Article

A Multi-Scale Numerical Method for the Study of Size-Scale Effects in Ductile Fracture

1
Politecnico di Torino, Department of Structural, Geotechnical and Building Engineering, Corso Duca degli Abruzzi 24, 10129 Torino, Italy
2
IMT Institute for Advanced Studies Lucca, Piazza San Francesco 19, 55100 Lucca, Italy
*
Author to whom correspondence should be addressed.
Metals 2014, 4(3), 428-444; https://doi.org/10.3390/met4030428
Submission received: 9 June 2014 / Revised: 30 July 2014 / Accepted: 18 August 2014 / Published: 27 August 2014

Abstract

:
The use of a stress-strain constitutive relation for the undamaged material and a traction-separation cohesive crack model with softening for cracking has been demonstrated to be an effective strategy to predict and explain the size-scale effects on the mechanical response of quasi-brittle materials. In metals, where ductile fracture takes place, the situation is more complex due to the interplay between plasticity and fracture. In the present study, we propose a multi-scale numerical method where the shape of a global constitutive relation used at the macro-scale, the so-called hardening cohesive zone model, can be deduced from meso-scale numerical simulations of polycrystalline metals in tension. The shape of this constitutive relation, characterized by an almost linear initial branch followed by a plastic plateau with hardening and finally by softening, is in fact the result of the interplay between two basic forms of nonlinearities: elasto-plasticity inside the grains and classic cohesive cracking for the grain boundaries.

1. Introduction

The cohesive zone model (CZM) is widely applied in the computational mechanics community to model cracking in quasi-brittle materials at the macro-scale [1,2,3,4]. Following this approach, the heterogeneous material composition is replaced by a homogenized continuum and the resistance to crack propagation is simulated by the action of cohesive tractions acting in the process zone along the crack path. At the same time, the CZM can be used at the meso-scale to depict the phenomenon of intergranular separation [5,6] in polycrystalline materials. In this instance, the nonlinearity is concentrated in the constitutive relation of the interfaces along the grain boundaries, whereas the grains are supposed to behave linear elastically.
In the majority of metals, on the other hand, large plastic deformation with significant elongation of the grains is observed, as, e.g., during metal forming. Even in this case, characterized by a high ductility, however, the load-displacement curve presents softening after the plastic regime, if the test is carried out up to very large displacements (see Figure 1). This softening, impossible to be explained as the result of purely plastic deformations, is the physical result of the formation of small micro-cracks and micro-cavities that coalesce, grow and finally lead to specimen failure.
Figure 1. Typical example of micro-cracks coalescence in metals leading to the softening branch and to the final failure of a specimen tested in uniaxial tension (taken from [7,8]).
Metals 04 00428 g001
Another interesting problem where there is a strong interplay between plasticity of the continuum and grain boundary decohesion is represented by the MgCa0.8 alloy investigated in [9]. This brittle Magnesium alloy used for medical implants contains Calcium as alloying element. Besides the grain refinement, which is of minor importance since the material fully recrystallizes during extrusion, Calcium increases the strength and reduces the tendency to corrosion. Though the alloying content of Calcium is less than the maximal solubility of Calcium in Magnesium, degenerate eutectics formed between the grains. These very brittle eutectics break into little fragments during subsequent extrusion. The presence of these interfaces along grain boundaries promotes brittle intergranular cracking in addition to ductile plastic deformation of the grains.
These experimental evidences suggest that the interplay between the two elementary forms of nonlinearity related to grain boundary decohesion and plasticity inside the grains is responsible for the failure behavior of the material at the meso-scale. In this article, it will be shown that the simultaneous use of the CZM and plasticity in a meso-scale model of a polycrystalline metal leads to size-scale dependent homogenized stress-relative displacement relations. These relations can be used at the macro-scale, in an upscaling procedure towards a multi-scale analysis of the material response. Hence, interface constitutive laws for the simulation of crack propagation in ductile materials at the scale of the structural element/specimen can be defined based on the results established at the meso-scale. At the macro-scale, a numerical algorithm and an analytical limit analysis approach are proposed and used to simulate bending tests. The role played by the initial notch length and the size-scale effects on the mechanical response in metallic materials are investigated. Numerical predictions are also compared with experimental results, showing a remarkable good agreement.

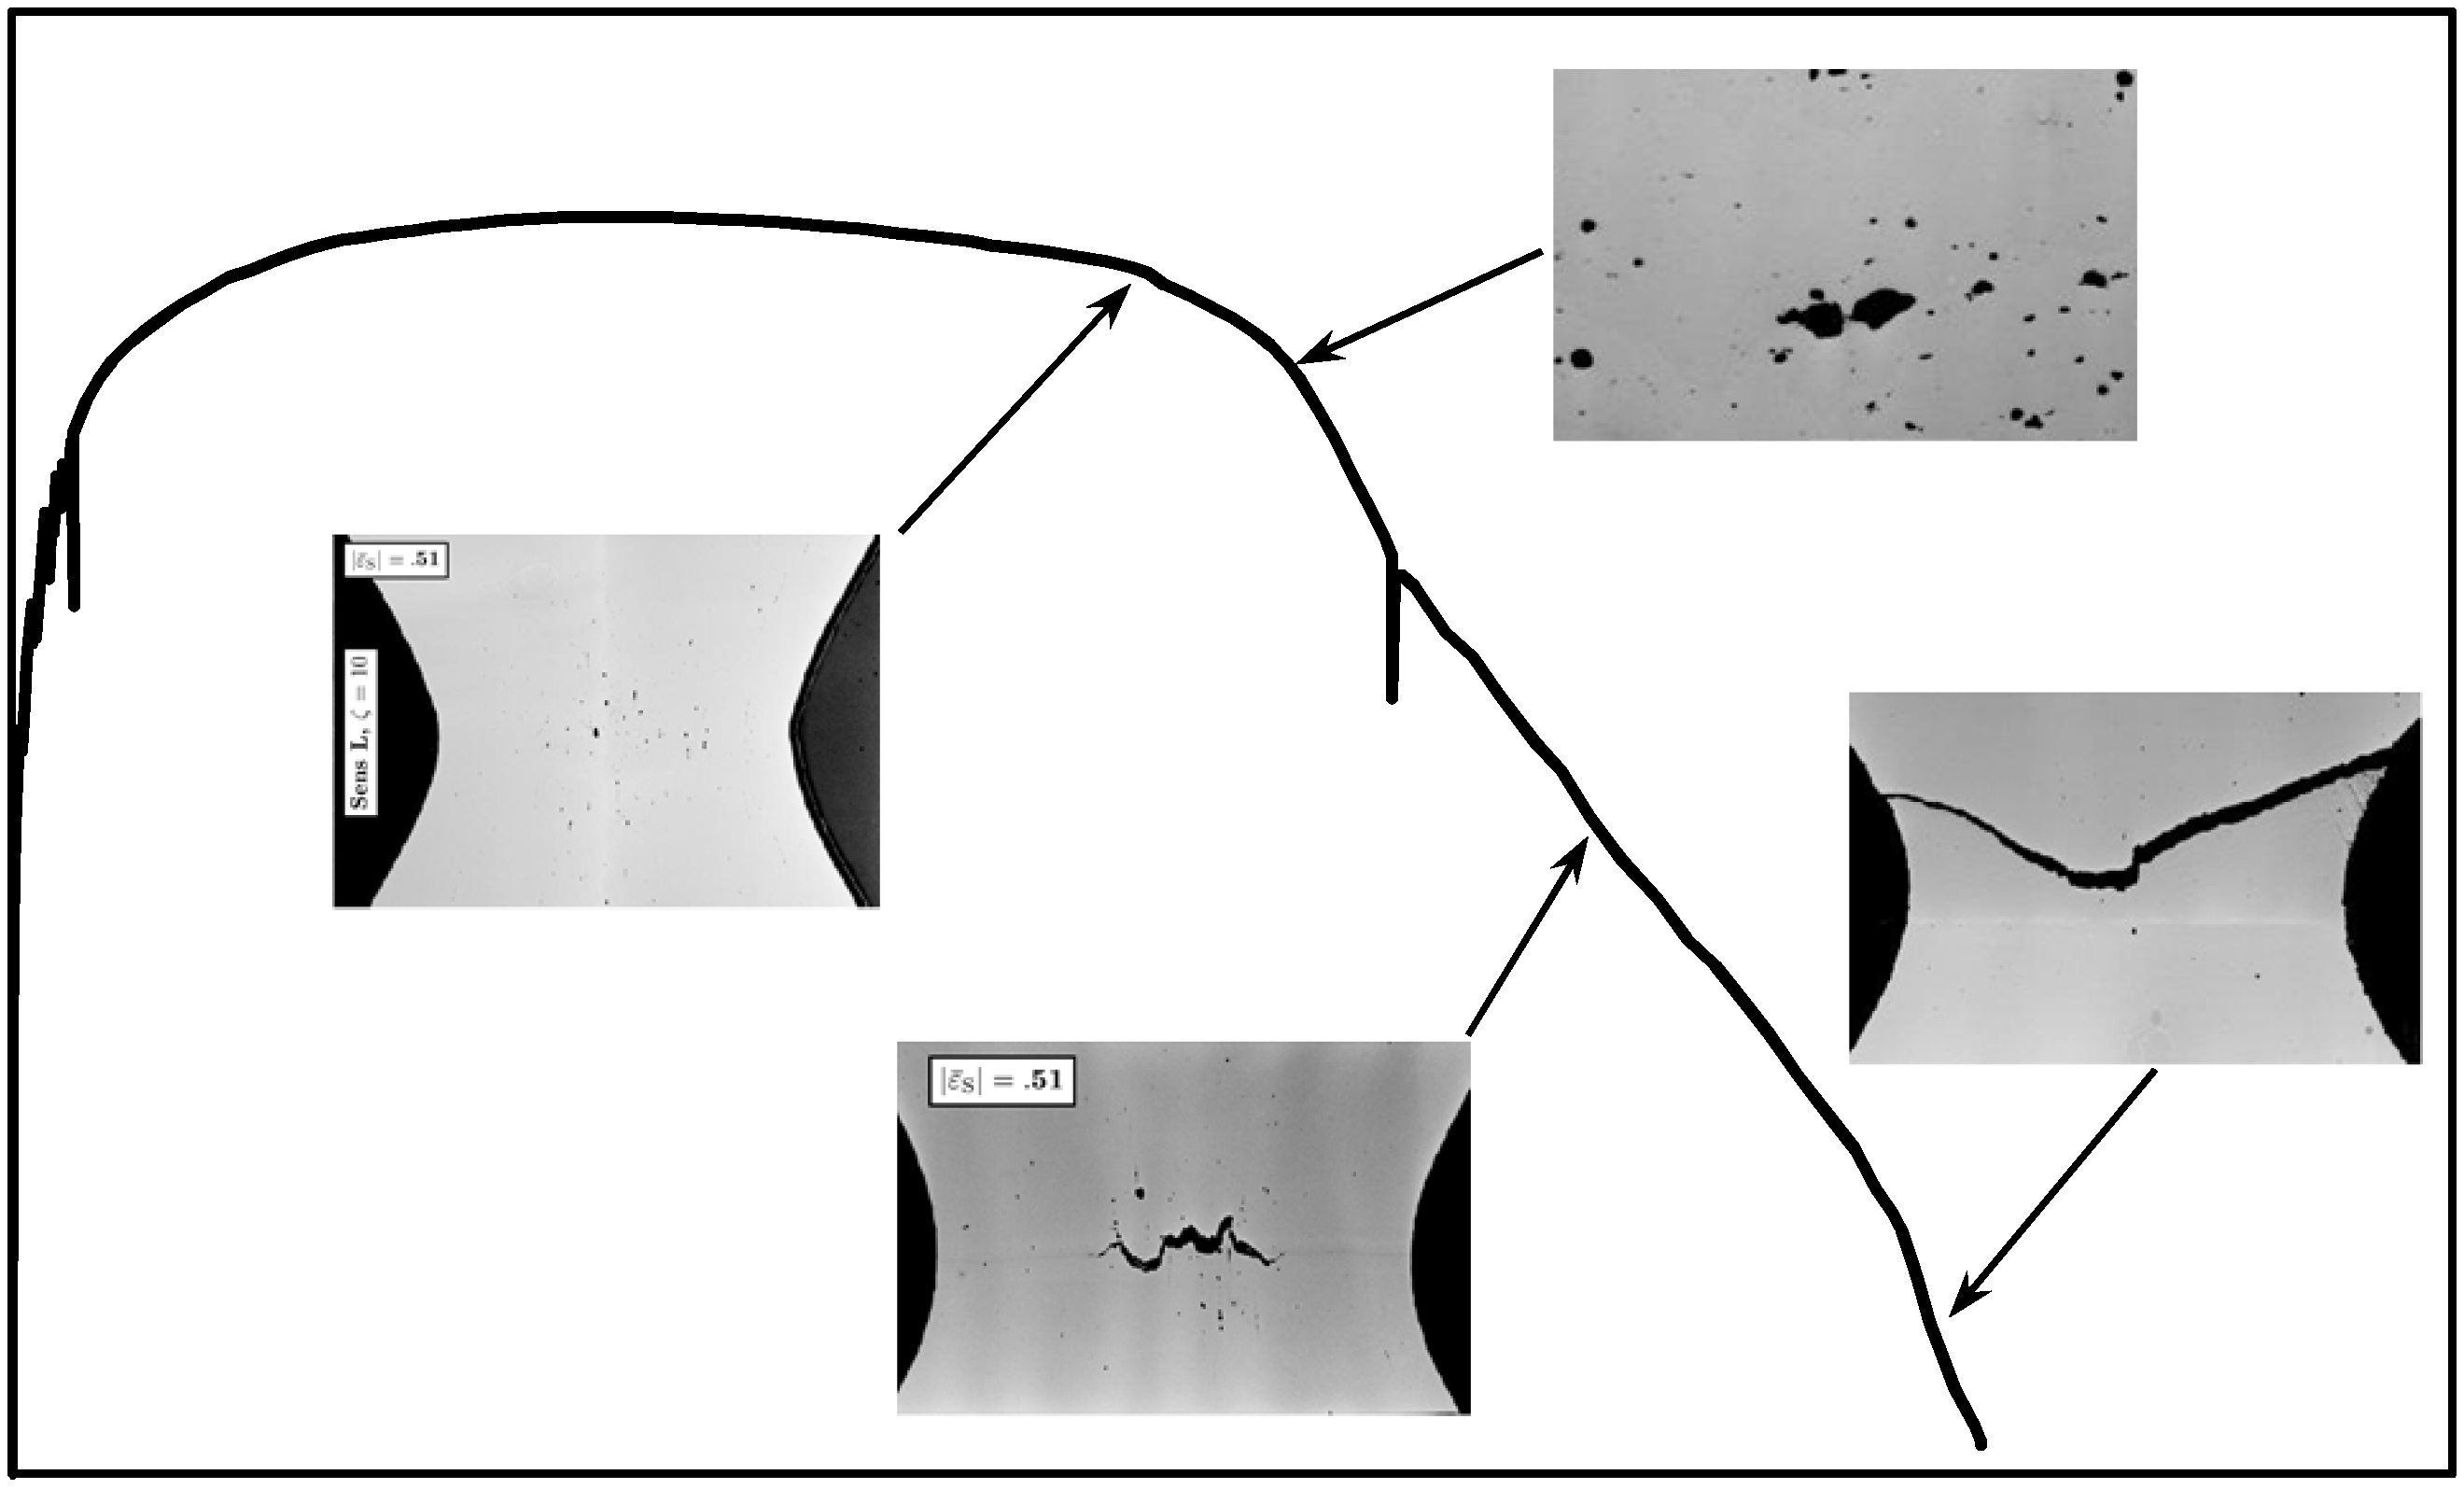
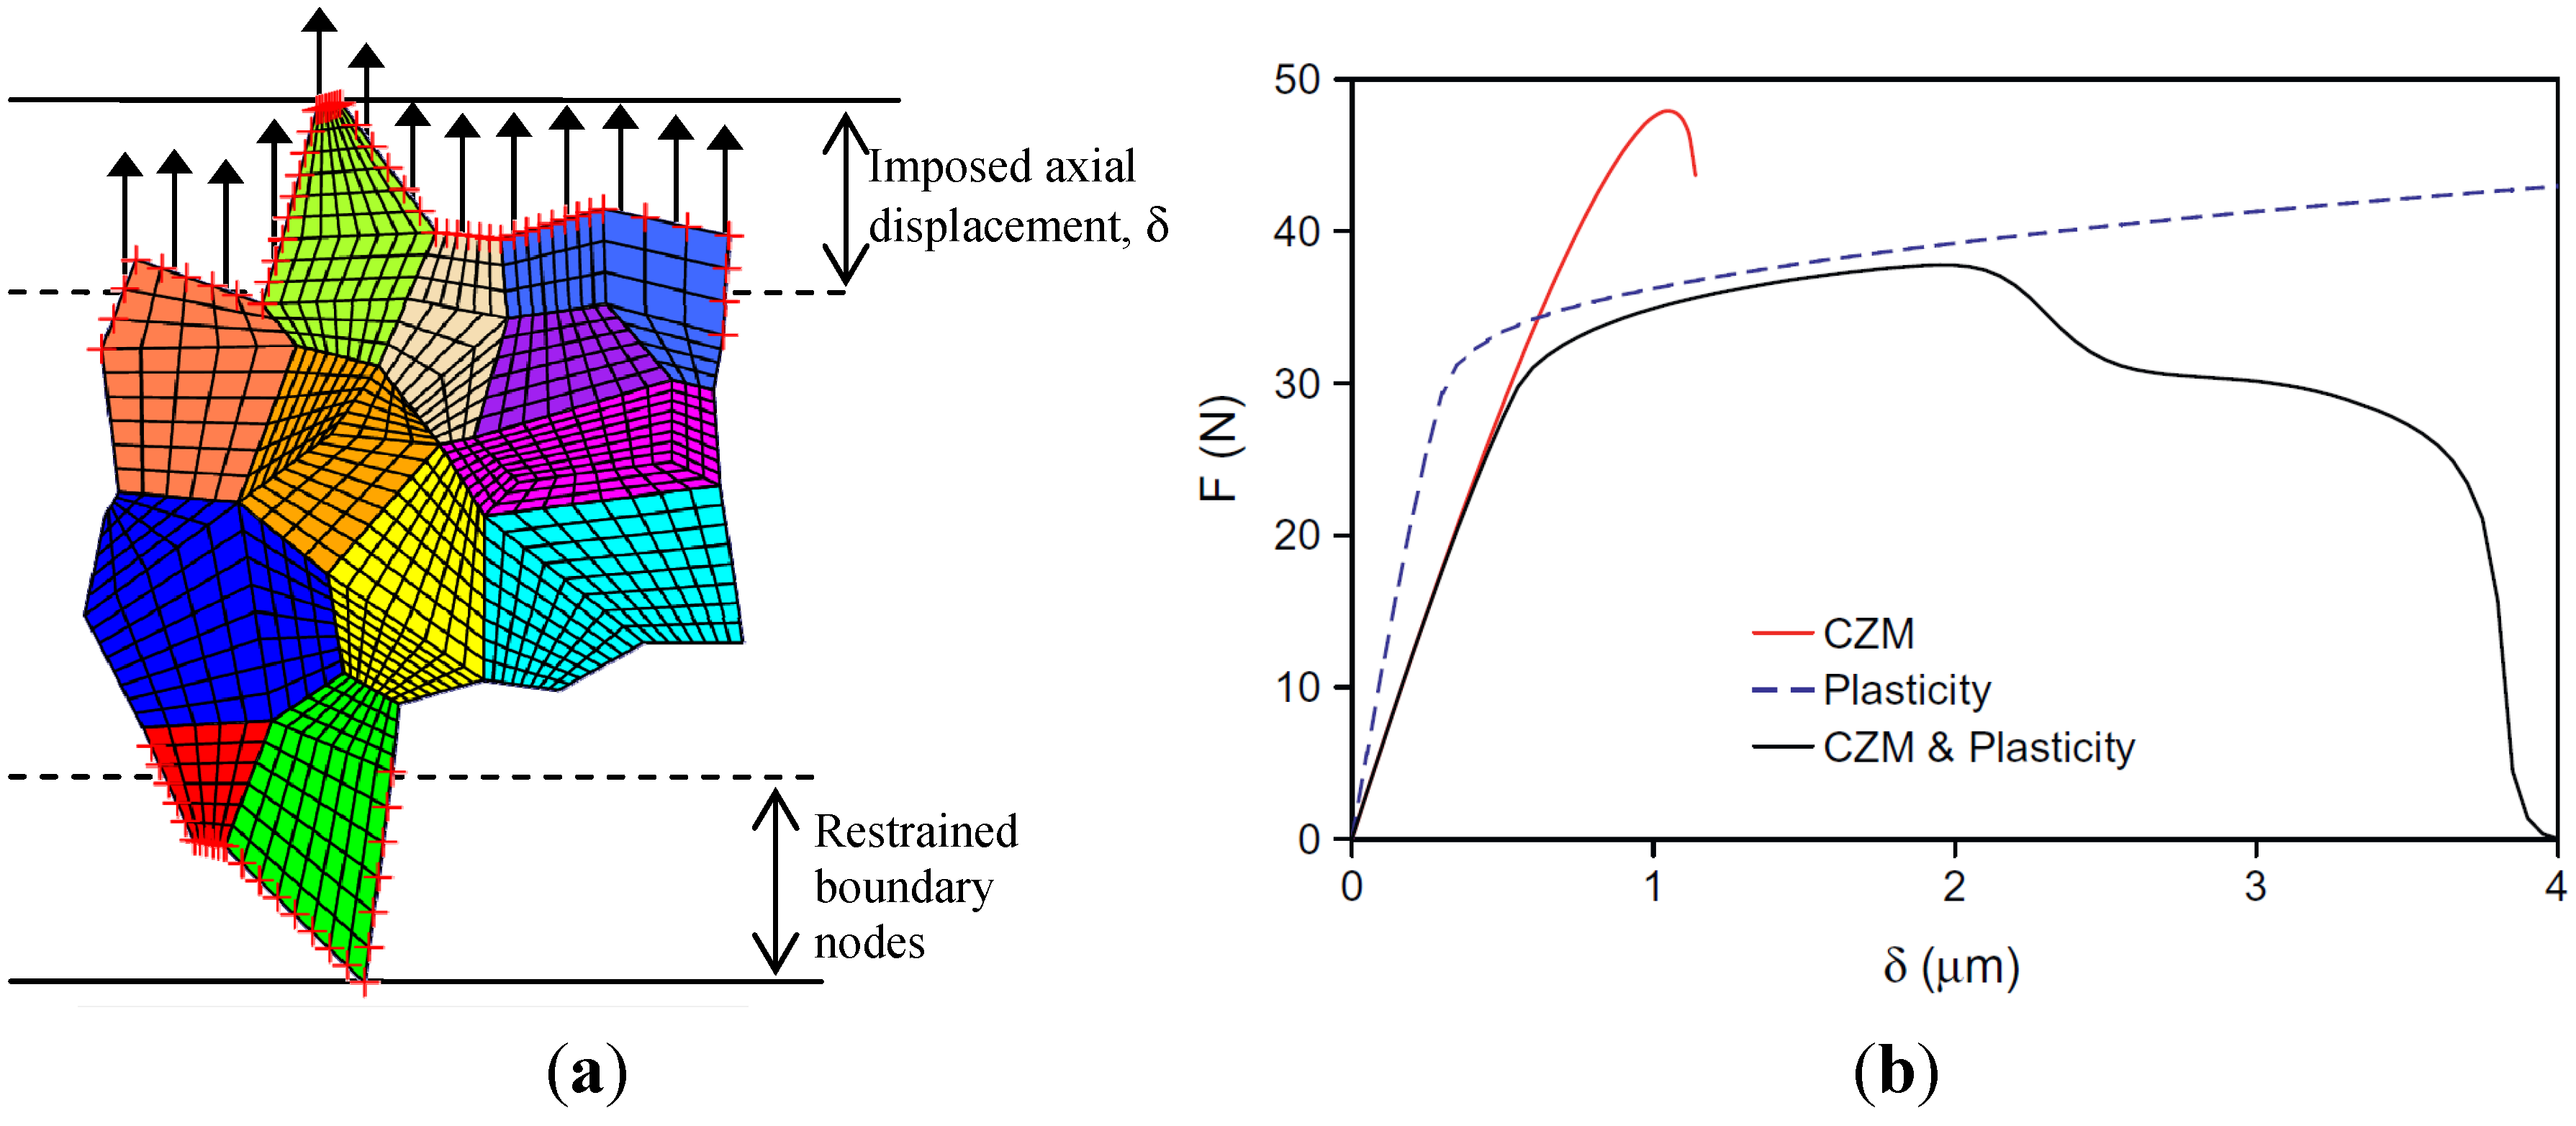
2. Meso-Scale Simulations of Ductile Polycrystalline Materials Based on the Cohesive Zone Model

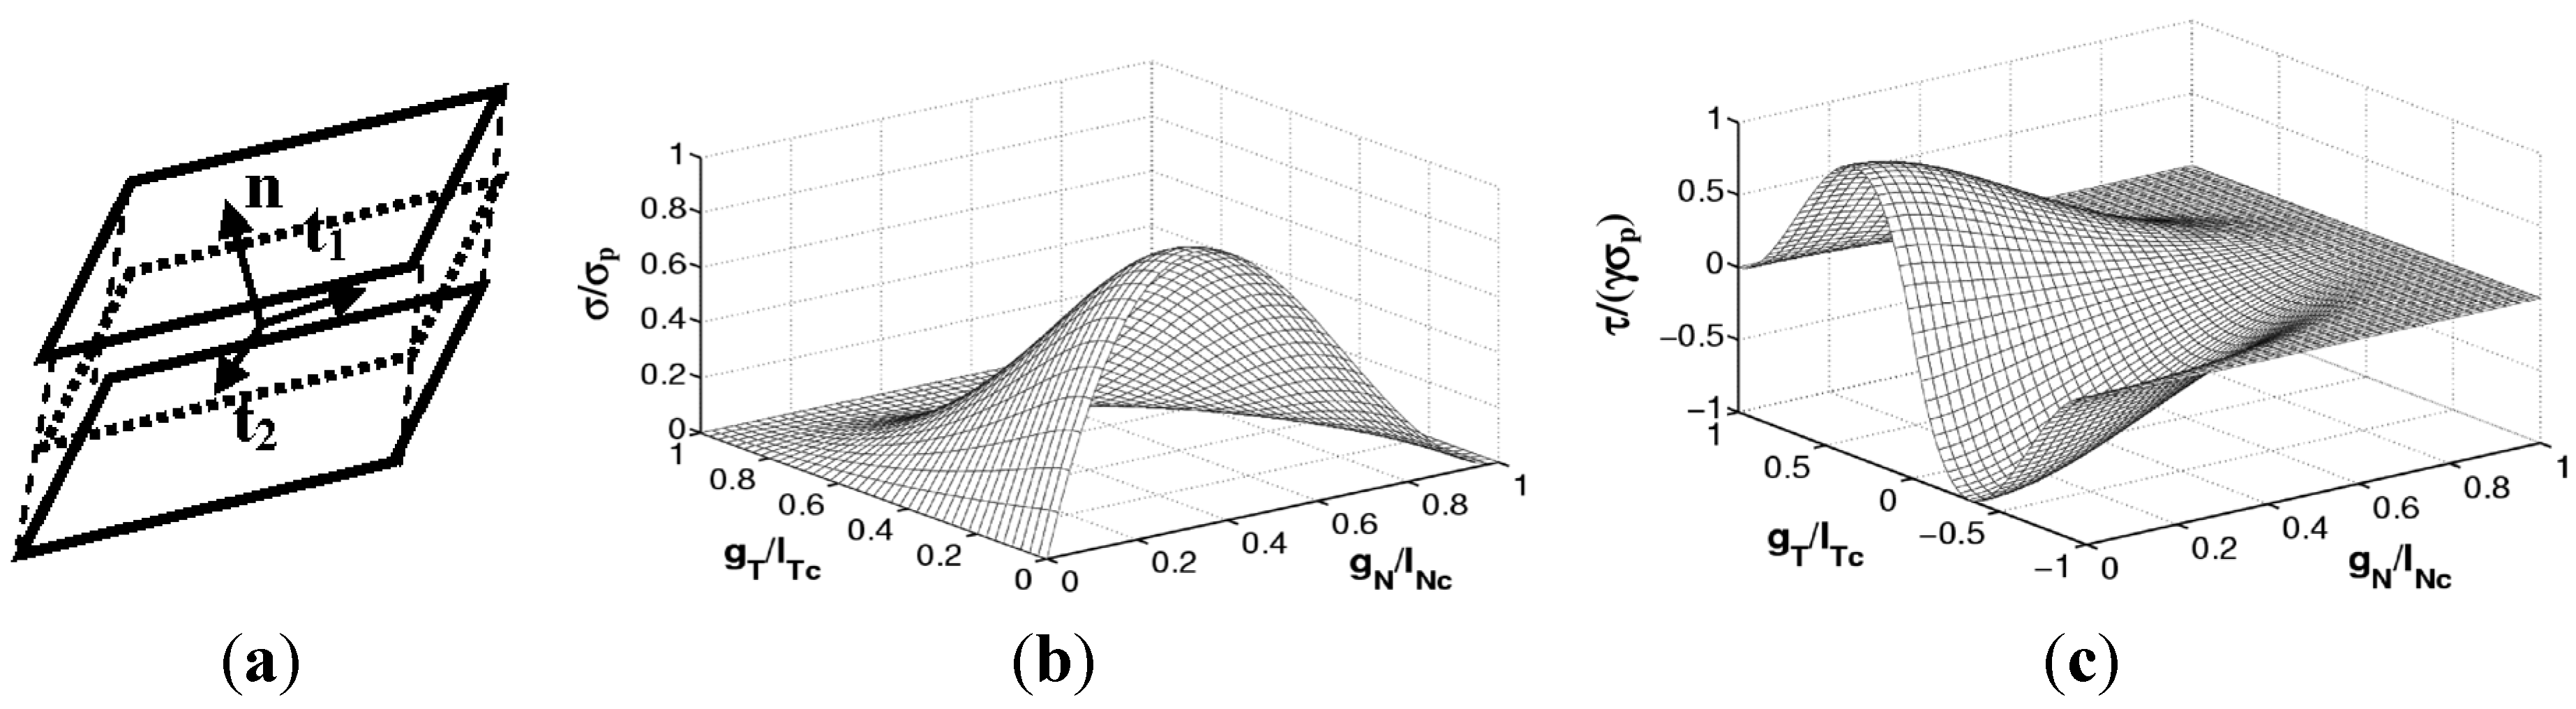
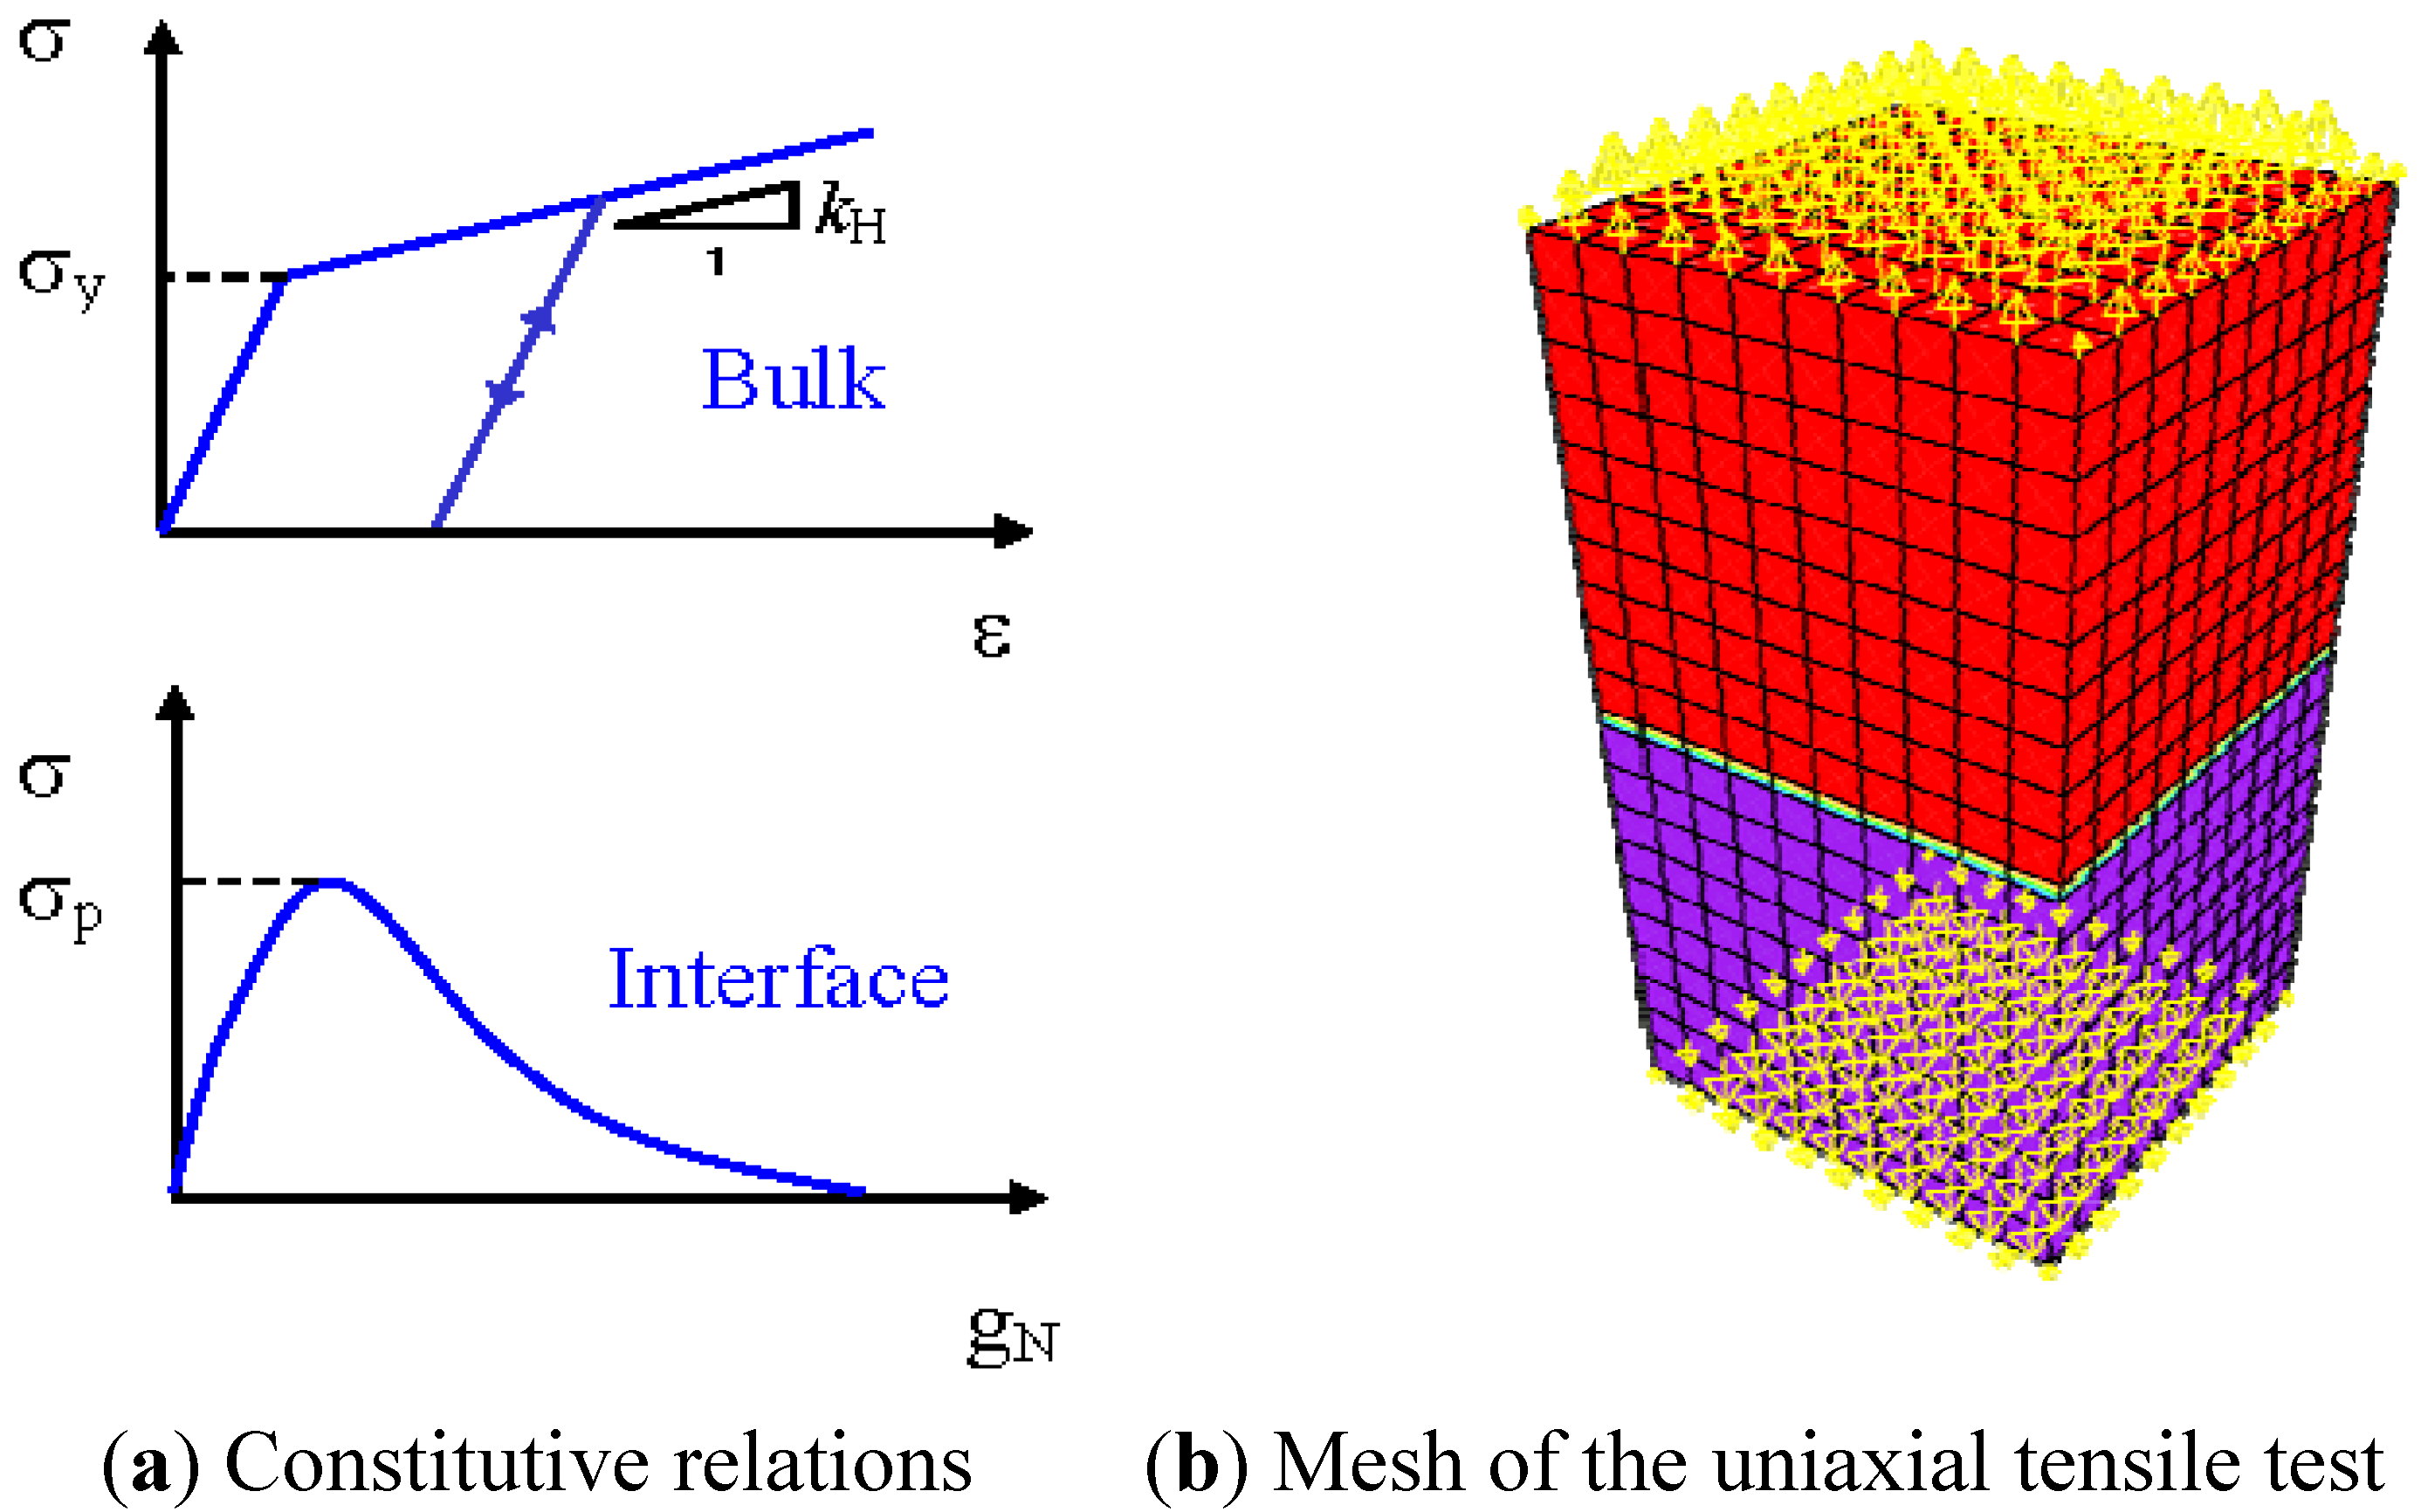
2.1. Constitutive Relations for the Grain Boundaries and for the Grains

Grain boundaries are sometimes considered as perfectly bonded interfaces. However, these material discontinuities are often the source of damage and cracking in polycrystalline materials. Hence, imperfect bonding is a more realistic assumption [10,11]. Following the 2D implementation of interface elements with a nonlocal CZM discussed in [10], a generalization to 3D FE topologies has been carried out in [9], where the analysis of a complex 3D set of grains and interfaces has been proposed. To this purpose, new user-defined subroutines for linear and quadratic interface elements compatible with brick and tetrahedra continuum elements have been implemented in the Finite Element Analysis Program FEAP [12].
The basic operations of an interface element are described in details in [10,13,14,15]. Essentially, this is a finite element with zero-thickness that is used to impose tractions on the grain boundaries dependent on the relative displacements of the grains sharing the interface. In the kinematic part of the element, the relative opening and sliding displacements of the opposing nodes of a common interface are computed. The cohesive tractions are determined in terms of these relative displacements according to a specified CZM relation, see also [1,3,4]. In the present study, the CZM by Tvergaard [16] is adopted, since it is frequently used to model crack propagation in the microstructure of metals. The normal and the tangential tractions, σ and τ, are computed as functions of the normal and tangential relative displacements gN and gT in the local frame defined by the normal unit vector to the average plane of the interface element, n, and by the tangent vectors t1 and t2:
σ = σ p g N l Nc P ( λ )
τ = γσ p g T l Tc P ( λ )
where
P ( λ ) = { 0       otherwise 27 ( 1 2 λ + λ 2 )/4 for  0 λ 1
λ= ( g N l Tc ) 2 + ( g T l Tc ) 2
The normal and the resultant tangential tractions are shown in Figure 2 vs. gN, and gT In this formulation, lNc and lTc denote the critical separations in the normal and tangential directions corresponding to complete decohesion. The parameter σp defines the Mode I peak CZM traction, whereas the Mode II peak CZM traction is τp = γσp. The variable λ physically represents a measure of the total relative displacement experienced by the interface.
Due to the nonlinearity of the CZM, the numerical simulations are carried out in an implicit FE code. Hence, a consistent linearization of the weak form of the finite element is performed to compute its tangent stiffness matrix and the residual vector, to be used within a Newton-Raphson iterative procedure. Regarding the constitutive relation for the bulk, a standard von Mises elasto-plastic formulation is considered.
Figure 2. (a) Local frame introduced at the interface element level; (b) and (c) Mixed-Mode CZM tractions used in meso-scale simulations.
Metals 04 00428 g002

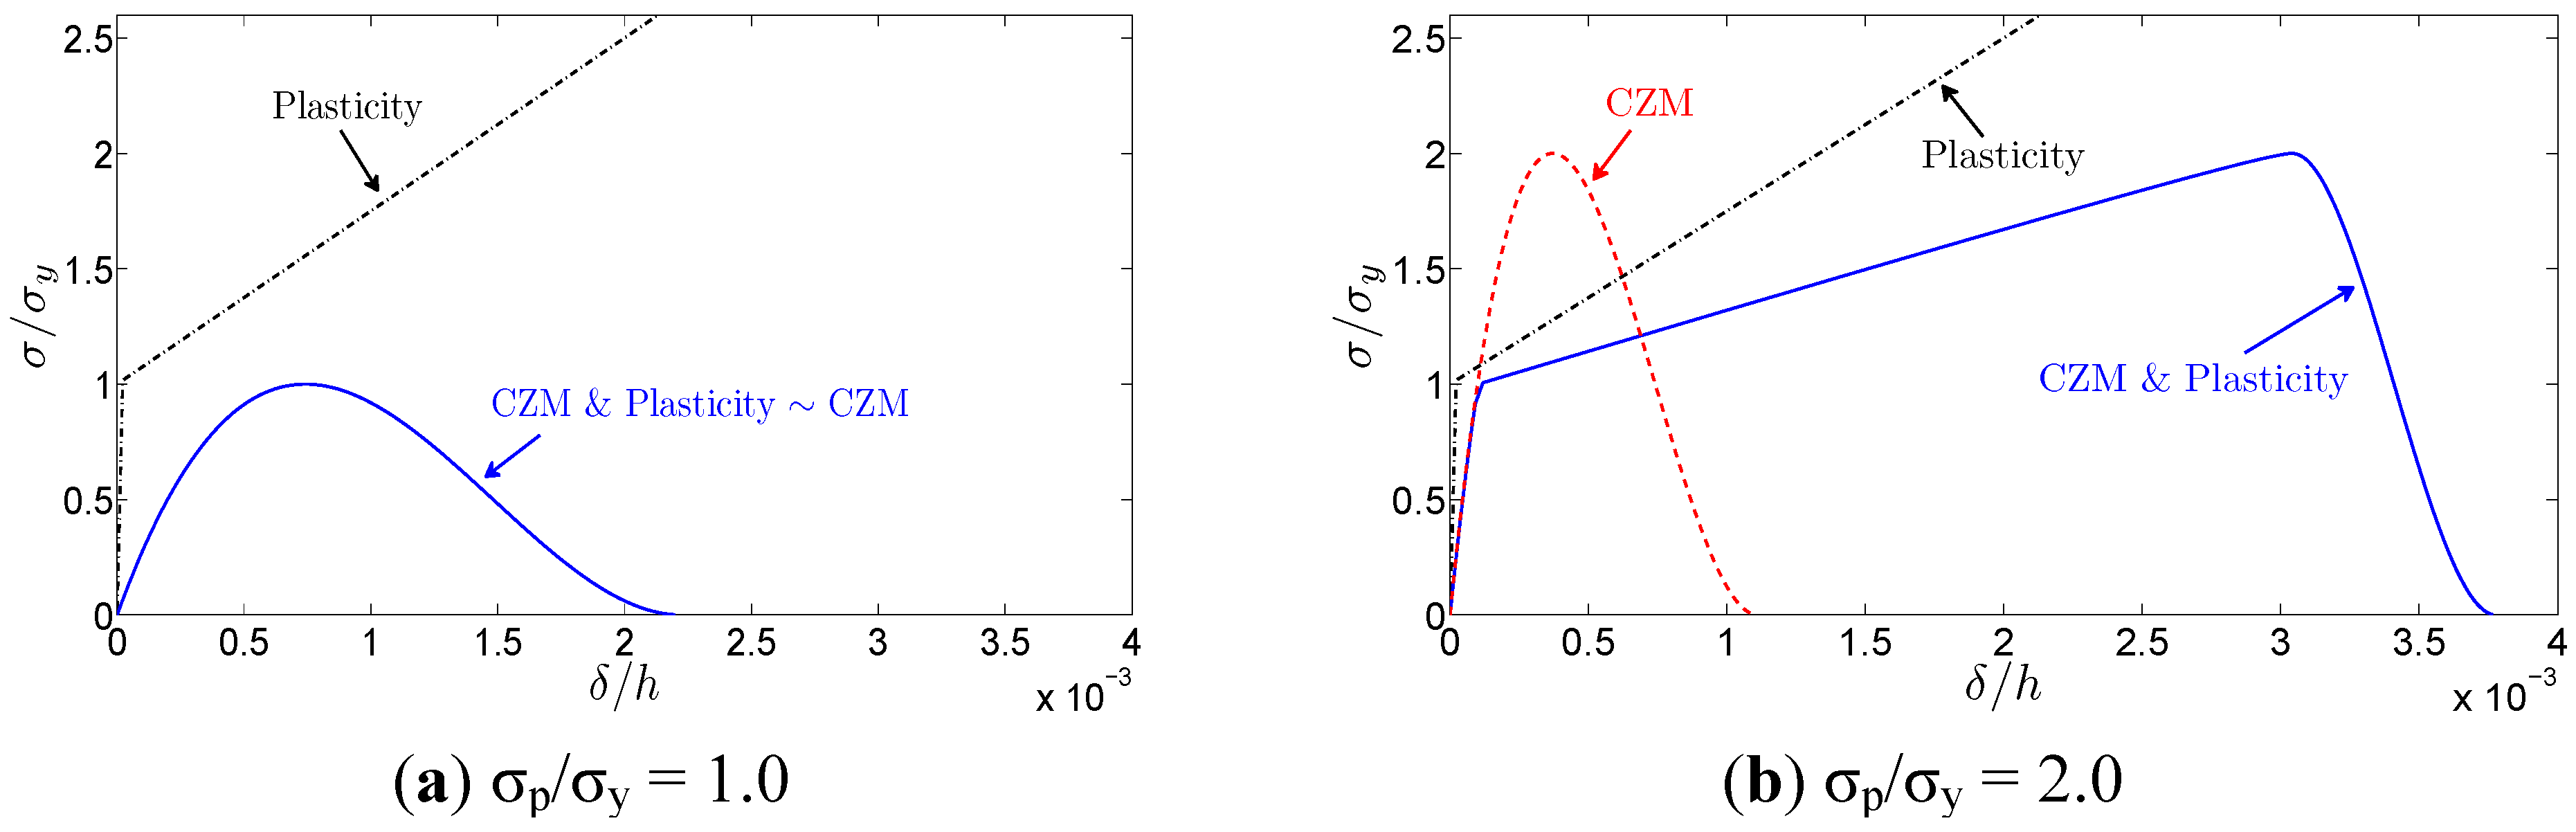
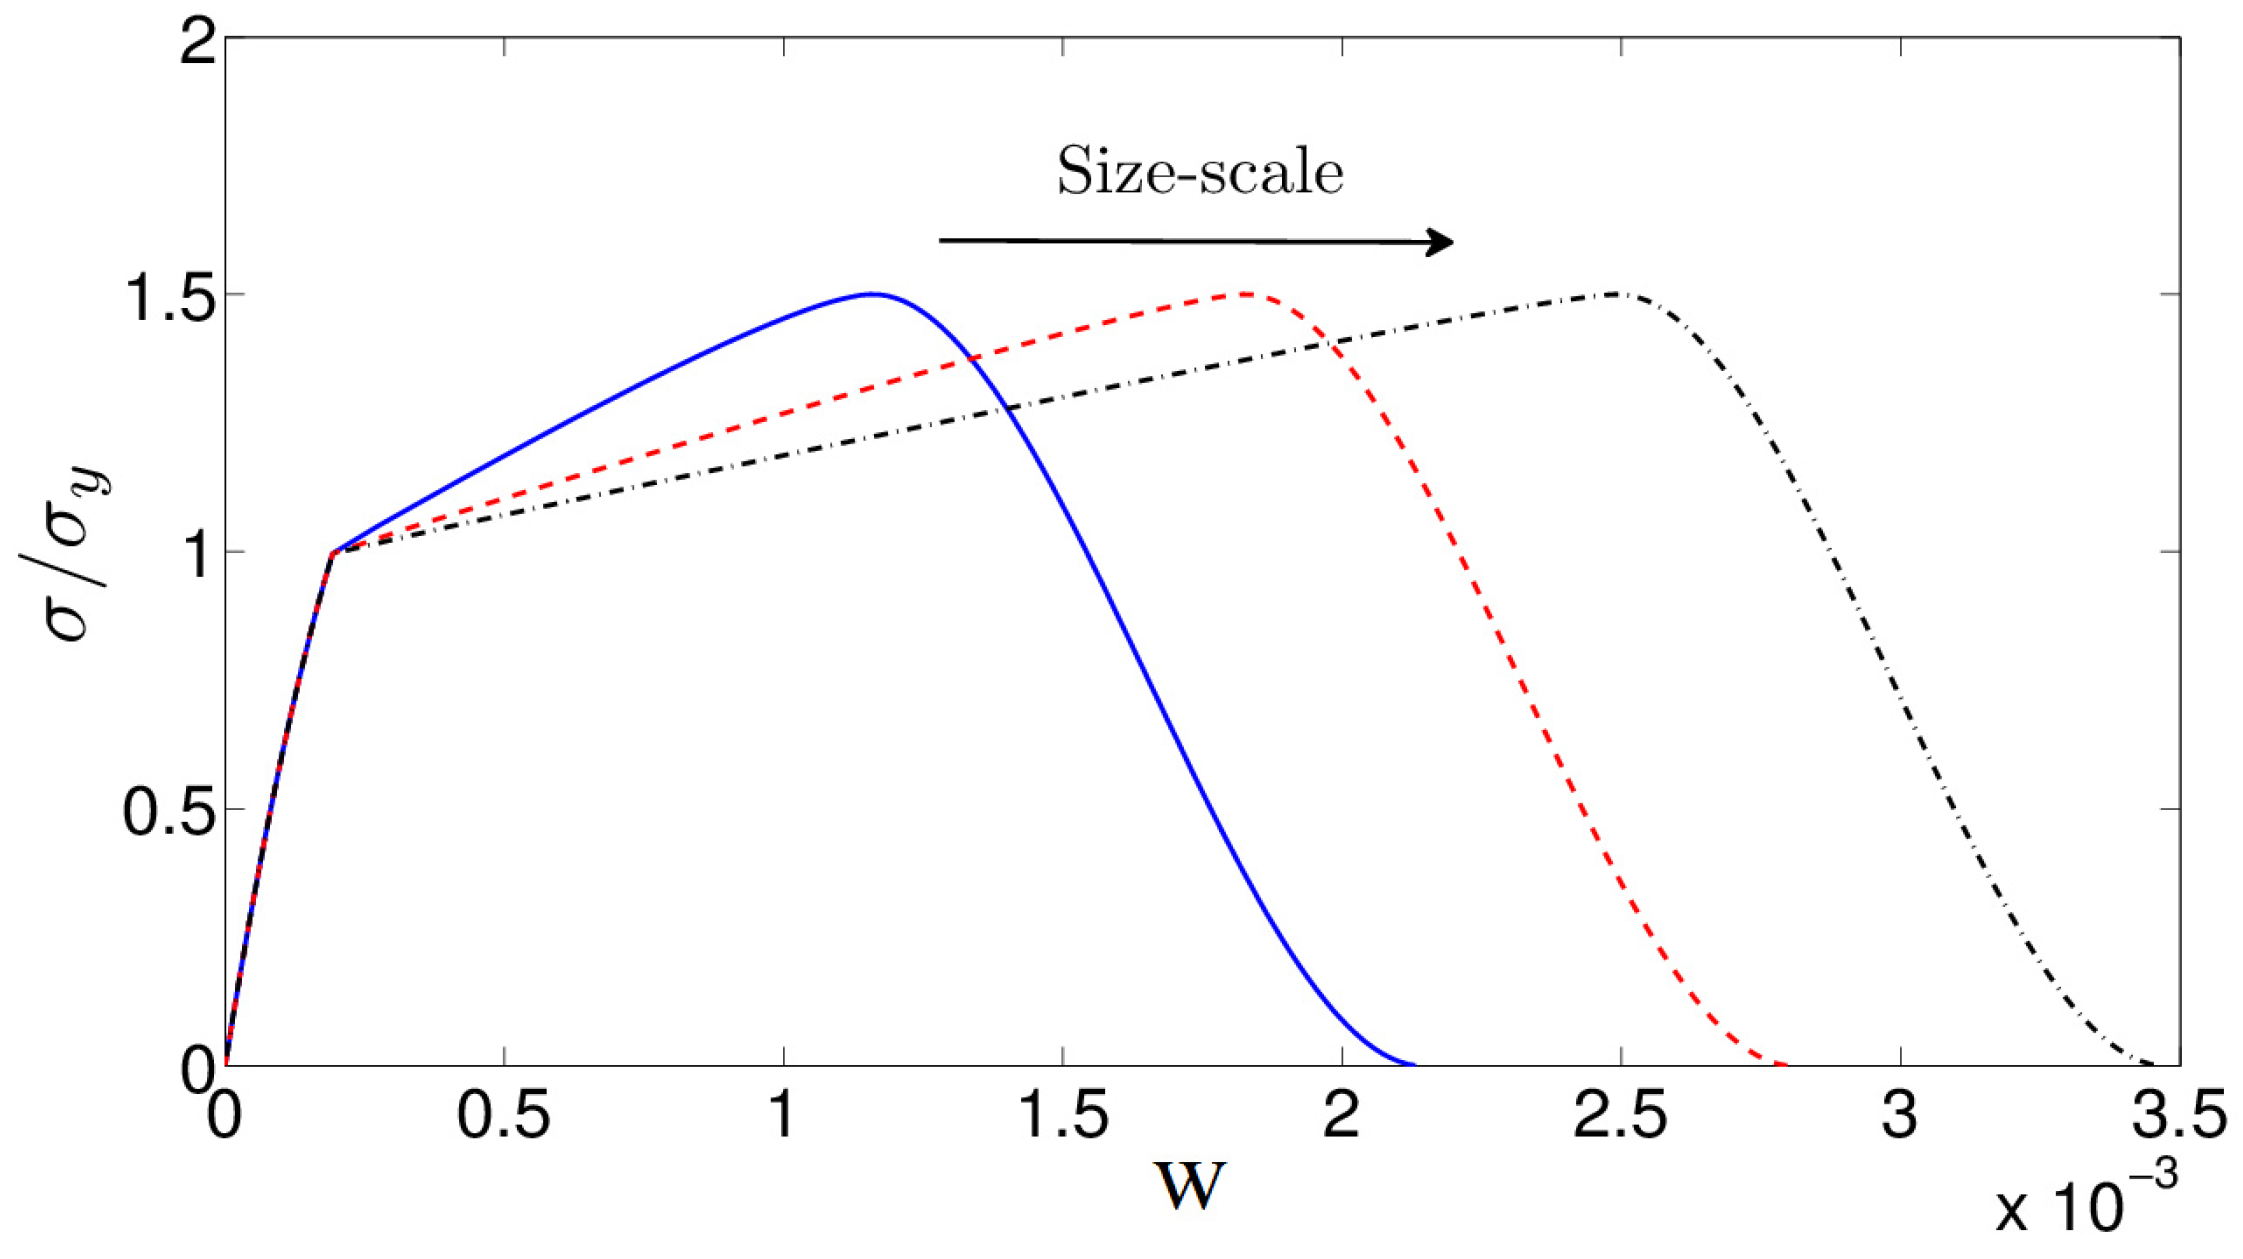
2.2. Interplay between Intergranular Fracture and Grain Plasticity and Derivation of Homogenized Relations for the Upscaling Procedure

The basic interplay between intergranular cohesive fracture and grain plasticity is herein investigated in reference to a system consisting of two blocks joined by a cohesive interface and subjected to a uniaxial tensile test. The lower side is restrained to the displacements in the axial direction, whereas the upper side is subjected to an imposed vertical displacement δ. The two blocks are discretized with quadratic brick elements and quadratic interface elements, see Figure 3b. The uniaxial test is carried out under displacement control. An elasto-plastic constitutive model with hardening (E = 152 GPa, ν = 0.3, σy = 80 MPa, kH = 120 MPa) is considered for the bulk (see Figure 3a). Regarding the nonlinear CZM at the interface, the formulation in [16] is used with a fracture energy GF = 0.1 N/mm. Different values of σp are explored, see Figure 3a.
Figure 3. (a) Constitutive relations for the bulk and the interface and (b) mesh of the 3D uniaxial tensile test.
Metals 04 00428 g003
For σp ≤ σy, the behavior of a brittle polycrystalline material is simulated and fracture is induced by intergranular cracking. The nonlinear response is therefore ruled by the CZM, see Figure 4a.
For σp > σy, the response for σ < σy is due to the CZM initial stiffness, which is not infinite for numerical reasons, and the elasticity of the system (see Figure 4b). Therefore, the CZM contribution to the overall deformation before the peak load should not be interpreted as a real grain boundary separation. For higher stresses, plasticity takes place and modifies the global response (see Figure 4b). The interesting aspect is the appearance of a softening branch after hardening, which is now related to a real grain boundary separation. Therefore, numerical results shown in Figure 4 pinpoint the strong interplay taking place between grain boundary decohesion and grain plasticity, depending on the material parameters. These results are confirmed by numerical simulations on polycrystalline materials, see Figure 5.
Figure 4. Basic interplay between CZM and plasticity: elasto-plastic with hardening constitutive law and nonlinear CZM. (a) Fracture for σpy ≤ 1, as for brittle materials; (b) fracture for σpy > 1, as for ductile materials.
Metals 04 00428 g004
Figure 5. Homogenized uniaxial response of a polycrystalline material in tension (E = 152 GPa, ν = 0.3, σy = 80 MPa, σp = 80 MPa, GF = 0.1 N/mm, and γ = 1). (a) Cross-section of a 3D model of the polycrystal simulated in [9] with an average grain size of 15 μm; (b) Homogenized force-displacement response in case of CZM only, plasticity only, or with both nonlinearities simultaneously present. The force is the resultant of the reactions in the constrained nodes in the vertical direction. The imposed displacement δ is also along the same direction.
Metals 04 00428 g005
It is interesting to point out that the numerical curves obtained according to the interplay between CZM and plasticity can be interpreted as a new CZM by plotting the homogenized stresses vs. an axial displacement obtained by removing the elastic component from the imposed total displacement δ. An example of this procedure is shown in Figure 6 for one of the cases analyzed in Figure 4. The initial part of the obtained traction-separation law depends on the shape of the CZM used for the interface. For σ > σy, on the other hand, hardening takes place due to plasticity. Finally, an almost linear softening of the cohesive traction is observed for large separations, again due to the CZM formulation.
Figure 6. Hardening cohesive laws obtained from the results in Figure 4, for different specimen size-scales (the inelastic displacement w is measured in mm).
Metals 04 00428 g006
By increasing the sample size and assuming that σp is size-scale independent, the traction-separation law is not scale invariant, although the fracture energy, the peak cohesive traction and the critical opening displacement are the same in all the simulations. Here, the size variation refers to the geometrical change of the size of the specimen, keeping constant the grain size and the material properties. This size-scale effect takes place due to the interplay between plastic deformation, which depends on the number of grains in the plastic regime, and cohesive cracking, which depends on the number of grain boundaries involved in the crack pattern at failure. In general, the maximum separation corresponding to the onset of linear softening increases with the sample size, as also observed in experimental tests [17,18].

3. Numerical Approach for Macro-Scale Numerical Simulations

3.1. Numerical Algorithm

A numerical algorithm for a macro-scale analysis is herein proposed with reference to the three-point-bending test (TPB) geometry shown in Figure 7. In this approach, both fracturing and plastic compressive phenomena are assumed to be fully localized along the mid-span cross-section of the beam, whereas the two symmetric beam portions behave elastically. The mechanical behavior of the symmetry cross-section is described by means of the previous meso-scale constitutive model discussed in Section 2. The meso-scale constitutive model was obtained in pure uniaxial tension (Mode I) on specimens where the grain microstructure was explicitly modeled. It has been shown that such meso-scale simulations lead to stress-inelastic displacement curves whose shapes are consistent with those used in [19] for the hardening cohesive/overlapping zone model. Therefore, the meso-scale results can be used as an equivalent cohesive zone model for characterizing the constitutive behavior of the single dominant crack at the macro-scale, where the material microstructure is not taken into account as a material heterogeneity. Since the problems at the macro-scale are characterized by pure Mode I deformation, the meso-scale constitutive model can be applied to all the finite element nodes used in the macro-scale computational model. More complex loading scenarios leading to Mixed Mode deformation would require additional testing at the meso-scale for different Mixed Mode loading, to be consistent in the upscaling procedure.
Figure 7. Finite element nodes along the mid-span cross-section of the TPB specimen.
Metals 04 00428 g007
The same constitutive relation is adopted for both tension and compression. From a kinematical point of view, in fact, when the elastic range is overcome in compression, a fictitious interpenetration is assumed to take place, according to the overlapping crack model proposed in [19,20], and similar to the fictitious crack opening considered in tension. More in details, a linear-elastic stress vs. strain relation is assumed for the undamaged material, whereas a hardening stress vs. displacement law, followed by a linear softening tail, is adopted for the damaged and/or yielded material (see Figure 8). The latter law is consistent with the numerical results obtained in Figure 6. For practical purposes, the hardening branch of the cohesive law can also be well described by a Ramberg-Osgood–like relationship:
σ = σy + (σu − σy)(w/wr)μ
where μ > 0 is the hardening exponent (μ = 0 corresponding to perfect plasticity), σy is the yielding stress; w is the opening or overlapping relative displacement; wr corresponds to the peak stress and determines the shape of the stress vs. separation law. Beyond the ultimate displacement, the stresses decrease linearly and vanish in correspondence with the critical value for the opening or overlapping relative displacement, wcr.
Figure 8. Constitutive laws according to the cohesive/overlapping crack model: (a) linear-elastic stress vs. strain relationship for the undamaged material, and (b) hardening stress vs. displacement law for the damaged and/or yielded material (followed by a linear softening tail).
Metals 04 00428 g008
For the application of the numerical scheme, the symmetry cross-section of the specimen is subdivided into finite elements by n nodes. Consequently, cohesive and overlapping stresses are replaced by equivalent nodal forces by integrating the corresponding distributed tractions over the element side. Such nodal forces depend on the nodal opening or overlapping displacements according to the cohesive or overlapping laws shown in Figure 8b. The nodal forces, F, acting along the mid-span cross-section are computed as follows:
{F} = [Kw]{w} + {KP}P
where {F} is the vector of nodal forces, [Kw] is the matrix of the coefficients of influence for the nodal displacements, {w} is the vector of nodal displacements, and {KP} is the vector of the coefficients of influence for the applied load P. All the coefficients of influence are computed a priori with a linear-elastic finite element analysis. In addition, [Kw] and {KP} are independent of the specimen size, mesh and slenderness ratio being the same. When fracturing and plastic yielding compression take place, the following equations can be considered (see Figure 9, where the central portion of the TPB specimen is shown):
Fi = 0   for i = 1, 2, … , (j − 1)
Fi = Fy + (FuFy)(wi/wcr)μ   for i = j …,(m − 1)
wi = 0   for i = m, … , p
Fi = −[Fy + (FuFy)(wi/wcr)μ]   for i = (p + 1),…,n
The same hardening law is used for tension, Equation (8), and compression, Equation (10). Equations (6)–(10) constitute an algebraic system of (2n) equations with (2n + 1) unknowns, i.e., the elements of the vectors {w} and {F} and the applied load, P. In this case, there are two alternative possible additional equations needed for solving the system: we can set either the force in the fictitious crack tip, m, equal to the tensile yielding force, or the force in the fictitious overlapping zone tip, p, equal to the compressive yielding force. In the numerical scheme, we select the situation that is closer to the critical condition. The driving parameter of the process is the tip that in the considered step has reached the limit resistance. Only this tip is moved when passing to the next step. The two fictitious tips advance until they converge to the same node. Finally, at each step of the algorithm it is possible to calculate the deflection, δ, as follows:
δ = {Dw}{w} + DPP
where {Dw} is the vector of the coefficients of influence for the nodal displacements, and DP is the coefficient of influence for the applied load. In addition, {Dw} and DP are also independent of the specimen size, mesh and beam slenderness being kept constant.
Figure 9. Nonlinear cohesive and overlapping stress distributions along the mid-span cross-section of the TPB specimen.
Metals 04 00428 g009
It is worth noting that the same numerical algorithm can be profitably used to study different specimen geometries and loading conditions, as, for instance, the compact tension test (CT). The only difference regards the elastic coefficients entering Equations (6) and (11). The geometry and the discretized model used to compute the elastic coefficients are shown in Figure 10.
Figure 10. Compact Tension test: (a) geometry; and, (b) finite element nodes along the symmetry cross-section.
Metals 04 00428 g010

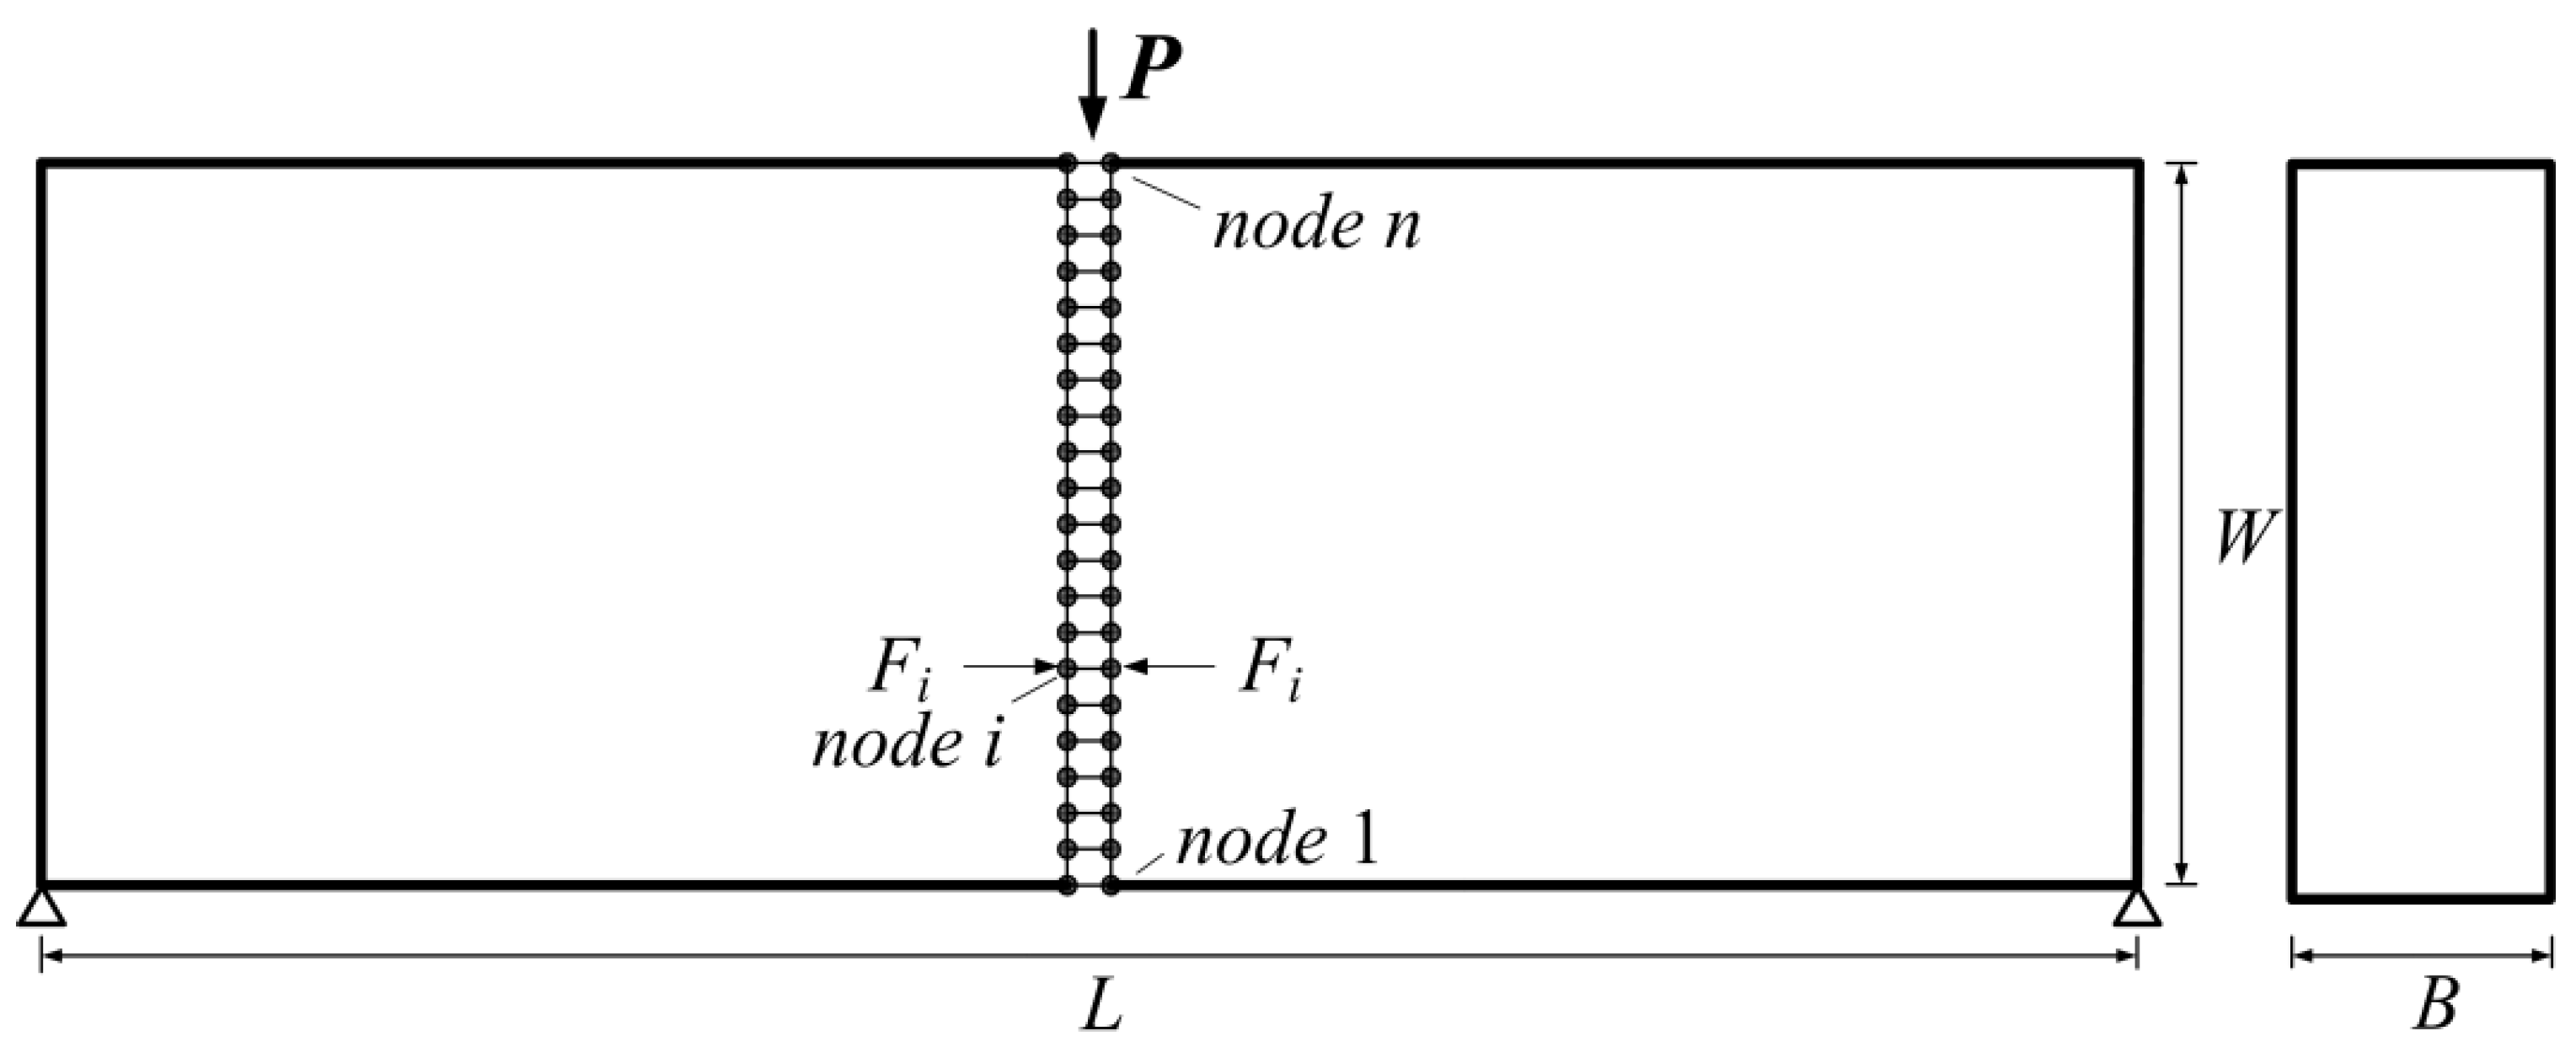
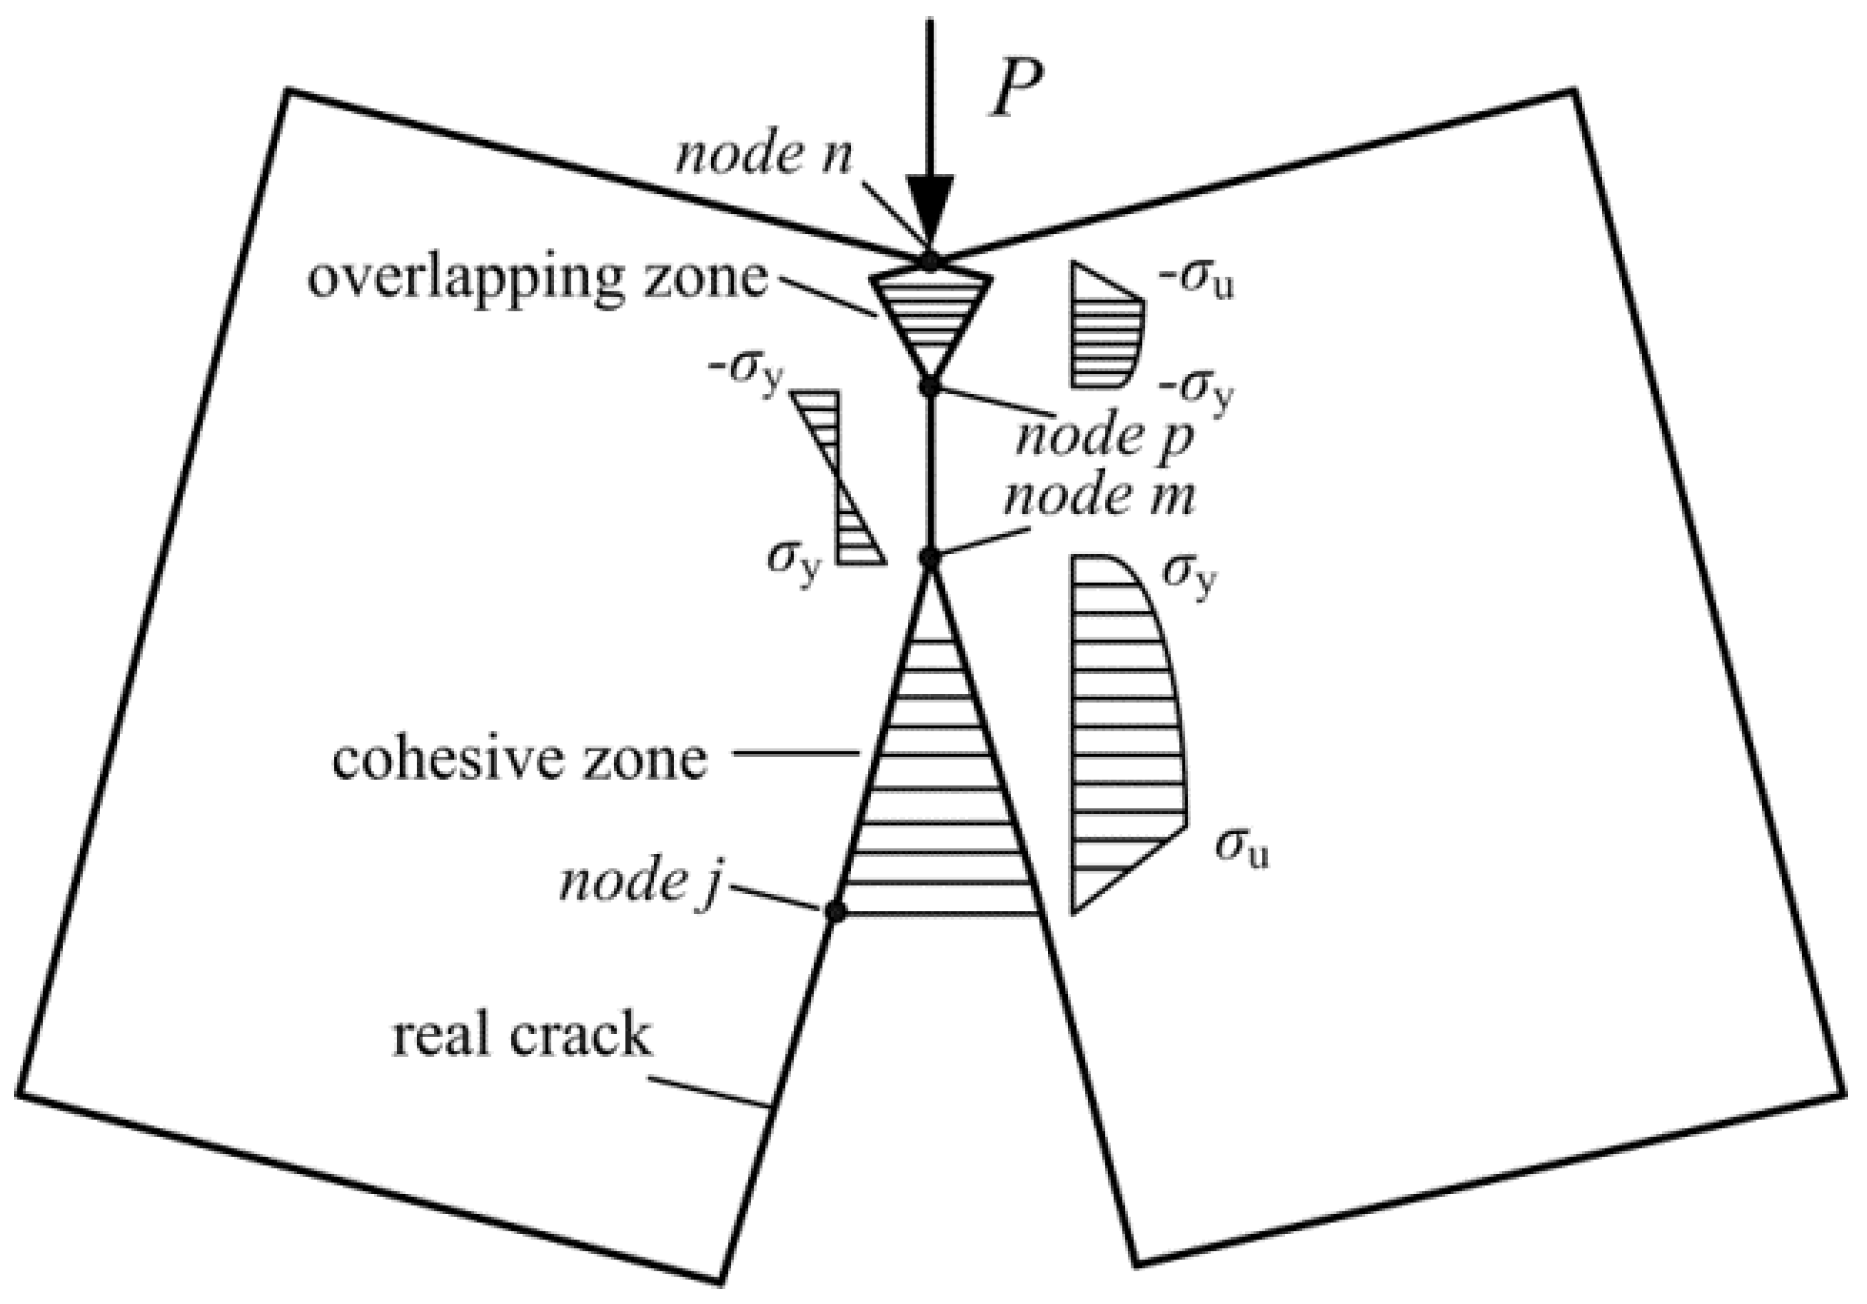
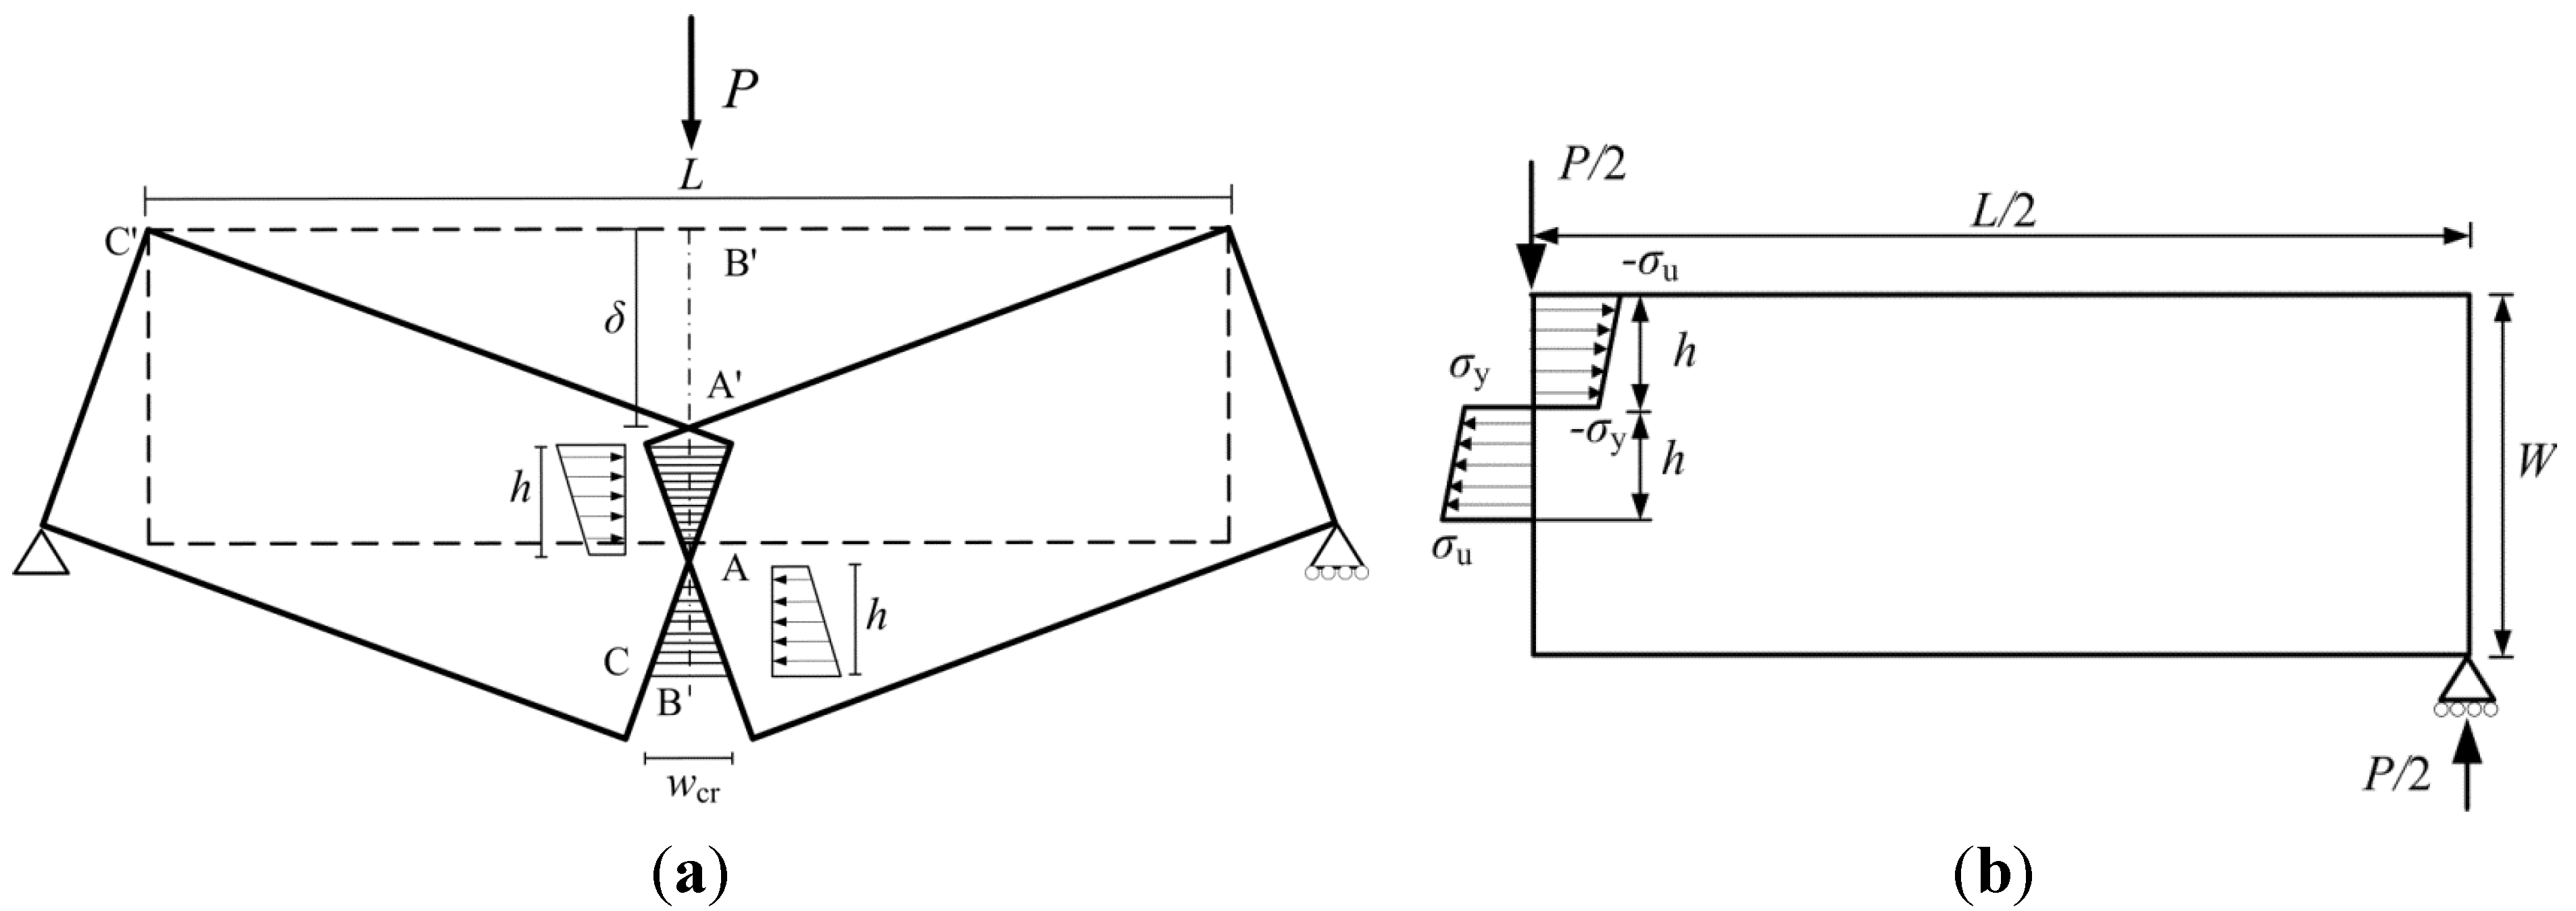
3.2. Limit Analysis for the Three-Point-Bending Test

The numerical simulations carried out with the algorithm proposed in the Section 3.1 terminates when the two fictitious tips converge to the same node. On the other hand, for an exhaustive analysis, the entire post-peak load vs. deflection curve should be determined. To this purpose, a limit analysis approach based on the proposed constitutive laws can provide asymptotic approximation to the post-peak response, which can be relevant in the analysis of ductile-to-brittle transitions.
Once the tensile yielding strength and the compressive yielding strength have been achieved at the bottom and the top beam edges, respectively, fracture and plastic compressive processes are assumed to initiate. The supposed limit situation is shown in Figure 11a. The limit stage of the deformation and fracture process may be considered as that of two rigid parts connected by the hinge A in the mid-span cross-section. The equilibrium of each part is ensured by the external load, the support reaction, the closing cohesive forces and the opening overlapping forces, as evidenced in Figure 11b. For the sake of simplicity, a linear-hardening with subsequent vertical drop relationship is assumed for the stress vs. displacement law (dashed curve in Figure 8b) instead of the power-law hardening expressed in Equation (5) followed by the linear softening branch (solid curve in Figure 8b). Several investigations focusing on the effect of the shape of the traction–separation law on the resulting fracture behavior (see [21,22] for metals and [23] for concrete-like materials), in fact, came to the conclusion that such an effect is relatively weak. On the contrary, the cohesive/overlapping dissipated energy plays a fundamental role in determining the overall response. Therefore, a simplified law can be assumed for the limit analysis computations, provided that the area beneath the stress vs. displacement curve is equal to that of the more complex law assumed for the corresponding numerical simulations. The same mechanical parameters (cohesive/overlapping energy, yielding stress, ultimate stress) are adopted for both tension and compression. The geometrical similitude of the triangles ABC and A'B'C' in Figure 11a provides:
δ 0.5 L = 0.5 w c r h
which gives:
h = w c r L 4 δ
Figure 11. Limit analysis for TPB test: (a) limit condition of fracture with cohesive and overlapping forces; (b) cohesive and overlapping force distributions along the symmetry cross-section.
Metals 04 00428 g011
The rotational equilibrium around point A is possible for any beam configuration only if the moment of external force and support reaction is equal to the moment of cohesive forces and overlapping forces (see Figure 11b):
P L 4 = 1 3 h 2 B ( 2 σ u + σ y )
which gives:
P = 1 12 w c r 2 L B ( 2 σ u + σ y ) δ 2
According to Figure 11a, the total extension of the cohesive and overlapping zones must be less than or equal to the initial ligament of the beam, so that the limit condition is:
2 h W ( 1 ξ 0 )
where ξ0 is the ratio between the initial crack length, a0, and the beam depth, W. From Equation (12), we determine the lower bound to limit analysis in terms of deflection:
δ = w c r L 2 W ( 1 - ξ 0 )
Similarly, a closed form solution based on the limit analysis approach can be obtained also for the compact tension test scheme. More details are given in [19].

4. Numerical Simulations and Comparison with Experimental Results

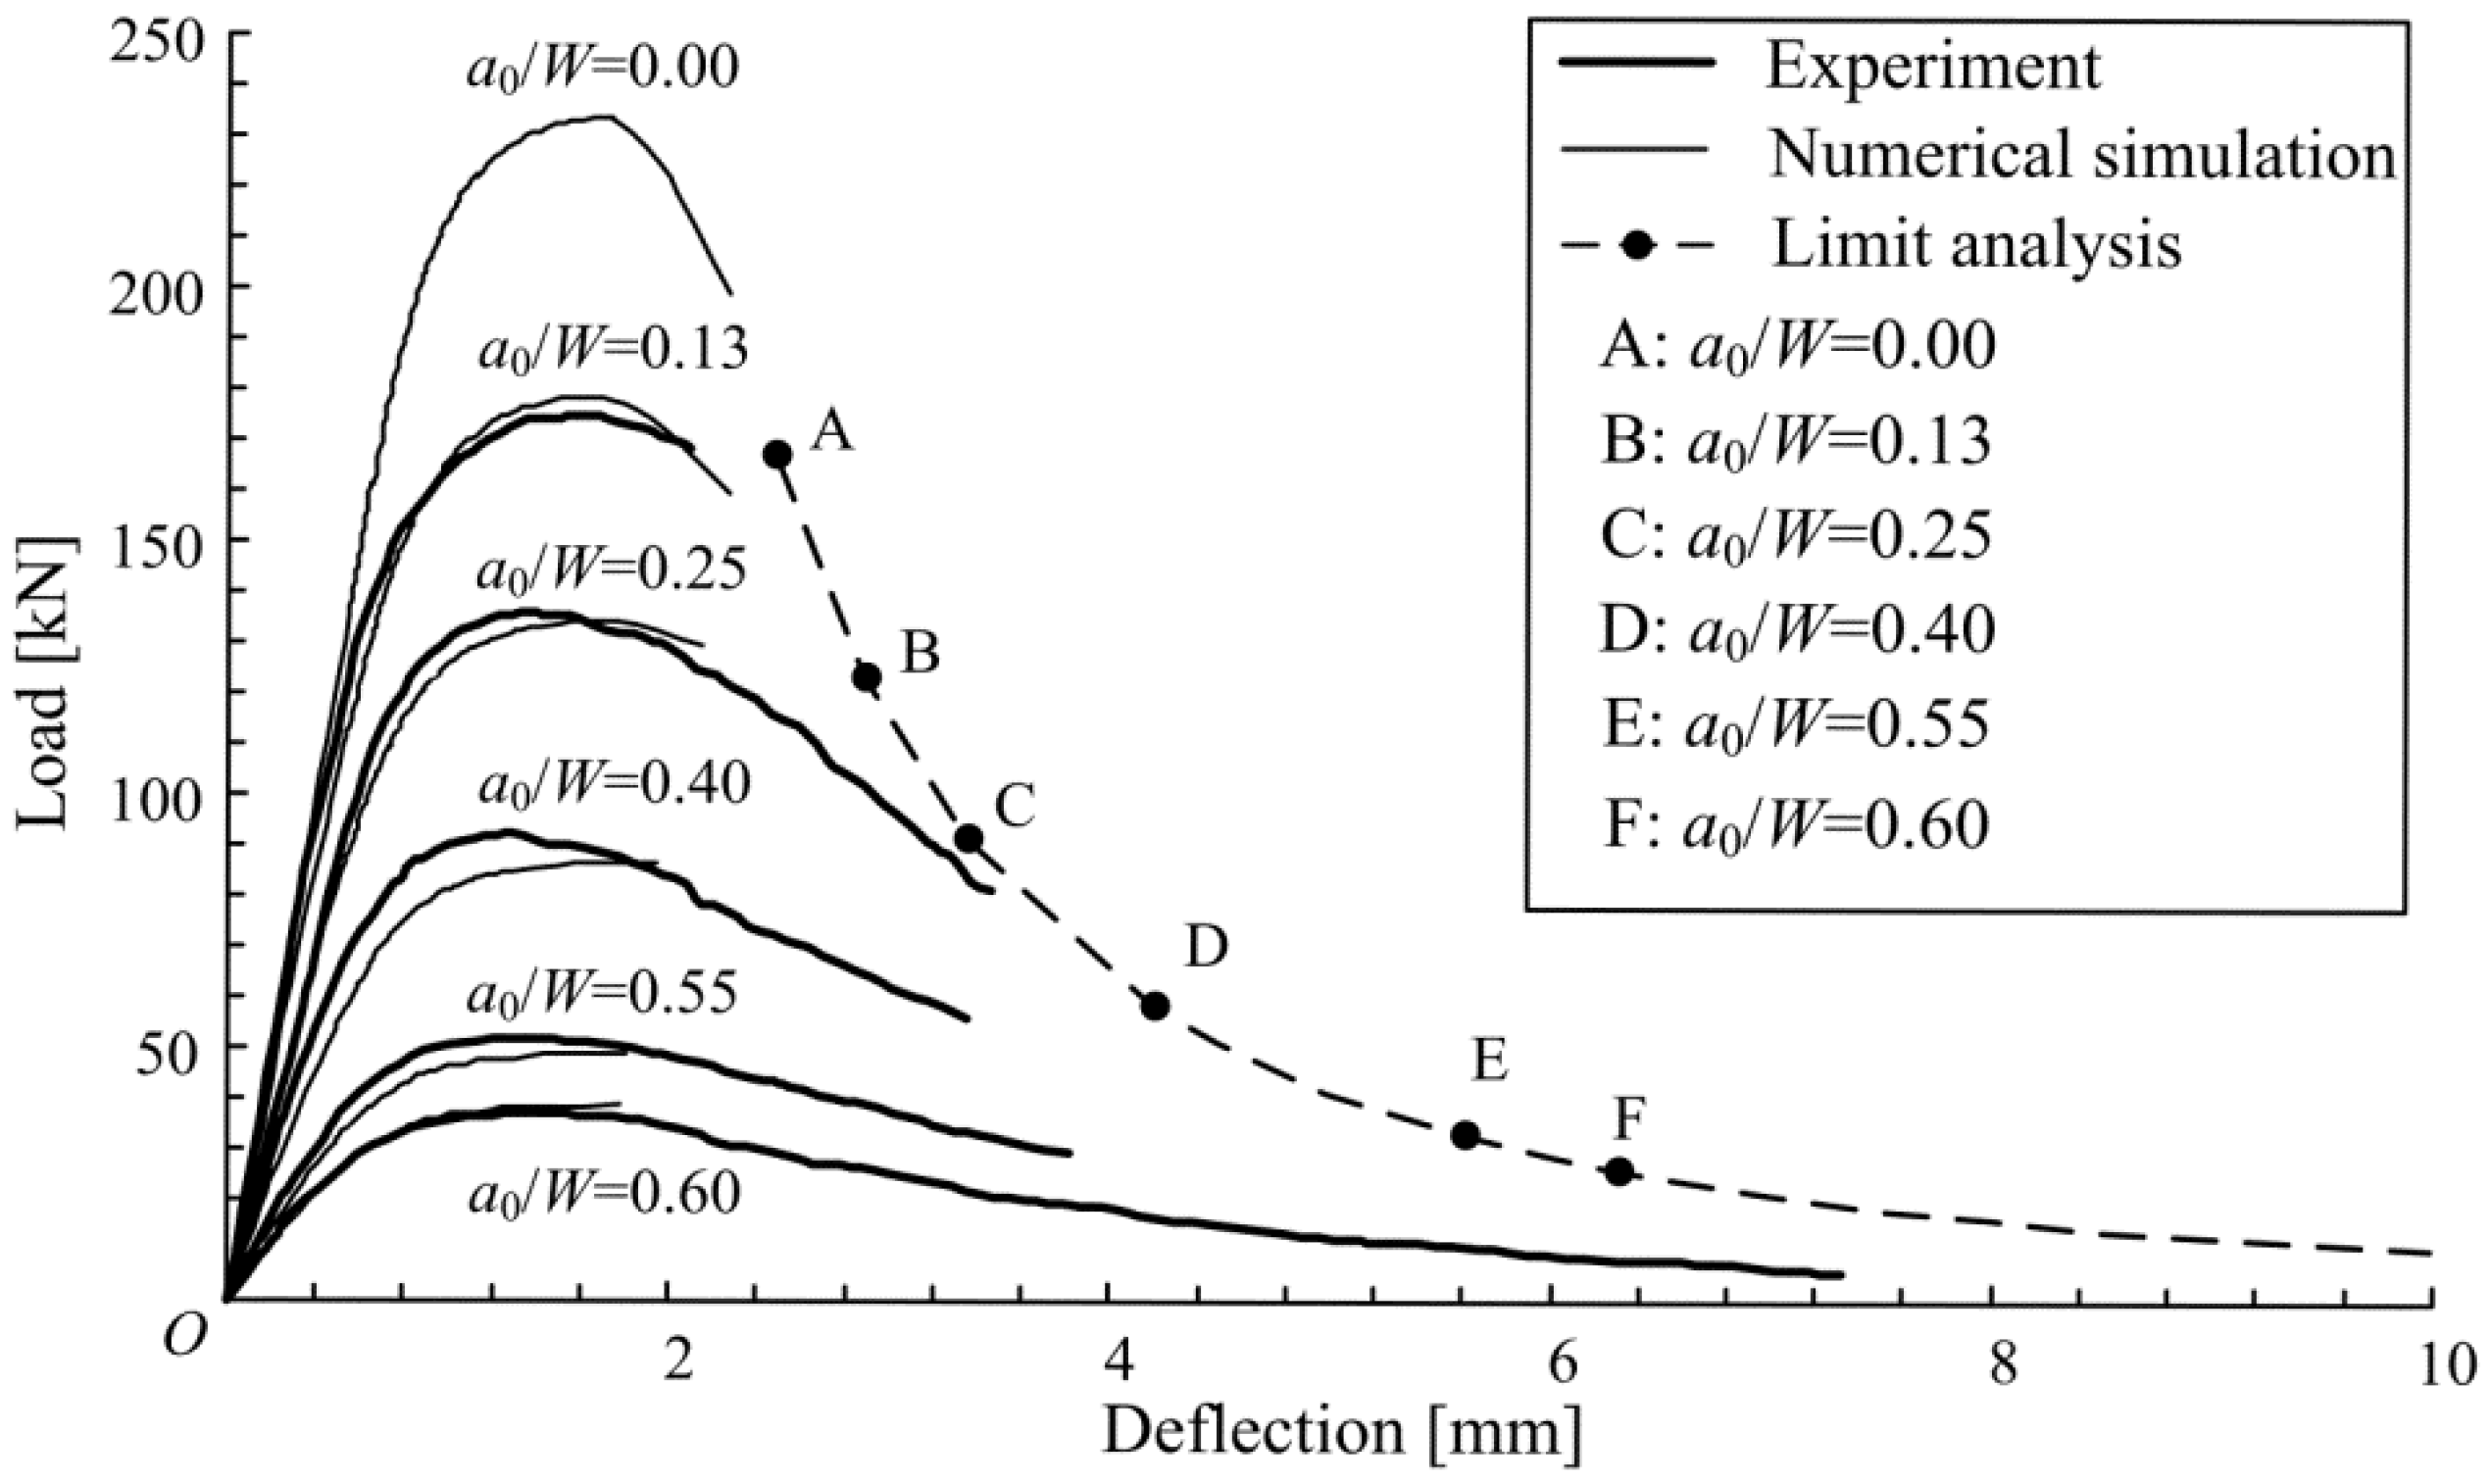
4.1. Three-Point-Bending Test of HY80 Steel

In this section, the experimental load vs. displacement curves from Zhu and Joyce [24] are compared with our numerical simulations. The material used for tests was HY80 steel. The mechanical properties, derived from tensile tests on cylindrical specimens with a 25 mm initial gauge, are: σy = 630 MPa, σu = 735 MPa, hardening exponent 0.1, and Young’s modulus E = 207 GPa. The specimens were single edge notched as recommended by ASTM E1820, with different initial crack length ratio ξ0 = a0/W = 0.13, 0.25, 0.40, 0.55, 0.60. The other geometric parameters of the beam are: L = 203 mm, W = 50.75 mm, B = 25.375 mm, slenderness λ = 4.
The above mechanical parameters have been employed in the numerical simulations for the cohesive/overlapping laws. The cohesive/overlapping energy is assumed to be 750 N/mm, wcr = 1.81 mm and wr = 0.3wcr. It is worth noting that the ratio wr/wcr has only a slight influence on the pre-peak behavior whereas the mechanical response, especially the post-peak performance, is significantly determined by the value of the cohesive energy [19].
The comparison between experimental results and numerical simulations is shown in Figure 12, where a very good approximation is obtained for all the considered initial crack lengths. The numerical simulations are terminated when the two fictitious tips converge to the same node, so that the tails of the load vs. deflection curves are described just by means of limit analysis. In addition, the numerical load–deflection curve for a0/W = 0.00 is also plotted in Figure 12, which demonstrates a very good continuity between numerical algorithm and limit analysis. The points A, B, C, D, E and F indicate the lower bounds of limit analysis for the different initial crack ratios, ξ0 = a0/W. It may be presumed that all the experimental load–deflection curves asymptotically tend to the limit analysis curve as shown in Figure 12.
Figure 12. Comparison between numerical simulations and experimental results [24] for TPB tests with different initial crack lengths (the points A, B, C, D, E, and F represent the lower bound of limit analysis for different initial crack lengths).
Metals 04 00428 g012

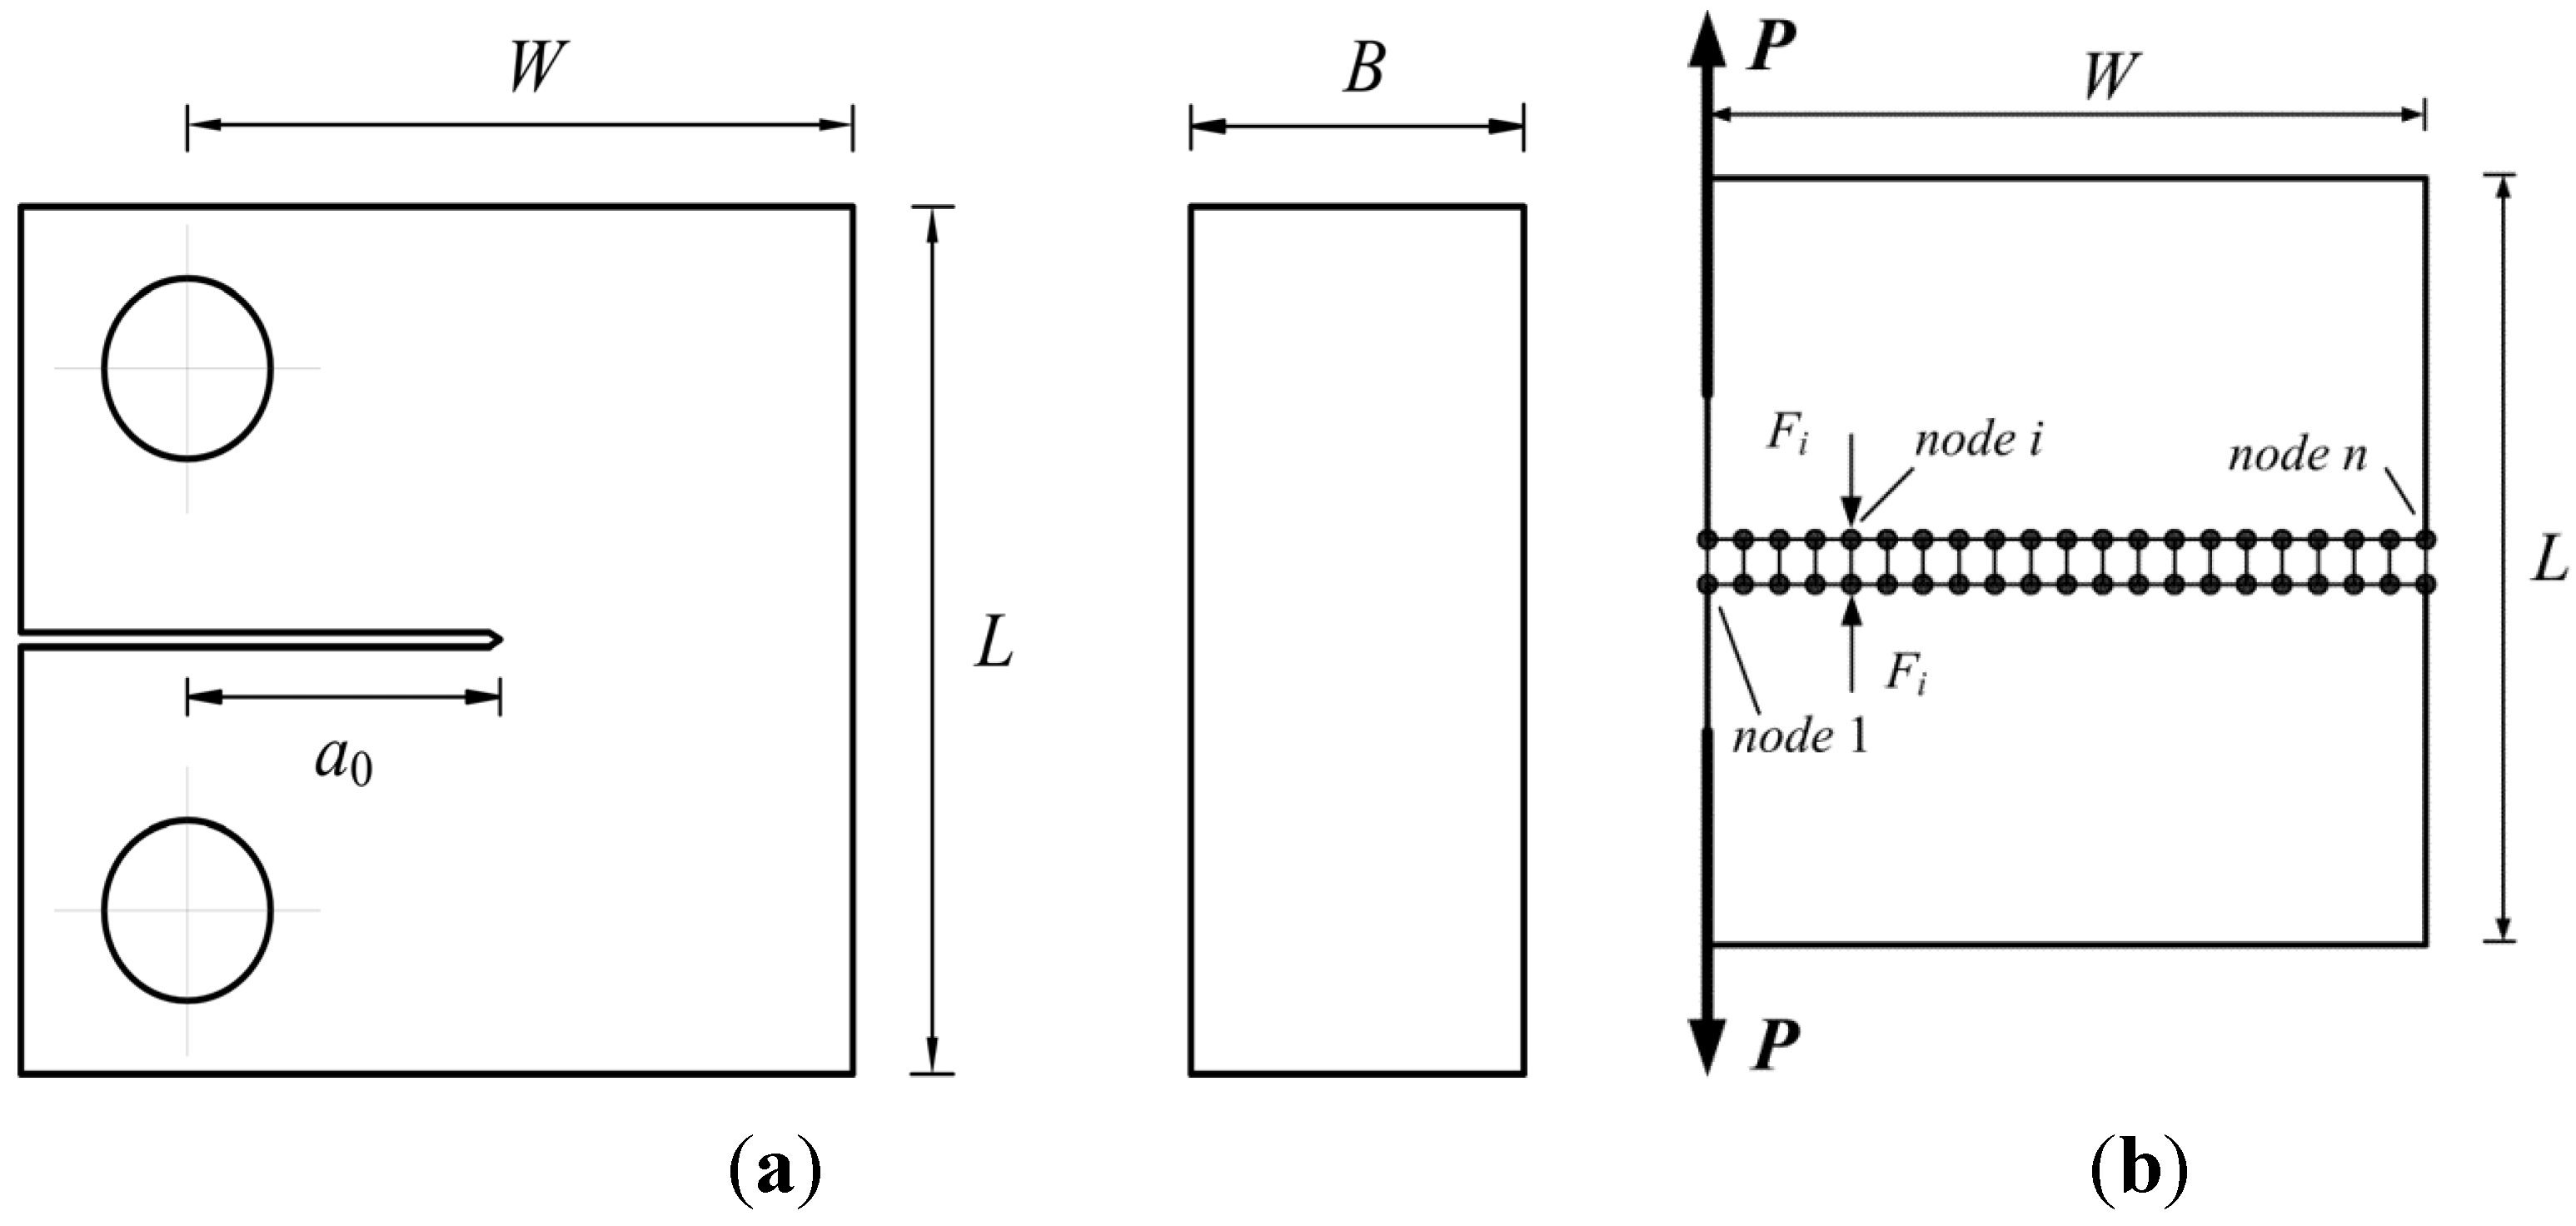
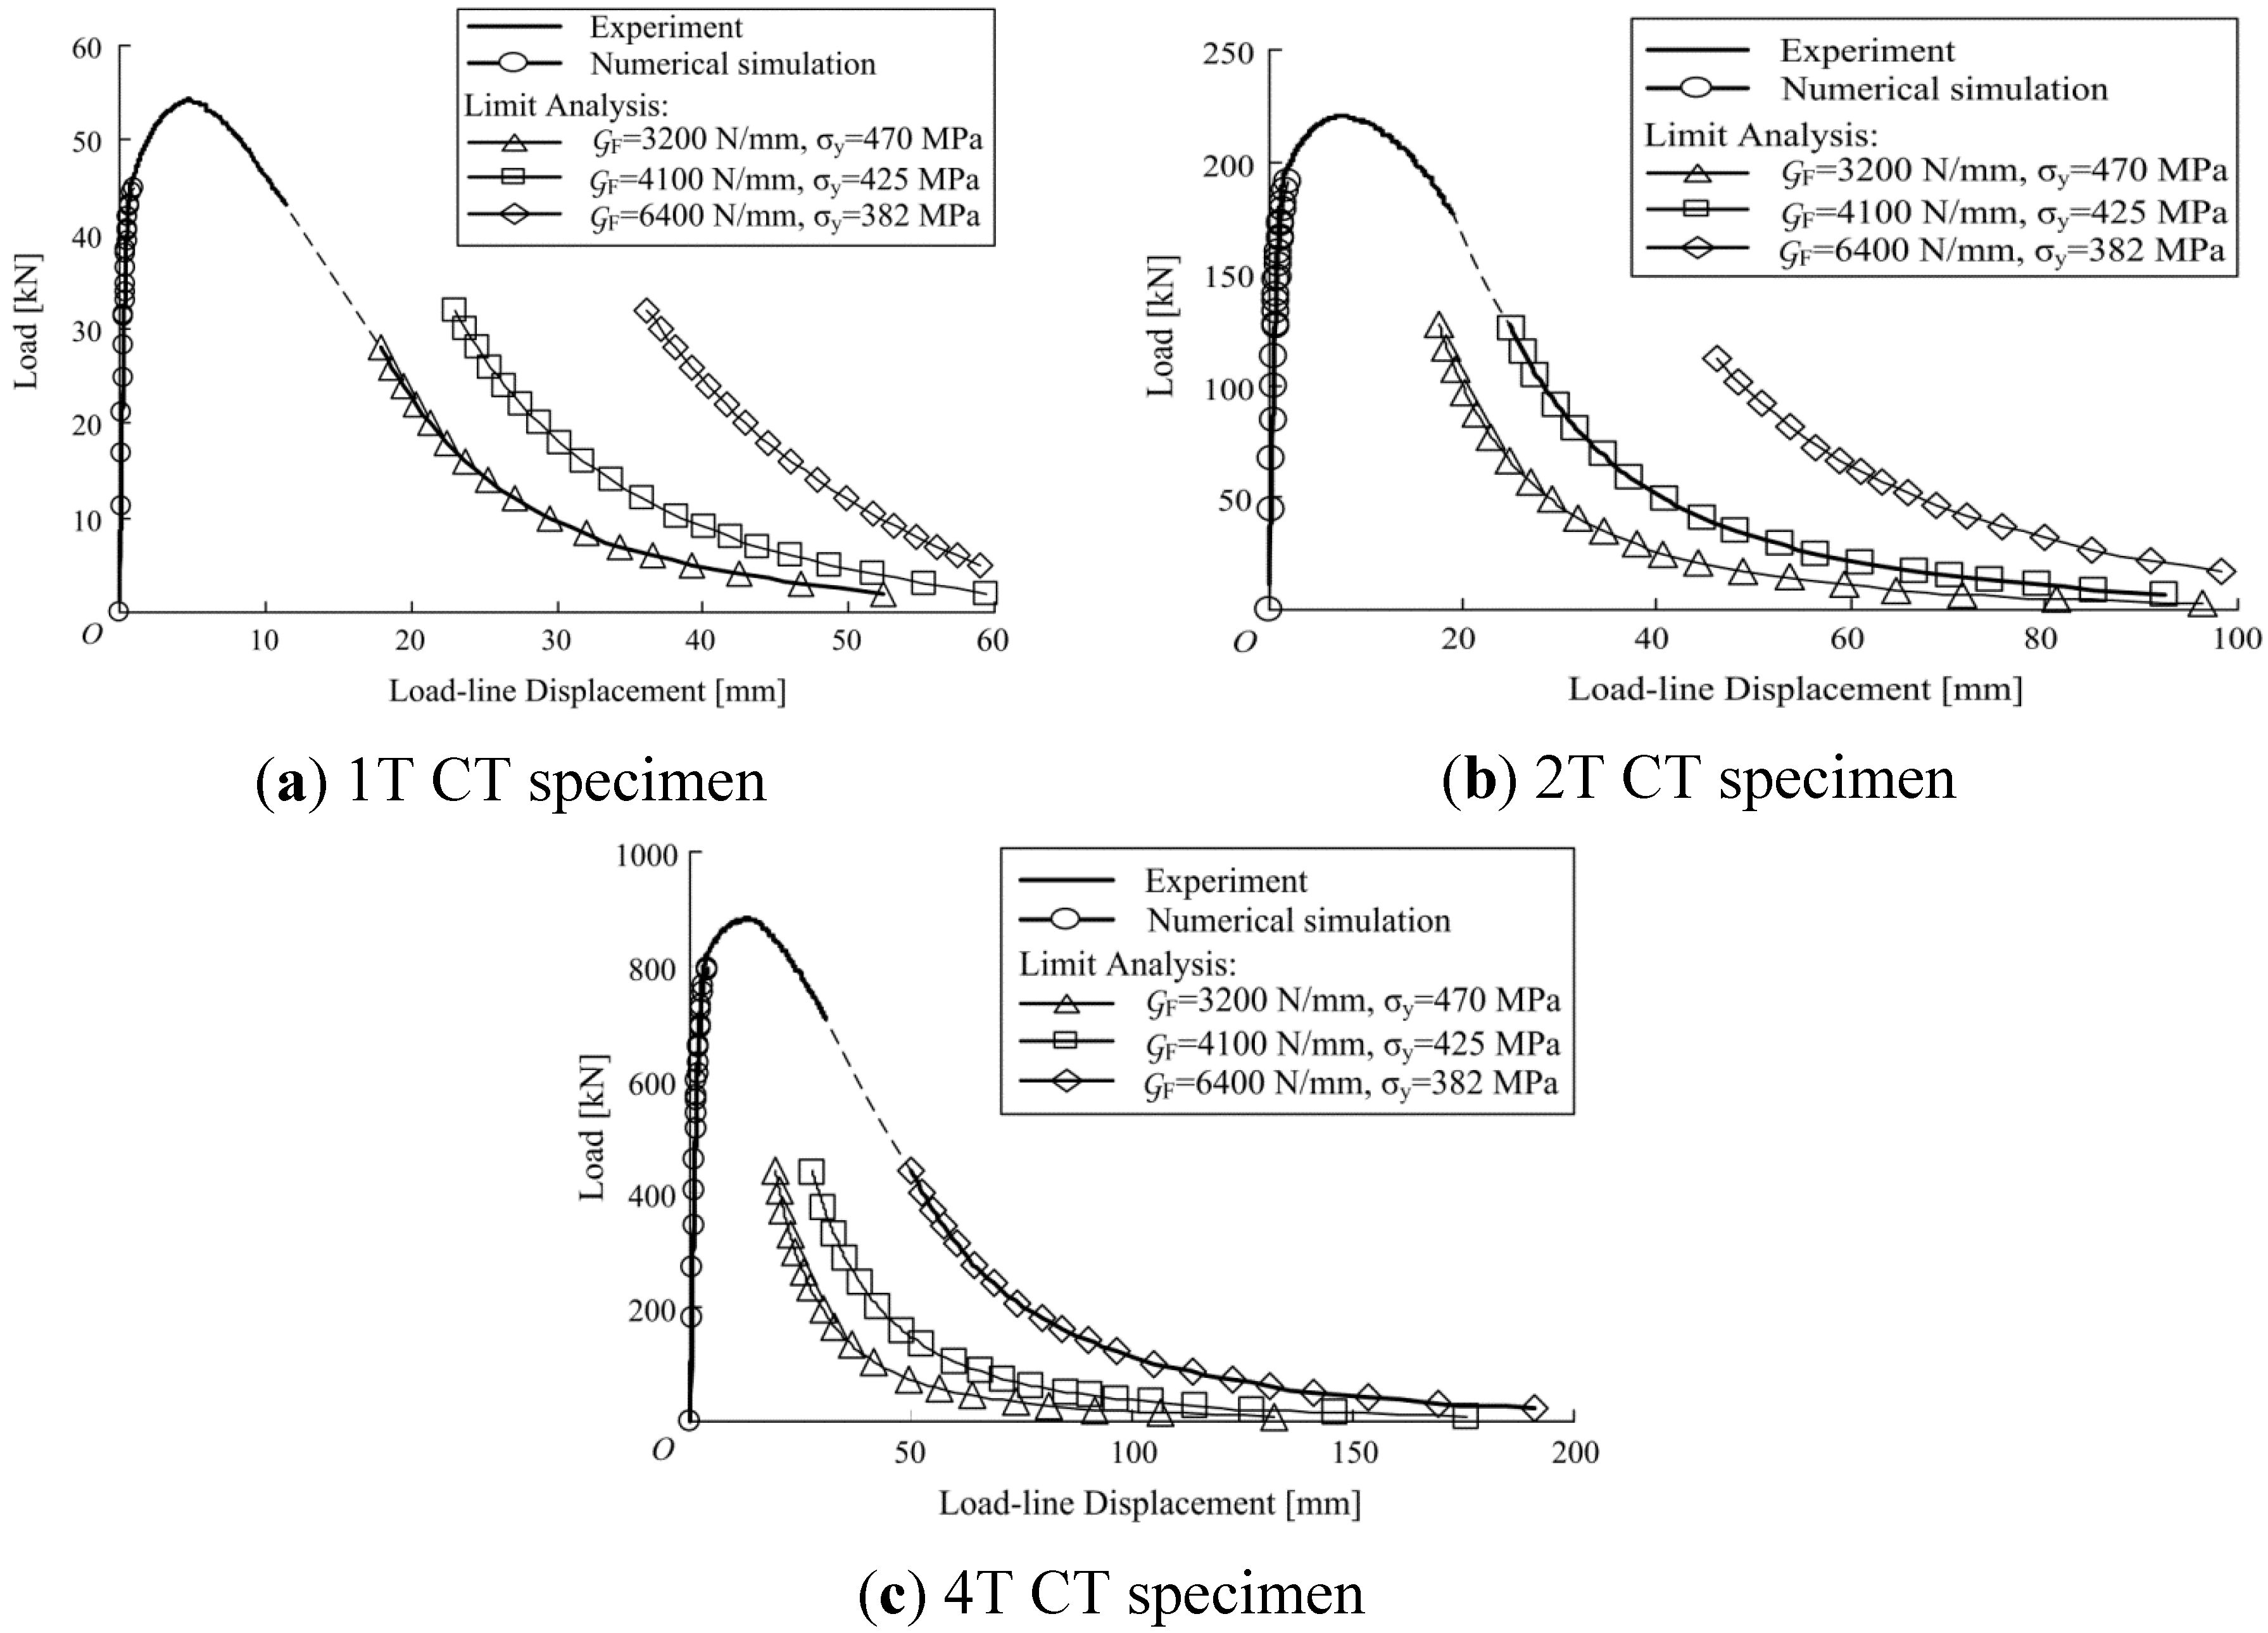
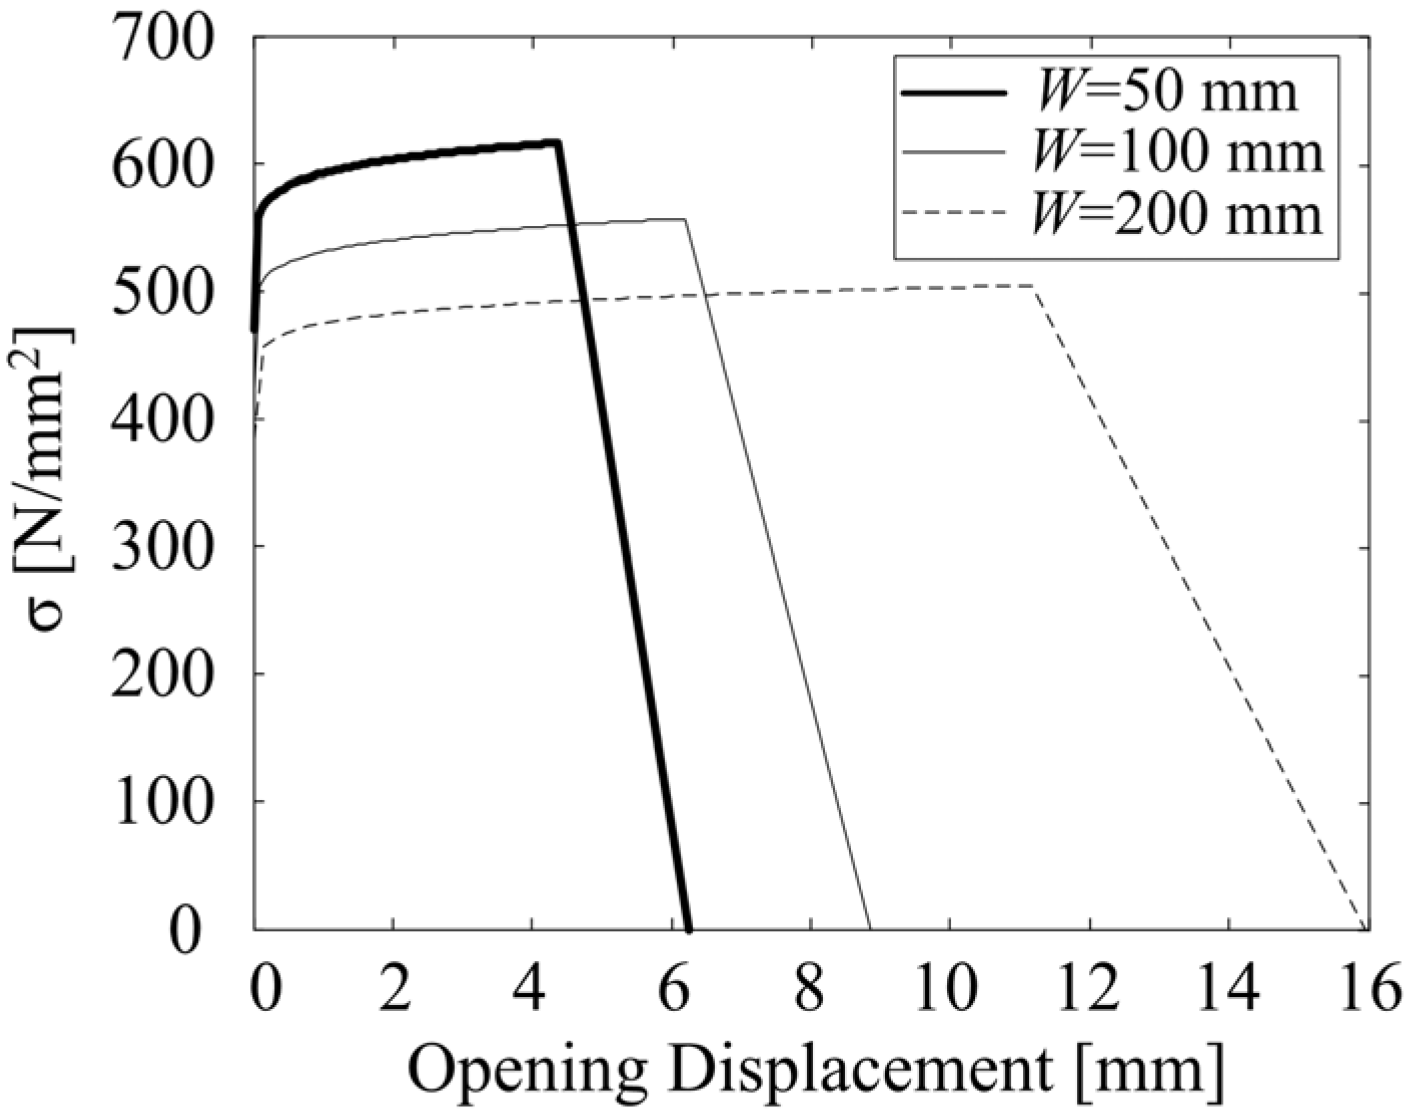
4.2. Compact Tension Test of DIN 22NiMoCr37 Steel

The material for the compact tension tests (CT) herein considered was obtained from a large forged, quenched and tempered ring segment of ferritic steel DIN 22NiMoCr37. All the experimental data are taken from the Euro-Fracture Dataset [17]. Three different specimens scaled in the ratio 1:2:4 have been considered, as described in Table 1. According to the CZM derived in Section 2, size-dependent parameters should be assumed for the constitutive laws. The tensile properties were determined from cylindrical specimens having a diameter of 6 mm and an initial gauge length of 25 mm. They are: σy = 470 MPa, σu = 616 MPa, and E = 200 GPa. In the numerical and analytical simulations such values are assigned to the 1T CT specimen, which has the dimensions closer to those of the tensile sample. For such a specimen, the cohesive/overlapping energy is assumed equal to 3200 N/mm, and the Ramberg-Osgood hardening exponent to 0.12. Then, scale-dependent cohesive parameters are assumed for the other specimens. In addition to the size effects on the fracture energy, justified by the meso-scale model presented in Section 2, scale-dependent yielding and ultimate strengths have also been considered, consistently with the experimental investigations on the size effects in mild steel reported in [18]. In particular, a variation for the yielding strength with a slope of −0.15 in the bi-logarithmic diagram σy vs. W, is introduced. Such a scaling law determines σy = 425 and 385 MPa for 2T and 4T CT specimens, respectively. As regards the scale effect on the cohesive/overlapping energy, it is determined by repeated solutions until the numerical and limit analysis predictions best fit the experimental results (Figure 13). In addition, in these cases, the numerical simulations are terminated when the two fictitious tips converge to the same node, and the asymptotic tails of the load vs. deflection curves are obtained from the limit analysis approach. The best fitting of the experimental results is obtained by assuming the values GF = 4100 and 6400 N/mm for specimens 2T and 4T CT, respectively. The parameter wcr is determined from σy and GF once the shape of the cohesive law and the ratio wr/wcr are fixed. The cohesive/overlapping constitutive laws adopted for the three considered specimens are shown in Figure 14.
Table 1. Geometry of the compact tension test (CT) specimens of DIN 22NiMoCr37 steel [17].
SpecimenWidth W (mm)Thickness, B (mm)Initial crack length a0 (mm)
CT 1T502528.3
CT 2T1005058.9
CT 4T200100113.6
In the investigated compact test examples, the material is very ductile as confirmed by the experimental force-displacement curves shown in Figure 13. Consistently, numerical results predict the propagation of the fictitious crack tip only, while the real crack tip does not propagate in the considered load range. Since a steady-state crack growth condition was not achieved, we cannot argue about the behaviour of energy dissipation and possible size-scale effects in that stage. However, we explored another simulation where the fracture energy was reduced in order to have both fictitious and real crack growths. For this case study, the diagram in Figure 15 shows that the dissipated energy rate, defined as the dissipated energy per unit of fictitious crack surface, is an increasing function of the fictitious crack tip position until the real crack tip starts propagating. Later on, the dissipated energy rate remains constant because the steady-state condition of crack growth is suddenly achieved. This particular result cannot exclude other cases when the size of the process zone changes during real crack tip propagation, leading to a further increase in the dissipated energy rate. Therefore, our proposed model can be used to predict the evolution of the energy dissipation also before the onset of real crack propagation mainly due to plastic deformation.
Figure 13. Comparison between experimental results [17], numerical simulations and limit analysis predictions for 1T, 2T and 4T CT specimens.
Metals 04 00428 g013
Figure 14. Hardening cohesive/overlapping laws for different specimen sizes.
Metals 04 00428 g014
Figure 15. Dissipated energy per unit of fictitious crack surface versus the relative crack tip position.
Metals 04 00428 g015

5. Conclusions

The hardening cohesive crack model is able to predict size-scale effects in ductile fracture taking place in metals, as firstly shown in [19] and further demonstrated with additional examples in the previous section. In the present study it has been shown that the shape of the hardening cohesive crack model can simply be deduced by the fundamental interplay between the following forms of nonlinearity at the meso-scale: grain plasticity and intergranular cracking in the polycrystalline microstructure of metals. Although a detailed calibration of the meso-scale parameters has not yet been proposed, since all the numerical results at the meso-scale refer to standard elasto-plastic constitutive parameters cohesive zone model properties of steel, the obtained stress-inelastic displacement curves are found to be in line with those assumed in [19]. Therefore, this opens the possibility to relate the shape of the hardening cohesive/overlapping crack model postulated in [19] to standard mechanical parameters governing the behaviour of the material at the meso-scale. A detailed parameters identification is also ongoing and we prospect a strategy based on performing tensile tests on metallic samples inside the chamber of a scanning electron microscope. The observation of the evolution of cracks and plasticity in the material will permit to identify meso-scale material parameters at the meso-scale, instead of considering them as free parameters to fit the macroscopic response. Therefore, a multi-scale computational method where the shape of the hardening cohesive crack model (equivalent constitutive law) is computed from meso-scale finite element simulations is an effective approach to be pursued.

Acknowledgments

The financial support by Ateneo Italo Tedesco, the Italian Ministry of Education, University and Research (MIUR) and the Deutscher Akademischer Austausch Dienst (DAAD) to the Project Vigoni 2010 “3D modelling of fracture and plasticity in polycrystalline materials” is gratefully acknowledged.

Author Contributions

AC and MC developed the theory of the hardening cohesive crack model for macro-scale simulations, implemented in a Fortran code by MC. MP implemented the 2D and 3D interface elements in FEAP and carried out the numerical simulations at the meso-scale. All the authors contributed to writing the manuscript and to the discussion of the results.

Conflicts of Interest

The authors declare no conflict of interest.

References

  1. Carpinteri, A. Post-peak and post-bifurcation analysis of cohesive crack propagation. Eng. Fract. Mech. 1989, 32, 265–278. [Google Scholar] [CrossRef]
  2. Carpinteri, A. Mechanical Damage and Crack Growth in Concrete; Martinus Nijhoff Publishers: Dordrecht, The Netherlands, 1986. [Google Scholar]
  3. Carpinteri, A. Cusp catastrophe interpretation of fracture instability. J. Mech. Phys. Solids 1989, 37, 567–582. [Google Scholar] [CrossRef]
  4. Carpinteri, A. Softening and snap-back instability in cohesive solids. Int. J. Numer. Methods Eng. 1989, 28, 1521–1537. [Google Scholar] [CrossRef]
  5. Espinosa, H.D.; Zavattieri, P.D. A grain level model for the study of failure initiation and evolution in polycrystalline brittle materials. Part I: Theory and numerical implementation. Mech. Mater. 2003, 35, 333–364. [Google Scholar]
  6. Espinosa, H.D.; Zavattieri, P.D. A grain level model for the study of failure initiation and evolution in polycrystalline brittle materials. Part II: Numerical examples. Mech. Mater. 2003, 35, 365–394. [Google Scholar]
  7. Benzerga, A.A. Rupture Ductile des Toles Anisotropes. Ph.D. Thesis, École Nationale Supérieure des Mines de Paris, Paris, France, 2000. [Google Scholar]
  8. Benzerga, A.A.; Leblond, J.B. Ductile fracture by void growth to coalescence. Adv. Appl. Mech. 2010, 44, 169–305. [Google Scholar]
  9. Paggi, M.; Lehmann, E.; Weber, C.; Carpinteri, A.; Wriggers, P.; Schaper, M. A numerical investigation of the interplay between cohesive cracking and plasticity in polycrystalline materials. Comput. Mater. Sci. 2013, 77, 81–92. [Google Scholar] [CrossRef]
  10. Paggi, M.; Wriggers, P. A nonlocal cohesive zone model for finite thickness interfaces—Part I: Mathematical formulation and validation with molecular dynamics. Comput. Mater. Sci. 2011, 50, 1625–1633. [Google Scholar] [CrossRef]
  11. Paggi, M.; Wriggers, P. A nonlocal cohesive zone model for finite thickness interfaces—Part II: FE implementation and application to polycrystalline materials. Comput. Mater. Sci. 2011, 50, 1634–1643. [Google Scholar] [CrossRef]
  12. Zienkiewicz, O.C.; Taylor, R.L. The Finite Element Method, 5th ed.; Butterworth-Heinemann: Oxford, UK; Boston, MA, USA, 2000. [Google Scholar]
  13. Schellekens, J.C.J.; de Borst, R. On the numerical integration of interface elements. Int. J. Numer. Methods Eng. 1993, 36, 43–66. [Google Scholar] [CrossRef]
  14. Ortiz, M.; Pandolfi, A. Finite-deformation irreversible cohesive elements for three-dimensional crack-propagation analysis. Int. J. Numer. Methods Eng. 1999, 44, 1267–1282. [Google Scholar]
  15. Segurado, L.; Llorca, J. A new three-dimensional interface finite element to simulate fracture in composites. Int. J. Solids Struct. 2004, 41, 2977–2993. [Google Scholar] [CrossRef]
  16. Tvergaard, V. Effect of fiber debonding in a whisker-reinforced metal. Mater. Sci. Eng. A 1990, 107, 23–40. [Google Scholar]
  17. Heerens, J.; Hellmann, D. Development of the Euro fracture toughness dataset. Eng. Fract. Mech. 2002, 69, 421–449. [Google Scholar] [CrossRef]
  18. Richards, C.W. Size effect in the tension test of mild steel. Proc. Am. Soc. Test. Mater. 1954, 54, 995–1000. [Google Scholar]
  19. Carpinteri, A.; Gong, B.; Corrado, M. Hardening cohesive/overlapping zone model for metallic materials: The size-scale independent constitutive law. Eng. Fract. Mech. 2012, 82, 29–45. [Google Scholar] [CrossRef]
  20. Carpinteri, A.; Corrado, M.; Paggi, M. An analytical model based on strain localisation for the study of size-scale and slenderness effects in uniaxial compression tests. Strain 2011, 47, 351–362. [Google Scholar] [CrossRef]
  21. Tvergaard, V.; Hutchinson, J.W. The relation between crack growth resistance and fracture process parameters in elastic-plastic solids. J. Mech. Phys. Solids 1992, 40, 1377–1397. [Google Scholar] [CrossRef]
  22. Tvergaard, V.; Hutchinson, J.W. Effect of T-stress on mode I crack growth resistance in a ductile solid. Int. J. Solids Struct. 1994, 31, 823–833. [Google Scholar] [CrossRef]
  23. Carpinteri, A.; Colombo, G.; Ferrara, G.; Giuseppetti, G. Numerical simulation of concrete fracture through a bilinear softening stress-crack opening displacement law. In Fracture of Concrete and Rock, In Proceedings of a SEM-RILEM International Conference, Houston, TX, USA, 1987; Shah, S.P., Swartz, S.E., Eds.; Springer-Verlag: New York, NY, USA, 1989; pp. 131–141. [Google Scholar]
  24. Zhu, X.-K.; Joyce, J.A. J-Resistance curve testing of HY80 steel using SE(B) specimens and normalization method. Eng. Fract. Mech. 2007, 74, 2263–2281. [Google Scholar] [CrossRef]

