Review

Mechanical Relaxation of Metallic Glasses: An Overview of Experimental Data and Theoretical Models

1
Department of Physics, Universitat Politècnica Catalunya—BarcelonaTech, Esteve Terradas 7–8, Castelldefels 08860, Spain
2
Centre for Research in NanoEngineering, Universitat Politècnica Catalunya—BarcelonaTech, Esteve Terradas 7–8, Castelldefels 08860, Spain
*
Author to whom correspondence should be addressed.
Metals 2015, 5(2), 1073-1111; https://doi.org/10.3390/met5021073
Submission received: 20 May 2015 / Revised: 11 June 2015 / Accepted: 12 June 2015 / Published: 19 June 2015
(This article belongs to the Special Issue Metallic Glasses)

Abstract

:
Relaxation phenomena in glasses are a subject of utmost interest, as they are deeply connected with their structure and dynamics. From a theoretical point of view, mechanical relaxation allows one to get insight into the different atomic-scale processes taking place in the glassy state. Focusing on their possible applications, relaxation behavior influences the mechanical properties of metallic glasses. This paper reviews the present knowledge on mechanical relaxation of metallic glasses. The features of primary and secondary relaxations are reviewed. Experimental data in the time and frequency domain is presented, as well as the different models used to describe the measured relaxation spectra. Extended attention is paid to dynamic mechanical analysis, as it is the most important technique allowing one to access the mechanical relaxation behavior. Finally, the relevance of the relaxation behavior in the mechanical properties of metallic glasses is discussed.

Graphical Abstract

1. Introduction

Relaxation is a universal phenomenon driving a system from an excited state towards a more stable one. In this work we will focus on relaxations implying changes of the atomic or molecular positions of a substance, generally known as structural relaxations. Relaxations involving changes of the electronic states are not discussed here. There are different techniques capable of exploring the relaxation response under different stimuli. These techniques comprehend mechanical and dielectric spectroscopy, nuclear magnetic resonance, neutron scattering and various electromagnetic radiation scattering. They probe the relaxation dynamics through the time evolution of macroscopic variables such as density, enthalpy, stress, strain and electric polarization, or by monitoring microscopic parameters such as nuclear spin orientation and mean square or rotational angle displacements.
The relaxation times obtained from different techniques coincide in some systems and time-temperature windows, but not necessary in others as illustrated in Figure 1 [1]. The relaxation time τl (liquid structural relaxation-longitudinal) determined from Brillouin scattering, τreorientation obtained from vibrational spectroscopy, τσ determined from electrical conductivity, τs from viscosity and τH from differential scanning calorimetry of 0.4Ca(NO3)20.6KNO3 (CKN glass) split off from each other when temperature decreases, this indicating a decoupling of the relaxation times associated to different structural movements as the supercooled liquid approaches the glass transition temperature (Tg). In the case of metallic glasses some of these experimental techniques cannot be used, as for example dielectric spectroscopy. This opens a hole in the frequency window usually probed in other substances, which is partially filled with the information obtained by mechanical relaxation techniques. This work is focused on mechanical relaxation of metallic glasses, where experimental data is obtained in terms of macroscopic stress and strain variables in experiments involving relatively long times (or low frequencies). The high-frequency (vibrational) dynamics is not within the scope of this work.
Figure 1. Relaxation times associated to different probed properties in CKN glass. Reprinted from Reference [1] with permission from Elsevier.
Metals 05 01073 g001
Although there is not yet a comprehensive theory, it is generally accepted that glass formation is not a thermodynamic phase transformation but a kinetic process that freezes the system in an out-of-equilibrium configuration at temperatures below Tg [2,3,4]. Therefore, glasses are permanently prone to change its configuration towards a more stable state through irreversible atomic movements. This process is called physical aging and it may have time scales much larger than the experimental ones, seeming that the system is stable from the macroscopic point of view. This process is also called structural relaxation, in the sense that the system is relaxing form a higher free-energy configuration towards a lower one. Nevertheless, the structural relaxation understood as the response of the system to an applied external stimulus, is an intrinsic process present both in equilibrium (liquid) and out-of-equilibrium (glassy) states. For the sake of clarity, in this work, we denote as relaxation only the latter kind of process while the former one will be always referred as aging. Of course, in many cases, similar structural movements are responsible for mechanical relaxation and physical aging. However, we would like to emphasize here that the relaxation response is a well-defined property dependent only on temperature and pressure for a particular glassy configuration while physical aging is a history dependent process driving the system through different glassy states.
This work aims to review early work as well as recent new findings on the relaxation of metallic glasses studied by mechanical spectroscopy. It is also intended as an easy introduction for beginners in the field. It is organized in the following way: Firstly, we will review the relaxation dynamics, viscosity and physical aging behaviors of glasses introducing the major models used for their interpretation; Secondly, we will summarize the main characteristics of the mechanical spectroscopy technique, the different kind of processes contributing to the mechanical relaxation of glasses and the model functions used for analyzing the response of glasses both in the time and the frequency domains; Finally, experimental data on mechanical relaxation of metallic glasses are presented, from early works measuring internal friction as a probe to study the physical aging to more recent works characterizing the presence and effects of secondary relaxations in bulk metallic glasses (BMGs). Eventually, recent progress on fitting the Dynamo-Mechanical-Analysis (DMA) results considering different fitting models and the relationship between the relaxation behavior and other mechanical properties will be also discussed.

2. Basics of Glass Relaxation Dynamics

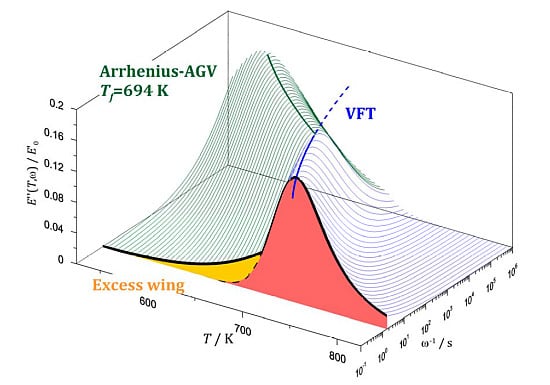
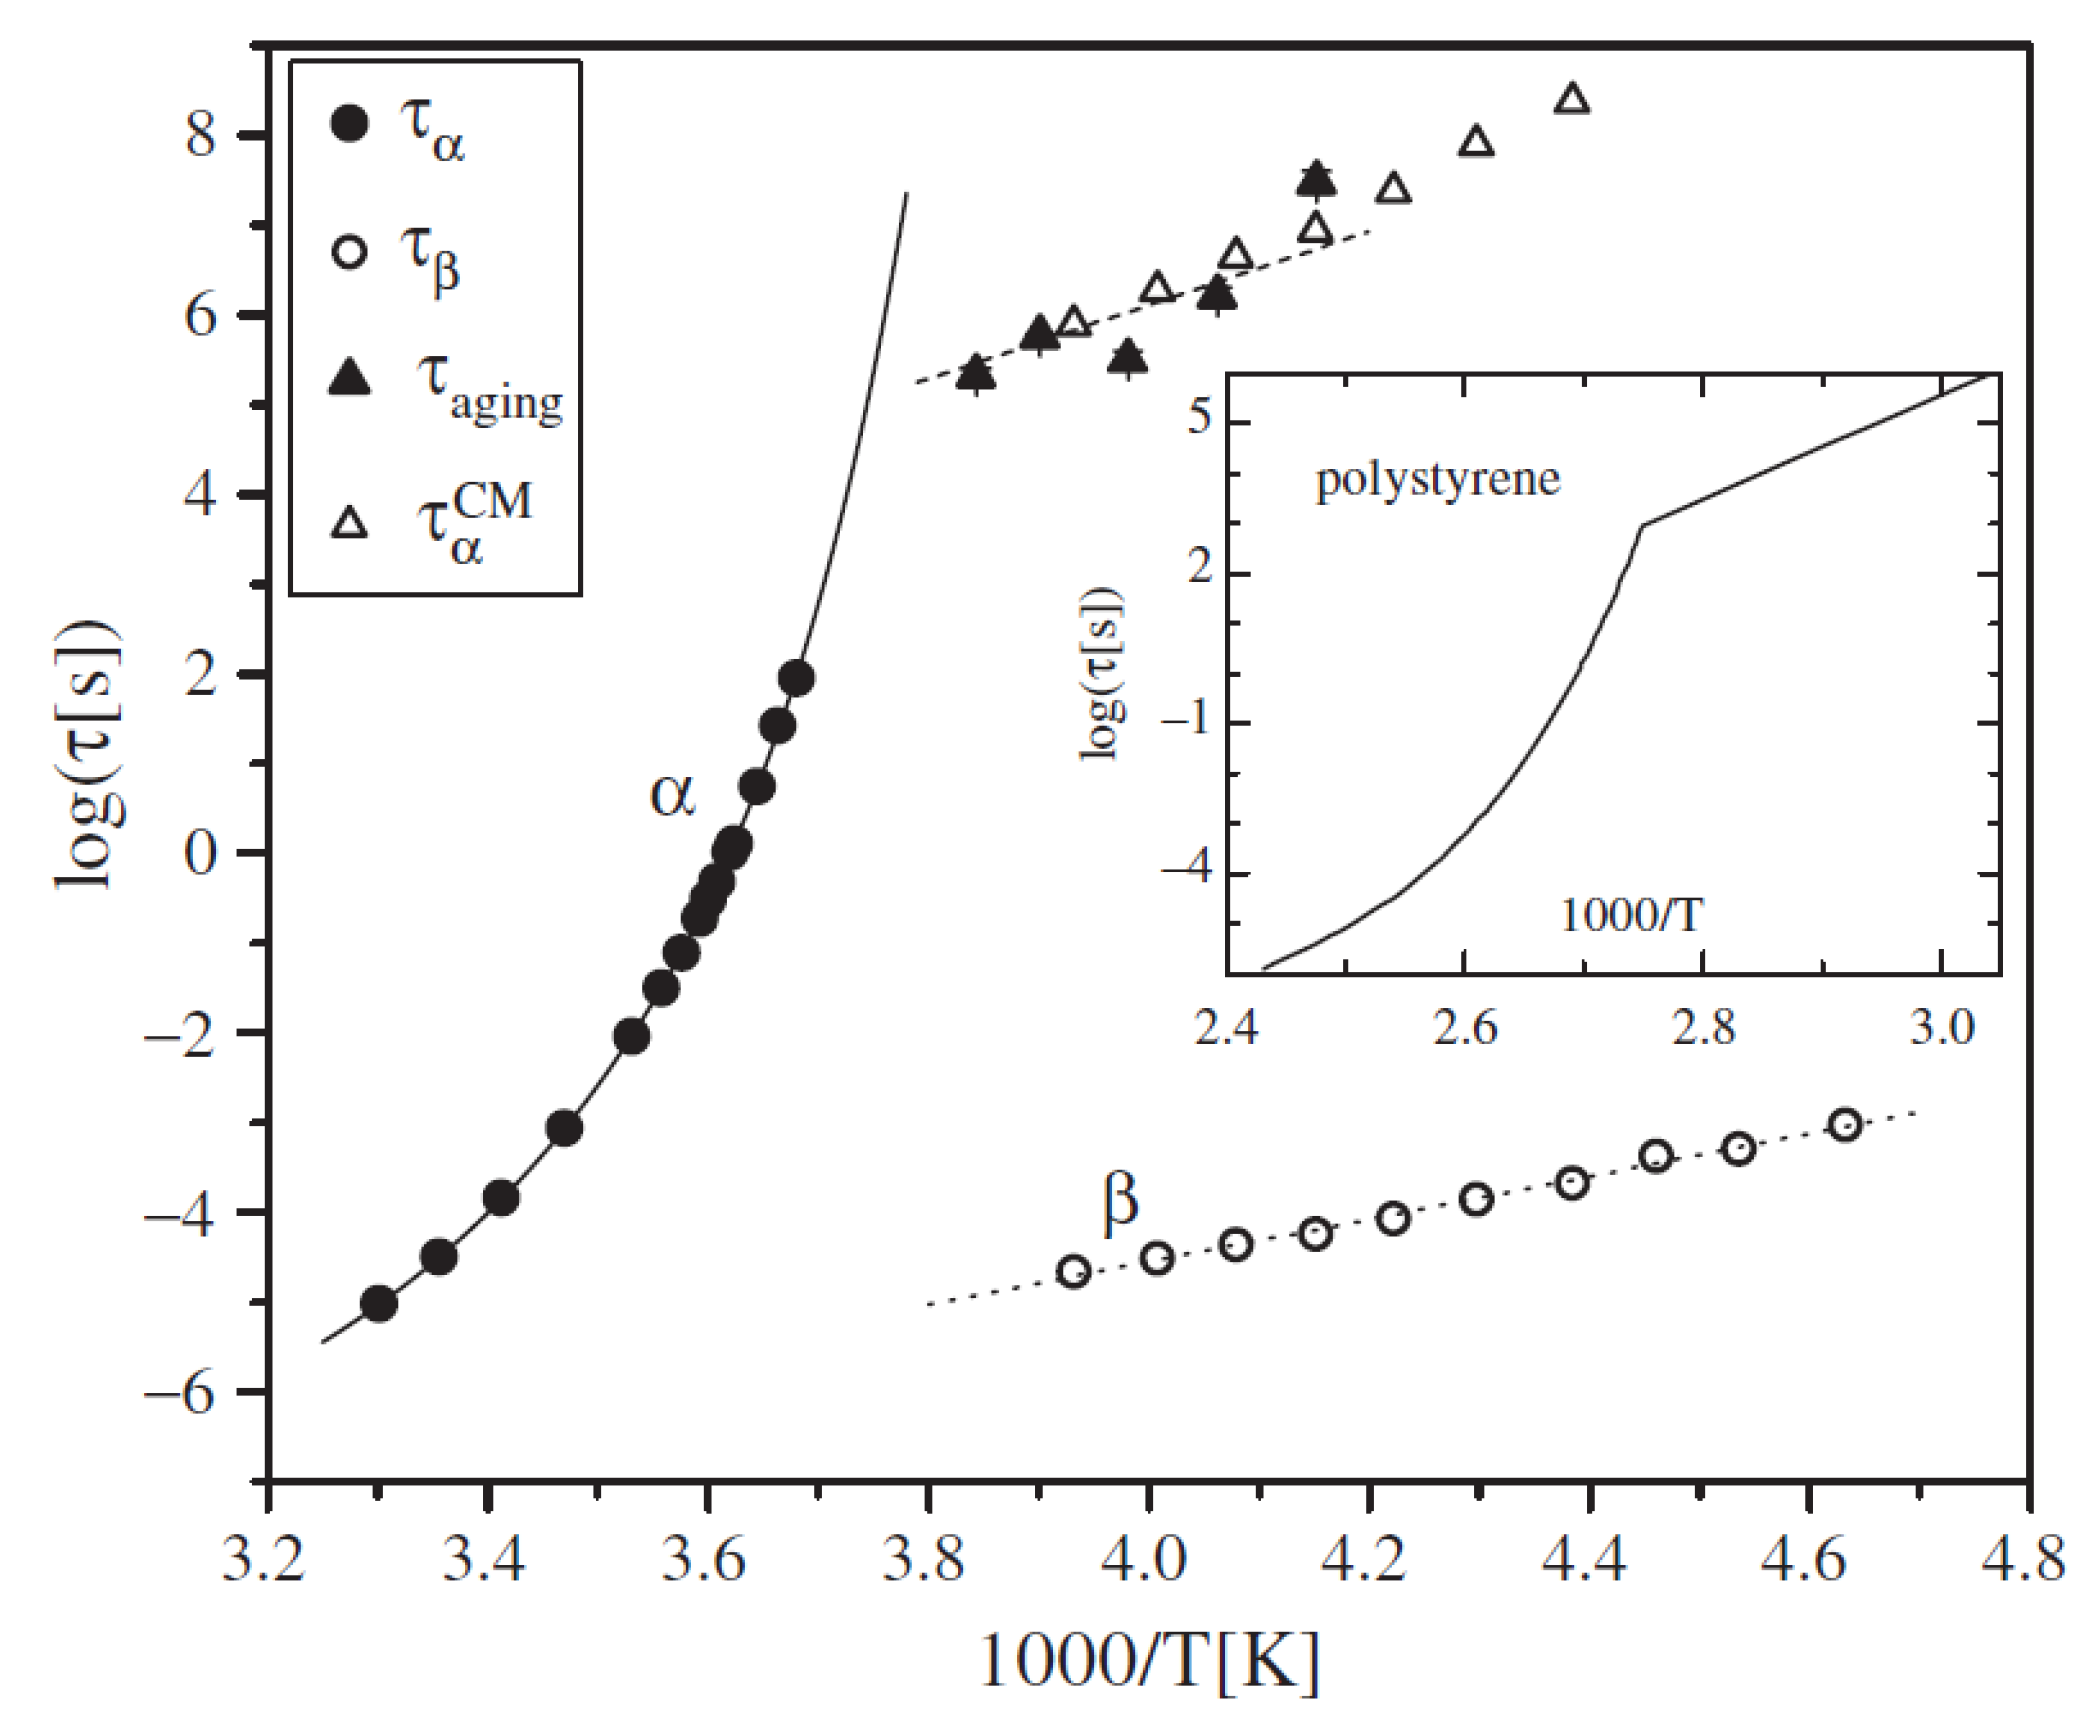
2.1. Relaxation in the Supercooled Liquid Region

The activation of viscous flow reflects the complete relaxation of the system, accommodating its structure under the application of an external force. Therefore, in structural glasses, viscosity is directly related to the primary relaxation time of the system, the so-called α-relaxation. In the supercooled liquid region, when T > Tg, the system is ergodic and the α-relaxation time, τα, characterizes how long takes the system to return to internal equilibrium after being excited by an external force or a change in the temperature-pressure conditions. Generally speaking, the viscosity (η) and τα deviate from Arrhenius behavior. As summarized by Angell [5], different theories like the simple liquid model, mode coupling theory, random walk model, or theoretical results for random packed spheres or cooperatively rearranging systems propose different dependences on temperature.
Actually, in the relatively narrow temperature region where most of the experimental viscosity data is obtained, all models fit the data with just two or three parameters and it is difficult to determine which model have superior validity. Experimentally, for many liquids above Tg, the relaxation dynamics can be described in the form of the Vogel-Fulcher-Tammann (VFT) equation for the viscosity
η ( T ) = η 0 exp ( D * T 0 T T 0 )
D* and T0 being the strength parameter and the VFT temperature respectively. The strength parameter D* is used to distinguish between strong and fragile liquids; strong liquids are defined by a large D* and an almost Arrhenius-like behavior (T0 → 0). On the other hand, fragile liquids are characterized by small D* and a very rapid breakdown of shear resistance when heating above Tg. Analogous temperature dependence is also found for τα above Tg [6]. The strong-fragile nature of liquids near Tg is also usually characterized by the fragility parameter
m = d log η d ( T g / T ) | T = T g = d log τ α d ( T g / T ) | T = T g
In addition to the main α-relaxation, secondary relaxations may be also found in the supercooled liquid region. Below some critical temperature, particular structural movements are decoupled from the main process giving rise to faster relaxations which usually follow an Arrhenius-like temperature behavior. As discussed below, some models predict the presence of a β-relaxation below a critical temperature (Tc > Tg) as a universal feature of the glass transition process [5,7].

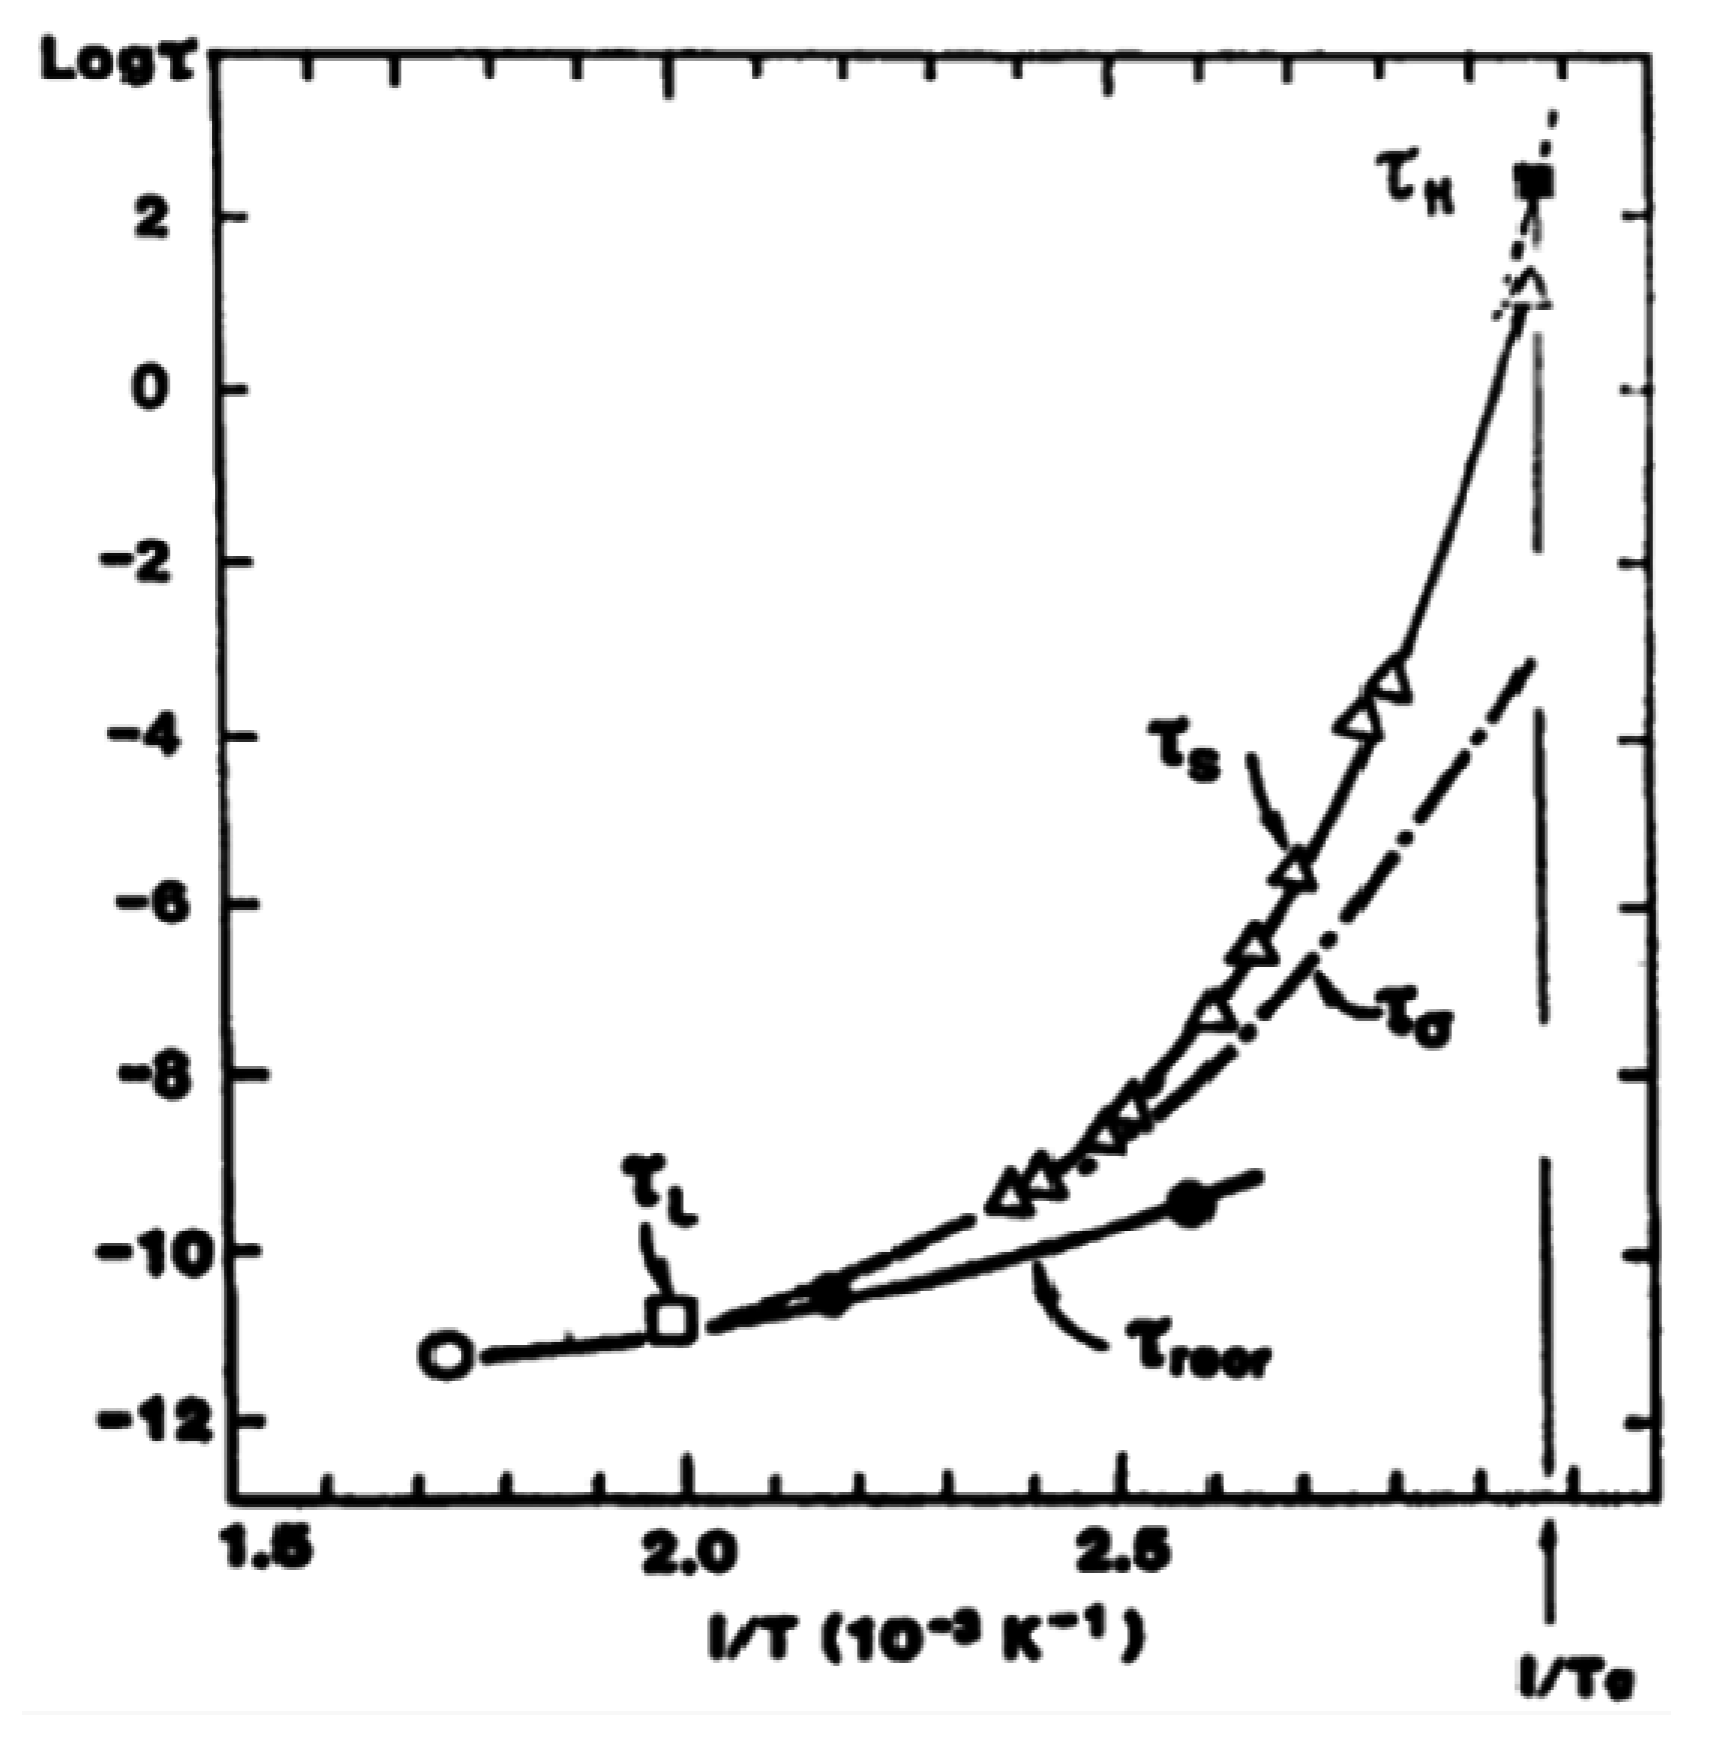
2.2. Relaxation and Aging below Tg

In an intermediate temperature region near and not too far below the glass transition, the situation is complex. The relaxation dynamics cannot be described by the VFT equation anymore, the system is not in an ergodic state and its properties are not uniquely defined by the temperature-pressure conditions; they depend on the particular glassy state reached during the previous history. Furthermore, the degree of aging determine the physical and mechanical properties like density, elastic constants, diffusivity, Curie temperature (for ferromagnetic glasses) [8], electrical resistivity, enthalpy, etc., as well as the relaxation dynamics of the system. In this intermediate region, physical aging must be considered as occurring continuously on all experimental time scales, but without reaching equilibrium except for very long annealing times (ta). This complexity might be solved in a first-order approach by introducing a fictive temperature Tf, which is used to define the glassy state of a system [9].
If aging is not considered the glassy dynamics of many systems can be approached as function of Tf using the Adams-Gibbs-Vogel (AGV) model [10,11]
τ α ( T ) = τ 0 exp ( B T ( 1 T 0 / T f ) )
where B and T0 are empirical parameters, τ0 the pre-exponential factor and Tf defines the temperature at which liquid (VFT) and glass Arrhenius-like (AGV) dynamics intersect each other. This fictive temperature evolves as a consequence of aging
d T f d t a = T T f τ aging
with limiting condition of Tf = T for a completely aged system attaining internal equilibrium.
At low temperatures (T << Tg) the aging time, τaging, is usually long enough to consider Tf constant and the glass structure frozen in an isoconfigurational state, with properties dependent on T, P and Tf. This low temperature region can be defined as the range where the cooperative stress relaxation (α-relaxation) of the viscous liquid is completely frozen and the structural state of the glass does not change in laboratory time-scale; as Tf is constant, the glass properties are defined only by the temperature-pressure conditions. Relaxation in this glassy range involves decoupled, localized motion of easily mobile species; this is usually called secondary relaxations. They are sometimes classified further as β, γ, δ-relaxations in polymers where the stepwise freezing of various local degrees of freedom may be associated with specific molecular groups. While remaining in an isoconfigurational state, relaxations are thermally activated processes with well-defined temperature dependences, τ(T), usually following Arrhenius-like behaviors.
On the other hand, at intermediate temperatures, the complexity comes from the fact that τaging, which controls the aging evolution, is at the same time dependent on the degree of aging. Different models have been introduced in order to model this complex behavior. One common approach to model the viscosity, the glassy dynamics and other properties is the Tool-Narayanaswamy-Moyniham (TNM) equation [10,12,13,14]
τ ( T , T f ) = τ 0 exp ( x E k B T + ( 1 x ) E k B T f )
where x is a dimensionless non-linearity parameter (the TNM parameter), E is an activation energy and kB is the Boltzmann constant as usual. Under this approach, the viscosity dependence on time could be described as a function of the change of the fictive temperature with complexity attributed to the non-linearity parameter x. Some models propose different approaches for the time evolution of the α-relaxation time during aging at a given temperature. Lunkenheimer et al. [15] proposed an expression for τα(ta) assuming that τaging is equal to τα. This assumption is commonly adopted for structural glasses, as it is reasonable to expect that the movements accommodating the structure to an external force should be similar to the ones driving the system towards more stable configurations during aging.
The study of physical aging in metallic glasses has been extensively done by calorimetric techniques. Based on Chen’s work [16], the aging process characterized by DSC can show a broad distribution of activation energies. Chen’s work shows that the spectrum has two separable broad processes, attributed to β and α relaxations respectively [16]. In Pd48Ni32P20 glass the low-energy peak corresponds to an activation energy E = 92.4 kJ/mol (0.96 eV). Tsyplakov [17] obtained similar results on the activation energy spectrum using DSC and mechanical relaxation. He interpreted the data by assuming that aging of metallic glasses is a change in the concentration of frozen defects similar to Dumbbell interstitials in simple crystals [17,18,19]. In the Dumbbell interstitials model, the activation energy shows a broad distribution of values. Nagel’s work on positron annihilation studies of free volume changes during aging of Zr65Al7.5Ni10Cu17.5 glass [20] suggests that the isothermal aging kinetics obeys a Kohlrausch-Williams-Watts (KWW) law with βKWW exponent of about 0.3 between 230 and 290 °C. The effective activation energy was found E ~ 120 kJ/mol.
Below Tg, there is also a reversible thermal relaxation component, faster than the irreversible aging. By thermal cycling, the annealing induced relaxation can be separated into reversible and irreversible components and has been interpreted by chemical short range ordering (CSRO) and topological short range ordering (TSRO) respectively [21,22]. The former was explained by the activation energy spectrum, while the latter was explained in terms of free volume theory [21]. However, it should be noted that this sharp separation between TSRO and CSRO is criticized because CSRO is unlikely without an accompanying TSRO [23,24]. Borrego et al. [25] studied aging by monitoring enthalpy and Curie temperature changes in Fe(Co)-Si-Al-Ga-P-C-B and Finemet glasses. They found that aging can be interpreted as driven by two relaxation times of minutes and hours respectively, in this case they associated the fast process to TSRO and the slow one to CSRO changes.
Khonik [26,27] treated plastic flow below Tg as irreversible structural relaxation with distributed activation energies modified by external stress, developing the so called directional structural relaxation (DSR) model. According to DSR model, relaxation and aging involve structural movements generally anisotropic at the atomic level. In the presence of a mechanical stress, however, the distribution of the local events may become asymmetric producing a net distortion in the direction of energetically favored orientations. The DSR model is a general approach which includes any relaxation mechanism based on the motion of defects, and it even can be applied to relaxation in crystalline materials. At T ~ Tg, cooperative atomic motions cause viscous flow, mechanical relaxation and aging. In the DSR model the relaxation centers are divided into irreversible and reversible ones, the former being responsible for viscoplastic low-frequency internal friction, plastic flow and even for reversible strain recovery, whereas the latter cause anelastic processes seen at higher frequencies. In spite of these and other models, the microscopic mechanisms of aging are still far from being understood. Recent work shows that, in the microscopic scale, the aging of metallic glasses is a complex process leaded by the release of internal stresses involving both smooth and sudden (avalanche-like) movements of the structure [28].
The activation energies of the processes controlling physical aging in metallic glasses show typical values around 100 kJ/mol [16,17,29]. Generally, aging is thought as being driven by thermally activated localized structural rearrangements and then controlled by the same molecular movements responsible of the secondary relaxations. Hu [30] performed a survey of the sub-Tg aging and relaxation data of several metallic glasses obtained by DSC or DMA and they found a common relationship of Eβ = 26RTg. Although enthalpy changes can be the result of many different types of structural rearrangements while mechanical measurements respond only to shear deformation, comparison between as-quenched and relaxed samples using both enthalpy and mechanical techniques suggest that structural relaxation could be characterized by both of these techniques and the results are consistent [17,31]. However, as Chen pointed out [32], the secondary relaxation process observed from calorimetry in metallic glasses does not necessarily correspond to the one observed by shear deformation. The internal friction measurements probe shear relaxations, while enthalpy relaxation samples all sorts of relaxation processes, chemical and topological.
At still lower T, plastic deformation of MG is controlled either by creep or by highly localized shear banding depending on the applied deformation rate. In this range, secondary relaxations are related to anelastic processes concerning easy mobile species with similar behaviors as in crystalline materials. Maddin [33] suggested that the creep behavior of Pd80Si20 metallic glass is governed by a single thermally activated process with an activation energy E = 50 kJ/mol (0.52 eV). Based on the calculation of the activation volume of 25 Å, close to the volume of one constituent atom, they proposed that the steady state creep of the metallic glass is due to transfer of atoms across a distance of one lattice spacing in order to relax the applied stress.

2.3. Theoretical Frameworks for Interpreting Glassy Dynamics

The free volume model, proposed by Turnbull and Cohen [34], describes quite properly the viscosity dependence on temperature and it was further developed to explain the glass transformation phenomenon [35,36]. The model uses free volume as a parameter to describe the change of physical properties, with the particular achievement of predicting the equivalence of viscosity changes due to temperature or pressure variations in the supercooled liquid state. According to this theory, physical properties are related to the density of the system. The volume in the liquid could be classified into two types; type I is the volume of the elemental unit, type II is the volume where the elemental unit can move freely. Type II is called free volume. It is a small part in the whole volume and it is shared by the elemental units. When the system cools down, both volumes decrease, and when the free volume drops below a certain value, the elemental units can no longer move and thus form glass. Free volume theory is quite useful and highly accepted in the metallic glass community to explain the glass transition and aging phenomena. The weak points of the theory is that free volume is difficult to measure directly by experiment and that a single parameter model is not enough to describe the properties of a glassy state [4,37].
The potential energy landscape model is often used to interpret the relaxation dynamics [38]. According to Johari and Goldstein [7], the atomic and molecular configurations in liquids and glasses change according to motions classified as primary and secondary relaxations. Primary relaxations describe the major large scale irreversible rearrangements responsible for viscous flow. On cooling, the glass transition is reached when the decreasing mobility stifles these rearrangements. On the contrary, secondary relaxation could be viewed as a locally initiated and reversible process. Measurements of the dielectric loss factor in many rigid molecular glasses as well as amorphous polymers show secondary relaxations. According to this evidence, Johari and Goldstein suggested that secondary relaxation could be a near universal feature of the glassy state [7]. From a potential energy landscape perspective, Debenedetti and Stillinger [2,3] have identified these β-transitions as stochastically activated hopping events across sub-basins confined within the inherent mega-basin and the α-transitions as irreversible hopping events extending across different landscape mega-basins.
The mode coupling theory (MCT) is able to explain the experimental evidence that the α-relaxation time diverges from β-relaxation at some critical temperature [39]. However, the MCT theory primordially explores the microscopic dynamics of the supercooled liquids at higher temperatures than the ones probed by mechanical spectroscopy. By characterizing and classifying the secondary relaxations in many glass formers, Ngai and Paluch identified the class of secondary relaxation that bear a strong connection or correlation with the primary one in all the dynamic properties and called it Johari-Goldstein (JG) β-relaxation [40]. This link between α and β relaxations was initially found in polymers, but at present it is assumed to be universal. According to their Coupling model, the decoupling temperature and the expected effects at much lower temperatures can be calculated. Based on this Ngai suggested the excess wing manifested in mechanical spectroscopy of metallic glasses comes from a JG-relaxation [41]. A detailed review of the theoretical models proposed for glass relaxation can be found in Angell et al. [5].

3. Mechanical Relaxation of Glasses

3.1. Introduction to Mechanical Relaxation

In general, the self-adjustment with time of a thermodynamic system towards a new equilibrium state in response to a change in an external variable is termed relaxation. When the external variable is mechanical, the phenomenon is known as mechanical relaxation. The measurement of internal friction by dynamic mechanical analysis (DMA), also known as mechanical spectroscopy, is widely used in solid state physics, physical metallurgy and materials science to study structural defects and their mobility, as well as transport phenomena and solid-solid phase transformations. From the mechanical engineering point of view, the internal friction is responsible for the damping behavior of materials, having implications in vibration and noise reduction as well as in low-damping applications. In metallic glasses, normally, the internal friction behavior is empirically characterized and interpreted as a manifestation of internal relaxation processes, ignoring the details of their physical origins or atomistic mechanisms which are difficult to describe due to the complex structure of glasses.
The relationship between stress, σ, and strain, ε, within the elastic region is given by the modulus of elasticity M
σ = M ε
For an arbitrary deformation, the stress and strain are second order tensors and Hooke’s law is a set of linear equations expressing each component of the stress tensor in terms of all the components of the strain tensor. However, considering an isotropic material and the usual modes of pure shear, uniaxial and hydrostatic loading, M corresponds to shear (G), Young’s (E) and bulk (B) modulus respectively. Results of mechanical spectroscopy in metallic glasses are obtained in both shear and uniaxial modes, the latter usually adopted when only thin ribbon-shape samples are available due to a low glass-forming ability (GFA) of the alloys.
The ideal elastic behavior has three conditions to be fulfilled, namely: (1) The strain response to each level of applied stress has a unique equilibrium value; (2) The equilibrium response is achieved instantaneously and (3) The response is linear. In a solid material exposed to a time dependent load, besides the elasticity part there might be also a time dependent part generating internal friction. According to the conditions obeyed by the stress-strain relationship, mechanical responses can be classified into the following types detailed in Table 1 [42].
So, the internal friction behavior could be the result of all these effects. The work by Nowick and Berry [42] explains in detail the different behaviors observed in the relaxation of solids, focusing mainly in the linear anelastic one. The terminology of these phenomena changes within the scientific literature; the recoverable/non-recoverable phenomena may be termed as anelastic/viscoelastic, viscoelastic/viscoplastic, solid-viscoelasticy/liquid-viscoelasticity, etc. Here we will term the recoverable and non-recoverable phenomena as anelastic and viscoplastic relaxations respectively, while the term “viscoelasticity” will include both types of effects. Experimentally, mechanical relaxation is observable by recording the stress (or strain) change with time when strain (or stress) is modified externally. It can be measured as quasi-static measurements in terms of creep or stress relaxation. Quasi-static experiments are used to obtain information on the behavior of materials over periods of several seconds and longer. For information about the behavior of a material in a shorter timescale, dynamic experiments are more appropriate. In these experiments a stress periodic in time, σ = σ0 eiωt, is imposed on the system, and the phase lag ϕ of the strain, ε = ε0 eit−ϕ), behind the stress is determined. For ideal elasticity, ϕ = 0, the ratio ε/σ gives the elastic compliance of the material J. In the case of anelastic or viscoplastic contributions, ϕ is not null, and so the ratio ε/σ is a complex quantity called complex compliance, J(ω), which is a function of the applied frequency ω
J ( ω ) = ε σ = J ( ω ) i J ( ω )
where J′(ω), the real part, is called the storage compliance and J″(ω), the imaginary part, is called the loss compliance. In a similar way, we could have regarded the periodic strain as given, and the stress as leading the strain by a phase angle ϕ. The complex modulus σ/ε = M(ω) = M′(ω) + iM″(ω) could be then defined in a similar way. It should be noted that J(0) = J′(0), and at very high frequencies, J(∞) = J′(∞), it follows that J″(0) = J″(∞) = 0.
Table 1. Classification of mechanical behaviors.
BehaviorComplete RecoverabilityInstantaneousLinear
Ideal elasticityYesYesYes
Nonlinear elasticityYesYesNo
Instantaneous plasticityNoYesNo
AnelasticityYesNoNot necessary
ViscoplasticityNoNoNot necessary
The characterization of the internal friction of materials is commonly done by the parameter
Q 1 = tan ϕ = M M
which is proportional to the mechanical energy dissipated by the system. Q−1 has the advantage of being not influenced by uncertainties of the sample sizes and it is widely used in thermal analysis of substances, for instance in the characterization of Tg in polymeric materials, and in the determination of internal friction at high frequencies by ultrasound spectroscopy. On the other hand, as we will discuss later, the loss modulus peak is more directly related to the frequency spectrum of the mechanical relaxation.
Within the scope of linearity, the mechanical response satisfies the Boltzmann superposition principle: the response of the material to an applied stress is independent on other applied stresses. This means that each response function constitutes a complete representation of the inherent viscoelastic properties of the solid. The classical analysis of mechanical relaxation data uses mechanical models composed of springs (σ = Kε, where K is the elastic constant of the spring) and Newtonian dashpots (σ = ηdε/dt, where η is the viscosity of the dashpot) arranged in different configurations. This allows the derivation of the response of the system from the solution of the differential equations coming from the model. The two elements combined in parallel and series give rise to the Voigt and Maxwell units respectively. The standard linear viscoelastic solid is a three parameter model which can either contain a Voigt or a Maxwell unit. Different arrangements of these units allow one to model both recoverable and non-recoverable linear processes.
The general behavior of a standard viscoelastic solid shows a Debye peak in the loss modulus with the form
M ( ω , T ) = M u Δ M 1 + ω 2 τ 2 ( T ) M ( ω , T ) = Δ M ω τ 1 + ω 2 τ 2 ( T )
where Mu = M(∞) is the modulus dictating the pure elastic response, and ΔM is the intensity of the relaxation process (i.e., the decay of storage modulus observed between external forces being applied faster or slower than the characteristic time of the process). The peak in the loss modulus is observed when ωτ = 1 and it can be traced either by scanning in ω or in temperature, as τ(T) is temperature dependent. Glass relaxation involves cooperative movements of atoms in a non-regular structure, and it is far more complex than the simple standard viscoelastic model. The mathematical functions most commonly used to characterize the mechanical responses measured in both quasi-static and dynamic experiments are detailed in the following section.

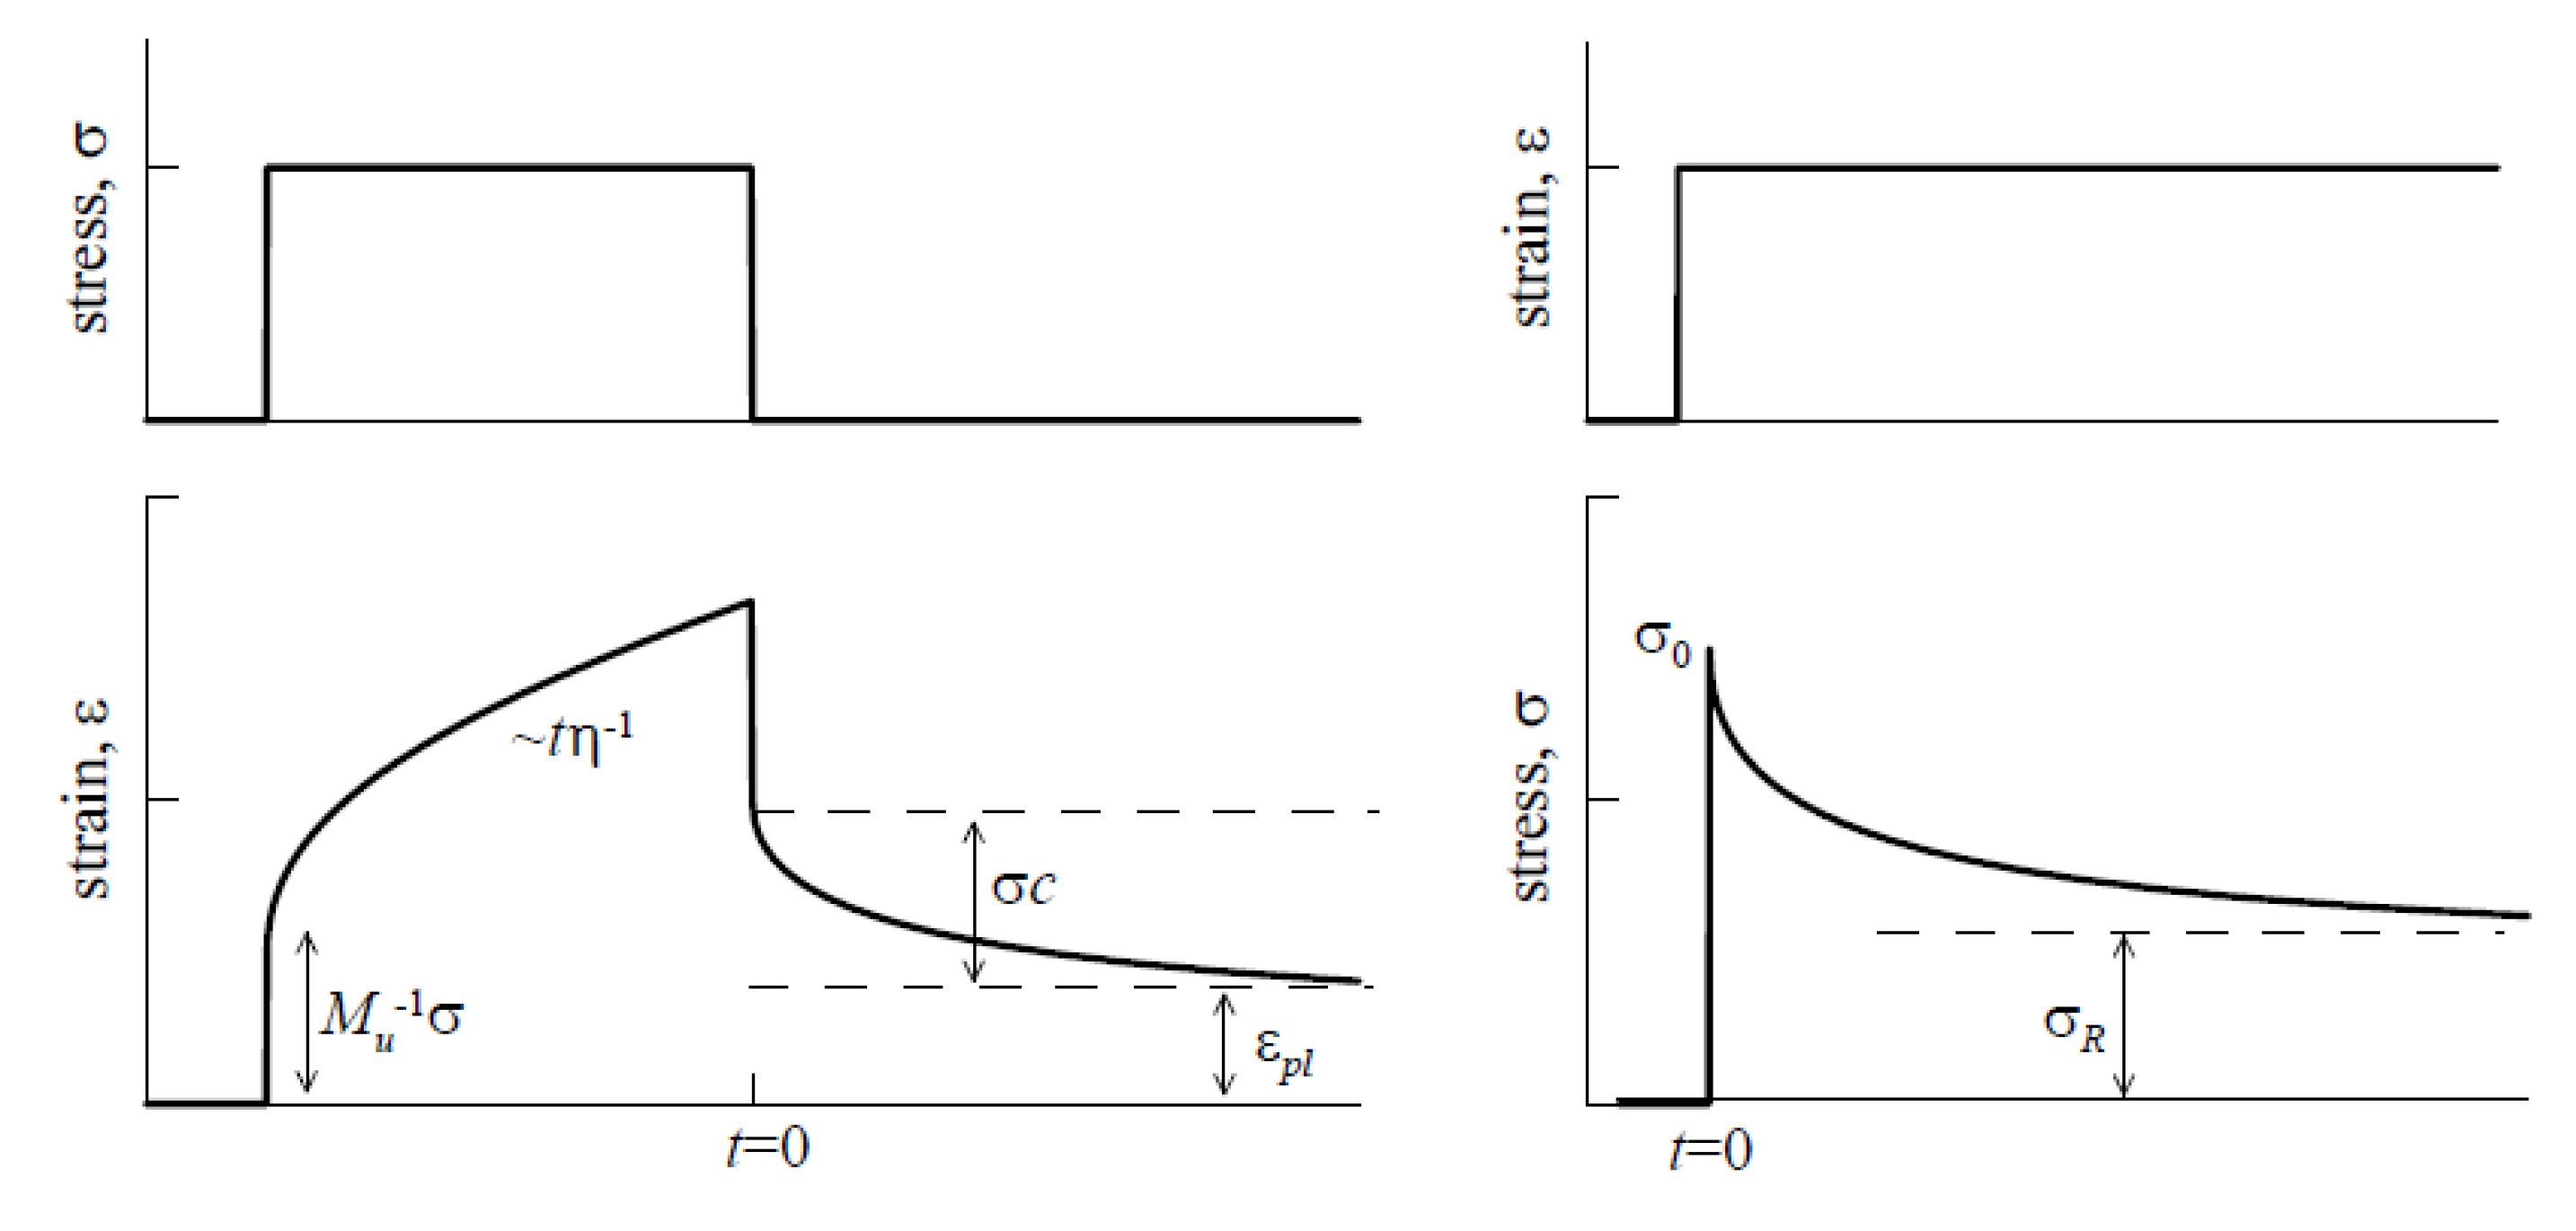
3.2. Time and Frequency Domain Response Functions

Based on the observation of relaxation phenomena, the time dependent properties measured in dielectric or mechanical relaxation of glasses can be usually well-described by a KWW equation, also called stretched exponential
φ ( t ) = exp [ ( t / τ ) β KWW ]
φ(t) being the time correlation function describing how the system losses memory and returns to equilibrium after being excited by an external stimulus. This expression with only two parameters is widely used to describe time dependent properties in both microscopic and macroscopic scales. Actually, the stretched exponential is known as a complementary cumulative Weibull distribution. The coverage of this equation is not only limited to models based on distributions of relaxation times but also complex correlated processes. The interpretation of the parameter βKWW is of great interest as discussed by Ngai [43]. When βKWW = 1 the function represents a simple exponential decay characteristic of a Debye relaxation with a characteristic time constant, while if 0 < βKWW < 1 the expression can be regarded as the result of a distribution of individual events with different relaxation times.
In creep-recovery experiments, the strain evolution ε(t) during the recovery is
ε ( t ) = ε pl + σ c φ ( t )
where εpl is the residual irreversible plastic deformation, σ is the stress applied during the previous creep period and σc + εpl corresponds to the strain at the beginning of the recovery period [44]. On the other hand, in quasi-static stress relaxation experiments, a sudden deformation is applied to the system generating an initial stress σ0 that decays following
σ ( t ) = ( σ 0 σ R ) φ ( t ) + σ R
where σR is the residual elastic contribution. Both creep recovery and stress relaxation probe the relaxation response function of the system. However, the φ(t) obtained from creep recovery only has contributions from anelastic processes while the φ(t) from stress relaxation may include both anelastic and viscoplastic relaxations. An example of the expected strain or stress time evolution in these experiments is shown in Figure 2.
Figure 2. Expected behavior for creep-recovery (left) and stress-relaxation (right) quasi-static experiments.
Metals 05 01073 g002
The description with a two parameter stretched exponential is forcedly a simplification of the mechanical response, assuming implicitly a unimodal distribution of relaxation times. In order to gain further insight, the time response may be analyzed in terms of a distribution of relaxation times
φ ( t ) = A i exp ( t / τ i ) or φ ( t ) = 0 A ( τ ) exp ( t / τ ) d τ
with factors A(τ′) determining the contribution of each relaxation time to the whole relaxation process. This analysis is able to fit complex experimental responses that may be not well fitted by the two-parameter function. However, φ(t) is just the Laplace transform of the intensity of the respective relaxation process and, as it is well known, the computation of the inverse Laplace transform is a very complex mathematical problem where experimental noise or inaccuracies may derive in fuzzy results. In the present case, it might give rise to fictitious relaxation time distributions, so experimental data must be cautiously analyzed.
Jiao [45] analyzed the stress relaxation of a metallic glass by assuming that the relaxation time spectrum had a log normal distribution with the form
A ( ln τ ) = k exp [ ( ln τ ln τ ) 2 / s 2 ]
where τ is the most probable relaxation time, s is the width of the τ spectrum, and k is a normalizing factor. This model fitted properly the stress relaxation of the Pd40Ni10Cu30P20 metallic glass. Besides log-normal distribution, other distribution shapes like box or wedge-like could be also used for the spectrum to fit with experimental data [46]. The activation energy spectrum could be also determined with some approximation by using the data from calorimetry or mechanical relaxation experiments [17].
The correlation function φ(t) is related to a complex susceptibility by Fourier transform
χ ( ω ) = χ ( ω ) i χ ( ω ) = 0 [ d φ ( t ) d t ] e i ω t d t
which can be probed by dynamical experiments. In case of DMA experiments, the measured complex elastic modulus is
M ( ω ) = M ( ω ) + i M ( ω ) = M u Δ M χ ( ω )
with Mu and ΔM already defined in Equation (9). It should be noticed that there is no analytical expression for the Fourier transform of the KWW function with a general value of the βKWW exponent and numerical methods have to be employed in order to translate the experimental data from time to frequency domains or inversely. Furthermore, computing of Fourier transform poses numerical problems originating from cutoff effects which yield unwanted oscillations, especially when treating real data with experimental error and noise.
Characterization of the relaxation processes is generally obtained from the analysis of the loss modulus M″(ω). The M″(ω) peak related to a given relaxation process is defined by four main characteristics: The intensity of the peak (ΔM), the bluntness of the peak, and the power laws defining both the low and high-frequency tails
χ ( ω ) ( ω τ ) a ω < < τ χ ( ω ) ( ω τ ) b ω > > τ
where 0 < a, b < 1. In the case of a Debye process a = b = 1, and for a time-domain response defined by a KWW function (Equation (10)) a = 1 and b = βKWW. The real loss peak found experimentally shows different degrees of asymmetry. An empirical function widely used for characterizing it is the Havriliak-Negami (HN) function
χ ( ω ) = 1 [ 1 + ( i ω τ ) α ] γ
where the exponents α and γ define the broadness and the asymmetry of the peak respectively, and they produce power-laws of the tails given by a = α and b = γα. The Cole-Davidson (CD) function and the Cole-Cole (CC) functions, which are also commonly used in relaxation studies, correspond to the HN-function with α = 1 or γ = 1 respectively. The CD-function, with peak shape dictated only by the γ exponent, shows an asymmetric peak very similar to the one given by the Fourier transform of the KWW-function [47]. On the other hand, the CC-function corresponds to a symmetric peak with broadening given by the exponent α. Many results show that secondary relaxations of glasses can be generally fitted by using the Cole-Cole equation; the parameter α gives information about how distributed are the relaxation times and normally it increases with the temperature. On the contrary, classical anelastic relaxations in crystalline metals are restricted to a small volume, namely defects, dislocations and grain boundaries. Accordingly they have a much smaller magnitude and show shapes very close to a Debye relaxation with α and γ ~ 1. It should be recalled here that the τ = τ(T) in the previous equation is the average relaxation time of the process at a given temperature.
Other functions, either empirical or coming from physical models, are used to characterize the experimental loss modulus of glasses [48,49]; although here we only describe the most common ones, some of these other models will appear in the next section when discussing the mechanical spectroscopy results in metallic glasses. In any case, however, all the functions have to fulfill similar properties as the ones detailed here for the HN and related functions.

3.3. Thermally Activated Models

As previously stated, internal friction can be interpreted as a combination of recoverable and non-recoverable relaxation events. Previous works on crystalline metals show that anelastic relaxation can be well explained by mobility of defects in the crystalline lattice. These models consider interface relaxation (including grain boundary, twin boundary and nano-crystalline structure), dislocation, and point defect relaxation known as Snoek and Zener relaxation [42,50]. That is, most of the known mechanisms of mechanical relaxation in metals have their origin in the thermally activated motion of various kinds of defects.
The amorphous nature of metallic glasses prevents the description of internal friction in terms of these mechanisms. The only mechanism which can be easily extrapolated from crystalline to amorphous structures is that of atomic and defect migrations, directly related to the movement of single atoms inside the structure. The jump of an atom or point defect from one site to another in a crystal lattice is a simple example of a rate process. The corresponding relaxation time follows a reciprocal Arrhenius equation
τ = τ 0 exp ( E k B T )
valid when the rate limiting step of the relaxation process is the movement over an energy barrier.
From the position of the loss peak at a given temperature ωτ(T) = 1, obtained from dynamic experiments, the activation energy is calculated as
ln ( ω peak τ ) = 0 = ln ( ω peak τ 0 ) + ( E k B ) ( 1 T ) ln ( ω peak2 ω peak1 ) = ( E k B ) ( 1 T 1 1 T 2 )
In the case of no observable peak, the activation energy could still be calculated using the temperature dependence of a fixed value of the loss modulus as a function of frequency. In a more general way, the temperature behavior of the average relaxation time τ(T) may be obtained by application of the temperature-time-superposition (TTS) analysis of the mechanical spectroscopy curves also for non-Arrhenius behaviors [51].
The relaxation processes of glasses may involve cooperative movements much more complex than the defect migration scheme. Besides, even for a well-defined process of atomic or defect migration, the inhomogeneous structure of glasses would generate a broader distribution of activation energies than in a crystalline material. In spite of this, glass relaxations are usually interpreted in terms of the temperature dependence of a main characteristic time τ(T), which is the average value of the relaxation times distribution, and can be determined by TTS analysis. Of course, if the DMA curves involve the overlapping of different processes with quite different activation energies or τ(T) behaviors, the TTS analysis will not be applicable.

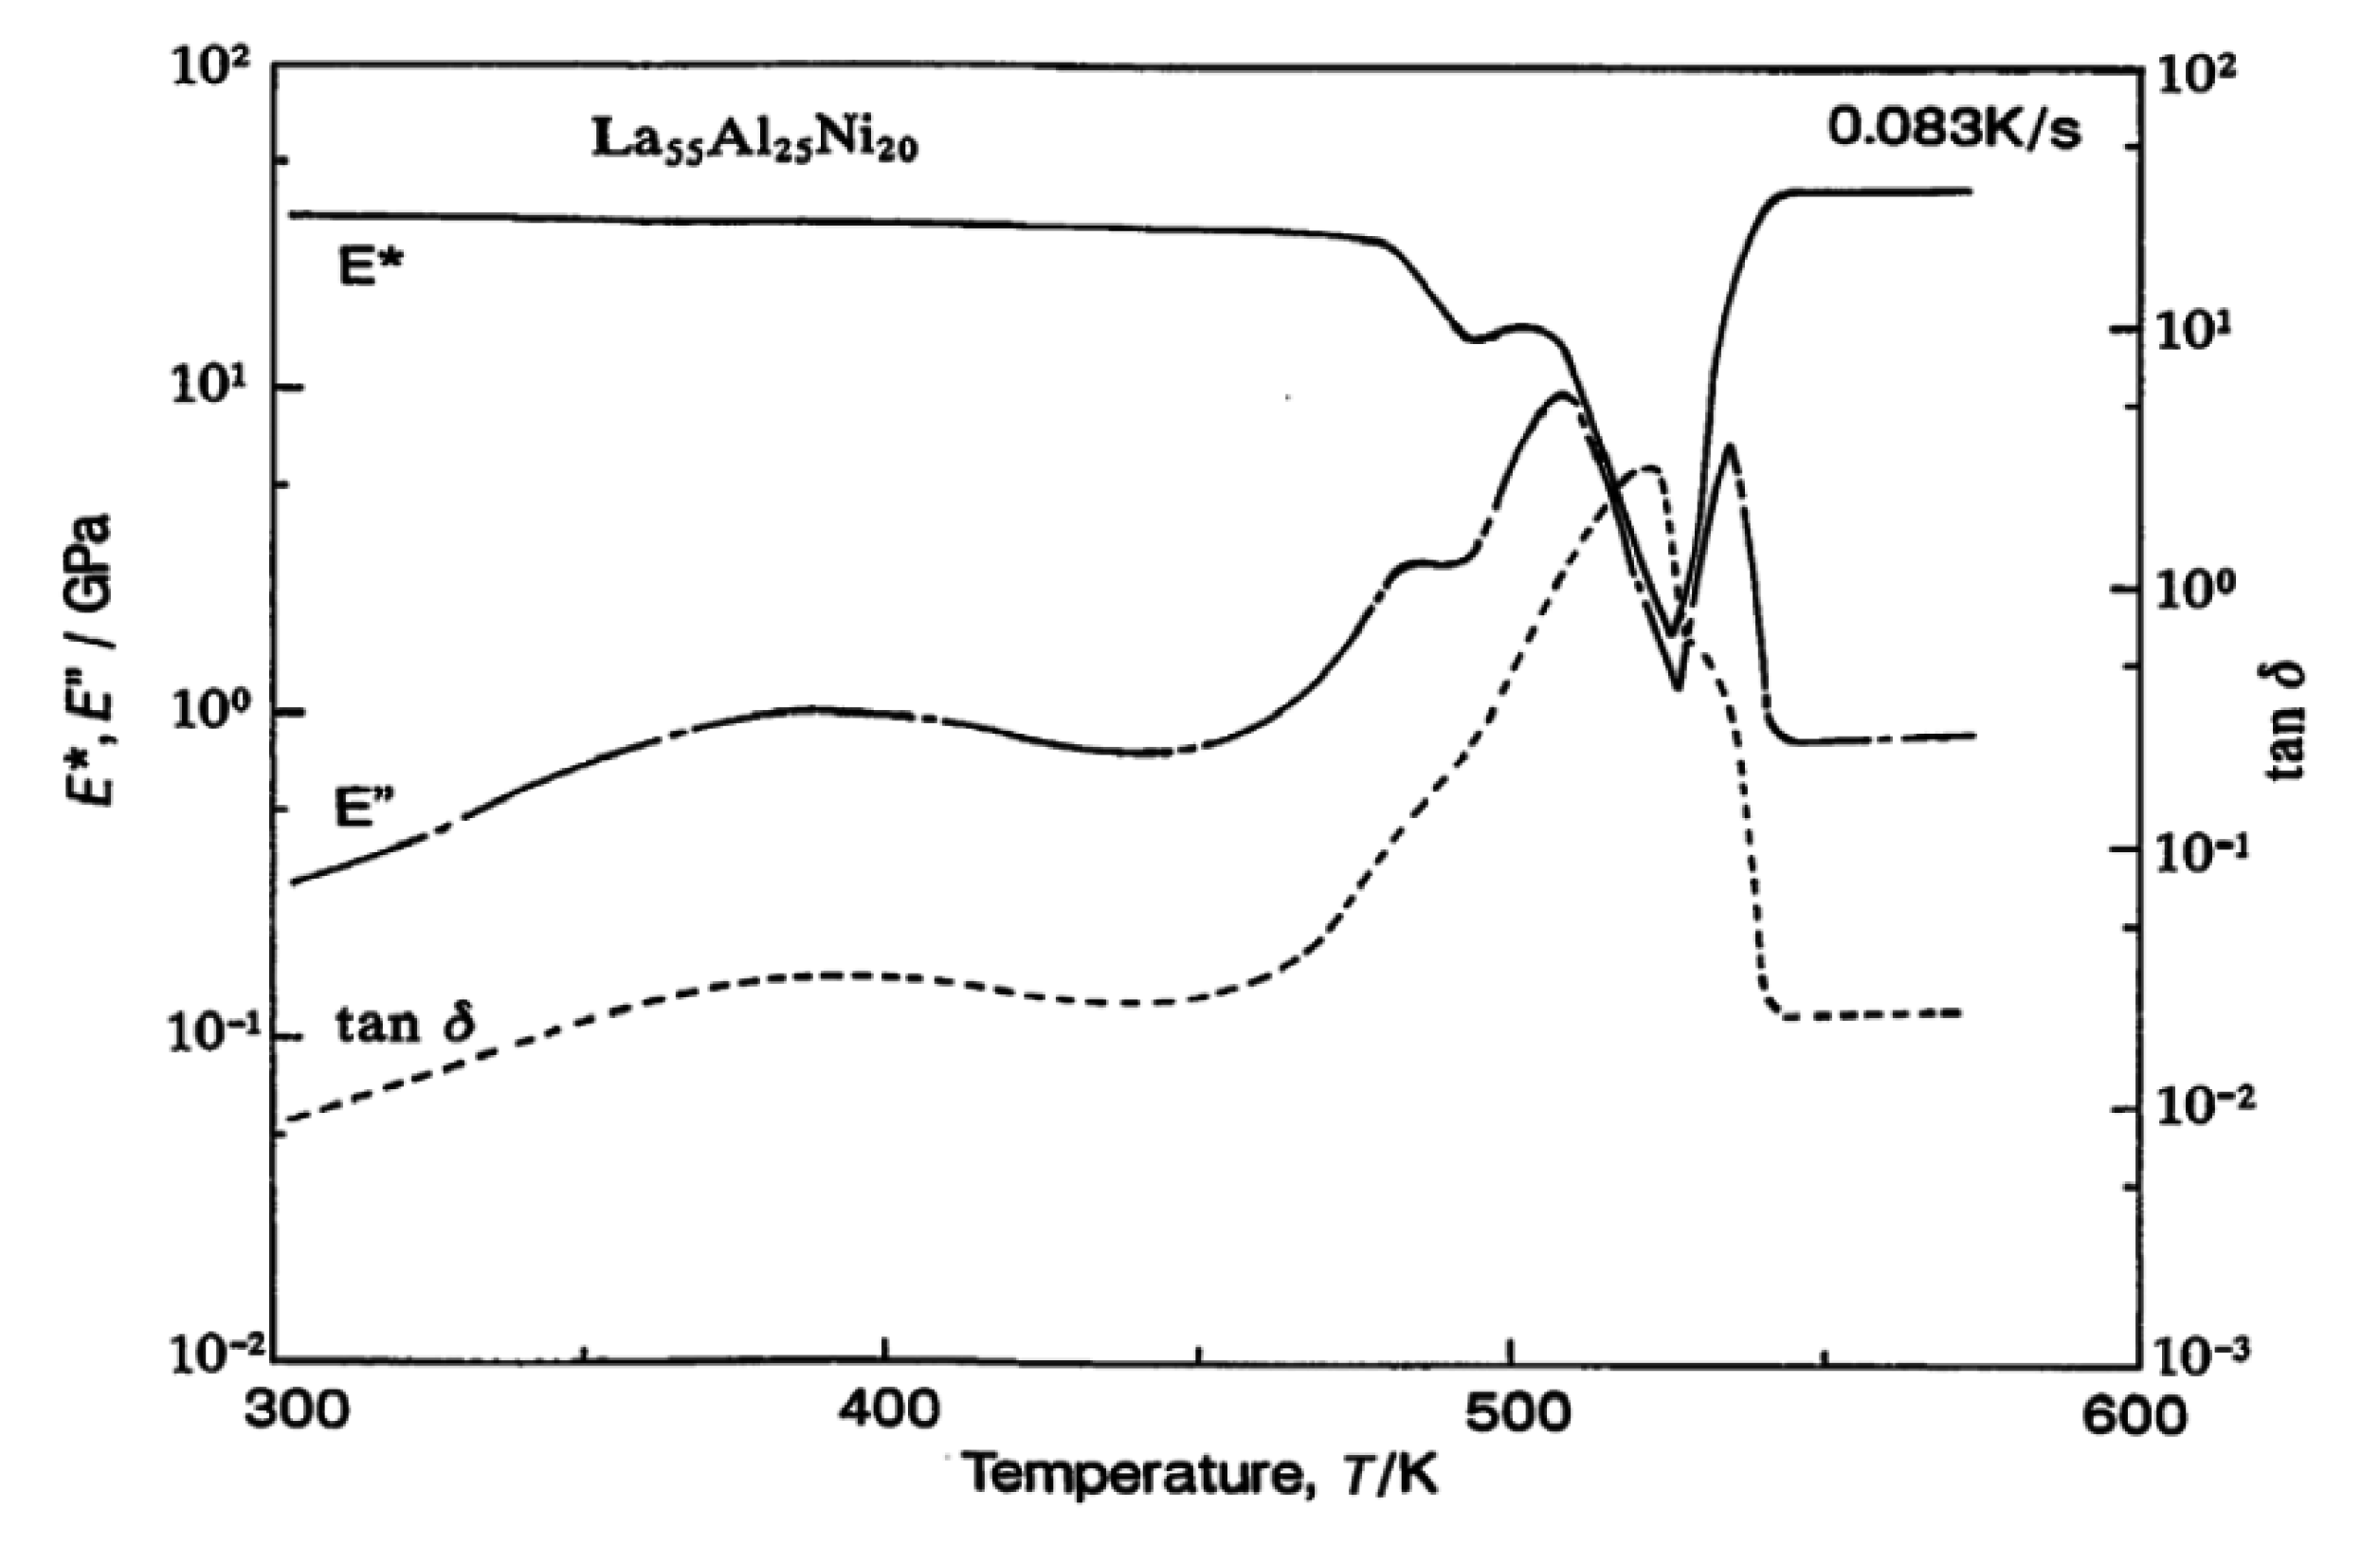
4. Mechanical Spectroscopy of Metallic Glasses

DMA can be performed both in isothermal (scanning frequency at fixed temperature) or isochronal (scanning temperature at fixed frequency) modes. In every solid, there exists a fundamental thermoelastic coupling between the thermal and mechanical states with the thermal expansion coefficient as the coupling constant. The thermoelastic damping contributes to the background of the loss modulus and Q−1 isochronal curves; differences between high and low frequency tests may originate from this effect. A detailed discussion on the thermoelastic background could be found in Nowick’s book [42]. Other effects may also contribute to the DMA background, which increases in less compact structures and it is then more important for glassy states with higher free-volume. Castellero [52] used the change in the intensity of the Q−1 background in order to follow the room temperature aging of Mg-Cu-Y glasses.
In addition to the background, the basic features of isochronal DMA curves of metallic glasses are observed in Figure 3. At temperatures below Tg, a slight and constant decrease of the storage modulus is expected as temperature increases due to thermal expansion of the structure [53]. In this region, many metallic glasses also show a secondary relaxation peak in the loss modulus and the corresponding partial step-like decay of the storage modulus. Increasing the temperature, the dynamic glass transition is clearly visualized by the α-relaxation peak of M″ and a complete decay of M′ once in the liquid state. At higher temperatures, crystallization returns the system to the solid state increasing again the storage modulus. At even higher temperatures, thermal expansion and softening of the solid reduce again the storage modulus and increases the internal friction.
Figure 3. Normalized storage shear modulus G′ and loss modulus G″ vs. temperature in La60Ni15Al25 bulk metallic glass, Gu is the unrelaxed shear modulus. Reprinted from Reference [54] with permission from American Institute of Physics (AIP).
Metals 05 01073 g003
DMA measurements are usually performed with heating rates of 1–5 K/min and frequencies from 0.01 to 100 Hz. For this range of heating rates and frequencies, the maximum of the α-peak is found in the liquid temperature-region, and the measured temperature dependence of τα is in good agreement with the viscosity behavior described by Equation (1) [55]. In many glassy alloys, however, crystallization is very close or even overlapped with glass transition. The decay of the storage modulus is then stopped before reaching a zero value and the α-peak may be cut on its high-temperature side. In this case, the apparent maximum of the peak may not correspond to the real α-relaxation peak maximum. In spite of possible deviations due to crystallization or aging, the α-relaxation process observed by DMA is generally well-understood and it can be characterized by an HN-function or the Fourier transform of a KWW function with stretched exponent values βKWW ~ 0.5, as seen in Figure 4. Wang et al. [56] also found values of βKWW between 0.4 and 0.5 for some of the most representative metallic glasses (Pd-Ni-Cu-P, Ce-Al-Cu and Vitreloy), while Meyer’s work on Pd40Ni10Cu30P20 in the equilibrium state [57] found that the α-relaxation followed the stretched exponential function with βKWW = 0.76. On the other hand, secondary relaxations show very diverse characteristics in different metallic glasses and their origin is less clear. Following we will review different experimental studies focusing on secondary relaxations.
Figure 4. Dependence of the normalized loss modulus vs. the normalized frequency in typical metallic glasses. The solid line is fitted by the Kohlrausch-Williams-Watts (KWW) model. Reprinted from Reference [58] with permission from Elsevier. Copyright 2014, Elsevier.
Metals 05 01073 g004

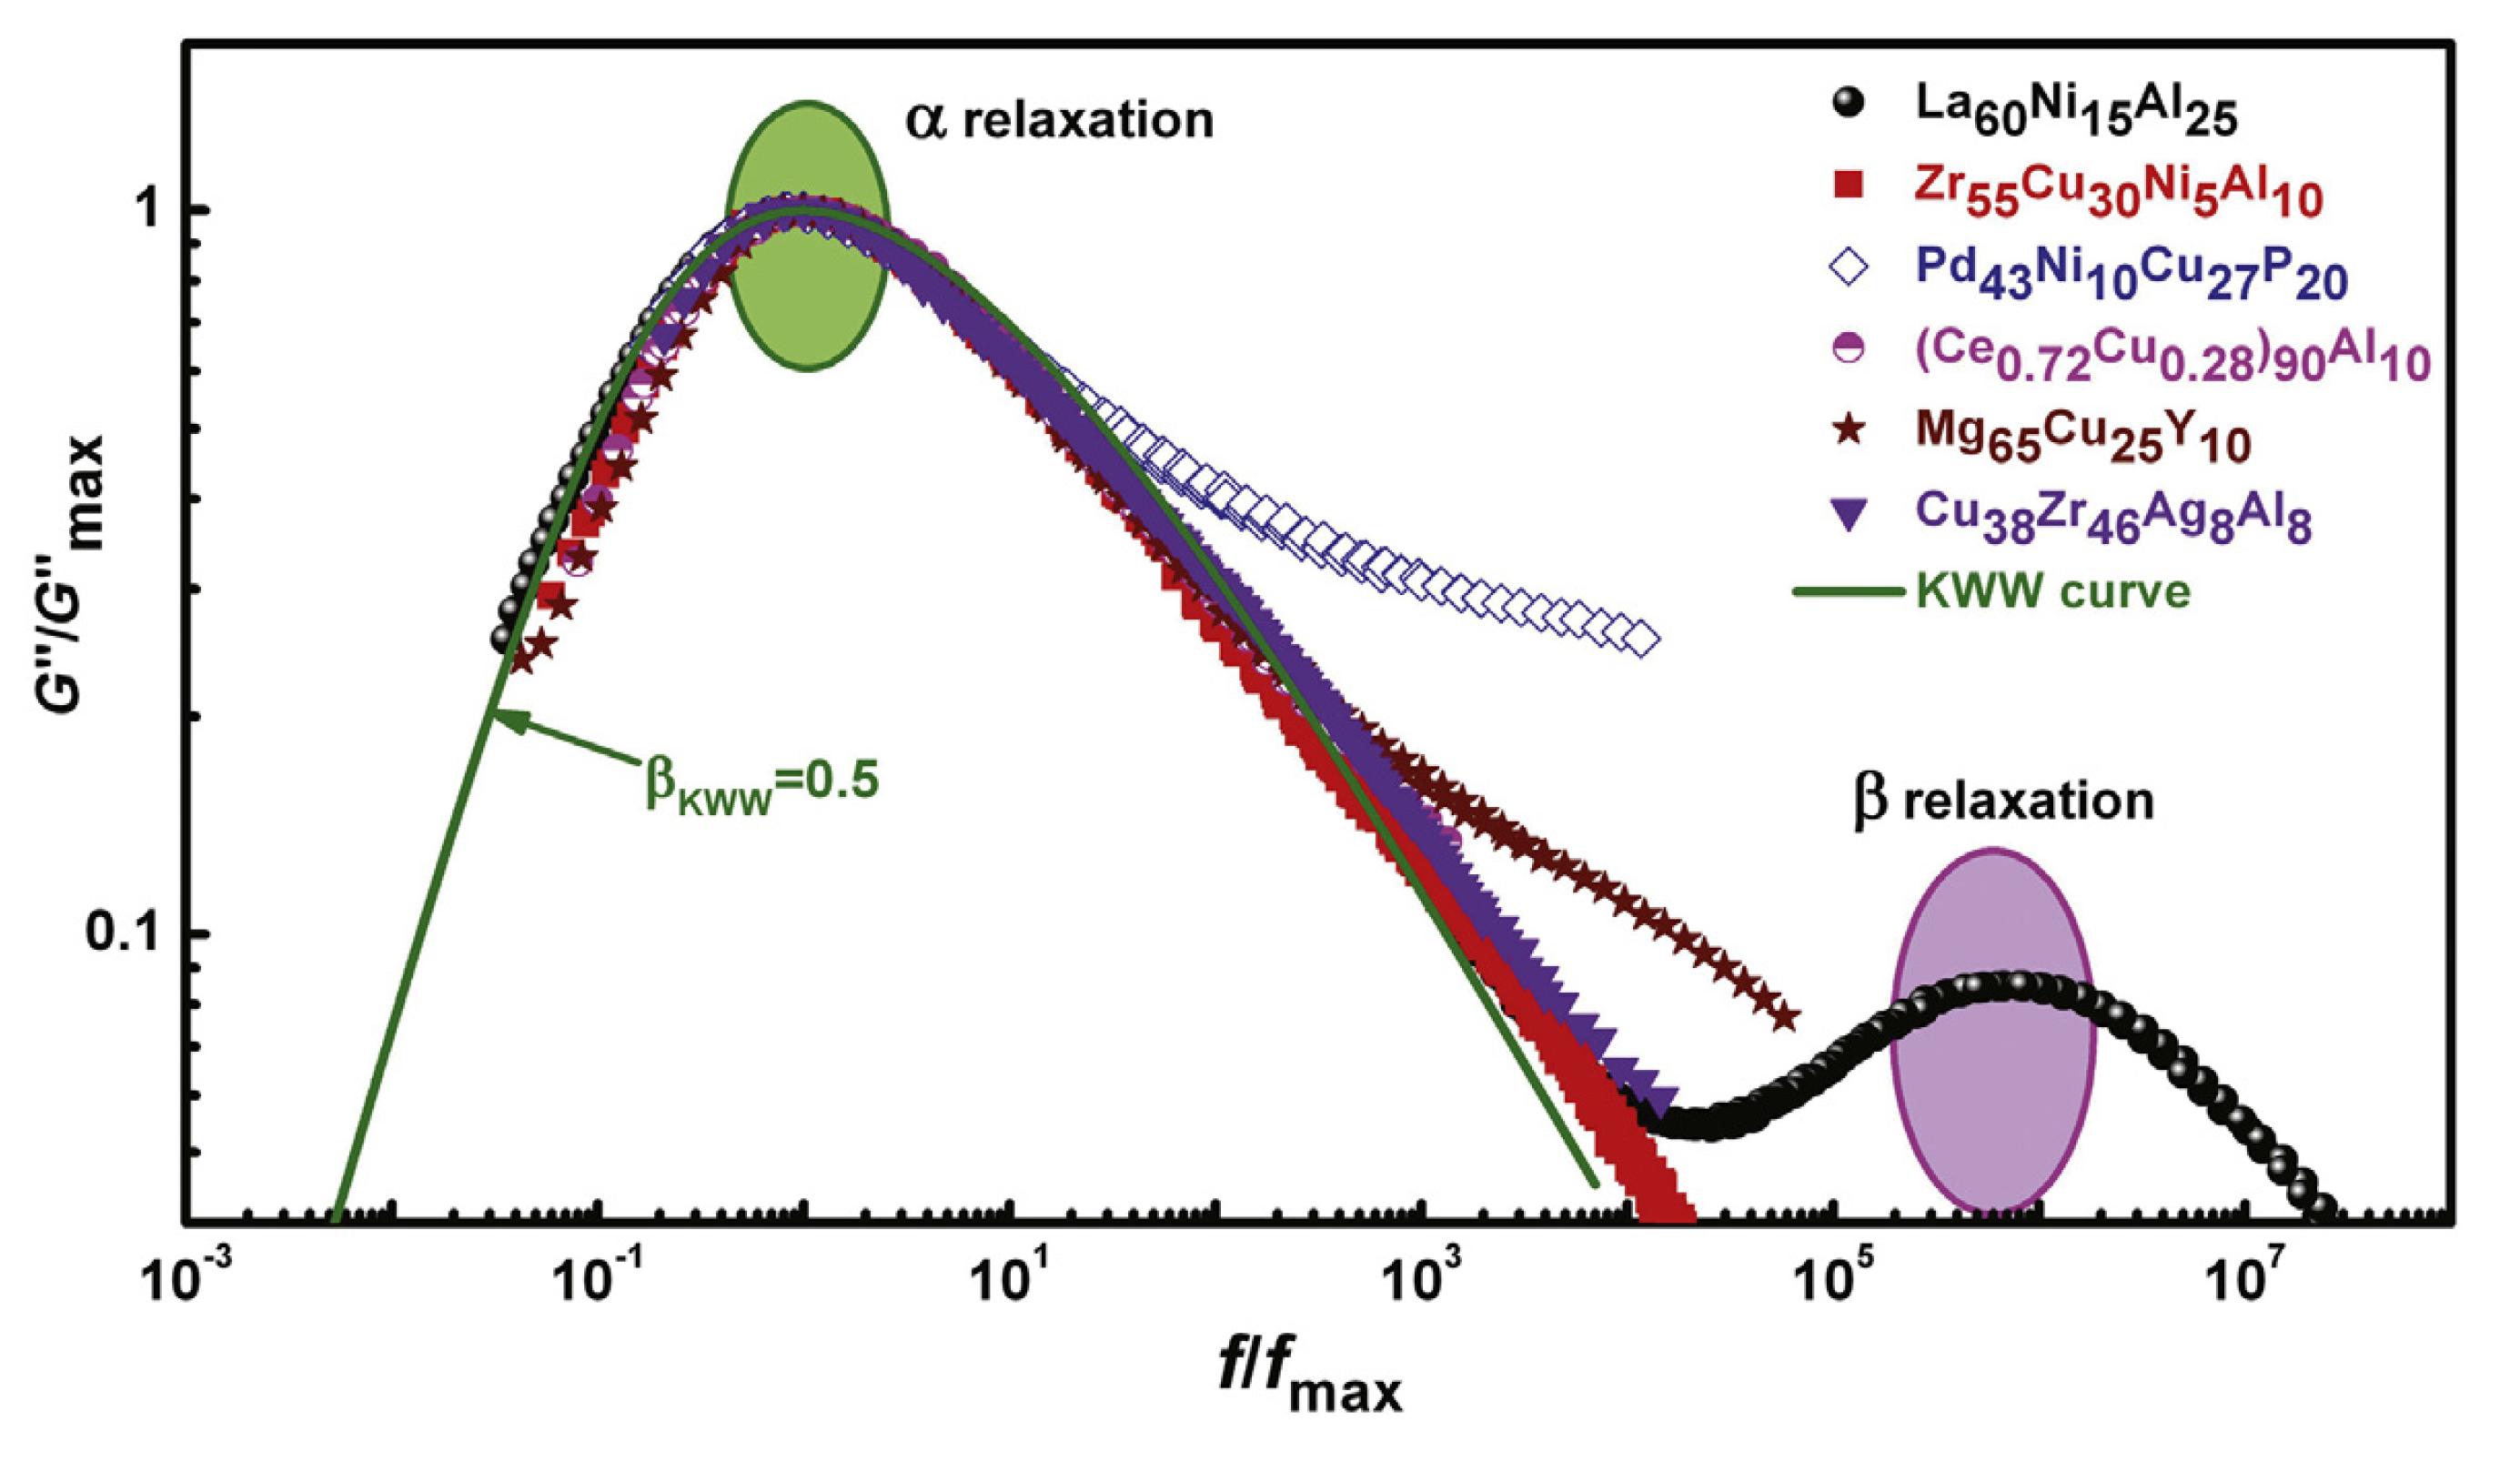
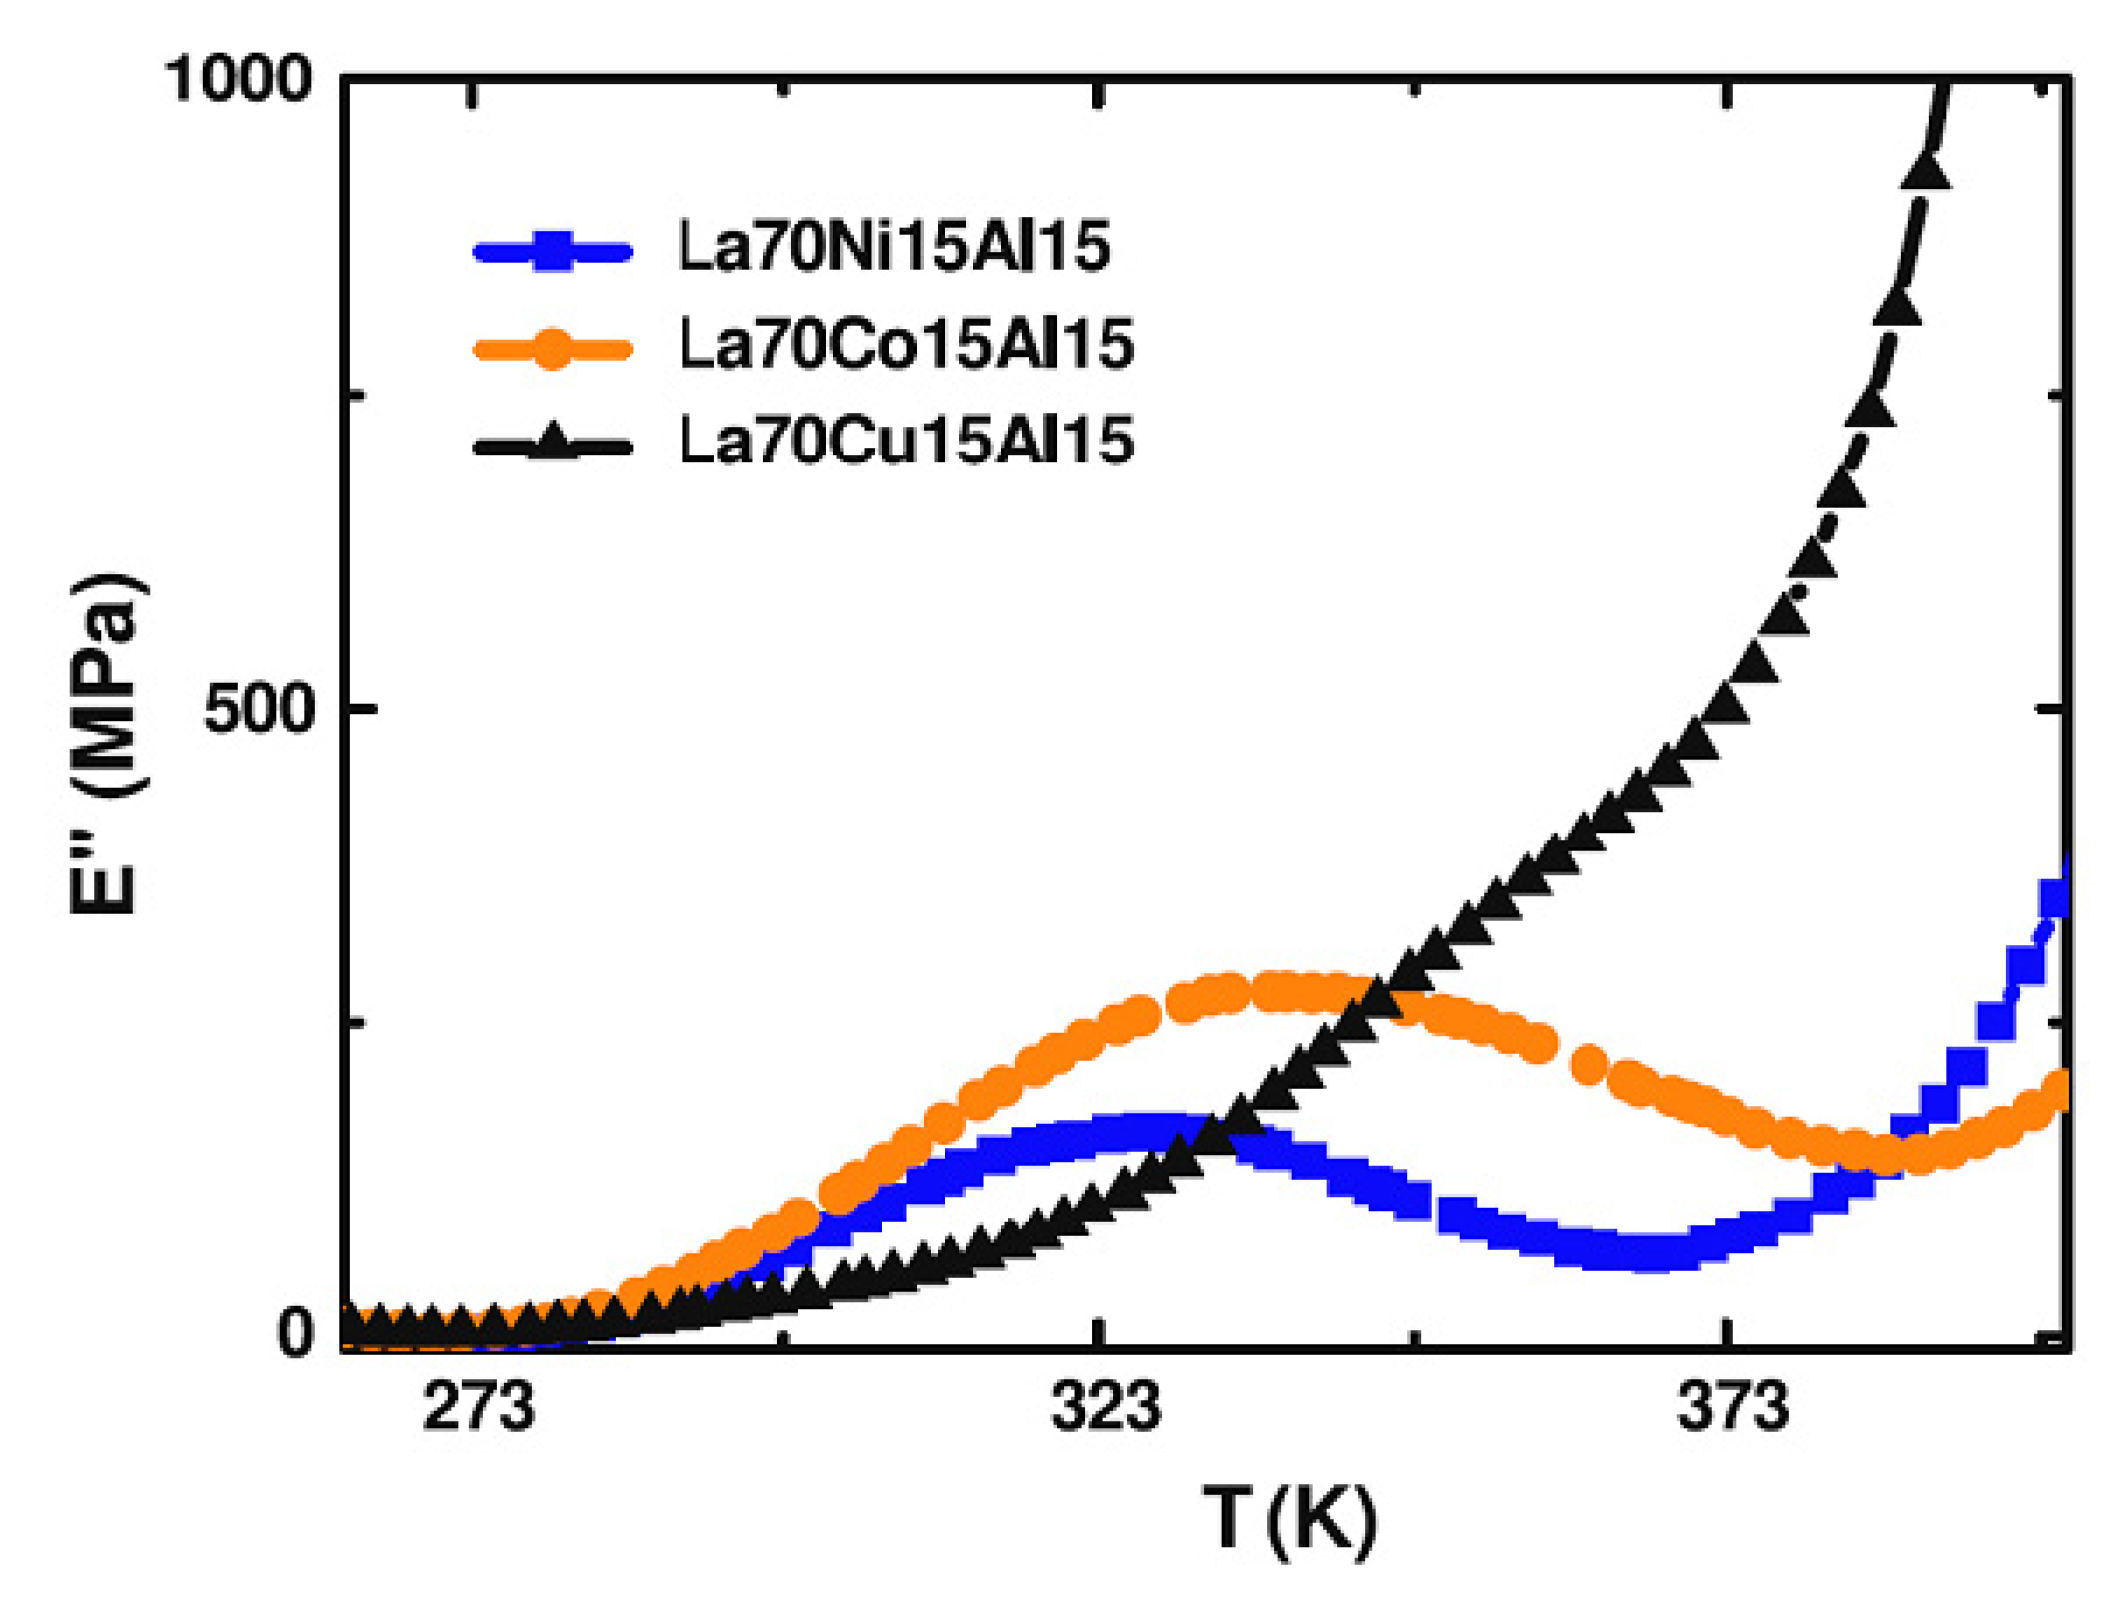
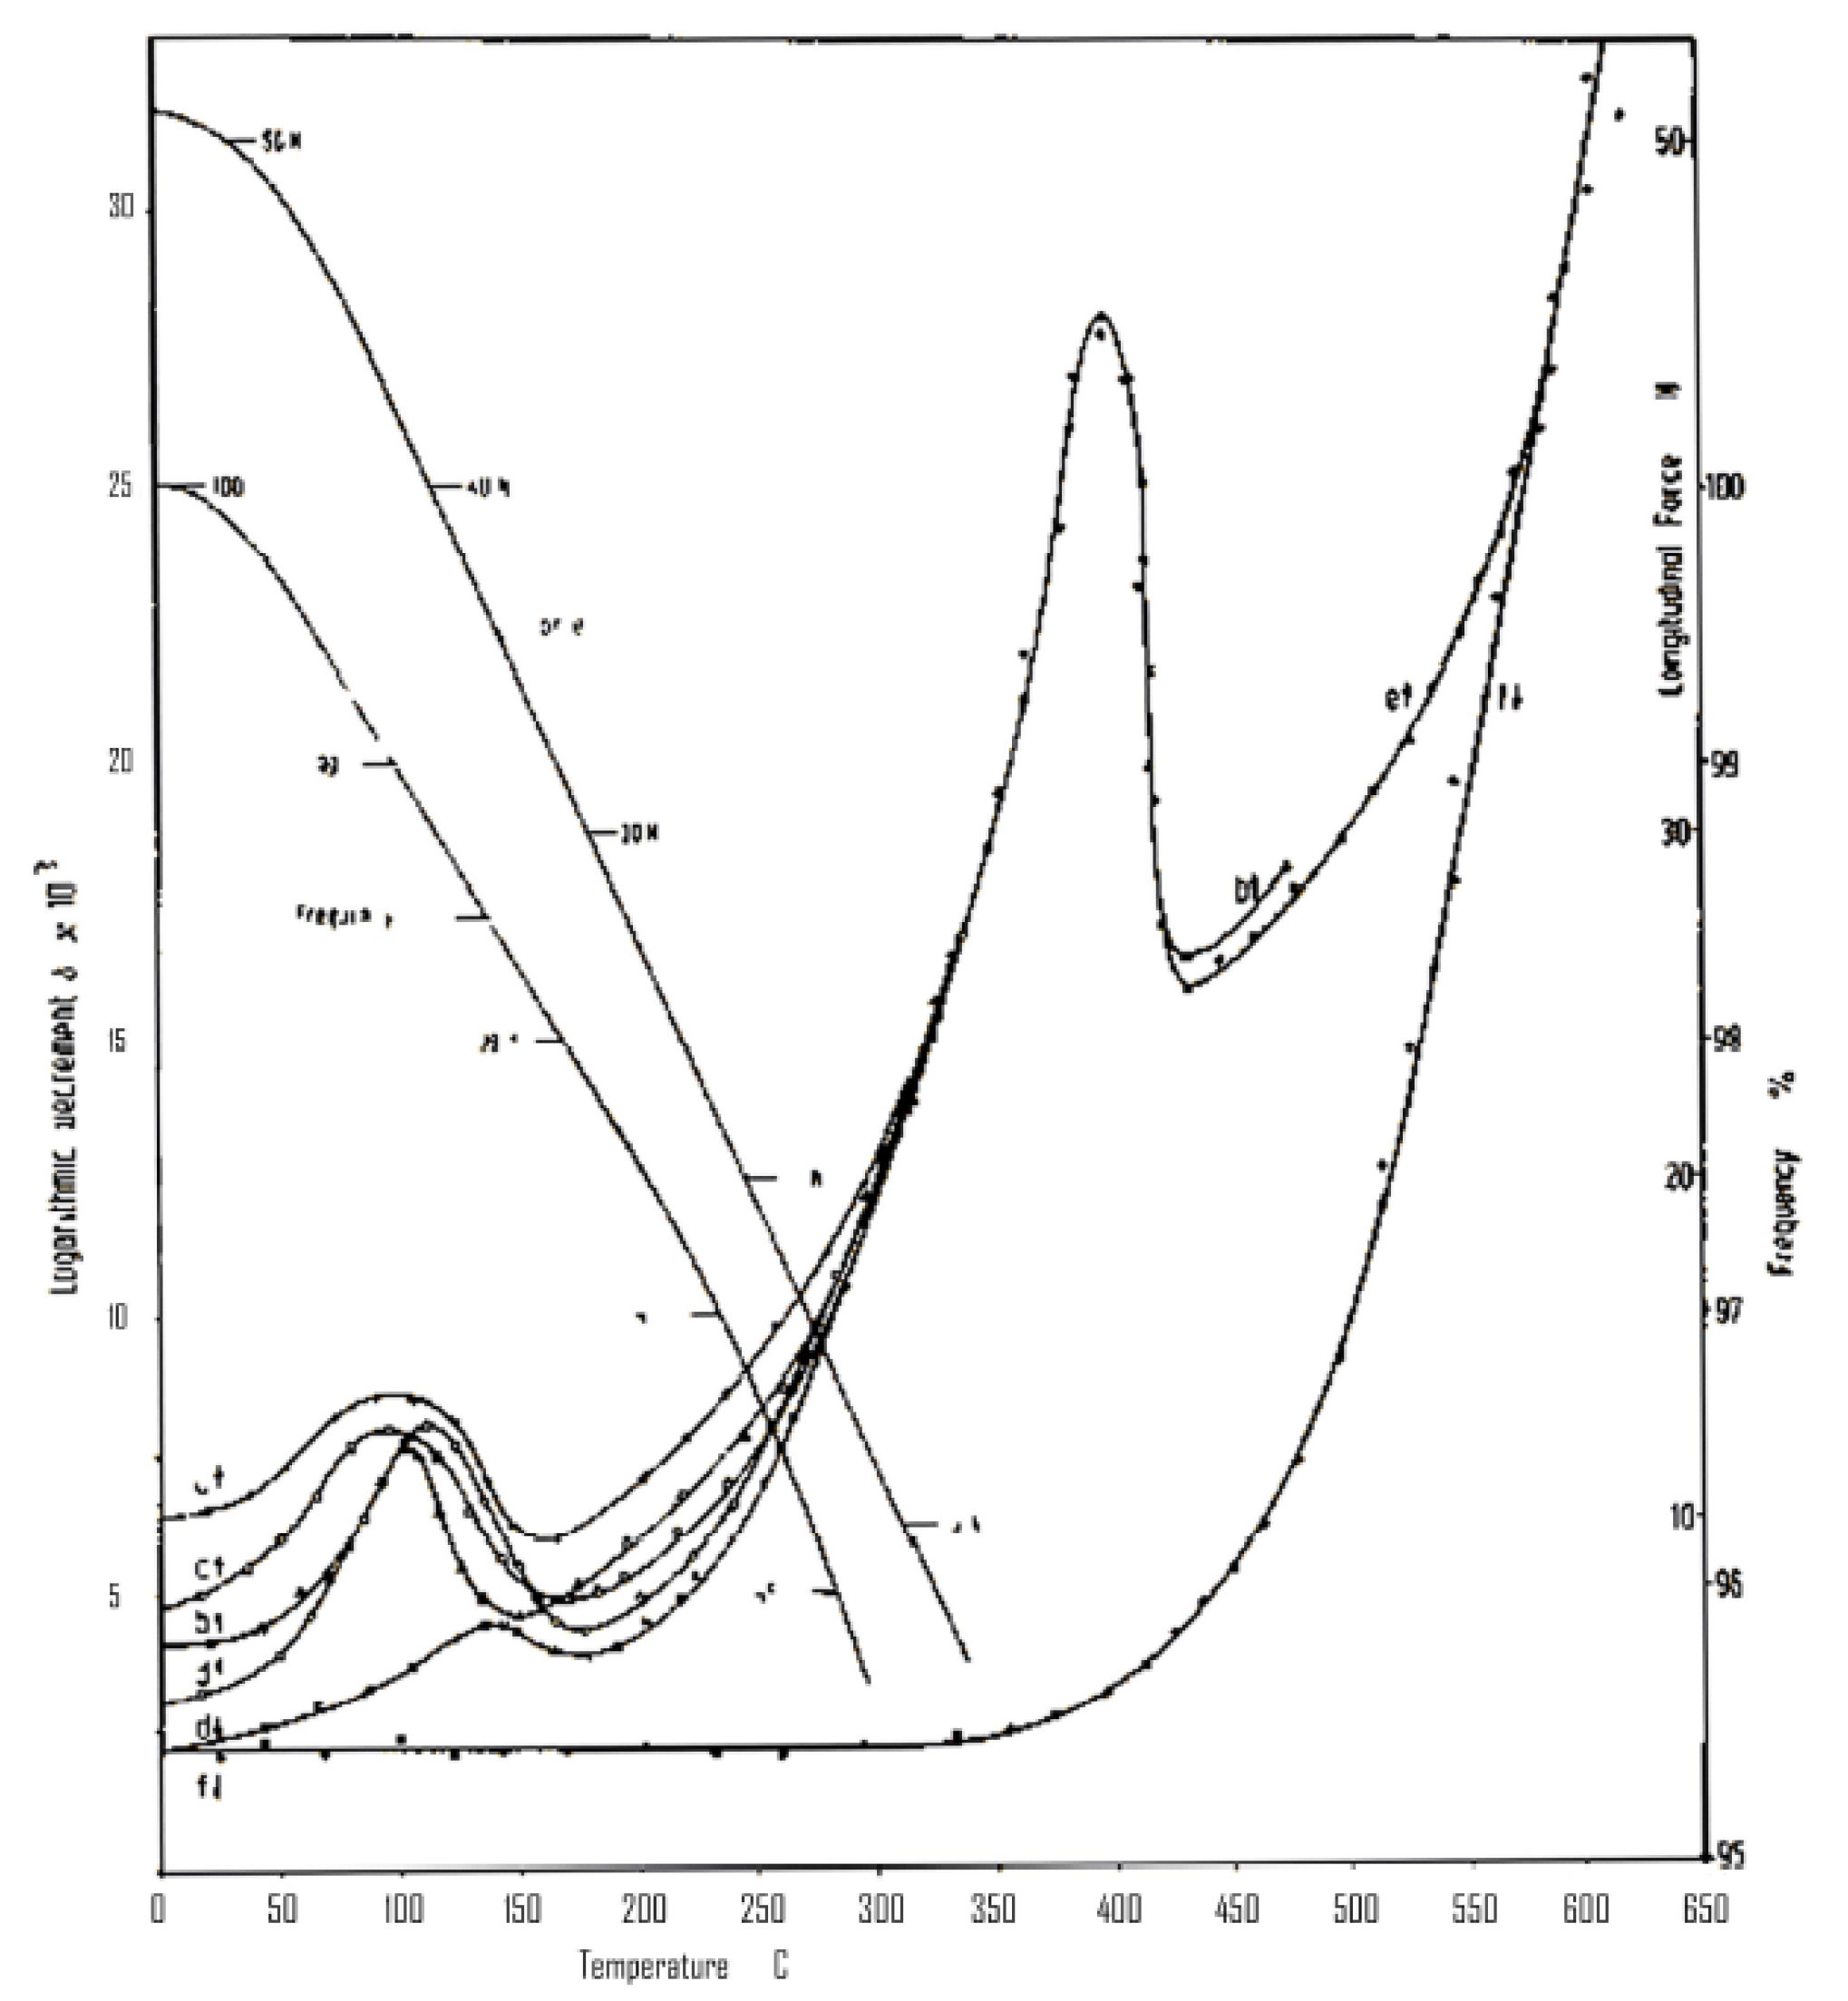
4.1. Secondary Relaxations

By surveying the relaxation dynamics in organic molecular liquids and fused salts, Johari and Goldstein suggested that β relaxation was a universal feature of glassy systems [7]. In some polymers, as shown in Figure 5 from the work by Casalini [59], there is a clear picture. On one hand the α-relaxation time becomes arrested in an Arrhenius behavior once in the glass state, it controls the aging and it is coincident with the calculations from the mode coupling model. On the other hand, the β-relaxation times are similar to the primitive τα in agreement with the interpretation of a Johari-Goldstein relaxation as a precursor of the structural α-relaxation.
Figure 5. Relaxation time for the α and β processes, along with the aging decay time τaging and the τα calculated from coupling model. Reprinted from Reference [59] with permission from American Physical Society (APS).
Metals 05 01073 g005
Nowadays, it is becoming popular a description of metallic glass dynamics in terms of α and β relaxations. All the peaks below the glass transition temperature are referred as β-relaxation although their origin may not be the same. We will follow this terminology here. However, it should be noted that some β-relaxations detected by mechanical spectroscopy are not Johari-Goldstein relaxations or the ones envisioned from the potential energy landscape model but may come from different origins.
Indeed, this kind of anelastic events in metallic glasses can be dated back to the discovery by Berry that in Nb3Ge metallic glasses thermal activated anelastic events manifest on an internal friction peak around 250 K [60]. This peak was interpreted as stress induced ordering of a similar nature to the point defect relaxations known in crystalline solids. Although it is not a Debye peak and it shows an asymmetric distribution of activation energies, the typical magnitude of the relaxation time corresponded to a single atomic jump and the intensity of the peak decreases with aging. Actually, later work suggested that in the low temperature region there might be contributions from hydrogen absorption, which exists in quite large range of metallic glasses [61]. Yoon [62] also found these peaks located around 250 K with activation energies of E ~ 100 kJ/mol (1.0 eV) in Fe40Ni40P14B6 and Fe32Ni36Cr14P12B6 metallic glasses and they ascribed them to the movement of B atoms. Fukuhara [63] interpreted the low-temperature (150 K) relaxation peak found in Zr55Cu30Al10Ni5 as related to a topological transition or a vacancy-like defect rearrangement.
However, based on the finding of this peak in Cu50Zr50, Co35Y65 as well as Co35Dy65 metallic glass, and after excluding factors like hydrogen or oxygen absorption, Kunzi [64] suggested that the relaxation peak is due to the existence of intrinsic degrees of freedom in the amorphous structure as well as in other glasses such as oxides glasses [65]. It is also observed that cold work might lead to the observation of peaks occurring at temperatures between 100 to 300 K [66]. Actually, plastic flow both on cold rolling and hydrogenation occurs via formation and motion of dislocation-like defects which are the reason of the observed anelastic anomalies. It is suggested by Khonik [66] that low temperature internal friction peaks described in the literature for as cast, cold deformed and hydrogenated samples have common origin. Nevertheless, the characterization of local defects in amorphous structures is a complex, long-standing topic still not fulfilled in spite of many efforts since the early works of Egami [67].
These thermal activated anelastic events might also happen in a bulk metallic glass as first described by Okumura [68] in the analysis of the viscoelastic behavior of La55Al25Ni20 metallic glass. As shown in Figure 6, besides the glass transition temperature region, a β-relaxation gets activated at around 400 K. In this case, the glass transition region also shows a double peak structure which was later associated by TEM analysis to glass phase separation and a corresponding two glass transitions. Further work [69] showed that aging reduces the magnitude of the relaxation peak but has little effect on the β-relaxation peak position. However, this fact was questioned by Qiao’s work, which showed that the β-peak moves to higher temperature after physical aging [70]. The activation energy of the β-relaxation obtained by the time temperature superposition (TTS) shift factor method is Eβ ~ 100 kJ/mol (1.0 eV). In calorimetric measurements, the extrapolation of the intensity of β-relaxation associated to enthalpy release when the aging process is completed shows a non-zero intercept, which suggests that the β-relaxation would still remain in the fully relaxed state. Combined with Qiao’s result on partially crystallized samples where this peak remains, it seems consistent that β relaxation might be caused by short range atomic relaxation, somewhat similar to Snoek or Zener type processes, as suggest by Okumura. On the other hand, as already stated above, some works have found that the characteristics of the secondary relaxation in some metallic glasses are well in agreement with the expected JG-relaxation [41]. The debate on the origin of β-relaxation remains open.
Figure 6. Temperature dependence of Dynamo-Mechanical-Analysis (DMA) behavior of La55Al25Ni20 metallic glass. Reprinted from Reference [68] with permission from The Japan Institute of Metals and Materials (JIM).
Metals 05 01073 g006
Similar behavior of the loss modulus is also observed in La70Al15Co15. Wang’s work on La-based BMGs shows that the β-relaxation behavior could be tuned by modification of the chemical composition and could also manifest on different fragility parameter [71]. Not only the intensity, but also the temperature is strongly influenced by the composition; the loss modulus dependence on temperature of La70M15Al15 with M = Ni, Co or Cu is strongly related to the composition as shown in Figure 7. In the case of Ni and Co, there are distinguishable β relaxation peaks, but in the case of Cu the onset of β relaxation is at higher temperature and overlaps with the contribution of the main relaxation, leading to a shoulder or excess wing. This is further explored by Yu [72], affirming that β-relaxation appears if all the atomic pairs have large similar negative values of enthalpy of mixing, while positive or significant fluctuations in enthalpy of mixing suppress β-relaxation. Their conclusion is based on the fact that by substituting Ni by Cu in La70Ni15Al15 the loss modulus change from a separate β-relaxation peak to an excess wing behavior. The enthalpy of mixing is also used to explain the experimental observation that partially substituting Ni with Cu in Pd40Ni40P20 increases the glass transition temperature while lowers the starting temperature of β-relaxation. Furthermore, they suggest that strong and comparable interactions among all the constituting atoms generate string-like atomic configurations, whose excitation emerges as the β-relaxation events.
Figure 7. The T dependence of loss modulus of La70M15Al15 with M = Ni, Co, Cu. Reprinted from Reference [71] with permission from IOP Publishing.
Metals 05 01073 g007
In systems like Pd77.5Si16.5Cu6, Pd48Ni32P20, Pt58.4Ni14.6P27 and Au49Cu26.9Si16.3Ag5.5Pd2.3 the sub-Tg relaxation is detected as a shoulder of the α-peak [73,74] and experiences important changes upon annealing due to aging. Chen pointed out [73] that this sub-Tg relaxation has different features from the JG-relaxation of polymeric and molecular glasses which shows a distinct peak at Tm < 0.6 Tg (at a frequency of 1 Hz) and small effect on the intensity due to thermal stabilization near Tg. In Zr55Cu30Al10Ni5 alloys or La55Al25Ni20, the M″(T) behavior is more similar to a double α-peak than a peak with a shoulder. These results have been interpreted in terms of double glass transitions related to phase separation in the glass [75] or because of double-stage unfreezing of the mobility of the different species during heating [76].
Cohen [77] simulated the loss modulus of a binary Lennard-Jones potential by molecular dynamics by introducing oscillatory stress. The simulation results showed that the β wing could appear on the loss modulus as a function of temperature. Based on simulated DMA curves performed with different fractions of pinned particles, β process was attributed to cooperative movements different from α relaxation. Yu [78] suggested that cooperative string-like atomic motion might be more appropriate to express β process in metallic glasses since it can explain the diffusion of the smallest atom species. Although with a nature of cooperative movement, they involve only small part of all the atoms in the system. Liu [79] measured the activation energy Eβ in ultra quenched MGs, the relationship Eβ = 26RTg suggested that it is a JG-relaxation. X-ray diffraction combined with EXAFS results showed that relaxation originated from short range collective rearrangements of large solvent atoms which could be realized by local cooperative bonding switch. In general, the microscopic mechanisms considered for secondary relaxation are also associated to aging. A short revision of various microscopic models suggested to be responsible of physical aging is already given in Section 2.2 above.

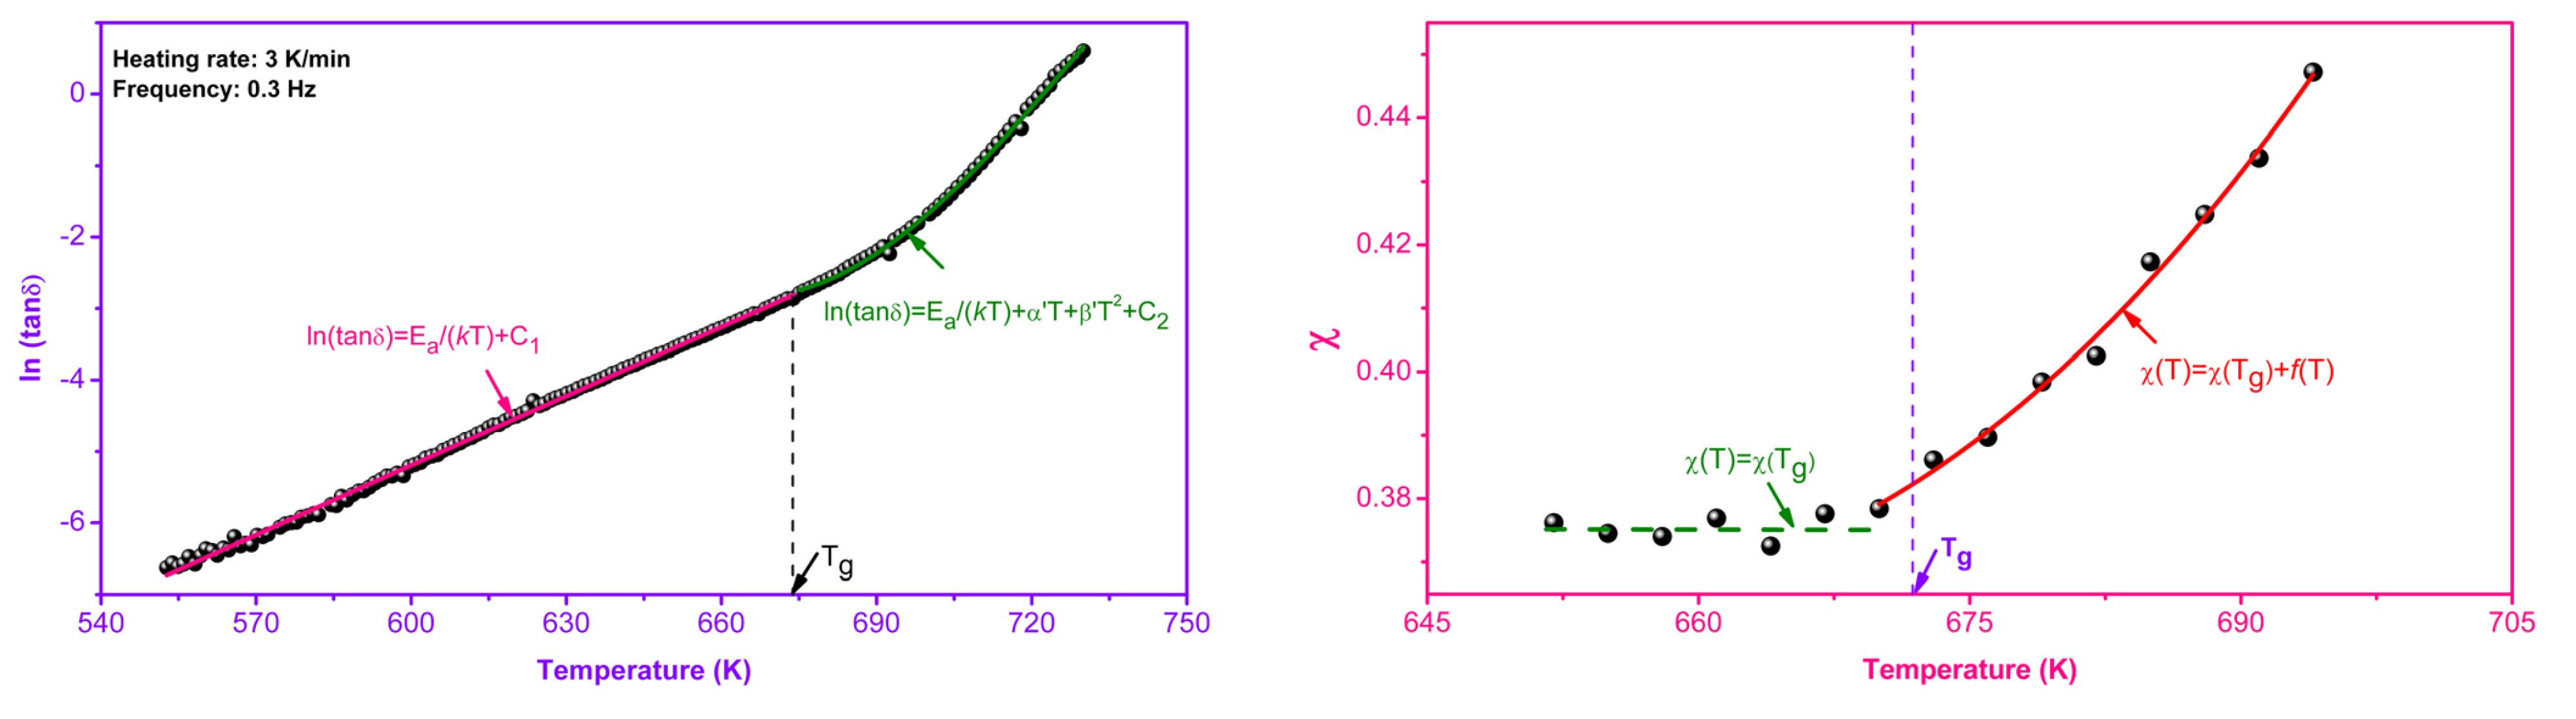
4.2. Influence of Aging

Physical aging makes the structure denser and induces changes in the mechanical, electrical, magnetic, thermal and transport properties. The oldest and widely adopted concept for interpreting aging is that of free volume being progressively reduced. Alternative concepts describe aging as annihilation of various kind of “defects” of the amorphous structure, comprising interstitial-like, stress inhomogeneities, local high free-volume zones or other microscopic motives. Some of these local motives are potential shear transformation zones (STZs), that become activated once external stress is applied. In metallic glasses aging is usually referred as irreversible structural relaxation and has long been noticed as a strong effect existing even at room temperature. Early experiments [80,81] found that when an as-quenched sample is heated cyclically at a constant rate to successively increasing temperatures, the internal friction in each heating run is reduced. This can be described as if the relaxation spectrum is reduced in its faster part by physical aging. When heating during a DMA isochronal test, physical aging may occur in situ and the relaxation spectrum would not correspond to a single isoconfigurational state [82]. On the other hand, if the sample has been previously properly annealed it may not suffer significant aging during the test and the results become reproducible in consecutive heating-cooling-heating cycles.
The nature of individual movement of small areas is supported by room temperature creep behavior using nanoindentation techniques by Castellero [52]. The creep behavior is viscoelastic and could be fitted by two typical relaxation times, which were found to be around 4 s and 36 s for Mg65Cu25Y10 and 2.5 s and 25 s for Mg85Cu5Y10. After aging, the relaxation time of the slow process increases. Comparing with the relaxation time obtained by positron annihilation spectroscopy, Castellero et al. suggested that there are small and large traps where positrons can be annihilated. Smaller defects could be intrinsic open volume regions similar to Bernal interstitial sites, while larger defects are unstable and get annihilated as a consequence of aging. The reduction of these defects, responsible for shear transformations, lead to an abrupt loss of plasticity and a continuous decrease in the creep deformation rate.
Kiss investigated the influence of aging on internal friction of FeB and NiP amorphous alloys [83]. Their results on Ni80P20 show that annealing decreases the internal friction and increases the storage modulus of MGs. Hettwer’s work [84] on influence of heat treatment on the internal friction of Fe32Ni36Cr14P12B6 shows that besides the peak observed around 665 K, there is another small peak in the range between 360 K and 400 K which nowadays could be classified as β-relaxation as shown in Figure 8. The intensity of such β-relaxation becomes reduced and shifted to higher temperatures by heat treatment. Using this β-relaxation as a probe, they investigated the aging dynamics by considering that the reduction of the damping is influenced by both temperature and annealing time as Q−1 = alogta + Q−10 where parameters a and Q−10 are functions of the temperature.
Figure 8. Internal friction of a Fe-based metallic glass for different degrees of physical aging. Reprinted from Reference [84] with permission from Elsevier.
Metals 05 01073 g008
Tests at higher frequency (280 Hz) on the same composition by Haush [85] show a similar behavior, a strong secondary relaxation peak shift to higher temperature. However, Morito [86,87] observed that the β-relaxation reported by Hettwer is not always reproducible, and he suggested that it might come from inappropriate loading. Morito and Egami’s work [80,87] on the same composition shows the influence of aging on internal friction. After an extended period of annealing, the glass reaches an internal pseudo-equilibrium state revealed on the internal friction. The decay kinetics can be expressed by first order kinetics with a log normal distribution of time constants, and the pseudo-equilibrium state is a function of the annealing temperature. A change in the annealing temperature results in a reversible change from one such state to another.
The work by Deng and Argon on Cu59Zr41 and Fe80B20 shows that besides the α-relaxation, there is another relaxation process which gets activated at lower temperatures [88,89], the peak position of the β-relaxation is near 500 K. This peak shifts progressively to higher temperatures as aging continues and is used as a probe to study the aging process. Unlike the Fe32Ni36Cr14P12B6, where quasi-equilibrium structures can be achieved and altered reversibly by annealing at different temperatures, in the Cu59Zr41 metallic glass these quantities continued to change until the onset of crystallization. By fitting the peak temperature at different frequencies, the activation energy for the sample aged at 573 K for 34 h is 46 kJ/mol (0.48 eV), with a frequency factor of 1.9 × 10⁵ s−1. Considering the connection between activation energy of shear transformations and the level of free volume at the transforming cluster site, they affirm that the aging related shifting to higher temperatures without change in height is a result of reduction of free volume in a specific local atomic environment existing in this composition.
The activation energy spectrum of the change of internal friction associated with aging can be obtained by subtracting the internal friction curve of the fully relaxed material from that of the as-quenched one, in a similar way as the data obtained by calorimetry measurements. It is important to keep in mind that the activation energy of internal friction is different than the activation energy of irreversible structural relaxation or aging. A well-known fact is that the relaxation time from internal friction tests is frequency dependent. However, for example in Fe32Ni36Cr14P12B6, the aging characteristic time at 473 K is around 135 min and almost the same for 573 K [86].

4.3. Modeling of the Mechanical Relaxation Spectrum

The temperature dependence of internal friction or loss modulus can be modeled with the methodologies described in Section 3. Debye relaxation is normally used to describe the anelastic behavior, and the distribution of relaxation times can be related to a spectrum of activation energy. Ignoring the microscopic origin of the E distribution, the time-temperature relaxation spectrum M″(ω,T) can be modeled by combining a frequency response function (HN, CD, CC or other) with a temperature dependence of the main relaxation time τ(T), in what is called time temperature superposition (TTS) method [90]. In this approach, the shape of the response function describes the effect of the relaxation time spectrum, i.e., the deviation from a Debye process. In the case of HN, CD or CC functions, this shape is determined by the exponents α and γ of Equation (18) with values obtained from fitting the experimental data. Therefore, τ(T) describes the temperature dependence of the average or main relaxation time of the process and is commonly found to follow an Arrhenius-like behavior for T < Tg.
If the system shows various relaxation processes well differentiated in the time scale, each one of these processes can be modeled by the corresponding response function χi and intensity ΔMi as
M ( ω , T ) = M u Δ M 1 χ 1 ( ω , T ) Δ M 2 χ 2 ( ω , T )
where the temperature dependence of χi is given by the corresponding τi(T). Of course, if the activation energy spectrum of one of these processes is very broad, a τ(T) defined by a single activation energy and a χ(ω) function with constant shape will not be able to reproduce the whole time-temperature spectrum and the modeling will have to take into account the explicit distribution of activation energies, computing the frequency-domain response function by numerical calculation of Equations (13) and (15). Finally, it should be taken into account that Mu, and sometimes ΔMi, usually shows a slight temperature dependence [53] that may has a significant effect if the modeling expands over a large temperature window.
The master curve analysis is often used in the interpretation of DMA data using TTS principle; the master curve is constructed using isothermal multi frequency DMA data. Within this methodology, the temperature dependence of the shift factor follows an Arrhenius relationship with different activation energies below and above Tg. Pelletier [91] investigated the apparent activation energy in PdNiCuP using this method and obtained Eβ = 1.1 eV and Eα = 3.4 eV respectively. Jeong [92,93] analyzed the mechanical relaxation of Mn55Al25Ni10Cu10 and Zr36Ti24Be40. For Mn55Al25Ni10Cu10 glass, the activation energy of the alpha relaxation was found Eα = 78 kJ/mol (0.81 eV) and Eα = 323 kJ/mol (3.3 eV) respectively below and above Tg. For Zr36Ti24Be40, the activation energies were Eα(T < Tg) = 93 kJ/mol (0.96 eV) and Eα(T > Tg) = 392 kJ/mol (4.1 eV). Guo’s work [94] on mechanical relaxation studies of α and slow β processes show that Nd65Fe15Co10Al10 have a distinct β-relaxation in the temperature region between 320 K and 420 K. The activation energy is found Eβ = 98 kJ/mol (1.0 eV) with the τβ0 = 10−14.5. Since there is a relationship Eβ = 24RTg which is close to the suggested by mode coupling theory [95], they claim that β relaxation is intrinsic in metallic glasses. Activation energy data of α and β relaxations of many metallic glass systems can be found in Wang’s work [96].
In a narrow range above Tg, the VFT behavior of τ(T) can be approximated to an Arrhenius law with an apparent activation energy of the liquid
E α,liquid = m R T g ln ( 10 )
This gives values between 200 and 600 kJ/mol depending on the fragility and the Tg of the system. On the other hand, the activation energies of both α and β relaxations at T < Tg are usually found between 80 and 160 kJ/mol. These E values of the mechanical relaxation processes below but not far from Tg coincide with the activation energy commonly found for physical aging in this temperature region, as already stated above, the same microscopic origins are expected for both processes.
Here it is interesting to note that Eβ ~ 26 R Tg and Eα given by the AGV approach (Equation (3)) give very similar values. For instance, considering typical values for metallic glasses of Tg = Tf = 600 K, T0 = 450 and B = D* T0 = 4500, Equations (1)–(3) and (22) give Eα(T > Tg) = 440 kJ/mol, m = 38, Eα(T < Tg) = 128 kJ/mol while Eβ = 26RTg = 130 kJ/mol. Therefore, the expected values of the average activation energies controlling both primary and secondary relaxations in the glassy phase are very similar for metallic glasses. This poses difficulty in interpreting the two phenomena as mega-basin and sub-basin transitions within the potential energy landscape picture.
Concerning the shape of the relaxation function, Liu and Wang [97,98] fitted the DMA behavior of Ce-based and Zr-Ti-Cu-Ni-Be glasses assuming that τ(T) follows a VFT behavior and relaxation can be described by the KWW function. The loss modulus was computed by Fourier transform finding that in the temperature region higher than Tg the experimental data was well reproduced; however, in the lower temperature region, the fitting was poorer. In Ce70Al10Cu20 and Zr-Ti-Cu-Ni-Be glasses the excess wing was fitted by considering α and β relaxations. They suggested that β relaxations arise from the small scale translational motions of atoms which are hindered in its metastable atomic positions by solid-like islands.
In some metallic glass compositions, mechanical relaxation below Tg is only perceived as an excess wing of the main α-peak (see Figure 9). In other cases, a shoulder or a secondary peak is detected in as-quenched samples but vanishes after thermal cycling in more stable glassy states. Description of M″(ω,T) along the whole temperature range by consistent relaxation functions and τ(T) behaviors is maybe the main tool in order to discern if a secondary relaxation is present and what are its main characteristics.
Figure 9. Low temperature side of the loss modulus peak of ZrAlCu glass. Reprinted from Reference [99] with permission from IOP Publishing.
Metals 05 01073 g009
Using a CC-function, Hachenberg et al. [100,101] showed that the α-peak of Zr65Cu27.5Al7.5 and Pd77Cu6Si17 is well described by the VFT equation and the excess wing is better fitted when taken in consideration a β-relaxation. By observing the heating rate dependence of the onset and turning point of storage modulus dependence on temperature, Hachenberg determined Eβ to be 0.67 ± 0.11 eV and 0.59 ± 0.39 eV for Pd77Cu6Si17 and Zr65Al17.5Cu27.5 respectively. He ascribed this change on the storage modulus as a result of aging driven by a β-relaxation with a cooperative nature. Since these two different glassy systems have quite different strong-fragile liquid behavior (m = 52.8–77 for PdCuSi and m = 36.4–38.4 for Zr-Al-Cu) they suggested β-relaxation might be a universal feature of metallic glass dynamics. Combining the dependence on the heating rate of α-peak and MCT predictions they explained the merging of α and β relaxations.
The excess-wing of M″(ω,T) found in isochronal DMA of Cu46Zr46Al8 was interpreted by Liu et al. [102] as the high-frequency tail of the α-peak once in the AGV (T < Tg) dynamics as shown in Figure 10. The Arrhenius/VFT transition is quite often observed in glass systems [103]. Liu showed that the DMA behavior of Cu46Zr46Al10 described with a CC-function and τα(T) showing VFT/AGV transition at T = Tg was compatible with the relaxation times obtained from quasi-static stress relaxation experiments following KWW equation (see Figure 11). The broadening parameter of the CC-function and the stretching exponent of the KWW were found α ~ βKWW ~ 0.4. The as-quenched samples, did not follow AGV dynamics below Tg, as they suffered in situ aging during the heating and the measured τα(T, Tf(t)) was interpreted as the system crossing different Tf states as it undergoes simultaneously physical aging.
The same approach was previously applied to the analysis of Mg65Cu25Y10 glass [82]. In this case, the deviation from VFT behavior combined with the in situ aging manifested a shoulder on the loss modulus as shown in Figure 12. In this case, the CC-function used for fitting the relaxation spectrum showed a significant change of the broadening parameter due to aging. The study of room temperature aging of the same system [29] shows an average activation energy coherent with the τα(T < Tg) behavior found from DMA, implying that in this system aging is driven by molecular movements belonging to the high-frequency tail of a broad α-peak.
Figure 10. Time-temperature map E″(ω,T) (E Young’s modulus) for Cu46Zr46Al8 glass calculated considering a Cole-Cole function and τ(T) described by Vogel-Fulcher-Tammann (VFT)/Adams-Gibbs-Vogel (AGV) transition.
Metals 05 01073 g010
Figure 11. τα(T) of Cu46Zr46Al8 obtained from Cole-Cole fitting of Dynamo-Mechanical-Analysis (DMA) measurements (open symbols) and from quasi-static stress-relaxation tests (filled symbols). Diamonds and circles correspond to annealed samples while triangles and squares to as-quenched ones. Reprinted from Reference [102] with permission from Elsevier.
Metals 05 01073 g011
In some metallic glass compositions, especially Pd and La-based ones, the secondary relaxation appears as a prominent peak well-separated from the α-peak and present also for well-aged samples. Based on Cavaille’s work on rheology of glasses and polymers [104], Pelletier analyzed the dynamic mechanical behavior of Pd43Ni10Cu27P20 in a hierarchical correlation concept [91]. Following Gauthier’s [105] work on quasi-point defects, three different contributions exist in the mechanical response as elastic, anelastic and viscoplastic parts. Qiao [106] analyzed and fit the temperature dependent internal friction behavior of Zr55Cu30Ni5Al10 using the same model. In this model, the important parameter χ is a correlation factor between 0 and 1 linked to the quasi point defect concentration. χ = 0 corresponds to a maximum order, when any movement of a structural unit requires the motion of all other units, while χ = 1 represent maximum disorder when all the movements are independent of each other. With this methodology, in the low temperature range, when the χ is constant (~0.38 in the case of Zr55Cu30Ni5Al10), the loss factor can be easily fitted by a simple Arrhenius equation. At higher temperatures, the parameter χ is a function of temperature, and it was found that it could be fitted with a parabolic function (see Figure 13). In the point defect model, the key-question is how the order parameter χ changes with temperature. The behavior of χ is related to the viscosity change and Qiao’s work shows that the quality of the fitting depends on an appropriate description of the viscosity behavior. However, due to the many orders of magnitude change within a relatively narrow temperature region, the description of viscosity behavior is still an open problem [4,107,108].
Figure 12. Thick solid line is the expected isochronal DMA behavior of Mg65Cu25Y10 for different fictive temperatures. Reprinted from Reference [82] with permission from Elsevier.
Metals 05 01073 g012
Figure 13. Internal friction modeled by the quasi-point defect theory and χ dependence on temperature. Reprinted from Reference [106] with permission from AIP.
Metals 05 01073 g013
Wang [109] showed that the DMA behavior can be fitted in the whole temperature range by coupling two KWW equations in Fourier transforms. The temperature dependence of τα shows a VFT equation while τβ has an Arrhenius-like dependence. For La70Ni15Al15, the pre-factors τα,0 and τβ,0 are 10−13 s and 10−15 s respectively and βKWW = 0.42. Qiao [70] fitted the relaxation dynamics of Pd40Ni10Cu30P20 as well as La60Ni15Al25 by combining the Fourier transform of the KWW function for the α-relaxation and the CC-function for the β. From a microscopic point of view, α-relaxation could be interpreted as collective movement of all the atoms, while β relaxation could be understood by the quasi-point defect theory which relates relaxation to thermally activated jumps of a structural unit [54]. Later on, they described the β process using a coupling model in a very similar form [70].
Mechanical spectroscopy data can also unveil the underlying distribution of relaxation times. This means obtaining the distribution of relaxation times A(τ′) defined in Equation (13). Kursumovic [44,110] and Ocelik [111] analyzed creep recovery and found a trimodal distribution of τ′ with maximums of the distribution peaks around 10 s, 100 s and 1000 s at temperature 50–100 K below Tg (Figure 14). The details of the A(τ′) allowed them to propose different TSRO and CSRO corresponding to each mode of the distribution, the slowest one corresponding to annihilation of free-volume by cooperative motions. Ju and Atzmon applied direct spectrum analysis to strain relaxation data on Al86.8Ni3.7Y9.5 at room temperature [112] and later to DMA isothermal curves of Zr46.8Ti8.2Cu7.5Ni10Be27.5 near Tg [113]. In both cases they obtained a multimodal distribution of times, and interpreted it as associated to the activation of shear transformation zones (STZs) involving different number of atoms. The direct time spectrum analysis of mechanical spectroscopy permits to unveil more details about the microscopic movements involved in the relaxation process.
Figure 14. Time spectrum of anelastic relaxations of Fe40Ni40B20 glass at T < Tg. Reprinted from Reference [110] with permission from Elsevier.
Metals 05 01073 g014
In addition to get insight to the microscopic origin of glassy dynamics, the determination of the relaxation spectrum M″(ω,T) by appropriate response functions and average τ(T) dependences is, per se, an important characterization of metallic glasses due to its consequences on the mechanical properties. The relationship between mechanical relaxation processes and mechanical properties will be briefly introduced in the following section.

5. Relationship between the Relaxation Spectrum and the Mechanical Properties

On the macroscopic scale, bulk metallic glasses can show plasticity depending on the temperature and the strain rate. At room temperature, depending on the specific system, the length scale of the plastic process zone ranges from 100 nm to 100 μm. Xi [114] determined the plastic zone size of metallic glasses and, based on the relationship between the plastic zone and the stress intensity factor KIC, they suggested that fracture of metallic glasses can be regarded as a flow process at different length scales. As reviewed by Schuh [115], physical aging affects all mechanical properties, from Young’s modulus to impact toughness. This is often explained in the framework of the free volume theory; the free volume decreases during annealing, the shear to bulk moduli ratio increases and the glass becomes more brittle. In general, the mechanical behavior of metallic glasses is interpreted in terms of shear transformation zones (STZs) or of the more recently developed cooperative shearing model (CSM) as described by Chen [116]. As discussed above, the β-relaxation measured by mechanical spectroscopy is interpreted as micro-events activated at temperature lower than Tg. The main point here is to describe the relationship between these events and the mechanical properties.
Kahl investigated [117] the aging paths below Tg of Pd40Ni40P20 glass via ultrasonic measurements. Figure 15 shows the changes in shear modulus due to decrease in free volume after various annealing treatments. The structural changes causing the process have been attributed to JG-β relaxations. In a similar material (Pd43Ni10Cu27P20), Harmon [118] identifies these secondary β-relaxation events with reversible anelastic excitations within the elastic matrix confinement, while the α-relaxation event was identified with the collapse of the matrix confinement and the breakdown of elasticity.
Figure 15. Shear modulus vs. annealing temperature of a freshly prepared Pd40Ni40P20 MG and subsequent annealing procedures. Reprinted from Reference [117] with permission from AIP.
Metals 05 01073 g015
Okumura [68] investigated the mechanical behavior of La55Al25Ni20 metallic glass at different temperatures. As can be seem from Figure 16, there is an increase of maximum elongation around 385 K that corresponds to the activation of β-relaxation in Figure 6. In the same work, La55Al25Cu20 was also investigated showing a similar increase of elongation at the temperatures where an obvious shoulder of the loss modulus was observed. It also exhibited an obvious shoulder behavior in the mechanical spectroscopy measurements. As pointed out by Spaepen [119,120], stress or thermal activation in metallic glasses transforms nanoscale soft regions (regions with higher free volume content) into flow units able to accommodate deformation. Below the yield stress, the resulting atomic rearrangement is reversible. Above the yield stress the flow units overcome a certain energy barrier and the atomic reconfiguration becomes irreversible. Macroscopic plastic deformation is thus the result of simultaneous irreversible microscopic shearing events. Under this approach, shear banding is a consequence of a localized high density of flow units. Single flow units promote the activation of near flow units, in a cooperative mechanism which eventually results in the nucleation of a shear band.
Figure 16. Changes in the yield stress and fracture elongation with testing temperature for La55Al25Ni20 glass. The observed decrease in length above ~490 K is attributed to crystallization. Reprinted from Reference [68] with permission from JIM.
Metals 05 01073 g016
Based on potential energy landscape and the theory of shear strength in dislocation free solids, Johnson [121] proposed the CSM with the aim of understanding the rheological mechanisms and mechanical properties of metallic glasses. According to it, the volume of STZs, Ω, is proportional to their activation energy, W*, and the number of atoms participating in the flow unit can be estimated from the model. Using this model and treating the observed shoulder or β-peak of M″(ω,T) as a thermal activated process, the activation energy of the process can be determined by DMA. Zhao et al. [122] obtained the Eβ of several different metallic glasses. They obtained a relationship of Eβ = 27.5RTg which is close to 24RTg accepted for nonmetallic glass formers. They ascribe this difference to the different type of bonding and suggest that this is the Johari-Goldstein β relaxation in metallic glasses. Using the same methodology, Yu [123] determined the activation energy of more metallic glass alloys and found Eβ = 26RTg. By an appropriate choice of parameters and using the CSM model they found that the activation energy of β-relaxations and the potential energy barriers of STZs are the same. Liu [124] determined the activation energy of the β relaxation in La-based bulk metallic glasses and assuming that this was the activation energy of STZs they obtained Ω = 5.5(0.1) nm3 and the number of atoms involved in an STZ, n = 178(10), for La60Al25Ni15. By compiling data of Eβ, they found that the flow unit volume of various MGs range from 2.36 to 6.18 nm3 and n goes from 170 to 250. These values are in agreement with Pan’s [125] estimation based on nanoindentation experiments.
The importance of the Poisson’s ratio, ν, on the design of modern materials is highlighted by Greaves [126]. Besides, it is generally accepted that Possion’s ratio is a good indicator of the ductility of MGs. With small deviations on the exact value, it is widely accepted in the literature that there exists a critical value which divides plasticity (higher ν values) from brittleness (lower ν values) [127]. For values of ν larger than 0.32, the shear band tip tends to extend rather than induce crack initiation, allowing formation of multiple shear bands and leading to the observed macroscopic plasticity. The exact mechanism is still obscure, but it is suggested that the ductile/brittle nature of metals (in amorphous or crystalline form) is related to the viscous time dependent properties of their liquid precursors, either constrained in metallic glass shear bands or in polycrystalline grain boundaries. The analysis on STZs suggests that the average flow units also correlates with the Possion’s ratio; as the value of Ω increase from 2.36 to 6.18 nm3, the value of Poisson’s ratio drops from 0.404 to 0.304.
Unlike previous work where plasticity could only be observed in constrained conditions like bending or compression, Yu [128] found a pronounced macroscopic tensile plasticity in a La68.5Ni16Al14Co1.5 metallic glass using ribbon samples. Even at room temperature, the stress strain curve deviates from linear relationship under the strain rate of 1.6 × 10⁻⁶ s−1. As shown in Figure 17, by determination of the strain rate of ductile to brittle transition (DBT) at different temperatures, the activation energy of the DBT is determined to be 103 kJ/mol. This is a similar value to the Eβ determined by DMA. Furthermore, by using nuclear magnetic resonance (NMR), Yu [78] determined the temperature dependent atomic (diffusive) hopping rates of P atoms in Pd40Ni10Cu30P20 and Be atoms in Zr46.75Ti8.25Cu7.5Ni10Be27.5. They found that their activation energies are very close to Eβ. Since the P and Be are the smallest atoms in the respectively metallic glasses, it is suggested that the β relaxation and self-diffusion of the smallest atoms are closely related.
Figure 17. Map of modes of deformation of a La-based glass showing the ductile/brittle transition. Reprinted from Reference [128] with permission from APS.
Metals 05 01073 g017
It is generally accepted that the microstructural origin of the MGs plasticity can be explained by flow units or STZs. By utilizing a mandrel winding method which deform in the bend mode, Lu [129] realized homogeneous plastic deformation at room temperature for Zr, Fe, Mg, Al, and La based metallic glass ribbons. Assuming Eβ = 26RTg and choosing metallic glasses with different Tg, they found that plastic deformation is higher for lower Eβ. By annealing the sample, physical aging decreases the density of flow units and then both the β-peak of internal friction and plastic deformation get reduced. From the results, they suggest that when the loading time is longer than the relaxation time or if enough energy is applied to activate a sufficiently high density of flow units, homogeneous plastic deformation of MGs can occur at room temperature.
As discussed in the previous sections, mechanical spectroscopy is a powerful tool in order to get insight of the complex glassy dynamics and the time evolution of the system due to physical aging. Furthermore, as shown in this section, the relationships between α-relaxation and homogeneous flow, on one side, and between β-relaxation and plastic behavior at lower temperatures on the other, makes the characterization of the mechanical relaxation spectrum an essential tool for predicting the deformation behavior of MGs at given temperature/deformation rate conditions.

6. Conclusions

In this work, the present knowledge of relaxation dynamics in metallic glasses is reviewed, as well as some suitable methodologies to reveal it. It is generally accepted that primary relaxation, well described by the VFT model at T > Tg, reflects the homogeneous flow. On the contrary, understanding of the β process is still developing. Early work suggested that it is the result of anelastic events similar to already known processes in crystalline metals. It might be originated from diffusion processes, resembling Zener or Snoek relaxation. In the energy landscape picture, it corresponds to jumps between close energy minima separated by a low energy barrier and, nowadays, it is treated as a process related to the activation of shear transformation zones or flow units. Both low temperature anelastic events and irreversible aging are usually attributed to the presence β-relaxation, mostly due to the fact that it is very difficult to distinguish between them and the purely reversible Johari-Goldstein relaxation. Furthermore, although the relaxation times of α and β relaxations are separated orders of magnitude, the activation energies obtained for both processes when T < Tg are similar. This obscures the differentiation of their microscopic origin and the effect of each relaxation in the mechanical behavior.
For as-quenched samples, obtained with high cooling rates, the relaxation times are also affected by aging and the corresponding change of fictive temperature of the glass. Dynamic mechanical analysis reveals a main α-peak combined with a well-differentiated secondary peak, a low-temperature shoulder or an excess wing depending on the composition and degree of aging of the system. The shoulder or excess wing is the signature of a relaxation time divergent from the VFT behavior which is generally associated to β-relaxation. In some systems, however, the excess wing can be explained only by the high-frequency tail of the α-peak. This picture applies both to glasses such as Cu46Zr46Al8, with a broad distribution of relaxation energies manifested on an excess wing, and to glasses such as Mg65Cu25Y10 showing a more obvious effect of physical aging reflected in an apparent shoulder of the loss modulus. In other metallic glasses like La-Ni-Al or Pd-Ni-Cu-P systems, the loss modulus behavior cannot be fitted by one single relaxation event. For La-Ni-Al β-relaxation is well-separated from the primary relaxation and shows different strengths for different compositions. In the case of Pd-Ni-Cu-P, α and β processes are close in a narrow temperature region. In this latter case, the loss modulus behavior might result from an overlap of different concurring mechanisms: thermoelastic background, β-relaxation, and the viscosity related component changing from Arrhenius to VFT behavior at the glass transition.
The link between relaxation dynamics of metallic glass and their mechanical properties is also discussed. At a given temperature, there is a ductile to brittle transition relating the applied strain rate and the β-relaxation time. Further work suggests that this transition might be originated from the notable β relaxations and its influence on the activation of shear transform zones or flow units. There might be also a connection between the β relaxations and the ability of absorbing energy which is associated with the toughness of materials. By exploring the internal friction behavior (especially the β relaxations), it is expected that we can improve our knowledge of metallic glasses, leading to obtain alloys with improved mechanical performance.

Acknowledgments

Work funded by MINECO, grant FIS2014-54734-P and Generalitat de Catalunya, grant 2014SGR00581. C. Liu is supported by Generalitat de Catalunya, FI grant 2012FI_B00237.

Author Contributions

All authors contributed equally to this work.

Conflicts of Interest

The authors declare no conflict of interest.

References

  1. Angell, C.A. Relaxation in liquids, polymers and plastic crystals strong/fragile patterns and problems. J. Non-Cryst. Solids 1991, 131–133, 13–31. [Google Scholar] [CrossRef]
  2. Stillinger, F.H.; Debenedetti, P.G. Glass Transition Thermodynamics and Kinetics. Annu. Rev. Condens. Matter Phys. 2013, 4, 263–285. [Google Scholar] [CrossRef]
  3. Debenedetti, P.G.; Stillinger, F.H. Supercooled liquids and the glass transition. Nature 2001, 410, 259–267. [Google Scholar] [CrossRef] [PubMed]
  4. Dyre, J.C. Colloquium: The glass transition and elastic models of glass-forming liquids. Rev. Mod. Phys. 2006, 78, 953–972. [Google Scholar] [CrossRef]
  5. Angell, C.A.; Ngai, K.L.; McKenna, G.B.; MaMillan, P.F.; Martin, S.W. Relaxation in glassforming liquids and amorphous solids. J. Appl. Phys. 2000, 88, 3113–3157. [Google Scholar] [CrossRef]
  6. Bohmer, R.; Ngai, K.L.; Angell, C.A.; Plazek, D.J. Nonexponential relaxations in strong and fragile glass formers. J. Chem. Phys. 1993, 99, 4201–4209. [Google Scholar] [CrossRef]
  7. Johari, G.P.; Goldstein, M. Viscous liquids and the glass transition. II. Secondary relaxations in glasses of rigid molecules. J. Chem. Phys. 1970, 53, 2372–2388. [Google Scholar] [CrossRef]
  8. Borrego, J.M.; Conde, C.F.; Conde, A. Structural relaxation processes in FeSiB-Cu(Nb, X), X = Mo, V, Zr, Nb glassy alloys. Mater. Sci. Eng. A 2001, 304–306, 491–494. [Google Scholar] [CrossRef]
  9. Kumar, G.; Neibecker, P.; Liu, Y.H.; Schroers, J. Critical fictive temperature for plasticity in metallic glasses. Nat. Commun. 2013, 4. [Google Scholar] [CrossRef]
  10. Hodge, I.M. Enthalpy relaxation and recovery in amorphous materials. J. Non-Cryst. Solids 1994, 169, 211–266. [Google Scholar] [CrossRef]
  11. Hodge, I.M. Effects of Annealing and Prior History on Enthalpy Relaxation in Glassy-Polymers 6. Adam-Gibbs Formulation of Nonlinearity. Macromolecules 1987, 20, 2897–2908. [Google Scholar] [CrossRef]
  12. Tool, A.Q. Relation Between Inelastic Deformability and Thermal Expansion of Glass in Its Annealing Range. J. Am. Ceram. Soc. 1946, 29, 240–253. [Google Scholar] [CrossRef]
  13. Moynihan, C.T.; Macedo, P.B.; Montrose, C.J.; Gupta, P.K.; DeBolt, M.A.; Dill, J.F.; Dom, B.E.; Drake, P.W.; Easteal, A.J.; Elterman, P.B.; et al. Structural Relaxation in Vitreous Materials. Ann. N. Y. Acad. Sci. 1976, 279, 15–35. [Google Scholar] [CrossRef]
  14. Narayanaswamy, O.S. A Model of Structural Relaxation in Glass. J. Am. Ceram. Soc. 1971, 54, 491–498. [Google Scholar] [CrossRef]
  15. Lunkenheimer, P.; Wehn, R.; Schneider, U.; Loidl, A. Glassy aging dynamics. Phys. Rev. Lett. 2005, 95. [Google Scholar] [CrossRef]
  16. Chen, H.S.; Coleman, E. Structure relaxation spectrum of metallic glasses. Appl. Phys. Lett. 1976, 28, 245–247. [Google Scholar] [CrossRef]
  17. Tsyplakov, A.N.; Mitrofanov, Y.P.; Makarov, A.S.; Afonin, G.V.; Khonik, V.A. Determination of the activation energy spectrum of structural relaxation in metallic glasses using calorimetric and shear modulus relaxation data. J. Appl. Phys. 2014, 116. [Google Scholar] [CrossRef]
  18. Granato, A.V.; Khonik, V.A. An interstitialcy theory of structural relaxation and related viscous flow of glasses. Phys. Rev. Lett. 2004, 93. [Google Scholar] [CrossRef]
  19. Khonik, S.V.; Granato, A.V.; Joncich, D.M.; Pompe, A.; Khonik, V.A. Evidence of distributed interstitialcy-like relaxation of the shear modulus due to structural relaxation of metallic glasses. Phys. Rev. Lett. 2008, 100. [Google Scholar] [CrossRef]
  20. Nagel, C.; Rätzke, K.; Schmidtke, E.; Faupel, F.; Ulfert, W. Positron-annihilation studies of free-volume changes in the bulk metallic glass Zr65Al7.5Ni10Cu17.5 during structural relaxation and at the glass transition. Phys. Rev. B 1999, 60, 9212–9215. [Google Scholar] [CrossRef]
  21. Van den Beukel, A.; Radelaar, S. On the Kinetics of Structural Relaxation in Metallic Glasses. Acta Mater. 1983, 31, 419–427. [Google Scholar] [CrossRef]
  22. Van den Beukel, A.; van der Zwaag, S.; Mulder, A.L. A semi quantitative description of the kinetics of structural relaxataion in amorphous Fe40Ni40B20. Acta Metall. 1984, 32, 1895–1902. [Google Scholar] [CrossRef]
  23. Gibbs, M.R.J.; Sinning, H.R. A critique of the roles of TSRO and CSRO in metallic glasses by application of the activation energy spectrum model to dilatometric data. J. Mater. Sci. 1985, 20, 2517–2525. [Google Scholar] [CrossRef]
  24. Khonik, V.A.; Kosilov, A.T.; Mikhailov, V.A.; Sviridov, V.V. Isothermal creep of metallic glasses: A new approach and its experimental verification. Acta Mater. 1998, 46, 3399–3408. [Google Scholar] [CrossRef]
  25. Borrego, J.M.; Blázquez, J.S.; Lozano-Pérez, S.; Kim, J.S.; Conde, C.F.; Conde, A. Structural relaxation in Fe(Co)SiAlGaPCB amorphous alloys. J. Alloys Compd. 2014, 584, 607–610. [Google Scholar] [CrossRef]
  26. Khonik, V.A. The Kinetics of Irreversible Structural Relaxation and Homogeneous Plastic Flow of Metallic Glasses. Phys. Status Solidi A 2000, 177, 173–189. [Google Scholar] [CrossRef]
  27. Khonik, V.A. The kinetics of irreversible structural relaxation and rheological behavior of metallic glasses under quasi-static loading. J. Non-Cryst. Solids 2001, 296, 147–157. [Google Scholar] [CrossRef]
  28. Ruta, B.; Baldi, G.; Monaco, G.; Chushkin, Y. Compressed correlation functions and fast aging dynamics in metallic glasses. J. Chem. Phys. 2013, 138. [Google Scholar] [CrossRef] [PubMed]
  29. Zhai, F.; Pineda, E.; Ruta, B.; Gonzalez-Silveira, M.; Crespo, D. Aging and structural relaxation of hyper-quenched Mg65Cu25Y10 metallic glass. J. Alloys Compd. 2014, 615, s9–s12. [Google Scholar] [CrossRef] [Green Version]
  30. Hu, L.; Zhou, C.; Zhang, C.; Yue, Y. Thermodynamic anomaly of the sub-Tg relaxation in hyperquenched metallic glasses. J. Chem. Phys. 2013, 138. [Google Scholar] [CrossRef] [PubMed]
  31. Tsyplakov, A.N.; Mitrofanov, Y.P.; Khonik, V.A.; Kobelev, N.P.; Kaloyan, A.A. Relationship between the heat flow and relaxation of the shear modulus in bulk PdCuP metallic glass. J. Alloys Compd. 2015, 618, 449–454. [Google Scholar] [CrossRef]
  32. Chen, H.S. Glass transition and secondary relaxation in metal glasses. In Amorphous Metals and Semiconductors; Haasen, P., Jaffee, R.I., Eds.; Pergamon Press: Coronado, CA, USA, 1985; pp. 126–150. [Google Scholar]
  33. Maddin, R.; Masumoto, T. The deformation of amorphous palladium-20 at. % silicon. Mater. Sci. Eng. 1972, 9, 153–162. [Google Scholar] [CrossRef]
  34. Cohen, M.H.; Turnbull, D. Molecular Transport in Liquids and Glasses. J. Chem. Phys. 1959, 31, 1164–1169. [Google Scholar] [CrossRef]
  35. Turnbull, D.; Cohen, M.H. Free Volume Model of the Amorphous Phase: Glass Transition. J. Chem. Phys. 1961, 34, 120–125. [Google Scholar] [CrossRef]
  36. Turnbull, D.; Cohen, M.H. On the Free-Volume Model of the Liquid-Glass Transition. J. Chem. Phys. 1970, 52, 3038–3041. [Google Scholar] [CrossRef]
  37. Jackle, J. Models of the glass transition. Rep. Prog. Phys. 1986, 49, 171–231. [Google Scholar] [CrossRef]
  38. Goldstein, M. Viscous Liquids and the Glass Transition: A Potential Energy Barrier Picture. J. Chem. Phys. 1969, 51, 3728–3739. [Google Scholar] [CrossRef]
  39. Gotze, W.; Sjogren, L. Relaxation processes in supercooled liquids. Rep. Prog. Phys. 1992, 55, 241–370. [Google Scholar] [CrossRef]
  40. Ngai, K.L.; Paluch, M. Classification of secondary relaxation in glass-formers based on dynamic properties. J. Chem. Phys. 2004, 120, 857–873. [Google Scholar] [CrossRef] [PubMed]
  41. Ngai, K.L. Johari-Goldstein relaxation as the origin of the excess wing observed in metallic glasses. J. Non-Cryst. Solids 2006, 352, 404–408. [Google Scholar] [CrossRef]
  42. Nowick, A.S.; Berry, B.S. Anelastic Relaxation in Crystalline Solids; Academic Press, Inc.: New York, NY, USA; London, UK, 1972. [Google Scholar]
  43. Ngai, K.L. Relaxation and Diffusion in Complex Systems; Springer: New York, NY, USA, 2011. [Google Scholar]
  44. Kuršumović, A.; Cantor, B. Anelastic crossover and creep recovery spectra in Fe40Ni40B20 metallic glass. Scr. Mater. 1996, 34, 1655–1660. [Google Scholar] [CrossRef]
  45. Jiao, W.; Wen, P.; Peng, H.L.; Bai, H.Y.; Sun, B.A.; Wang, W.H. Evolution of structural and dynamic heterogeneities and activation energy distribution of deformation units in metallic glass. Appl. Phys. Lett. 2013, 102. [Google Scholar] [CrossRef]
  46. Hermida, É.B. Description of the Mechanical Properties of Viscoelastic Materials Using a Modified Anelastic Element. Phys. Status Solidi 1993, 178, 311–327. [Google Scholar]
  47. Alvarez, F.; Alegria, A.; Colmenero, J. Relationship between the time domain Kohlrausch Williams Watts and frequency domain Havriliak Negami relaxation functions. Phys. Rev. B 1991, 44, 7306–7312. [Google Scholar] [CrossRef]
  48. Svanberg, C. Correlation function for relaxations in disordered materials. J. Appl. Phys. 2003, 94, 4191–4197. [Google Scholar] [CrossRef]
  49. Qiao, J.; Casalini, R.; Pelletier, J.-M.M.; Kato, H. Characteristics of the structural and Johari-Goldstein relaxations in Pd-based metallic glass-forming liquids. J. Phys. Chem. B 2014, 118, 3720–3730. [Google Scholar] [CrossRef] [PubMed]
  50. Blanter, M.S.S.; Golovin, I.S.S.; Neuhauser, H.; Sinning, H.-R. Internal Friction in Metallic Materials; Springer: Heidelberg, Germany, 2007. [Google Scholar]
  51. Wen, P.; Zhao, D.Q.; Pan, M.X.; Wang, W.H.; Huang, Y.P.; Guo, M.L. Relaxation of metallic Zr46.75Ti8.25Cu7.5Ni10Be27.5 bulk glass-forming supercooled liquid. Appl. Phys. Lett. 2004, 84, 2790–2792. [Google Scholar] [CrossRef]
  52. Castellero, A.; Moser, B.; Uhlenhaut, D.I.; Dalla Torre, F.H.; Löffler, J.F. Room-Temperature creep and structural relaxation of Mg–Cu–Y metallic glasses. Acta Mater. 2008, 56, 3777–3785. [Google Scholar] [CrossRef]
  53. Wang, W.H. The elastic properties, elastic models and elastic perspectives of metallic glasses. Prog. Mater. Sci. 2011, 57, 487–656. [Google Scholar] [CrossRef]
  54. Qiao, J.C.; Pelletier, J.M. Dynamic mechanical analysis in La-based bulk metallic glasses: Secondary (β) and main (α) relaxations. J. Appl. Phys. 2012, 112. [Google Scholar] [CrossRef]
  55. Ruta, B.; Chushkin, Y.; Monaco, G.; Cipelletti, L.; Pineda, E.; Bruna, P.; Giordano, V.M.; Gonzalez-Silveira, M. Atomic-Scale relaxation dynamics and aging in a metallic glass probed by X-ray photon correlation spectroscopy. Phys. Rev. Lett. 2012, 109. [Google Scholar] [CrossRef]
  56. Wang, L.-M.; Liu, R.; Wang, W.H. Relaxation time dispersions in glass forming metallic liquids and glasses. J. Chem. Phys. 2008, 128. [Google Scholar] [CrossRef] [PubMed]
  57. Meyer, A.; Busch, R.; Schober, H. Time-Temperature Superposition of Structural Relaxation in a Viscous Metallic Liquid. Phys. Rev. Lett. 1999, 83, 5027–5029. [Google Scholar] [CrossRef]
  58. Qiao, J.C.; Pelletier, J.M. Dynamic universal characteristic of the main (α) relaxation in bulk metallic glasses. J. Alloys Compd. 2014, 589, 263–270. [Google Scholar] [CrossRef]
  59. Casalini, R.; Roland, C.M. Aging of the secondary relaxation to probe structural relaxation in the glassy state. Phys. Rev. Lett. 2009, 102. [Google Scholar] [CrossRef]
  60. Berry, B.S.; Pritchet, W.C.; Tsuei, C.C. Discovery of an internal-friction peak in the metallic glass Nb3Ge. Phys. Rev. Lett. 1978, 41, 410–413. [Google Scholar] [CrossRef]
  61. Berry, B.S.; Pritchet, W.C. Hydrogen related internal friction peaks in metallic glasses. Scr. Mater. 1981, 15, 637–642. [Google Scholar] [CrossRef]
  62. Yoon, H.N.; Eisenberg, A. Dynamic mechanical properties of metallic glasses. J. Non-Cryst. Solids 1978, 29, 357–364. [Google Scholar] [CrossRef]
  63. Fukuhara, M.; Wang, X.; Inoue, A.; Yin, F. Low temperature dependence of elastic parameters and internal frictions for glassy alloy Zr55Cu30Al10Ni5. Phys. Status Solidi 2007, 1, 220–222. [Google Scholar]
  64. Kunzi, H.U.U.; Agyeman, K.; Guntherodt, H.-J. Internal friction peaks in metallic glasses. Solid State Commun. 1979, 32, 711–714. [Google Scholar] [CrossRef]
  65. Zdaniewski, W.A.; Rindone, G.E.; Day, D.E. The internal friction of glasses. J. Mater. Sci. 1979, 14, 763–775. [Google Scholar]
  66. Khonik, V.A.; Spivak, L.V. On the nature of low temperature internal friction peaks in metallic glasses. Acta Mater. 1996, 44, 367–381. [Google Scholar] [CrossRef]
  67. Egami, T.; Maeda, K.; Vitek, V. Structural defects in amorphous solids A computer simulation study. Philos. Mag. A 1980, 41, 883–901. [Google Scholar] [CrossRef]
  68. Okumura, H.; Inoue, A.; Masumoto, T. Glass transition and viscoelastic behaviors of La55Al25Ni20 and La55Al25Cu20 amorphous alloys. Mater. Trans. 1991, 32, 593–598. [Google Scholar] [CrossRef]
  69. Okumura, H.; Chen, H.S.; Inoue, A.; Masumoto, T. Sub-Tg mechanical relaxation of a La55A125Ni20 amorphous alloy. J. Non-Cryst. Solids 1991, 130, 304–310. [Google Scholar] [CrossRef]
  70. Qiao, J.; Pelletier, J.-M.; Casalini, R. Relaxation of bulk metallic glasses studied by mechanical spectroscopy. J. Phys. Chem. B 2013, 117, 13658–13666. [Google Scholar] [CrossRef] [PubMed]
  71. Wang, Z.; Yu, H.B.; Wen, P.; Bai, H.Y.; Wang, W.H. Pronounced slow beta-relaxation in La-based bulk metallic glasses. J. Phys. Condens. Matter 2011, 23. [Google Scholar] [CrossRef] [PubMed]
  72. Yu, H.B.; Samwer, K.; Wang, W.H.; Bai, H.Y. Chemical influence on β-relaxations and the formation of molecule-like metallic glasses. Nat. Commun. 2013, 4. [Google Scholar] [CrossRef] [PubMed]
  73. Chen, H.S.; Morito, N. Sub-Tg α′ relaxation in a PdCuSi glass; internal friction measurements. J. Non-Cryst. Solids 1985, 72, 287–299. [Google Scholar] [CrossRef]
  74. Evenson, Z.; Naleway, S.E.; Wei, S.; Gross, O.; Kruzic, J.J.; Gallino, I.; Possart, W.; Stommel, M.; Busch, R. β relaxation and low-temperature aging in a Au-based bulk metallic glass: From elastic properties to atomic-scale structure. Phys. Rev. B 2014, 89. [Google Scholar] [CrossRef]
  75. Okumura, H.; Inoue, A.; Masumoto, T. Heating rate dependence of two glass transitions and phase separation for a La55Al25Ni20 amorphous alloy. Acta Metall. Mater. 1993, 41, 915–921. [Google Scholar] [CrossRef]
  76. Louzguine-Luzgin, D.V.; Seki, I.; Yamamoto, T.; Kawaji, H.; Suryanarayana, C.; Inoue, A. Double-Stage glass transition in a metallic glass. Phys. Rev. B 2010, 81. [Google Scholar] [CrossRef]
  77. Cohen, Y.; Karmakar, S.; Procaccia, I.; Samwer, K. The nature of the β-peak in the loss modulus of amorphous solids. EPL 2012, 100. [Google Scholar] [CrossRef]
  78. Yu, H.B.; Samwer, K.; Wu, Y.; Wang, W.H. Correlation between belta relaxation and self-diffusion of the smallest constituting atoms in metallic glasses. Phys. Rev. Lett. 2012, 109. [Google Scholar] [CrossRef]
  79. Liu, Y.H.; Fujita, T.; Aji, D.P.B.; Matsuura, M.; Chen, M.W. Structural origins of Johari-Goldstein relaxation in a metallic glass. Nat. Commun. 2014, 5. [Google Scholar] [CrossRef] [PubMed]
  80. Morito, N.; Egami, T. Internal friction and reversible structural relaxation in the metallic glass Fe32Ni36Cr14P12B6. Acta Metall. 1984, 32, 603–613. [Google Scholar] [CrossRef]
  81. Bohonyey, A.; Kiss, L.F. A quantitative study on reversible structural relaxation of metallic glasses. J. Phys. Condens. Matter 1999, 3, 4523–4531. [Google Scholar] [CrossRef]
  82. Pineda, E.; Bruna, P.; Ruta, B.; Gonzalez-Silveira, M.; Crespo, D. Relaxation of rapidly quenched metallic glasses: Effect of the relaxation state on the slow low temperature dynamics. Acta Mater. 2013, 61, 3002–3011. [Google Scholar] [CrossRef]
  83. Kiss, S.; Posgay, G.; Harangozo, I.Z.; Kedves, F.J. Structural relaxation and crystallization of FeB and NiP metallic glasses followed by internal friction and modulus measurements. J. Phys. 1981, 42, C5:529–C5:534. [Google Scholar] [CrossRef]
  84. Hettwer, K.J.; Haessner, F. Influence of heat treatment on the internal friction of metglas Fe32Ni36Cr14P12B6. Mater. Sci. Eng. 1982, 52, 147–154. [Google Scholar] [CrossRef]
  85. Hausch, G. Internal Friction and Ultrasonic Attenuation in Solids; University of Tokyo Press: Tokyo, Japan, 1977; p. 265. [Google Scholar]
  86. Morito, N.; Egami, T. Internal friction of a glassy metal Fe32Ni36Cr14P12B6. IEEE Trans. Magn. 1983, 5, 1898–1900. [Google Scholar] [CrossRef]
  87. Morito, N. Internal friction study on structural relaxation of a glassy metal Fe32Ni36Cr14P12B6. Mater. Sci. Eng. 1983, 60, 261–268. [Google Scholar] [CrossRef]
  88. Deng, D.; Argon, A.S. Structural relaxation and embrittlement of Cu59Zr41 and Fe80B20 glasses. Acta Metall. 1986, 34, 2011–2023. [Google Scholar] [CrossRef]
  89. Deng, D.; Argon, A.S. Analysis of the effect of aging on distributed relaxations, hardness, and embrittlement in Cu59Zr41 and Fe80B20 glasses. Acta Metall. 1986, 34, 2025–2038. [Google Scholar] [CrossRef]
  90. Olsen, N.B.; Christensen, T.; Dyre, J.C. Time-Temperature superposition in viscous liquids. Phys. Rev. Lett. 2001, 86, 1271–1274. [Google Scholar] [CrossRef] [PubMed]
  91. Pelletier, J.M.; van de Moortèle, B.; Lu, I.R. Viscoelasticity and viscosity of Pd–Ni–Cu–P bulk metallic glasses. Mater. Sci. Eng. A 2002, 336, 190–195. [Google Scholar] [CrossRef]
  92. Jeong, H.T.; Fleury, E.; Kim, W.T.; Kim, D.H.; Hono, K. Study on the Mechanical Relaxations of a Zr36Ti24Be40 Amorphous Alloy by Time-Temperature Superposition Principle. J. Phys. Soc. Jpn. 2004. [Google Scholar] [CrossRef]
  93. Jeong, H.T.; Kim, J.-H.; Kim, W.T.; Kim, D.H. The mechanical relaxations of a Mm55Al25Ni10Cu10 amorphous alloy studied by dynamic mechanical analysis. Mater. Sci. Eng. A 2004, 385, 182–186. [Google Scholar] [CrossRef]
  94. Guo, L.; Wu, X.; Zhu, Z. Mechanical relaxation studies of α and slow β processes in Nd65Fe15Co10Al10 bulk metallic glass. J. Appl. Phys. 2011, 109. [Google Scholar] [CrossRef]
  95. Ngai, K.L.; Capaccioli, S. Relation between the activation energy of the Johari-Goldstein belta relaxation and Tg of glass formers. Phys. Rev. E 2004, 69. [Google Scholar] [CrossRef]
  96. Wang, W.H. Correlation between relaxations and plastic deformation, and elastic model of flow in metallic glasses and glass-forming liquids. J. Appl. Phys. 2011, 110. [Google Scholar] [CrossRef]
  97. Liu, X.F.; Zhang, B.; Wen, P.; Wang, W.H. The slow β-relaxation observed in Ce-based bulk metallic glass-forming supercooled liquid. J. Non-Cryst. Solids 2006, 352, 4013–4016. [Google Scholar] [CrossRef]
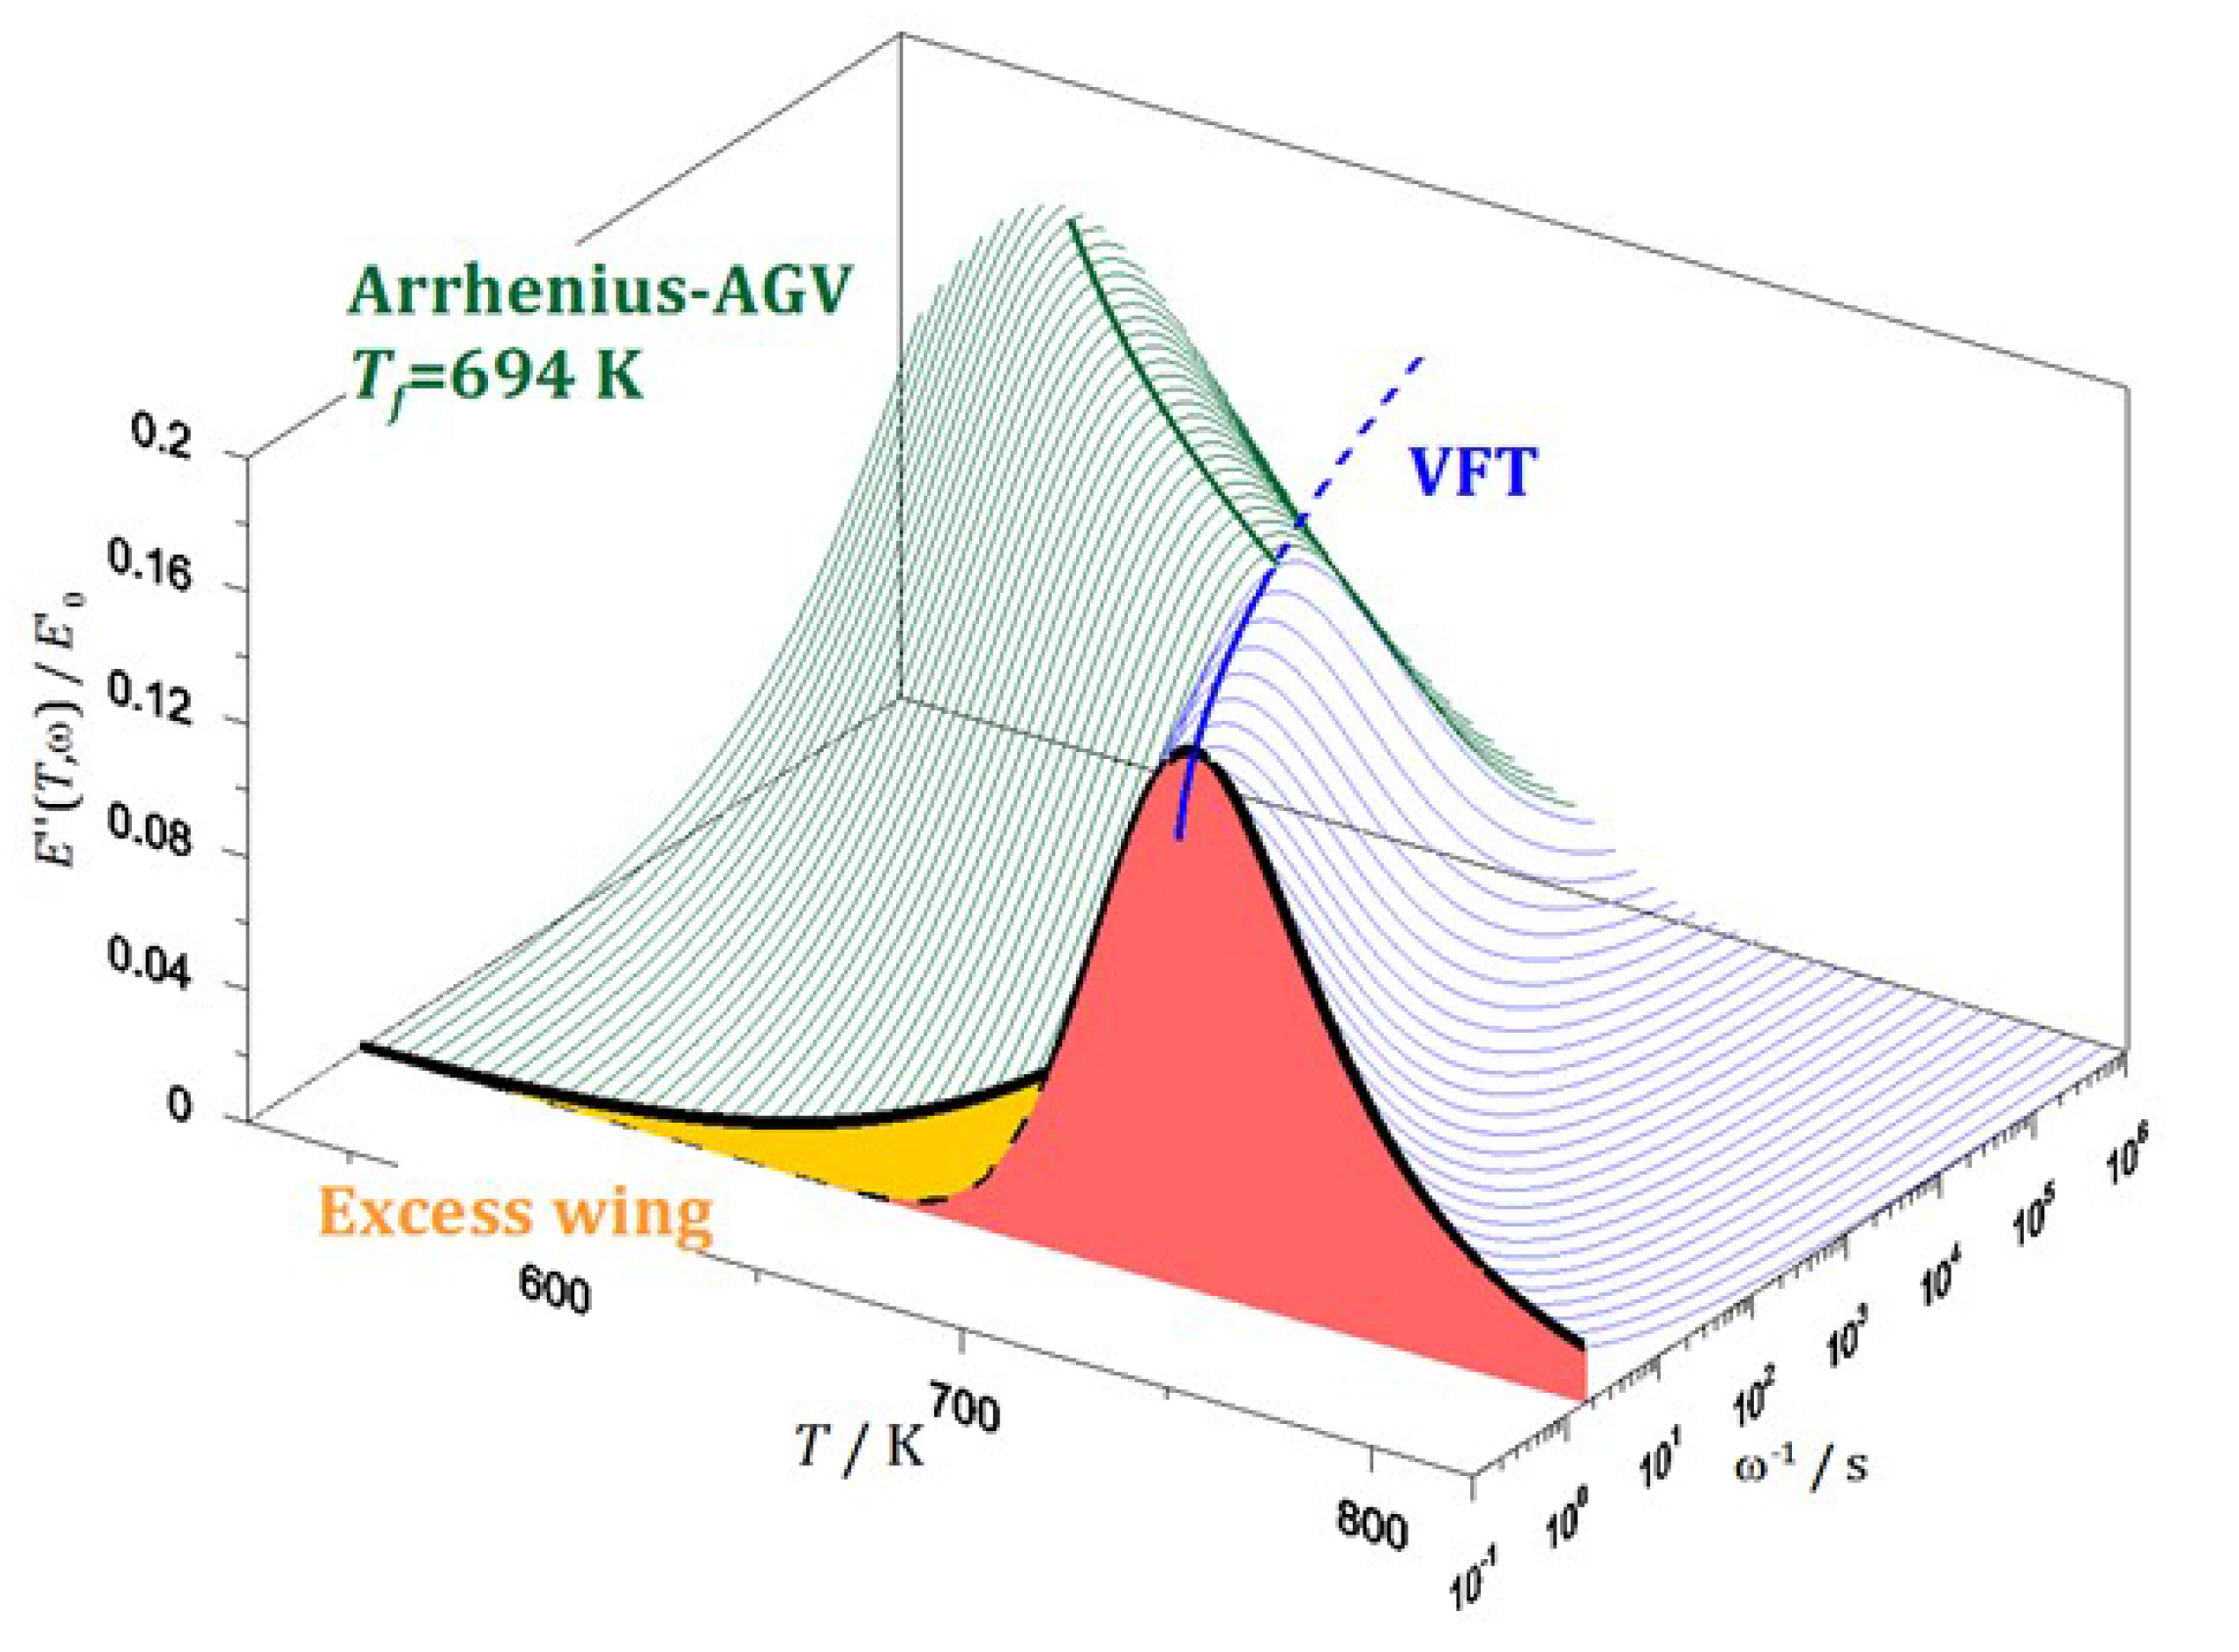
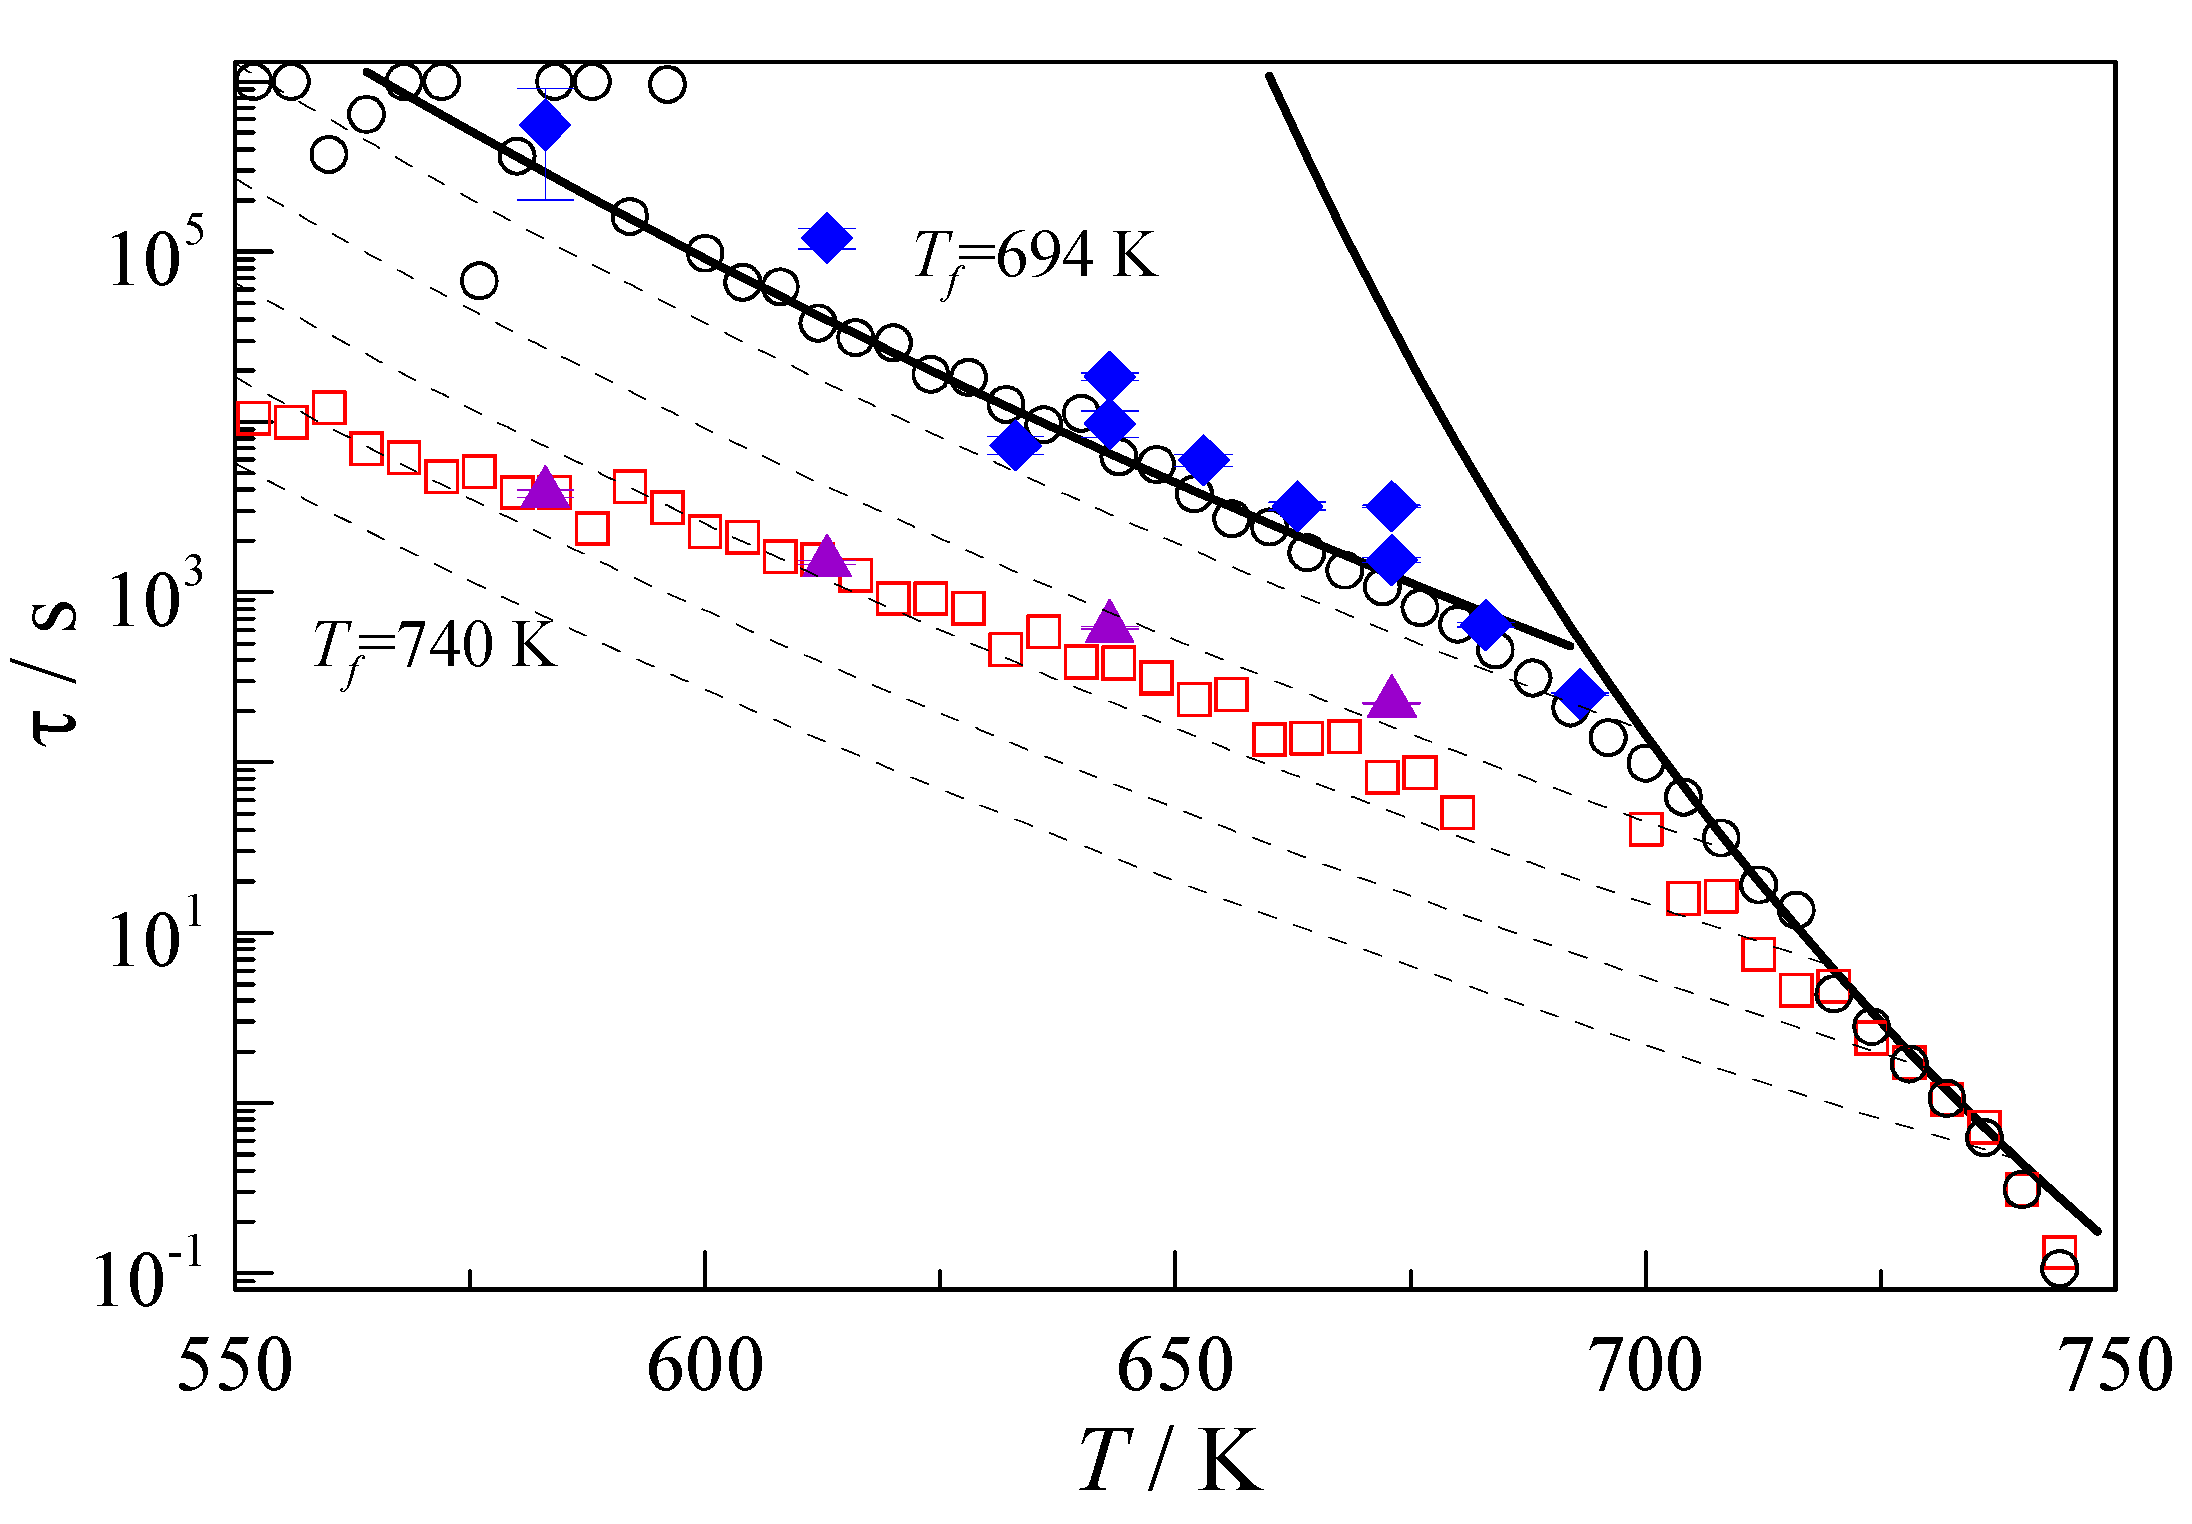
  98. Wang, W.H.; Wen, P.; Liu, X.F. The excess wing of bulk metallic glass forming liquids. J. Non-Cryst. Solids 2006, 352, 5103–5109. [Google Scholar] [CrossRef]
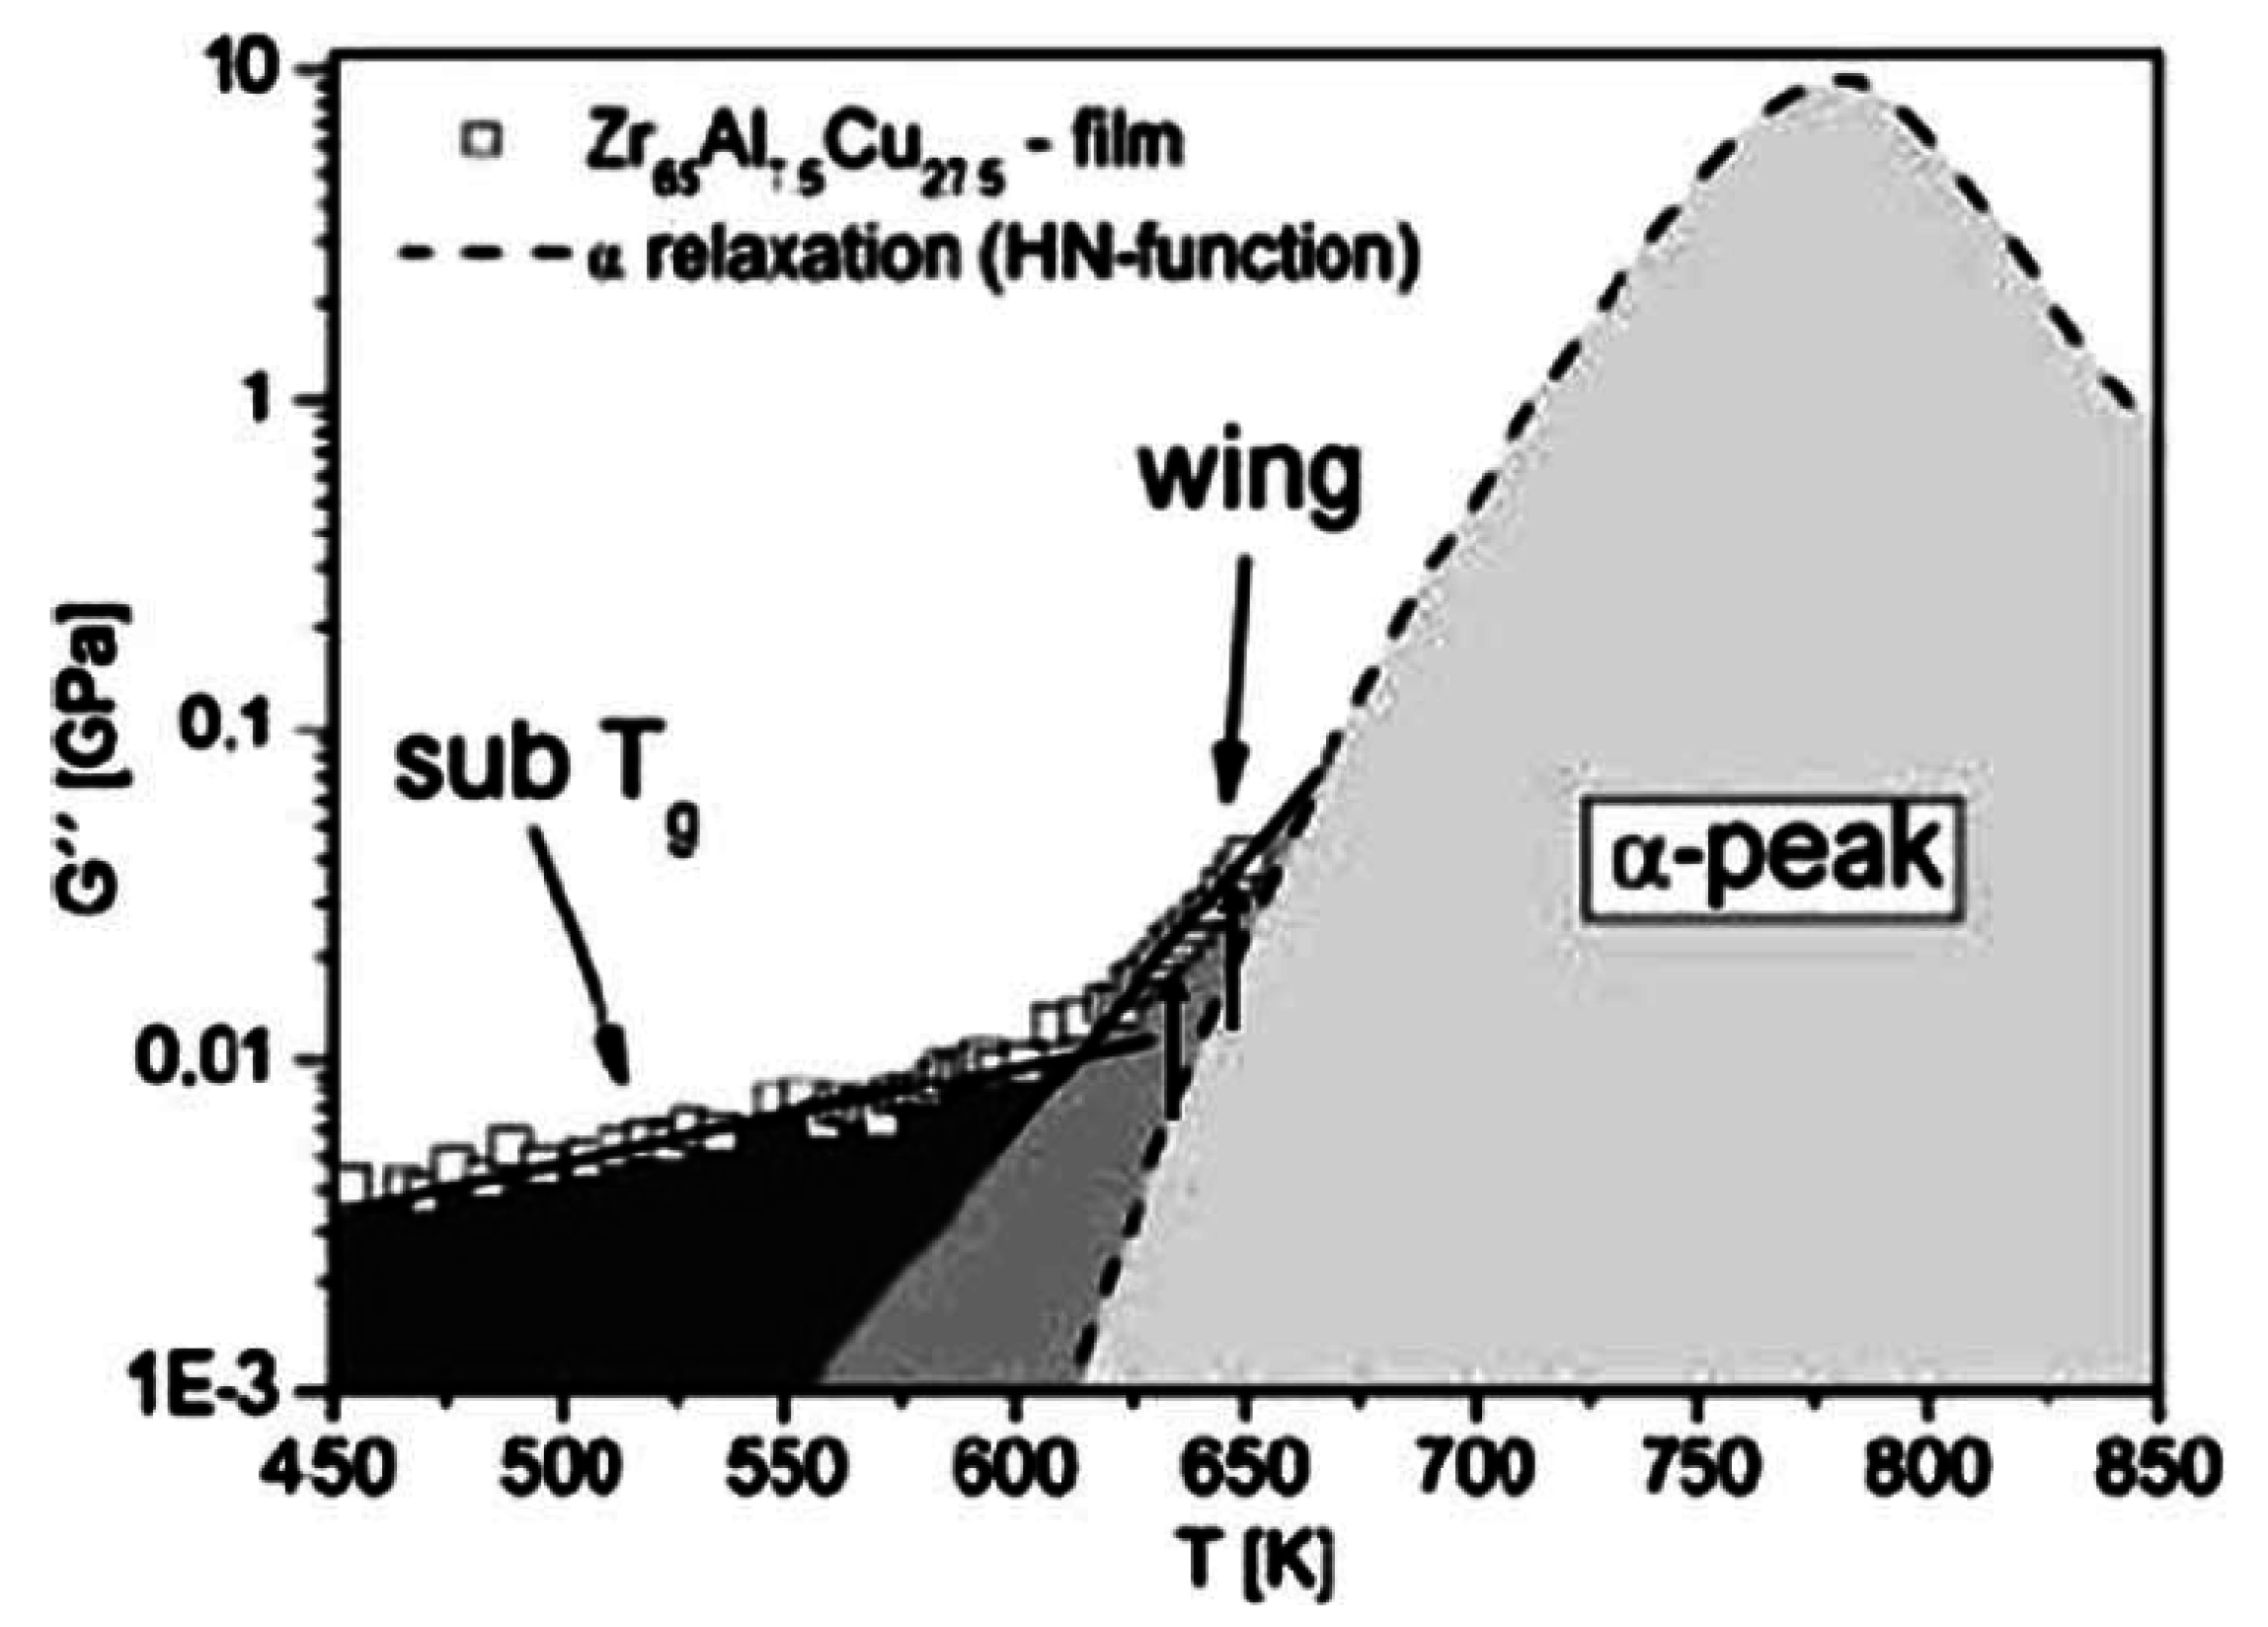
  99. Rosner, P.; Samwer, K.; Lunkenheimer, P. Indications for an excess wing in metallic glasses from the mechanical loss modulus in Zr65Al7.5Cu27.5. Europhys. Lett. 2004, 68, 226–232. [Google Scholar] [CrossRef]
  100. Hachenberg, J.; Bedorf, D.; Samwer, K.; Richert, R.; Kahl, A.; Demetriou, M.D.; Johnson, W.L. Merging of the alpha and beta relaxations and aging via the Johari-Goldstein modes in rapidly quenched metallic glasses. Appl. Phys. Lett. 2008, 92. [Google Scholar] [CrossRef]
  101. Hachenberg, J.; Samwer, K. Indications for a slow β-relaxation in a fragile metallic glass. J. Non-Cryst. Solids 2006, 352, 5110–5113. [Google Scholar] [CrossRef]
  102. Liu, C.; Pineda, E.; Crespo, D. Characterization of mechanical relaxation in a Cu–Zr–Al metallic glass. J. Alloys Compd. 2014, in press. [Google Scholar]
  103. Ferrari, L.; Mott, N.F.; Russo, G. A defect theory of the viscosity in glass-forming liquids. Philos. Mag. A 1989, 59, 263–272. [Google Scholar] [CrossRef]
  104. Cavaille, J.Y.; Perez, J. Molecular theory for the rheology of glasses and polymers. Phys. Rev. B 1989, 39, 2411–2422. [Google Scholar] [CrossRef]
  105. Gauthier, C.; Pelletier, J.M.; David, L.; Vigier, G.; Perez, J. Relaxation of non-crystalline solids under mechanical stress. J. Non-Cryst. Solids 2000, 274, 181–187. [Google Scholar] [CrossRef]
  106. Qiao, J.C.; Pelletier, J.M. Mechanical relaxation in a Zr-based bulk metallic glass: Analysis based on physical models. J. Appl. Phys. 2012, 112. [Google Scholar] [CrossRef]
  107. Hecksher, T.; Nielsen, A.I.; Olsen, N.B.; Dyre, J.C. Little evidence for dynamic divergences in ultraviscous molecular liquids. Nat. Phys. 2008, 4, 737–741. [Google Scholar] [CrossRef]
  108. Martinez-Garcia, J.C.; Rzoska, S.J.; Drozd-Rzoska, A.; Martinez-Garcia, J. A universal description of ultraslow glass dynamics. Nat. Commun. 2013, 4. [Google Scholar] [CrossRef] [PubMed]
  109. Wang, Z.; Wen, P.; Huo, L.S.; Bai, H.Y.; Wang, W.H. Signature of viscous flow units in apparent elastic regime of metallic glasses. Appl. Phys. Lett. 2012, 101. [Google Scholar] [CrossRef]
  110. Kuršumović, A.; Scott, M.G.; Cahn, R.W. Creep recovery spectra in Fe40Ni40B20 metallic glass. Scr. Mater. 1990, 24, 1307–1312. [Google Scholar] [CrossRef]
  111. Ocelík, V.; Csach, K.; Kasardová, A.; Bengus, V.Z. Anelastic deformation processes in metallic glasses and activation energy spectrum model. Mater. Sci. Eng. A 1997, 226–228, 851–855. [Google Scholar] [CrossRef]
  112. Ju, J.D.; Jang, D.; Nwankpa, A.; Atzmon, M. An atomically quantized hierarchy of shear transformation zones in a metallic glass. J. Appl. Phys. 2011, 109. [Google Scholar] [CrossRef]
  113. Ju, J.D.; Atzmon, M. A comprehensive atomistic analysis of the experimental dynamic-mechanical response of a metallic glass. Acta Mater. 2014, 74, 183–188. [Google Scholar] [CrossRef]
  114. Xi, X.K.; Zhao, D.Q.; Pan, M.X.; Wang, W.H.; Wu, Y.; Lewandowski, J.J. Fracture of brittle metallic glasses: Brittleness or plasticity. Phys. Rev. Lett. 2005, 94. [Google Scholar] [CrossRef]
  115. Schuh, C.A.; Hufnagel, T.C.; Ramamurty, U. Mechanical behavior of amorphous alloys. Acta Mater. 2007, 55, 4067–4109. [Google Scholar] [CrossRef]
  116. Chen, M. Mechanical Behavior of Metallic Glasses: Microscopic Understanding of Strength and Ductility. Annu. Rev. Mater. Res. 2008, 38, 445–469. [Google Scholar] [CrossRef]
  117. Kahl, A.; Koeppe, T.; Bedorf, D.; Richert, R.; Lind, M.L.; Demetriou, M.D.; Johnson, W.L.; Arnold, W.; Samwer, K. Dynamical and quasistatic structural relaxation paths in Pd40Ni40P20 glass. Appl. Phys. Lett. 2009, 95. [Google Scholar] [CrossRef]
  118. Harmon, J.S.; Demetriou, M.D.; Johnson, W.L.; Samwer, K. Anelastic to plastic transition in metallic glass-forming liquids. Phys. Rev. Lett. 2007, 99. [Google Scholar] [CrossRef]
  119. Spaepen, F. Homogeneous flow of metallic glasses: A free volume perspective. Scr. Mater. 2006, 54, 363–367. [Google Scholar] [CrossRef]
  120. Spaepen, F. A microscopic mechanism for steady state inhomogeneous flow in metallic glasses. Acta Metall. 1977, 25, 407–415. [Google Scholar] [CrossRef]
  121. Johnson, W.L.; Demetriou, M.D.; Harmon, J.S.; Lind, M.L.; Samwer, K. Rheology and Ultrasonic Properties of Metallic Glass-Forming Liquids: A Potential Energy Landscape Perspective. MRS Bull. 2007, 32, 644–650. [Google Scholar] [CrossRef]
  122. Zhao, Z.F.; Wen, P.; Shek, C.H.; Wang, W.H. Measurements of slow β-relaxations in metallic glasses and supercooled liquids. Phys. Rev. B 2007, 75. [Google Scholar] [CrossRef]
  123. Yu, H.B.; Wang, W.H.; Bai, H.Y.; Wu, Y.; Chen, M.W. Relating activation of shear transformation zones to β relaxations in metallic glasses. Phys. Rev. B 2010, 81. [Google Scholar] [CrossRef]
  124. Liu, S.T.; Wang, Z.; Peng, H.L.; Yu, H.B.; Wang, W.H. The activation energy and volume of flow units of metallic glasses. Scr. Mater. 2012, 67, 9–12. [Google Scholar] [CrossRef]
  125. Pan, D.; Inoue, A.; Sakurai, T.; Chen, M.W. Experimental characterization of shear transformation zones for plastic flow of bulk metallic glasses. Proc. Natl. Acad. Sci. USA 2008, 105, 14769–14772. [Google Scholar] [CrossRef] [PubMed]
  126. Greaves, G.N.; Greer, A.L.; Lakes, R.S.; Rouxel, T. Poisson’s ratio and modern materials. Nat. Mater. 2011, 10, 823–838. [Google Scholar] [CrossRef] [PubMed]
  127. Lewandowski, J.J.; Wang, W.H.; Greer, A.L. Intrinsic plasticity or brittleness of metallic glasses. Philos. Mag. Lett. 2005, 85, 77–87. [Google Scholar] [CrossRef]
  128. Yu, H.B.; Shen, X.; Wang, Z.; Gu, L.; Wang, W.H.; Bai, H.Y. Tensile plasticity in metallic glasses with pronounced β relaxations. Phys. Rev. Lett. 2012, 108. [Google Scholar] [CrossRef]
  129. Lu, Z.; Jiao, W.; Wang, W.H.; Bai, H.Y. Flow unit perspective on room temperature homogeneous plastic deformation in metallic glasses. Phys. Rev. Lett. 2014, 113. [Google Scholar] [CrossRef]

