Article

Evaluation of Structural Stability of Materials through Mechanical Spectroscopy: Four Case Studies

Department of Industrial Engineering, University of Rome “Tor Vergata”, Via del Politecnico 1, 00133 Rome, Italy
*
Author to whom correspondence should be addressed.
Metals 2016, 6(12), 306; https://doi.org/10.3390/met6120306
Submission received: 28 September 2016 / Revised: 18 November 2016 / Accepted: 30 November 2016 / Published: 5 December 2016

Abstract

:
Microstructural stability is one of the utmost important requirements for metallic materials in engineering applications, particularly at high temperatures. The paper shows how Mechanical Spectroscopy (MS) (i.e., damping and dynamic modulus measurements) permits the monitoring of the evolution of lattice defects, porosity, and cracks which strongly affect the mechanical behavior of metals and sometimes lead to permanent damage. For this purpose, some applications of the technique to different metals and alloys (AISI 304 stainless steel, PWA 1483 single crystal superalloy, nanostructured FeMo prepared via SPS sintering and tungsten) of engineering interest are presented. These experiments have been carried out in lab conditions using bar-shaped samples at constant or increasing temperatures. The results can be used to orient the interpretation of frequency and damping changes observed through other instruments in components of complex shape during their in-service life.

1. Introduction

Mechanical Spectroscopy (MS) provides damping and dynamic modulus of a material under different conditions of strain and temperature. Principles and applications of the technique are exhaustively described in some classical texts [1,2].
MS is commonly employed for investigating physical phenomena but can be very useful also for solving practical problems related to industrial processes, such as the determination of the amount of carbon, oxygen, nitrogen, and hydrogen in solid solution in steels and other metals; the monitoring of precipitation and ordering in metallic alloys; the identification of superplastic regime; and the characterization of magnetoelastic effects. Recently, this technique has been also used by some of the present authors to study the mechanical instability of metals taking place in a temperature range before melting (e.g., see [3]).
The focus of this paper is on the microstructural stability of metals and their monitoring by means of MS tests carried out at constant or increasing temperatures. Microstructural changes can be at the origin of malfunction of mechanical components during their in-service life; for some complex systems—such as aircraft, bridges, offshore platforms, and structural parts of nuclear reactors—the existence and the evolution of damage may cause catastrophic failures.
The presence of structural damage in engineering systems has been largely investigated on the basis of modification of the vibration modes (natural frequencies, mode shapes, and damping) and important results have been achieved (e.g., see Ref. [4,5,6]). In the past, MS was applied to the detection of absorbed hydrogen in steel components that can induce stress corrosion cracking and unpredictable brittle fractures [7]. The technique proved to be very effective because the amplitude of forced vibrations is dampened by the absorption of hydrogen, and the amplitude change can be correlated to the hydrogen content.
This paper aims to demonstrate that MS can be used in a much wider range of defect analysis. In particular, it permits high sensitivity detection of the evolution of dislocation structures, cell and grain growth, and porosity and cracks which strongly affect the mechanical behavior of metals and sometimes lead to permanent damage.
The reported results were obtained in experiments with bar-shaped samples (60 mm × 7 mm × 0.5 mm) excited by flexural vibrations and operating in conditions of resonance (frequencies in the range of kHz). The VRA 1604 apparatus (CANTIL Srl, Bologna, Italy) has been described in detail in [8].
The damping factor (Q−1) was determined from the logarithmic decay of flexural vibrations while the dynamic modulus E from the resonance frequency f:
E = 48 π 2 L 4 ρ m 4 h 2 f 2 ,
where m is a constant (m = 1.875), ρ the material density, L and h are the length and thickness of the sample, respectively. Some experiments have been carried out at constant temperature, others at increasing temperature with a heating rate of 1 °C/min (cases 2, 3, 4) and 5.6 °C/min (case 1).
To illustrate how the MS technique can be usefully employed for monitoring the mechanical stability of metals, four cases regarding different metals (AISI 304 stainless steel, PWA 1483 single crystal superalloy, nano-structured FeMo prepared via SPS sintering and tungsten) are presented.

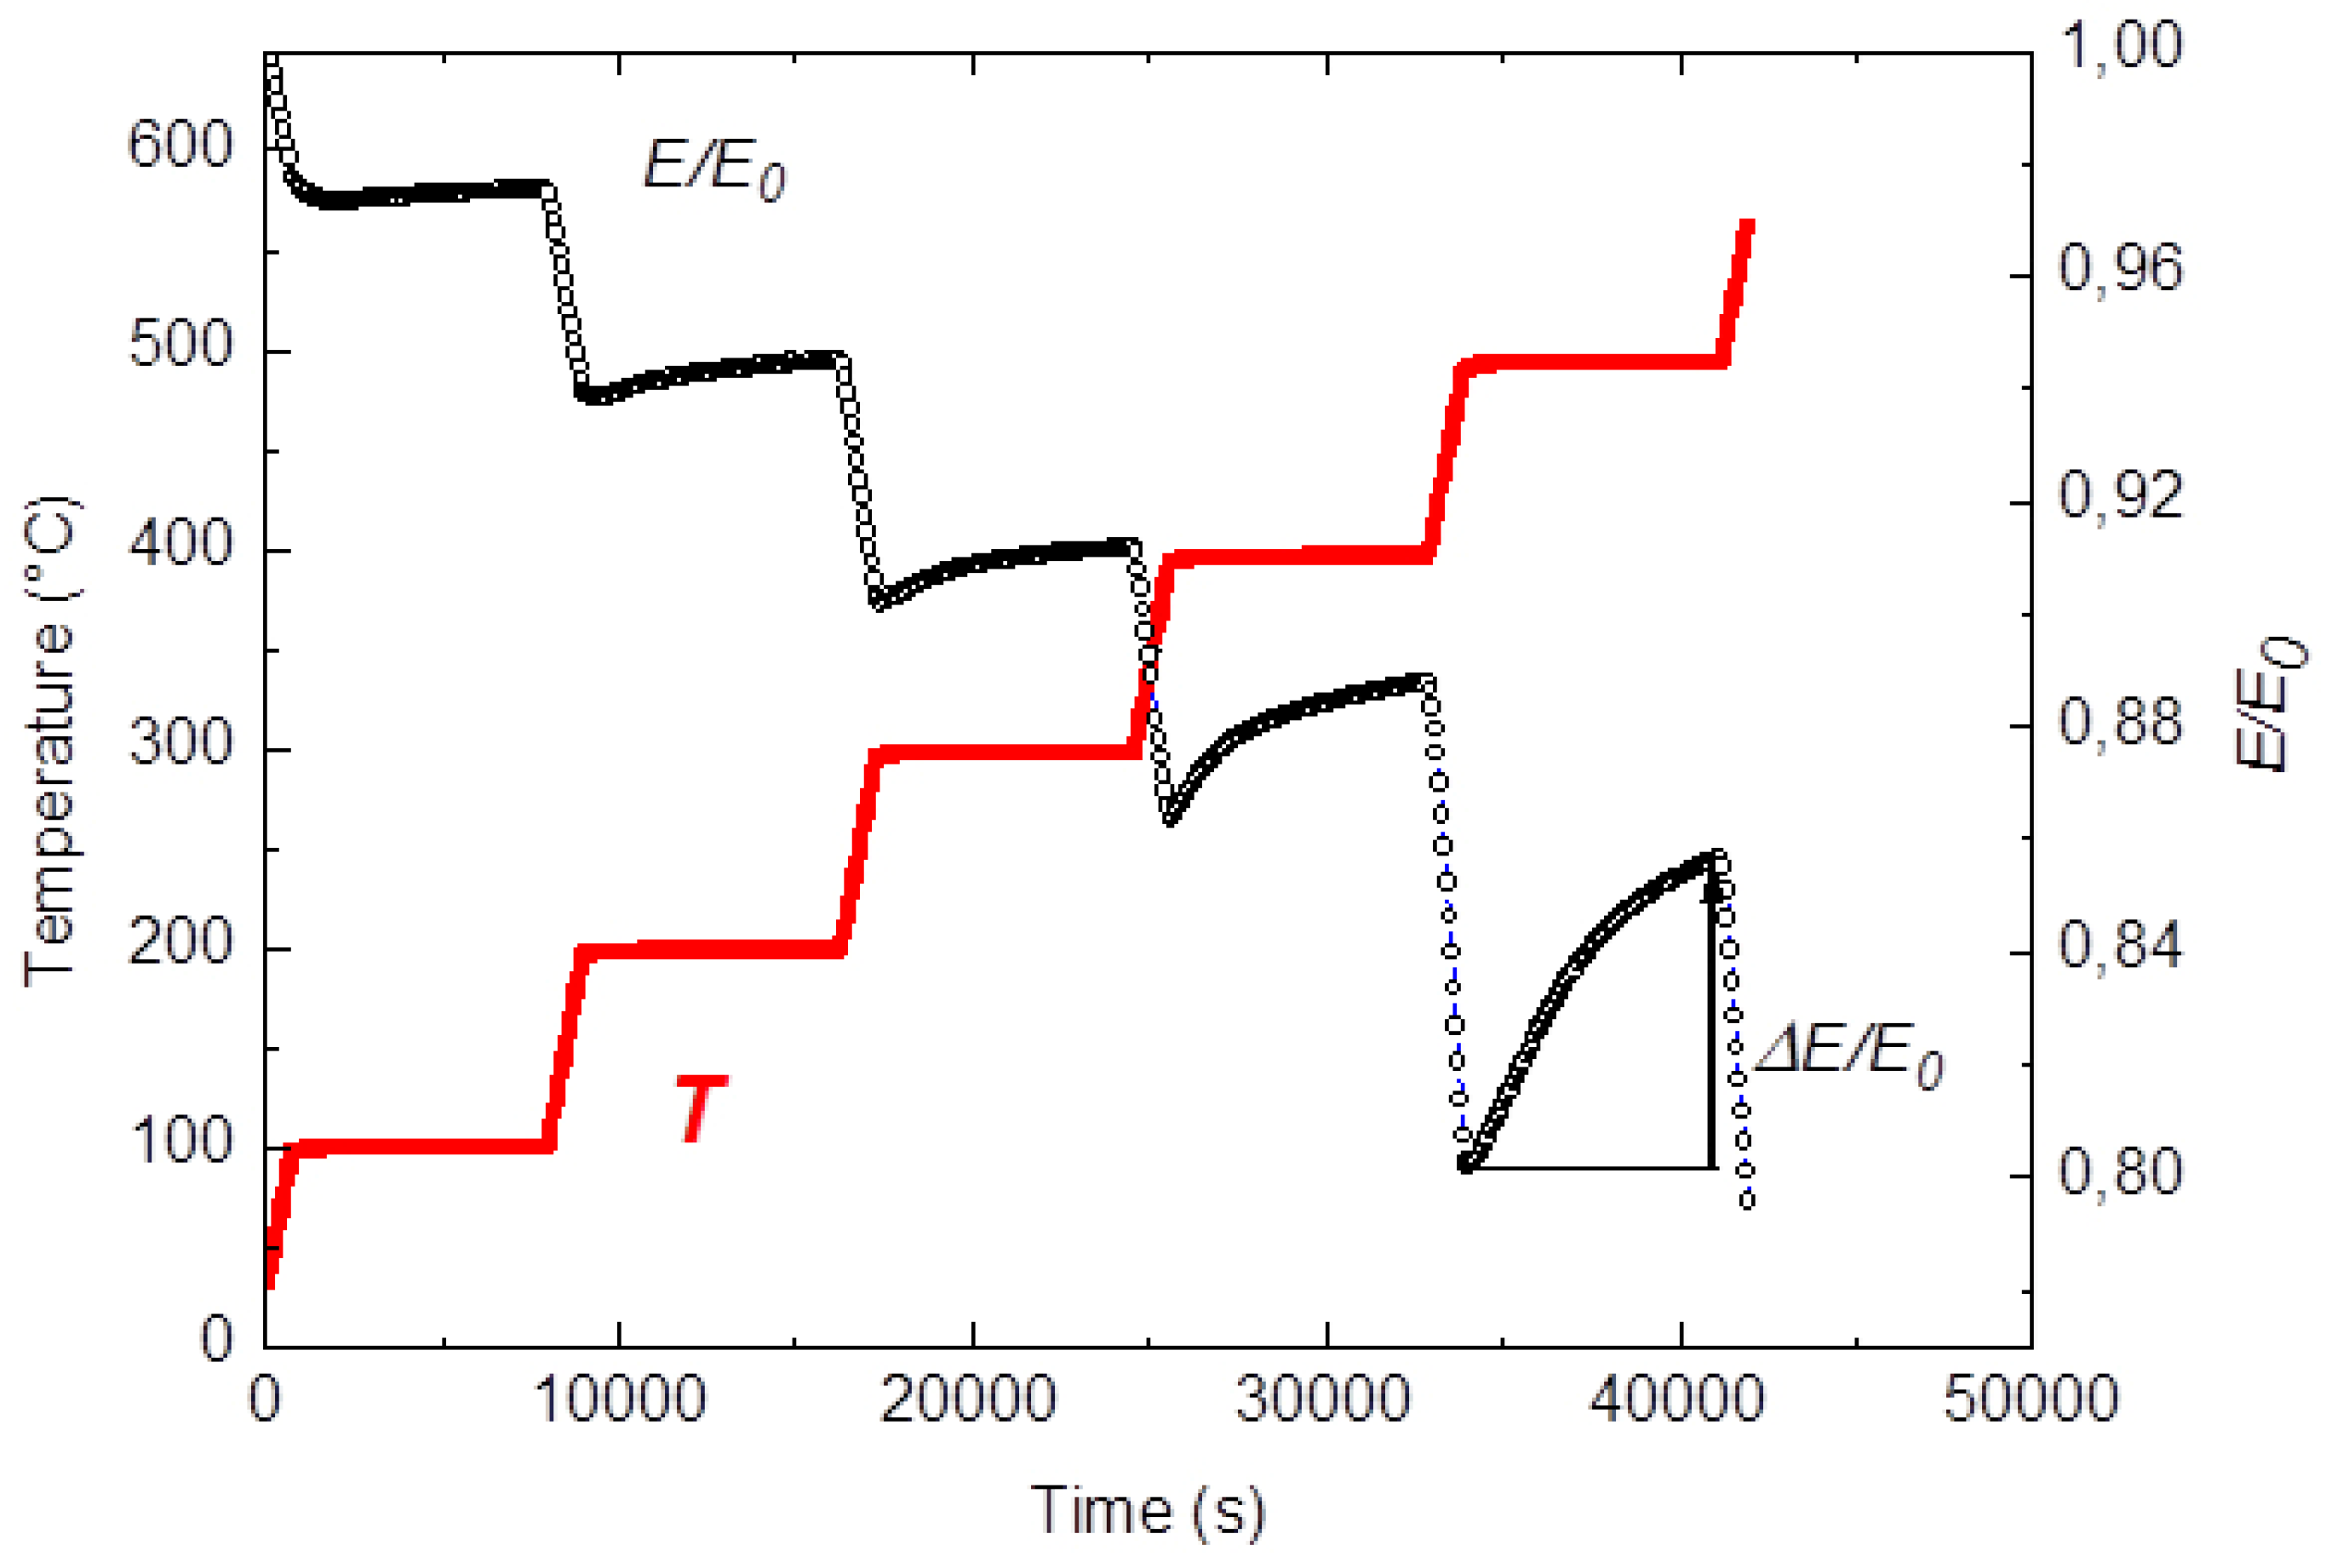
2. Case 1—AISI 304 Steel: Isothermal Change of Dynamic Modulus E and Q−1

In Figure 1, dynamic modulus E—normalized to its initial value E0—is plotted vs. time in successive isothermal treatments of 2 h at increasing temperature T (steps of 100 °C). The temperature curve is displayed in red color.
As expected, the modulus progressively decreases with temperature owing to anharmonicity effects. However, an increase can be observed during each isothermal step: higher the temperature, larger the modulus variation. For the sake of clarity, the relative change of modulus ∆E/E during the step at 500 °C is evidenced in Figure 1. Such changes are strictly related to microstructure evolution, in particular the density of dislocations and the mean length of dislocation segments play a fundamental role. At low frequencies, i.e., in kHz range, the Granato-Lücke string model for dislocation damping [2], predicts the following relationships:
Q 1 ξ . l 4 ω ,
Δ G G β ξ . l 2 ,
where β = 1.666 is a constant, ξ the dislocation density, l the mean length between dislocation pinning points, and ω/2π the vibration frequency. G is the shear modulus in absence of dislocations while ∆G is the difference between the modulus with and without dislocations. Although Equation (3) refers to G, the same effect occurs also for the modulus E because longitudinal deformation may be analyzed into pure shear plus hydrostatic deformation and
E = 2 ( 1 + ν ) G ,
with ν being the Poisson’s ratio.
Through X-ray diffraction (XRD), the dislocation density ξ has been determined after each stage at increasing temperatures. High precision peak profiles were collected with 2Θ steps of 0.005° and counting time per step of 5 s, the mean micro-strain ε has been determined from the most intense reflection [9], then the dislocation density ξ has been calculated by means of the Williamson-Smallman relationship [10]:
ξ = Ξ ε 2 / k 0 b 2 ,
with Ξ = 16 being a constant, b = 0.253 nm the modulus of Burgers vector, and k0 ≅ 1 a factor depending on dislocation interaction.
The ξ values reported in Table 1 show that the dislocation density does not substantially vary up to 300 °C and slightly decreases from 400 °C upwards.
According to Equations (2) and (3), the mean length of dislocation segments l at increasing temperature has been calculated on the basis of ∆E/E determined from MS test and ξ measured by XRD. The results in Table 1 indicate a relevant increase of l with temperature that can be explained as a progressive depinning efficiency of dislocations from interstitial atoms (C and N) and other obstacles.
The phenomenon is highlighted by Figure 2 displaying the Q−1 and E curves of the steel during an isothermal heat treatment at 400 °C for 20 h.
Both modulus and damping exhibit an asymptotical behavior: Q−1 progressively decreases vs. time while E has an opposite trend. From the modulus change ∆E/E = 0.05 the mean length of dislocation segments l results to be 447 nm. The asymptotical trend of both curves depends on the equilibrium reached by the dislocation structure after a long time of treatment at the same temperature; depinning from stronger obstacles requires higher energy and thus a higher temperature.

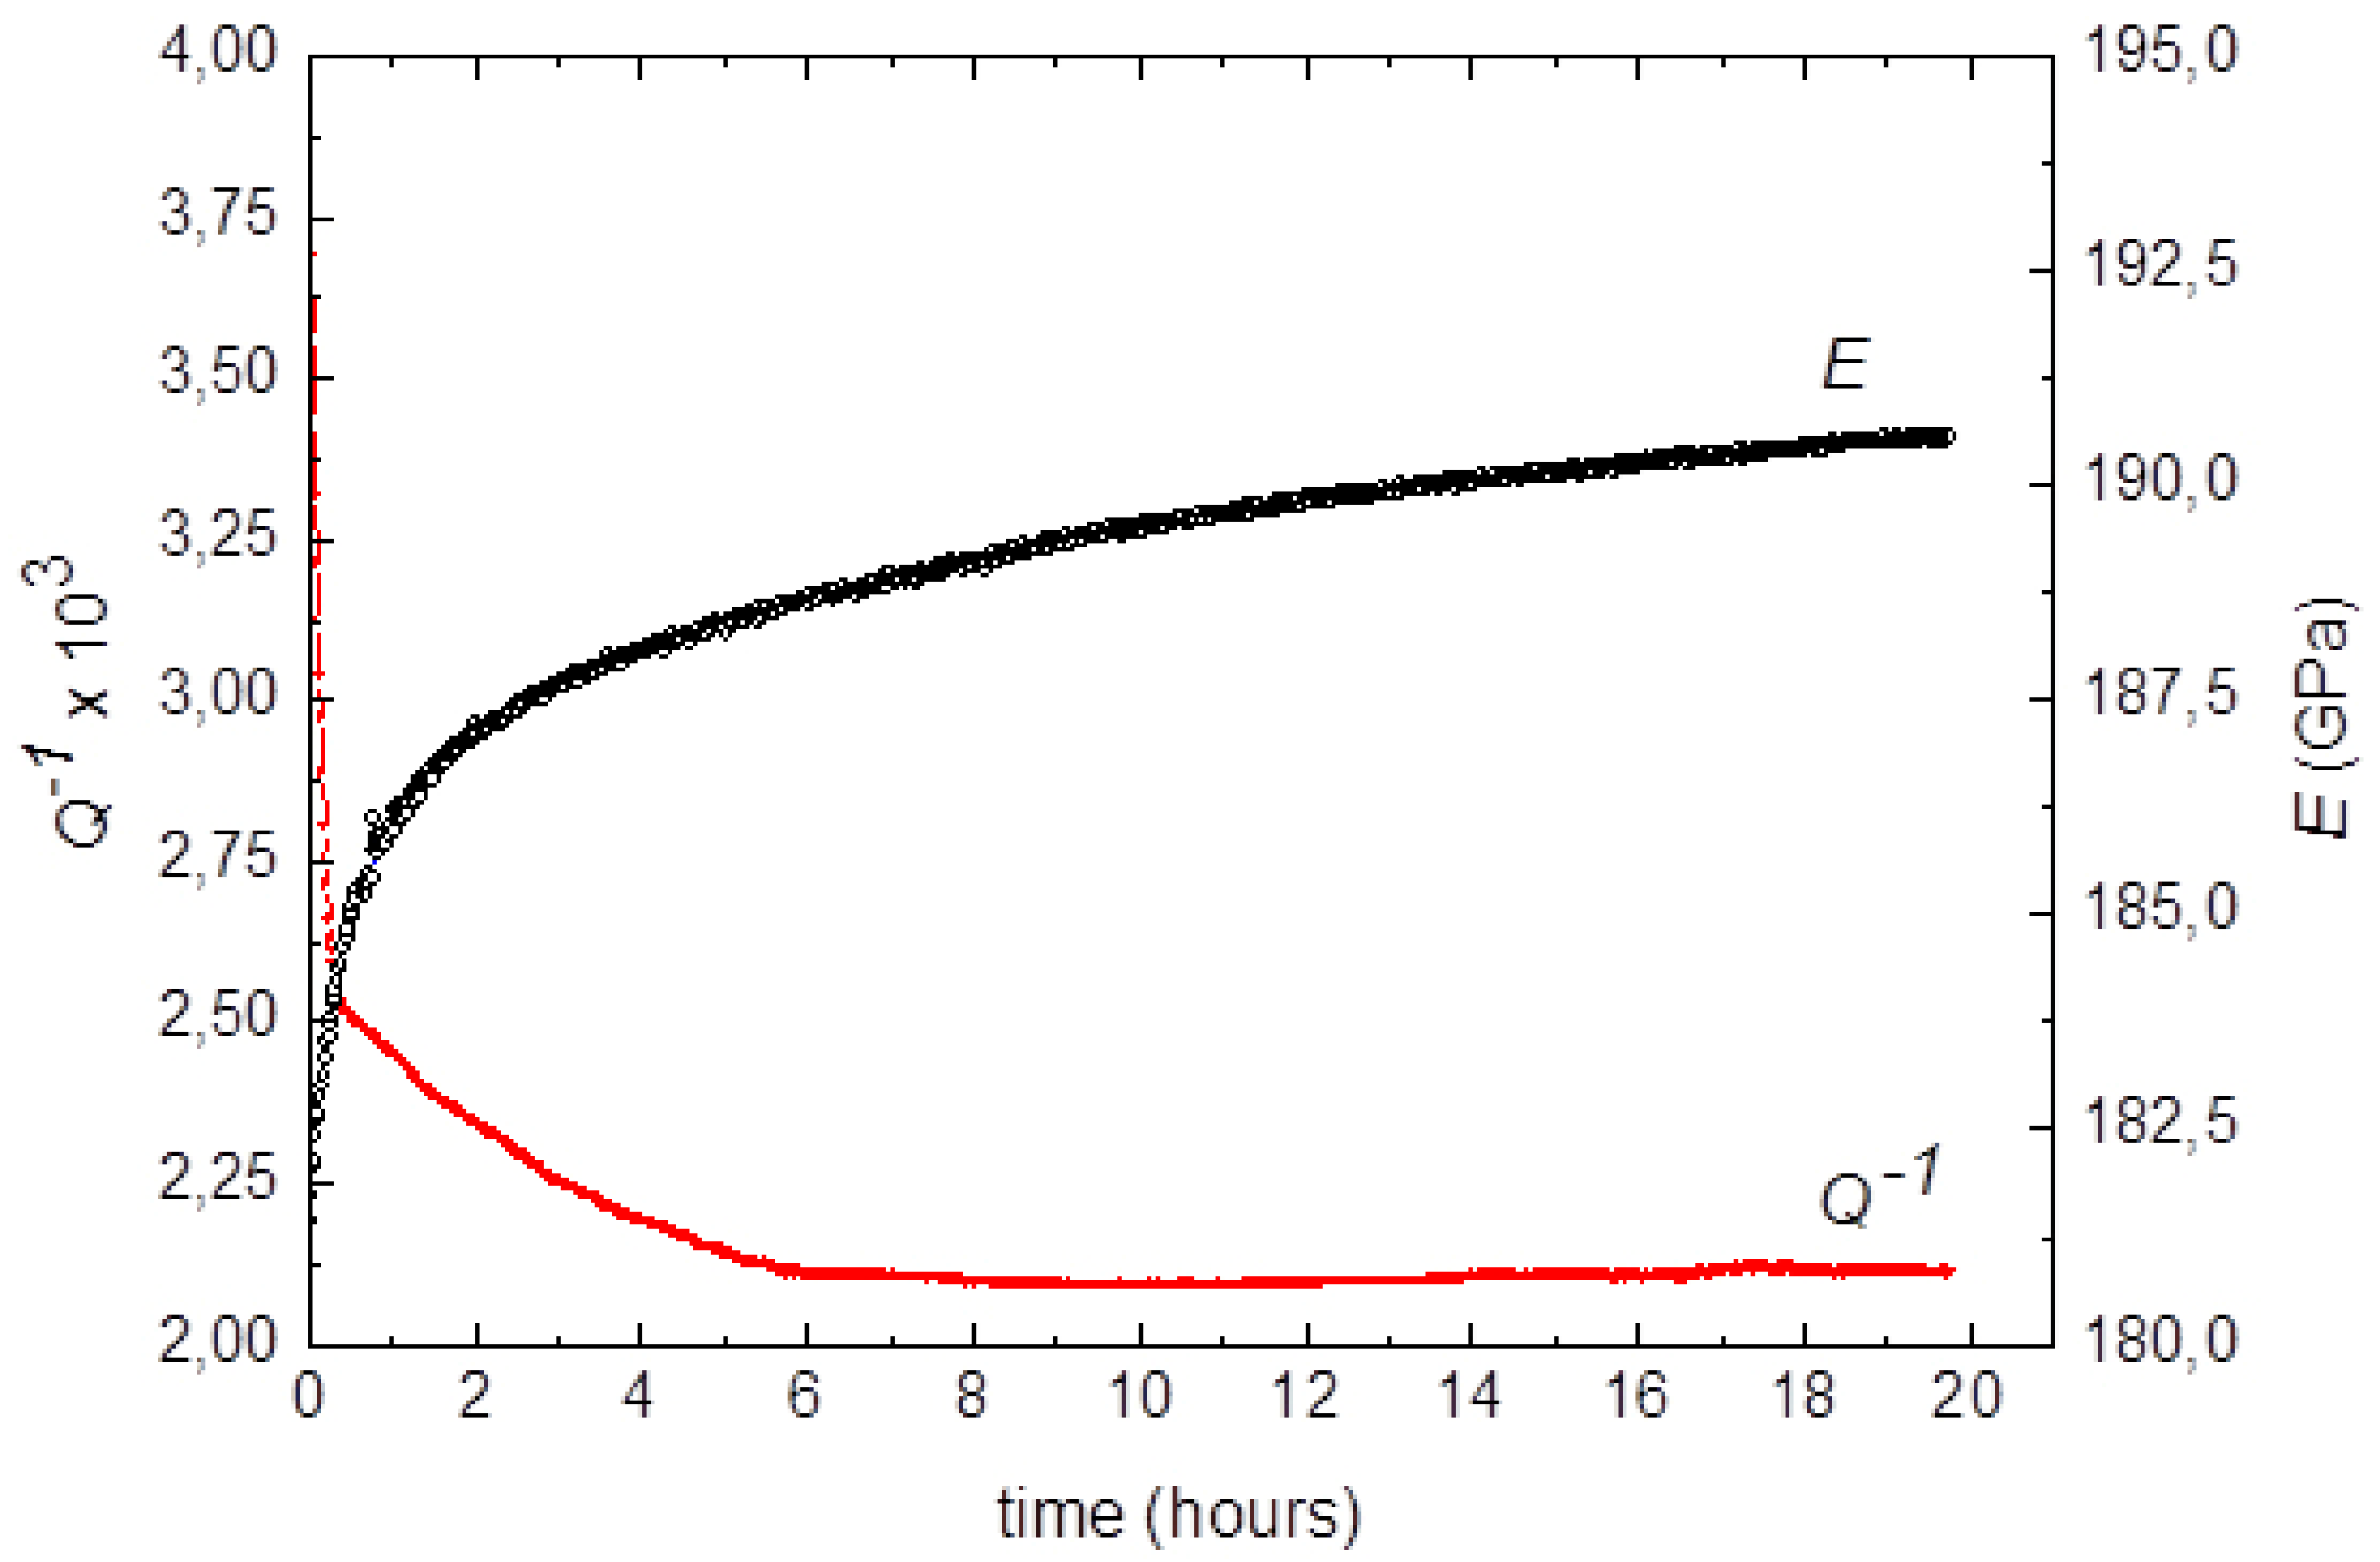
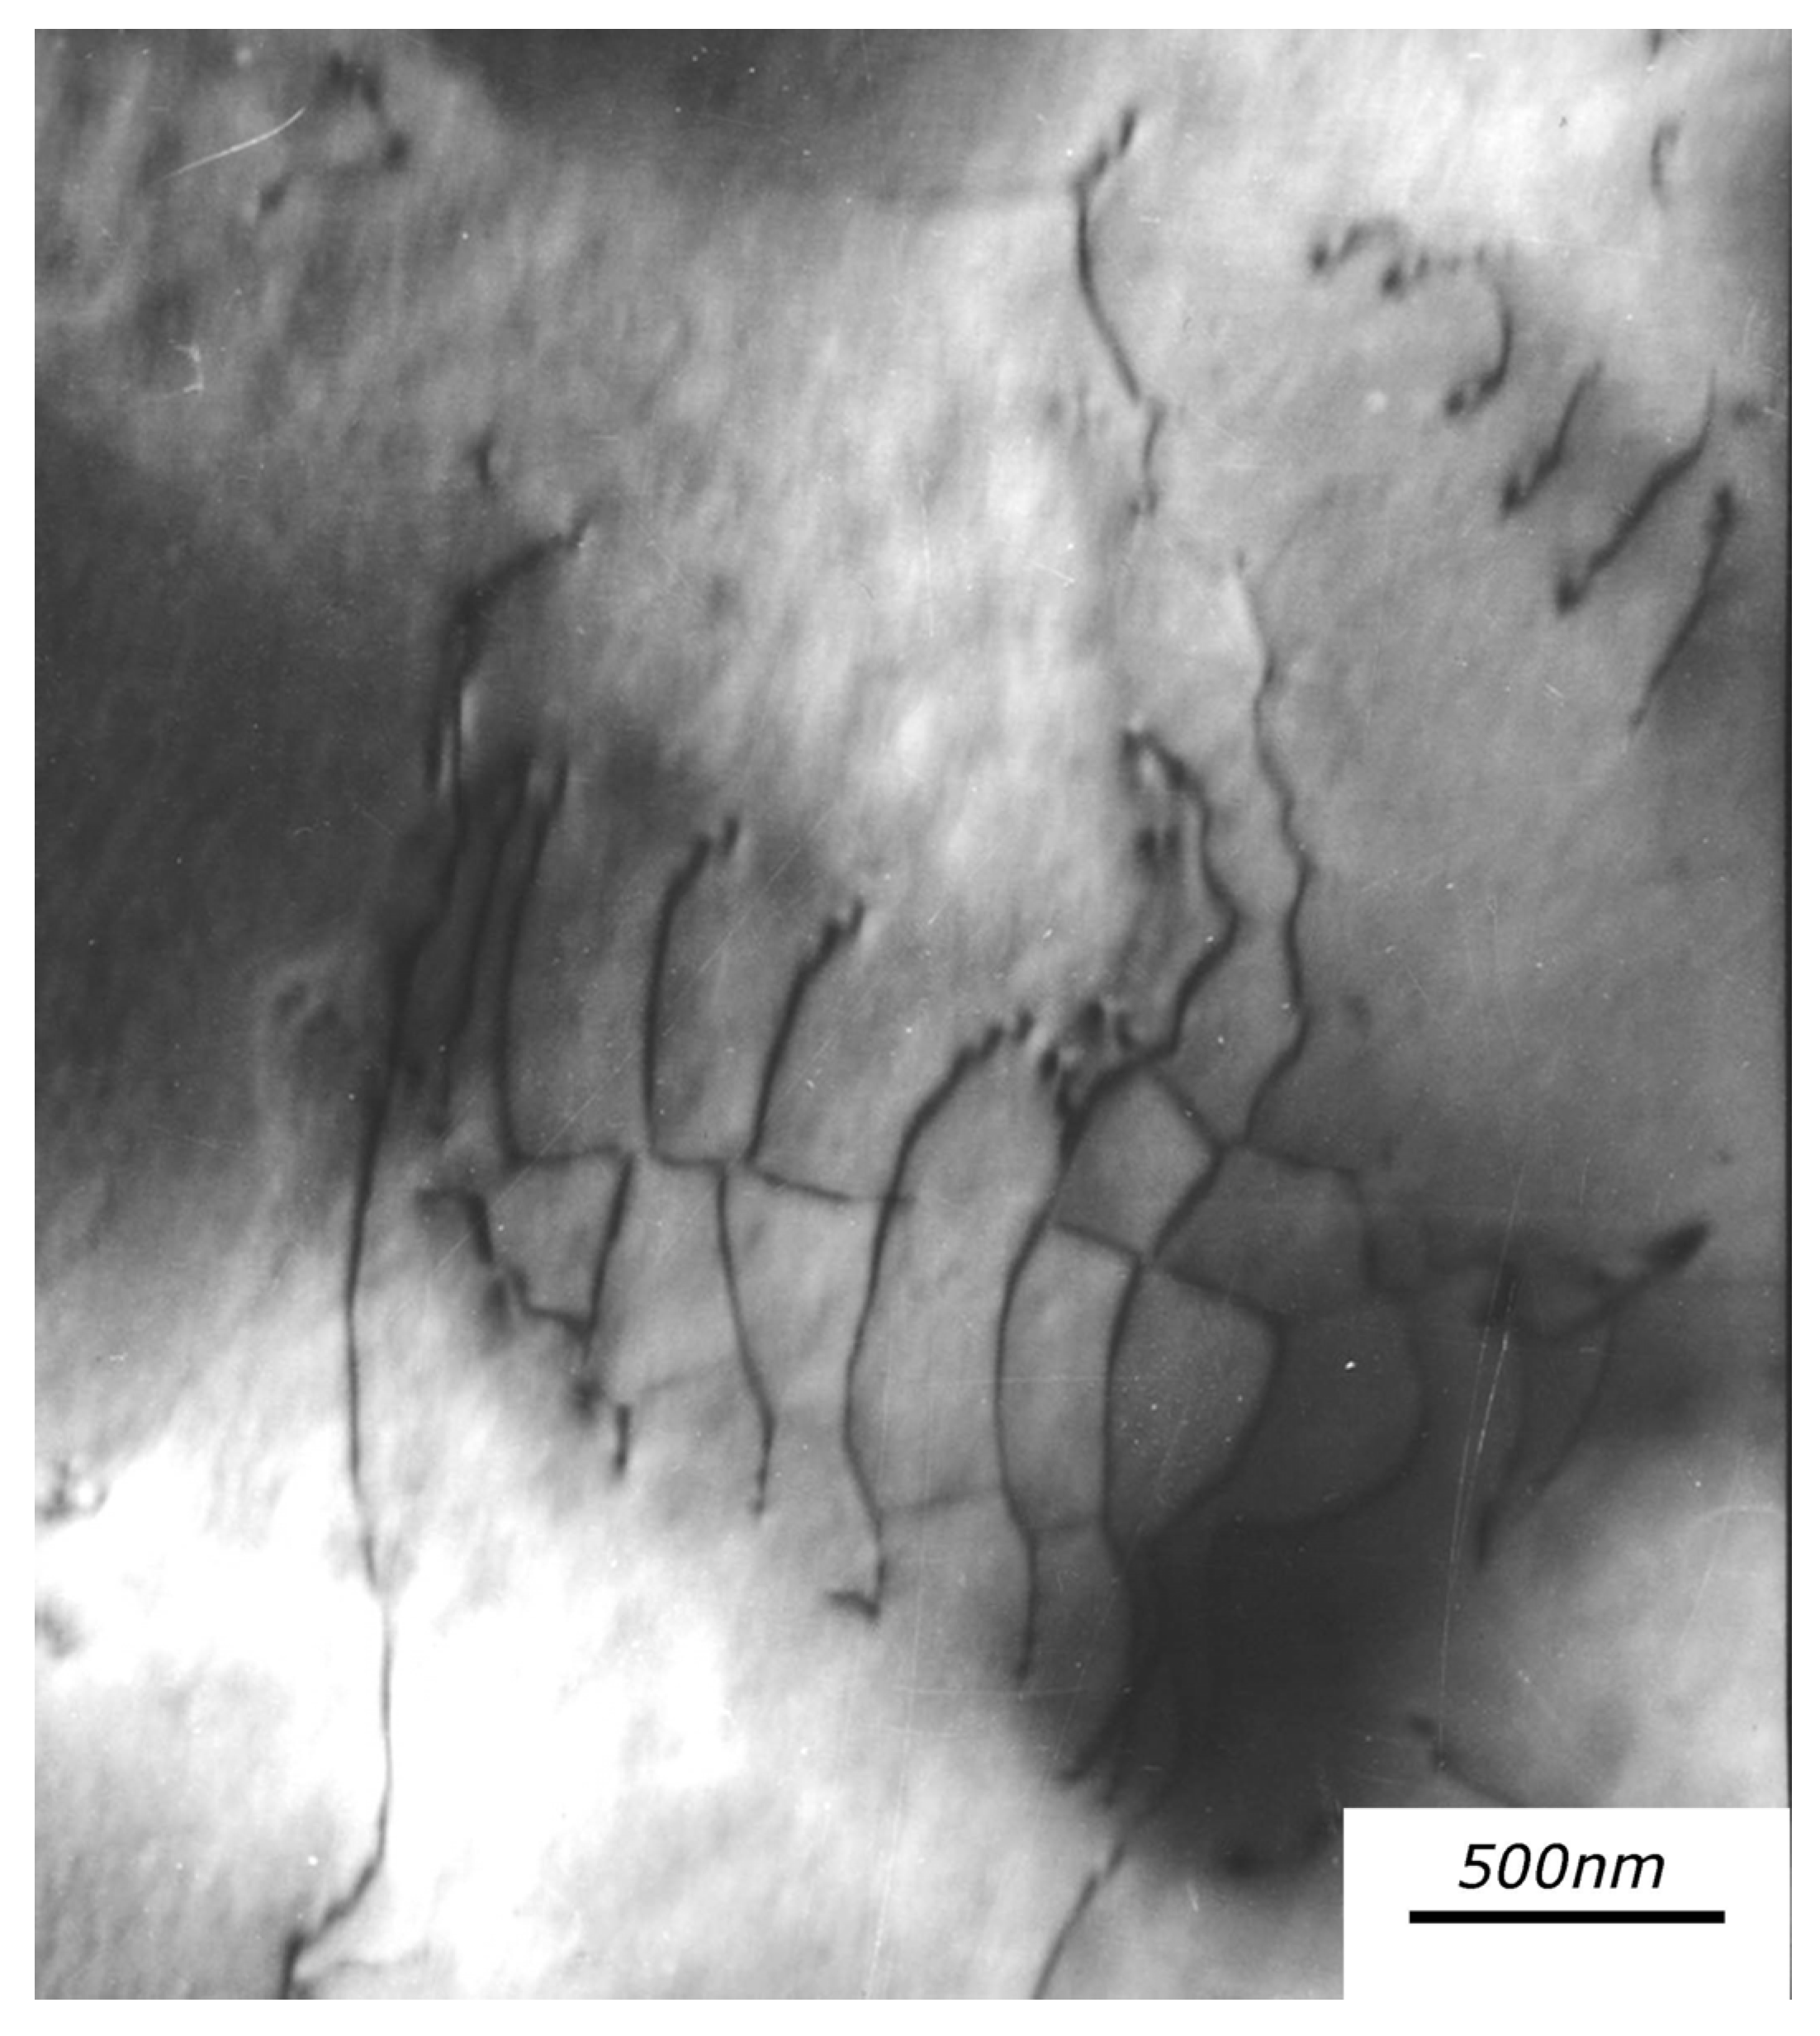
3. Case 2—PWA 1483 Superalloy: Recovery of Dislocation Structures in PFZ

PWA 1483 is a single crystal Ni base superalloy used for blades of jet-engines: the matrix of γ phase hosts the ordered γ′ phase, whose particles have the typical cube shape and an average size of about 1 μm (Figure 3a). The γ′ phase has a substantially homogeneous distribution with channels of ~100 nm between the particles; some particle-free zones (PFZ) with size of 1–2 μm can be observed in the matrix. TEM observations evidenced the presence of dislocation networks inside PFZ such as that shown in Figure 3b.
In successive MS test runs (heating to 800 °C/cooling to room temperature) on the same sample, a Q−1 maximum (M1) has been observed. Its position does not depend on the resonance frequency and randomly changes in each run while its intensity tends to decrease. Sometimes, M1 is accompanied by another maximum (M2) at lower temperature (~250 °C) and of lower intensity. After some test runs, Q−1 maxima disappear. In correspondence of Q−1 maxima, the modulus shows a slow decrease followed by a sharp increase.
These results, illustrated in Figure 4a, are compatible with an irreversible microstructural transformation taking place in successive steps giving rise to Q−1 maxima [11]. When the transformation has been completed, the structure is stable and the maxima are no more observed. At the end of each test run the modulus at room temperature is higher than the original one while Q−1 is lower. The variations of E and Q−1 occur mainly in the first runs, then negligible changes are observed (Figure 4b); after stabilization modulus has increased of ~4% with respect the original value. The trends of Q−1 and E0 in successive test runs confirm an irreversible microstructural evolution occurring by steps because they progressively change and finally tend to constant values when transformation has been completed.
Such phenomena are connected to the growth of cells forming the dislocation networks of PFZ, which are not observed after some cycles of heating and cooling. Such growth occurs by coalescence and the process requires that the walls dividing the cells merging together disappear. For example, Figure 5 displays the evolution of a network of dislocations in a PFZ after two MS test runs. The dislocation network is less defined than in the original material (Figure 3b) and some single dislocations can be observed.
When a wall breaks up, the dislocations forming the wall become free and are able to give their contribution to the damping, thus the dislocation density ξ increases determining the initial modulus decrease and the ascending part of a Q−1 maximum (Equations (2) and (3)). When dislocations rearrange in the walls of the new cell of a larger size they cannot contribute to damping so modulus increases and Q−1 decreases (descending part of maximum). Cell growth ends when the cells reach a size comparable to that of the corresponding PFZ. At that point the material has a stable microstructure which cannot be further modified by successive heat cycling.
The scientific literature is rich of papers focused on instability phenomena occurring in superalloys at very high temperatures such as Ostwald ripening of γ′ phase and raftening. The present study evidenced that the microstructure of the PWA 1483 superalloy exhibits early instability phenomena at temperatures well below the working one (~1100 °C). Therefore, the material needs a suitable stabilization heat treatment before to be put in service. Recently, similar results have been also found by investigating the directionally solidified IN792 superalloy [12].

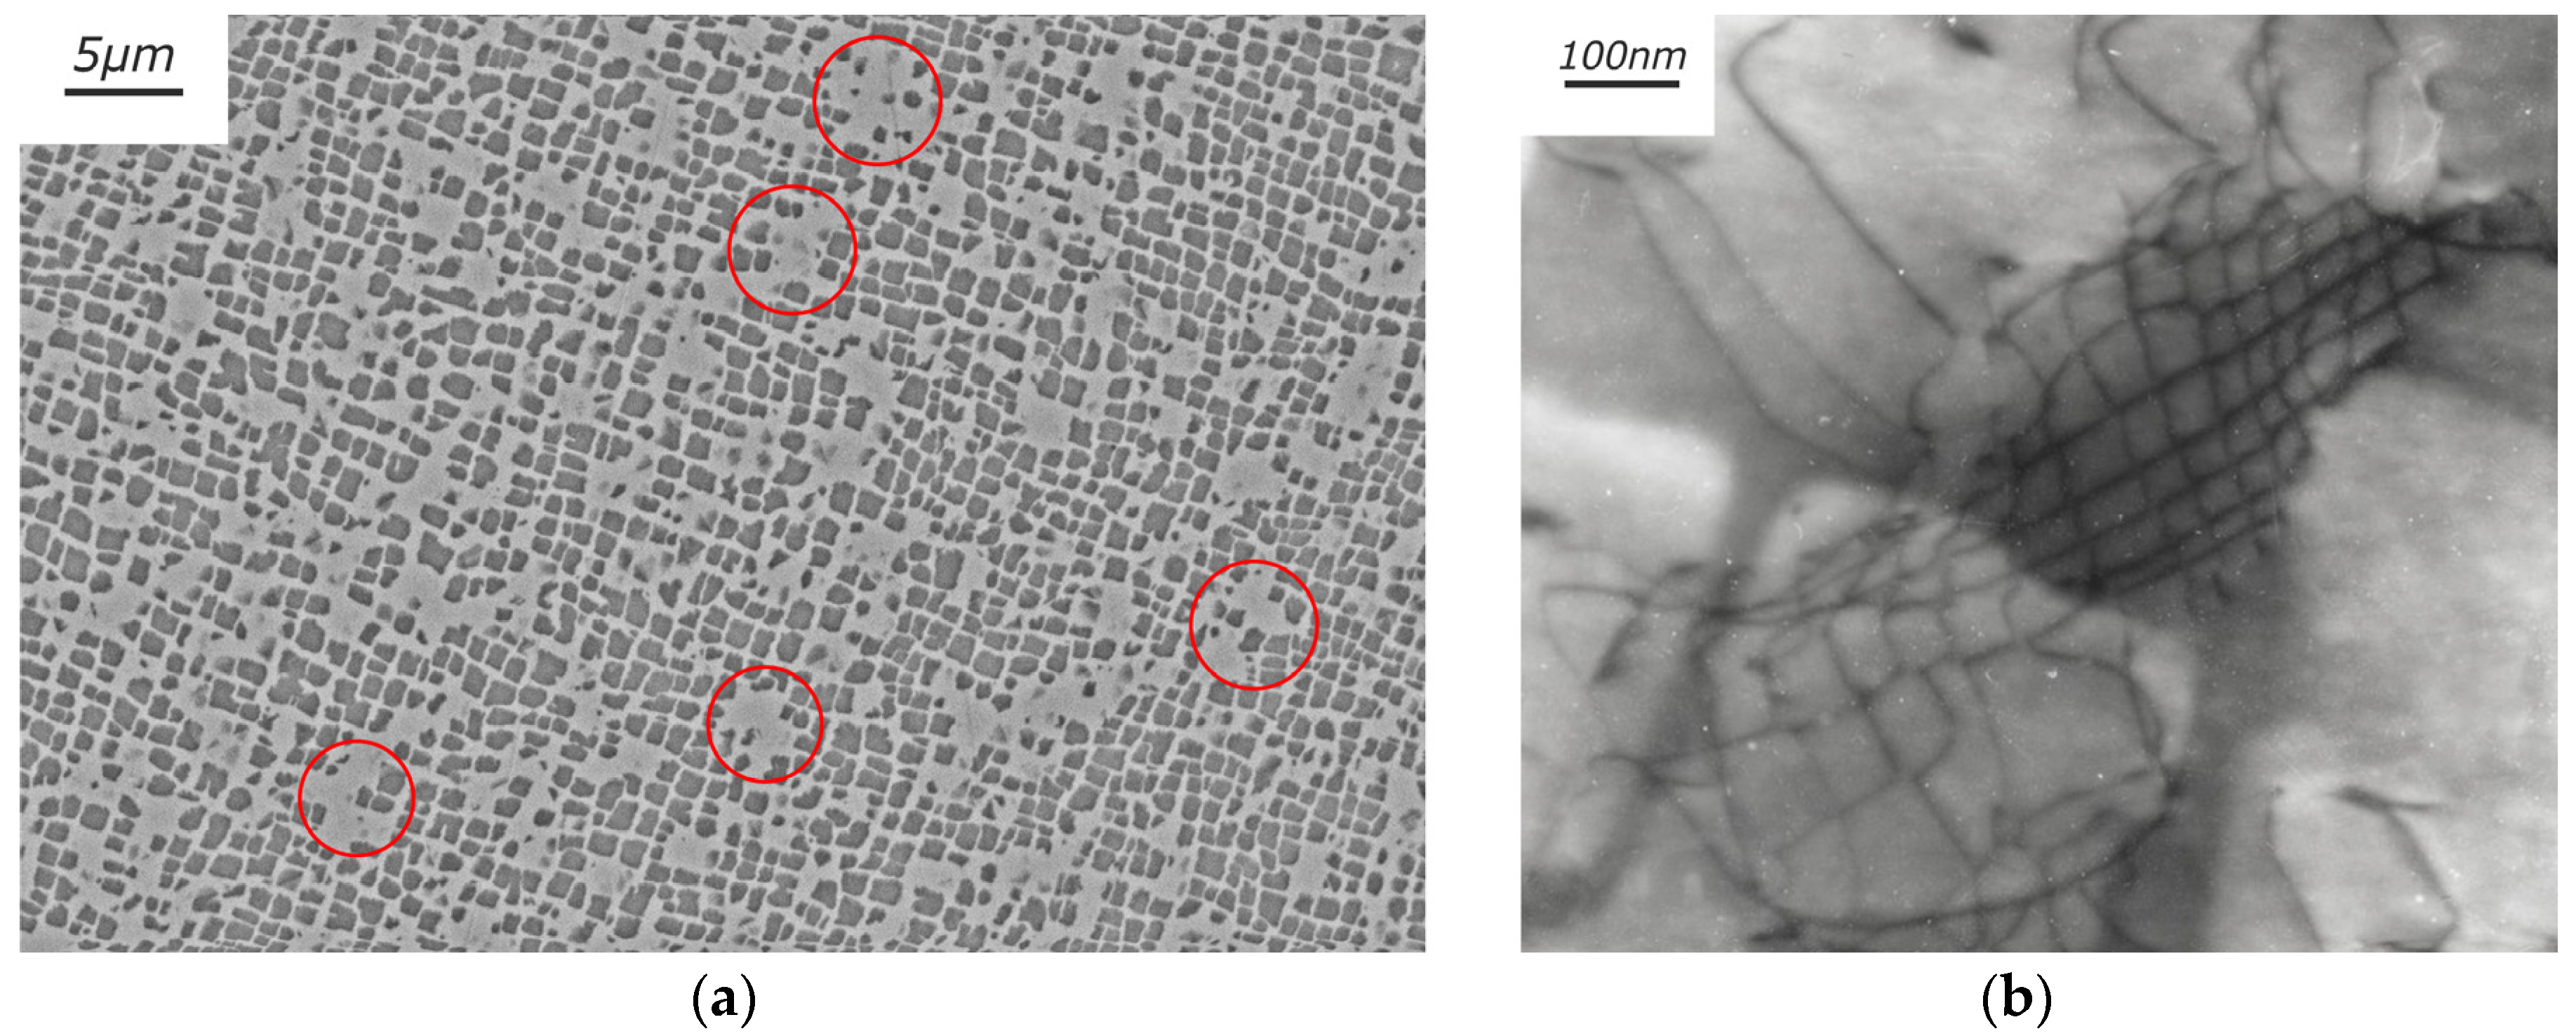
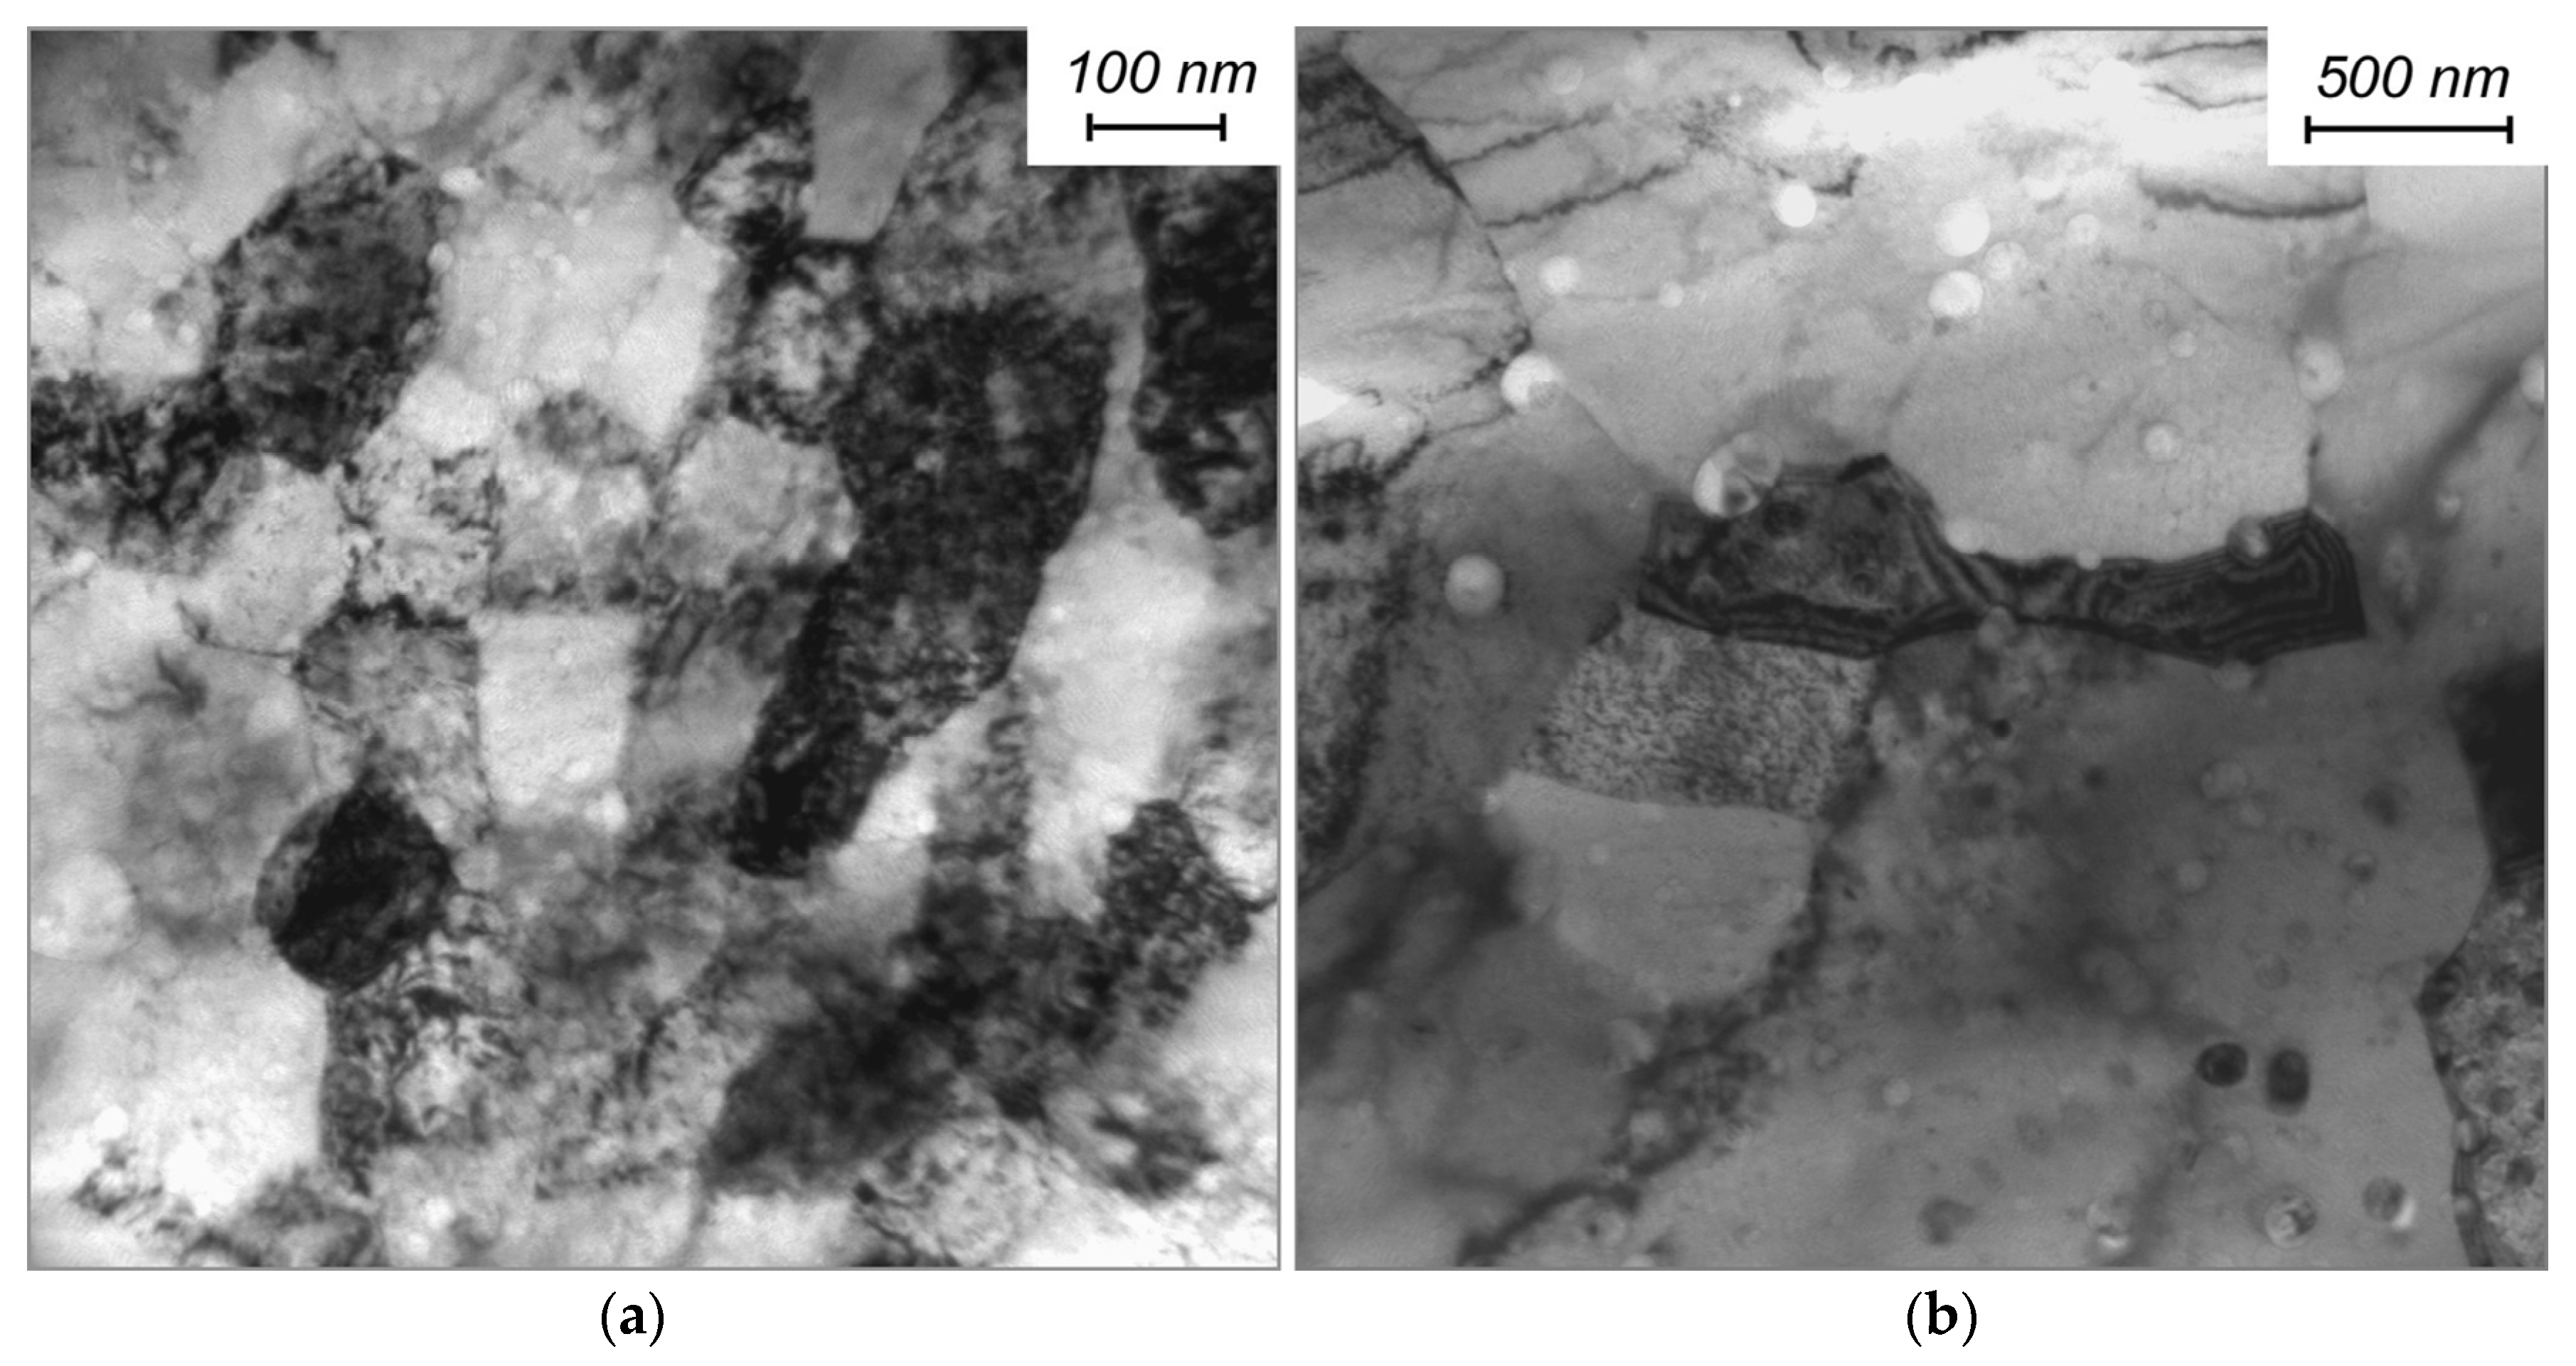
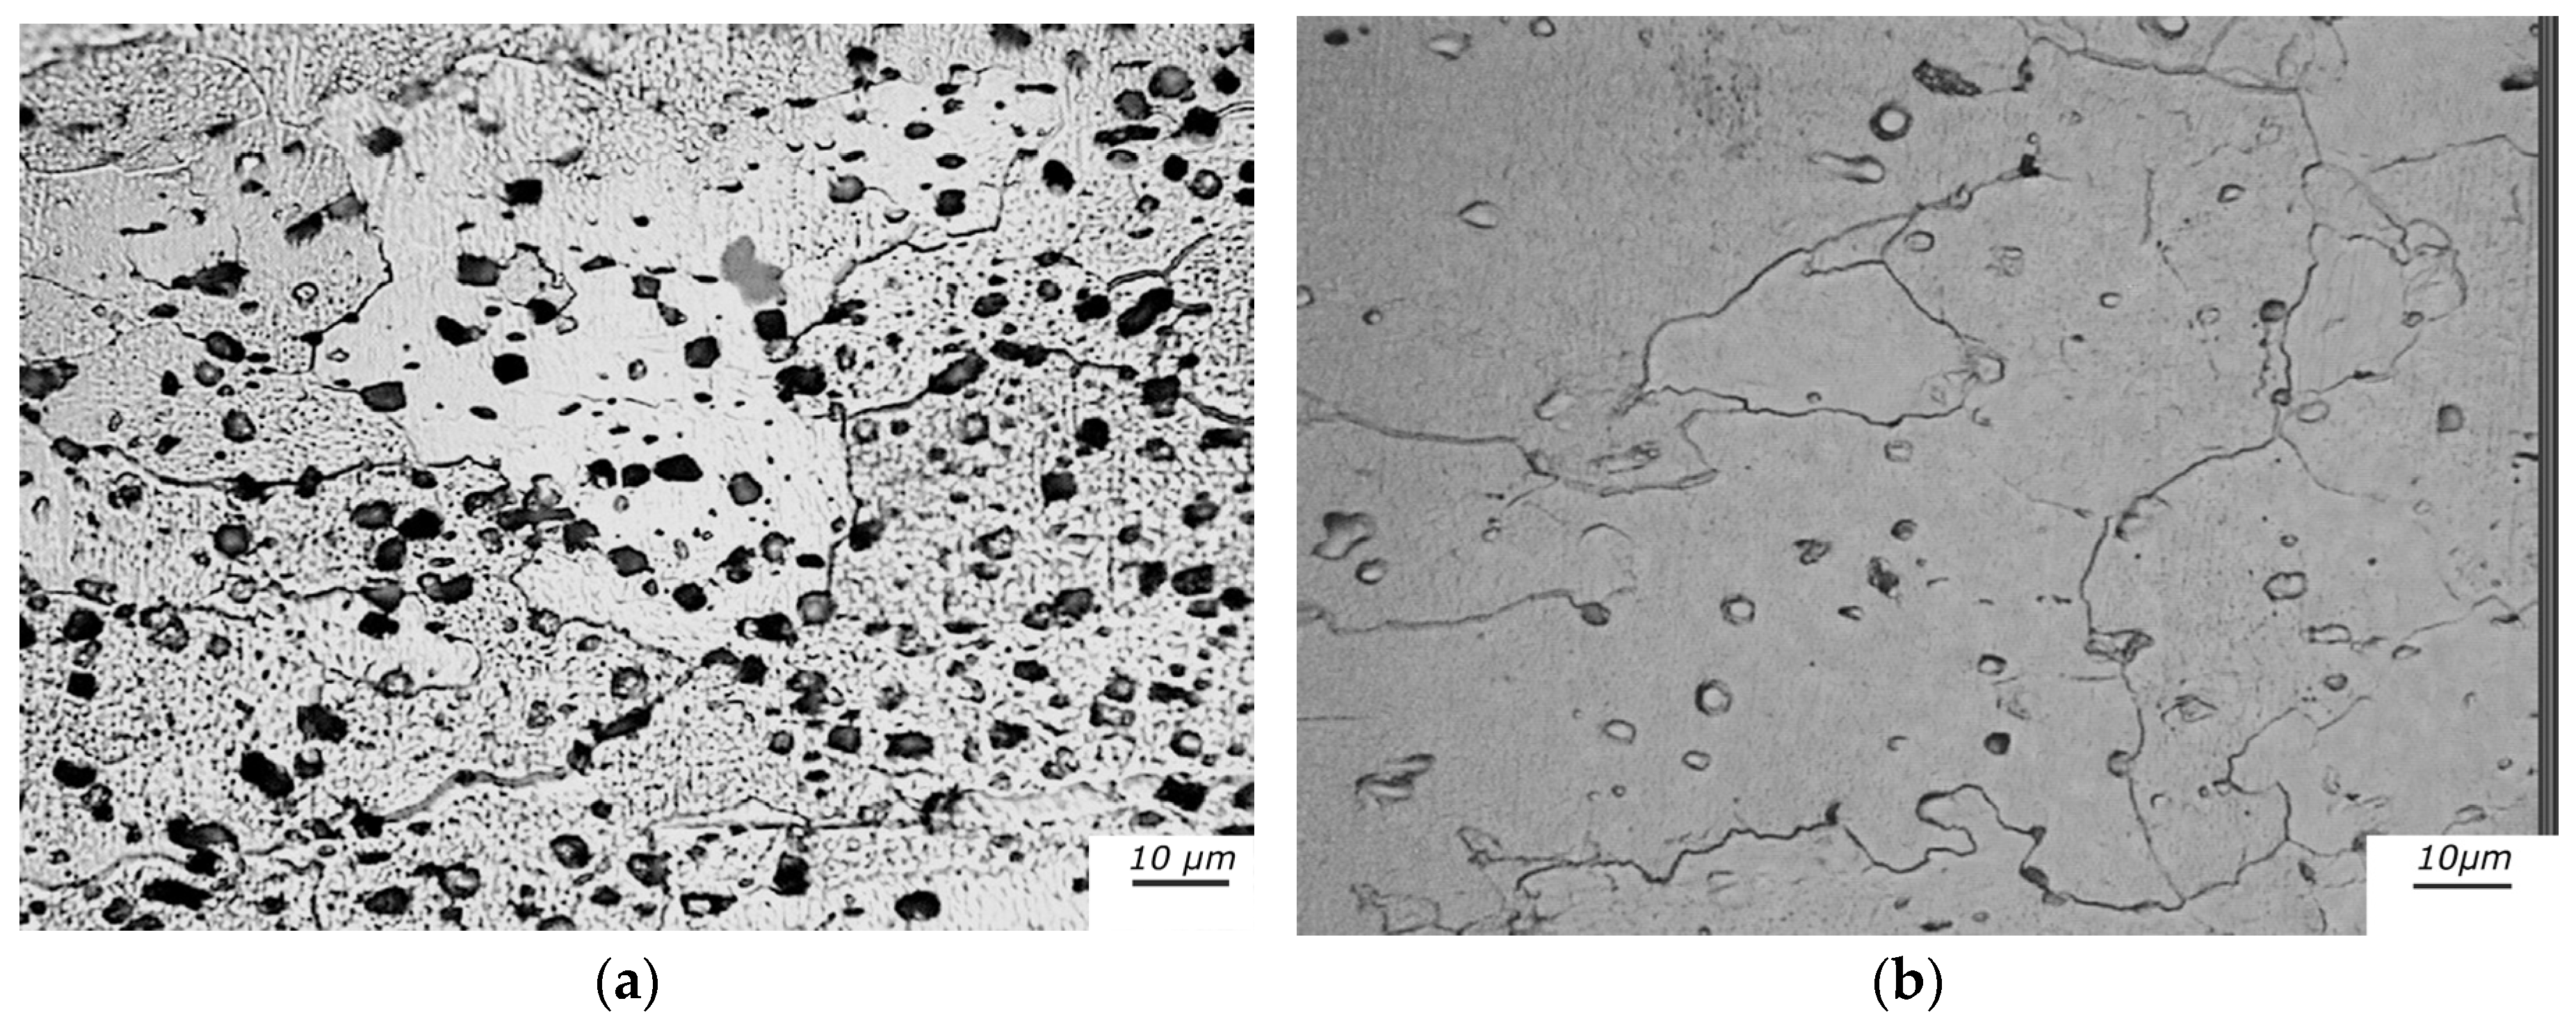
4. Case 3—SPS Sintering of a Nano-Structured Fe-Mo alloy: Crack Formation and Grain Growth Effects

Nano-structured materials (grain size d < 100 nm) possess a better strength as compared to the conventional ones [13,14]. They can be produced by sintering nano-structured powders obtained by mechanical milling. A fully dense material can be obtained by conventional sintering only at high temperatures, which lead to grains of larger sizes [15,16,17] thus the preparation of bulk nano-structured samples requires special consolidation processes, characterized by an overall low thermal load on the powder. Spark Plasma Sintering (SPS) is a pressure assisted consolidation technology characterized by a high heating rate, a low sintering temperature, and a short isothermal time at the sintering temperature [18,19] and has been successfully used to process FeMo nano-structured powders [20].
A mixture of powders (Fe-1.5 wt. % Mo alloy plus 1.5 wt. % of SiO2 powder with particle size of 10 nm) has been high energy milled to obtain a nanostructure and then consolidated by SPS under different conditions. SPS was carried out with the following process: 1—heating at 1.7 °C·s−1 up to the maximum temperature (varying from 800 to 900 °C); 2—holding for 1 min; 3—free cooling; 4—compressive pressure of 30–60 MPa, was applied during the heating step. SPS sintering in the aforesaid conditions always produced samples with densities ranging from 95% to 100% of that of the bulk alloy. However, remarkable differences were observed in the final grain size. In particular, the sintering temperature (TS) is a critical parameter because, passing from 840 to 855 °C, variations of average grain size from ~100 nm to ~1 μm are observed (Figure 6a,b).
To investigate the microstructural stability, repeated MS tests (heating to 650 °C/cooling to room temperature) have been performed on samples prepared with different TS in the range 840–855 °C. Figure 7 displays Q−1 and E/E0, vs. temperature curves in successive test runs of the same samples sintered at 840°C (a) or 855°C (b).
Q−1 of the sample sintered at 840 °C exponentially increases with temperature while modulus monotonically decreases except in the first run where an anomalous drop has been observed above 380 °C. All the curves of the sample sintered at 855 °C clearly exhibit the same behavior.
The as-prepared samples have nanometric grain size and homogeneously distributed nano-porosity. These features make them hard and brittle, thus small cracks may form during the first test to accommodate internal stresses. The samples do not show macroscopic ruptures also after several test cycles and cracks are not visible by an external inspection also at high magnification. The explanation of the modulus instability is based on TEM observations showing pores often separated by metallic ligaments of the order of tens of nanometers. A failure of these ligaments is supposed, thus the cracks have a nanometric size.
Crack formation reduces the effective sample thickness h and, according to Equation (1), leading to a sudden decrease of the resonance frequency f from which is calculated the modulus E. In fact, such an apparent change of the modulus reveals the formation and growth of cracks of very small size not otherwise detectable with other techniques.
In addition, Q−1 and E/E0 values change after successive test runs, indicating that irreversible transformations take place in both sets of samples. In the samples sintered at 840 °C, these values show a slight decrease after the first run then remain substantially stable whereas the changes occur in all the cycles for the samples sintered at 855 °C.
The physical origin of such behavior is the increase of the mean grain size, as shown by data in Table 2.
The coalescence of grains involves rearrangement of dislocations with dissipative effects as predicted by Equations (2) and (3). The process is analogous to cell coalescence discussed in Case 2. In the first step, grain boundary breaks up and the dislocations forming the boundary become free to oscillate under the external stress; in the second step, dislocations, which formed the old boundary, in part annihilate and in part rearrange in the remaining boundaries. Grain coalescence is a random process, thus several successive maxima are observed in test runs of samples sintered at 855 °C.

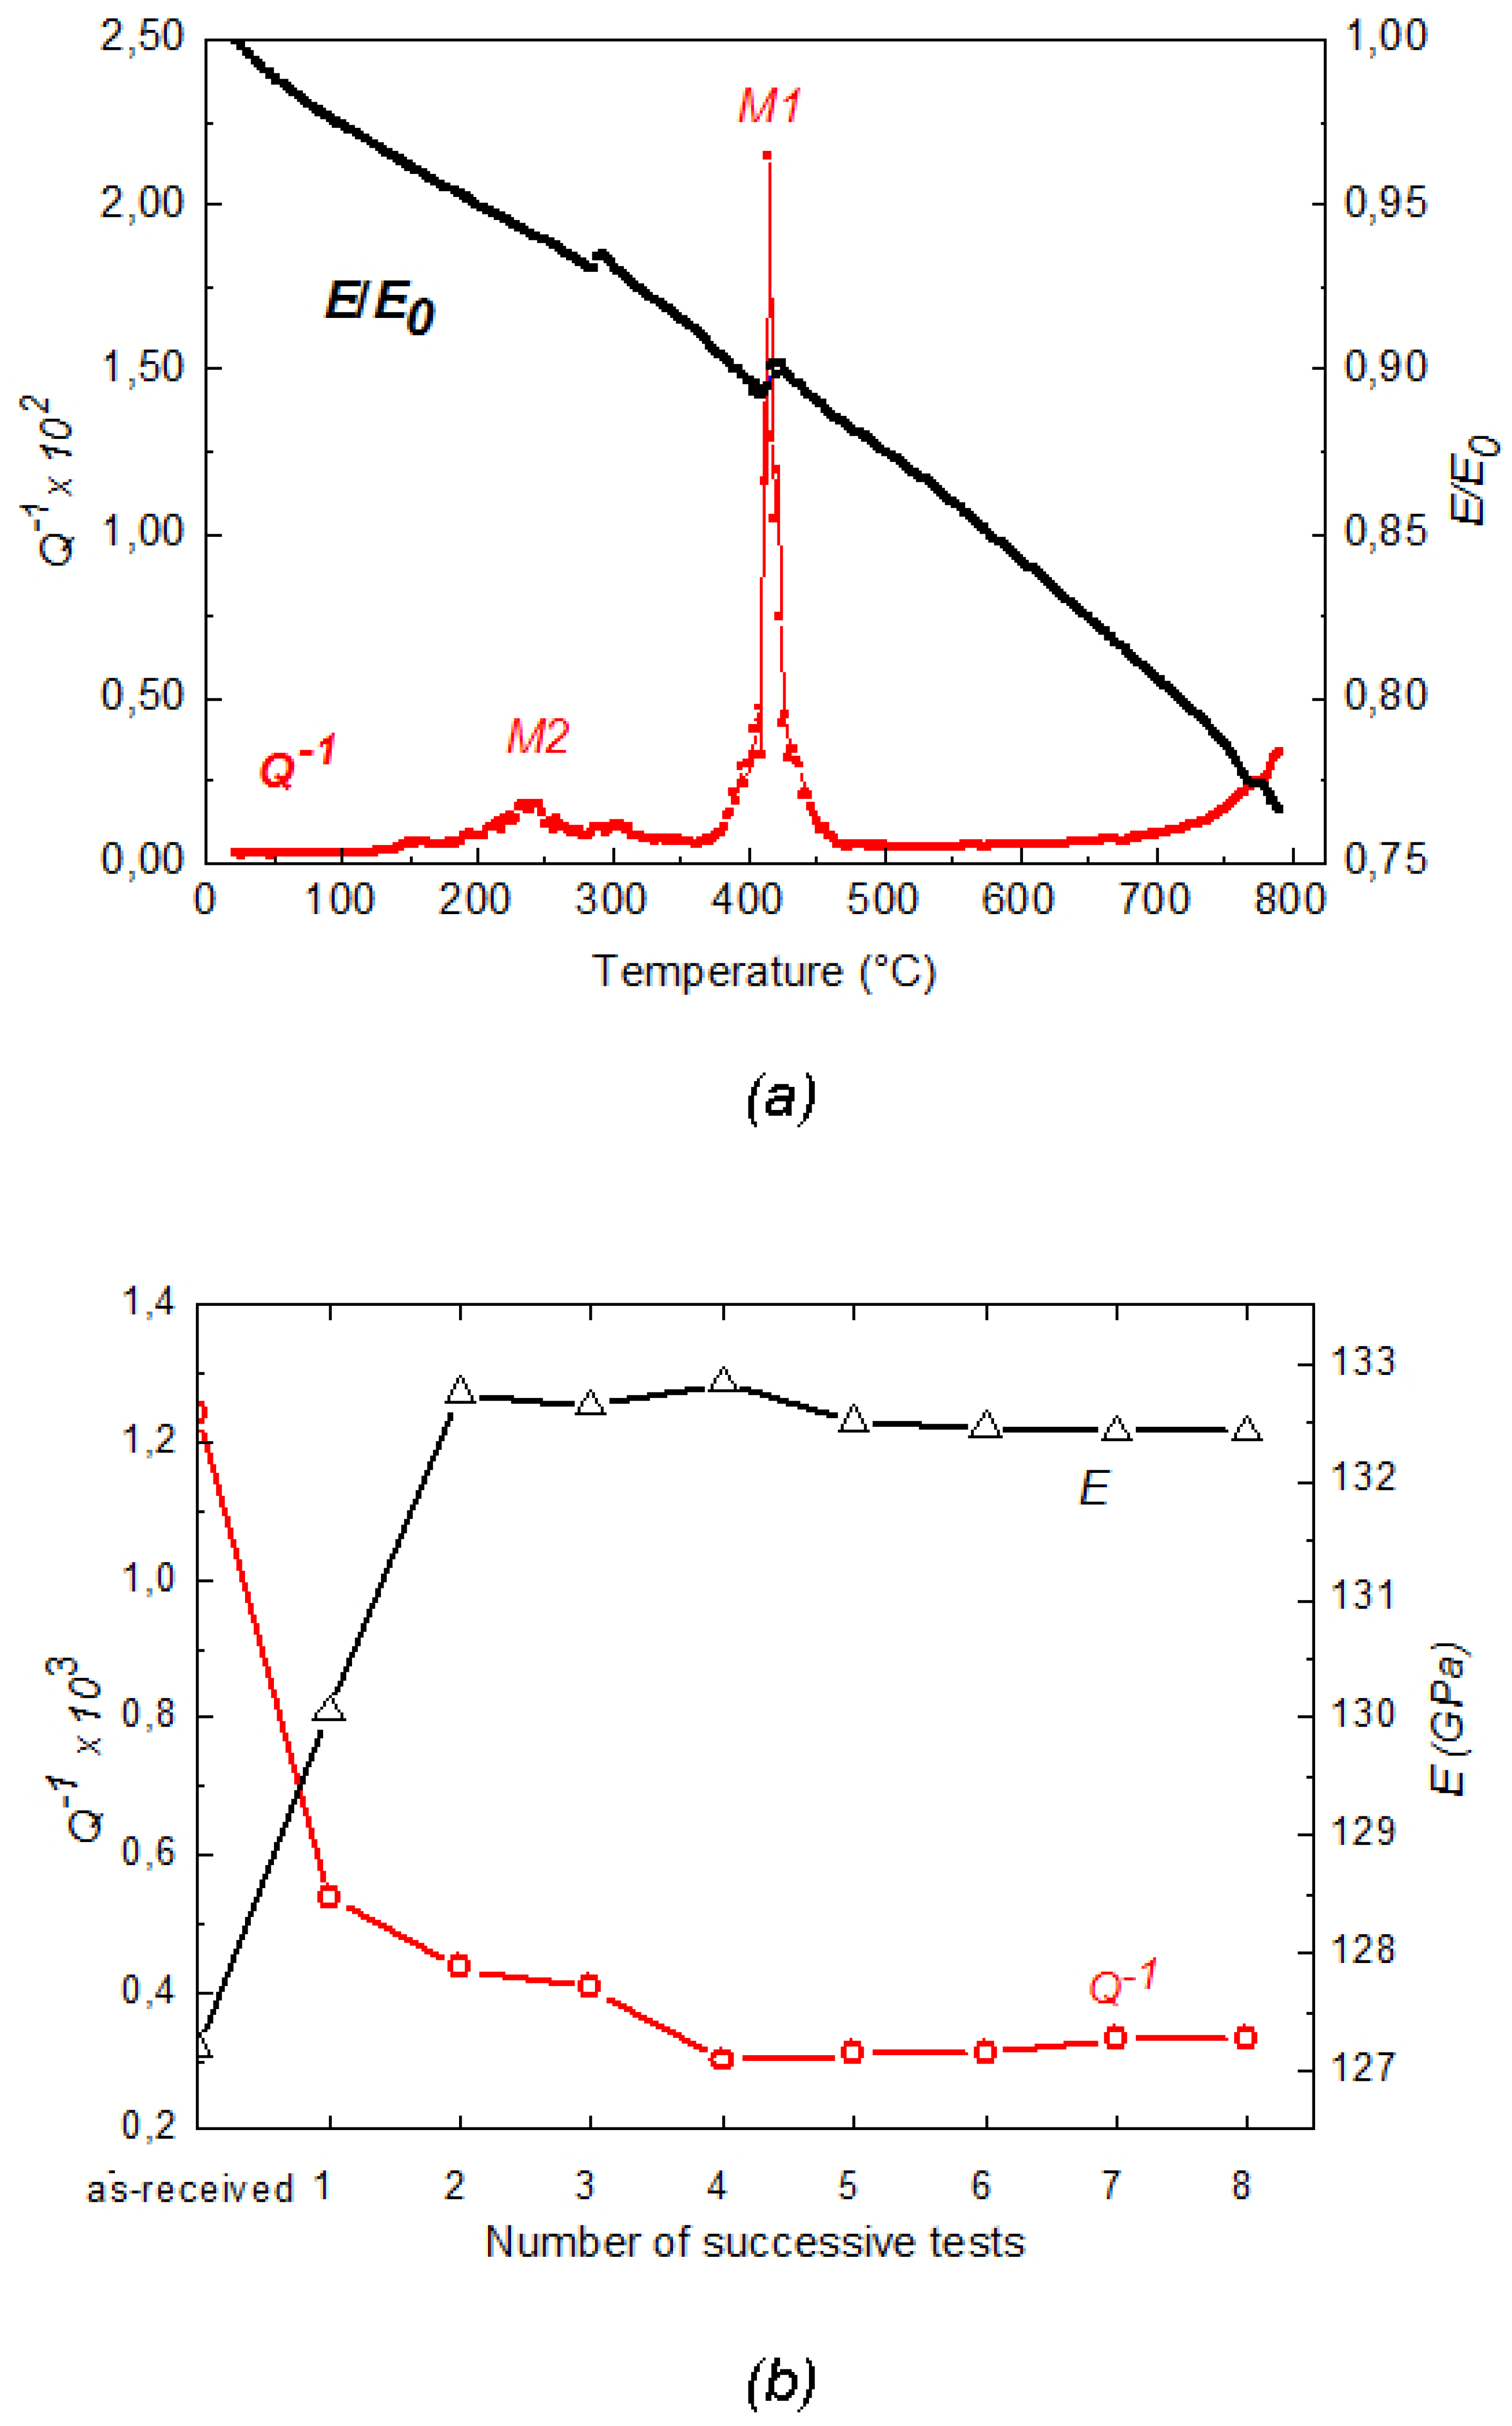
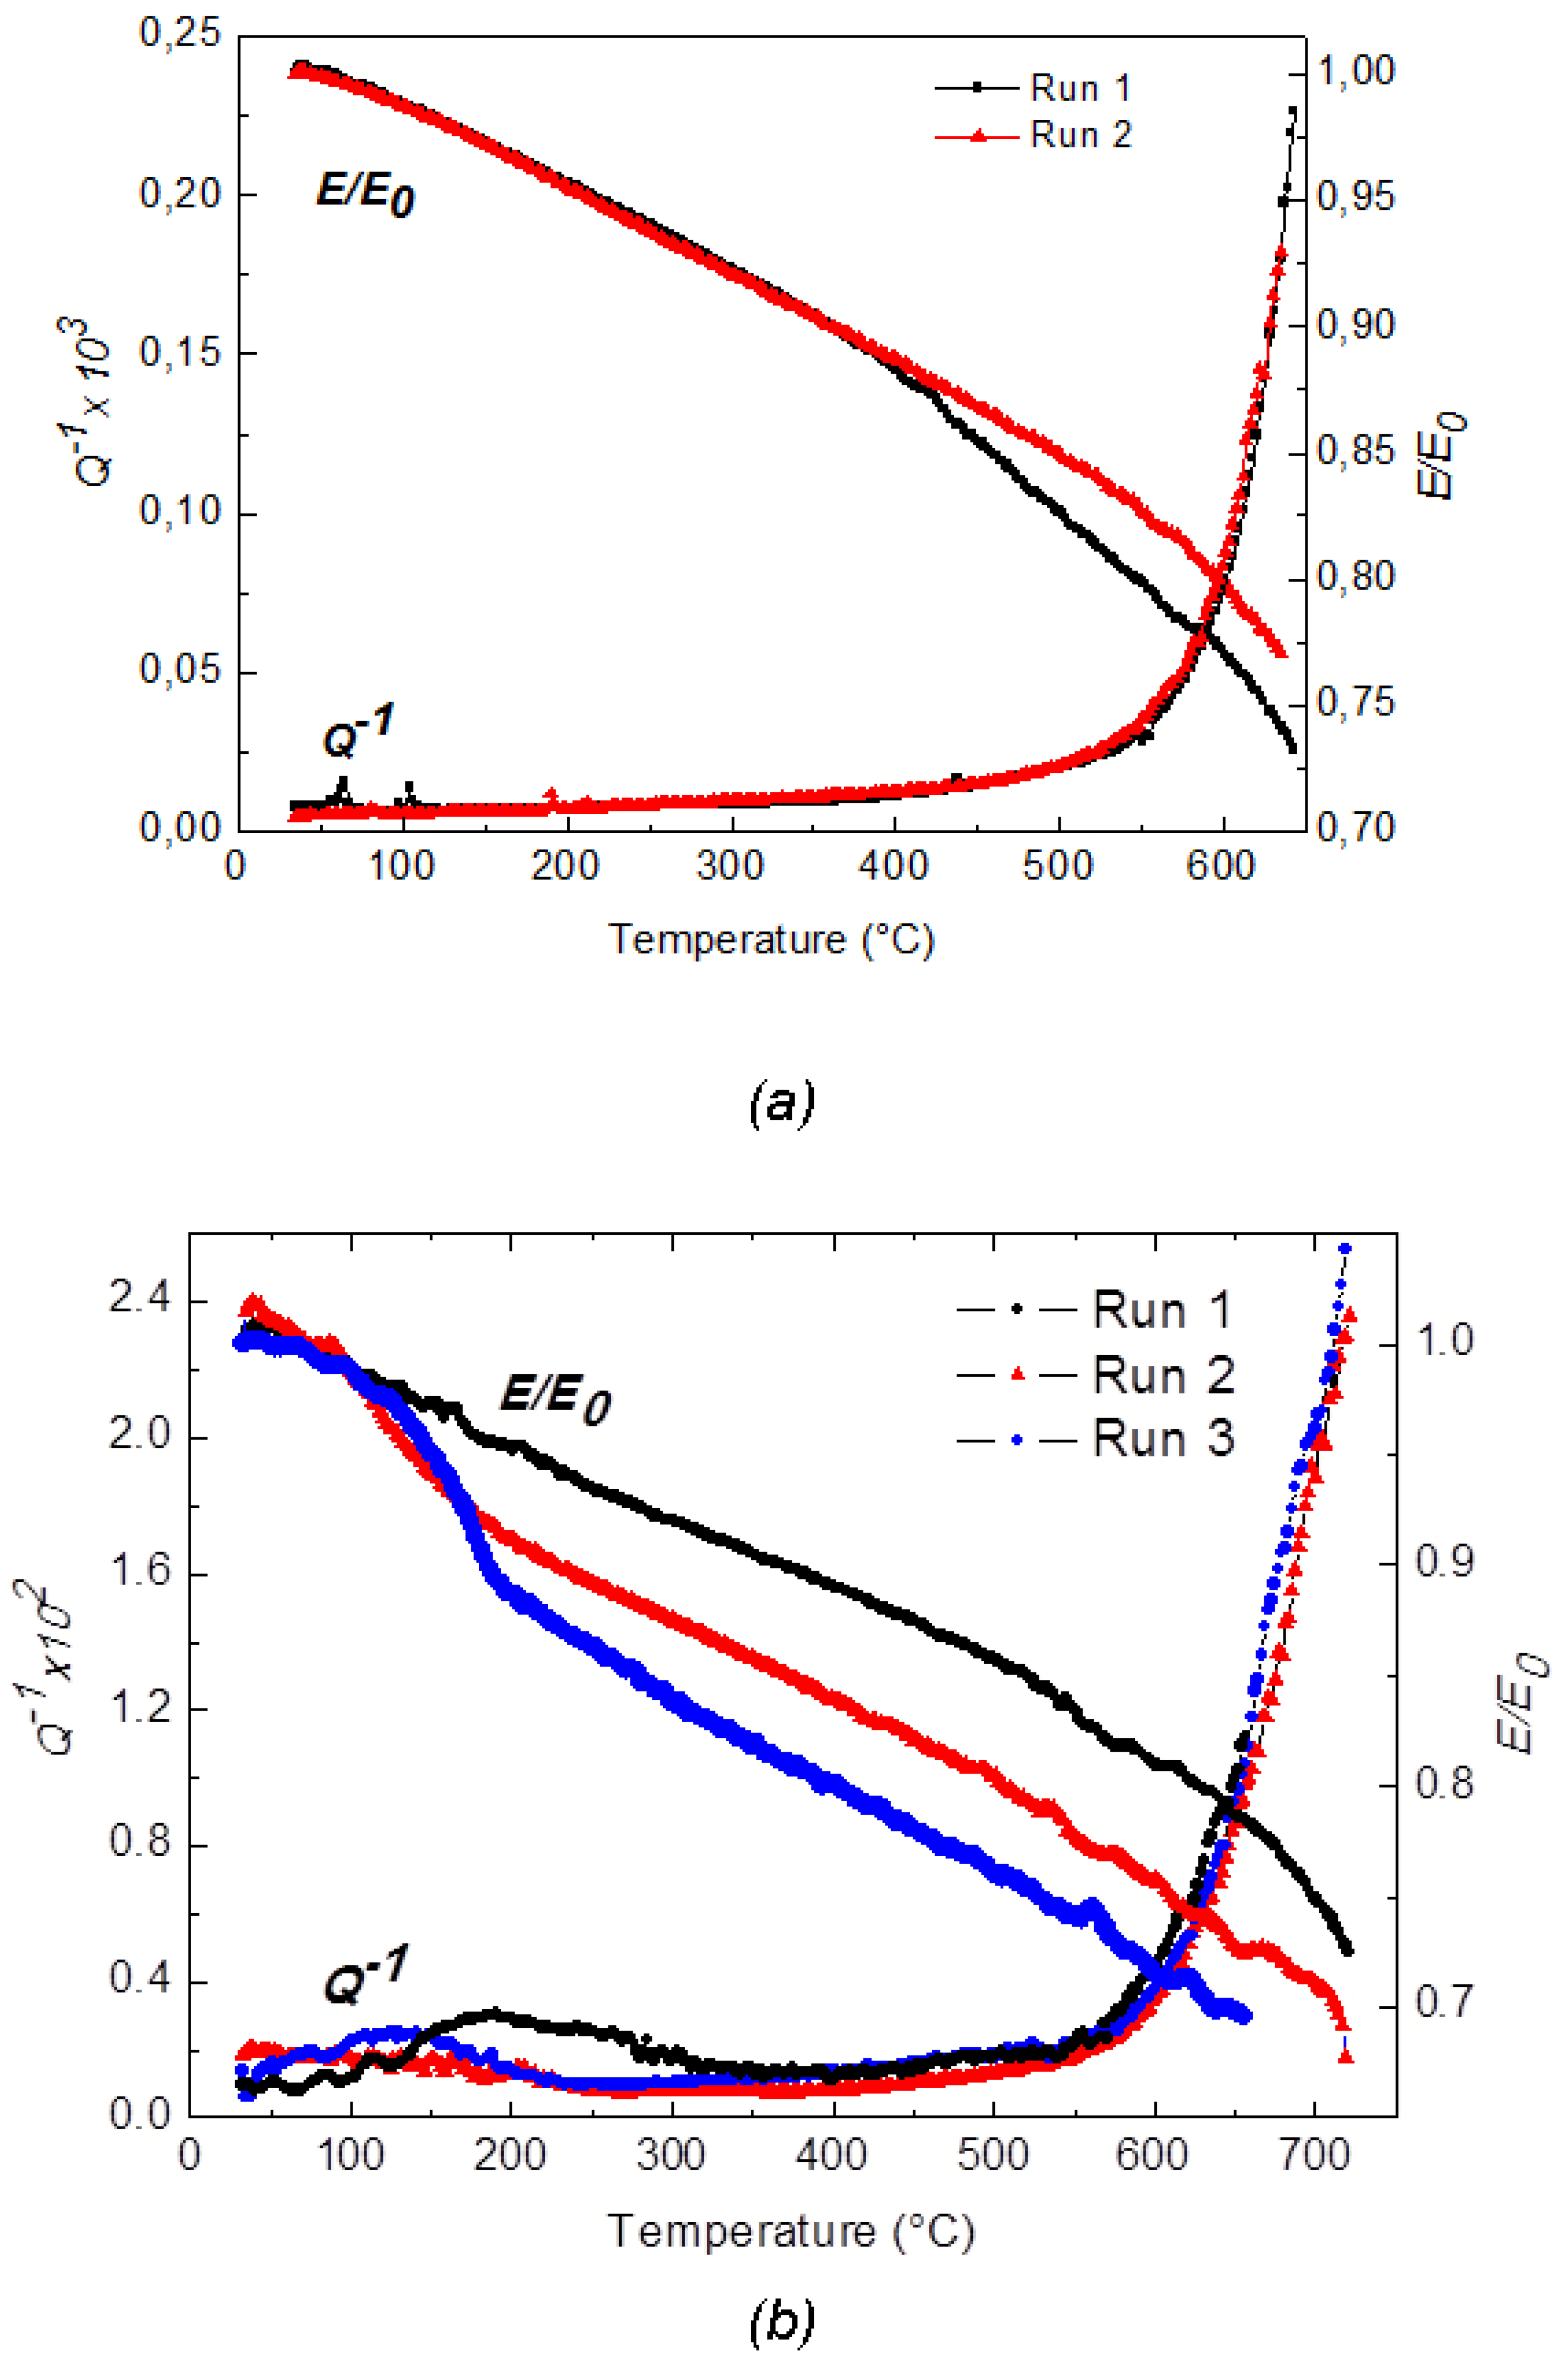
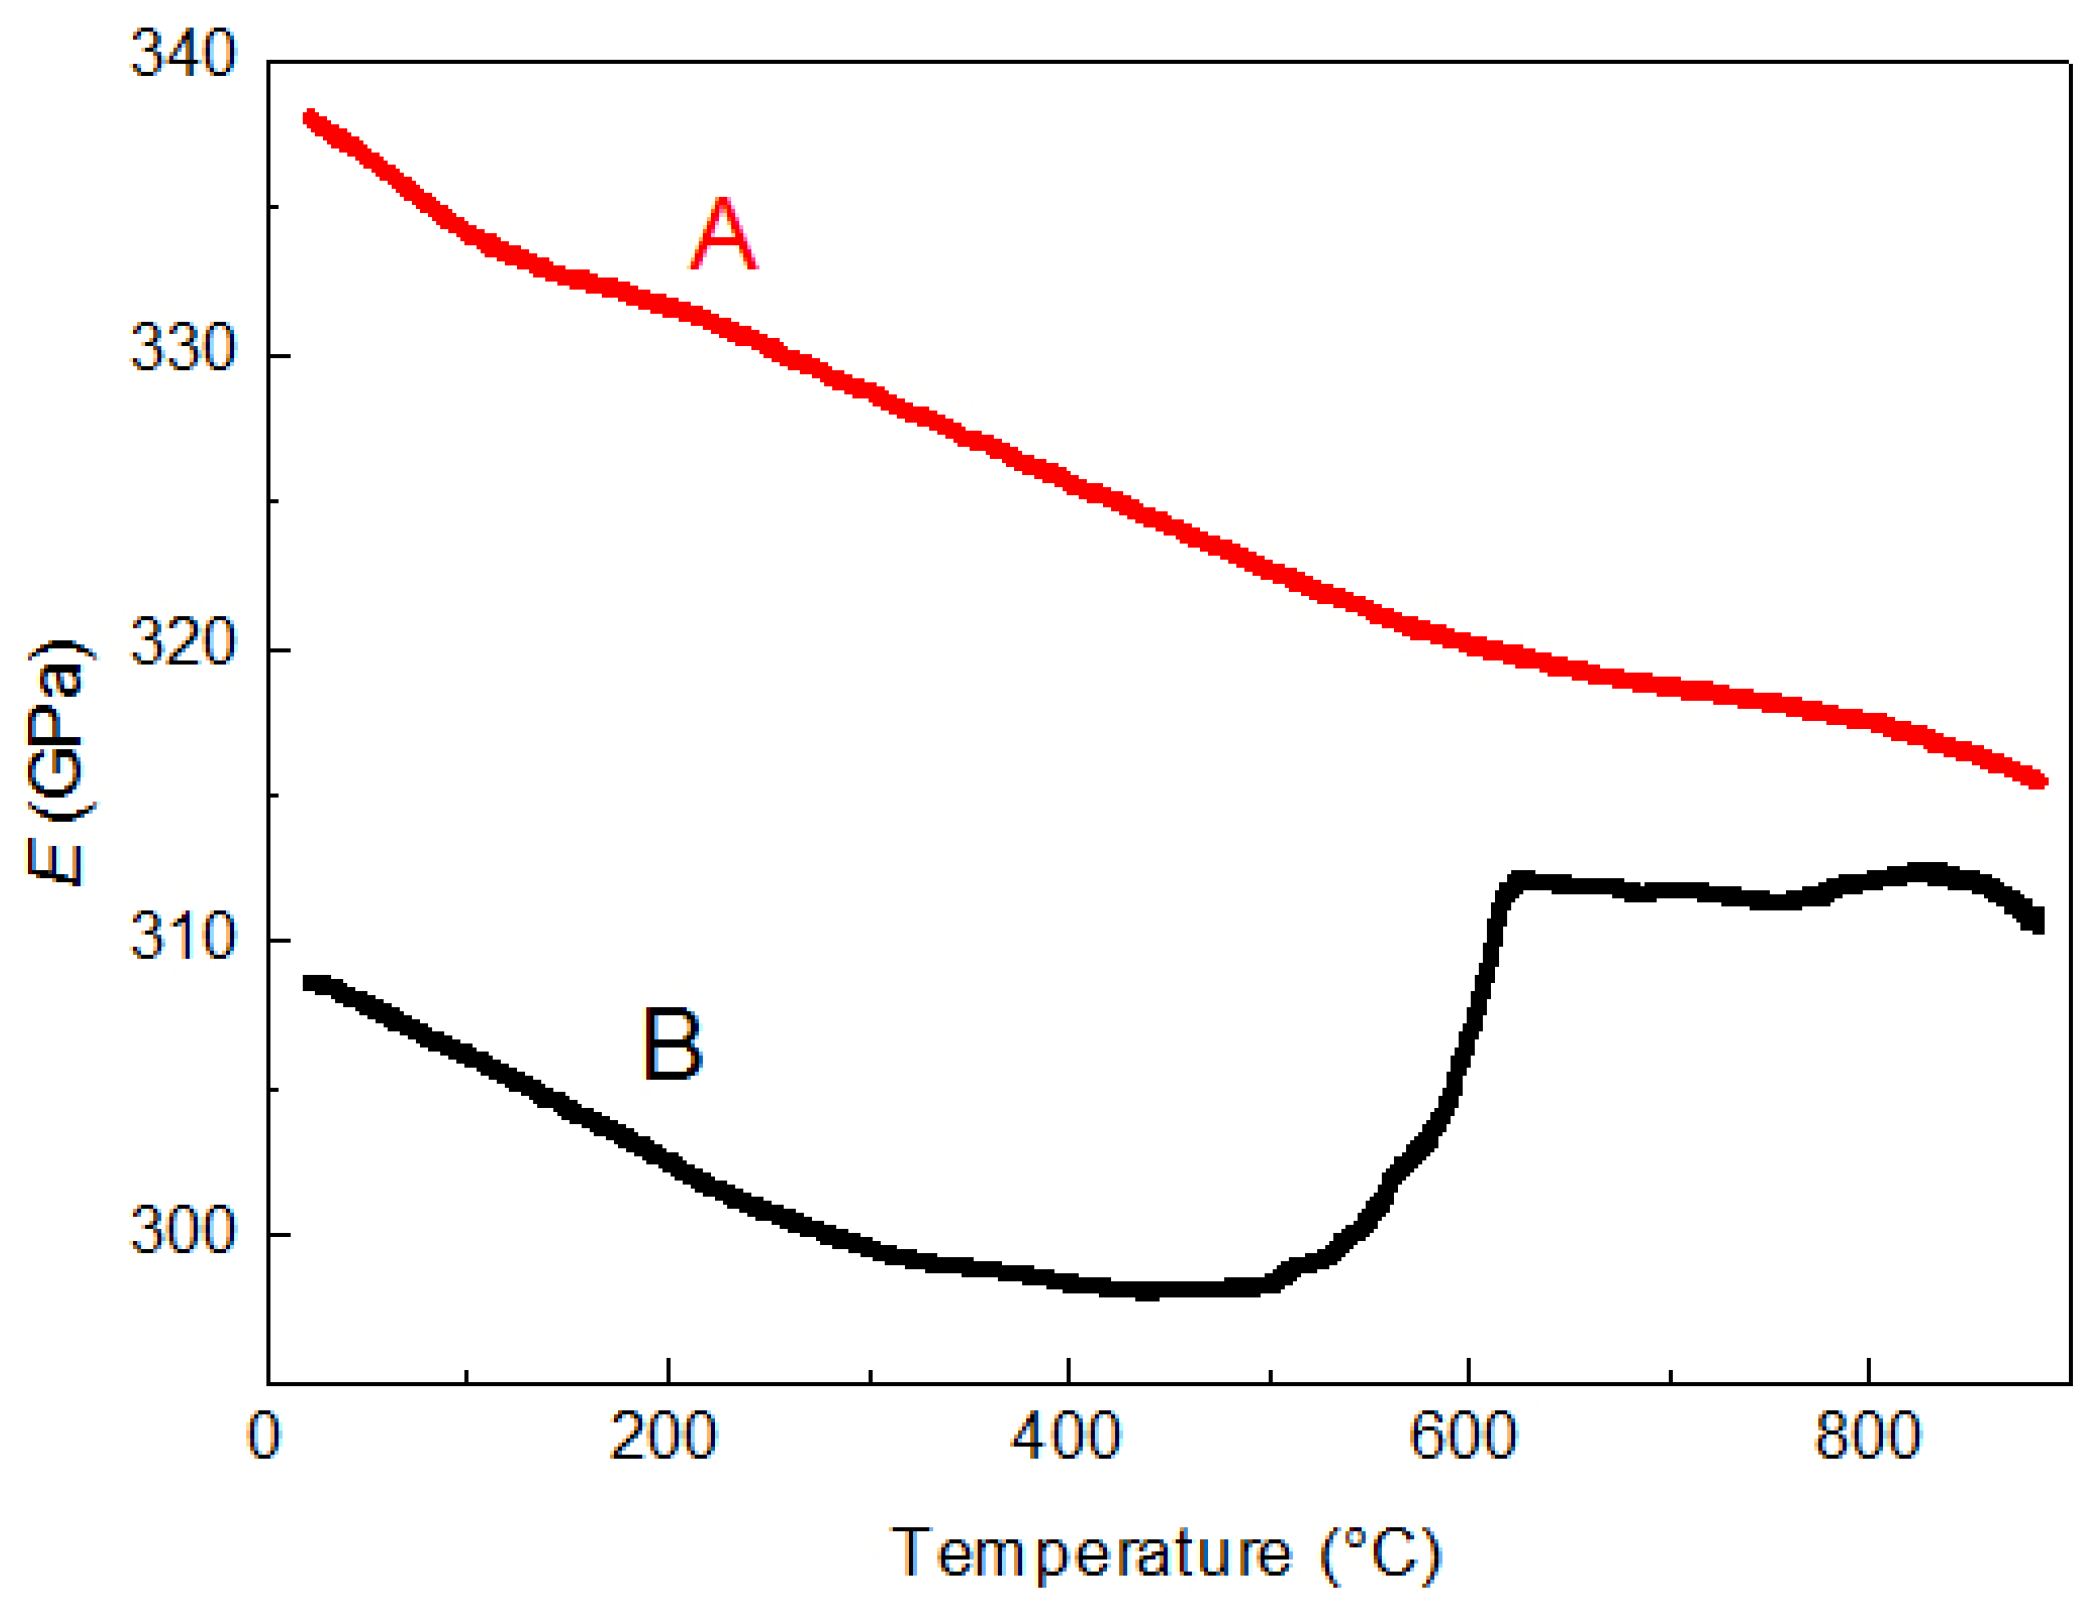
5. Case 4—W as Plasma-Facing Material in Future Nuclear Fusion Reactors

Tungsten is a promising armor material for plasma facing components of nuclear fusion reactors because of its low sputter rate and favorable thermo-mechanical properties (high melting point and good thermal conductivity) [21]. Previous works demonstrated the feasibility of 5 mm thick W coatings deposited on CuCrZr substrates by plasma spraying and their capability to withstand heat fluxes up to 5 MW/m2 in condition relevant for fusion reactor plasma facing components [22].
A complete characterization of plasma facing materials is of fundamental importance because they are subjected to simultaneous high thermal and ionic fluxes. Therefore, an experimental campaign was carried out for investigating the microstructural characteristics and the mechanical properties of bulk tungsten samples for fusion applications. One of the objectives was to select the right material and MS was revealed to be a very useful technique to identify tungsten with the best characteristics. Here, we report the example of two materials (A and B) prepared by different companies. Tungsten A and B had different purity (A: 99.97%, B: 99.95%) and porosity (A: 5%, B: 9%). MS measurements of dynamic modulus at room temperature give the values of 339 and 309 GPa for tungsten A and B, respectively. The result confirms that modulus strongly depends on the residual porosity and tungsten A exhibits better elastic characteristics than tungsten B. Experimental data are in agreement with the values calculated by the equation proposed by Kováčik [23]:
E = E 0 ( 1 p p c ) N
where p is the material porosity, pc the critical porosity at which the effective Young’s modulus becomes negligible (~40%), and N is a parameter dependent on the grain morphology and pore geometry [24]. The values E = 350 GPa and E = 310 GPa are obtained by introducing p values of A (5%) and B (9%) into Equation (6), respectively, and taking N = 1 [25]. Very important information about the microstructural stability of the two materials comes from the comparison of modulus curves at increasing temperature (Figure 8).
As expected by a stable material, the modulus of tungsten A progressively decreases with temperature whereas that of tungsten B shows a trend inversion at about 500 °C that corresponds to a partial closure of pores with consequent density increase due to heating during the test. The porosity change is clearly shown in Figure 9, comparing the same sample in as-supplied condition (a) and after a MS run test (b).
Therefore, tungsten B is not suitable as a plasma facing material for applications in nuclear fusion reactors where geometrical and mechanical stability is a strict requirement.

6. Conclusions

The paper presents some applications of Mechanical Spectroscopy (MS) for monitoring the microstructural stability of metals and alloys. Four case studies have been presented:
  • isothermal changes of damping and dynamic modulus due to the depinning of dislocations from interstitial atoms (C and N) and other obstacles;
  • rearrangement of dislocation cells in PFZ of PWA 1483 single crystal superalloy;
  • crack formation in nano-structured FeMo alloy prepared via SPS sintering;
  • porosity evolution in two types of tungsten samples with different characteristics foreseen for application as plasma facing material in nuclear fusion reactors.
The examined cases demonstrate the high sensitivity of MS in detecting variations of the microstructure connected to different types of defects. Therefore, MS can be used to directly assess the material stability in mechanical parts of simple geometry and, in addition, to orient the interpretation of frequency and damping changes observed through other instruments in components of complex shape during their in-service life.

Author Contributions

G. Costanza and M. E. Tata performed Microscopy and TEM micrographs, R. Montanari and A. Varone performed XRD and MS experiments; M. Richetta analyzed the data; R. Montanari, M. Richetta and A. Varone wrote the paper.

Conflicts of Interest

The authors declare no conflict of interest.

References

  1. Zener, C. Elasticity and Anelasticity of Metals; University of Chicago Press: Chicago, IL, USA, 1948. [Google Scholar]
  2. Nowick, A.S.; Berry, B.S. Anelastic Relaxation in Crystalline Solids; Academic Press: New York, NY, USA; London, UK, 1972. [Google Scholar]
  3. Montanari, R.; Varone, A. Synergic Role of Self-interstitials and Vacancies in Indium Melting. Metals 2015, 5, 1061–1072. [Google Scholar] [CrossRef]
  4. Salawu, O.S. Detection of structural damage through changes of frequency: A review. Eng. Struct. 1997, 19, 718–723. [Google Scholar] [CrossRef]
  5. Kessler, S.S.; Spearing, S.M.; Atalla, M.J.; Cesnik, C.E.S.; Soutis, C. Damage detection in composite materials using frequency response methods. Compos. B 2002, 33, 87–95. [Google Scholar] [CrossRef]
  6. Kim, J.T.; Ryu, Y.S.; Cho, H.M.; Stubbs, N. Damage identification in beam-type structures: Frequency-based method vs. mode-shape-based method. Eng. Struct. 2003, 25, 57–67. [Google Scholar] [CrossRef]
  7. Thomas, K.G.S.; Bauberger, A. Nondestructive detection of hydrogen in steel by vibration damping. NDT Int. 1988, 21, 327–332. [Google Scholar]
  8. Amadori, S.; Campari, E.G.; Fiorini, A.L.; Montanari, R.; Pasquini, L.; Savini, L.; Bonetti, E. Automated resonant vibrating-reed analyzer apparatus for a non-destructive characterization of materials for industrial applications. Mater. Sci. Eng. A 2006, 442, 543–546. [Google Scholar] [CrossRef]
  9. Klug, H.P.; Alexander, L.E. X-ray Diffraction Procedures for Polycrystalline and Amorphous Materials, 2nd ed.; John Wiley & Sons: New York, NY, USA, 1974. [Google Scholar]
  10. Williamson, G.K.; Smallman, R.A. Dislocation densities in some annealed and cold-worked metals from measurements on the X-ray Debye-Scherrer spectrum. Philos. Mag. 1956, 1, 34–46. [Google Scholar] [CrossRef]
  11. Deodati, P.; Montanari, R.; Tassa, O.; Ucciardello, N. Single crystal PWA 1483 superalloy: Dislocation rearrangement and damping phenomena. Mater. Sci. Eng. A 2009, 521–522, 102–105. [Google Scholar] [CrossRef]
  12. Montanari, R.; Tassa, O.; Varone, A. Early instability phenomena of IN792 DS superalloy. Mater. Sci. Forum 2016, 879, 2026–2031. [Google Scholar] [CrossRef]
  13. Takaki, S.; Kawasaki, K.; Kimura, Y. Mechanical properties of ultra fine grained steels. J. Mater. Process. Technol. 2001, 117, 359–363. [Google Scholar] [CrossRef]
  14. Tsuji, N.; Ito, Y.; Saito, Y.; Minamino, Y. Strenght and ductility of ultrafine grained aluminum and iron produced by ARB and annealing. Scr. Mater. 2002, 47, 893–899. [Google Scholar] [CrossRef]
  15. Harvey, D.P.; Kalianaraman, R.; Sudarshan, T. Consolidation and mechanical behavior of nanocrystalline iron powder. Mater. Sci. Technol. 2002, 18, 959–963. [Google Scholar] [CrossRef]
  16. Amador, D.R.; Monge, M.A.; Torralba, J.M.; Pareja, R. Strain-enhanced sintering of iron powders. Appl. Phys. A 2005, 80, 803–811. [Google Scholar] [CrossRef]
  17. Krill, C.E.; Helfen, L.; Michels, D.; Natter, H.; Fitch, A.; Masson, O.; Birringer, R. Size-dependent grain-growth kinetics observed in nanocrystalline Fe. Phys. Rev. Lett. 2001, 86, 842–845. [Google Scholar] [CrossRef] [PubMed]
  18. Tokita, M. Industrial applications of advanced spark plasma sintering. Am. Ceram. Soc. Bull. 2006, 85, 32–34. [Google Scholar]
  19. Zhang, H.W.; Gopalan, R.; Mukai, T.; Hono, K. Fabrication of bulk nanocrystalline Fe-C alloy by spark plasma sintering of mechanically milled powder. Scr. Mater. 2005, 53, 863–868. [Google Scholar] [CrossRef]
  20. Iacovone, B.; Libardi, S.; Molinari, A.; Zadra, M.; Montanari, R.; Plini, P. FIMEC tests on SPS sintered FeMo nanostructured alloys. J. Test. Eval. 2008, 36, 430–435. [Google Scholar]
  21. Bolt, H.; Barabash, V.; Krauss, W.; Linke, J.; Neu, R.; Suzuki, S.; Nyoshida, N. Materials for the plasma-facing components of fusion reactors. J. Nucl. Mater. 2004, 329–333, 66–73. [Google Scholar] [CrossRef]
  22. Montanari, R.; Riccardi, B.; Volterri, R.; Bertamini, L. Characterisation of plasma sprayed W-coatings on a CuCrZr alloy for nuclear fusion reactor applications. Mater. Lett. 2002, 52, 100–105. [Google Scholar] [CrossRef]
  23. Kováčik, J. Correlation between Young’s modulus and porosity in porous materials. J. Mater. Sci. Lett. 1999, 18, 1007–1010. [Google Scholar] [CrossRef]
  24. Phani, K.K.; Niyogi, S.K. Young’s modulus of porous brittle solids. J. Mater. Sci. 1987, 22, 257–263. [Google Scholar] [CrossRef]
  25. Lam, D.C.; Lange, F.F.; Evans, A.G. Mechanical properties of partially dense alumina produced from powder compacts. J. Am. Ceram. Soc. 1994, 77, 2113–2117. [Google Scholar] [CrossRef]
Figure 1. AISI 304 steel: dynamic modulus E normalized to its initial value E0 evolution during isothermal stages at increasing temperature (steps of 100 °C). The temperature T curve is plotted in red.
Metals 06 00306 g001
Figure 2. AISI 304 steel: Q−1 and E evolution during an isothermal heat treatment at 400 °C for 20 h.
Metals 06 00306 g002
Figure 3. Microstructure of the PWA 1483 superalloy; some PFZ are evidenced by red circles (a); TEM micrograph displaying a network of dislocations in a PFZ (b).
Metals 06 00306 g003
Figure 4. Q−1 and E/E0 vs. temperature in the first test run (a); Q−1 and E after successive MS test runs (b).
Metals 06 00306 g004
Figure 5. TEM micrograph displaying the evolution of a network of dislocations in a PFZ after two MS test runs.
Metals 06 00306 g005
Figure 6. Nano-structured FeMo powders after SPS sintering at 840 °C (a) and 855 °C (b).
Metals 06 00306 g006
Figure 7. Fe-Mo alloy produced via SPS from nano-structured powders. Trends of Q−1 and E/E0 vs. temperature in successive test runs carried out on samples sintered at 840 °C (a) and 855 °C (b).
Metals 06 00306 g007
Figure 8. Dynamic modulus vs. temperature curves of tungsten samples (A and B) prepared by two different companies.
Metals 06 00306 g008
Figure 9. Tungsten B: light microscopy micrographs of the same sample in as-supplied condition (a) and after a MS run test (b).
Metals 06 00306 g009
Table 1. AISI 304 steel submitted to the heating treatment with isothermal stages at increasing temperatures shown in Figure 1: the mean length l of dislocation segments has been calculated from dislocation density ξ measured by XRD and ∆E/E values determined in the MS test.
Temperature T (°C)E/E0ξ (cm−2)l (nm)
1002.50 × 10−33.0 × 10871
2008.19 × 10−33.0 × 108128
3001.13 × 10−23.0 × 108150
4002.39 × 10−21.8 × 108282
5005.51 × 10−21.0 × 108548
Table 2. SPS sintered FeMo alloy: average grain size D of samples sintered at 840 and 855 °C, in as-prepared condition and after MS test runs.
MaterialD (nm)
Sintered at 840 °C/as-prepared100
Sintered at 840 °C/after MS test runs120
Sintered at 855 °C/as-prepared1000
Sintered at 855 °C/after MS test runs4000

