
Ultrasonic Guided Wave Propagation through Welded Lap Joints

Prof. K. Barsauskas Ultrasound Research Institute, Kaunas University of Technology, K. Barsausko str. 59, Kaunas LT-51423, Lithuania
*
Author to whom correspondence should be addressed.
Metals 2016, 6(12), 315; https://doi.org/10.3390/met6120315
Submission received: 30 September 2016
/
Revised: 30 November 2016
/
Accepted: 6 December 2016
/
Published: 10 December 2016
(This article belongs to the Special Issue Non-Destructive Metallic Materials Testing—Recent Research and Future Perspectives)
Abstract
:The objective of the research presented here is the investigation of ultrasonic guided wave (UGW) propagation through the lap joint welded plates used in the construction of a storage tank floors. The investigations have been performed using numerical simulation by finite element method (FEM) and tested by measurement of the transmission losses of the guided waves transmitted through the welded lap joints. Propagation of the symmetric S0 mode in the welded stainless steel plates in the cases of different lap joint overlap width, operation frequency, and additional plate bonding caused by corrosion were investigated. It was shown that the transmission losses of the S0 mode can vary in the range of 2 dB to 8 dB depending on the ratio between lap joint width and wavelength. It was also demonstrated that additional bonding in the overlap zone caused by corrosion can essentially reduce transmission losses.
1. Introduction
In the petrochemical industry, corroded areas of a storage tank floor are an object of non-destructive testing (NDT). For this reason, testing for a high level of safety and the reliability of periodical maintenance of the tank and its floor should be performed, in order to avoid corrosion related accidents when hazardous chemical materials might get into the environment and groundwater. In order to avoid this, various NDT methods for the inspection of the construction elements in the petrochemical industry, such as penetrant testing, magnetics [1], eddy current [2], thermography [3,4], radiographic testing [5], acoustic emission [6], and ultrasonic techniques are used [7,8]. The main problems related to the inspection of the storage tanks and their floors using conventional NDT methods is that, in most cases, the tank has to be emptied, cleaned, and made safe for human entry before any inspection could be performed. It causes large financial and time costs to perform these operations.
In this regard, the most promising technique which enables inspection at relatively long distances (up to 100 m) and can be used for the inspection of storage tank floor from an outside perimeter of the tank is ultrasonic inspection method, based on the application of ultrasonic guided waves (UGW). Advantages of such a technique were successfully demonstrated on the long range applications for rapid screening of pipes [9,10,11,12], rails [13,14] and transmission lines [15]. At present, UGW technology is used primarily to detect and locate defective areas. A significant number of studies on the interaction of UGW with discontinuities in flat plates [16,17,18,19] and pipes [20,21,22,23,24] have been reported by a number of researchers. One challenge in UGW inspection is that general corrosion occurring over a large surface area may not create reflection sufficient for detections. In this regard, the primary effect on guided wave inspection when corrosion is present is an increase in the attenuation of UGW energy. If the attenuation is measured, it may be possible to produce an estimate of the degree of corrosion through the inspected object [23]. Unfortunately, other mechanisms besides corrosion such as additional coatings [23,25], loadings [26], temperature [23], construction features—e.g., welds, bends, and branches—can produce an increase of guided wave attenuation and influence the achievable inspection range. In the case of the tank floor, the attenuation of UGW is mainly conditioned by the leakage of guided waves to the liquid and the losses in the welded lap joints. It is necessary to take into account that, in order to propagate the whole tank floor, the UGW needs to pass multiple welds. Therefore, estimation of losses on the lap joint welds is a critical issue in determination of possibilities of such an approach.
A huge amount of work has been produced on the general topic of UGW propagation in lap joint connected objects, mainly targeting adhesively bonded [27,28,29,30,31,32], bolted [33], and brazed [34] lap joints. However, little attention was paid to metal plates joined using lap welds. It is necessary to underline that lap joint welds are essentially different from listed ones as it has narrow weld part and relatively wide unwelded part (overlap zone). Additionally, the contact condition in the overlap zone can vary due the heavy load of the filled tank, humidity, or partial corrosion. The influence of these parameters on the attenuation of the guided waves propagating through the weld have not been investigated sufficiently. So, the purpose of the research presented is to determine regularities and assess transmission losses of the UGW propagating through lap welds and to investigate how they are affected by the different lap weld overlap widths, operation frequency, and variation of bonding condition in overlap zone.
2. Numerical Simulation of the Guided Waves Propagation
2.1. Dispersion Curves
In the case of long range UGW application, the objects being tested are big and consequently the test samples for the inspection technique development also are big and expensive to manufacture, as well impractical to use in laboratory conditions. Due to this reason, we decided to use scaled-down physical and numerical models of the object simultaneously. In a corresponding way, we changed the operation frequency. Such an approach is valid as the properties of UGW depend on frequency-thickness product fd and linear acoustic propagation is assumed. This means that, if the dimensions of the object—including plate thickness—are reduced by the factor N then the frequency of selected ultrasonic waves will be higher by the same factor N and the properties of the guide wave will be the same. So, instead of investigating large objects, it is reasonable to carry out investigations with the scaled-down models and verify determined regularities on a real-sized object afterwards.
In order to answer the questions related to UGW propagation in a tank floor constructed out of multiple lap joint welded plates, models with the scaling factor 1:8 were developed and investigated. Investigations were carried out by using stainless steel plates. The elastic properties of materials used in the numerical model were as follows: density ρ = 8000 kg/m3, Young’s modulus E = 193 GPa, shear modulus G = 77.2 GPa, and Poisson’s ratio ν = 0.31. In order to properly select the operation frequency and modes suitable for investigation, the dispersion curves of the phase cph and group cgr velocities in the 8 mm thickness and in the scaled-down 1 mm thickness stainless steel plates were calculated using the semi-analytical finite element (SAFE) method [35,36]. The algorithm of the method was implemented by the authors. The calculated dispersion curves of UGW are presented in Figure 1. The dashed line denotes the frequency selected for investigations. This frequency for a real-sized object is 50 kHz, and for a scaled-down model is 400 kHz. The product fd in both cases is the same. The velocities of the fundamental guided wave modes in the case of 1 mm thickness steel plate at the selected operation frequency are presented in Table 1.
The symmetric S0 guided wave mode was selected for analysis due to several key properties of this wave mode [37]:
- the group velocity of the symmetric S0 wave mode is highest, ensuring that it arrives before any other modes, thus making it easier to identify and separate the time interval in the measured signals;
- symmetric S0 wave mode is less sensitive to liquid boundary interaction. It has lower attenuation and leakage losses compared to the asymmetric A0 wave mode, thus it enables stronger signals to be received at a longer propagation distance.
2.2. Transmission Losses Dependence from Lap Joint Width and Operation Frequency
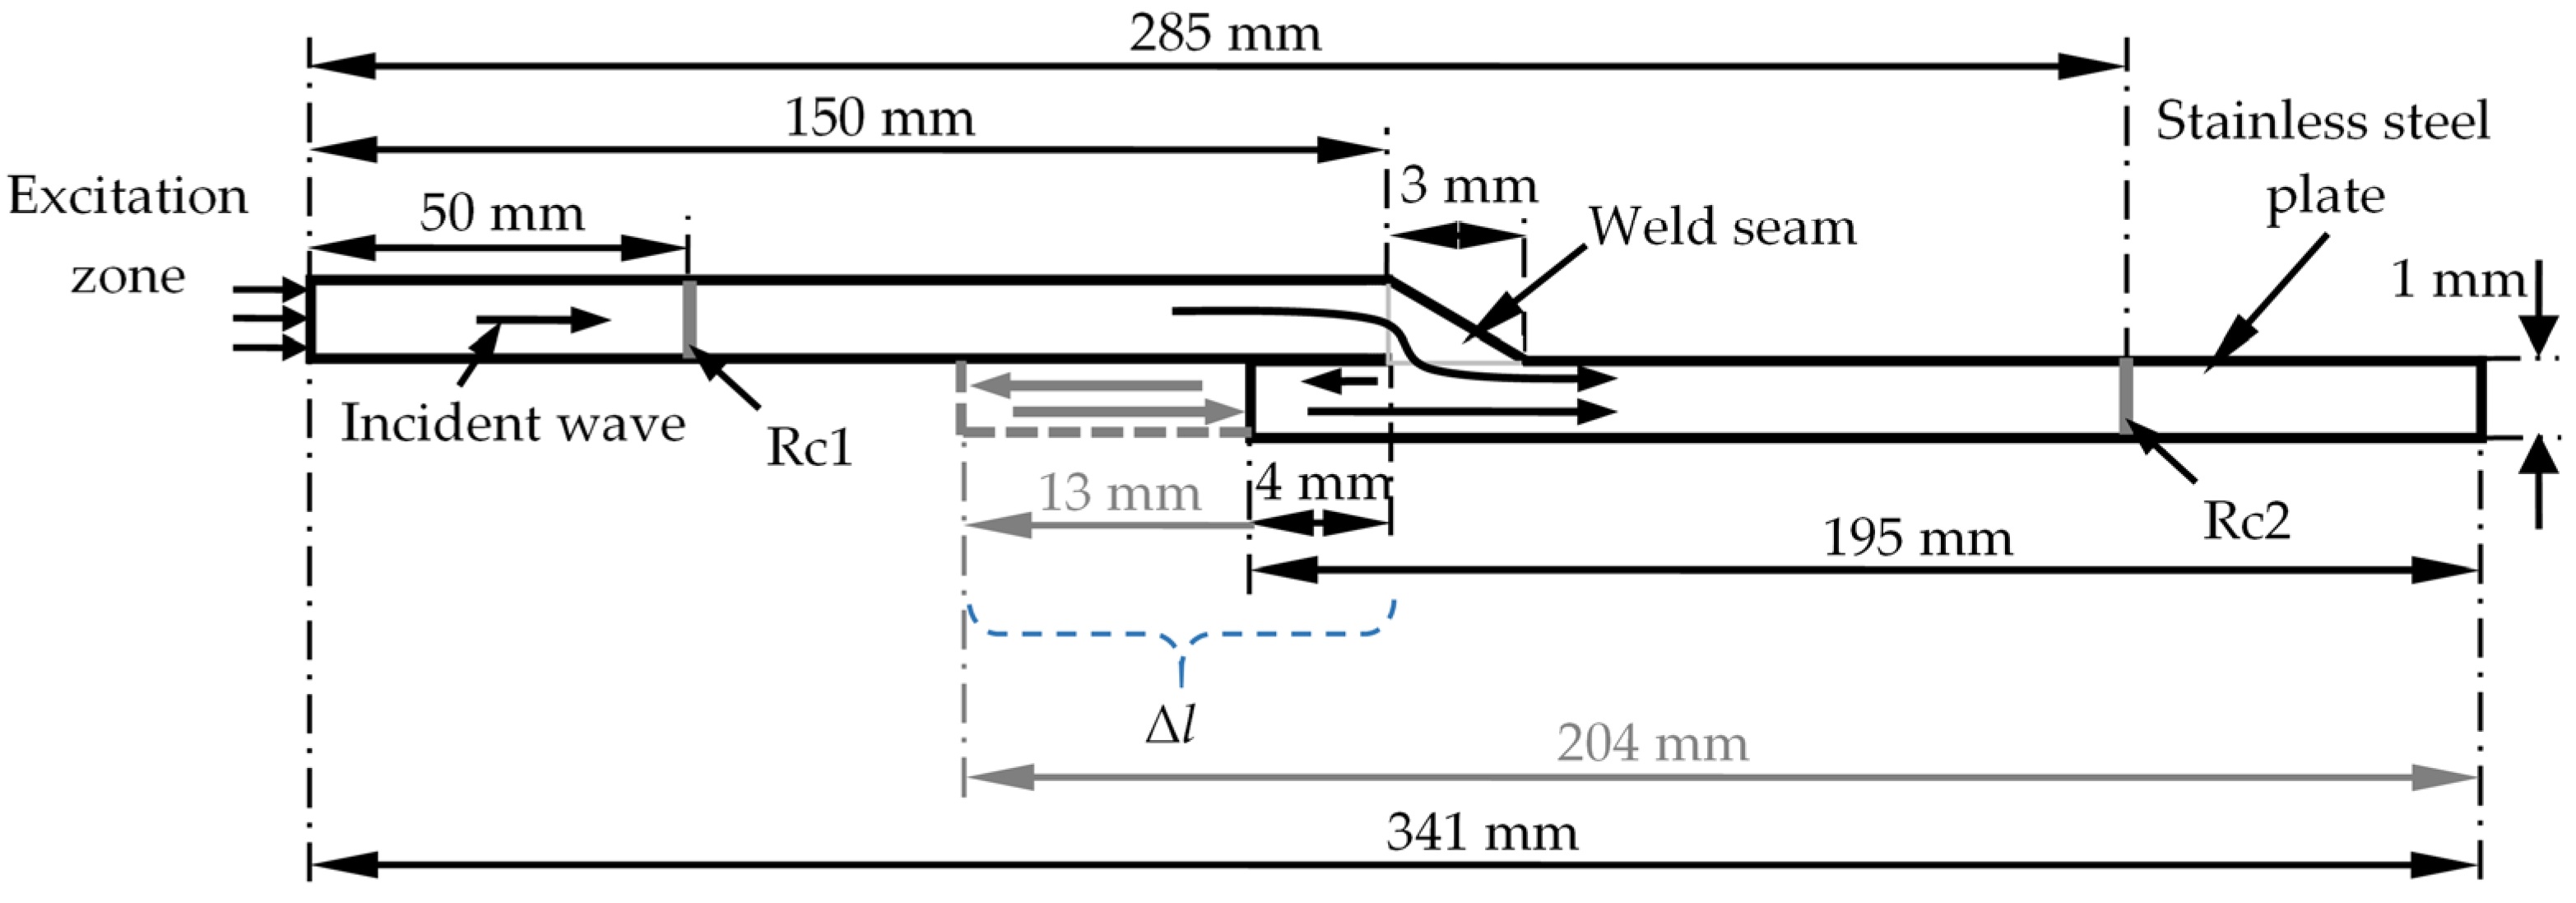
In order to investigate how the welded lap joint overlap zone width Δl influences propagation of the UGW symmetric S0 mode and its transmission losses αS0(f) the numerical modelling was carried out using the finite element (FE) method. The model of the lap joint used in the numerical investigation is presented in Figure 2. It should be noted that the model is presented on different vertical and horizontal scales.
The ANSYS finite element software was used to obtain wave propagation through the 2D geometry which includes an implicit algorithm with Newmark time integration method for solving the transient wave propagation. The model of elastic wave propagation is based on the assumption of linear elasticity and solution of the Navier equation of the elastic wave motion in matrix form [38,39,40,41,42,43,44]:
where M is the mass matrix, C is the damping matrix, K is the stiffness matrix, —are the nodal displacement, velocity, and acceleration vectors, respectively, F is the externally applied excitation nodal forces. To simplify the model, a linear elastic solid is considered and no damping is added in this study (C = 0). The model under investigation was considered to be infinite in the z direction so that the plane strain condition is used, which assumes that all strains occurs in the x–y direction and there are no strains in the z direction. Four-node PLANE42 linear elements were used to represent the 2D section in the plane strain. The element has four nodes, each with two degrees of freedom—translations in the nodal x and y directions. The spatial size of the finite element was set to 0.2 mm, which corresponds to 21 elements per wavelength in accordance with the minimum wavelength of the slowest asymmetric A0 wave mode at the 400 kHz frequency (Table 1). The excitation was performed by applying longitudinal force as five periods of 400 kHz sine-burst with the Gaussian envelope signal to the edge of the model (Figure 2). The time integration step dt = 10 ns is equal to 1/250 of the period at 400 kHz central frequency. The time interval used for the modelling of elastic wave propagation was Δt = 0 ÷ 80 μs. The overlap zone width Δl of the lap joint between welded plates was gradually changed from 4 mm up to 13 mm by steps of 1 mm. The material elastic properties in the modelling were used such as presented in Section 2.1.
The signals corresponding to the fastest propagating symmetric S0 UGW mode were acquired by selecting the sets of nodes at the positions Rc1, 50 mm and Rc2, 285 mm distance from the excitation zone. The position Rc1 is situated before the lap joint weld and Rc2—after the lap joint weld, respectively. The distances were selected in a way that ensured the sufficient time domain separation of different guided wave mode signals. The received signal was assumed to be the mean value of the longitudinal particle velocity across the plate thickness, which was calculated by using the following presented expression:
where, Ne is the number of nodes and un is the nodal value of the longitudinal particle velocity in node n. The time intervals corresponding to the fastest propagating symmetric S0 UGW mode signals were selected from the time diagrams of the received signals by using the Hanning window. The transmission losses αS0(f) of the selected wave mode were calculated by using the following equation:
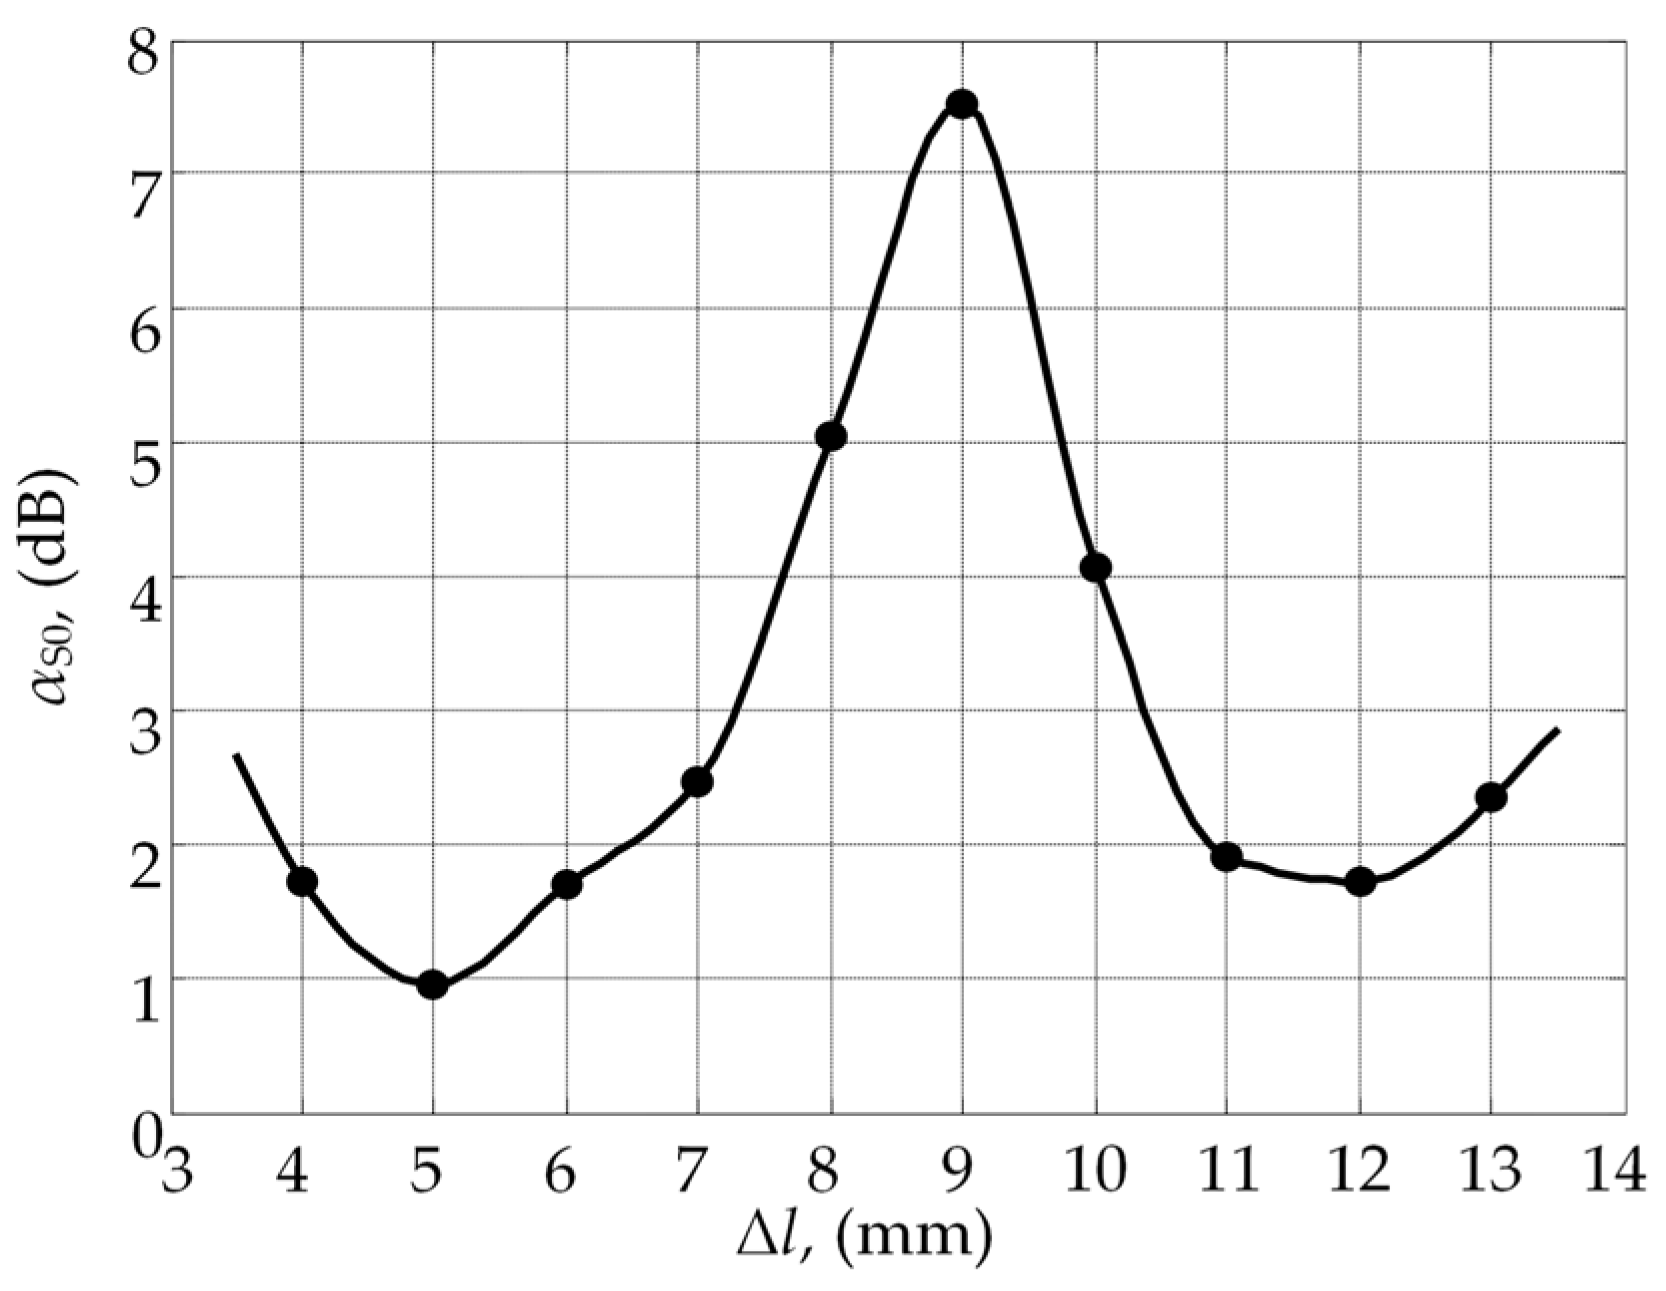
where, ur(t) is the reference ultrasonic signal (picked-up by the virtual receiver Rc1 before the weld), u1(t)is the ultrasonic signal transmitted through the weld (picked-up by the virtual receiver Rc2 behind the weld), FT denotes Fourier transform. The obtained waveforms of the signals in the time domain of the ultrasonic symmetric S0 wave mode are presented in Figure 3. The variations of the signal amplitude related to different widths of the overlap zone can be observed (Figure 3b). The obtained transmission losses αS0(f) of the symmetric S0 wave mode for the current lap joint weld width Δl meaning were acquired by taking the value corresponding to the frequency f = 400 kHz. The obtained transmission losses dependence versus plate overlap zone width is presented in Figure 4, where dots denote transmission losses value obtained by FE analysis, and the solid line denotes the interpolation by piecewise cubic Hermite polynomial.
It was observed that the overlap zone width Δl in the welded lap joint essentially influences the transmission losses αS0(f) of the analyzed symmetric S0 wave mode and varies from 1 dB/weld up to 7.5 dB/weld depending on lap joint overlap width. The results demonstrated that the highest transmission losses αS0(f) of the symmetric S0 wave mode are obtained in the case of 9 mm overlap zone width. The obtained dependence of transmission losses αS0(f) can be explained by the fact that UGW are reflecting back and forth within the free edge of the overlapped part of the plate and this produces a series of signals which interfere with each other in such a way that it becomes essentially dependent on the length of propagation path which is defined by the width of the overlapped zone. On the other hand, it means that it is dependent on the wavelength λ of the symmetric S0 wave mode.
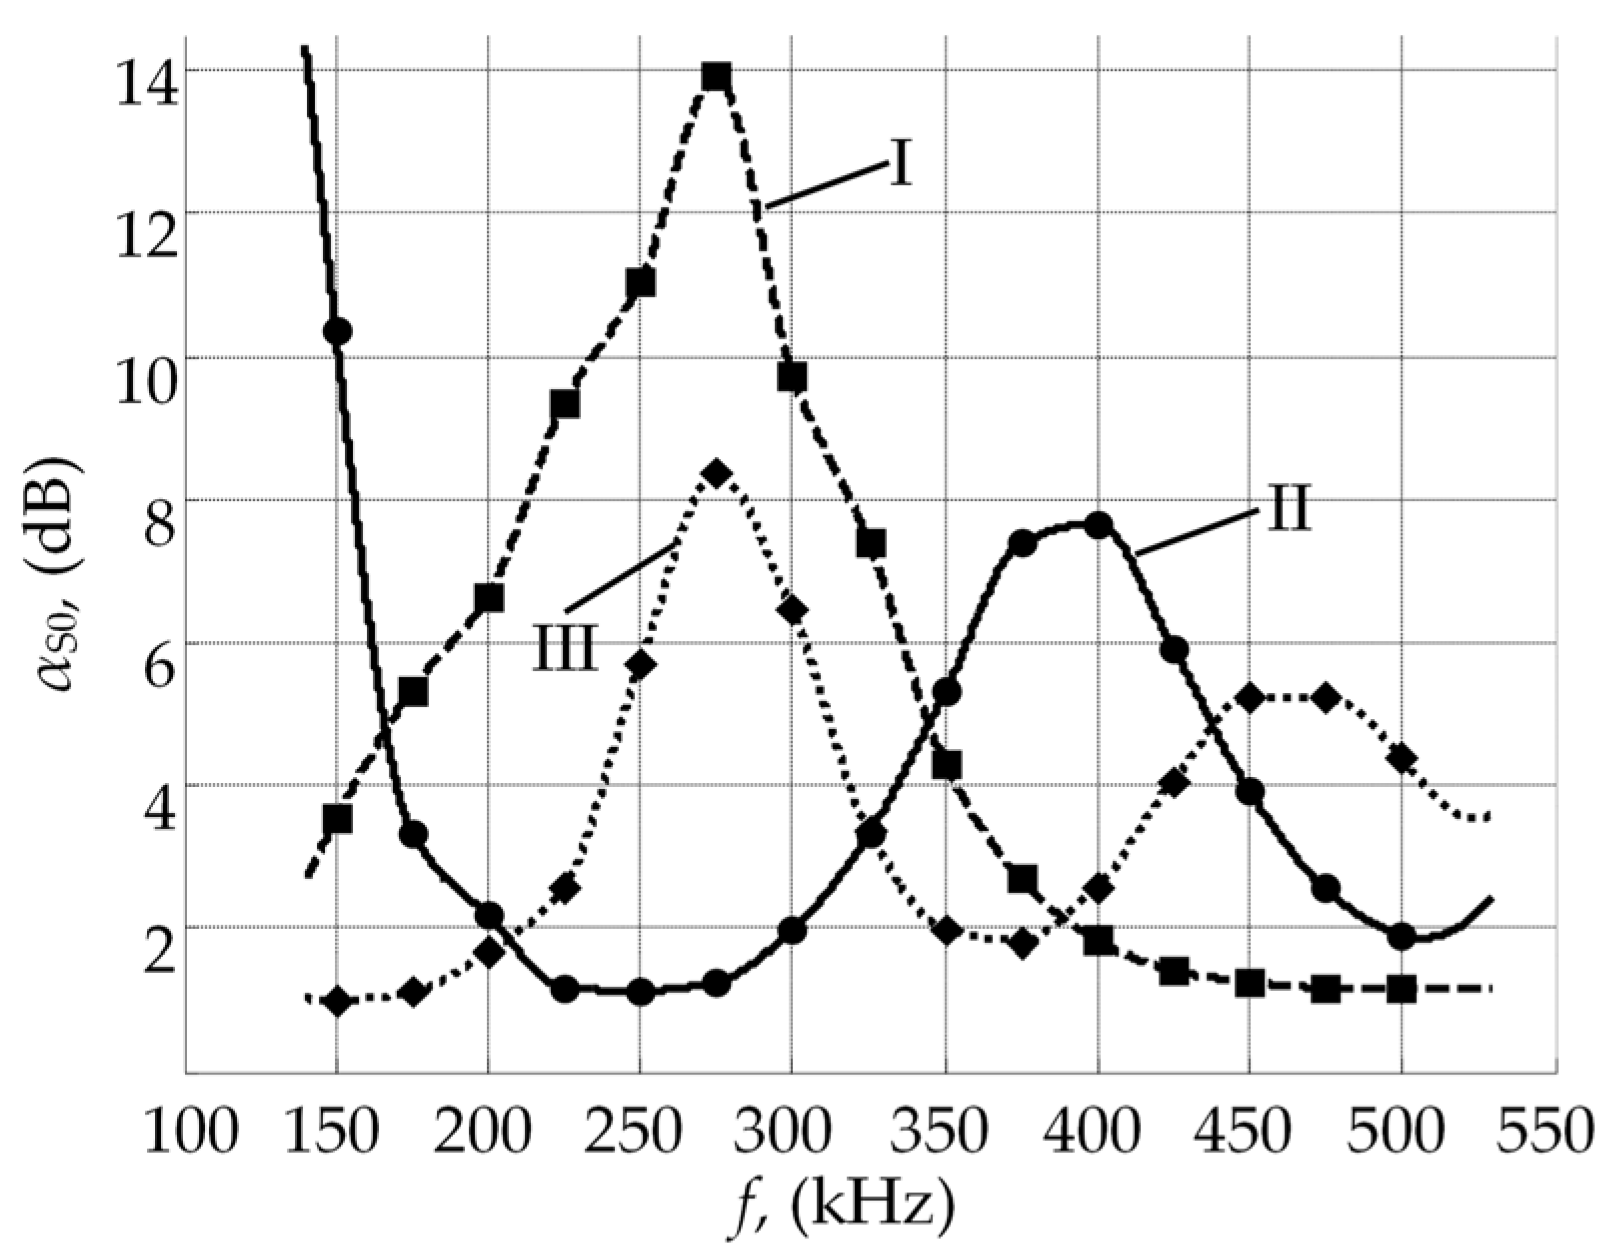
In order to determine how the transmission losses αS0(f) of the symmetric S0 wave mode for particular lap joint overlap zone widths depend on excitation frequency, numerical modelling was carried out. The frequency of the excitation signal (five periods of sine-burst with a Gaussian envelope) was changed in the frequency range from 150 kHz up to 500 kHz with 25 kHz steps. Obtained dependencies of the transmission losses αS0(f) in the case of different frequencies and different overlap zone widths (Δl = 4 mm, Δl = 9 mm, Δl = 13 mm) are presented in Figure 5.
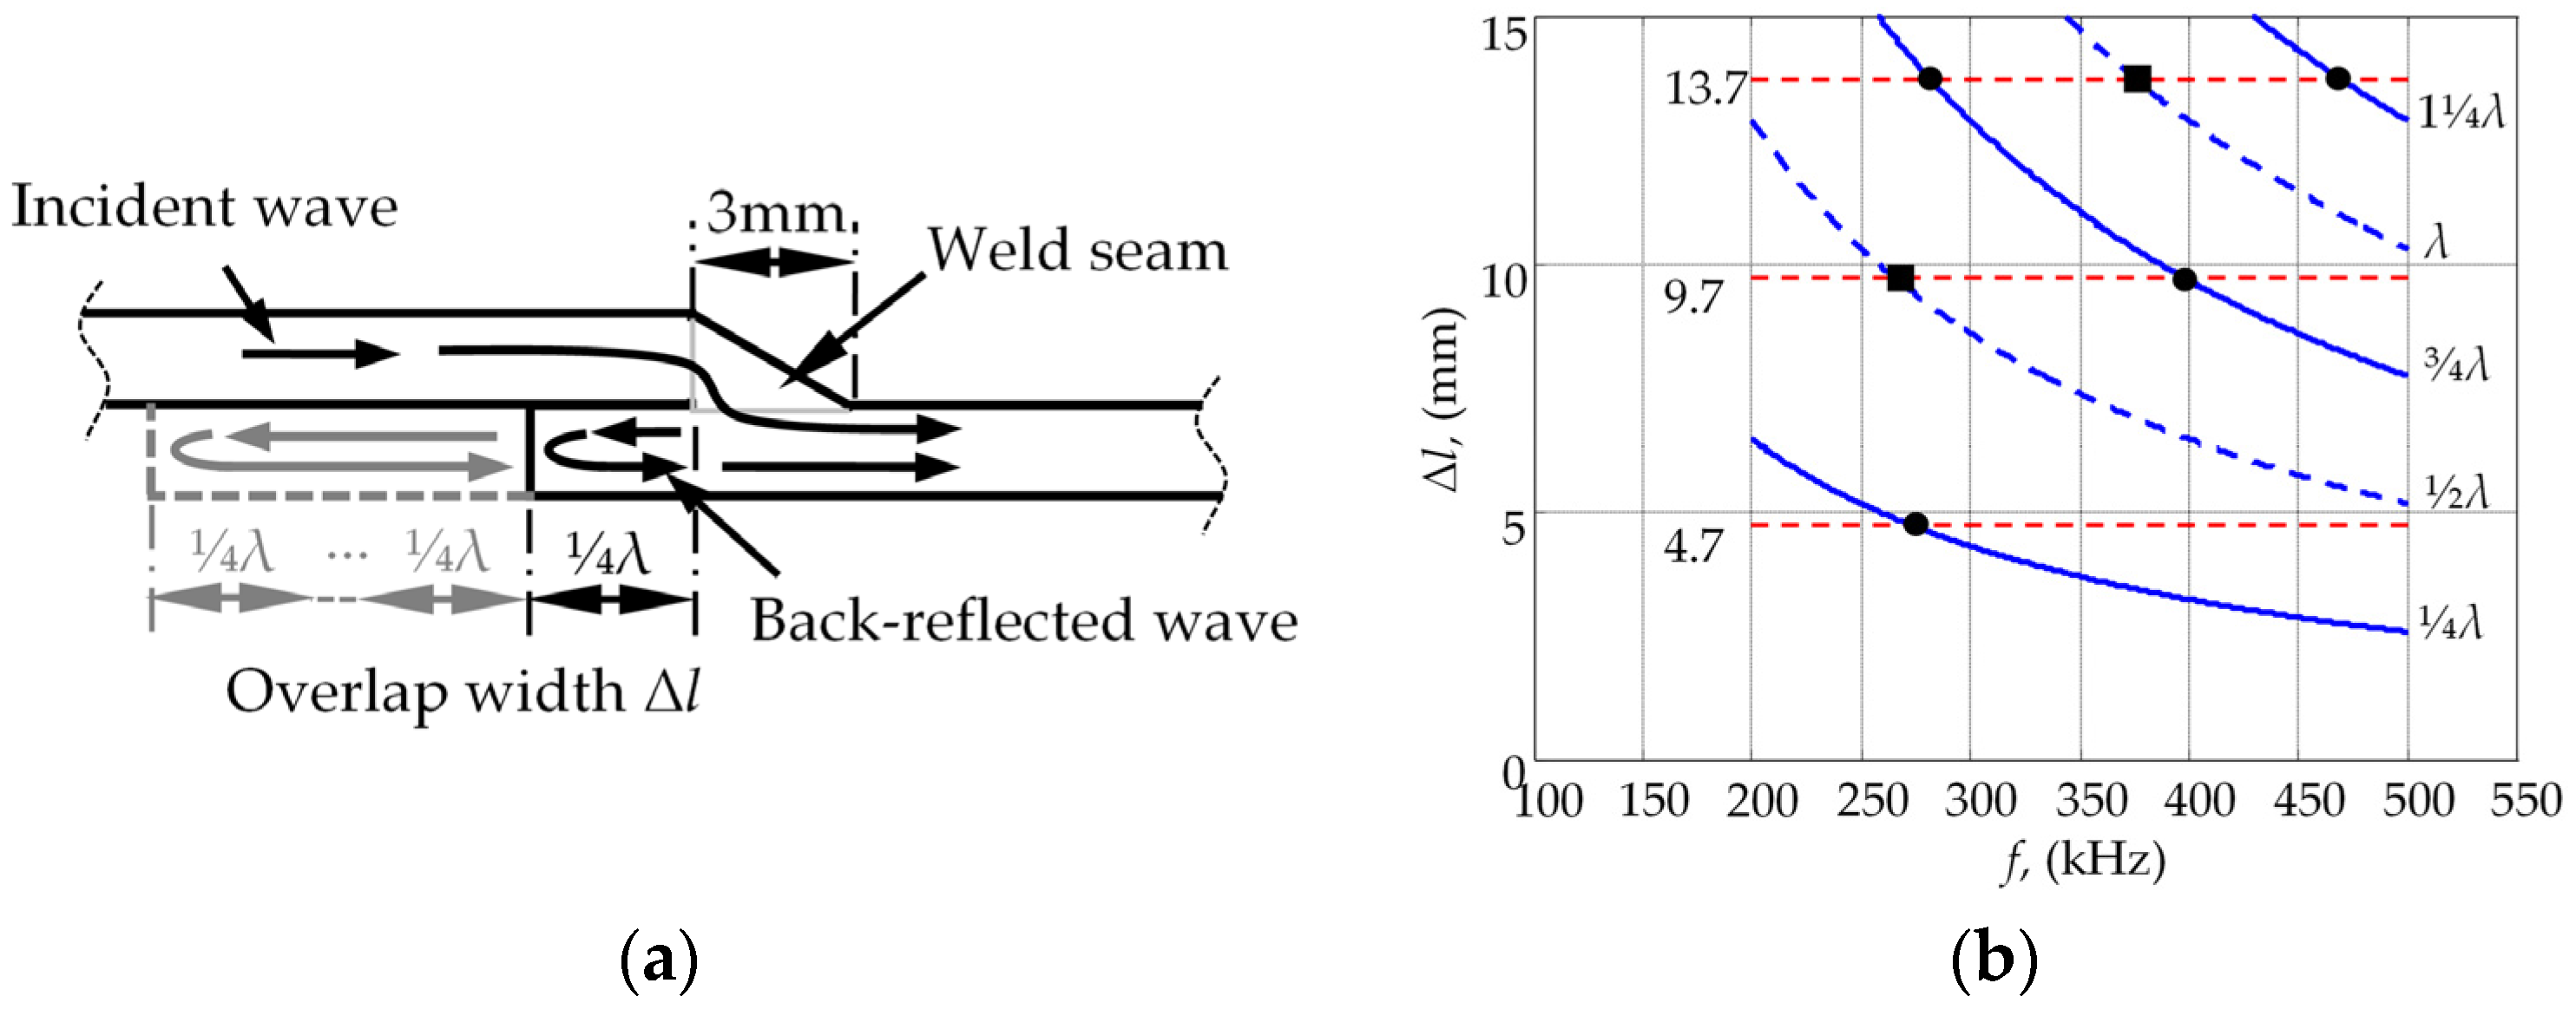
The presented results demonstrate that there are some regular changes of maxima and minima in the dependency of the transmission losses versus frequency. The dependency of the transmission losses versus frequency is different for different overlap zone widths. In this case, it can be assumed that the superposition of the direct waves and the waves reflected by the free end of lap joint of S0 wave mode signals takes place, and hence depending on the total width of the lap joint Δl, leads to a larger or lover amplitude of the resultant wave. In the case of the single-edge closed reflector, the maxima or minima will appear at every integer number of ¼λ per lap joint width (Figure 6a). So, it can be stated that the increase of transmission losses αS0(f) of symmetric S0 wave mode transmitted through the lap joint is expected at every odd number of ¼λ per lap joint width. Meanwhile, on the even number of ¼λ per lap joint width, a reduction of the transmission losses could be observed. This regularity can be expressed by
The graphical representation of the maxima and minima of transmission losses αS0(f) versus frequency and lap joint width Δl are presented in Figure 6b.
The numerical investigation performed on the UGW propagation through the single lap joint welded connection demonstrated that the overall transmission losses αS0(f) of the symmetric S0 wave mode are strongly dependent on the selected system parameters, such as width of lap joint Δl and operation frequency. Thus, it was observed that—depending on the wavelength per lap joint width—the increase (related to the odd number of ¼λ) or reduction (related to the even number of ¼λ) of transmission losses could be observed.
2.3. Transmission Losses Dependence on Plates Bonding
As was demonstrated in investigations carried out earlier by a number of researchers, the dispersive behavior of UGW is strongly dependent on the bonding state between lap joint connected objects [27,29,30,31,32,45,46]. Thus, the velocity and amplitude of UGW signals transmitted through lap joint are among the main parameters to be affected [27,28,29]. Typically, in adhesive bonding, the elastic waves are transmitted through the adhesive layer in the overlap region where the adhesive serves as a medium for wave transmission and the overall efficiency of the transmission is mostly affected by the width of the lap joint area and adhesive layer parameters by itself. In contrast to adhesively bonded lap joints, lap joints produced in storage tank floor construction are commonly connected only by the weld seam. The overlap zone which in its original state does not possess acoustic coupling between the upper and lower plates during long period of tank exploitation (usually design life of an aboveground storage tank is 25 years, but in some cases may be in use for 50–70 years) leads to partial cohesion of the plates in overlap zone. The physical factors leading to it can be pressure of the filled tank, moisture retention in the lap and corrosion. How such phenomena are affecting transmission losses αS0(f) of the selected S0 guided wave mode was the task for the second stage of investigation.
To achieve this goal, three cases of the UGW propagation through the lap joint welded plates were analyzed (Figure 7):
The modelling was performed by using the same FE model parameters as those presented in the previous subsection. During the modelling, it was assumed that—due to cohesion of the plates in overlap region—there is solid contact. In the case of solid contact, it was assumed that the contact layer between plates has the properties of stainless steel. This means that the contact allows the propagation of both normal and tangential components of the waves. The transmission losses αS0(f) of the selected wave mode were calculated by comparing the spectra of the acquired S0 wave mode signals, observed before lap joint connection and after it, by using Equation (3) presented earlier. The predicted transmission losses αS0(f) of the analyzed symmetric S0 wave mode for different plate bonding conditions are presented in Figure 8.
The numerical investigation that we carried out demonstrated that the highest transmission losses αS0(f) of the analyzed ultrasonic symmetric S0 guided wave mode are obtained in the case where plates in the lap joint are connected only by the weld seam. The predicted value of the transmission losses αS0(f) of S0 mode at 400 kHz frequency were estimated to be 7.7 dB/weld. Meanwhile, in the case of the partially and fully bonded lap joints, these transmission losses of the S0 wave mode were obtained to be 2.1 dB/weld and 2.7 dB/weld, respectively. Such a decrease of the transmission losses αS0(f) for the analyzed symmetric S0 guided wave mode in the case of the partially and fully bonded lap joint welds may be explained by the fact that due cohesion changes the width of the connection zone between lap joint welded plates. The performed numerical modelling demonstrated that average value of the transmission losses of symmetric S0 wave mode were at a level of 8 dB/weld, but additionally these losses strongly depend on cohesion between plates. Taking into account that there can be 10 s of welds across the tank floor, the total transmission losses may exceed 100 dB. However, considering possible plate cohesion in the overlap region, those losses are expected to be much lower.
3. Experimental Investigation of Guided Wave Propagation through Lap Joints
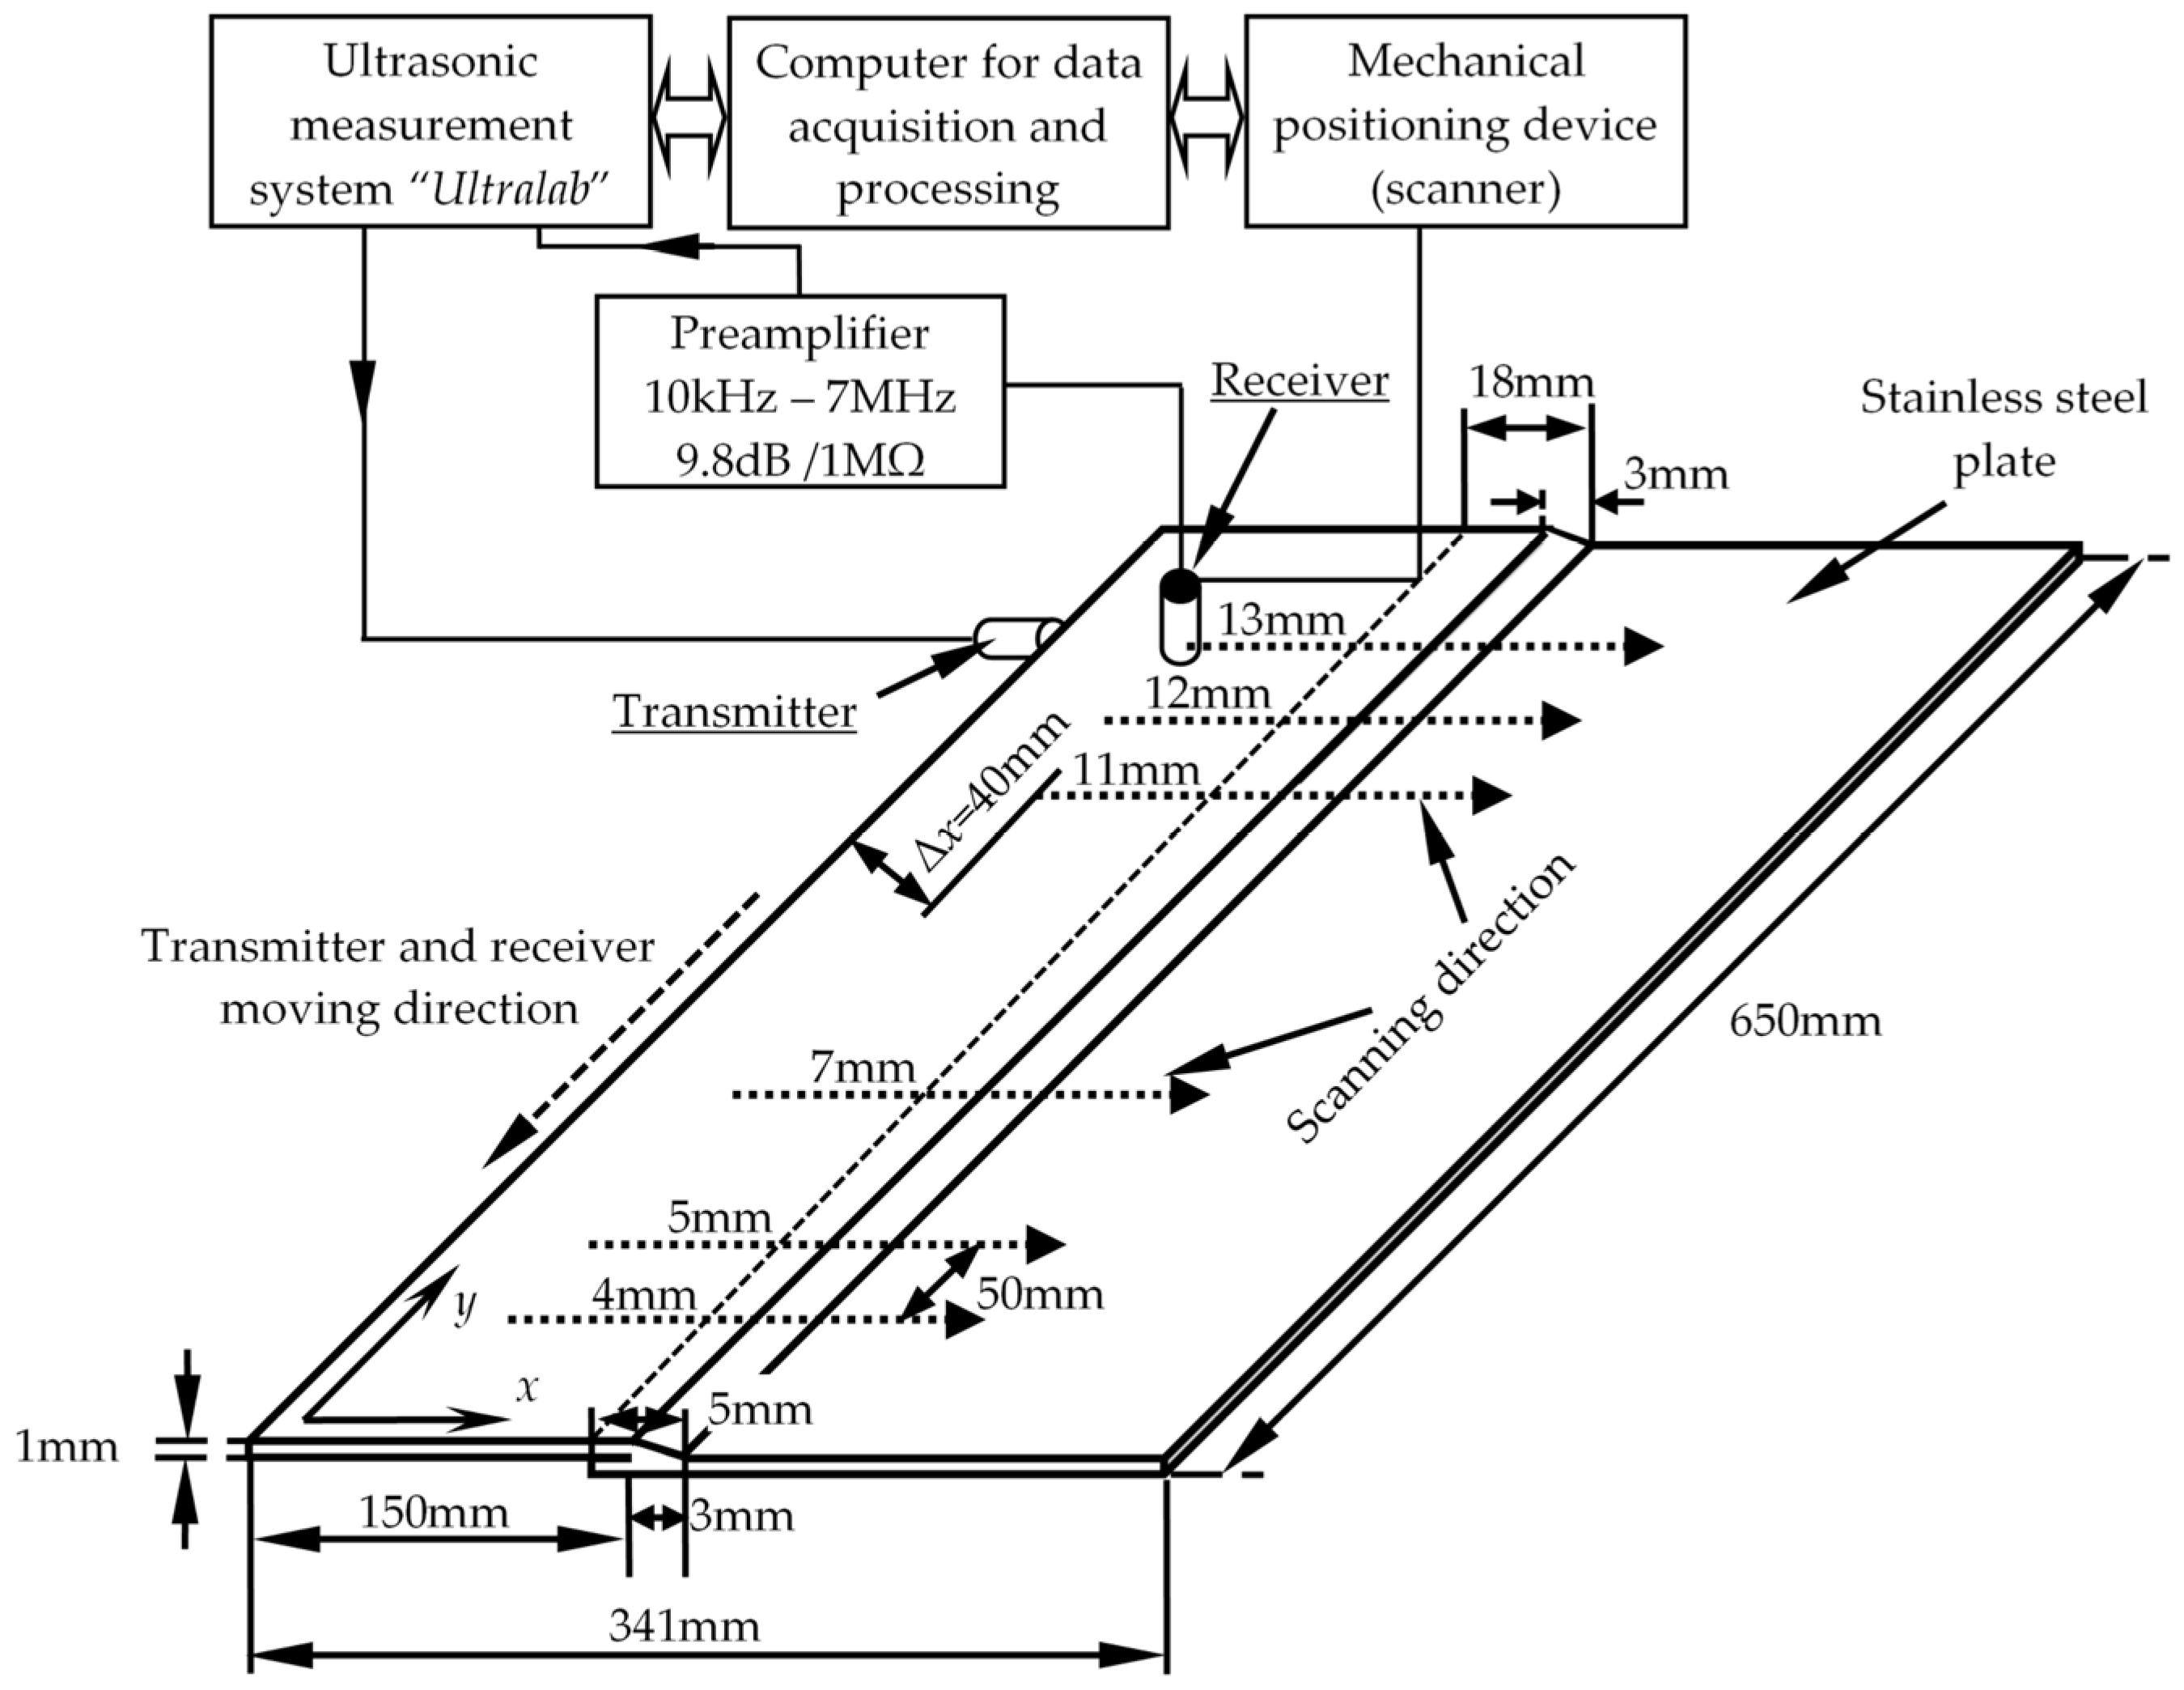
The objective of this part was the experimental verification of the modelling results, obtained using a finite element model. For this purpose, the special test sample was manufactured by welding two 1 mm-thick stainless steel plates together. The plates were welded using lap welds with different overlap zone width Δl, which linearly change from 2 mm up to 15 mm (Figure 9). The width of the weld seam was 3 mm. Experimental investigation of the ultrasonic symmetric S0 guided wave mode propagation through the welded lap joint was performed using the experimental set-up presented in Figure 9.
The low frequency ultrasonic measurement system “Ultralab”, produced and manufactured at Prof. K. Barsauskas Ultrasound Research Institute of Kaunas University of Technology, was used as the control instrument for measurements. The wideband ultrasonic transducers operating in the thickness mode were used for the generation and reception of the ultrasonic guided wave signals. The excitation was performed by using three periods of rectangular pulse with a frequency of 400 kHz and an amplitude of 300 V. The reception of the propagating ultrasonic guided waves was performed by using low frequency ultrasonic transducer having special wear-proof convex form replaceable protector made out of fiberglass with a contact area of 1 mm [47,48,49]. The frequency responses of the ultrasonic transducers used as the transmitter and the transducer used as the receiver are shown in Figure 10. The sampling frequency fs was selected fs = 100 MHz, the frequency range of the amplifier filters was 0.02 MHz–2 MHz and the total gain of amplifiers was 45 dB.
The experiments were carried out in the following way. The transmitter was attached at the first position to the edge of the stainless steel plate (in order to create the longitudinal force) using specially developed spring-type adjusters and the receiver was scanned across the weld in the x direction (Figure 8). Scanning of the test sample for the B-scan type data collection of the propagating ultrasonic guided waves was performed by using a one-axis scanner with the scanning step of 0.1 mm and the total scanned distance was x = 270 mm. At each position, the signals were recorded to form a B-scan image of the ultrasonic guided waves propagating in the lap welded stainless steel plates. In order to improve the signal to noise ratio, the averaging of the eight signals at each measurement position was used also. The initial distance between transducers was set to be ∆x = 40 mm. It was selected so that asymmetric A0 and symmetric S0 guided wave modes would be separate in time domain already at the initial measurement position. Oil was used as the coupling material between transducers and test sample. Then the transmitter was attached to the second position along the edge and the scanning along the x axis was repeated. The distance between each measurement position along the plate edge was 50 mm, in total the measurements were performed across 450 mm of the edge. This enabled investigation of the test sample in the area where the width of the lap joint overlap zone Δl is gradually changing from 4 mm up to 13 mm with steps of 1 mm.
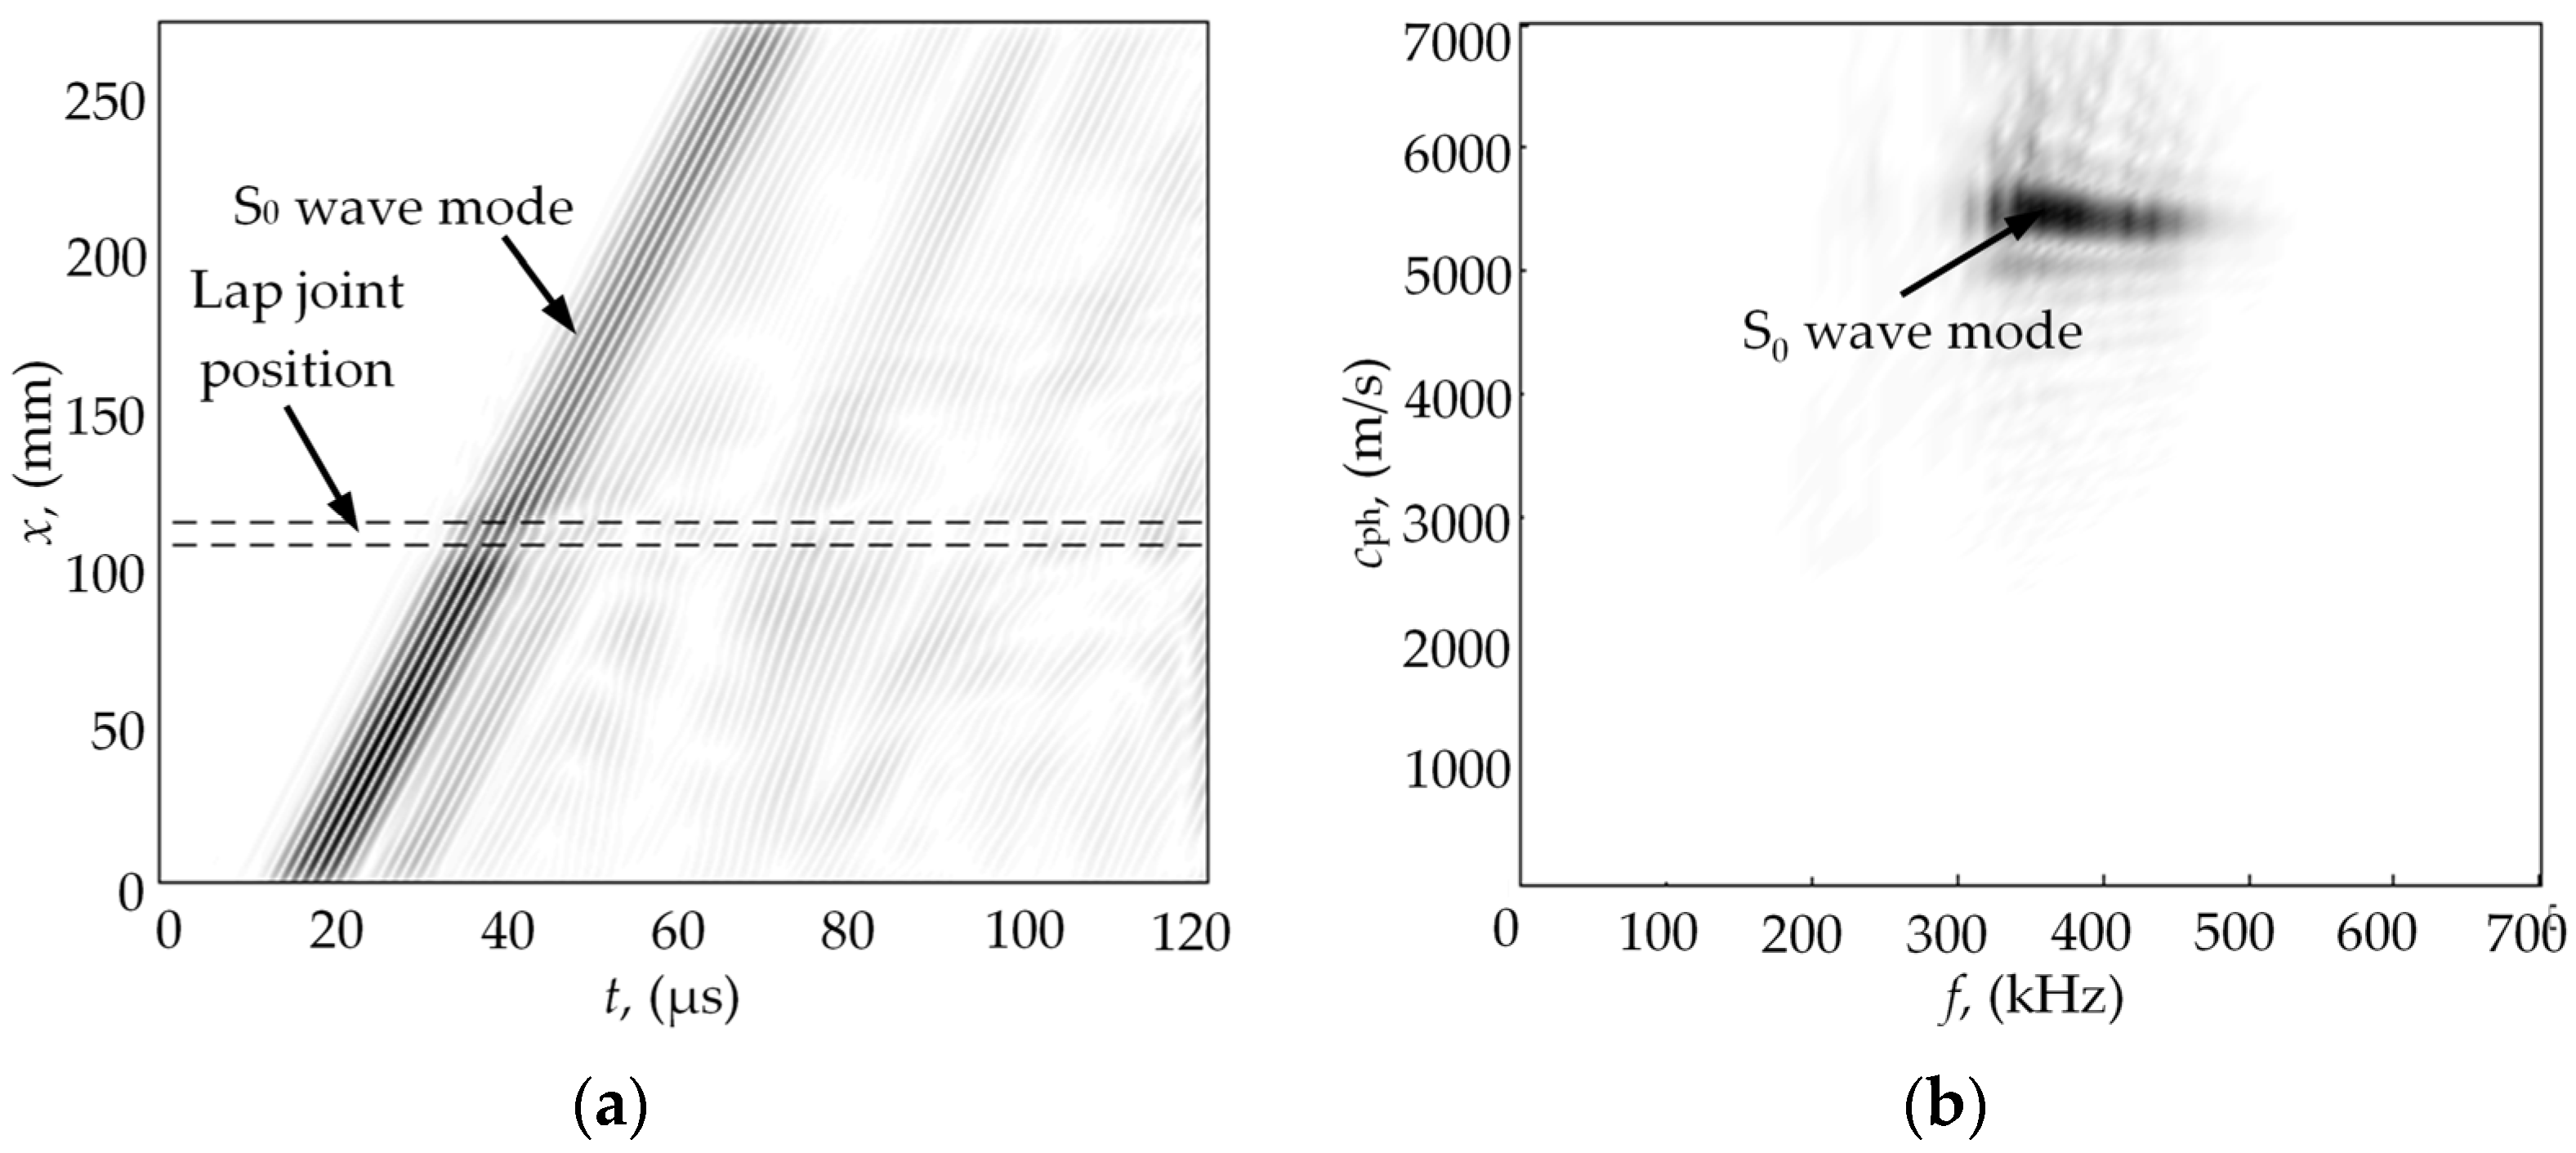
The measured signals in the form of a B-scan image (in the case of 4 mm overlap width) are presented in Figure 11a. Dashed lines denote the positions of the lap welds. In the B-scan image, the pattern of the propagating symmetric S0 and asymmetric A0 UGW modes could be clearly observed, as well the occurring reflection and mode conversion on the weld. The wavenumber-frequency analysis has been reported as an effective means for wave mode identification and propagation analysis. The wavenumber-frequency representation of time-space wavefield data u(x,t) was performed by using the 2D Fourier transform (FT), which is defined as [50,51,52,53,54,55,56]:
where, x is the spatial coordinate, t is the time, ω is the angular frequency, k is the wavenumber. Taking into account that k = ω/cph, the U(k,f) can be easily transformed into U(cph,f). The reconstructed patterns of the dispersion curves of the ultrasonic guided wave modes propagating in the welded plate are presented in Figure 11b.
From the results presented in Figure 11, it was observed that the most dominant and strongest propagating ultrasonic guided wave mode in the investigated test sample is the asymmetric A0 wave mode. It could be explained by the fact that, for reception, the thickness mode ultrasonic transducer was used. Such a transducer has an essentially higher sensitivity to the out-of-plane uy displacement component which is dominant for asymmetric A0 wave mode motion. This is mainly due to the attached protector, which possesses a special shape, enabling it to record the modes with a dominant longitudinal component. Nevertheless, the propagating symmetric S0 wave mode, which has lower amplitude, can also be clearly observed. It can also be noticed, that the asymmetric A0 guided wave mode in the investigated test sample was generated at the lower 40–450 kHz frequency range. Meanwhile, the symmetric S0 wave mode was generated at the 320–450 kHz frequency range.
In order to separate the signals of symmetric S0 wave mode propagating in forward direction from the reflected waves and from other guided wave modes, the 2D filtering in the wavenumber-frequency domain was used. The filtering process can be mathematically expressed as the product between the wavenumber-frequency spectrum U(k,f) and filter function W(k,f) [52,53,55]:
where, W(k,f) is the 2D bandpass filter in the wavenumber-frequency domain and UW(k,f) is the filtered 2D spectrum. The filtered spectrum UW(k,f) is then transformed back into the space-time domain using the inverse 2D FFT in order to obtain the filtered wavefield uW(x,t) [55]
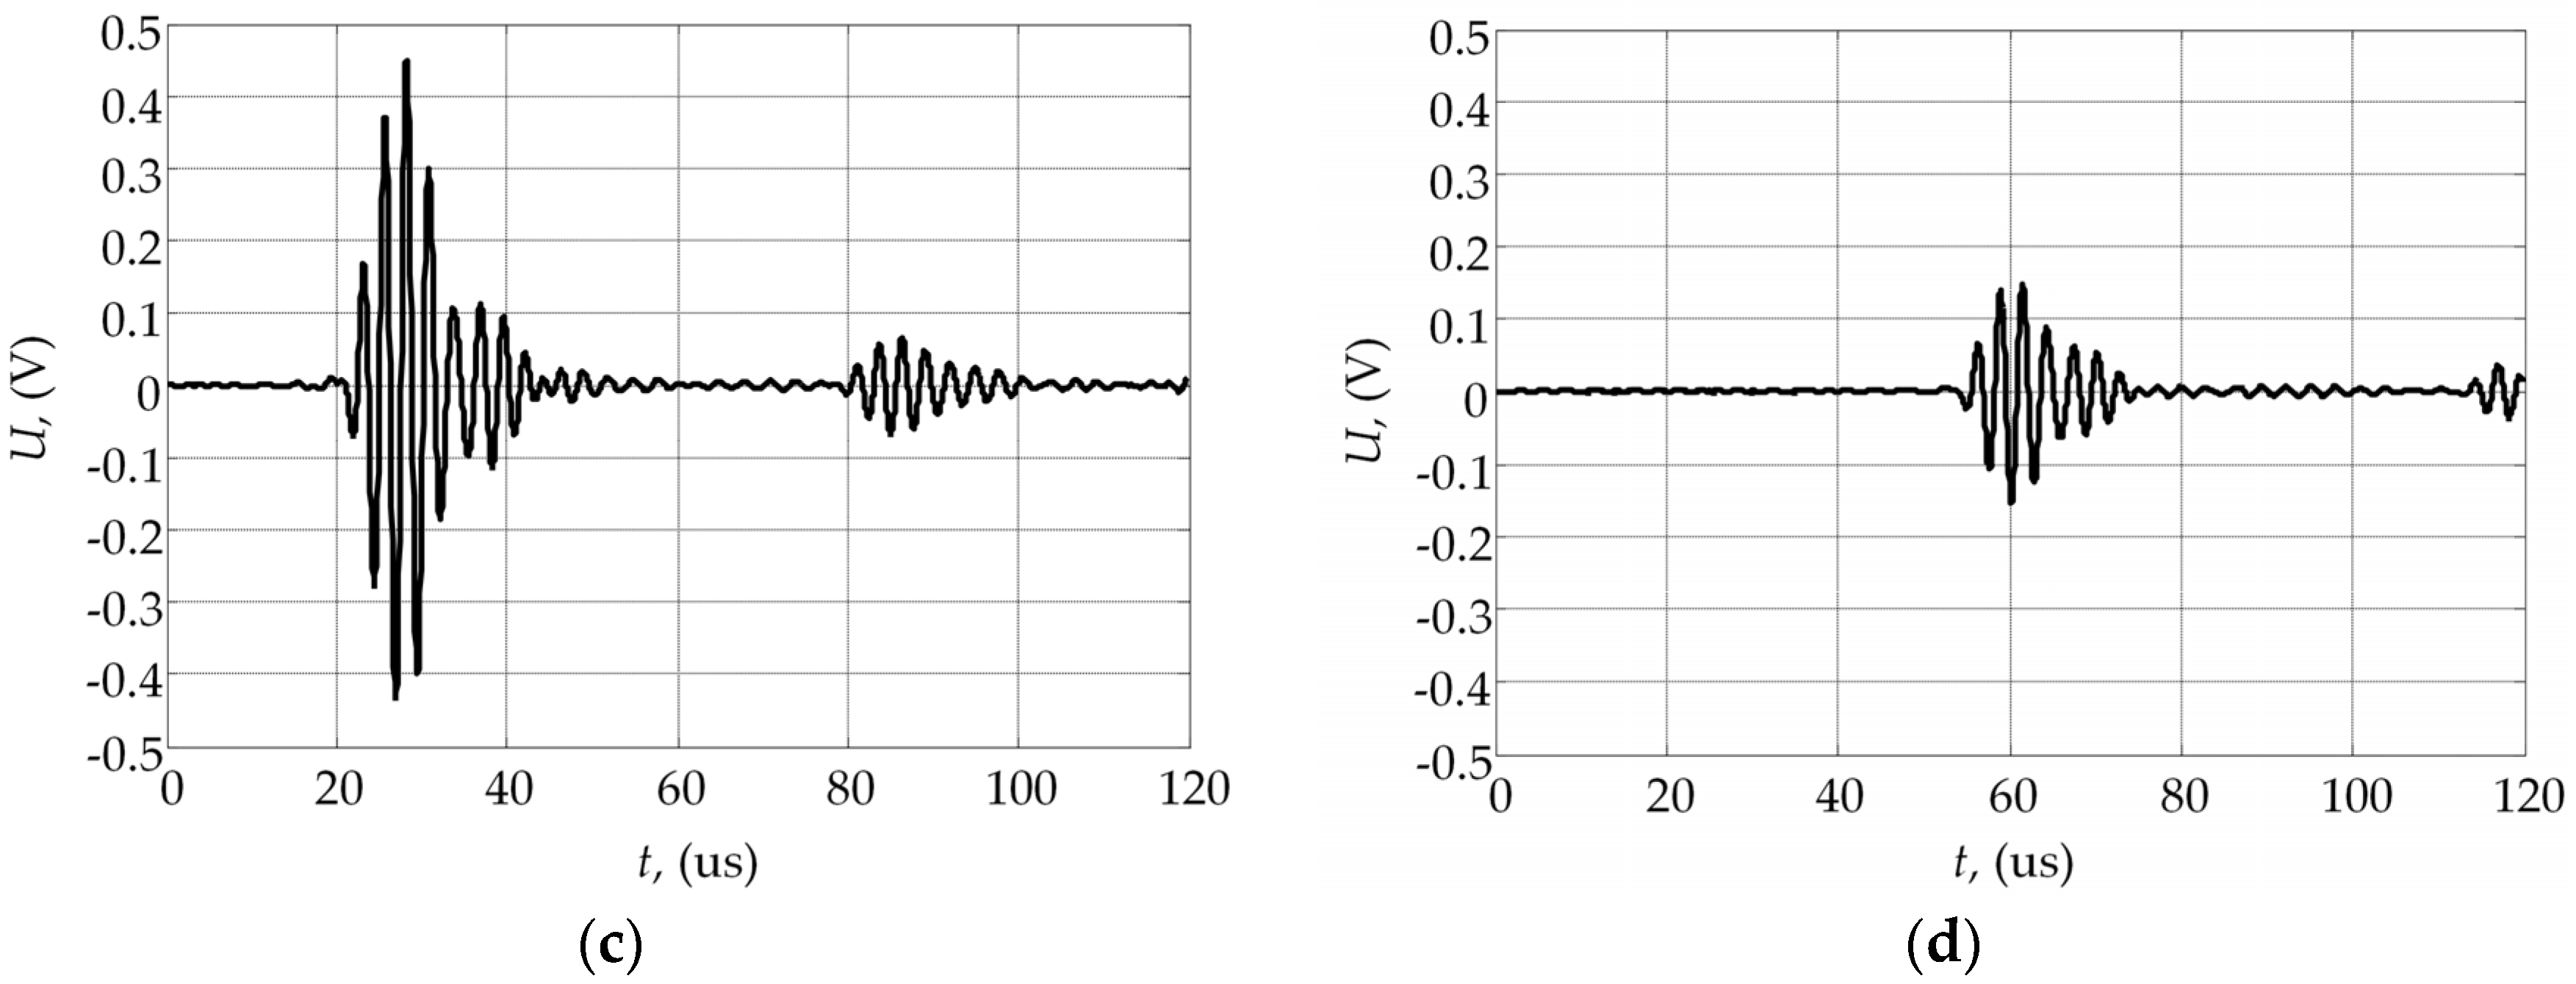
The filtered 2D UW(k,f) spectrum converted into the phase velocity–frequency domain UW(cph,f) and reconstructed afterwards B-scan uW(x,t) are presented in Figure 12. As an example, the time waveforms of the experimentally measured UGW signals and experimental signals after using spatial mode filtering are presented in Figure 13.
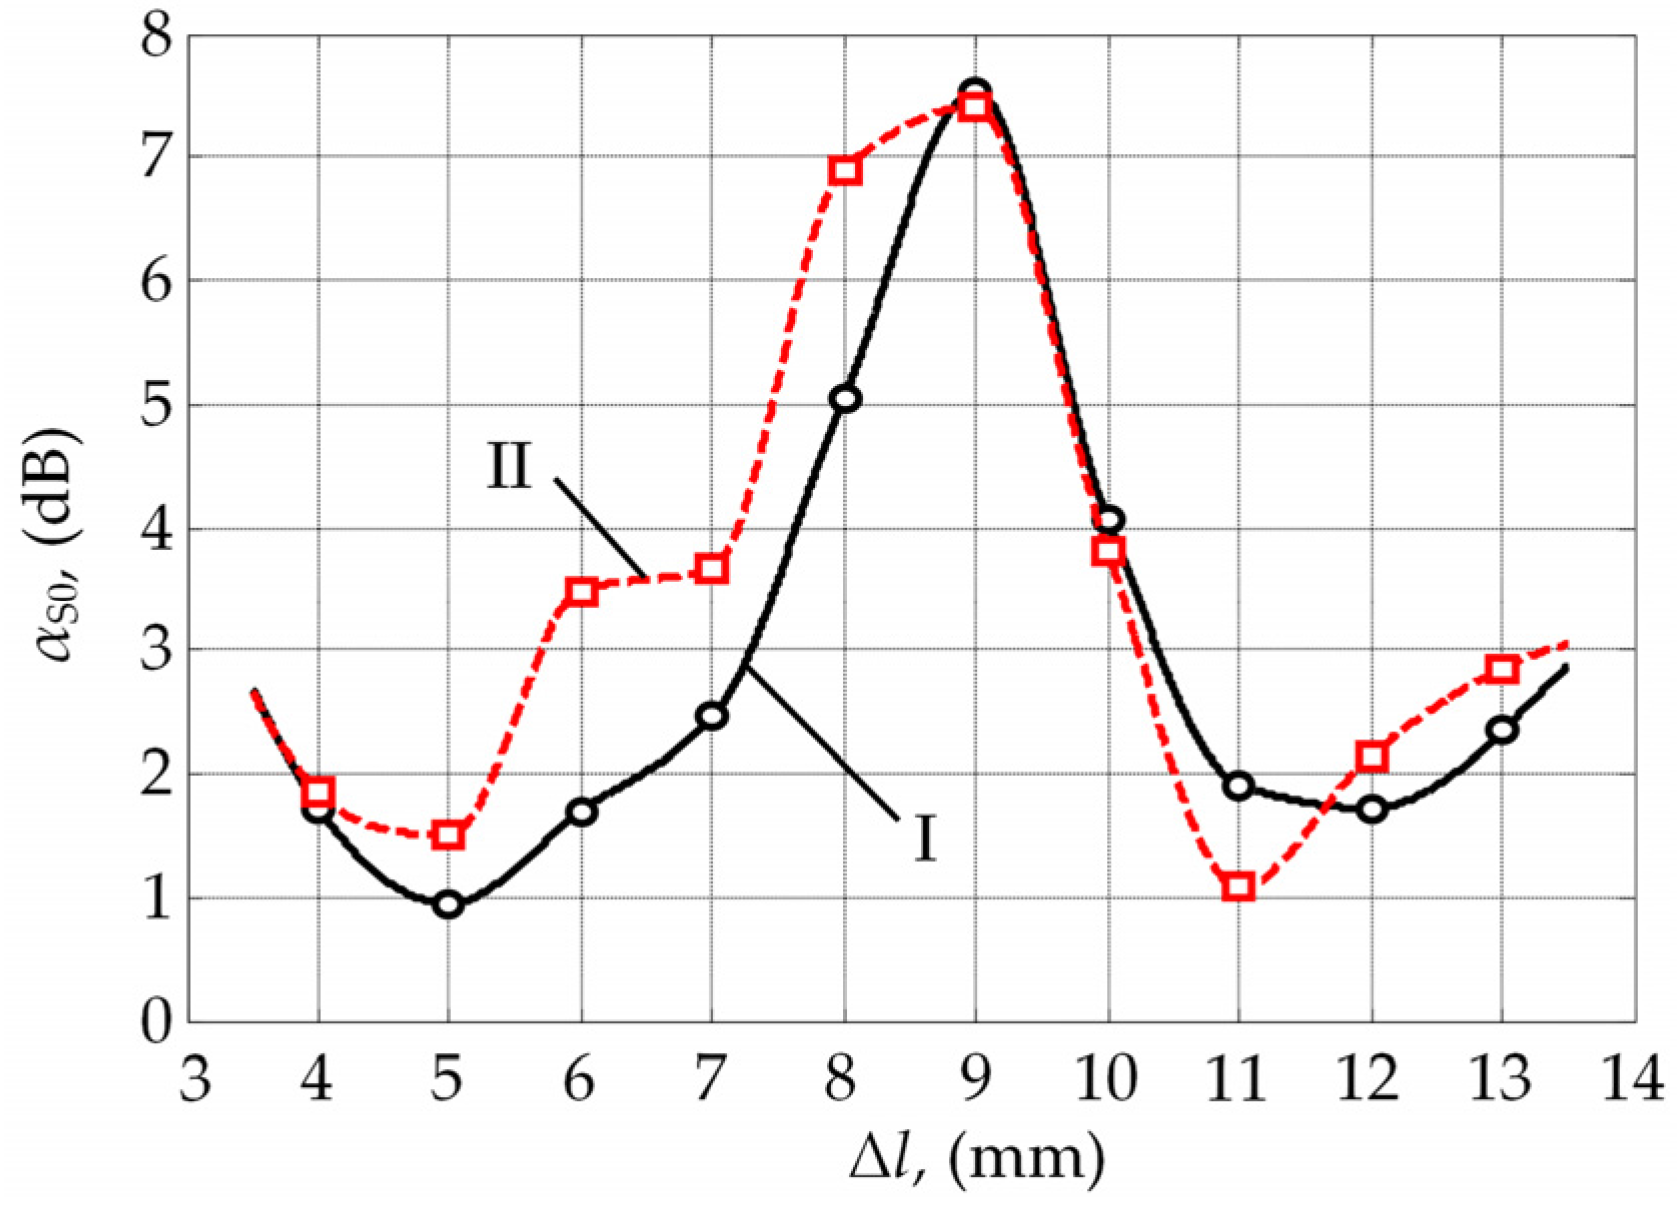
As can be seen from the presented B-scan, the other guided wave modes and reflected waves are completely filtered. Two signals were selected for the assessment of transmission losses on the lap weld, one before the weld and another one after guided waves are transmitted through weld. The first one, used as the reference signal, was measured at the distance 90 mm from the transmitter or edge of the plate. Another one was measured at 265 mm distance away from the transmitter. The Hanning time window was used to select the segment of the signal correponding to the first burst of the propagating S0 wave mode. The transmission losses αS0(f) on the lap weld of the symmetric S0 guided wave mode in the case of different width Δl lap joint connections were estimated according to Equation (3) presented earlier by comparing the frequency spectra of the S0 guided wave mode measured before and after it is transmitted through the lap joint weld. The transmission losses αS0(f) for the particular overlap zone width Δl were estimated by taking the value corresponding to the frequency f = 400 kHz. The obtained dependency of the transmission losses αS0(f = 400, Δl) versus overlap zone width are presented in Figure 14. For comparison, the dependency obtained by FE modelling is also presented.
It can be observed that experimentally measured transmission losses αS0(f) of the symmetric S0 guided wave mode possess a variation similar to those obtained by finite element modelling. It was estimated that the highest transmission losses are obtained in the case of the 9 mm overlap zone width and are approximately 7.6 dB. This maximum loss occurs due to interference of the waves directly propagated through the lap joint weld and the waves reflected by the free edge of the lap joint. Meanwhile, the observed differences from the numerical results are mainly conditioned by mounting of the transmitting transducer to the edge of the plate, i.e., parallelism of fixing that directly affects the acoustical contact and, in the case of amplitude measurements, is are particularly important.
4. Conclusions
The ultrasonic guided wave propagation through the lap joint welded plates used for the construction of the fuel tank floor were investigated by estimating the influence of the lap joint overlap width, operation frequency, and additional plate bonding on the transmission losses. The performed numerical investigation and experiment demonstrated that the transmission losses of the S0 wave mode can vary in the range of 2 dB to 8 dB depending on the ratio between lap joint width and wavelength. In addition, it was demonstrated that the additional bonding in the overlap zone caused by such factors as moisture retention, pressure, and corrosion can essentially reduce the overall transmission losses of the through lap welds transmitted guided waves.
Author Contributions
Audrius Jankauskas designed and performed numerical modelling, performed the experiments, analyzed the data, and wrote the manuscript; Liudas Mazeika as supervisor helped to perform analysis and interpretation of results with constructive discussions, corrected the draft of the paper, and contributed to the writing of the final revision of the paper.
Conflicts of Interest
The authors declare no conflict of interest.
References
- Kasai, N.; Sekine, K.; Maruyama, H. Non-destructive evaluation method for far-side corrosion type flaws in oil storage tank bottom floors using the magnetic flux leakage technique. J. Jpn. Pet. Inst. 2008, 46, 126–132. [Google Scholar] [CrossRef]
- Kasai, N.; Fujiwara, Y.; Sekine, K.; Sakamoto, T. Evaluation of back-side flaws of the bottom plates of an oil-storage tank by the RFECT. NDT E Int. 2008, 41, 525–529. [Google Scholar] [CrossRef]
- Bagavathiappan, S.; Lahiri, B.B.; Saravanan, T.; Philip, J.; Jayakumar, T. Infrared thermography for condition monitoring—A review. Infrared Phys. Technol. 2013, 60, 35–55. [Google Scholar] [CrossRef]
- Marinetti, S.; Vavilov, V. IR thermographic detection and characterization of hidden corrosion in metals: General analysis. Corros. Sci. 2010, 52, 865–872. [Google Scholar] [CrossRef]
- Edalati, K.; Rastkhah, N.; Kermani, A.; Seiedi, M.; Movafeghi, A. The use of radiography for thickness measurement and corrosion monitoring in pipes. Int. J. Press. Vessels Pip. 2006, 83, 736–741. [Google Scholar] [CrossRef]
- Nowak, M.; Baran, I.; Schmidt, J.; Ono, K. Acoustic emission method for solving problems in double bottom storage tanks. J. Acoust. Emiss. 2009, 27, 272–280. [Google Scholar]
- Rose, J.L. Ultrasonic guided waves in structural health monitoring. Key Eng. Mater. 2004, 270–273, 14–21. [Google Scholar] [CrossRef]
- Zhao, X.; Royer, R.L.; Owens, S.E.; Rose, J.L. Ultrasonic Lamb wave tomography in structural health monitoring. Smart Mater. Struct. 2011, 20, 105002. [Google Scholar] [CrossRef]
- Lowe, M.J.S.; Alleyne, D.N.; Cawley, P. Defect detection in pipes using guided waves. Ultrasonics 1998, 36, 147–154. [Google Scholar] [CrossRef]
- Alleyne, D.N.; Pavlakovic, B.; Lowe, M.J.S.; Cawley, P. Rapid, long range inspection of chemical plant pipework using guided waves. AIP Conf. Proc. 2001, 557, 180–187. [Google Scholar]
- Demma, A.; Cawley, P.; Lowe, M.; Roosenbrand, A.G.; Pavlakovic, B. The reflection of guided waves from notches in pipes: A guide for interpreting corrosion measurements. NDT E Int. 2004, 37, 167–180. [Google Scholar] [CrossRef]
- Leinov, E.; Lowe, M.J.S.; Cawley, P. Investigation of guided wave propagation and attenuation in pipe buried in sand. J. Sound Vib. 2015, 347, 96–114. [Google Scholar] [CrossRef]
- Rose, J.L.; Avioli, M.J.; Mudge, P.; Sanderson, R. Guided wave inspection potential of defects in rail. NDT E Int. 2004, 37, 153–161. [Google Scholar] [CrossRef]
- Moustakidis, S.; Kappatos, V.; Karlsson, P.; Selcuk, C.; Gan, T.; Hrissagis, K. An intelligent methodology for railways monitoring using ultrasonic guided waves. J. Nondestruct. Eval. 2014, 33, 694–710. [Google Scholar] [CrossRef]
- Legg, M.; Yücel, M.K.; Kappatos, V.; Selcuk, C.; Gan, T. Increased range of ultrasonic guided wave testing of overhead transmission line cables using dispersion compensation. Ultrasonics 2015, 62, 35–45. [Google Scholar] [CrossRef] [PubMed]
- Diligent, O.; Grahn, T.; Boström, A.; Cawley, P.; Lowe, M.J.S. The low-frequency reflection and scattering of the S0 Lamb mode from a circular through-thickness hole in a plate: Finite Element, analytical and experimental studies. J. Acoust. Soc. Am. 2002, 112, 2589–2601. [Google Scholar] [CrossRef] [PubMed]
- Demma, A.; Cawley, P.; Lowe, M. Scattering of the fundamental shear horizontal mode from steps and notches in plates. J. Acoust. Soc. Am. 2003, 113, 1880–1891. [Google Scholar] [CrossRef] [PubMed]
- Diligent, O.; Lowe, M.J.S. Reflection of the S0 Lamb mode from a flat bottom circular hole. J. Acoust. Soc. Am. 2005, 118, 2869–2879. [Google Scholar] [CrossRef]
- Ma, J.; Cawley, P. Low-frequency pulse echo reflection of the fundamental shear horizontal mode from part-thickness elliptical defects in plates. J. Acoust. Soc. Am. 2010, 127, 3485–3493. [Google Scholar] [CrossRef] [PubMed]
- Carandente, R.; Ma, J.; Cawley, P. The scattering of the fundamental torsional mode from axi-symmetric defects with varying depth profile in pipes. J. Acoust. Soc. Am. 2010, 127, 3440–3448. [Google Scholar] [CrossRef] [PubMed]
- Løvstad, A.; Cawley, P. The reflection of the fundamental torsional guided wave from multiple circular holes in pipes. NDT E Int. 2011, 44, 553–562. [Google Scholar] [CrossRef]
- Løvstad, A.; Cawley, P. The reflection of the fundamental torsional mode from pit clusters in pipes. NDT E Int. 2012, 46, 83–93. [Google Scholar] [CrossRef]
- Cobb, A.C.; Kwun, H.; Caseres, L.; Janega, G. Torsional guided wave attenuation in piping from coating, temperature, and large-area corrosion. NDT E Int. 2012, 47, 163–170. [Google Scholar] [CrossRef]
- Carandente, R.; Lovstad, A.; Cawley, P. The influence of sharp edges in corrosion profiles on the reflection of guided waves. NDT E Int. 2012, 52, 57–68. [Google Scholar] [CrossRef]
- Kwun, H.; Kim, S.Y.; Choi, M.S.; Walker, S.M. Torsional guided-wave attenuation in coal-tar-enamel-coated, buried piping. NDT E Int. 2004, 37, 663–665. [Google Scholar] [CrossRef]
- Chen, F.; Wilcox, P.D. The effect of load on guided wave propagation. Ultrasonics 2007, 47, 111–122. [Google Scholar] [CrossRef] [PubMed]
- Lanza di Scalea, F.; Rizzo, P.; Marzani, A. Propagation of ultrasonic guided waves in lap-shear adhesive joints: Case of incident A0 Lamb wave. J. Acoust. Soc. Am. 2004, 115, 146–156. [Google Scholar] [CrossRef] [PubMed]
- Santos, M.J.; Faia, P. Propagation of ultrasonic lamb waves in aluminium adhesively bonded lap joints and in single plates. Res. Nondestruct. Eval. 2009, 20, 178–191. [Google Scholar] [CrossRef]
- Castaings, M. SH ultrasonic guided waves for the evaluation of interfacial adhesion. Ultrasonics 2014, 54, 1760–1775. [Google Scholar] [CrossRef] [PubMed]
- Dalton, R.P.; Cawley, P.; Lowe, M.J.S. The potential of guided waves for monitoring large areas of metallic aircraft fuselage structure. J. Nondestruct. Eval. 2001, 20, 29–46. [Google Scholar] [CrossRef]
- Choi, M.S.; Kim, S.J. Reflection and transmission of normal incidence SH0 waves at a lap joint of two plates of the same material and thickness. J. Korean Phys. Soc. 2006, 49, 1955–1960. [Google Scholar]
- Siryabe, E.; Renier, M.; Meziane, A.; Castaings, M. The transmission of lamb waves across adhesively bonded lap joints to evaluate interfacial adhesive properties. Phys. Procedia 2015, 70, 541–544. [Google Scholar] [CrossRef]
- Rhee, I.; Choi, E.; Roh, Y. Guided wave propagation induced by piezoelectric actuator in bolted thin steel members. KSCE J. Civ. Eng. 2012, 16, 398–406. [Google Scholar] [CrossRef]
- Comot, P.; Bocher, P.; Belanger, P. Ultrasonic guided wave inspection of Inconel 625 brazed lap joints. Proc. SPIE 2016, 9804, 980408. [Google Scholar]
- Hayashi, T.; Song, W.; Rose, J.L. Guided wave dispersion curves for a bar with an arbitrary cross-section, a rod and rail example. Ultrasonics 2003, 41, 175–183. [Google Scholar] [CrossRef]
- Hayashi, T.; Kawashima, K.; Rose, J.L. Calculation for guided waves in pipes and rails. Key Eng. Mater. 2004, 270–273, 410–415. [Google Scholar] [CrossRef]
- Mažeika, L.; Kažys, R.; Raišutis, R.; Šliteris, R. Ultrasonic guided wave tomography for the inspection of the fuel tanks floor. Int. J. Mater. Prod. Technol. 2011, 41, 128–139. [Google Scholar] [CrossRef]
- Moser, F.; Jacobs, L.; Qu, J. Application of Finite Element Methods to Study Transient Wave Propagation in Elastic Wave Guides; Thompson, D., Chimenti, D., Eds.; Springer: New York, NY, USA, 1998; pp. 161–167. [Google Scholar]
- Moser, F.; Jacobs, L.J.; Qu, J. Modeling elastic wave propagation in waveguides with the finite element method. NDT E Int. 1999, 32, 225–234. [Google Scholar] [CrossRef]
- Cerniglia, D.; Pantano, A.; Montinaro, N. 3D simulations and experiments of guided wave propagation in adhesively bonded multi-layered structures. NDT E Int. 2010, 43, 527–535. [Google Scholar] [CrossRef]
- Sorohan, Ş.; Constantin, N.; Găvan, M.; Anghel, V. Extraction of dispersion curves for waves propagating in free complex waveguides by standard finite element codes. Ultrasonics 2011, 51, 503–515. [Google Scholar] [CrossRef] [PubMed]
- Noh, G.; Bathe, K. An explicit time integration scheme for the analysis of wave propagations. Comput. Struct. 2013, 129, 178–193. [Google Scholar] [CrossRef]
- Asmus, A.; Lammering, R. Actual time integration methods for elastic wave propagation analysis. PAMM 2014, 14, 857–858. [Google Scholar] [CrossRef]
- Mirbagheri, Y.; Nahvi, H.; Parvizian, J.; Düster, A. Reducing spurious oscillations in discontinuous wave propagation simulation using high-order finite elements. Comput. Math. Appl. 2015, 70, 1640–1658. [Google Scholar] [CrossRef]
- Mal, A.; Lih, S.; Guo, D. Ultrasonic Characterization of Defects in Lap Joints; Thompson, D., Chimenti, D., Eds.; Springer: New York, NY, USA, 1995; pp. 2059–2064. [Google Scholar]
- Chang, Z.; Guo, D.; Mal, A. Lamb Wave Propagation across a Lap Joint; Thompson, D., Chimenti, D., Eds.; Springer: New York, NY, USA, 1996; pp. 185–192. [Google Scholar]
- Vladišauskas, A.; Šliteris, R.; Raišutis, R.; Seniūnas, G. Contact ultrasonic transducers for mechanical scanning systems. Ultragarsas (Ultrasound) 2010, 65, 30–35. [Google Scholar]
- Vladišauskas, A.; Raišutis, R.; Šliteris, R.; Seniūnas, G.; Jankauskas, A. Investigation of the characteristics of the low frequency broadband contact transducers. Ultragarsas (Ultrasound) 2010, 65, 41–44. [Google Scholar]
- Vladišauskas, A.; Mažeika, L.; Šliteris, R.; Raišutis, R.; Jankauskas, A. Pulse and frequency responses of broadband low frequency ultrasonic transducers. Ultragarsas (Ultrasound) 2011, 66, 32–39. [Google Scholar] [CrossRef]
- Alleyne, D.N.; Cawley, P. A 2-dimensional Fourier transform method for the quantitative measurement of Lamb modes. In Proceedings of the 17th Annual Review, La Jolla, CA, USA, 15–20 July 1990; Volume 2, pp. 1143–1146.
- Duflo, H.; Morvan, B.; Izbicki, J.-L. Interaction of lamb waves on bonded composite plates with defects. Compos. Struct. 2007, 79, 229–233. [Google Scholar] [CrossRef]
- Ruzzene, M. Frequency-wavenumber domain filtering for improved damage visualization. Smart Mater. Struct. 2007, 16, 2116. [Google Scholar] [CrossRef]
- Michaels, T.E.; Michaels, J.E.; Ruzzene, M. Frequency–wavenumber domain analysis of guided wavefields. Ultrasonics 2011, 51, 452–466. [Google Scholar] [CrossRef] [PubMed]
- Yu, L.; Tian, Z. Lamb wave structural health monitoring using a hybrid PZT-laser vibrometer approach. Struct. Health Monit. 2013, 12, 469–483. [Google Scholar] [CrossRef]
- Tian, Z.; Yu, L. Lamb wave frequency-wavenumber analysis and decomposition. J. Intell. Mater. Syst. Struct. 2014, 25, 1107–1123. [Google Scholar] [CrossRef]
- Yu, L.; Tian, Z. Case study of guided wave propagation in a one-side water-immersed steel plate. Case Stud. Nondestruct. Test. Eval. 2015, 3, 1–8. [Google Scholar] [CrossRef]
Figure 1.
Ultrasonic guided waves phase (blue) and group (red) velocities dispersion curves for: (a) 8 mm thickness stainless steel plate; (b) 1 mm thickness stainless steel plate.
Figure 1.
Ultrasonic guided waves phase (blue) and group (red) velocities dispersion curves for: (a) 8 mm thickness stainless steel plate; (b) 1 mm thickness stainless steel plate.
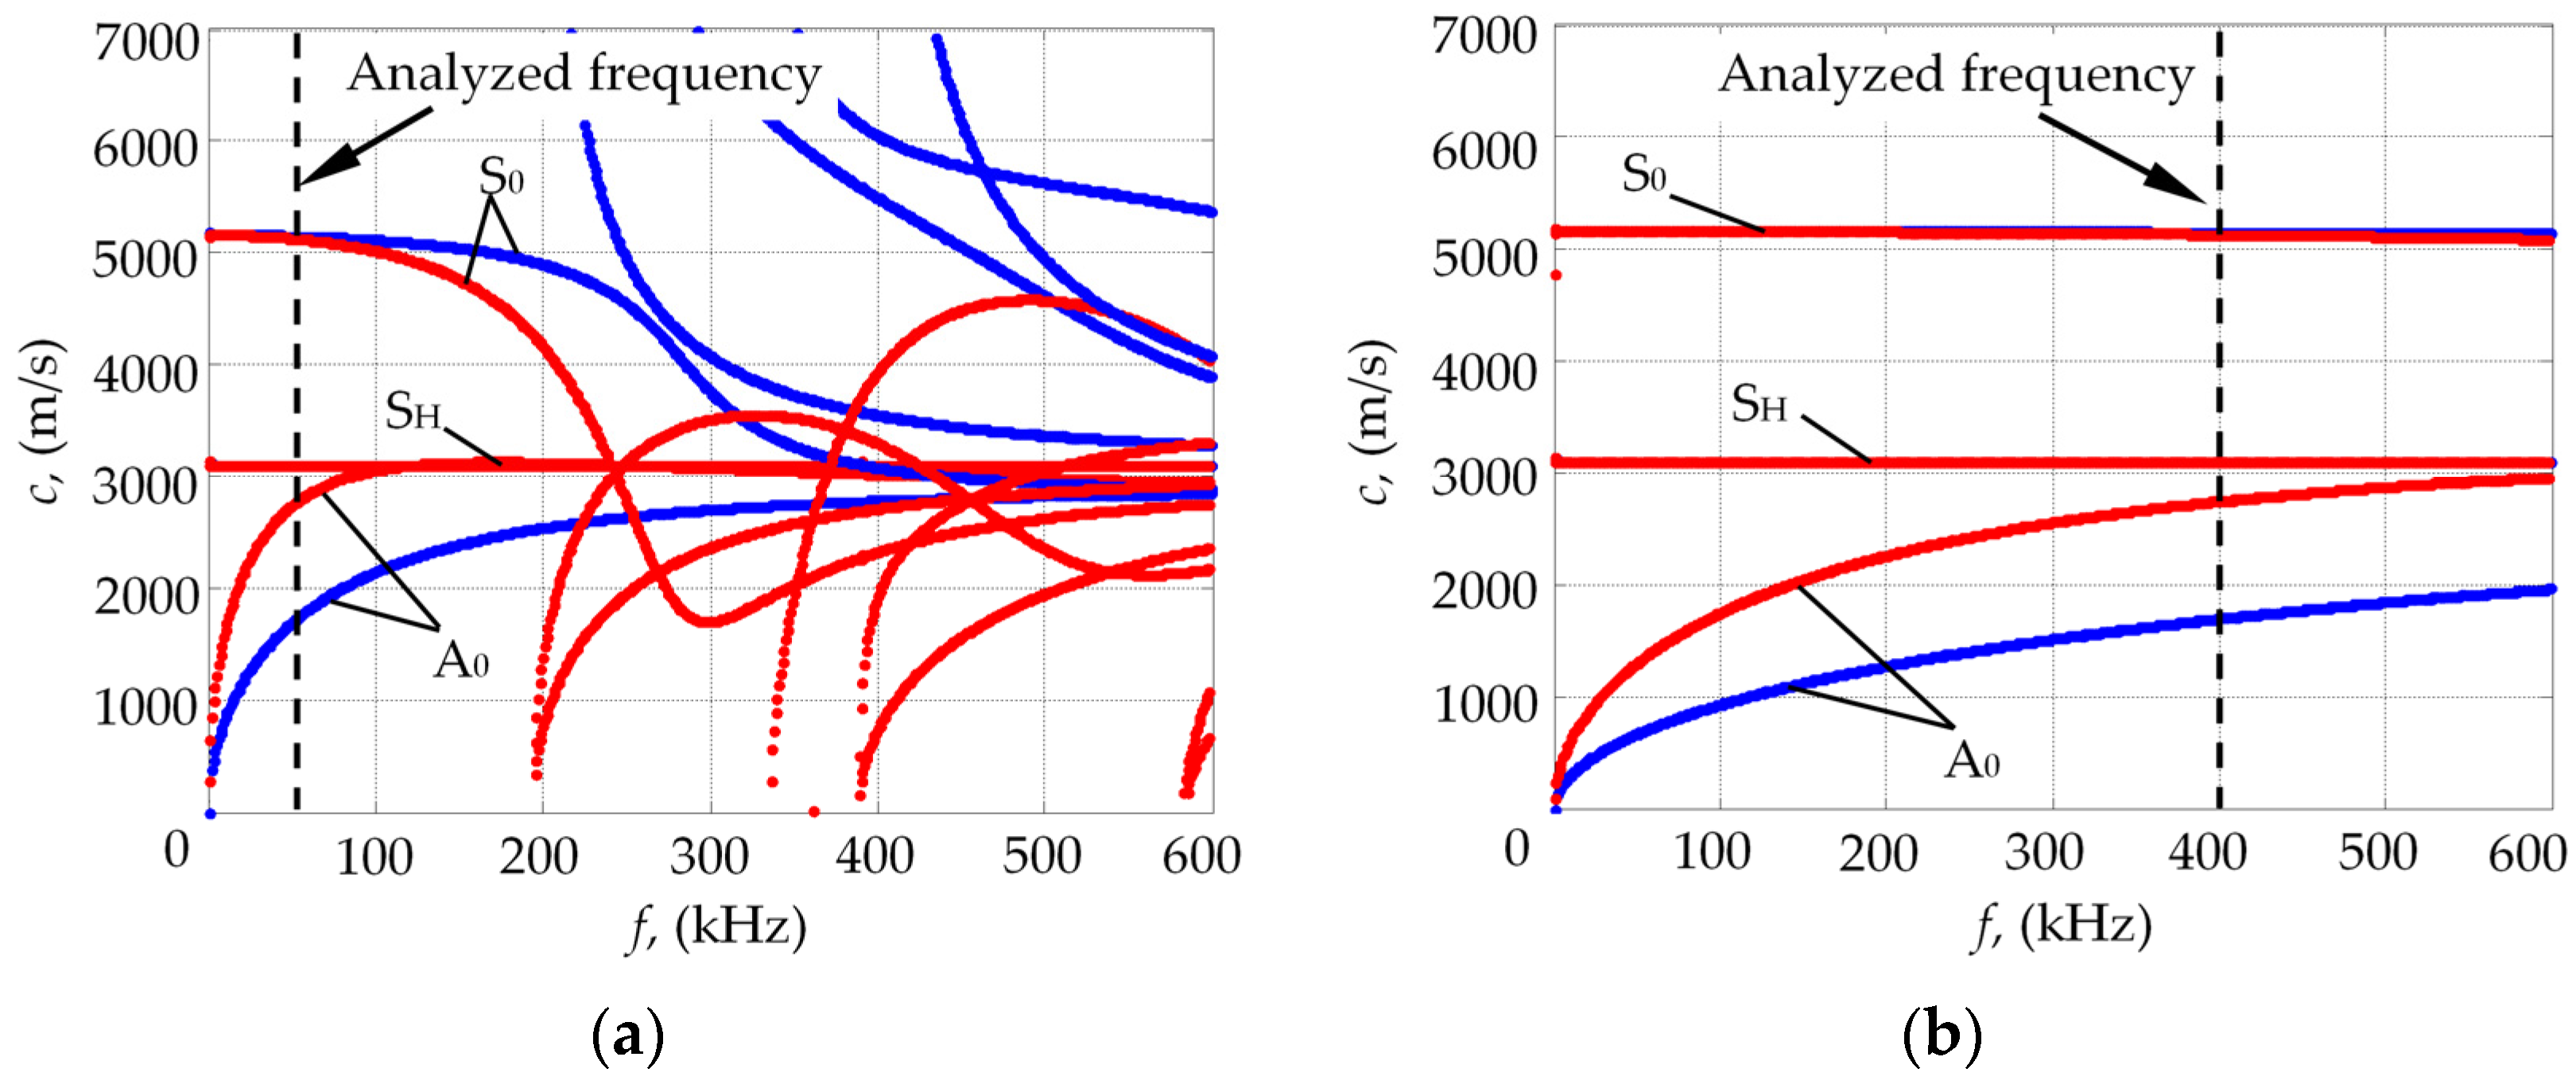
Figure 2.
Model used for the investigation of the symmetric S0 guided wave mode transmission through the different width Δl lap joint welded plates.
Figure 2.
Model used for the investigation of the symmetric S0 guided wave mode transmission through the different width Δl lap joint welded plates.

Figure 3.
The waveforms of the signals measured: (a) before lap joint connection at Rc1 position; (b) after lap joint connection at Rc2 position in the case of different overlap zone width Δl.
Figure 3.
The waveforms of the signals measured: (a) before lap joint connection at Rc1 position; (b) after lap joint connection at Rc2 position in the case of different overlap zone width Δl.

Figure 4.
The transmission losses αS0(f) of the S0 guided wave mode in the case of different lap joint overlap zone width Δl.
Figure 4.
The transmission losses αS0(f) of the S0 guided wave mode in the case of different lap joint overlap zone width Δl.

Figure 5.
The transmission losses αS0(f) of the S0 guided wave mode for the different excitation signal frequency in the case of I: 4 mm overlap, II: 9 mm overlap, and III: 13 mm lap joint overlap widths (dots: FE analysis results, solid line: interpolation by piecewise cubic Hermite polynomial).
Figure 5.
The transmission losses αS0(f) of the S0 guided wave mode for the different excitation signal frequency in the case of I: 4 mm overlap, II: 9 mm overlap, and III: 13 mm lap joint overlap widths (dots: FE analysis results, solid line: interpolation by piecewise cubic Hermite polynomial).

Figure 6.
(a) Wave propagation and reflection in the lap joint connection; (b) dependence of the transmission losses local maxima and minima from the wavelength for particular lap joint width (square: local minima, dots: local maxima od the transmission losses).
Figure 6.
(a) Wave propagation and reflection in the lap joint connection; (b) dependence of the transmission losses local maxima and minima from the wavelength for particular lap joint width (square: local minima, dots: local maxima od the transmission losses).

Figure 7.
(a) Model used for the investigation of the symmetric S0 wave mode propagation through the lap joint in the case of: (b) plates are connected only at the weld seam position; (c) partially bonded plates; (d) fully bonded plates.
Figure 7.
(a) Model used for the investigation of the symmetric S0 wave mode propagation through the lap joint in the case of: (b) plates are connected only at the weld seam position; (c) partially bonded plates; (d) fully bonded plates.
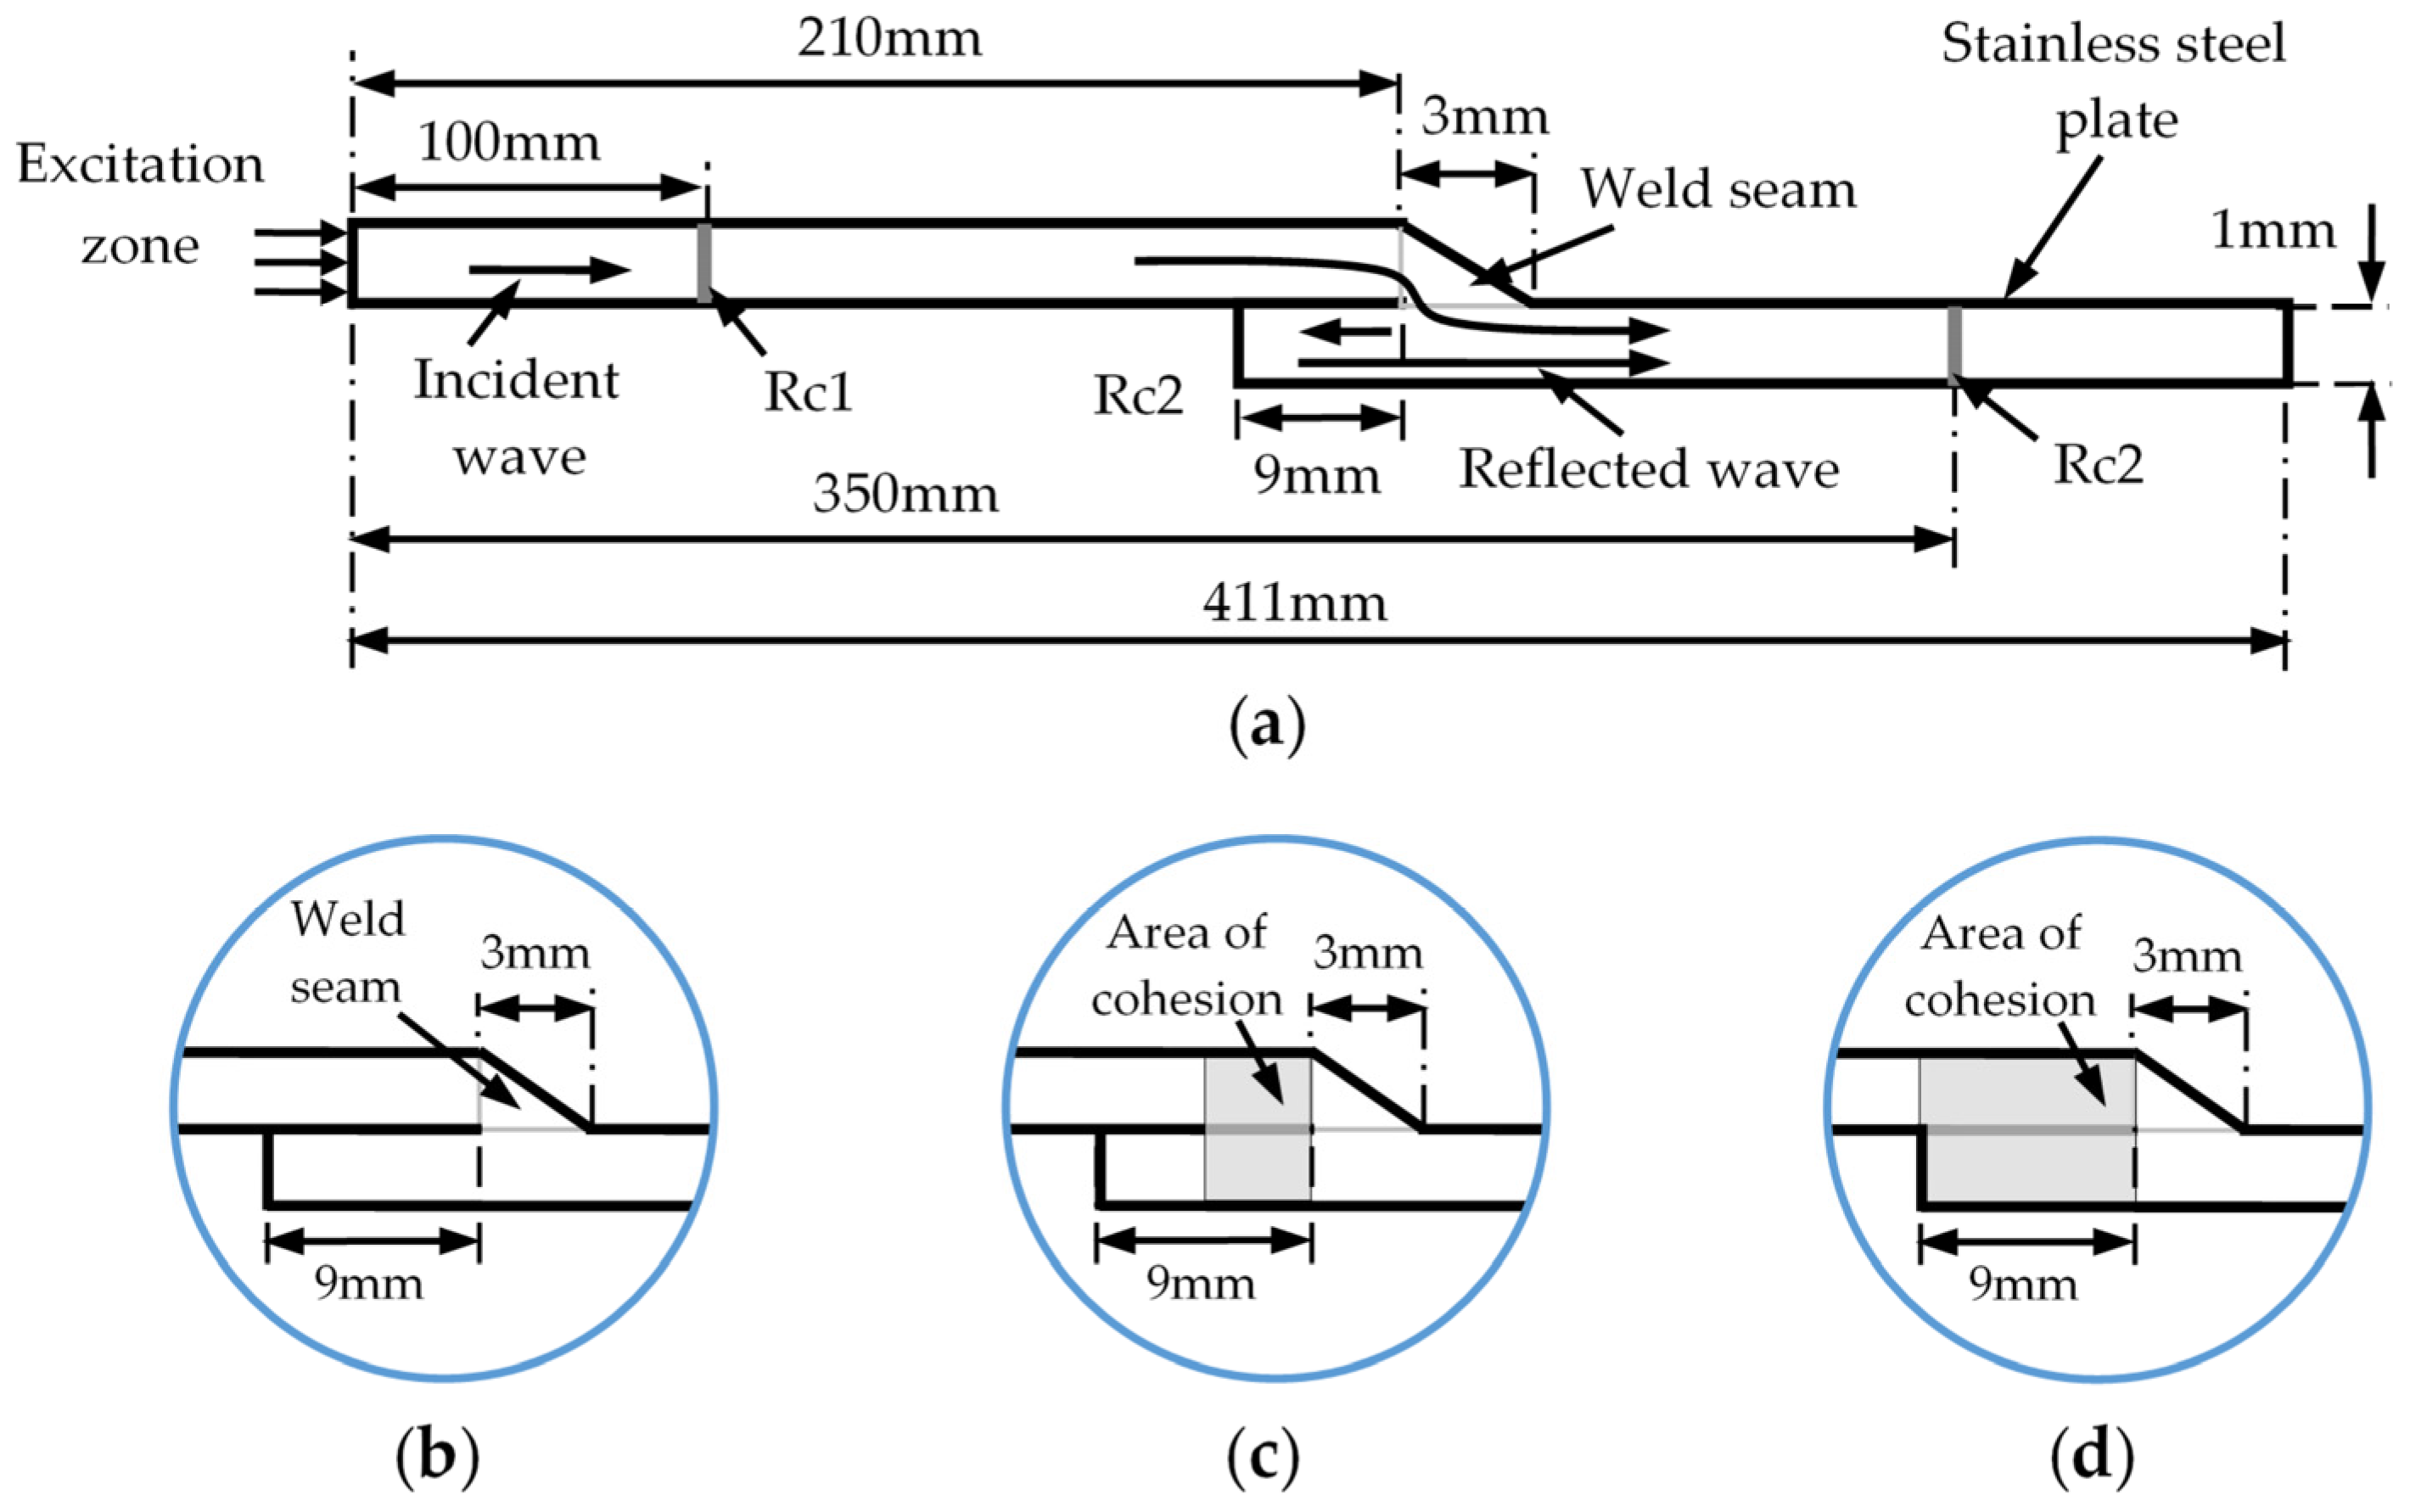
Figure 8.
The transmission losses αS0(f) of the S0 wave mode at different lap joint bonding conditions in the case: I: plates are connected only at the weld seam position, II: partially bonded plates, III: fully bonded plates.
Figure 8.
The transmission losses αS0(f) of the S0 wave mode at different lap joint bonding conditions in the case: I: plates are connected only at the weld seam position, II: partially bonded plates, III: fully bonded plates.
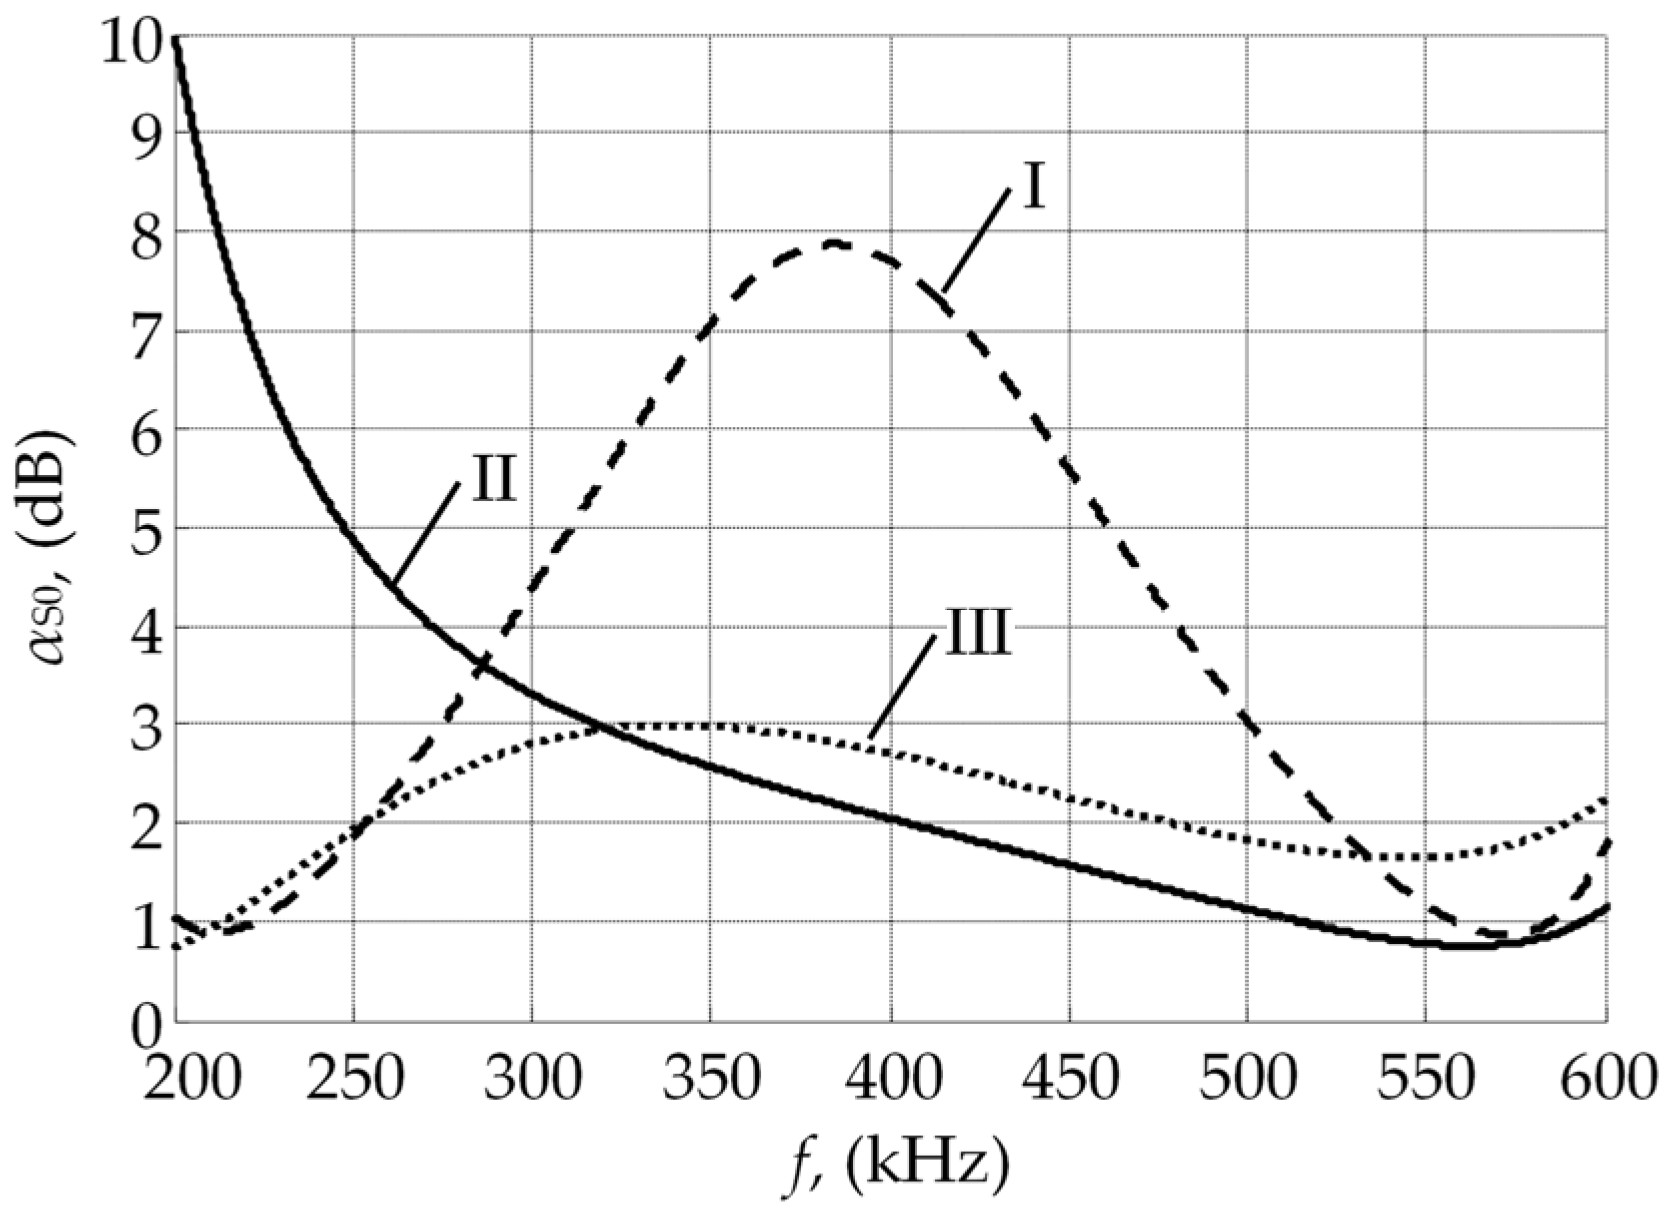
Figure 9.
Experimental set-up for the investigation of the ultrasonic S0 guided wave mode propagation through the lap joint welded plates with different overlap zone width Δl.
Figure 9.
Experimental set-up for the investigation of the ultrasonic S0 guided wave mode propagation through the lap joint welded plates with different overlap zone width Δl.

Figure 10.
The frequency responses of the (a) transmitter and (b) receiver with convex protector (the equivalent diameter of the contact area 1 mm).
Figure 10.
The frequency responses of the (a) transmitter and (b) receiver with convex protector (the equivalent diameter of the contact area 1 mm).
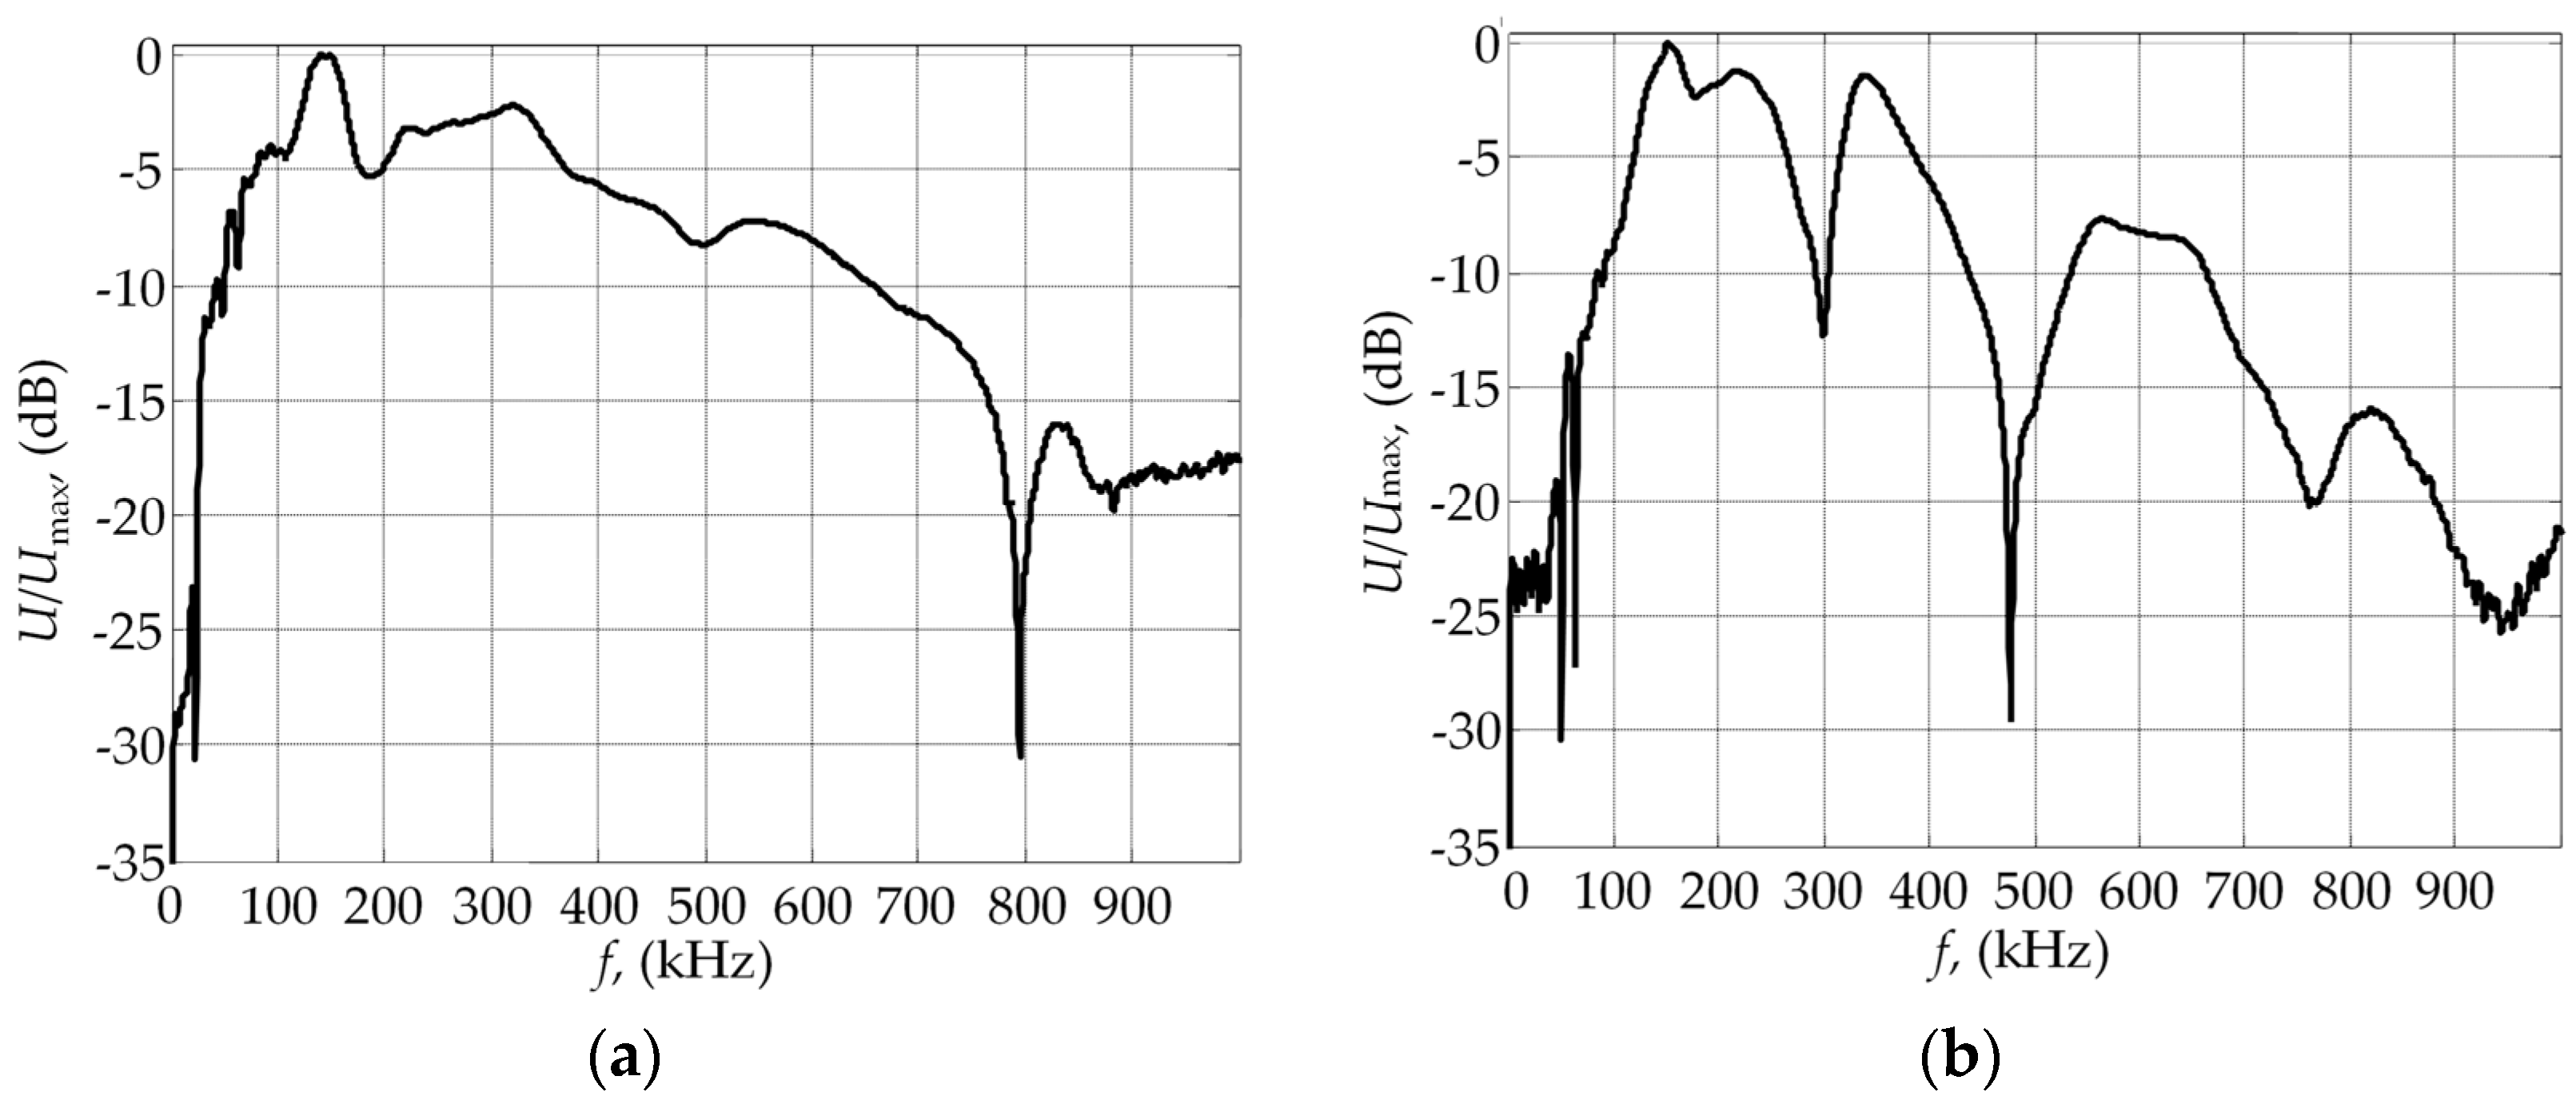
Figure 11.
(a) An experimentally obtained B-scan image of the ultrasonic guided waves propagating through the lap joint welded plates in the case of the 4 mm overlap zone width; (b) reconstructed guided waves dispersion curve pattern by using 2D Fourier transform (FT).
Figure 11.
(a) An experimentally obtained B-scan image of the ultrasonic guided waves propagating through the lap joint welded plates in the case of the 4 mm overlap zone width; (b) reconstructed guided waves dispersion curve pattern by using 2D Fourier transform (FT).
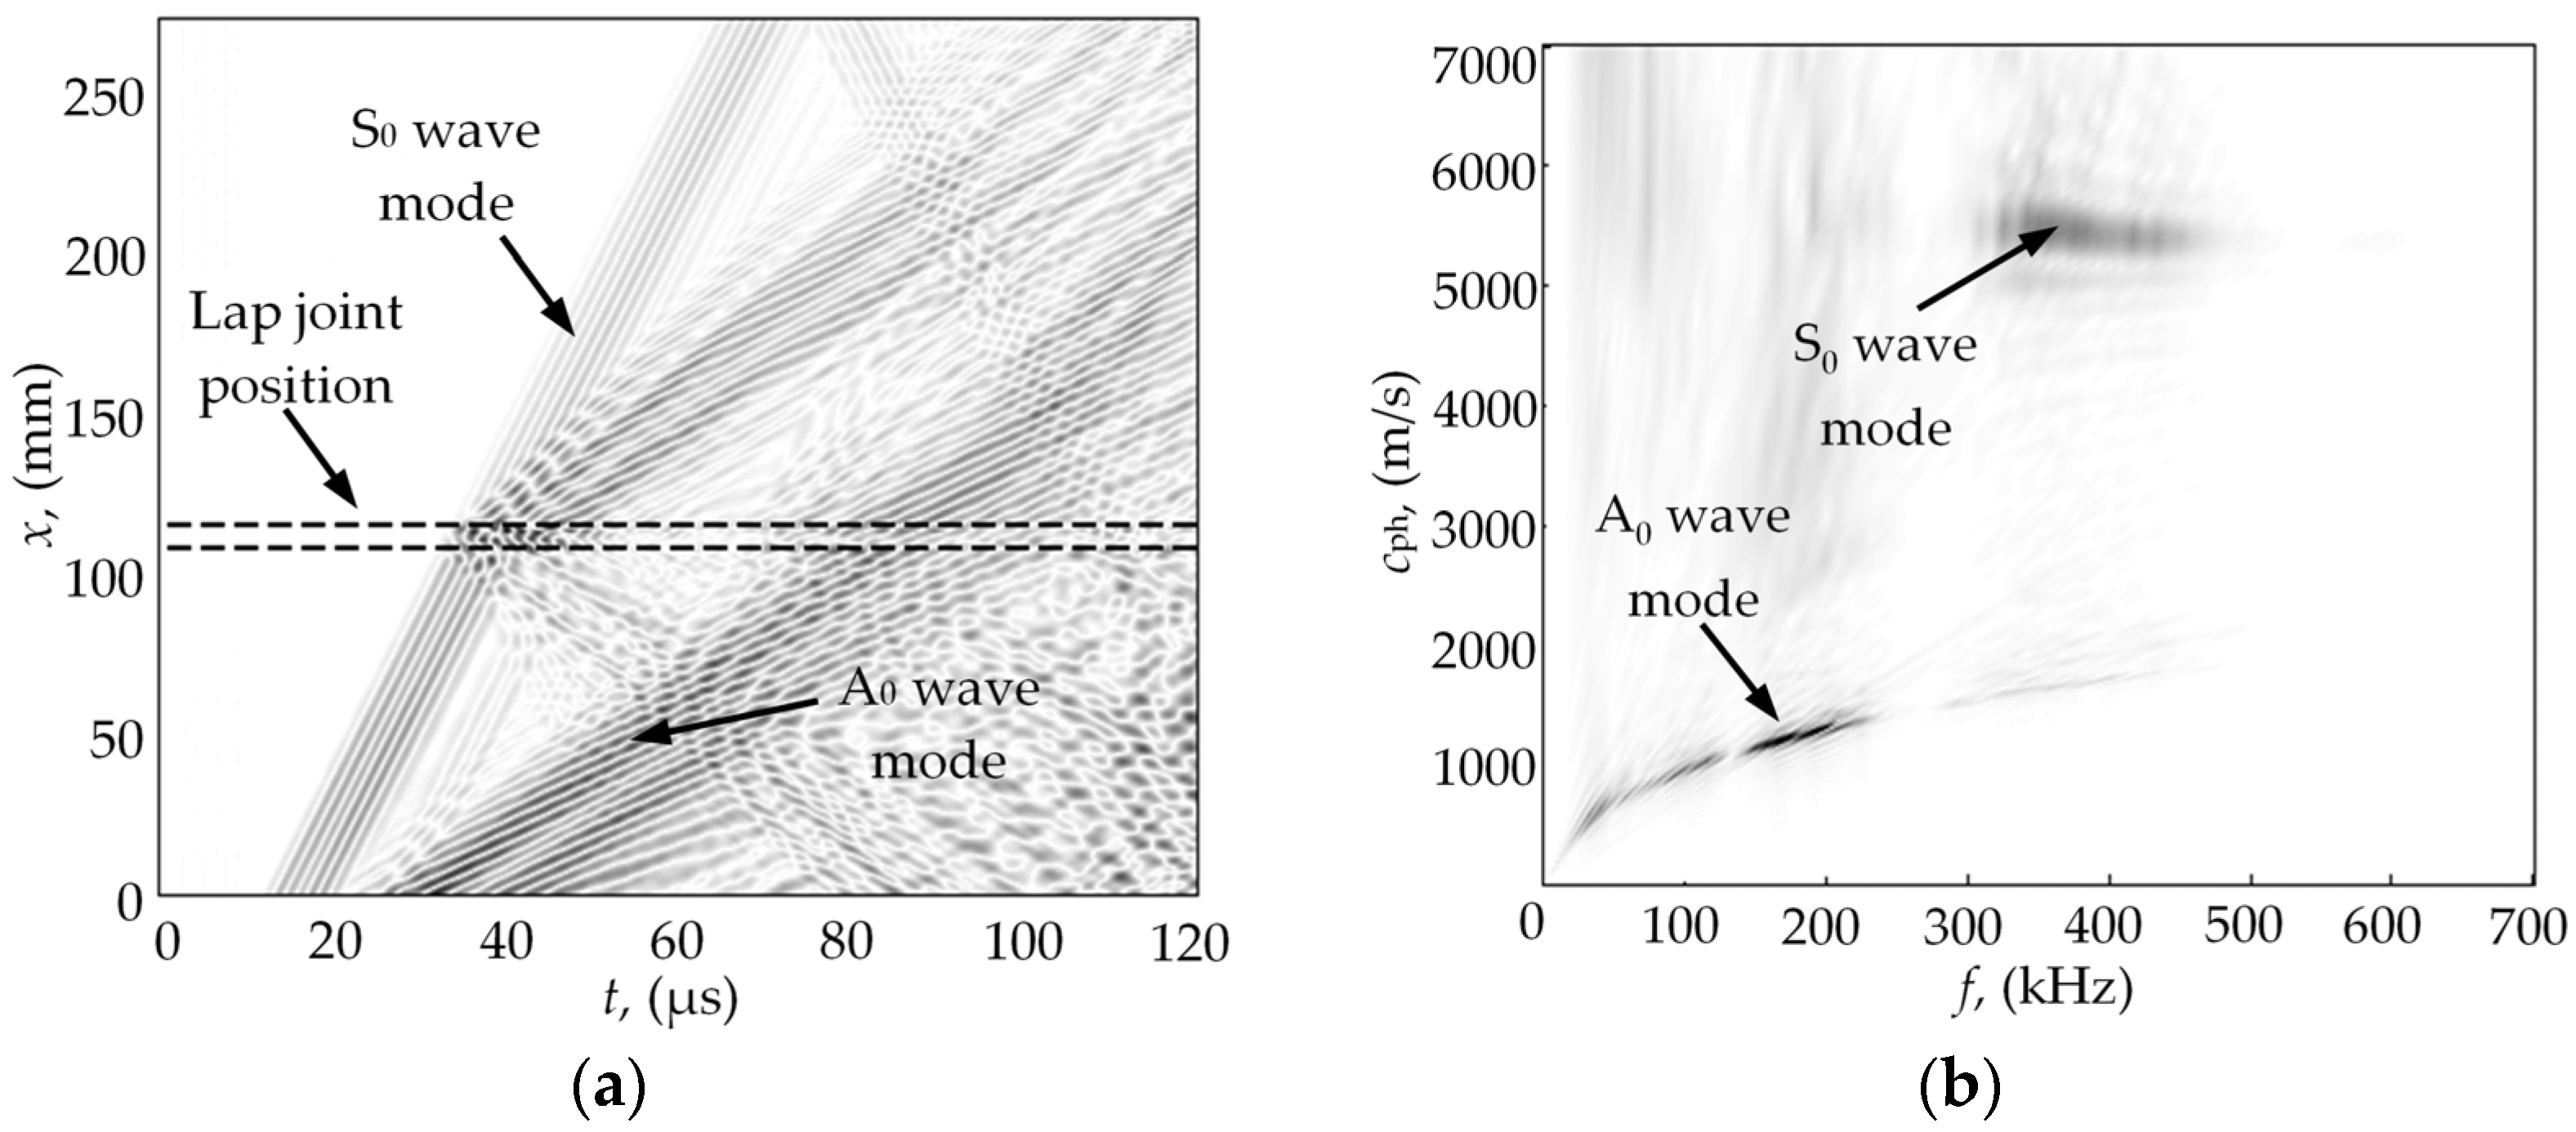
Figure 12.
(a) Filtered B-scan image of the ultrasonic guided waves propagating through the lap joint welded plates in the case of the 4 mm overlap zone width; (b) reconstructed guided waves dispersion curve pattern by using 2D FT from filtered data.
Figure 12.
(a) Filtered B-scan image of the ultrasonic guided waves propagating through the lap joint welded plates in the case of the 4 mm overlap zone width; (b) reconstructed guided waves dispersion curve pattern by using 2D FT from filtered data.

Figure 13.
Waveforms of the ultrasonic guided wave signals measured: (a) before lap joint weld; (b) after lap joint weld; (c) waveform of the signal before the lap joint weld after applying spatial mode filtering; (d) waveform of the signal after the lap joint weld after applying spatial mode filtering.
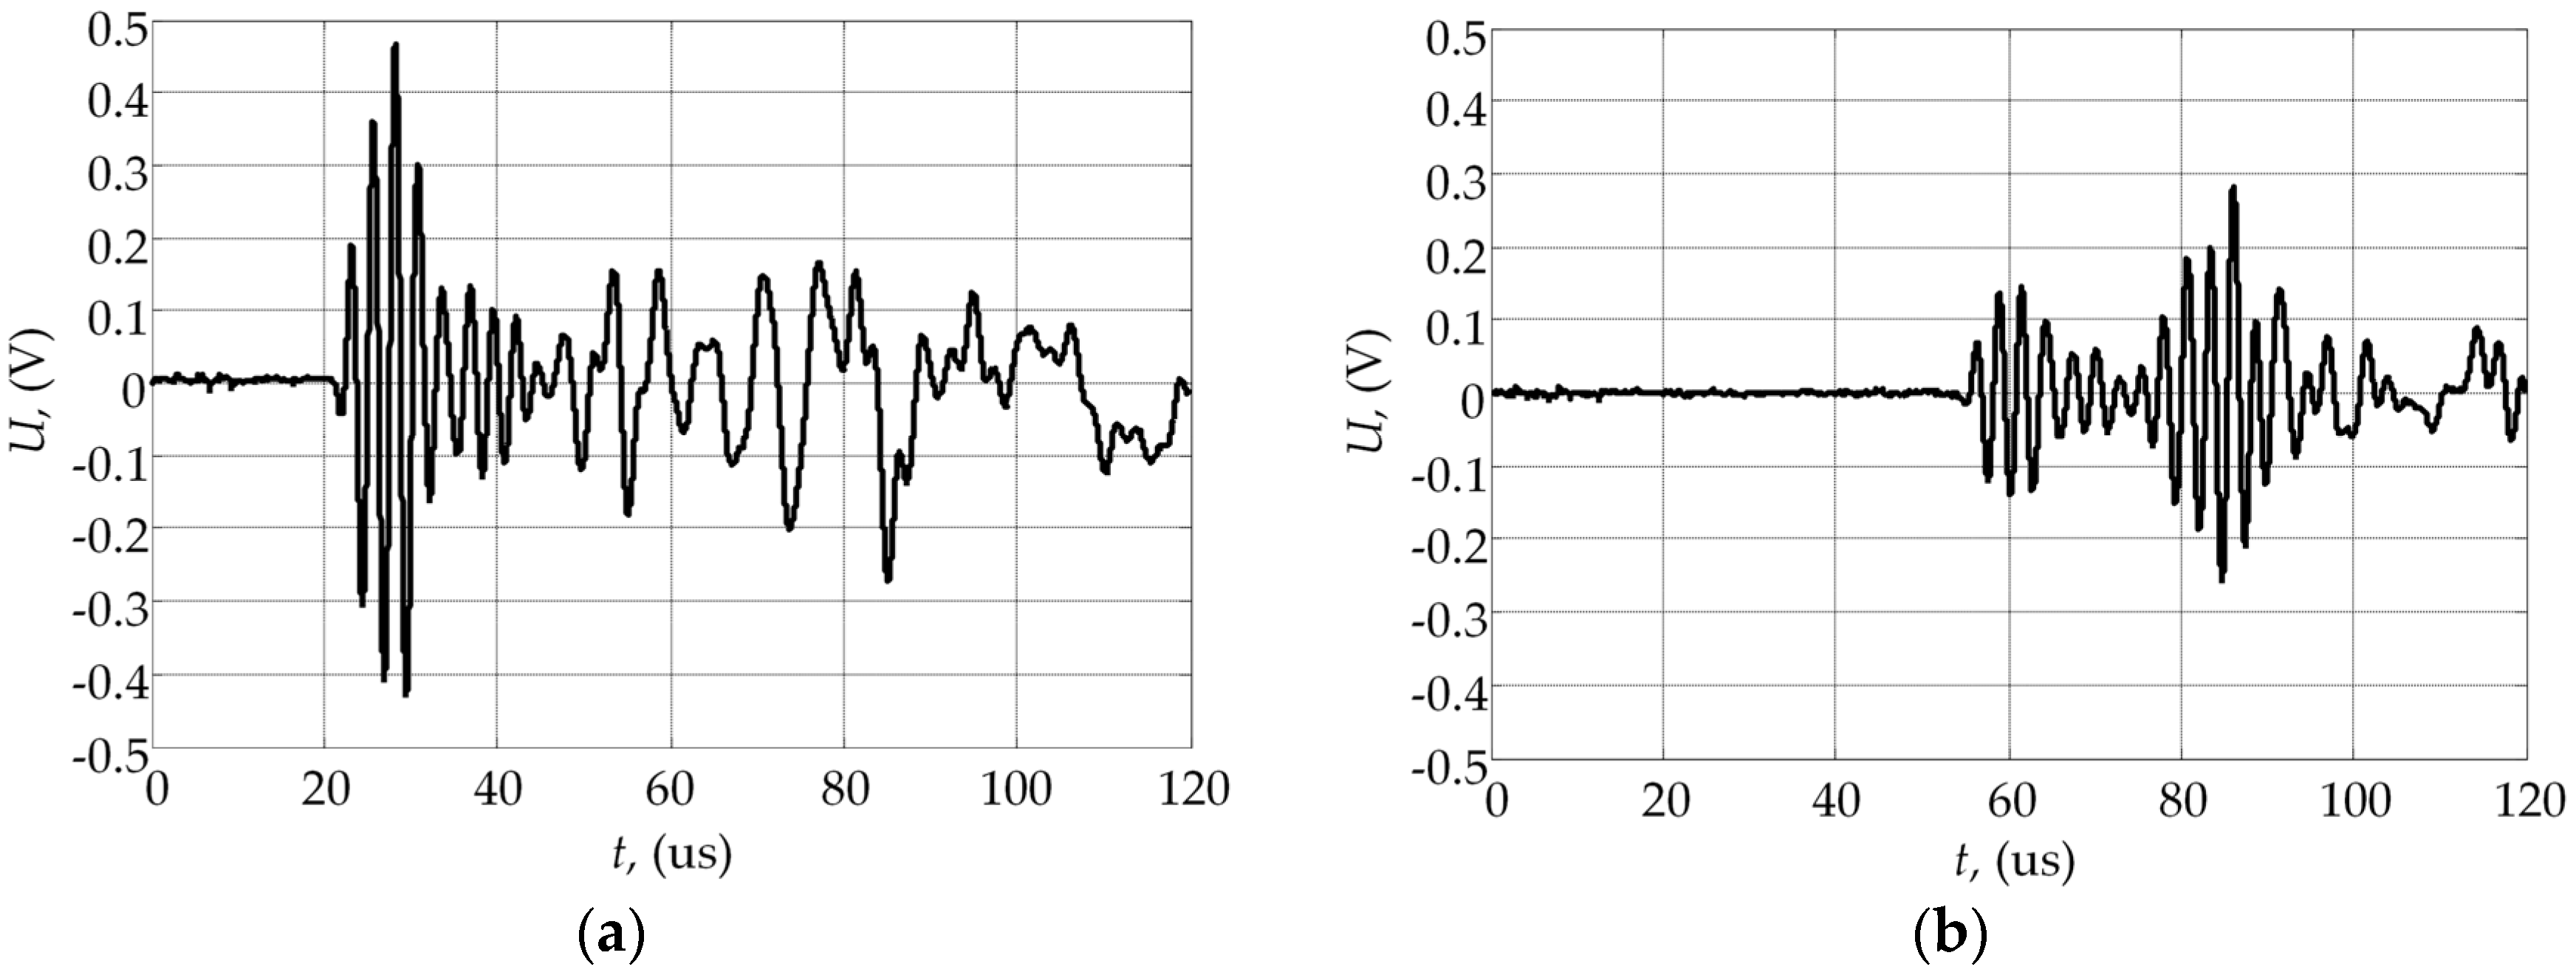

Figure 14.
The transmission losses αS0(f) of the S0 mode obtained by I: using numerical simulation finite element (FE) method, II: experimental measuring.
Figure 14.
The transmission losses αS0(f) of the S0 mode obtained by I: using numerical simulation finite element (FE) method, II: experimental measuring.


Table 1.
Velocity of the asymmetric A0, symmetric S0, and shear horizontal SH guided waves modes at 400 kHz frequency for 1 mm thickness stainless steel plate.
| Guided Wave Mode | Phase Velocity cph, m/s | Group Velocity cgr, m/s |
|---|---|---|
| Asymmetric A0 | 1701 | 2751 |
| Symmetric S0 | 5156 | 5134 |
| Shear horizontal SH | 3106 | 3106 |
© 2016 by the authors; licensee MDPI, Basel, Switzerland. This article is an open access article distributed under the terms and conditions of the Creative Commons Attribution (CC-BY) license (http://creativecommons.org/licenses/by/4.0/).
Share and Cite
MDPI and ACS Style
Jankauskas, A.; Mazeika, L. Ultrasonic Guided Wave Propagation through Welded Lap Joints. Metals 2016, 6, 315. https://doi.org/10.3390/met6120315
AMA Style
Jankauskas A, Mazeika L. Ultrasonic Guided Wave Propagation through Welded Lap Joints. Metals. 2016; 6(12):315. https://doi.org/10.3390/met6120315
Chicago/Turabian StyleJankauskas, Audrius, and Liudas Mazeika. 2016. "Ultrasonic Guided Wave Propagation through Welded Lap Joints" Metals 6, no. 12: 315. https://doi.org/10.3390/met6120315
Note that from the first issue of 2016, this journal uses article numbers instead of page numbers. See further details here.