Article

Laser-Driven Ramp Compression to Investigate and Model Dynamic Response of Iron at High Strain Rates

by
Nourou Amadou
1,2,3,*,
Erik Brambrink
1,4,
Thibaut De Rességuier
3,
Adamou Ousmane Manga
2,
Almoustapha Aboubacar
2,
Björn Borm
5 and
Anaïs Molineri
5
1
Laboratoire pour l’Utilisation des Lasers Intenes (LULI)–Centre National pour la Recherche Scientifique (CNRS), Ecole Polytechnique, Commissariat à l’Energie Atomique (CEA): Université Paris-Saclay, 91128 Palaiseau CEDEX, France
2
Département de Physique, Université Abdou Moumouni de Niamey, BP. 10662 Niamey, Niger
3
Institut P’. Centre National pour la Recherche Scientifique (CNRS). Ecole Nationale Supérieure de Mécanique et d’Aérotechnique (ENSMA) , Université de Poitiers, 86961 Futuroscope CEDEX, France
4
Sorbonne Université, Université Pierre et Marie Curie, Université Paris 06, Centre National pour la Recherche Scientifique (CNRS), Laboratoire d’Utilisation des Lasers Intenses (LULI), Place Jussieu, 75252 Paris CEDEX 05, France
5
Gesellschaft für Schwerionenforschung, Planck str. 1, Darmstadt 64287, Germany
*
Author to whom correspondence should be addressed.
Metals 2016, 6(12), 320; https://doi.org/10.3390/met6120320
Submission received: 14 October 2016 / Revised: 2 December 2016 / Accepted: 8 December 2016 / Published: 18 December 2016
(This article belongs to the Special Issue Laser Shock Processing on Metal)

Abstract

:
Efficient laser shock processing of materials requires a good characterization of their dynamic response to pulsed compression, and predictive numerical models to simulate the thermomechanical processes governing this response. Due to the extremely high strain rates involved, the kinetics of these processes should be accounted for. In this paper, we present an experimental investigation of the dynamic behavior of iron under laser driven ramp loading, then we compare the results to the predictions of a constitutive model including viscoplasticity and a thermodynamically consistent description of the bcc to hcp phase transformation expected near 13 GPa. Both processes are shown to affect wave propagation and pressure decay, and the influence of the kinetics of the phase transformation on the velocity records is discussed in details.

1. Introduction

High power pulsed lasers offer means to subject materials to pressure loads of short duration, typically some ns to some tens of ns. A successful engineering application is laser shot peening, leading to strain hardening and compressive residual stresses that have been shown to significantly enhance metals resistance to fatigue and corrosion [1,2,3]. Another one is laser shock-induced permanent compaction of porous materials such as sintered steels, over a few hundreds of μ m below the loaded surface [4], to improve their mechanical properties. A third example of industrial interest is the LAser Shock Adhesion Test (LASAT), which can be used to investigate debonding at a substrate-coating interface [5,6]. In order to optimize those processes and analyze their effects, physically based simulations are required to describe wave propagation from the loaded surface, subsequent pressure decay, plastically-affected depth, polymorphic transformations etc. In such highly dynamic regime, time dependence, viscoplasticity and kinetic effects may play crucial roles. In this article, we use laser driven ramp loading to investigate the effects of elastic-plastic behavior and allotropic phase transition (from α , bcc to ε, hcp) on wave propagation in iron. Ramp compression is preferred to shock compression because it provides a better insight into the kinetics of the governing processes [7,8,9]. Besides, in all practical applications mentioned above, laser compression starts with a finite rise time, typically a few ns, before steepening into a shock wave after propagation over some distance from the irradiated surface, so that the superficial zone of interest is actually subjected to ramp compression.
Figure 1 illustrates the dynamical response of polymorphic crystal material such as iron under laser ramp compression [10]. The crystal generally begins to deform elastically along the direction of wave propagation with the lattice coming back to its original configuration on unloading. Beyond some critical state of stress, the crystal defects, amplify and propagate through the lattice leading to plastic deformation, that can be caused by dislocation slip or twinning. In some cases, further compression can induce a solid-solid (polymorphic) phase transformation or melting [11]. These phenomena will usually correspond to singularities in the temporal profile of the target rear surface velocity. Thus, time-resolved measurement of these singularities and their comparison with a theoretical model prediction should give insight into the different physical process that govern the dynamic behaviour. Here attention was focused on the iron α ε phase transformation. Iron was choosen because of its importance in civil engineering, geophysics and astrophysics.
Experiments were performed at the Phelix laser facility (Darmstadt, Germany). Time-resolved velocity measurements are compared to the predictions of a constitutive model including rate-dependent twinning, dislocation slip, and a kinetic, thermodynamically consistent description of the phase transformation. Fair match assesses to some extent the predictive capability of the model over the explored range of pressures and strain rates.

2. Experiments

During the experiment, 25 μ m or 50 μ m thick, freestanding polycrystalline iron targets were ramp compressed by direct irradiation with a 10 ns laser pulse with energy up to 160 J at 527 nm-wavelength. Temporal laser pulse shaping was used to optimize the ramp profile using a model based on [12,13] resulting in an exponential type laser profile. To ensure a uniform compression front, a Hybrid Phase Plate (HPP) was used to obtain a smooth flat laser profile of 1 mm-diameter, considerably larger than the sample thickness, which implies conditions of uniaxial strain during the measurement. The compression wave propagates through the target and when it reaches the rear surface, this surface expands into the vacuum. The temporal profile of the rear surface velocity was measured using two channel Velocity Interferometer System for Any Reflector (VISAR) [14], with temporal and spatial resolutions of 100 ps and 10 μ m respectively (see Figure 2).
As will be shown next, the acceleration of this surface upon emergence of the pressure ramp lasts about 10 ns. Thereafter, complex wave interactions inside the sample may induce local tension, possible damage and further plastic deformation, but such late effects are not described in the present paper, where we focus on the dynamic response of iron to the ramp compression. The Figures 5 and 6 show the measured VISAR profiles which exhibit the common three waves structure: the elastic precursor followed by the first plastic wave (the so called P1 wave) which carries the α iron to the α ε boundary and the P2 wave in which the body-centered cubic (bcc) structure ( α phase) transforms into the high pressure hexagonal close-packed (hcp) structure (ε phase). To accurately interpret these VISAR profiles numerical simulation were performed with constitutive models including rate-dependent twinning, dislocation slip, and a kinetic description of the phase transformation.

3. Numerical Simulations

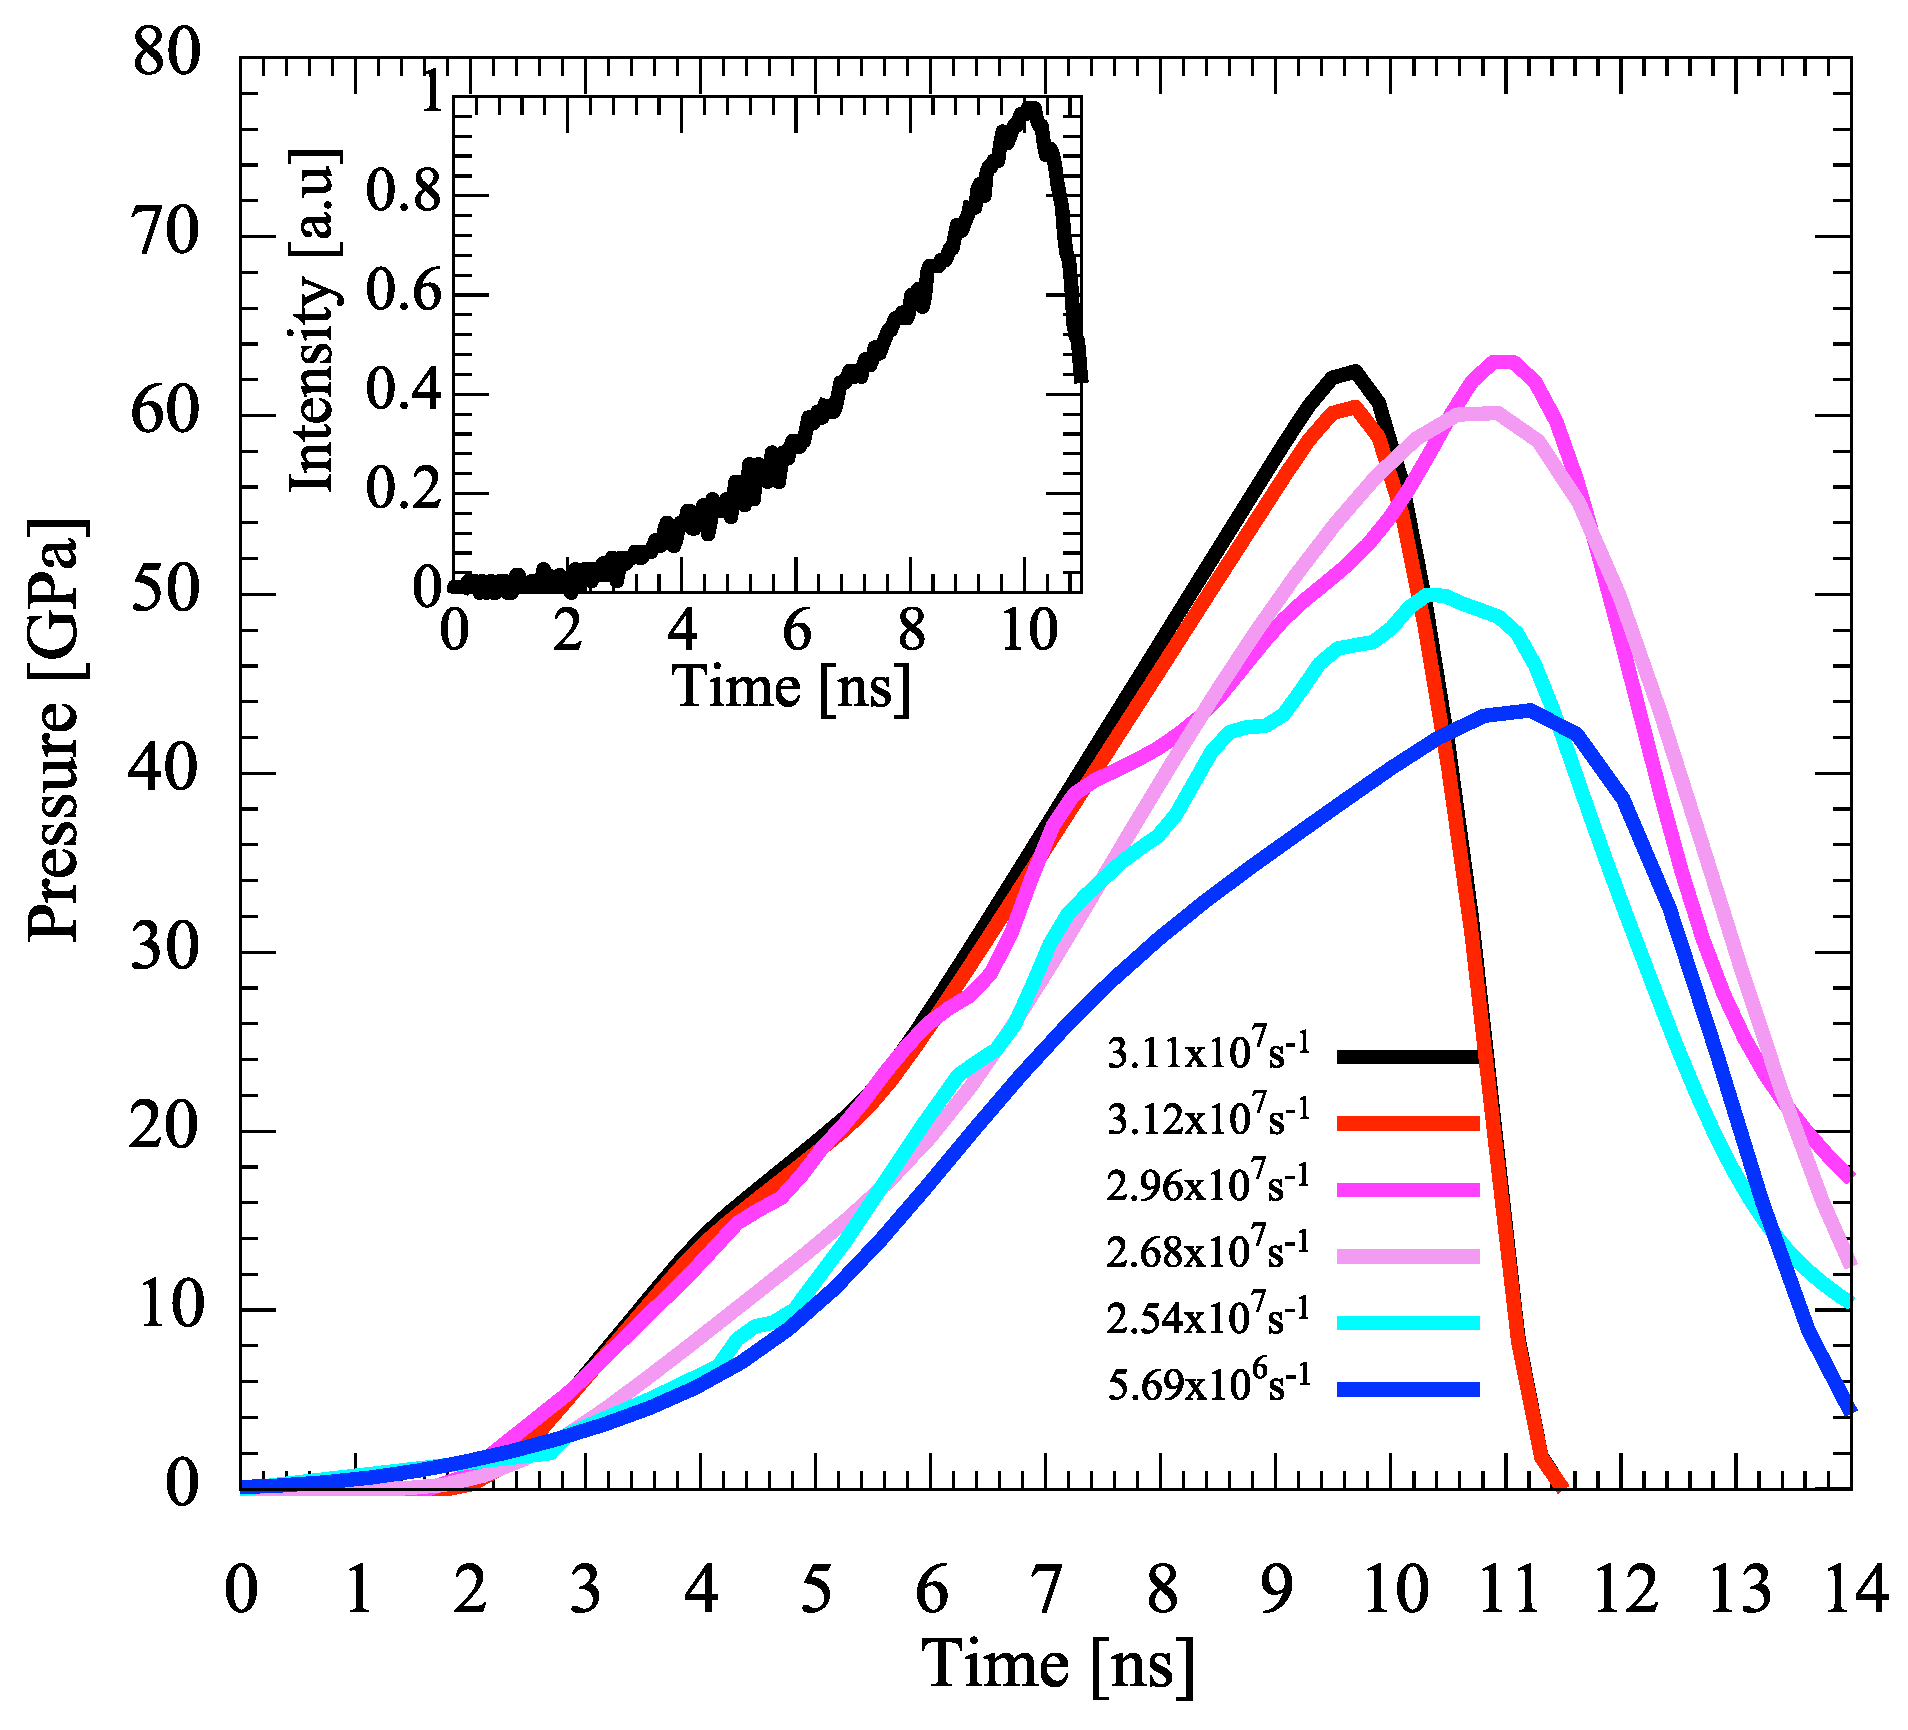
For each shot, a first simulation of laser-matter interaction is performed with the 1D hydrodynamic code MULTI [15], using the measured profile of laser intensity as input boundary condition and material data from the SESAME tables. This simulation provides the amplitude and temporal shape of the pressure load induced beneath the irradiated surface. It consists of a pressure ramp of duration 8 to 10 ns, to a maximum of about 43 to 63 GPa, depending on the shots, followed by gradual unloading of a few ns duration (see Figure 3).
Then, this calculated ramp profile is used as boundary condition in the 1 D finite difference, Lagrangian hydro code SHYLAC [16,17] to simulate the dynamic response of iron, including the kinetics of the phase transition. The iron sample is discretized into cells of same mass, as recommended in Reference [18], of initial thickness about 0.01 μ m. The equations of conservation of mass, momentum and energy are combined with the material equations of state and constitutive law described next. As in most computations of dynamic processes, an explicit time integration scheme is used [19], and time step is controlled through the classical Courant condition. A Von Neumann artificial viscosity is used to deal with shock formation [20]. As will be shown next, these general parameters and methods are well suited to reproduce the very sharp velocity gradients and short rise times involved in our experiments.

3.1. Elastic-Plastic Model

We use an elastic-plastic model fully described in [21]. It includes a macroscopic description of both dislocation slip and deformation twinning. The longitudinal component of stress σ is obtained from the shear stress τ and the pressure P according to the relationship
σ = P + 4 3 τ
A common form is used for rate-dependent plastic flow in conditions of 1 D strain such as
τ ˙ = μ ( ϵ ˙ 2 γ ˙ )
where μ is the shear modulus, ϵ is the longitudinal component of total strain, γ is the plastic shear strain, and a dot above a variable means a derivation with respect to time. Macroscopic plastic flow is attributed to both dislocation slip and twin formation,
γ = γ D + γ T
where γ D is due to dislocation motion, and γ T is due to twinning. Time-dependent description of twin growth [22] accounts for viscoplastic behaviour while a perfectly plastic formulation is used for slip.

3.2. α ε Kinetics Model

To account for the kinetics of the iron α ε , each cell is considered as a mixture of α and ε phases (subscripts 1 and 2, respectively). X is defined as the mass fraction of the ε phase ( 0 < X < 1 ) . The specific volume V and specific internal energy E of the mixture are expressed in terms of the specific volumes V 1 , V 2 and specific internal energies E1, E2 of the pure-phase constituents:
V = ( 1 X ) V 1 + X V 2
E = ( 1 X ) E 1 + X E 2
As in most work on phase transformation, pressure and thermal equilibrium is assumed between the two phases:
P ( E , V ) = P 1 ( E 1 , V 1 ) = P 2 ( E 2 , V 2 )
T ( E , V ) = T 1 ( E 1 , V 1 ) = T 2 ( E 2 , V 2 )
with the details of the equation of state for each pure phase described in the References [16,17]. The time evolution of the epsilon mass fraction X is governed by a kinetics law derived from the classical concept of nucleation and growth of phase [23,24,25]
X ( t ) = 1 exp 4 π 12 t θ 4
with θ , a characteristic time known as the transition completion time (more details can be found in the Reference [7]).

4. Elastic-Plastic Transition

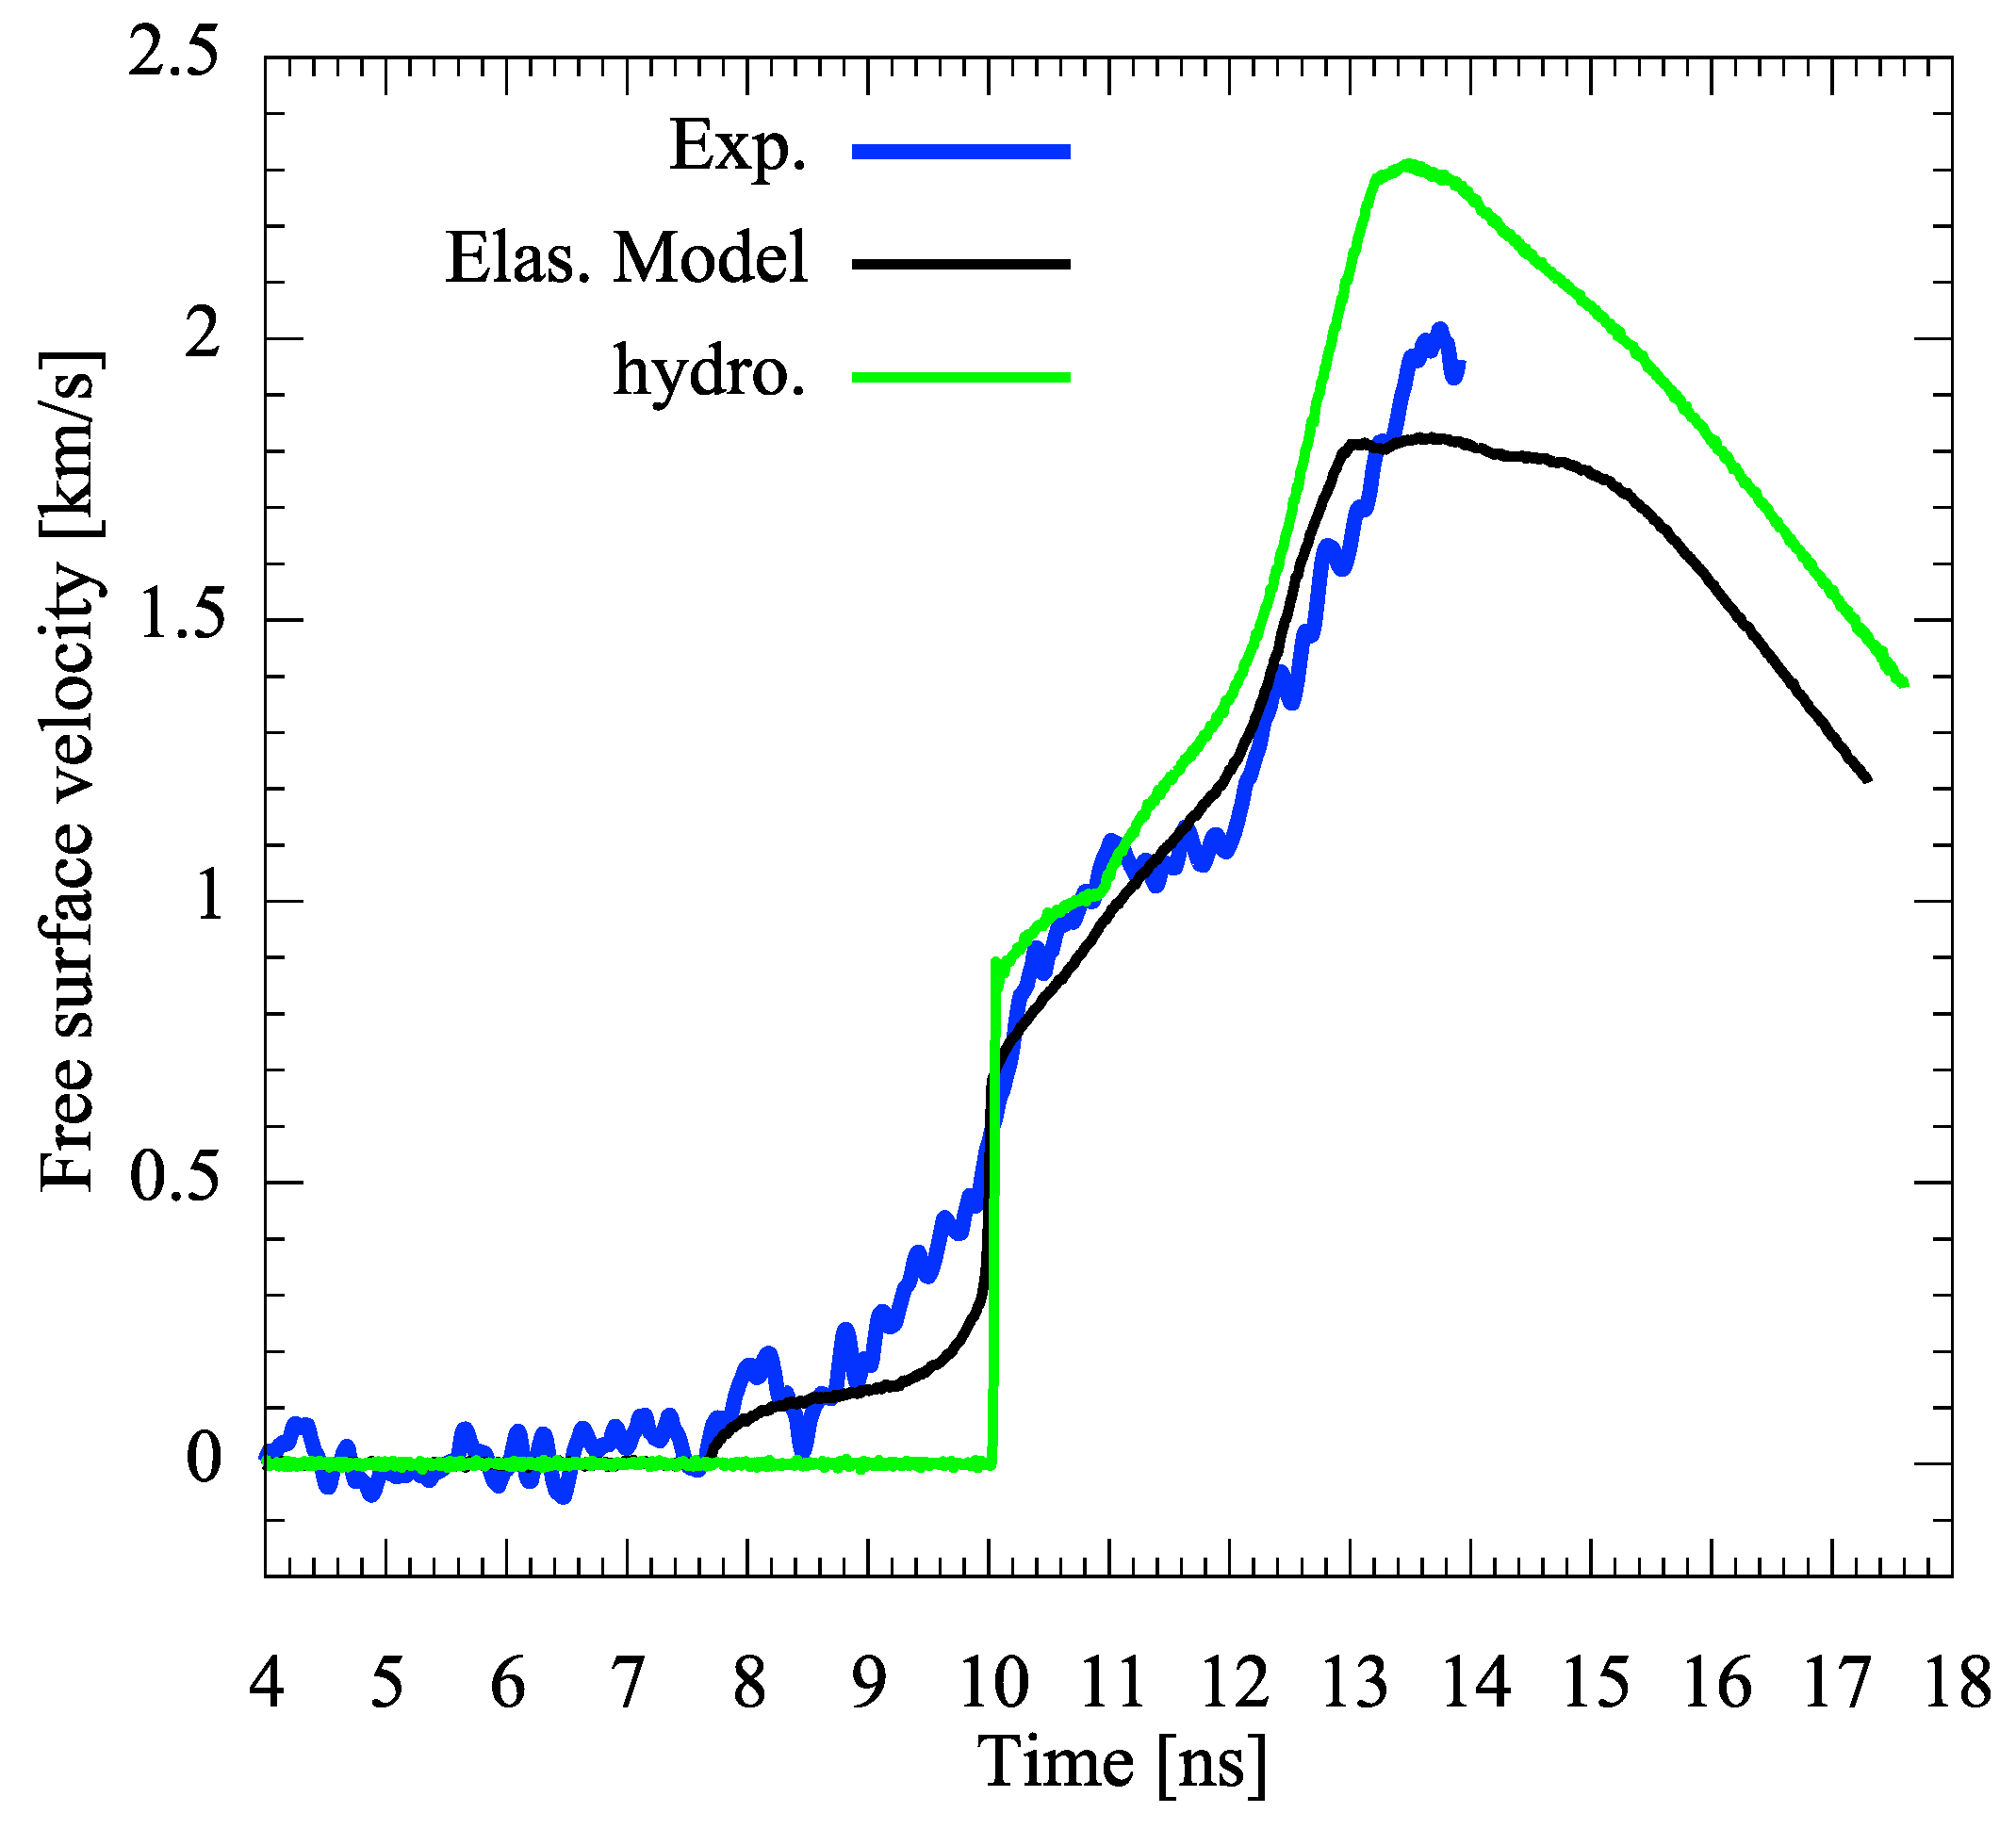
The elastic-plastic properties of metals play a crucial role in all the engineering applications mentioned in the introduction. In particular, they largely condition pressure decay with propagation distance. Finally, it is thought that they may have observable influences on the solid-solid phase transition dynamics [9]. The Figure 4 shows a comparison between the experiment (blue curve) and simulations with (black curve) and without (green curve) material strength model for a target of 50 μ m thickness at a loading rate of 3.11 × 10 7 s 1 . This loading rate was inferred at each shot from the volume profile V(t) computed just beneath the ramp-loaded surface, as a mean strain rate ϵ ˙ = 1 V 0 d V d t with V 0 the initial specific volume.
The values of the material parameters are those of the reference [21]. The hydrostatic simulation overestimates the maximum free surface velocity and starts with an abrupt acceleration due to the absence of the elastic precursor. The overall agreement is significantly better when using the full elasto-plastic model, which predicts an elastic precursor of amplitude about 100 m/s. The velocity bump at about 1 km/s, due to the phase transition, is roughly the same with both descriptions, in correct agreement with the measurement. An identic completion time of 4 ns has been used in both calculations. However, our model handles separately the elastic-plastic and the α ε transition. A stronger effect on this velocity bump would probably be expected with a more sophisticated model coupling elasticity and phase transformation. However, the example shows, that including material strength not only improves the reproduction of the simulation in the vicinity of the elastic limit but also at the final pressure.

5. α ε Transition Kinetics

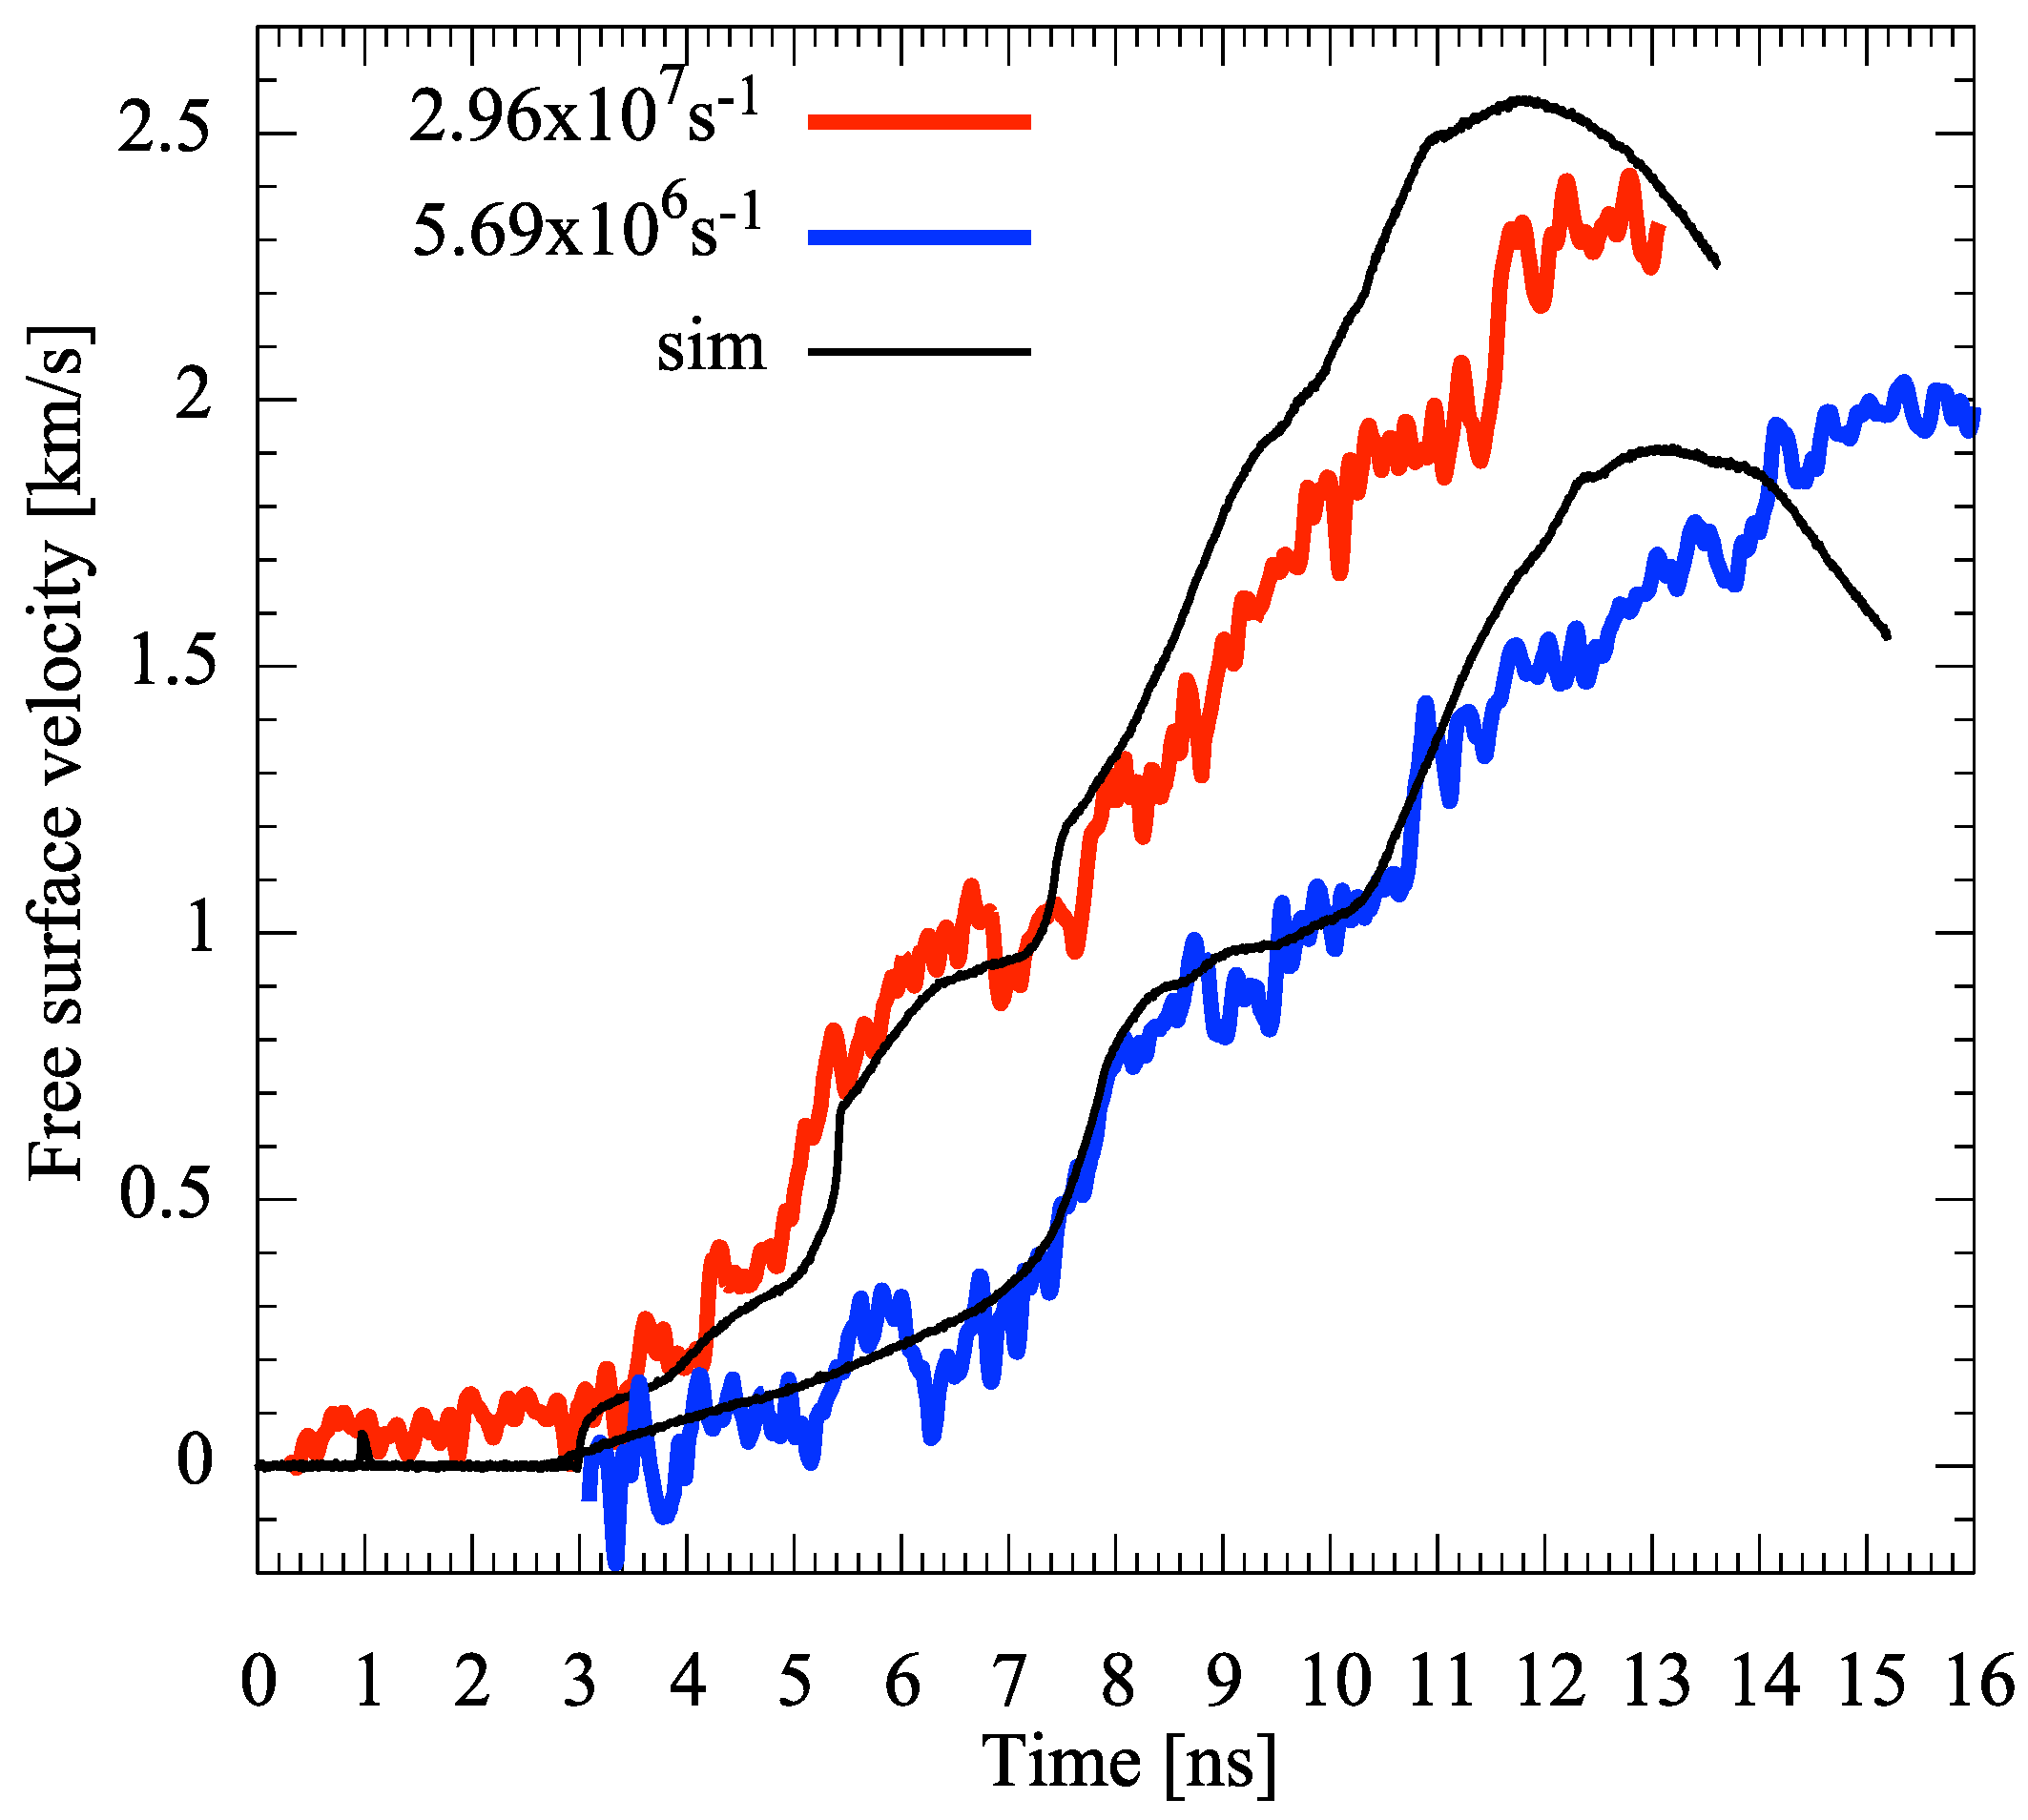
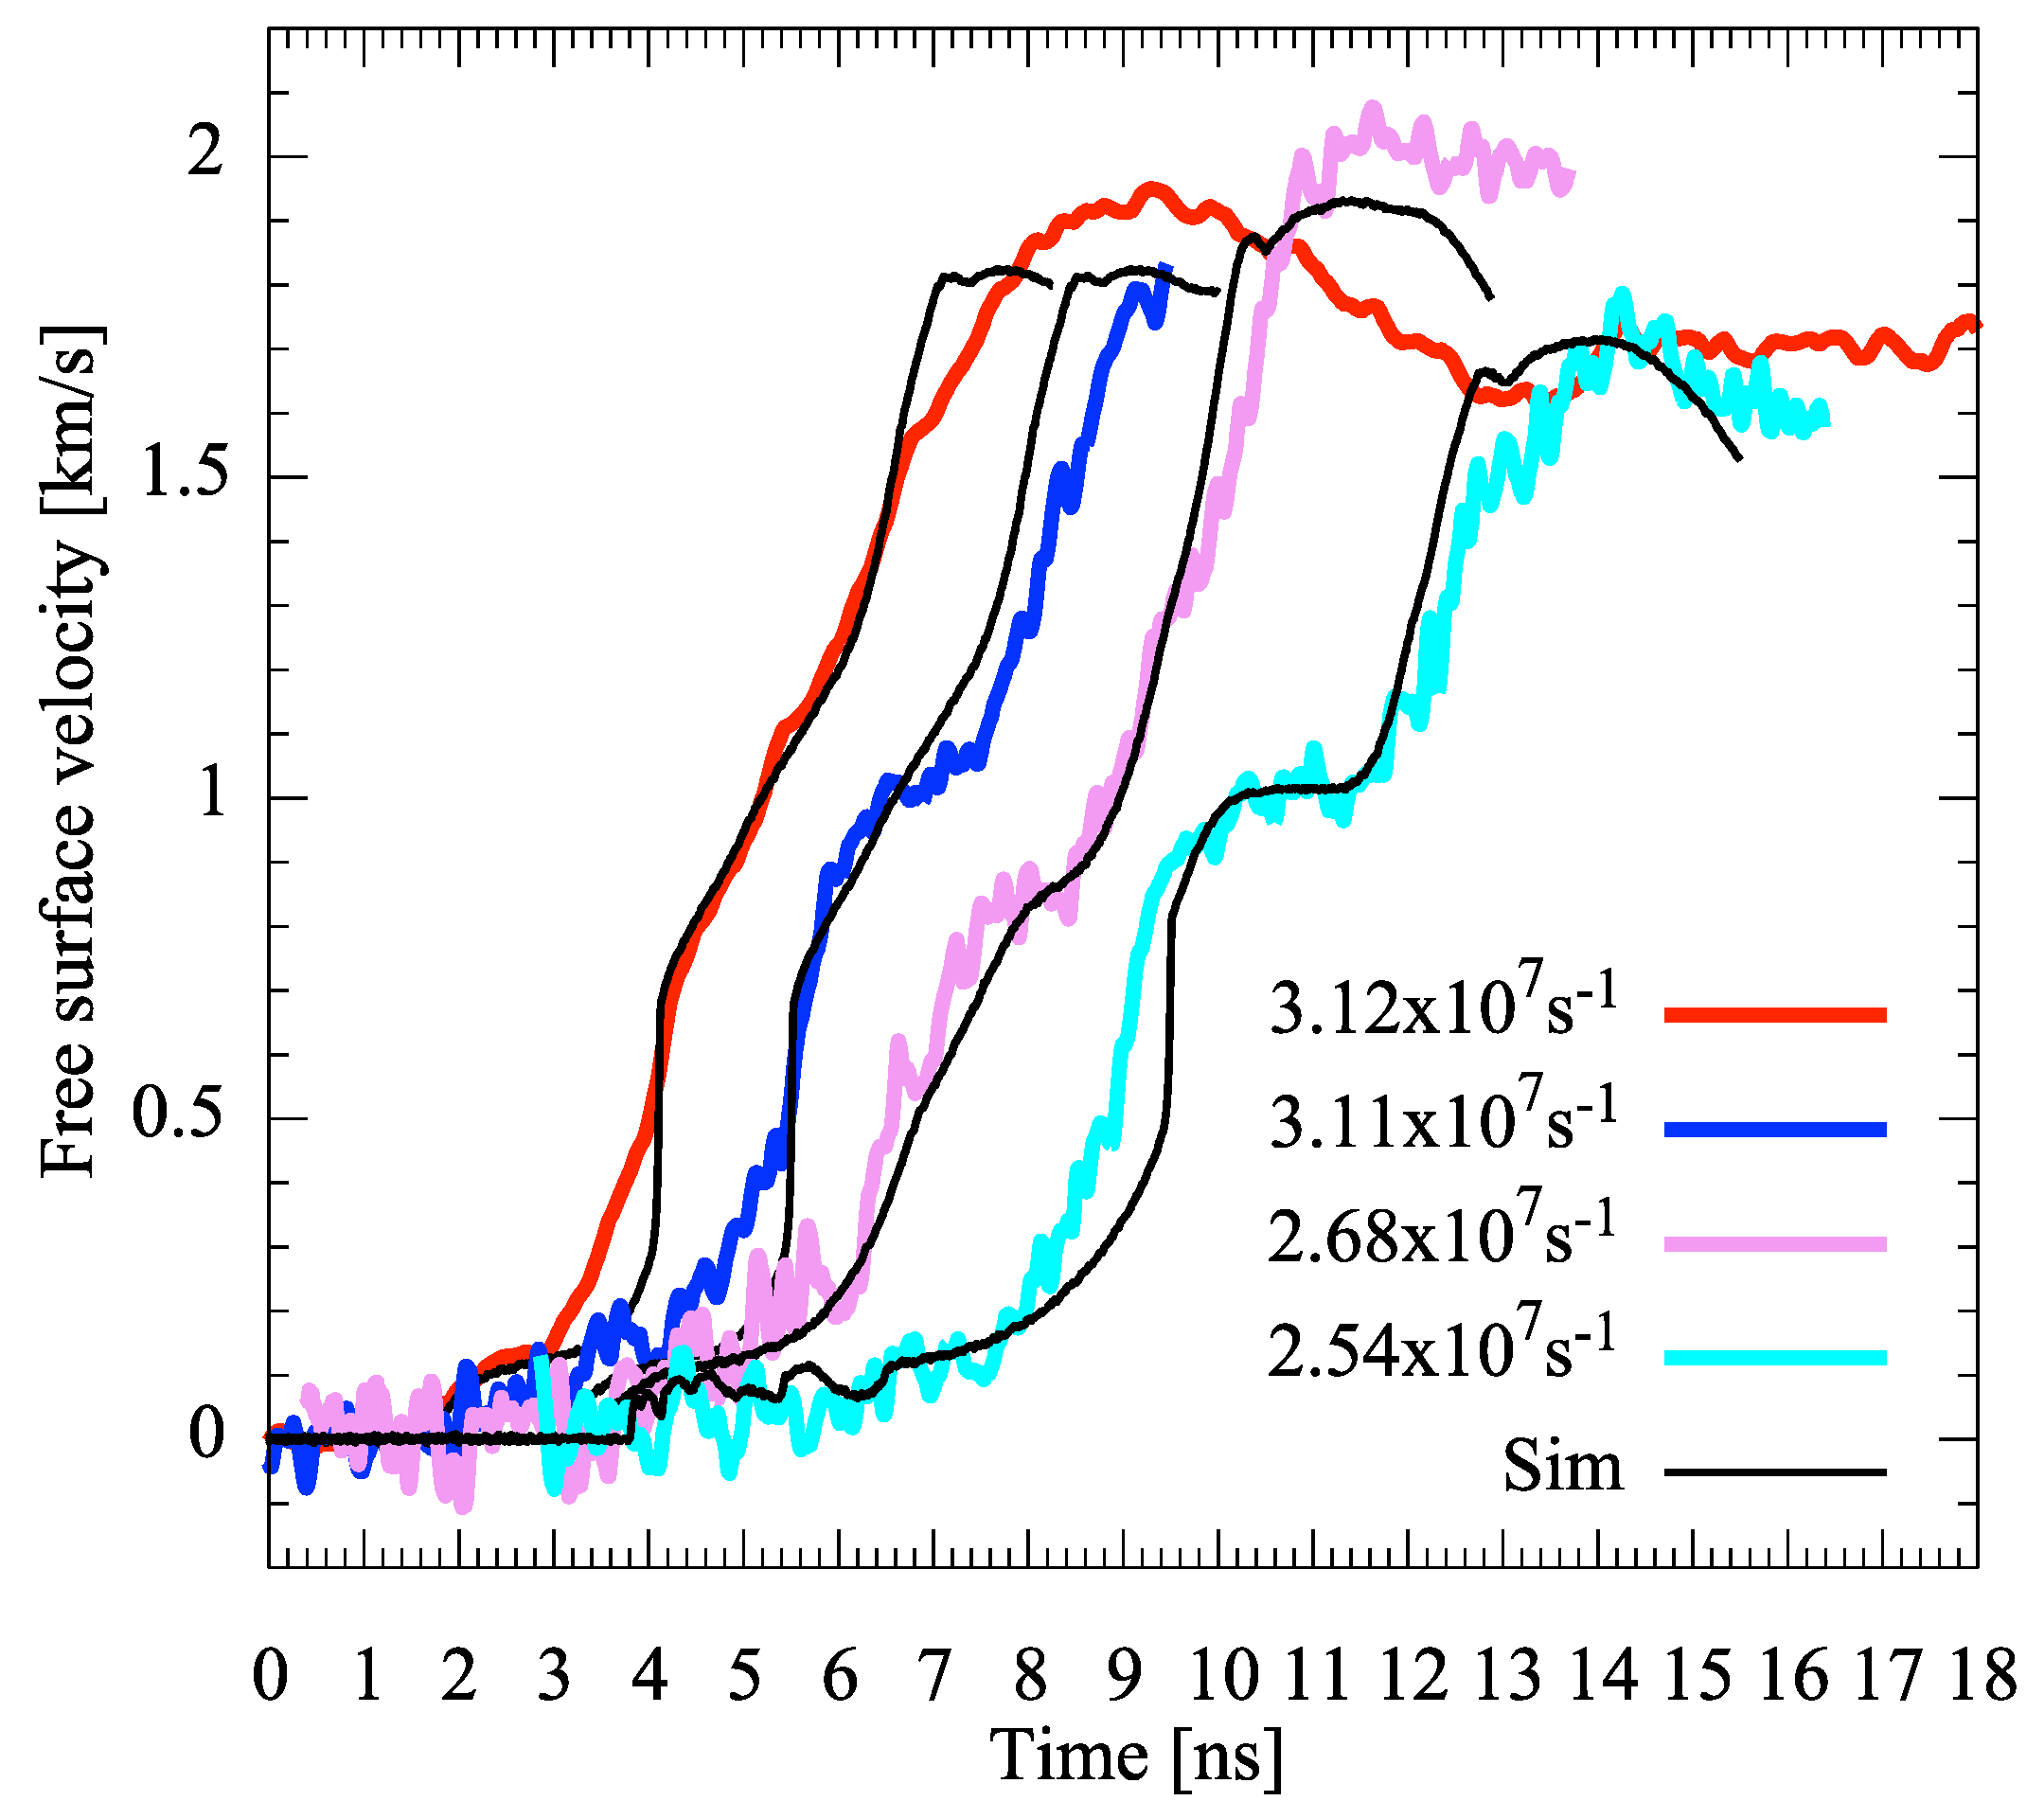
The kinetics model presented in Section 3.2 and Reference [7] allows us to estimate the transition completion time for given experimental conditions by comparing the experimental measured velocity profile to a simulated one where the corresponding measured laser pulse is used as boundary condition. In order to study the variations of this θ parameter we have varied independently loading rate and target thickness. For the thinner target (25 μ m), the θ value was found to remain constant, equal to 3 ns, when the loading rate was increased by a factor 5 (see Figure 5). However, for the thicker target (50 μ m), a variation of θ depending on the loading rate was observed (see Figure 6). Indeed, it was observed to vary from 4 ns for loading rate around 3.1 × 10 7 s 1 to 3.25 ns for loading rate around 2.5 × 10 7 s 1 .

6. Discussions

In the context of nucleation and growth, the phase transformation kinetics is based on the nucleation, at a given rate R, of nuclei of the daughter phase with critical size from germ nuclei which already exist in the parent phase and their subsequent expansion, due to a gain in free energy, at the velocity u. The germ nuclei may consist of defects of any type like grain boundary, impurity, point defects, etc. The completion time is thus assumed to be an intrinsic characteristic of the sample given by
θ = ( R u 3 ) 1 / 4
in the case of homogeneous nucleation [7]. Where the nucleation rate is given by
R = A exp [ ( Δ G c + E a ) / k B T ]
with A, a constant; E a , the activation energy and Δ G c , the energy need to form a stable nuclei with critical size which, in first approximation, is function of the interface energy between the parent and daughter phases, σ , and the thermodynamic driving force Δ G = Δ G ε G α .
Δ G c = 16 π 3 σ 3 / | Δ G | 2
Figure 4 shows that it is necessary to take into account the plastic model in order to correctly simulate the rear surface velocity profile. However, no significant difference was found in the phase transition completion time between simulations assuming hydrodynamic or elasto-plastic behaviour. This suggests that the direct contribution of the shear strength on the transition kinetics is rather small or negligible in consistence with previous observations under shock compression where no influence of the shear strength on the α ε phase transition was found [26].
However, martensitic phase transition can be considered as a deformation mechanism competing with slip and twinning [27]. Furthermore, some works (both numerical simulations [28,29] andexperiment under static compression [30]) suggest that shear stresses have a significant effect on the α ε iron phase transformation. Thus, the fact the transition completion time was the same in both simulations (pure hydrodynamic simulation or with the material strength model) may be interpreted as a limitation of our model, which handles separately the elastic-plastic and the α ε transitions. A model that couples both transitions is required. As twins are thought to be the favorite sites for the hcp nucleation during the α ε phase transition [31], we speculate a dependency of the transition kinetics on the plastic model via the fraction of the twinned material (see point ii) in the following text).
Constant completion time of 3 ns was found for the 25 μ m iron target when the loading rate was varied from 0.57 to 2.96 × 10 7 s 1 (see Figure 7). This is consistent with what was previously reported where an unique completion time was found for 9.5 μ m target when the rate was varied from 3.2 to 8.6 × 10 7 s 1 [7]. This confirms the existence of an isokinetics regime, for thin target, where the transition kinetics is independent of the deformation rate. In this regime, for a given target thickness, the temporal evolution of the fraction of the ε-phase follows an identical sigmoid form for any loading rate. Contrary, a loading rate dependent completion time was found for the target of 50 μ m (See Figure 7). This observation is similar to what was reported under shock compression for target of millimiter thickness where the transition characteristic time was found to depend on peak pressure [32,33,34].
In this article, the iron α ε phase transition completion time was found to vary depending on the sample thickness. Indeed, it increases from 1 ns in 9.5 μ m samples [7] to 3 ns in 25 μ m samples, and up to 4 ns in 50 μ m samples. This confirms the fact that in the studies of phase transition kinetics, the sample thickness is an important variable [26,31,32]. These variations and the change from isokinetics regime where θ is independent of the loading rate (for thin target) to a regime where θ depends on this rate (for thick target) are the result of a complex interplay of various process with the most important being: (i) The target initial defects density. A thin sample is generally thought to contain higher defects density than thick sample [35,36]. Thus the nucleation rate R might be lower for thick target leading to greater θ ; (ii) The creation and propagation of twins during the compression. In iron twinning is found to be the dominant plastic yielding process under fast compression [22] and twins are thought to be the favorite sites for the hcp nucleation during the α ε phase transition [31]. If this assertion is true, a decrease of twinning density with the wave propagation distance [21] will lead to the same conclusion as in point (i); (iii) A third possible explanation is the wave relaxation during its propagation through the target. Indeed, near the compression surface, the phase transition wave is highly off-equilibrium with a great absolute value of | Δ G | . As the wave propagates through the target its relaxes toward equilibrium with a decrease in | Δ G | . Thus, the energy needed to form stable critical nuclei increases with the propagation distance (see Equation (11)). Consequently, the nucleation rate is smaller far from the compression surface conducting to a large completion time for thick target; (iv) The variation of the nuclei activation energy. The iron α ε phase transformation is a martensite phase transition. In such kind of phase transition the activation energy is found to decrease lineary with the magnitude of thermodynamic drive force [37]. This allows to compensate the energy needed to form stable critical nuclei, when this energy is in the order of the interface energy, leading to an isokinetics regime. Determining the contribution of each process is currently studied and beyond the scope of this article.

7. Conclusions

In conclusion, the dynamic behaviour of polycrystalline iron samples was investigated under laser-driven ramp compression for loading rates ranging from 0.56 to 3.1 × 10 7 s 1 . The sample deformation and mechanical properties were diagnosed with a time-resolved VISAR system where elastic-plastic and the structural α ε transitions were observed in the temporal profiles of the target rear surface velocity. The elastic-plastic behaviour was modeled with a constitutive law including rate-dependent twinning and dislocation slip. The model reproduces quite well the experimental observations. The kinetics of α ε structural phase transition was interpreted in the framework of phase nucleation and growth. Over the investigated loading rate regime, the structural α ε transition was found to match an isokinetic regime for thin target (<50 μ m) with the kinetics independent of the loading rate while a different behaviour was observed for thicker target (50 μ m). More experiments are needed, over a wider range of sample thickness and loading rate, to complement the data, hopefully comfort the model validity, and consolidate some of the interpretations proposed in this paper.

Acknowledgments

We thank the PHELIX laser team for their support during the experiment. This research was supported by Region de Poitou-charentes, France.

Author Contributions

Nourou Amadou, Erik Brambrink, Thibaut de Rességuier conceived and designed the experiments; Nourou Amadou, Erik Brambrink, Björn Börm and Anaïs Molineri performed the experiments; Nourou Amadou and Adamou Ousmane Manga and Aboubacar Almoustapha analyzed the data; Thibaut de Resseguier contributed reagents/materials/analysis tools; Nourou Amadou, Thibaut de Resseguier, Erik Brambrink wrote the paper.

Conflicts of Interest

The authors declare no conflict of interest.

References

  1. Peyre, P.; Berthe, L.; Scherpereel, X.; Fabbro, R. Laser-shock processing of aluminium-coated 55C1 steel in water-confinement regime, characterization and application to high-cycle fatigue behaviour. J. Mater. Sci 1998, 33, 1421–1429. [Google Scholar] [CrossRef]
  2. Peyre, P.; Scherpereel, X.; Berthe, L.; Carboni, C.; Fabbro, R.; Béranger, G.; Lemaître, C. Surface modifications induced in 316L steel by laser peening and shot-peening, influence on pitting corrosion resistance. Mater. Sci. Eng. A 2000, 280, 294–302. [Google Scholar] [CrossRef]
  3. Warren, A.W.; Guo, Y.B.; Chen, S.C. Massive parallel laser shock peening: Simulation, analysis and validation. Int. J. Fatigue 2008, 30, 188–197. [Google Scholar] [CrossRef]
  4. De Rességuier, T.; Romain, J.P. Investigation of the response of a porous steel to laser driven shocks. Shock Waves 2001, 11, 125–132. [Google Scholar] [CrossRef]
  5. Berthe, L.; Arrigoni, M.; Boustie, M.; Cuq-Lelandais, J.P.; Broussillou, C.; Fabre, G.; Jeandin, M.; Guipont, V.; Nivard, M. State of the art LASer Adhesion Test (LASAT). Nondestruct. Test. Eval. 2011, 26, 303–317. [Google Scholar] [CrossRef]
  6. Bégué, G.; Fabre, G.; Guipont, V.; Jeandin, M.; Bilhe, P.; Guédou, J.Y.; Lepoutre, F. Laser Shock Adhesion Test (LASAT) of electron beam physical vapor deposited thermal barrier coatings: Toward an industrial application. Surf. Coat. Technol. 2013, 237, 305–312. [Google Scholar] [CrossRef]
  7. Amadou, N.; de Resseguier, T.; Brambrink, E.; Benuzzi-Mounaix, A.; Huser, G.; Guyot, F.; Mazevet, S.; Morard, G.; Vinci, T.; Myanishi, K.; et al. Kinetics of the iron αε phase transition at high strain rates: Experiment and model. Phys. Rev. B 2016, 93, 214108. [Google Scholar] [CrossRef]
  8. Amadou, N.; Brambrink, E.; Benuzzi-Mounaix, A.; Huser, G.; Guyot, F.; Mazevet, S.; Morard, G.; de Resseguier, T.; Vinci, T.; Myanishi, K.; et al. Direct laser-driven ramp compression studies of iron: A first step toward the reproduction of planetary core conditions. High Energy Density Phys. 2013, 9, 243–246. [Google Scholar] [CrossRef]
  9. Smith, R.F.; Eggert, J.H.; Swift, D.C.; Wang, J.; Duffy, T.S.; Braun, D.G.; Rudd, R.E.; Reisman, D.B.; Davis, J.-P.; Knudson, M.D.; et al. Time-dependence of the alpha to epsilon phase transformation in iron. J. Appl. Phys. 2013, 114, 223507. [Google Scholar] [CrossRef]
  10. Lorenzana, H.E.; Belak, J.F.; Bradley, K.S.; Bringa, E.M.; Budil, K.S.; Cazamias, J.U.; El-Dasher, B.; Hawreliak, J.A.; Hessler, J.; Kadau, K.; et al. Shocked materials at the intersection of experiment and simulation. Sci. Model. Simul. 2008, 15, 159–186. [Google Scholar] [CrossRef]
  11. De Rességuier, T.; Loison, D.; Dragon, A.; Lescoute, E. Laser driven compression to investigate shock-induced melting of metals. Metals 2014, 4, 490–502. [Google Scholar] [CrossRef]
  12. Brambrink, E.; Amadou, N.; Benuzzi-Mounaix, A.; Geissel, M.; Harm, M.; Pelka, A.; Vinci, T.; Koenig, M. Production and diagnostics of dense matter. Contrib. Plasma Phys. 2015, 55, 67–77. [Google Scholar] [CrossRef]
  13. Swift, D.C.; Kraus, R.G.; Loomis, E.N.; Hicks, D.G.; McNaney, J.M.; Johnson, R.P. Shock formation and the ideal shape of ramp compression waves. Phys. Rev. E 2008, 78, 066115. [Google Scholar] [CrossRef] [PubMed]
  14. Barker, L.M.; Hollenbach, R.E. Laser interferometer for measuring high velocities of any reflecting surface. J. Appl. Phy. 1972, 43, 4669–4675. [Google Scholar] [CrossRef]
  15. Ramis, R.; Schmalz, R.; Meyer-ter-Vehn, J. MULTI—A computer code for one-dimensional multigroup radiation hydrodynamics. Comput. Phys. Commun. 1988, 49, 475. [Google Scholar] [CrossRef]
  16. De Rességuier, T.; Hallouin, M. Effects of the αε phase transition on wave propagation and spallation in laser shock-loaded iron. Phys. Rev. B 2008, 77, 174107. [Google Scholar] [CrossRef]
  17. De Rességuier, T.; Hallouin, M. Interaction of two laser shocks inside iron samples. J. Appl. Phys. 2001, 90, 4377–4384. [Google Scholar] [CrossRef]
  18. Richtmyer, R.D.; Morton, K.W. Difference methods for initial-value problems. In Interscience Tracts in Pure and Applied Mathematics; Bers, L., Courant, R., Stoker, J.J., Eds.; John Wiley & Sons, Inc.: New York, NY, USA, 1967. [Google Scholar]
  19. Hiermaire, S.J. Structures under Crash and Impact Continuum Mechanics, Discretization and Experimental Characterization; Springer: New York, NY, USA, 2008. [Google Scholar]
  20. Wilkins, M.L. Computer Simulation of Dynamic Phenomena; Springer: Berlin, Germany, 1999. [Google Scholar]
  21. De Rességuier, T.; Hallouin, M. Stress relaxation and precursor decay in laser shock-loaded iron. J. Appl. Phys. 1998, 84, 1932–1938. [Google Scholar] [CrossRef]
  22. Johnson, J.N.; Rohde, R.W. Dynamic Deformation Twinning in Shock-Loaded Iron. J. Appl. Phys. 1971, 42, 4171–4182. [Google Scholar] [CrossRef]
  23. Avrami, M. Kinetics of Phase Change. I General Theory. J. Chem. Phys. 1939, 7, 1103–1112. [Google Scholar] [CrossRef]
  24. Avrami, M. Kinetics of Phase Change. II TransformationTime Relations for Random Distribution of Nuclei. J. Chem. Phys. 1940, 8, 212–224. [Google Scholar] [CrossRef]
  25. Avrami, M. Granulation, Phase Change, and Microstructure Kinetics of Phase Change. III. J. Chem. Phys. 1941, 9, 177–184. [Google Scholar] [CrossRef]
  26. Duvall, G.E.; Graham, R.A. Phase transitions under shock-wave loading. Rev. Mod. Phys. 1977, 49, 523–579. [Google Scholar] [CrossRef]
  27. Meyers, M.A.; Murr, L.E. Defect generation in shockwave deformation. In Shock Waves and High-Strain-Rate Phenomena in Metals, Concepts and Applications; Meyers, M.A., Murr, L.E., Eds.; Plenum Press: New York, NY, USA, 1981; pp. 487–530. [Google Scholar]
  28. Caspersen, K.J.; Lew, A.; Ortiz, M.; Carter, E.A. Importance of Shear in the bcc-to-hcp Transformation in Iron. Phys. Rev. Lett. 2004, 93, 115501. [Google Scholar] [CrossRef] [PubMed]
  29. Cui, X.; Zhu, W.; He, H.; Deng, X.; Li, Y. Phase transformation of iron under shock compression: Effects of voids and shear stress. Phys. Rev. B 2008, 78, 024115. [Google Scholar] [CrossRef]
  30. Ma, Y.; Selvi, E.; Levitas, V.I.; Hashemi, J. Effect of shear strain on the α-ϵ phase transition of iron: A new approach in the rotational diamond anvil cell. J. Phys. Condens. Matt. 2006, 18, S1075–S1082. [Google Scholar] [CrossRef] [PubMed]
  31. Forbes, J.F. Experimental Investigation of the Kinetics of the Shock-Induced Alpha to Epsilon Phase Transformation in Armco Iron; Naval Surface Weapons Center; White Oak Laboratory: Silver Spring, MD, USA, 1977; pp. 72–90. [Google Scholar]
  32. Barker, L.M.; Hollenbach, R.E. Shock wave study of the αε phase transition in iron. J. Appl. Phys. 1974, 45, 4872–4887. [Google Scholar] [CrossRef]
  33. Boettger, J.C.; Wallace, D.C. Metastability and dynamics of the shock-induced phase transition in iron. Phys. Rev. B 1997, 55, 2840–2849. [Google Scholar] [CrossRef]
  34. Jensen, B.J.; Gray, G.T., III; Hixson, R.S. Direct measurements of the α-ϵ transition stress and kinetics for shocked iron. J. Appl. Phys. 2009, 105, 103502. [Google Scholar] [CrossRef]
  35. Bastea, M.; Bastea, S.; Becker, R. High pressure phase transformation in iron under fast compression. J. Appl. Phys. 2009, 95, 241911. [Google Scholar] [CrossRef]
  36. Hawreliak, J.; Colvin, J.D.; Eggert, J.H.; Kalantar, D.H.; Lorenzana, H.E.; Stölken, J.S.; Davies, H.M.; Germann, T.C.; Holian, B.L.; Kadau, K.; et al. Atomistic simulations of shock-induced transformations and their orientation dependence in bcc Fe single crystals. Phys. Rev. B 2006, 74, 184107. [Google Scholar] [CrossRef]
  37. Blank, V.D.; Estrin, E.I. Hysteresis and kinetics of low-temperature polymorphic transformations under pressure. In Phase Transitions in Solids Under High Pressure; CRC Press, Taylor and Francis Group: Boca Raton, FL, USA, 2014; Chapter 14; pp. 382–423. [Google Scholar]
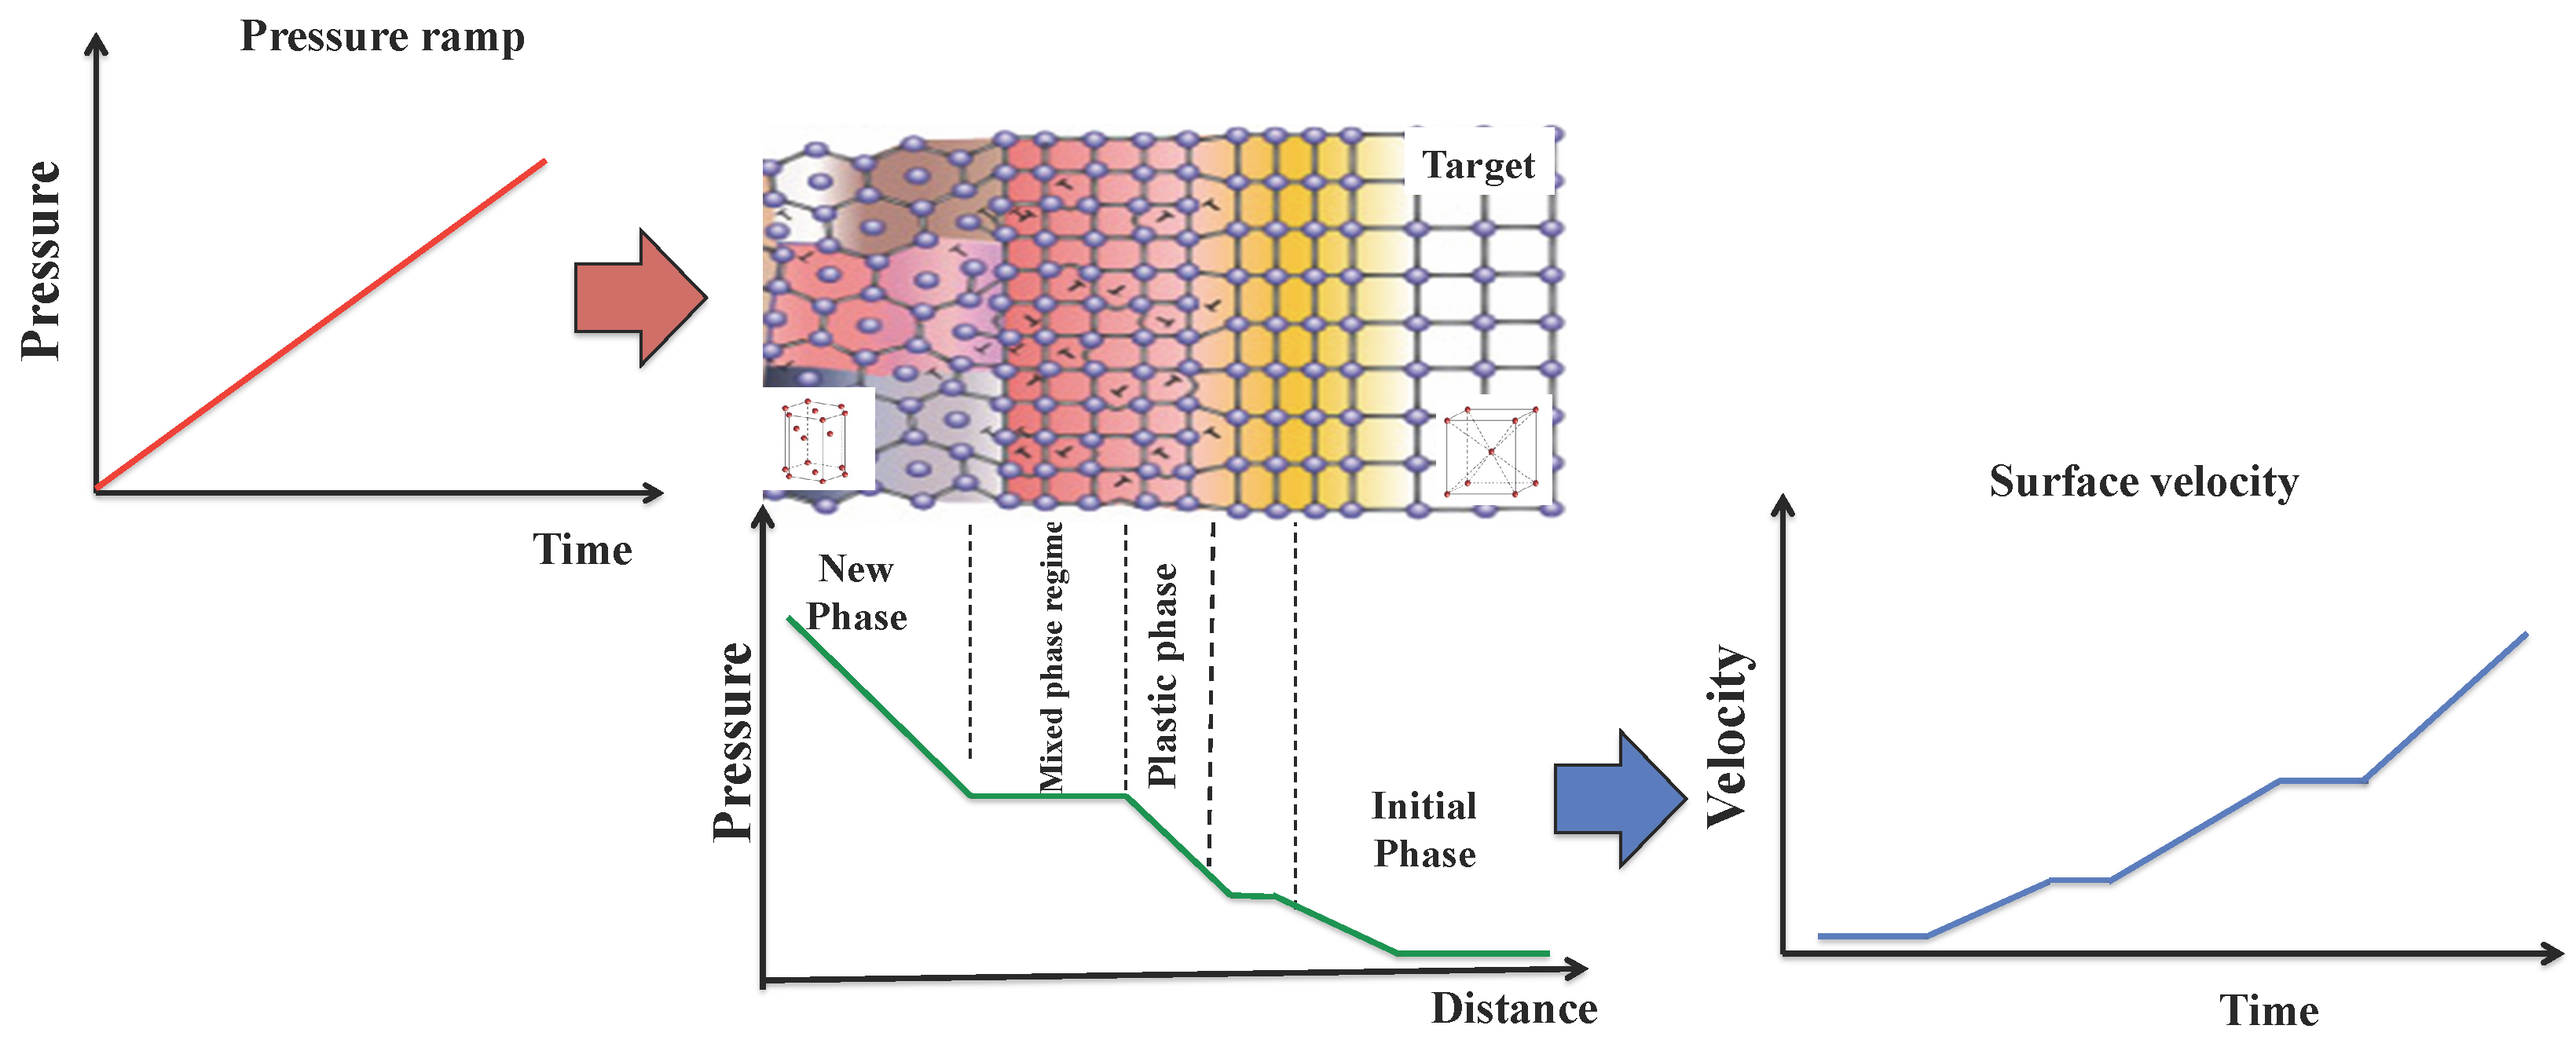
Figure 1. Adaptation from Reference [10] of the schematic relation between the microstructural process occuring during ramp compression of crystal and the target rear surface velocity. When the material compressibility changes, due to an elastic-plastic transition or to a phase transformation, the atomic re-organization, in the compression front, modifies the dynamical response of the crystal causing a variation in the slope the measured rear surface velocity.
Metals 06 00320 g001
Figure 2. Schematic experimental set up where a Velocity Interferometer System for Any Reflector (VISAR) was used to record the target free surface.
Metals 06 00320 g002
Figure 3. Pressure loading profiles as simulated by the code MULTI [15] (see in the text) and used as boundary conditions in our simulations. Inset: typical example of measured laser intensity profile.
Metals 06 00320 g003
Figure 4. Comparison between experiment (blue curve) and simulations with (black curve) and without (green curve) material strength model. for a target of 50 μ m thickness at a loading rate of 3.11 × 10 7 s 1 . Similar behaviour was observed for the 25 μ m target and other loading rates.
Metals 06 00320 g004
Figure 5. VISAR profiles for different loading rates for the iron 25 microns thick target. The thin black curves are the numerical simulation where the completion time θ was set to 3 ns. For clarity, the velocity profiles are temporally shifted.
Metals 06 00320 g005
Figure 6. VISAR profiles for different loading rates for the iron 50 microns thick target. The black thin lines are numerical simulations where the completion time was set to be 4 ns for the loading rate of 3.12 and 3.11 × 10 7 s 1 and 3.25 for those of 2.68 and 2.56 × 10 7 s 1 . For clarity, the velocity profiles are temporally shifted.
Metals 06 00320 g006
Figure 7. Variation of the completion time ( θ ) with the loading rate. For the 25 microns thick target, θ remains constant while for the 50 microns two distinct values of θ are observed.
Metals 06 00320 g007