
Contact Properties and Wear Behaviour of Nickel Based Superalloy René 80


Politecnico di Torino—Dipartimento di Ingegneria Meccanica e Aerospaziale, Corso Duca degli Abruzzi, 24, Torino 10129, Italy
Metals 2016, 6(7), 159; https://doi.org/10.3390/met6070159
Submission received: 23 May 2016
/
Revised: 5 July 2016
/
Accepted: 6 July 2016
/
Published: 12 July 2016
(This article belongs to the Special Issue Ni- and Co-Based Superalloys and Their Coatings)
Abstract
:A superalloy traditionally offers excellent mechanical strength, resistance to thermal creep deformation, good surface stability and resistance to corrosion or oxidation. However, a superalloy often also needs performance in terms of fretting resistance. Experimental results regarding fretting wear and contact properties of the superalloy René 80 are illustrated and discussed. The widespread applications of superalloys in jointing with friction as in the jointing of a turbine blade, is the main motivation for characterizing their fretting behaviour. The fretting experiments were performed at 100 Hz for two temperatures (600, 800 °C), and two sliding amplitudes (30, 60 µm). These temperatures and strokes are typical at the medium stage of a low-pressure gas turbine. Wear volume and the contact properties such as friction coefficient and tangential contact stiffness were measured and analysed. Results show that the lowest friction coefficient was measured at the temperature of 800 °C. This temperature hence appears to be an optimum working condition for the fretting wear of René 80. With regard to wear mechanism, a fundamental role of the sliding amplitude was found. In particular, the ratio between the sliding amplitude and the characteristic contact length has a significant influence upon the oxide growth on contact surfaces.
Keywords:
contact properties; friction coefficient; contact stiffness; fretting; wear; superalloy; René 801. Introduction
The widespread application of turbines, particularly gas turbines, in strategic fields such as power generation, oil & gas and jet engines is the main reason for the existence of superalloy. Gas turbine efficiency is mainly correlated with the compression ratio: if this increases the efficiency increases. The problem is that to a higher compression ratio corresponds a higher temperature at the end of the combustion phase. As a consequence, taking into account that the gas turbine blades are continuously in contact with a post combustion gas, the turbine blades are strongly stressed by the centrifugal load at high temperatures. In other words, the efficiency of the gas turbine increases if the blades are able to work at high temperatures. Therefore, the materials of turbine blades were traditionally required to perform well in terms of thermal creep deformation, good surface stability and resistance to corrosion or oxidation. Moreover, superalloys are also known as “Heat Resisting Alloys” or “High Temperature Alloys”. Even if the origin of the name superalloy seems to be rather obscure, it appears in the late 1940s and it could be related to the television hero Superman [1]. Although the majority of today’s superalloys are used in gas the turbine industry, these materials have a wide range of applications. Even if the current development of superalloys is essentially stimulated by gas turbines, they were initially developed and applied in components that worked at elevated temperatures under high stress, and in severe environments. To sum up, the development of superalloys, today can be essentially associated to the necessity of increasing gas turbine efficiency, using alloys with better performance at high temperatures.
Due to the applications of superalloys in turbine components, with respect to the traditional properties of superalloys, such as good performance in terms of thermal creep deformation and resistance to corrosion, the further properties of good performances in terms of fretting wear and fatigue are also required. Fretting is the relative oscillatory tangential movement at low amplitude which may occur at component interfaces subjected to vibration. The damage to the mating surfaces generated by this cyclic stressing is a function of the contact conditions such as temperature, normal load, relative displacement amplitude, and frequency. Moreover, fretting can accelerate crack initiation as well as interfacial degradation. Working turbine blades joints, usually exhibit relative displacements from a few micrometres to 200 μm. Consequently, fretting occurs at typical blade joints with the disk, the other blades and the blade damping systems. The origin of these displacements are essentially vibrations and load cycles. The typical fretting frequencies of turbine blades are from a few hundred to a few thousand Hertz, but there are blades that vibrate at 6000 Hz. On the other hand, displacements due to load cycles are usually at low frequencies, less than 10 Hz. Whit regard to temperatures, the blade joints may work from just over 100 °C up to over 1000 °C. Commonly, superalloys are applied from a medium (400 °C) to high temperature. The contact pressure can be from a few to hundreds of megapascals. In order to avoid catastrophic blade failure, the control of the fretting processes on the contact surfaces is a fundamental action. An example of this is the typical blade failure mechanism activated by a loss of interlocking on the damping surfaces. As a consequence of a loss of interference, the blade vibration amplitude increases and a further loss of interlocking takes place and leads to a further increase in vibration amplitude. This unstable mechanism can produce blade failure. As a consequence of a blade failure, the turbine must be shutdown. At this point, it can be stated that the fretting behaviour of superalloys is a fundamental property for the application of this material in turbine components.
This paper aims to show the fretting wear behaviour and the contact properties, friction coefficient and tangential contact stiffness, of the superalloy René 80. An example of the application of this nickel-based superalloy are the stages of rotor blades and stator vanes of some turbines. Although it was reported before [2], fretting has been an object of research since the 1927 [3]. With regard to the fretting of superalloys for turbine applications, widespread studies have been published. However, regarding the fretting wear of René 80 there is a lack of literature. Nevertheless, the authors of [4] reports a fretting fatigue study where the specimen material was René 95 while the pad was a directionally solidified René 80. Furthermore, in [5] a low cycle fatigue study can be found. In this study, fretting wear experiments were conducted with a nominal spherical surface that was pressed against a flat surface. The mating surfaces were worn by means of an alternating relative displacement, where amplitude, frequency, temperature and normal load were controlled. The wear process was performed with samples of the same material under the typical operating conditions of blade tips and stator vanes for a low-pressure turbine. After the wear tests, the worn surfaces were analysed using an optical three-dimensional measurement system in high resolution based on focus variation technique and Scanning Electron Microscopy (SEM). Wear volume and contact properties such as friction coefficient and tangential contact stiffness were measured and analysed. Results show that the lowest dissipated energy and consequently the lowest friction coefficient was measured at the temperature of 800 °C. This temperature appears to be an optimum working condition for the fretting wear of René 80. With regard to the wear mechanism, a fundamental role of the sliding amplitude was found. In particular, the ratio between the sliding amplitude and the characteristic contact length has a significant influence upon the oxides growth on the contact surfaces.
In order to obtain predictive dynamic models, knowledge of the contact parameters and wear evolution is fundamental. In [6,7] it is clearly illustrated how an appropriate value of the contact stiffness is necessary to obtain the right resonance frequencies. Typically, a model tuning with the experimental data is necessary in order to obtain the correct value of the contact parameters. Moreover, taking into account that the contact parameters depend on the wear state of the contact surfaces, it is even more important to know the evolution of the contact parameters as a function of the wear state.
2. Materials and Methods
2.1. Experimental Plan and Samples
Tests at different durations, namely 5 × 10⁶, 10 × 106 and 15 × 106 wear cycles, were performed at the frequency of 100 Hz with a normal load of 32 N. In addition, the experimental conditions (see Table 1) was based on two temperature (600, 800 °C) and two strokes (30, 60 µm).
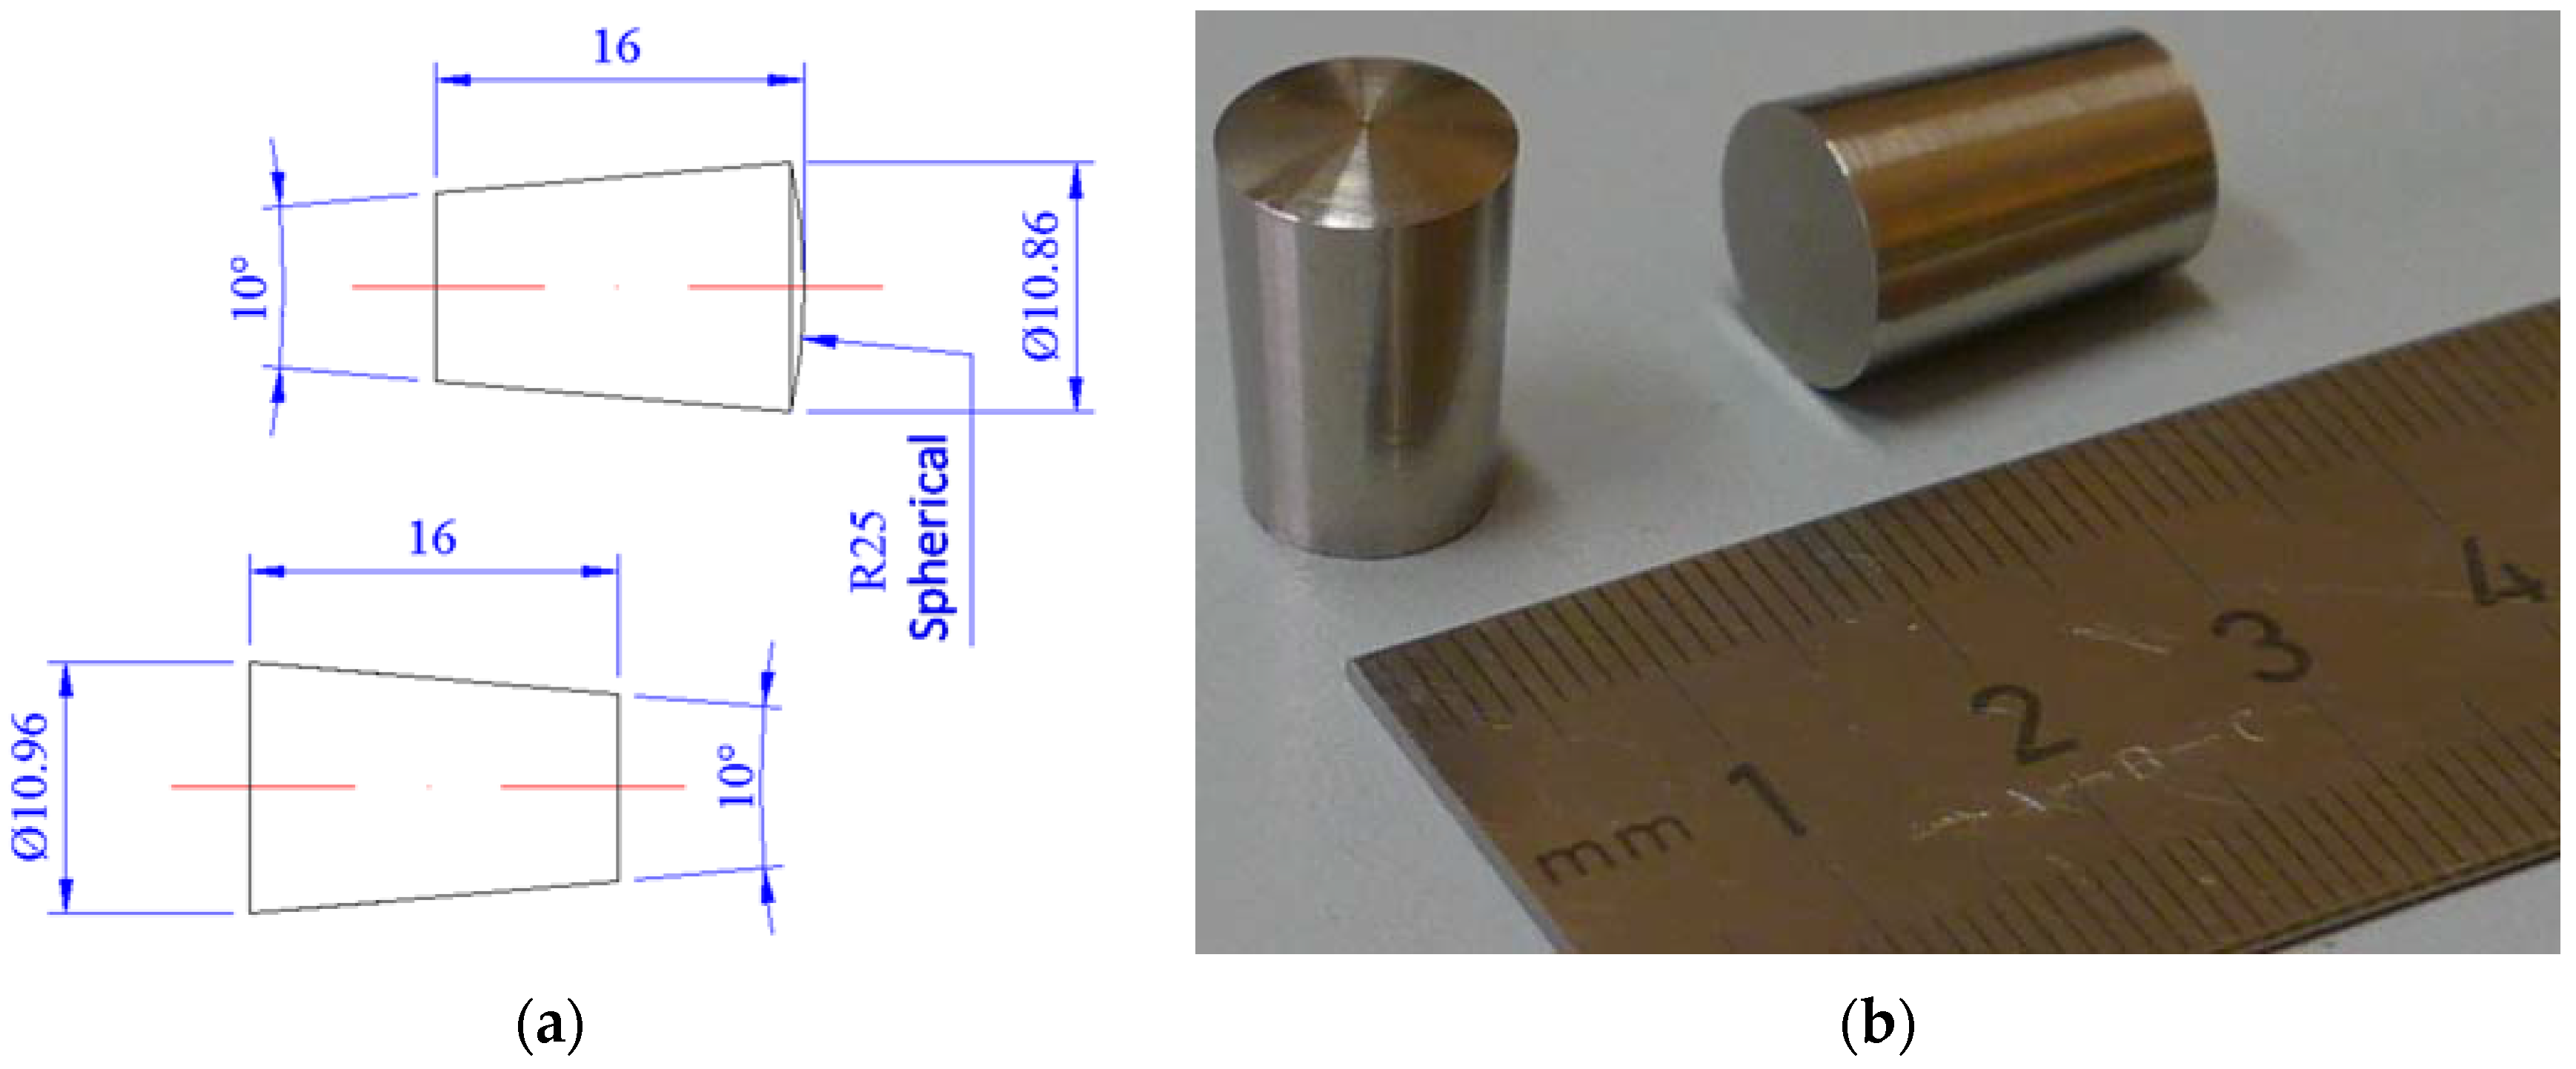
Experiments were conducted with a nominal spherical surface which was pressed against a flat surface of the same material. The radius of the sphere was of 25 mm while the normal load generated by the application of a constant mass of 3.2 kg was 31.75 N. Figure 1 shows a drawing and a picture of the samples. They were produced by the machining of a bar of a circular cross section. The roughness (Ra) of flat contact surfaces was 0.3 µm while it was 0.4 µm for the spherical contact surface. These roughness measurements both had a cut-off length of 250 µm. Chemical composition and mechanical properties of René 80 can be found in [5,8,9].
As a consequence, contact area and pressure calculated using Hertz’s theory at different temperatures are listed in Table 1. This computation was essentially based on Poisson’s ratio modulus of elasticity reported in [8], while the modulus of elasticity at room temperature (21 °C) was obtained from the source [9].
2.2. Test Rig and Procedures
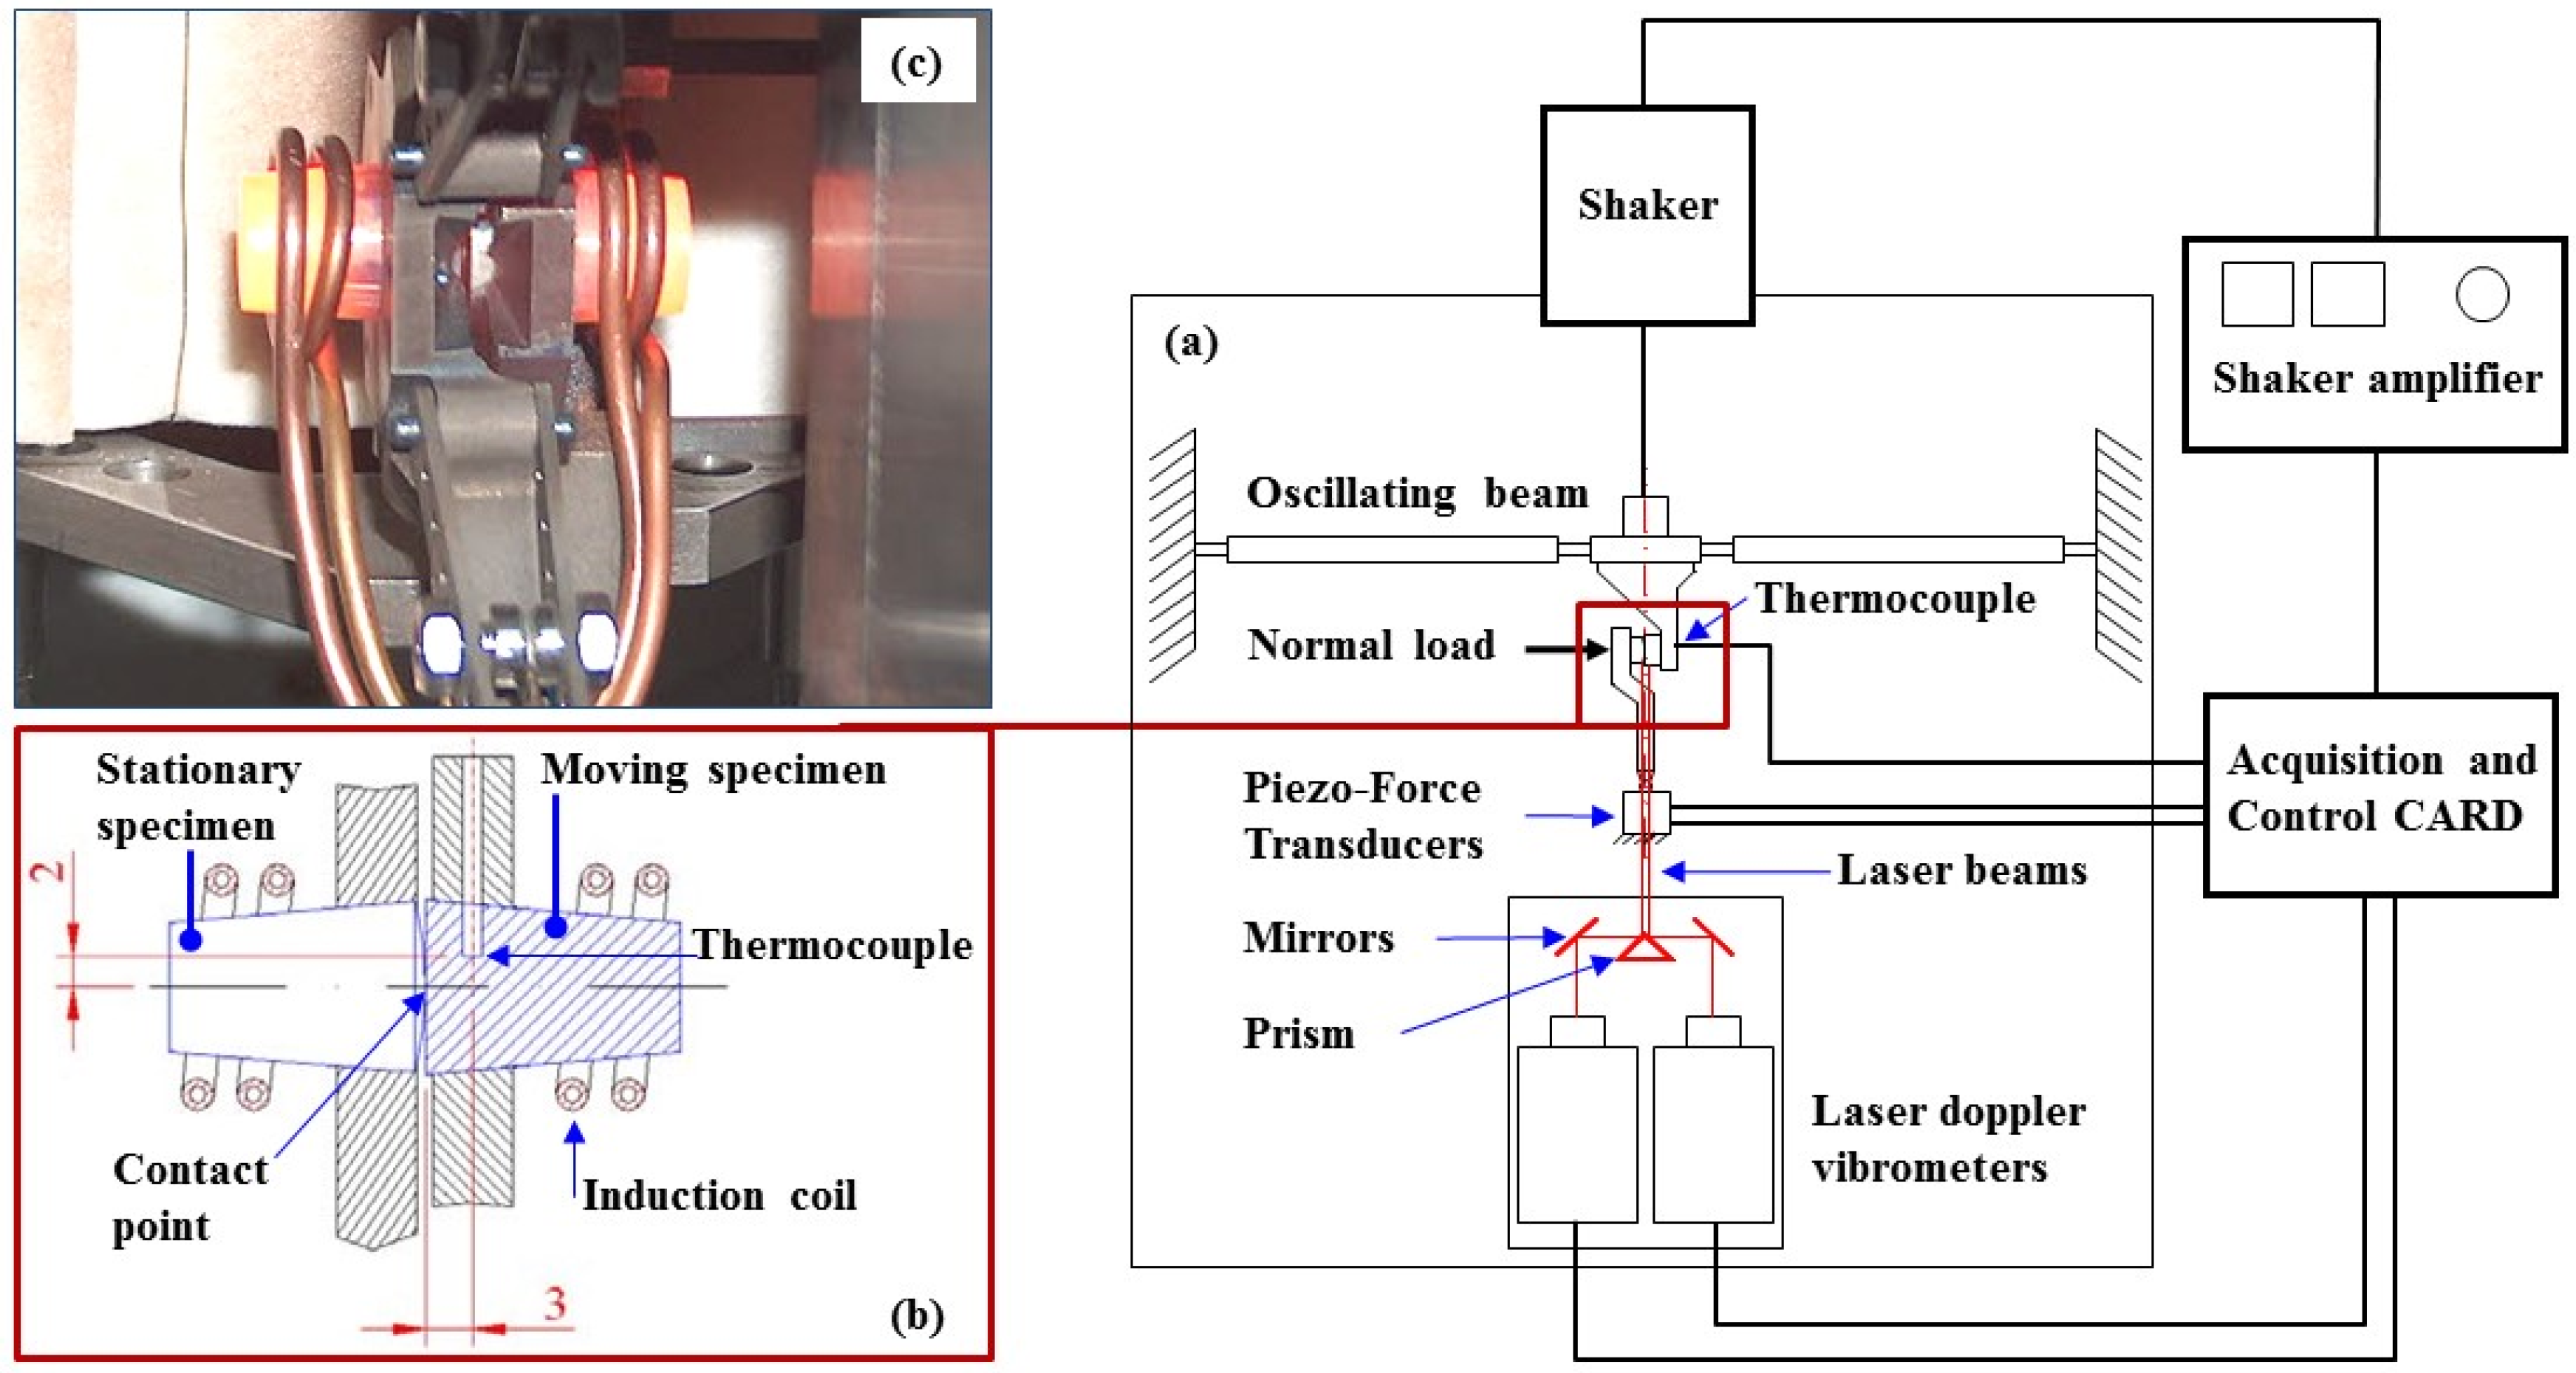
The fretting experiments were performed on a rig to characterize the friction hysteresis for a point contact at high temperature designed at Politecnico di Torino, LAQ AERMEC—Department of Mechanical and Aerospace Engineering. A description of the rig can be found in [10], while Figure 2 contains a general scheme and a detailed illustration of specimens.
The two specimens rub against each other with a displacement of low amplitude (typically, from 1 μm to 250 μm) under the action of a constant normal load. The sample support of the flat specimen was fixed on an oscillating beam that was set in motion by a shaker. The shaker input voltage was controlled by a computer card using the relative displacement of two specimen as feedback. The measurement of the relative displacements was taken as closely as possible to the actual contact point using two laser Doppler vibrometers (Figure 2a). The same card performed the control algorithm for both relative displacement and contact temperature. This temperature was controlled on the basis of thermocouple measurements located near the contact point (Figure 2b). Feedback control automatically kept the contact temperature constant at the set-point value throughout the whole test (Figure 2a). The temperature adjustment was made by switching the induction machine on and off within a duty cycle of one second. The sample support of the spherical specimen was fixed and constrained by two piezo-force transducer sensors in order measure the tangential contact force. The hysteresis loops, which are the tangential contact forces as a function of relative displacements, were visualized and stored during the test. The contact parameters were obtained by hysteresis loop elaborations.
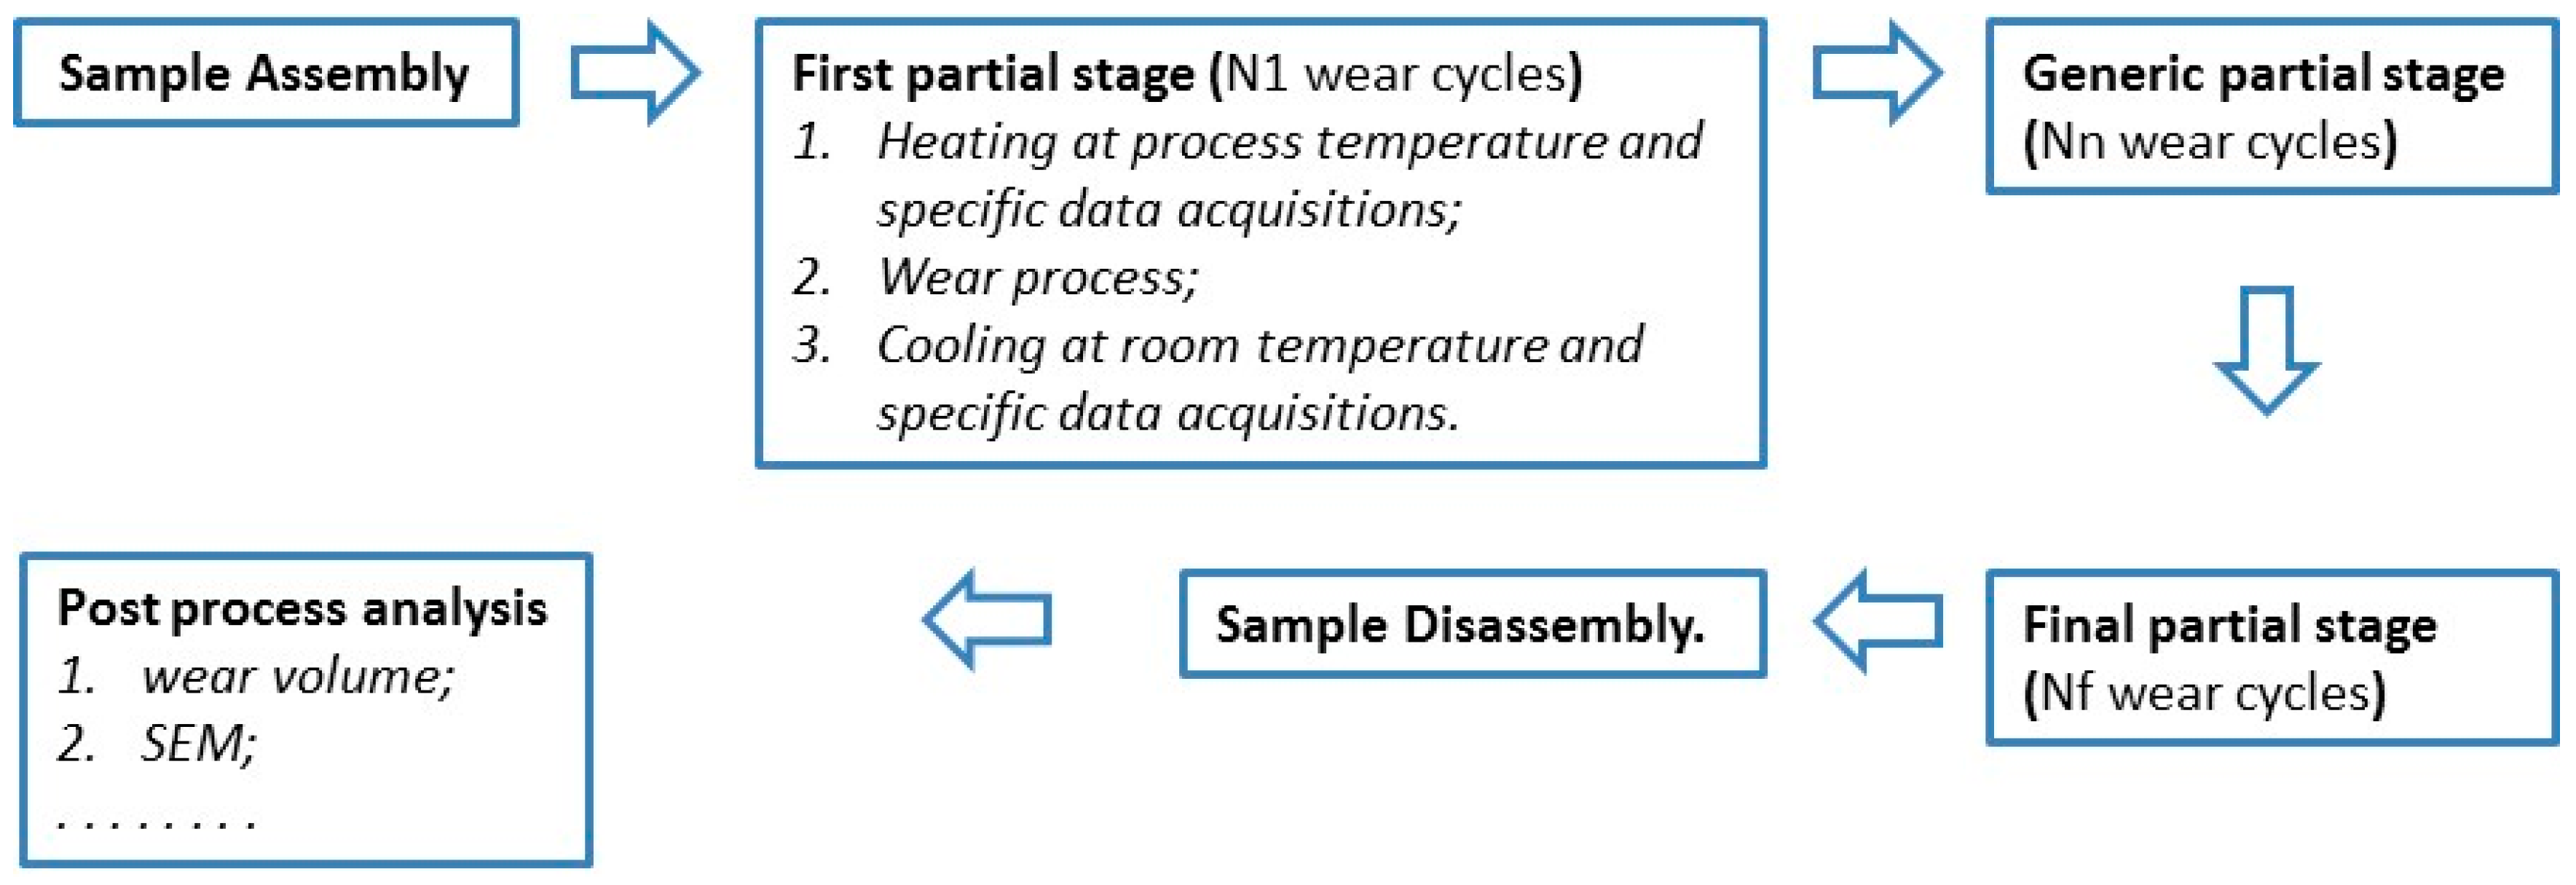
Due to the very long duration of each test, the test procedure (see Figure 3) was essentially a succession of partial stages. In this investigation, the duration of each partial stage was constant (N1 = Nn = Nf) and set to 2.5 × 10⁶ wear cycles. At the beginning or at the end of each partial stage specific data acquisitions were performed to measure hysteresis loops in different conditions with respect to the wear process, commonly other temperatures and sometimes other frequencies and strokes. These specific acquisitions usually need less than 0.1 × 10⁶ wear cycles. Consequently, they are negligible compared to the duration of a partial stage (2.5 × 10⁶ wear cycles). During each partial stage the hysteresis loop acquisitions were performed over 0.25 × 10⁶ cycles apart from the first and the last 0.25 × 10⁶ cycles of each stage. During the first and last step of 0.25 × 10⁶ cycles of each partial stage, the loop acquisitions were more frequent.
Through these acquisitions, the contact characterization is much more complete because, for each partial stage, it is possible to obtain the discrete values of contact parameters in different conditions from the wear process. For instance, for the René 80-04 test in Table 1, the process parameters were temperature 600 °C, stroke 60 µm, frequency 100 Hz, normal load 32 N, and 5 × 10⁶ wear cycles. In this case, specific acquisitions of hysteresis loops were performed at other temperatures, RT, 200, 400 °C and frequency, 10 and 100 Hz. Thus, the contact parameters were obtained as a function of temperature and frequency for different wear states (new, 2.5 × 10⁶, and 5 × 10⁶ wear cycles). At the end of the wear process, the samples were disassembled in order to perform the post process analysis. The evaluation of the wear volume is illustrated in the next section. For the SEM analysis, an ultrasonic polishing was performed using solution of ammonium citrate at 7% for 30 s. After the sample disassembly, the same pair cannot be reassembled to restart the wear process. The reason for this is that the test rig cannot return to the same groove. This capability is the main advantage of the test rig described [11].
2.3. Wear Volume Measurements
The wear volume was measured at the end of the wear process. As a consequence of the micro wear process, the volume lost is very small. In order to evaluate this small volume, the difference between the worn and unworn contact surfaces cannot be easily applied. The reason for this is that the error due to two different positions of the samples during the surface measurements might be of the same order of magnitude as the volume measured.
The methodology used to measure the wear volume was based on the following main steps:
- optical topographic measurements of the contact surfaces;
- selection of the points by topographic measurements of the contact surfaces useful for the subsequent computing;
- form removal;
- peak and hole volume measurements in the worn area;
- peak and hole volume evaluation in the worn area before the wear process;
- computing of the wear volume for one sample;
- computing of the wear volume for the pair of samples.
For the first step, the measurements were performed with focus variation technology using an alicona infinite focus instrument.
The second step was the selection of the points necessary to define the worn and unworn contact surfaces. Points external to the contact surfaces or non-representative parts of these surfaces are usually acquired during the topographic measurements. These unuseful surface measurements are excluded from the initial topographic optical measurements.
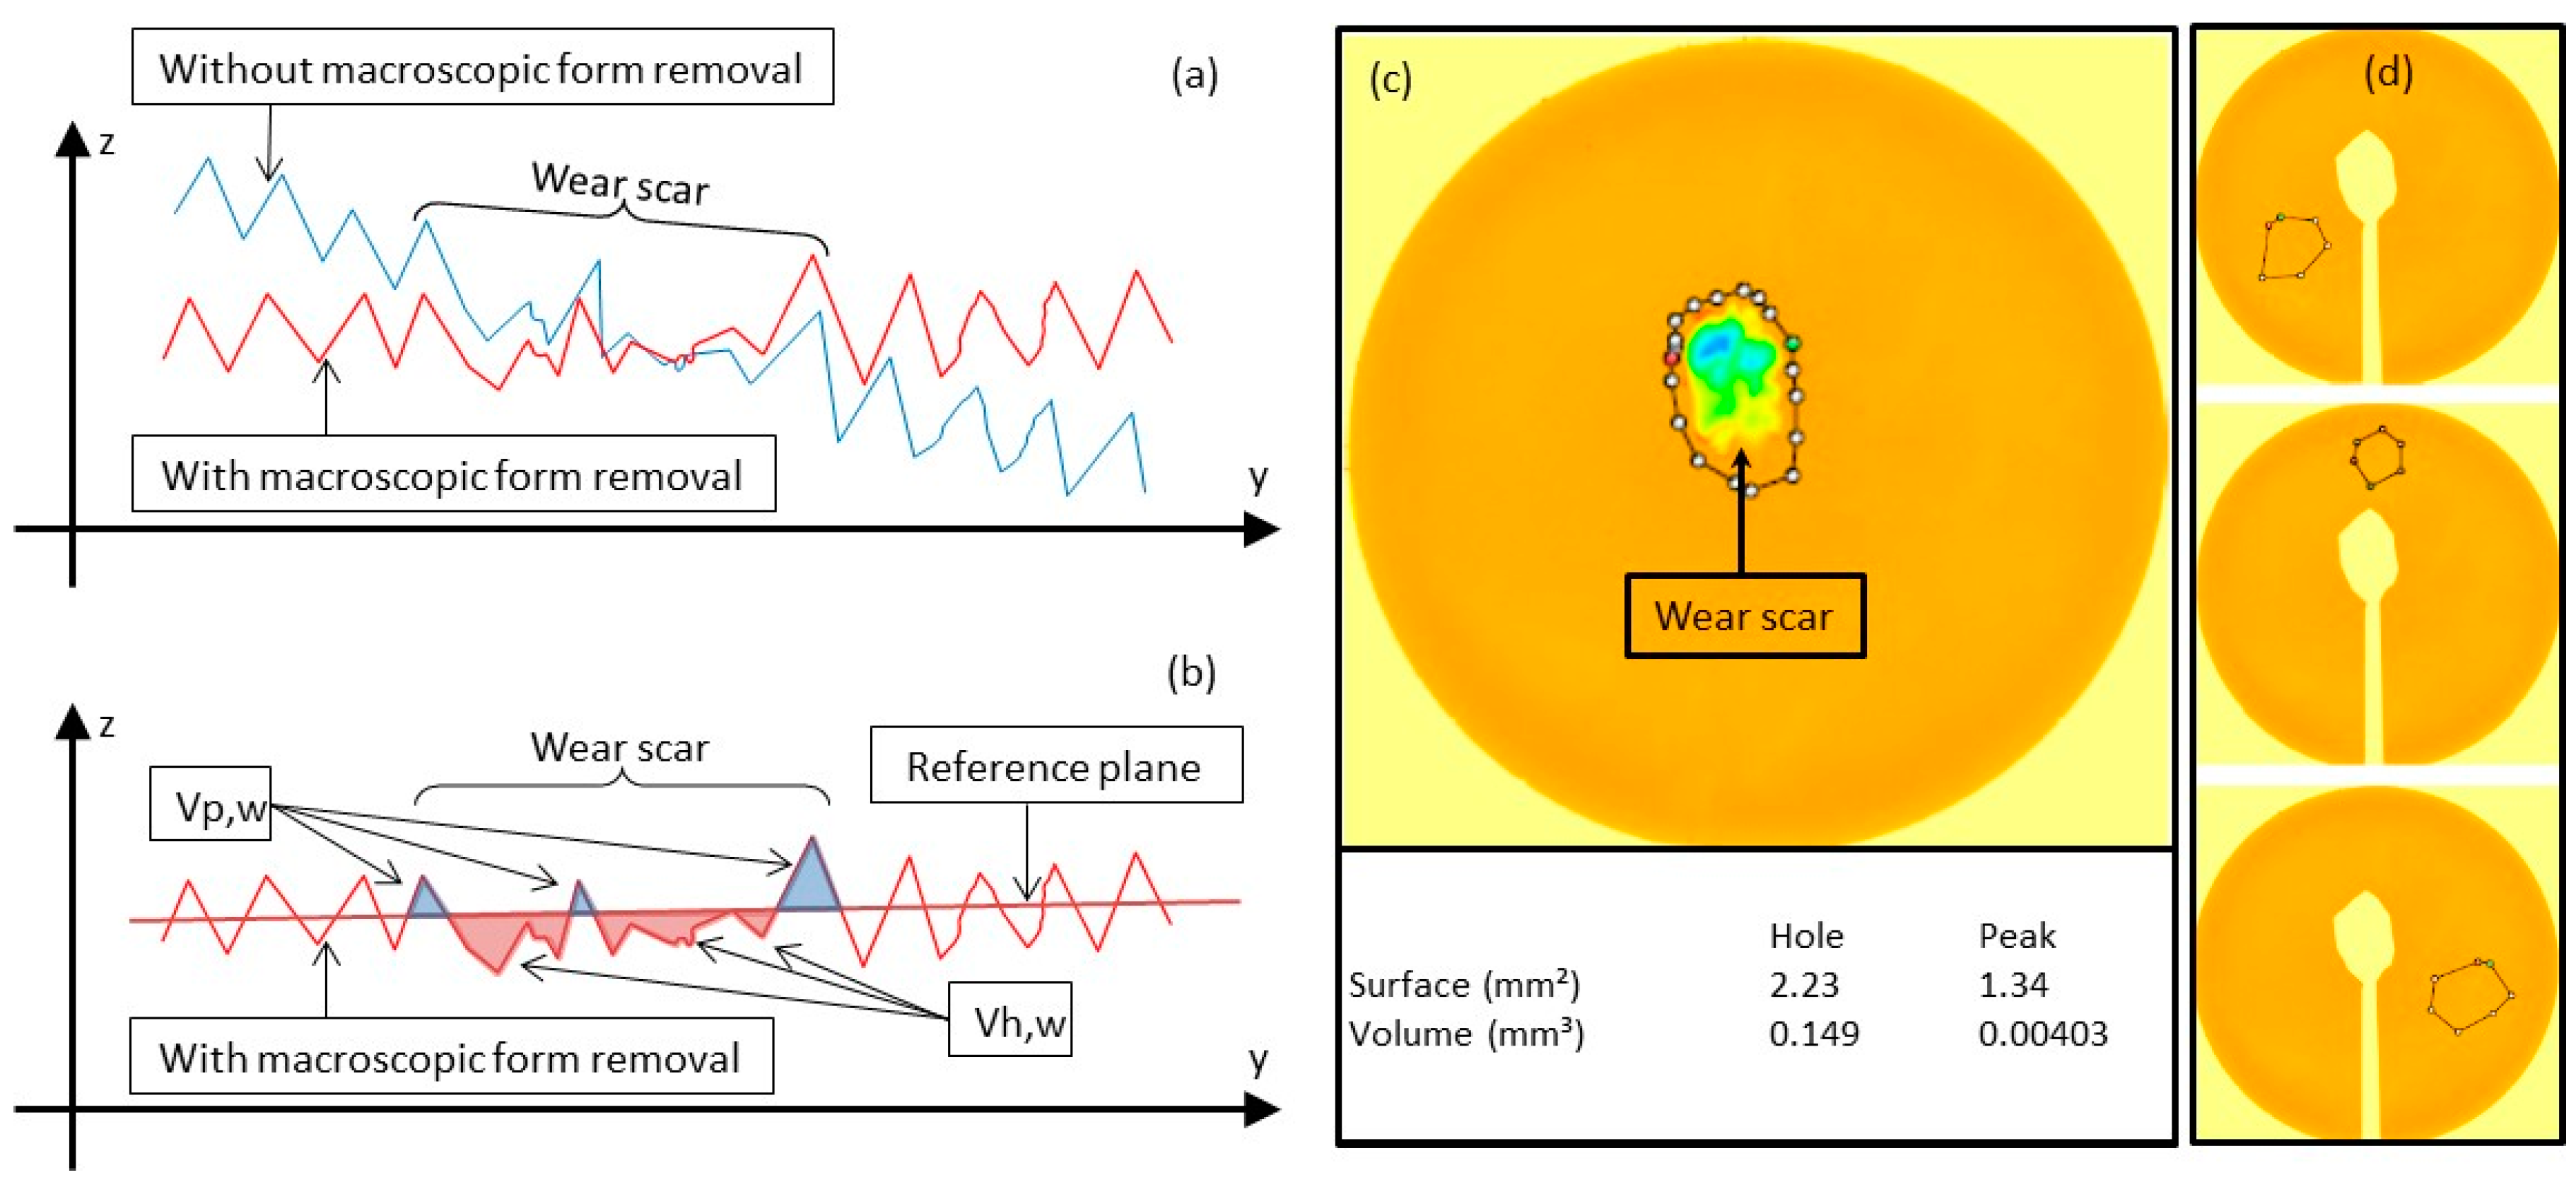
At the third step, a smooth macroscopic form was removed in order to obtain a flat macroscopic form of the contact surface (see Figure 4a). The removed form can have a spherical, polynomial or other type of surface, in this case, it was a polynomial function of degree 4 obtained by interpolation of all the unworn points. In other words, the removed form was interpolated using all the points of the contact surface outside the wear scar.
At the fourth step, some characteristic volumes of the wear scar were measured. The volume of the peaks (Vp,w) is the sum of all the volumes above the reference plane delimited by this plane and by the contact surfaces (see Figure 4b). Analogously, the hole volume (Vh,w) is the sum of all the volumes below the reference plane delimited by this plane and by the contact surfaces (see Figure 4b). The reference plane was obtained by interpolation of the overall unworn points of the contact surface outside the wear scar (see Figure 4c).
At the fifth step the peak (Vp,i) and hole (Vh,i) initial volumes were evaluated, both before the wear process and where the wear scar occurs. This initial condition is important because in micro wear processes the groove could be just a small variation of the profile of the surface asperity. Obviously when the wear is important, i.e., the depth of the groove is much greater than the surface asperity, the initial peak and hole volume can be ignored. This measurement is made in two different ways, depending on the availability of the contact surfaces measurements before the wear process. If this is available, the initial peak and hole volumes are evaluated by a volume measurement that selects the area of the wear scar in unworn condition. When the contact surface measurements before the wear process are not available, the initial peak and hole volumes in the worn area are estimated using other zones of the potential contact surfaces. Other zones are appropriate if there was no contact and the roughness can be supposed to be the same of the worn area in an unworn condition. In this study, the contact surface measurements before the wear process were not available. In order to estimate the initial peak and hole volume, the worn area was cut from the surface measurements after the wear process and peak and hole measurements were acquired in three different appropriate zones machined in same way as the worn zone (see Figure 4d). These three zones were used to calculate an average value of peak and hole volumes in unworn conditions. However obtained, initial peak (Vp,i) and hole (Vh,i) volumes measurements need to be normalized to the real wear scar surface, where:
- (Vp,a, Vh,a) are the average value of the peak and hole initial volumes measured in the appropriate zones or in the approximate position where the wear scar will occur;
- (Sp,a, Sh,a) are the surfaces of the peak and hole relative to the volumes (Vp,a, Vh,a);
- (Sp,w, Sh,w) are the surfaces of the peak and hole relative to the volumes (Vp,w, Vh,w).
Then, the peak and hole initial volumes in the real position, where the wear scar will occur, can be estimated by the following normalization of the measurements in the approximate positions:
The sixth step, regarding the volume lost during the wear process from one sample (Vw), was computed as follows:
In other words, there is a loss of volume if the peak volume decreases and the hole volume increases with respect to their initial value. Equation (3) implicitly introduces the convention that the volumes are positive if lost while they are negative if they increase.
For the seventh step, the volume loss during the wear process from the pair of samples (Vw,c) is computed as follows:
where (Vw,1, Vw,2) are the lost volume of the two samples.
3. Results and Discussion
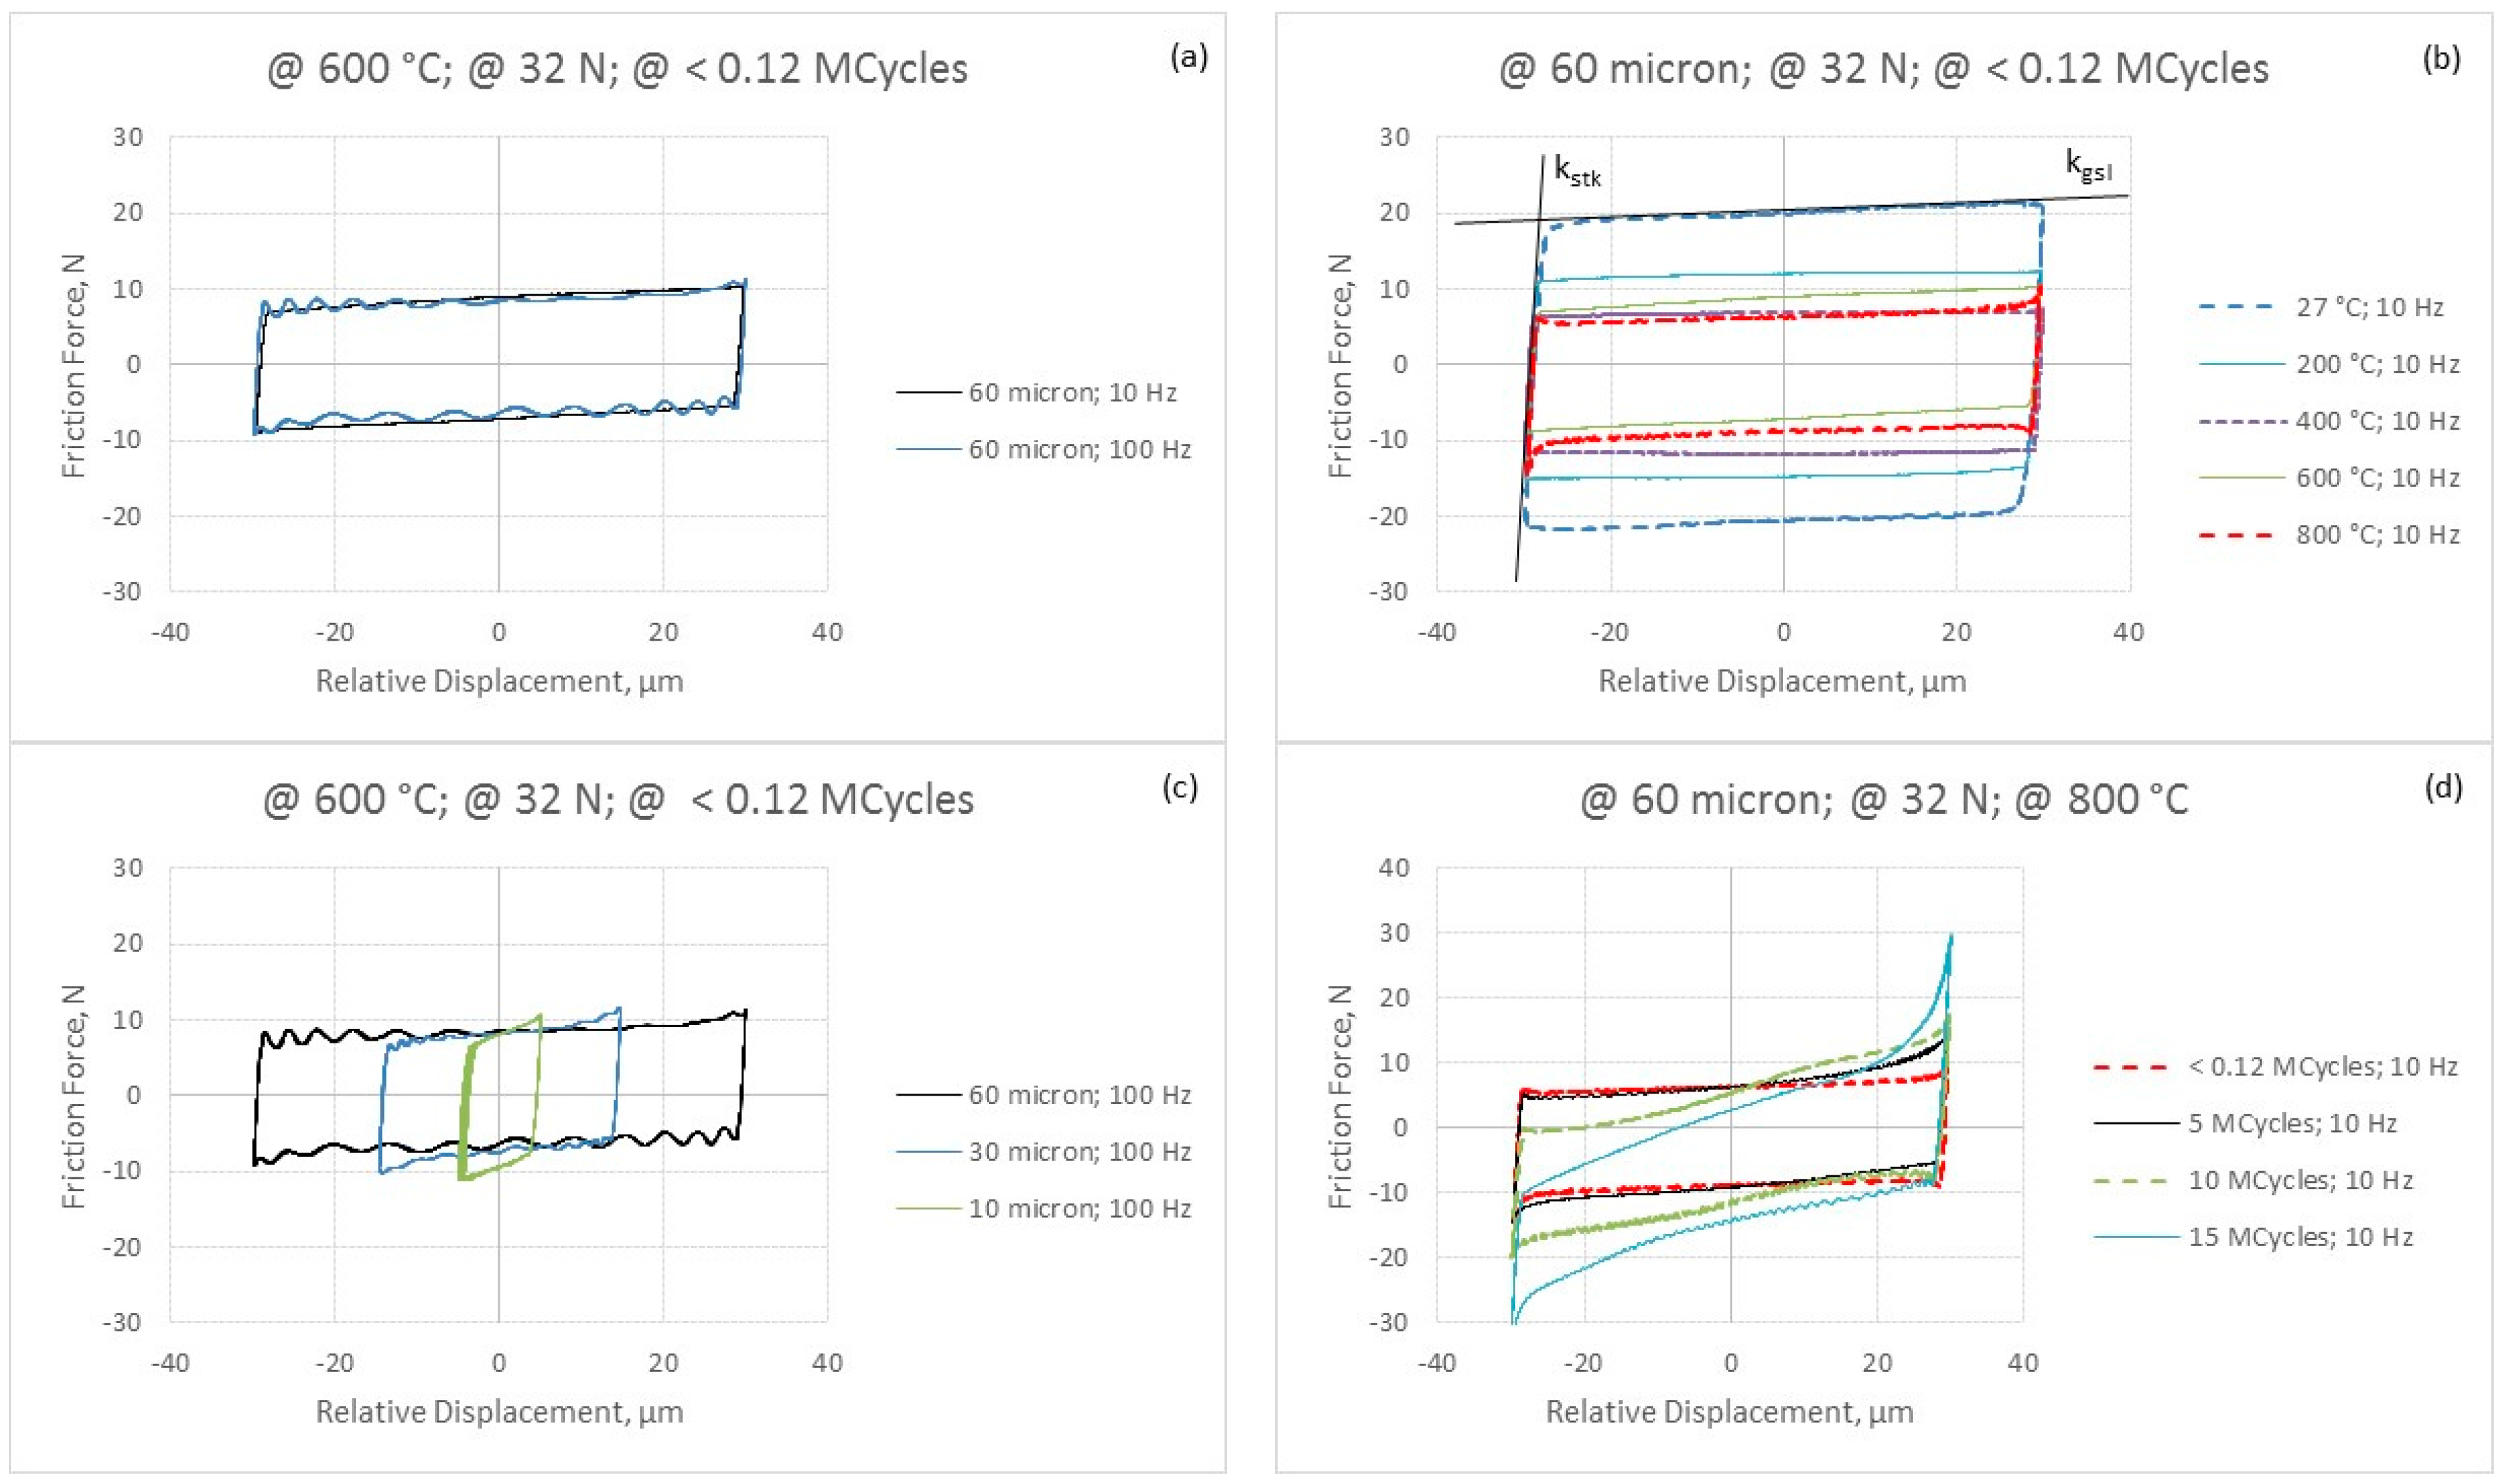
The direct outputs obtained by the test rig are relative displacements, tangential force, and the temperature of the mating surfaces at a predefined frequency and normal load. This means that the hysteresis loops are the first results obtained, they are shown directly by the control system during the entire process and some of them are stored for further elaboration. A description of the typical main phases of the hysteresis loops (stick-transition-slip-sliding inversion-stick…) can be found in [11]. Loops acquired during test 07 (see Table 1) for different process parameters are reported in Figure 5. An increasing frequency (Figure 5a) causes oscillation of the friction force in the gross slip stage of the loops. This inertial dynamical effect seems to be due to obstacles to the sliding motion. With regard to the temperature, if it increases from room temperature to 800 °C, the area of loops decreases, (see Figure 5b). The decrease in the area at low temperatures (RT–200 °C) is faster than at high ones (600–800 °C). This means that the contact surfaces dissipate more energy at low temperature. Moreover, in the same Figure 5b the straight lines “kstk” and “kgsl” are used to describe the curve linearization during the stick and gross slip stages. The slopes of these straight lines are the tangential contact stiffness for the stick and gross slip stages, respectively. Figure 5c shows the dependency of the hysteresis loops on the displacement amplitude in a gross slip regime. These loops show a substantial similarity, consequently the energy dissipated changes regularly as a function of the stroke. The evolution of the hysteresis loops at different wear states is shown in Figure 5d. Due to the wear, the loops exhibit initially (new-5 Mc) a nonlinear strain hardening near the inversion motion point (approximatively 30 µm, 15 N and −30 µm, −15 N in loop at 5 Mc). This nonlinear effect is a direct consequence of the wear groove. As a consequence of the groove nucleation and growth a groove edge was also generated that became an obstacle to the sliding motion, as reported in [10]. In addition to the groove edge effect, there was also a progressive increase of the slope of the gross slip stage of the loops as a consequence of the increasing wear. In [12], these strain-hardening effects are associated to the normal displacements generated by the wear scar.
The area of hysteresis loops is the energy dissipated by the relative wear cycles (EL):
The cumulated energy loss () is the sum of the energy dissipated for each wear cycle, formally:
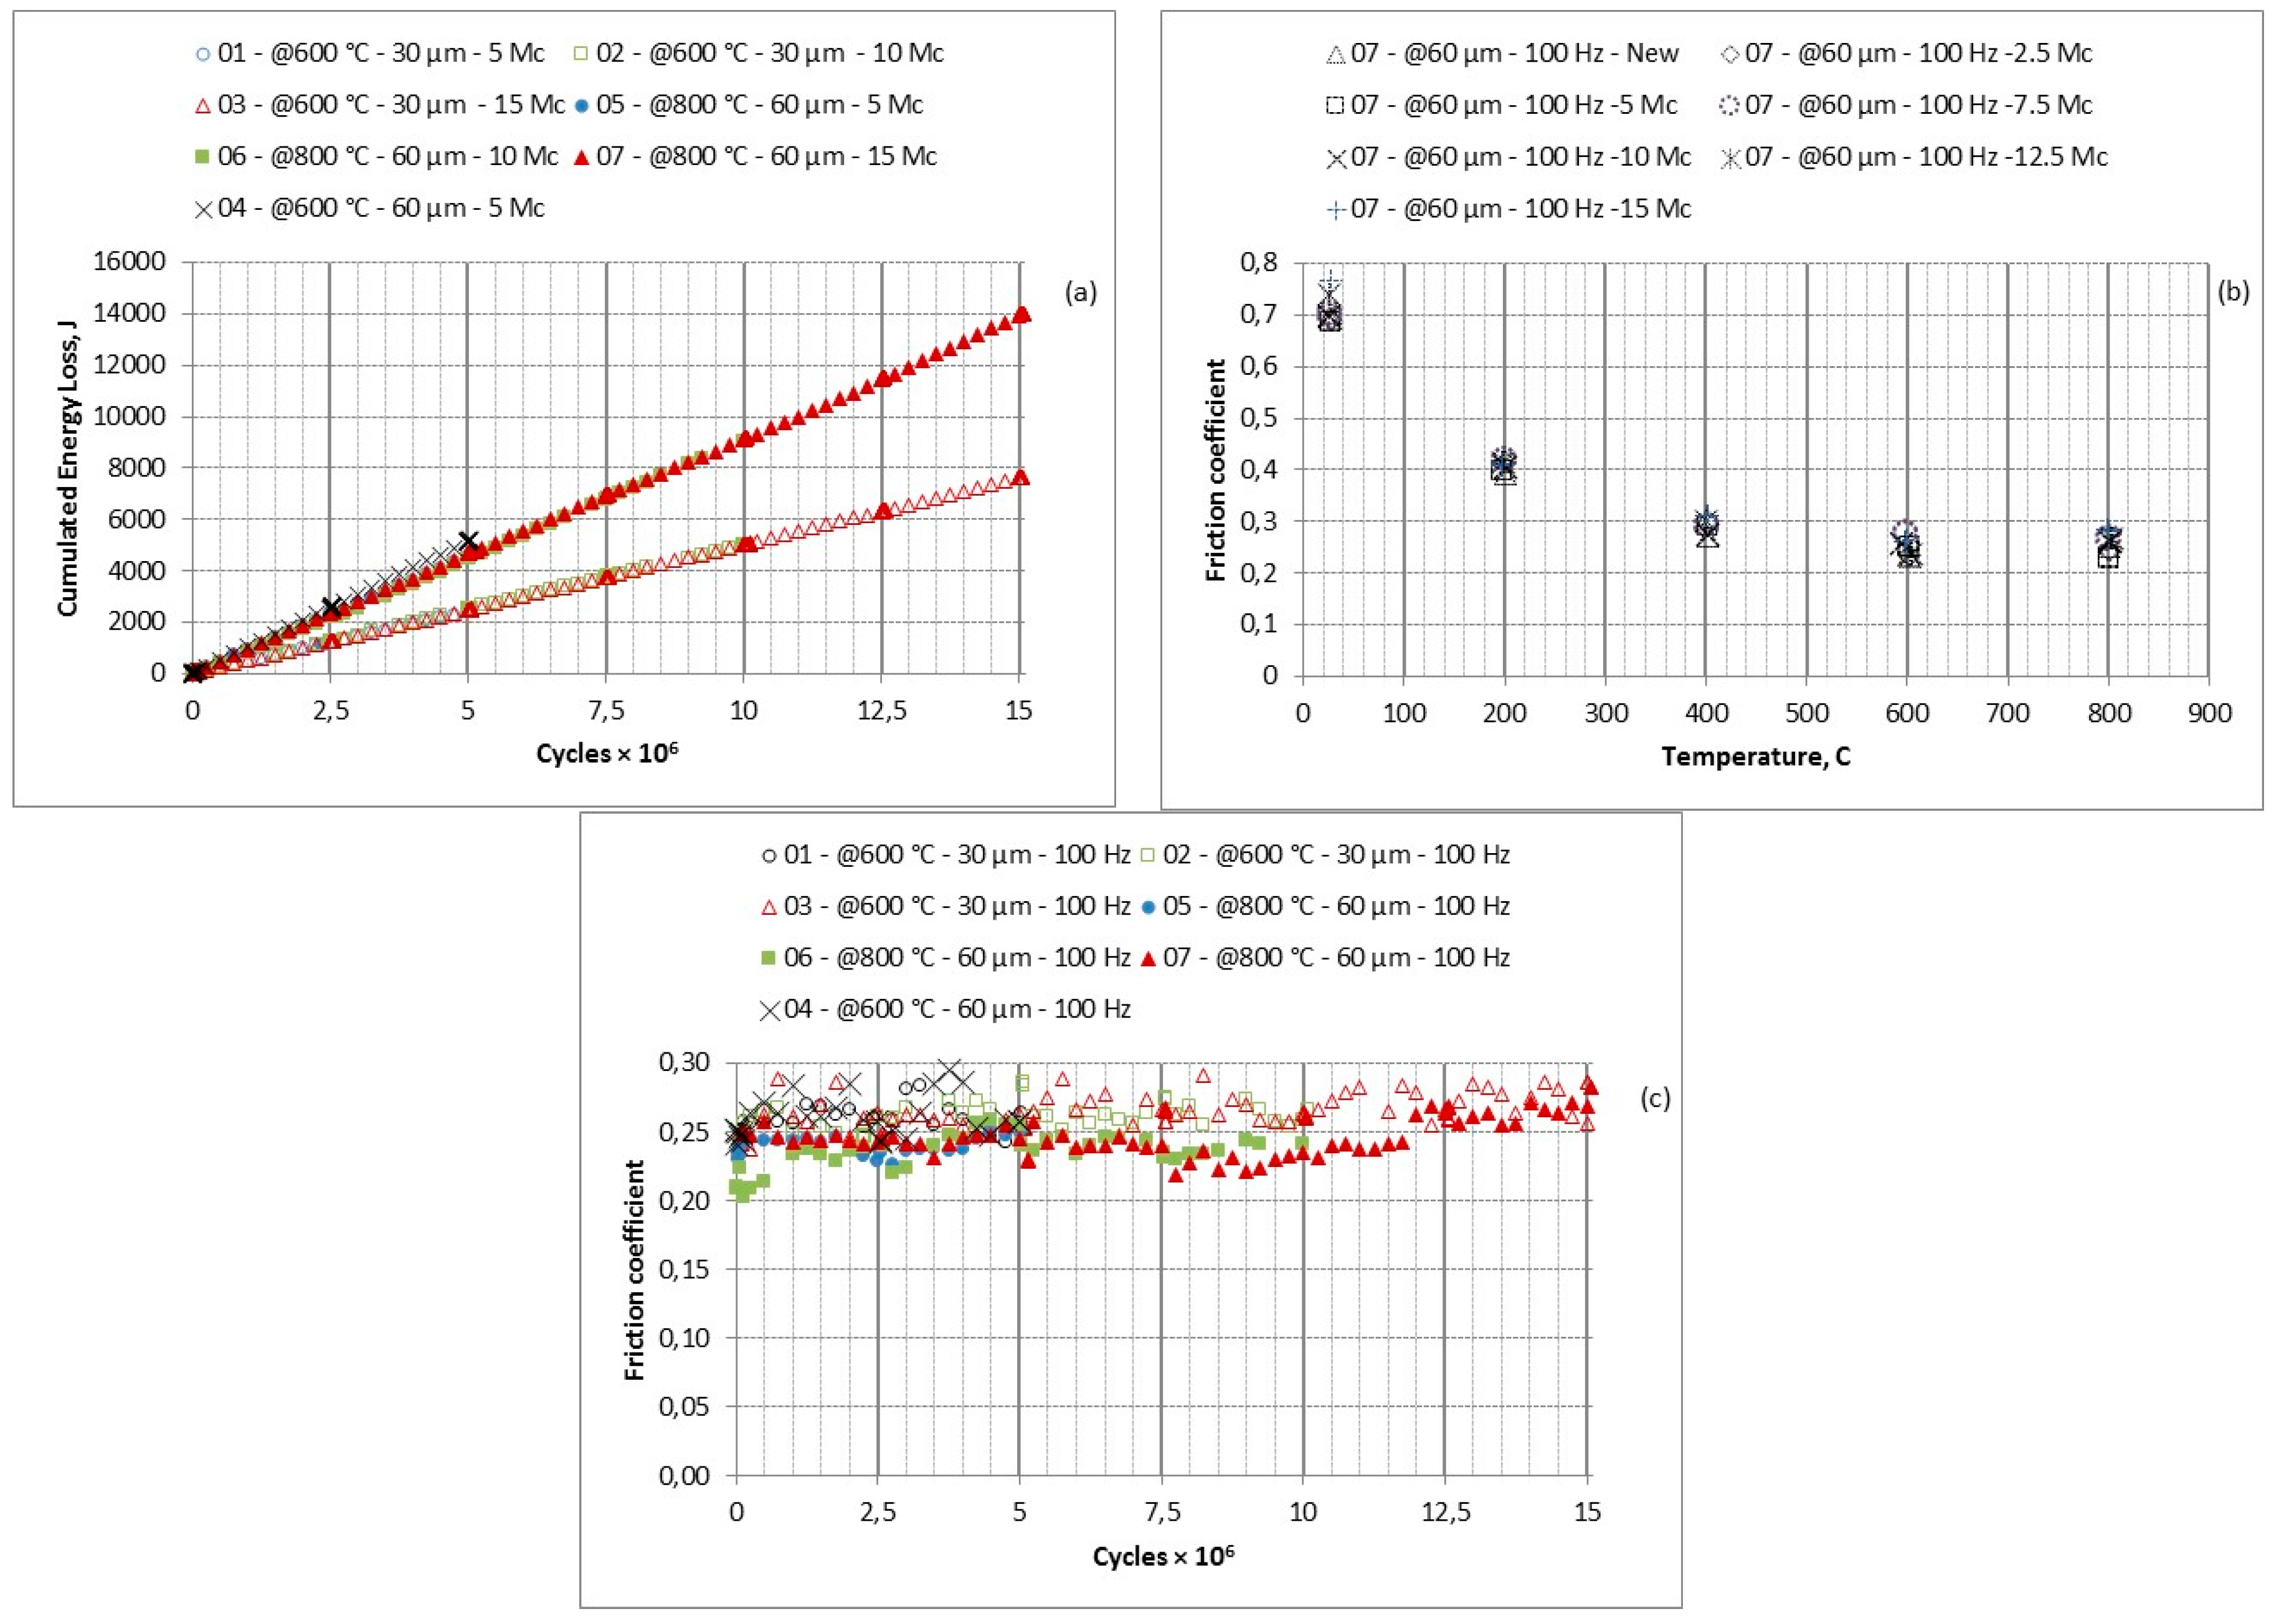
where Fu is the tangential contact force, u is the relative displacement of the contact surfaces and N is the number of wear cycles. The cumulate energy dissipate during all tests are illustrated in Figure 6a. These energy measurements were obtained using the Equation (5) on the hysteresis loops acquired during specific wear cycles. Between two subsequent loop acquisitions the dissipated energy for each wear cycle was assumed constant. The loop acquisitions were performed during each 0.25 × 10⁶ cycles but not during the first and the last step (of 0.25 × 10⁶ cycles) of each partial wear stage of 2.5 × 10⁶ cycles. During the beginning and end of a wear stage the acquisitions were more frequent.
In Figure 6a it is evident that the difference of energy dissipated during the fretting processes in these two operating conditions can essentially be attributed to the difference of strokes. This is illustrated by the difference in slope between the curves of pairs 01, 02, 03 compared to pair 04 which is much lower than the difference of slope between the curves of 01, 02, 03 compared to 05, 06, 07. However, the energy dissipated by the fretting processes at 600 °C is slightly greater than at 800 °C. This can be seen in Figure 6a by comparing the difference of slopes between the energy of pair 04 with pairs 01, 02, 03.
The friction coefficient (μ) is the ratio between the tangential contact force in the macroslip phase and the normal load applied to the contact surface. Considering that the hysteresis loops are measured with a constant normal load, the friction coefficient can also be calculated from the hysteresis loop. When the contact behaviour is analogous to the description of Coulomb/Amontons, i.e., the tangential contact force is constant during the macro-slip phase, it is only necessary to calculate the ratio between this force and the normal load used. However, not all contact surface behaviours are characterized by a constant tangential contact force during the macro-slip phase, see Figure 5d. In this case, the friction coefficient can be calculated by the average value of the tangential contact force directly in the ratio with the normal force. In other cases, for example when the tangential force is not constant and it is difficult to identify the friction force, or when a friction constant coefficient is needed which dissipates the same energy of the real hysteresis loop, the following formula based on energy loss can be used:
where EL, Fn and Δu are the energy loss during one hysteresis loop, the normal force and the displacement amplitude respectively.
The friction coefficient, obtained using Equation (7), as a function of the temperature at different wear states for pair 07 is reported in Figure 6b. Each reported value of the friction coefficient is an average value of different subsequential hysteresis loops (24 loops at 100 Hz). The trend of the friction coefficient shows a minimum at 600–800 °C, consequently the energy dissipated by the contact interfaces has a minimum. This means that the damping capability of contact surfaces is minimum but the volume loss will also be a minimum as a consequence of the fretting process. It is well known that the wear volume increases if the energy dissipated by the surfaces increases. Figure 6c illustrates the friction coefficient as a function of the number of wear cycles of all tested pairs at 100 Hz. The trend of measurements shows that, at 600 °C, the friction coefficient is slightly higher than at 800 °C from the beginning to 12.5 × 10⁶ wear cycles, while this difference seems less evident from 12.5 × 10⁶ to 15 × 106 wear cycles. One possible reason for this trend is that the increasing of the friction coefficient due to wear groove increment dissolves the difference of friction coefficients due to the different temperatures.
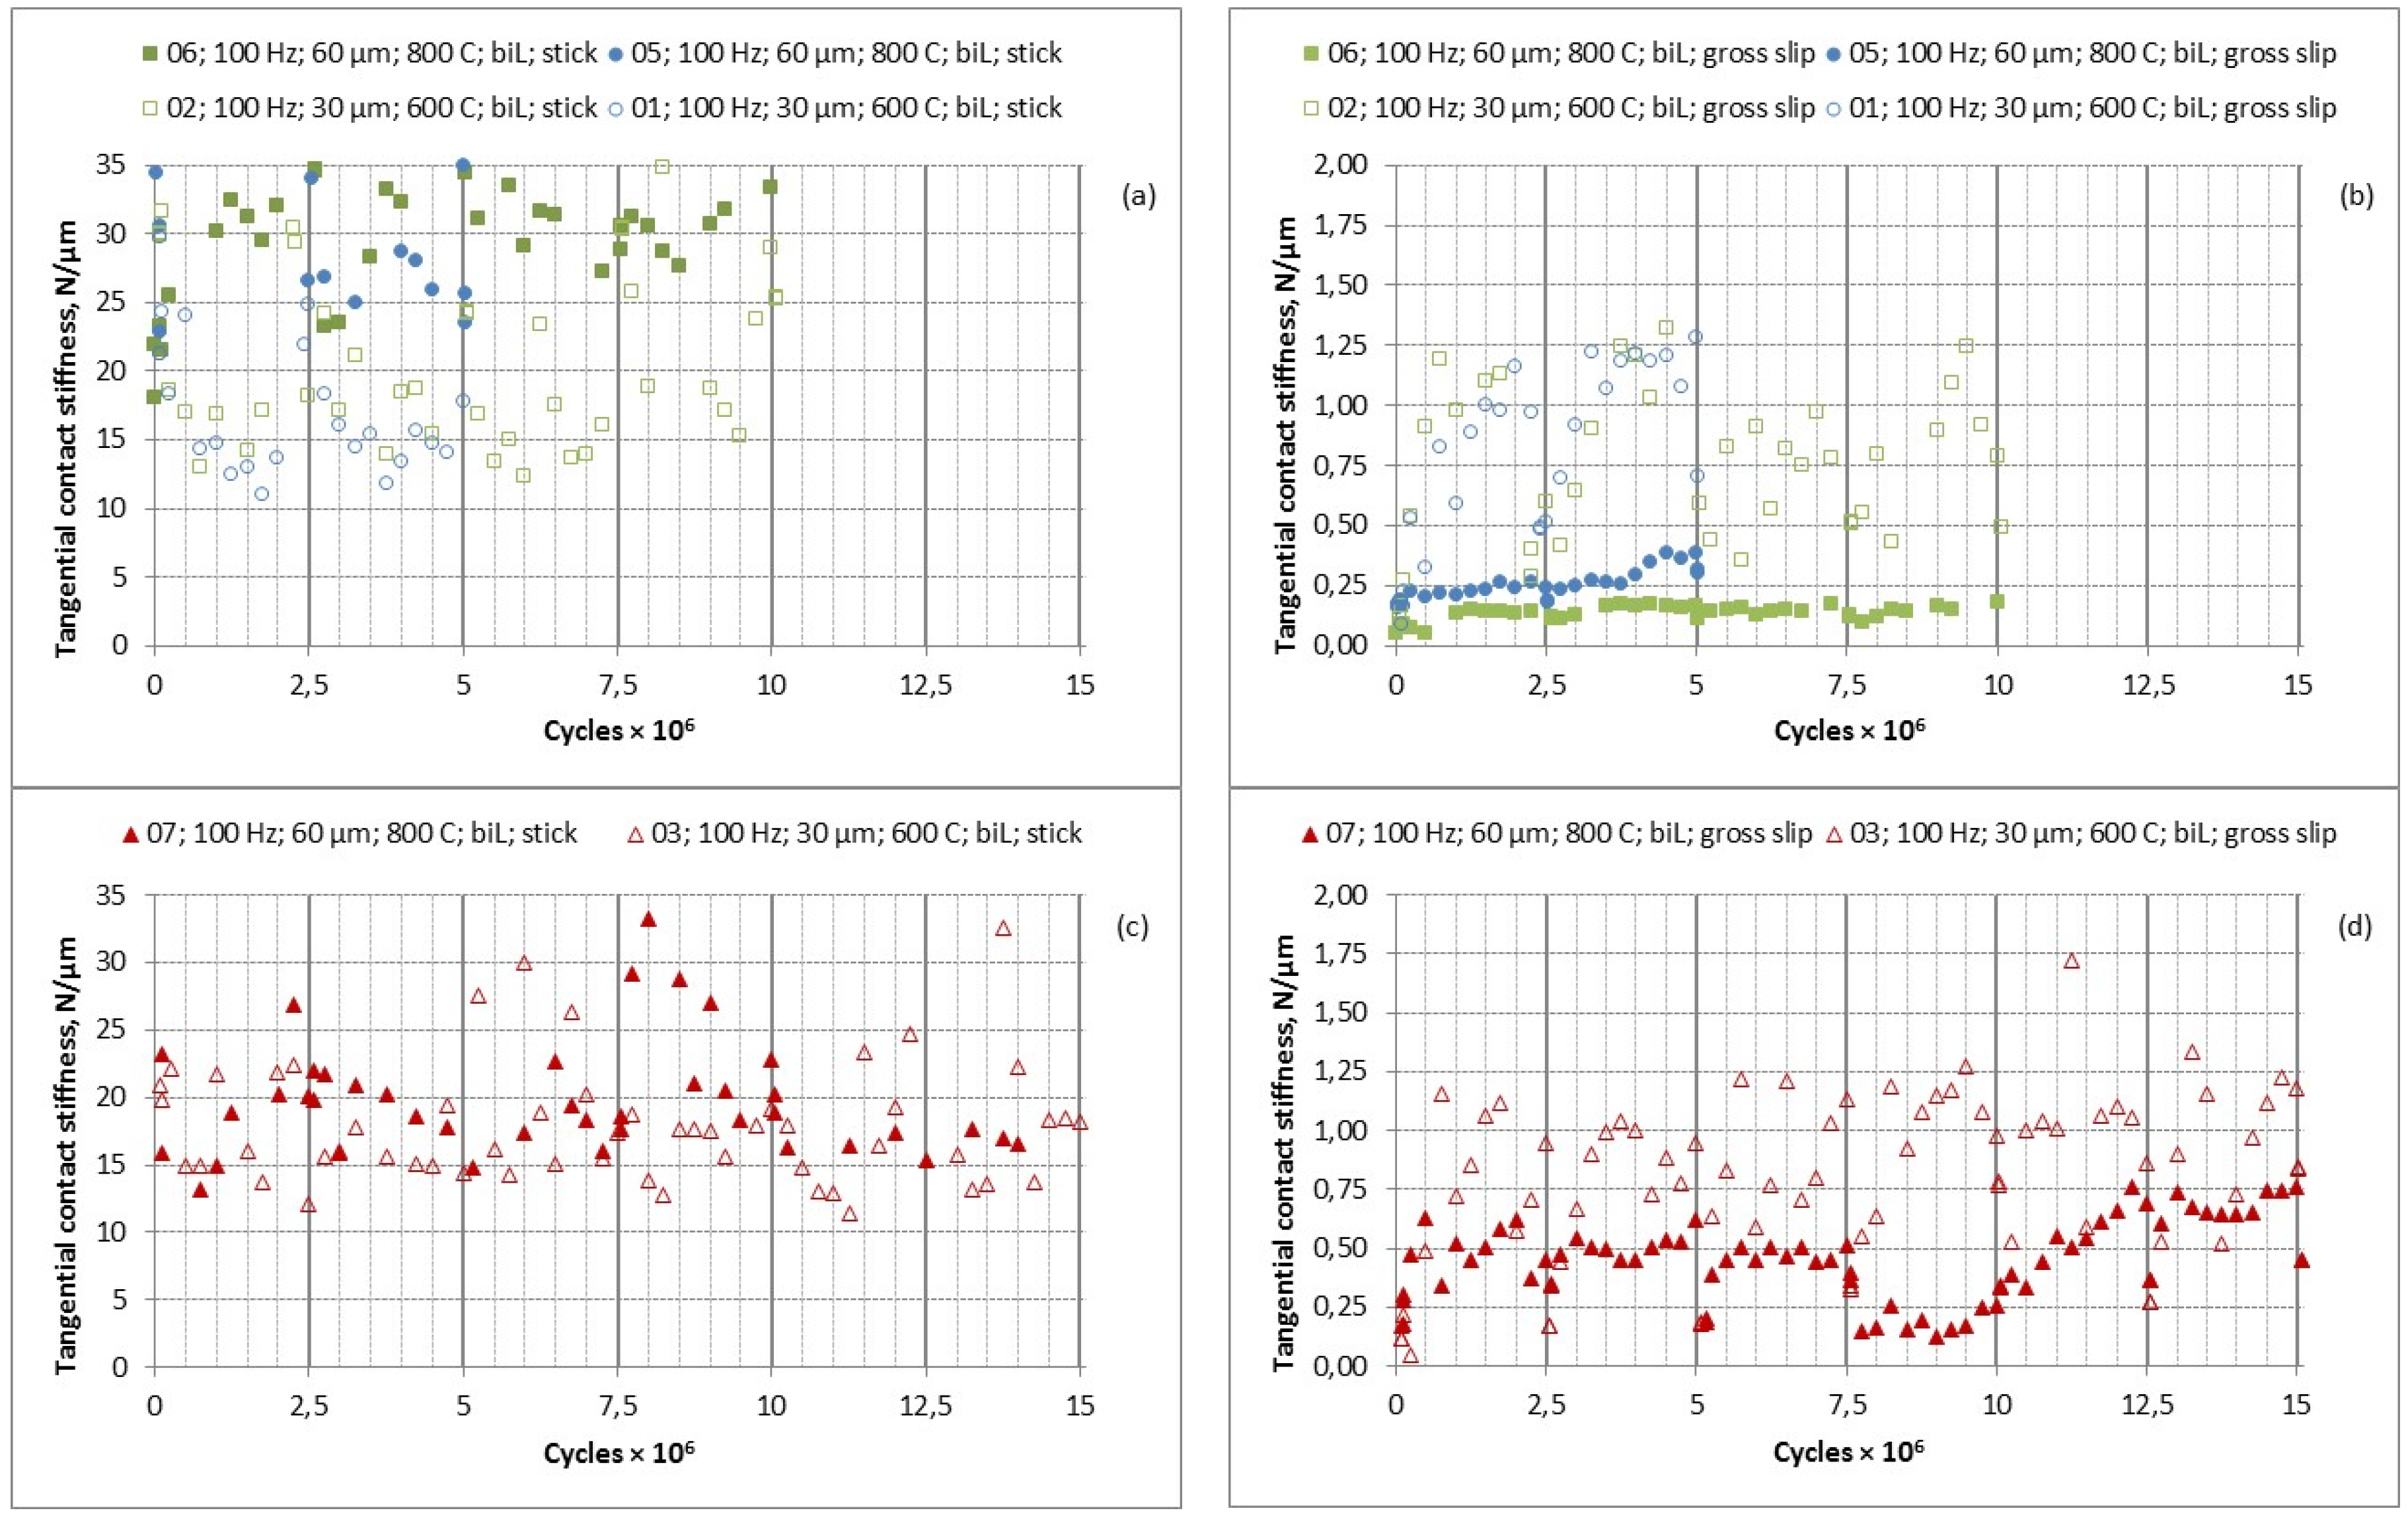
The hysteresis loops can be described from two straight lines (“kstk” and “kgsl” Figure 5b). The slopes of these straight lines represent contact stiffness during the stick and gross slip stages, Figure 7 reports the contact stiffness obtained by linear interpolations of hysteresis loops acquired at different stages of the wear process. From a general point of view, it is immediately evident that the contact stiffness is much more variable than the friction coefficient. Analogously to the friction coefficient, each value of contact stiffness is an average value of different subsequential hysteresis loops (24 loops at 100 Hz) but the standard deviation is higher. Figure 7 shows that the contact stiffness in the stick stage at 800 °C is higher than at 600 °C. This trend is clearer for the pairs 01, 02, 05, 06 Figure 7a than for the pairs 03, 07 Figure 7a. This result is in contrast with the well-known model [13] where the contact stiffness (KT) is correlated with the modulus of elasticity (E) from a relation like:
Consequently, if the temperature increases, the modulus of elasticity decreases and the tangential contact stiffness in the stick stage should be decreased. The model is not appropriate to describe real contact because it was developed assuming smooth contact surfaces. Taking into account the surface asperity, the contact occurs on a grid of points.
This means that, when the temperature increases, the real contact surfaces increase. An explanation for this is that, if the temperature increases, the ductility also increases and this means that both, the contact area associated to each asperity and the total number of surface asperities increase. Obviously, this effect ends when the decrease of the modulus of elasticity no longer compensates for the increase of real contact surface. More details concerning the increase of the tangential contact stiffness in the stick stage as a consequence of the reduction of Young’s modulus can be found in [14]. Figure 7b,d illustrate that the trend of the contact stiffness in the gross slip stage is the contrary of the trend in the stick stage. At 800 °C, the contact stiffness is lower than at 600 °C.
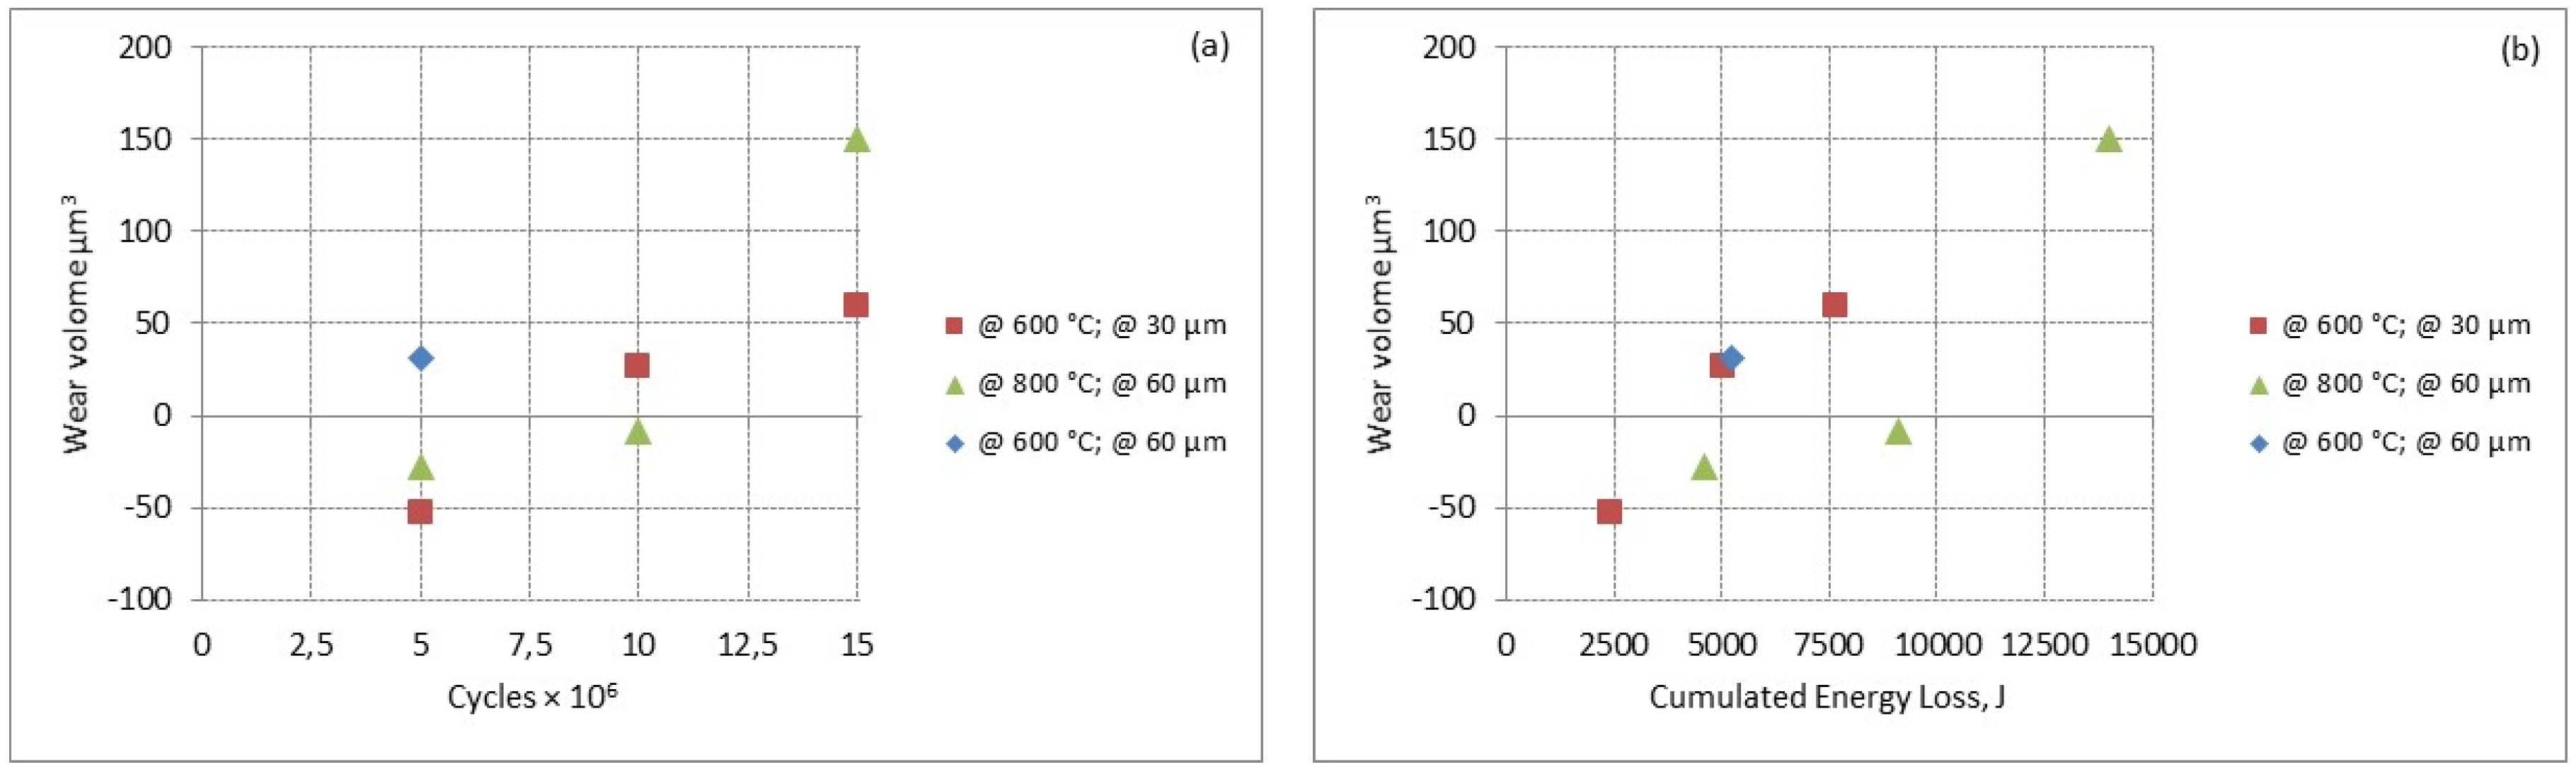
Figure 8 shows the wear volumes as a function of wear cycles (Figure 8a) and cumulated energy loss (Figure 8b). It is immediately visible that the wear volume produced at 5 × 10⁶ wear cycles from the process at 60 µm and 600 °C was about the same as the wear volume produced at 10 × 106 wear cycles from the process at 30 µm and 600 °C. The reason was that the energy dissipated by the contact surfaces in both cases was essentially the same (Figure 6a and Figure 8b). This finding confirms the well-known relation between wear volumes and the energy dissipated by contact surfaces. Moreover, it also confirm the good repeatability of this wear tests because at the same dissipated energy was measured a very similar wear volume. In regard to both evolutions as a function of wear cycles and cumulated energy loss, the measured wear volume was initially negative while it became positive at 10 × 106 wear cycles at 600 °C or 15 × 106 wear cycles at 800 °C. In other words, the measurements indicate that, initially, there were volume growths (negative values) while subsequently there were volume losses (positive value).
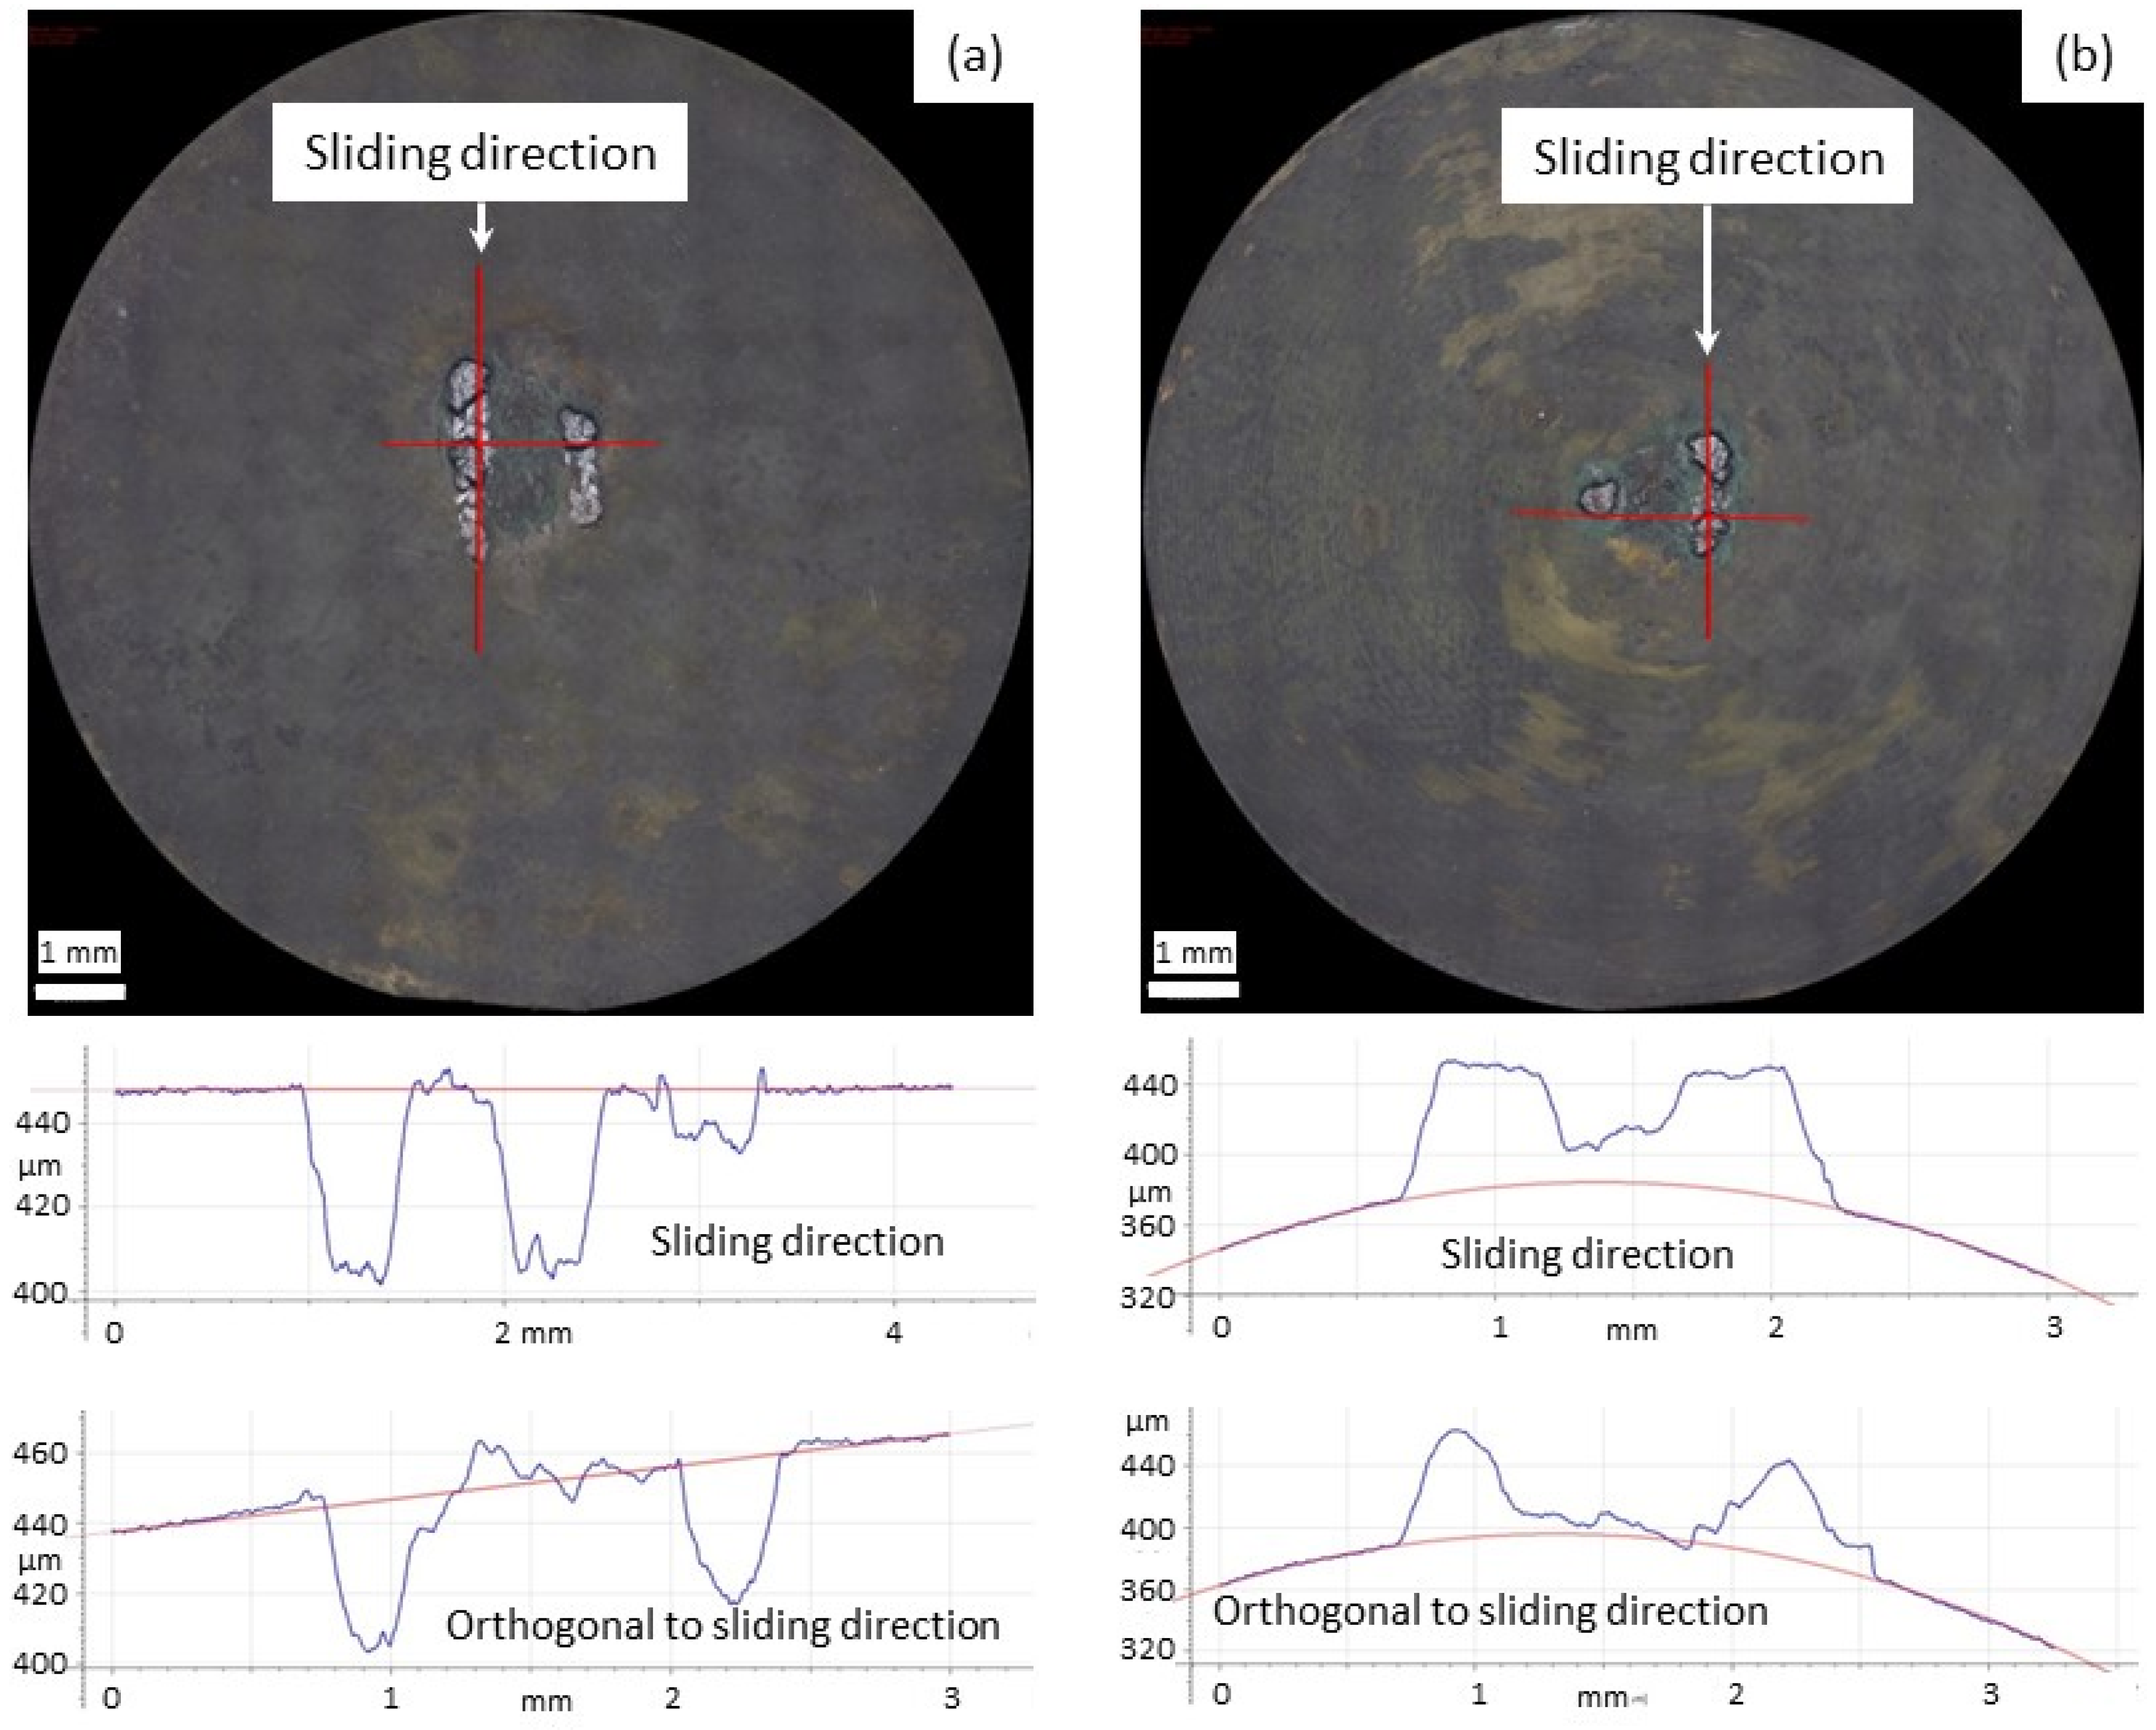
Figure 9 illustrates the wear groove of the pair 05 for the flat (Figure 9a) and spherical (Figure 9b) samples.
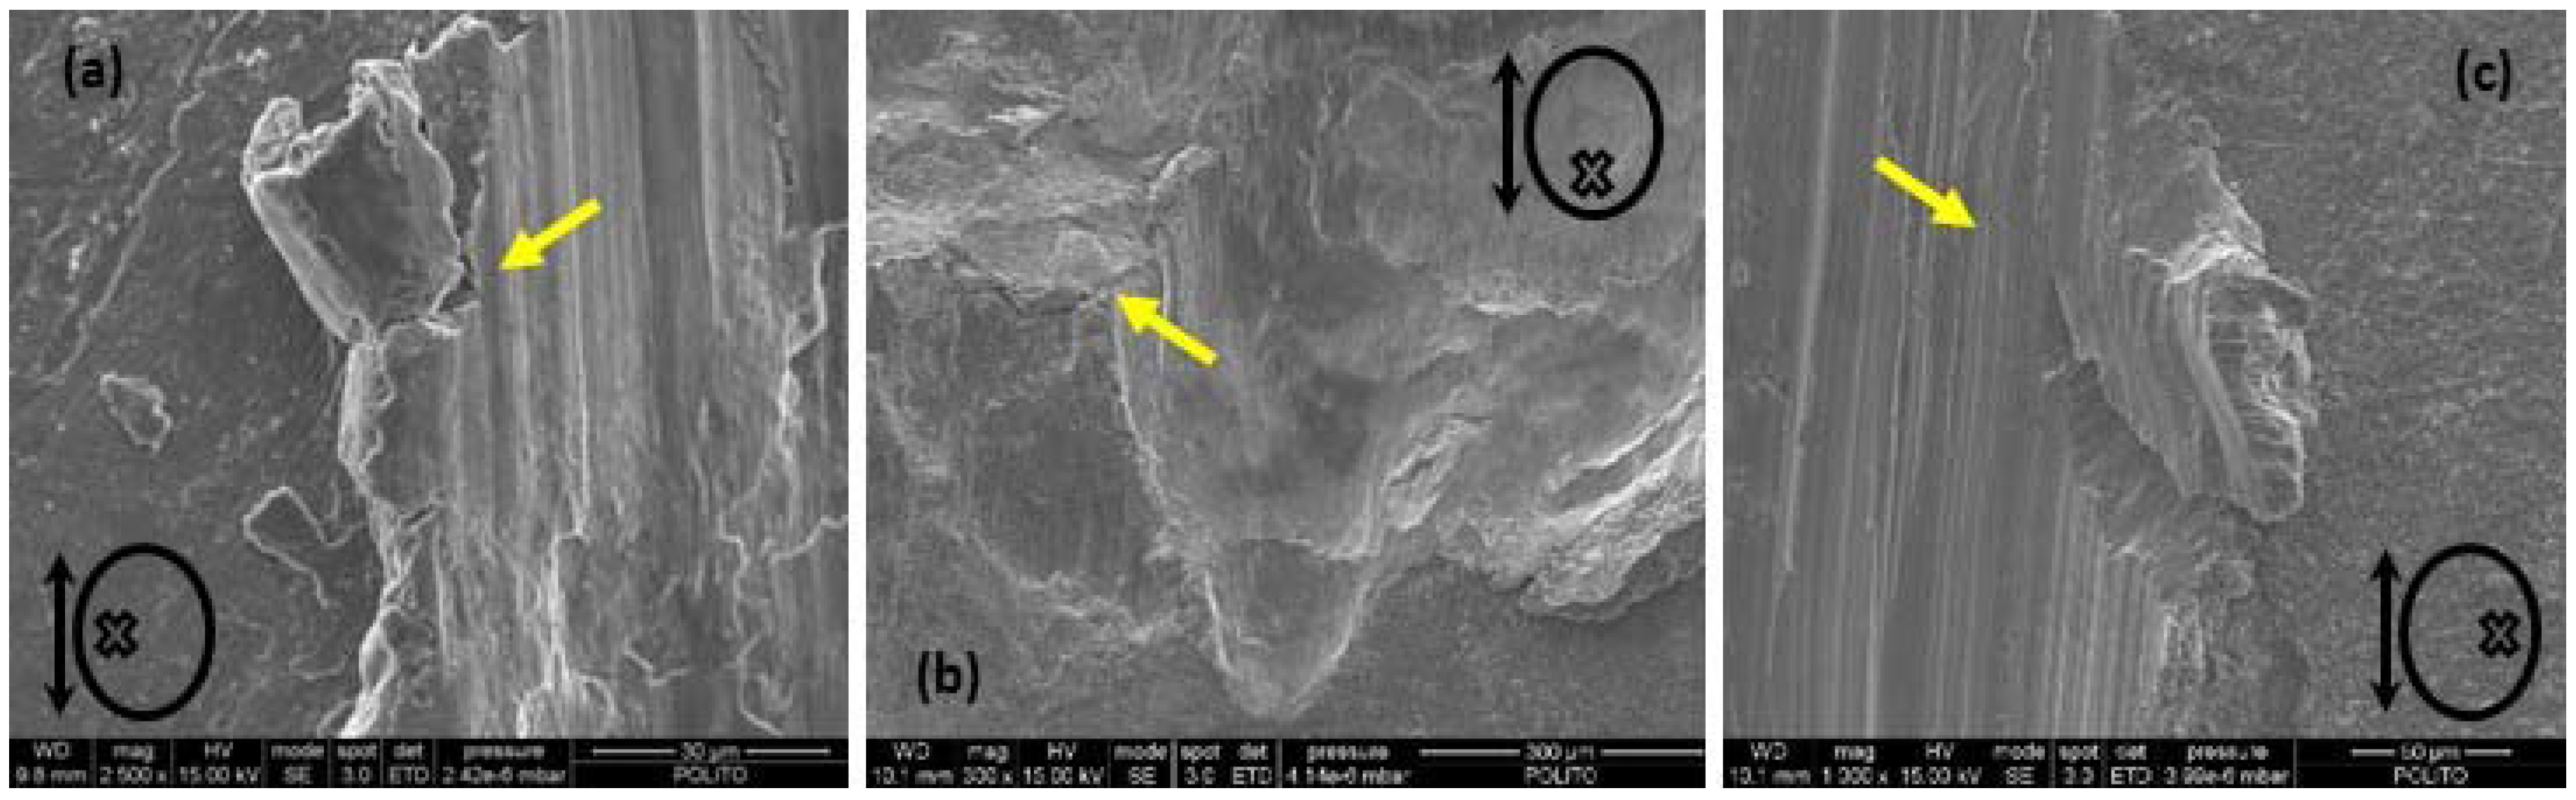
In Figure 9, the profiles measured on the straight lines red are also reported. These profiles are measured in the sliding direction and in the direction orthogonal to this. The red line reported in the diagram indicates the unworn profile. The comparison of profiles shows that the volume growth is essentially concentrated on the spherical sample. Pairs 01 and 06 show an analogous volume growth distribution. The volume growth on the contact surfaces can be explained by the oxidation process that occur in debris at high temperature. Due to the alternating motion of the mating surfaces, a wear mechanism of abrasion is expected during the gross slip stage. On the contrary, at the inversion motion points a wear mechanism of adhesion is expected as a consequence of the stick stage. Thus, the debris generated from the abrasion process cannot be expelled. This is due to the fact that the sliding amplitude is much lower than the characteristic contact length. Consequently, debris were oxidised and welded on the mating surfaces. As a consequence, a debris accumulation can be started anywhere on the contact surfaces. This originates a growth of material that locally further increases the wear rate which leads to a further increase in debris accumulation. The wear damage illustrated in Figure 9 can be produced by three main points of debris accumulation. High temperatures and small dimensions of debris (essentially powders of very small dimension) favour this process. Due to the brittle behaviour of oxides, they cannot have an unlimited growth and fractures and consequent breakaway of the oxides’ agglomerate will occur. Figure 10 illustrates examples of brittle fracture of oxide accumulation with inchoate breakaway of oxides agglomerate. In this figure, the double arrow indicates the sliding direction, while the circle and “X” shows the position relative to the groove of the SEM micrographs.
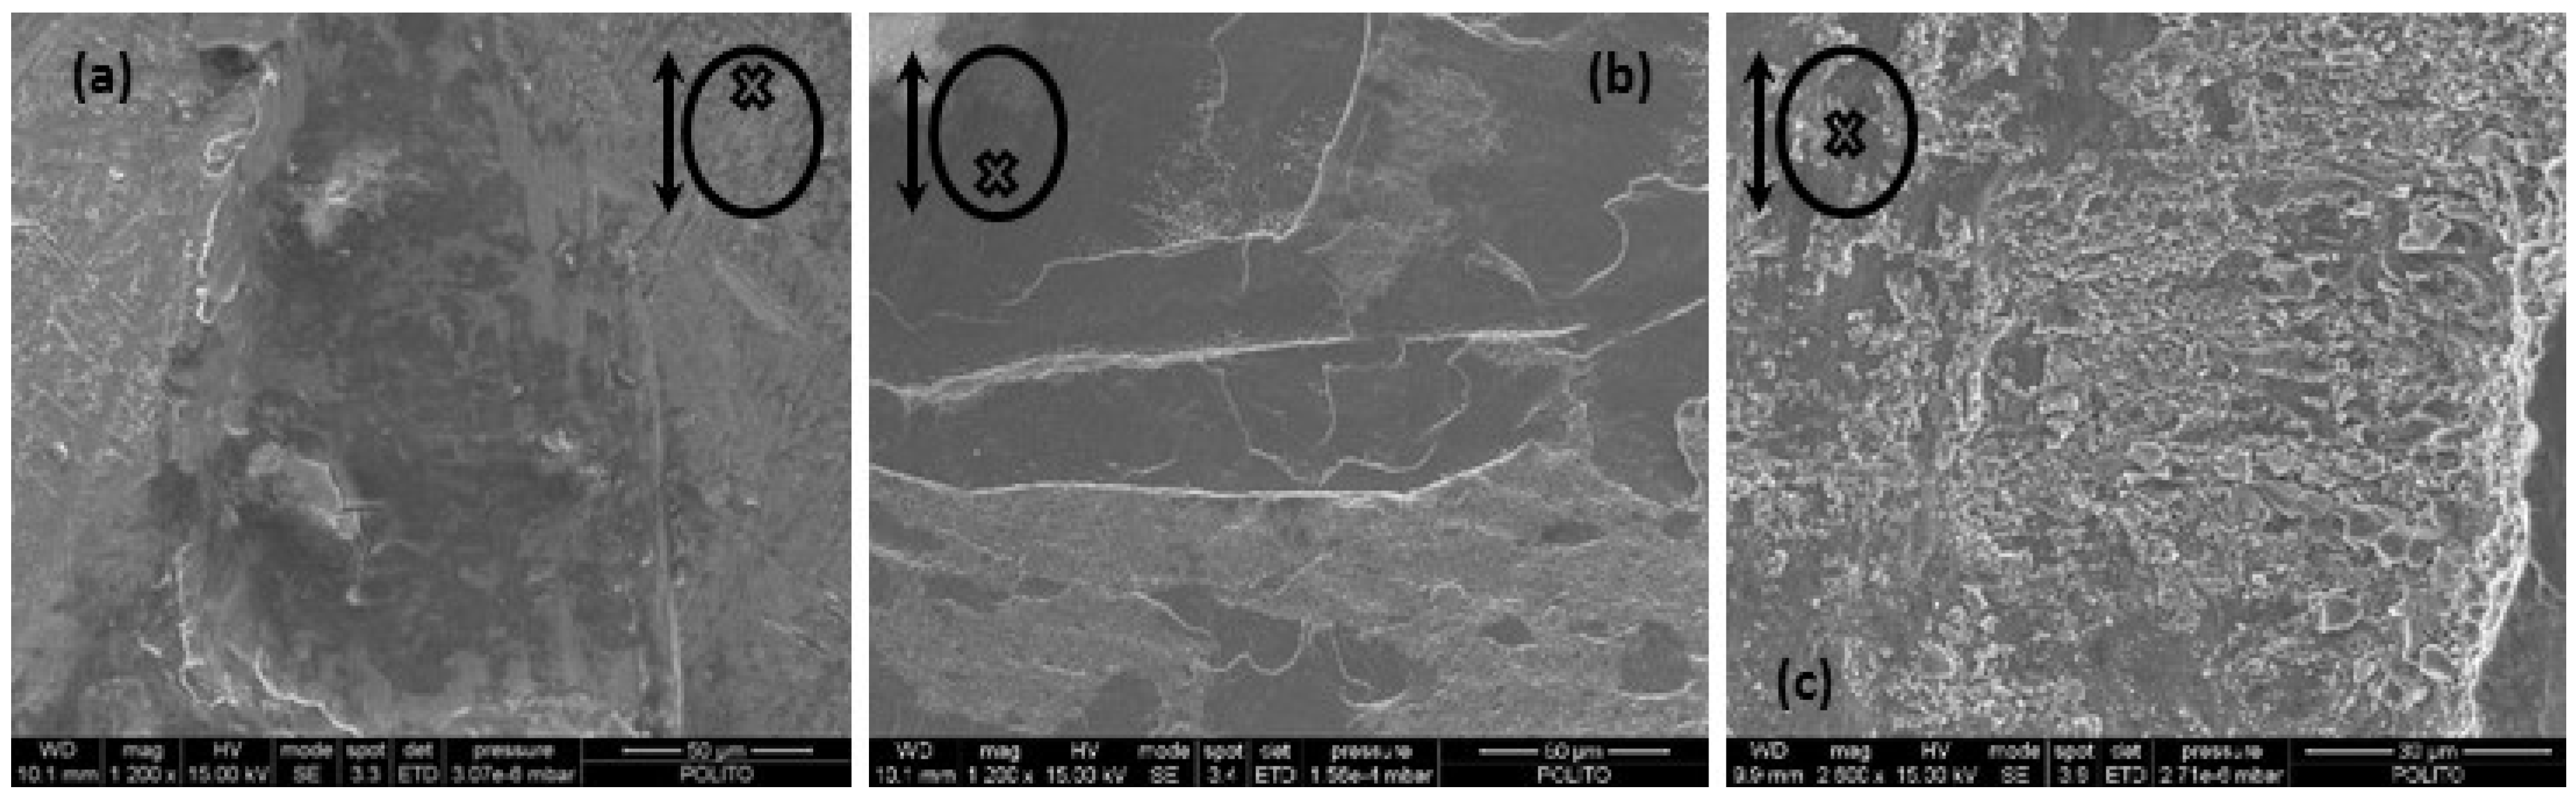
Figure 11 shows fractures on the flat (Figure 11a) and spherical (Figure 11b) contact surfaces. These agglomerates are large debris that are sometime expelled, and other times are shattered and welded onto the surface. Figure 11c shows brittle shattered oxides at the centre of the flat surface of the pair 01.
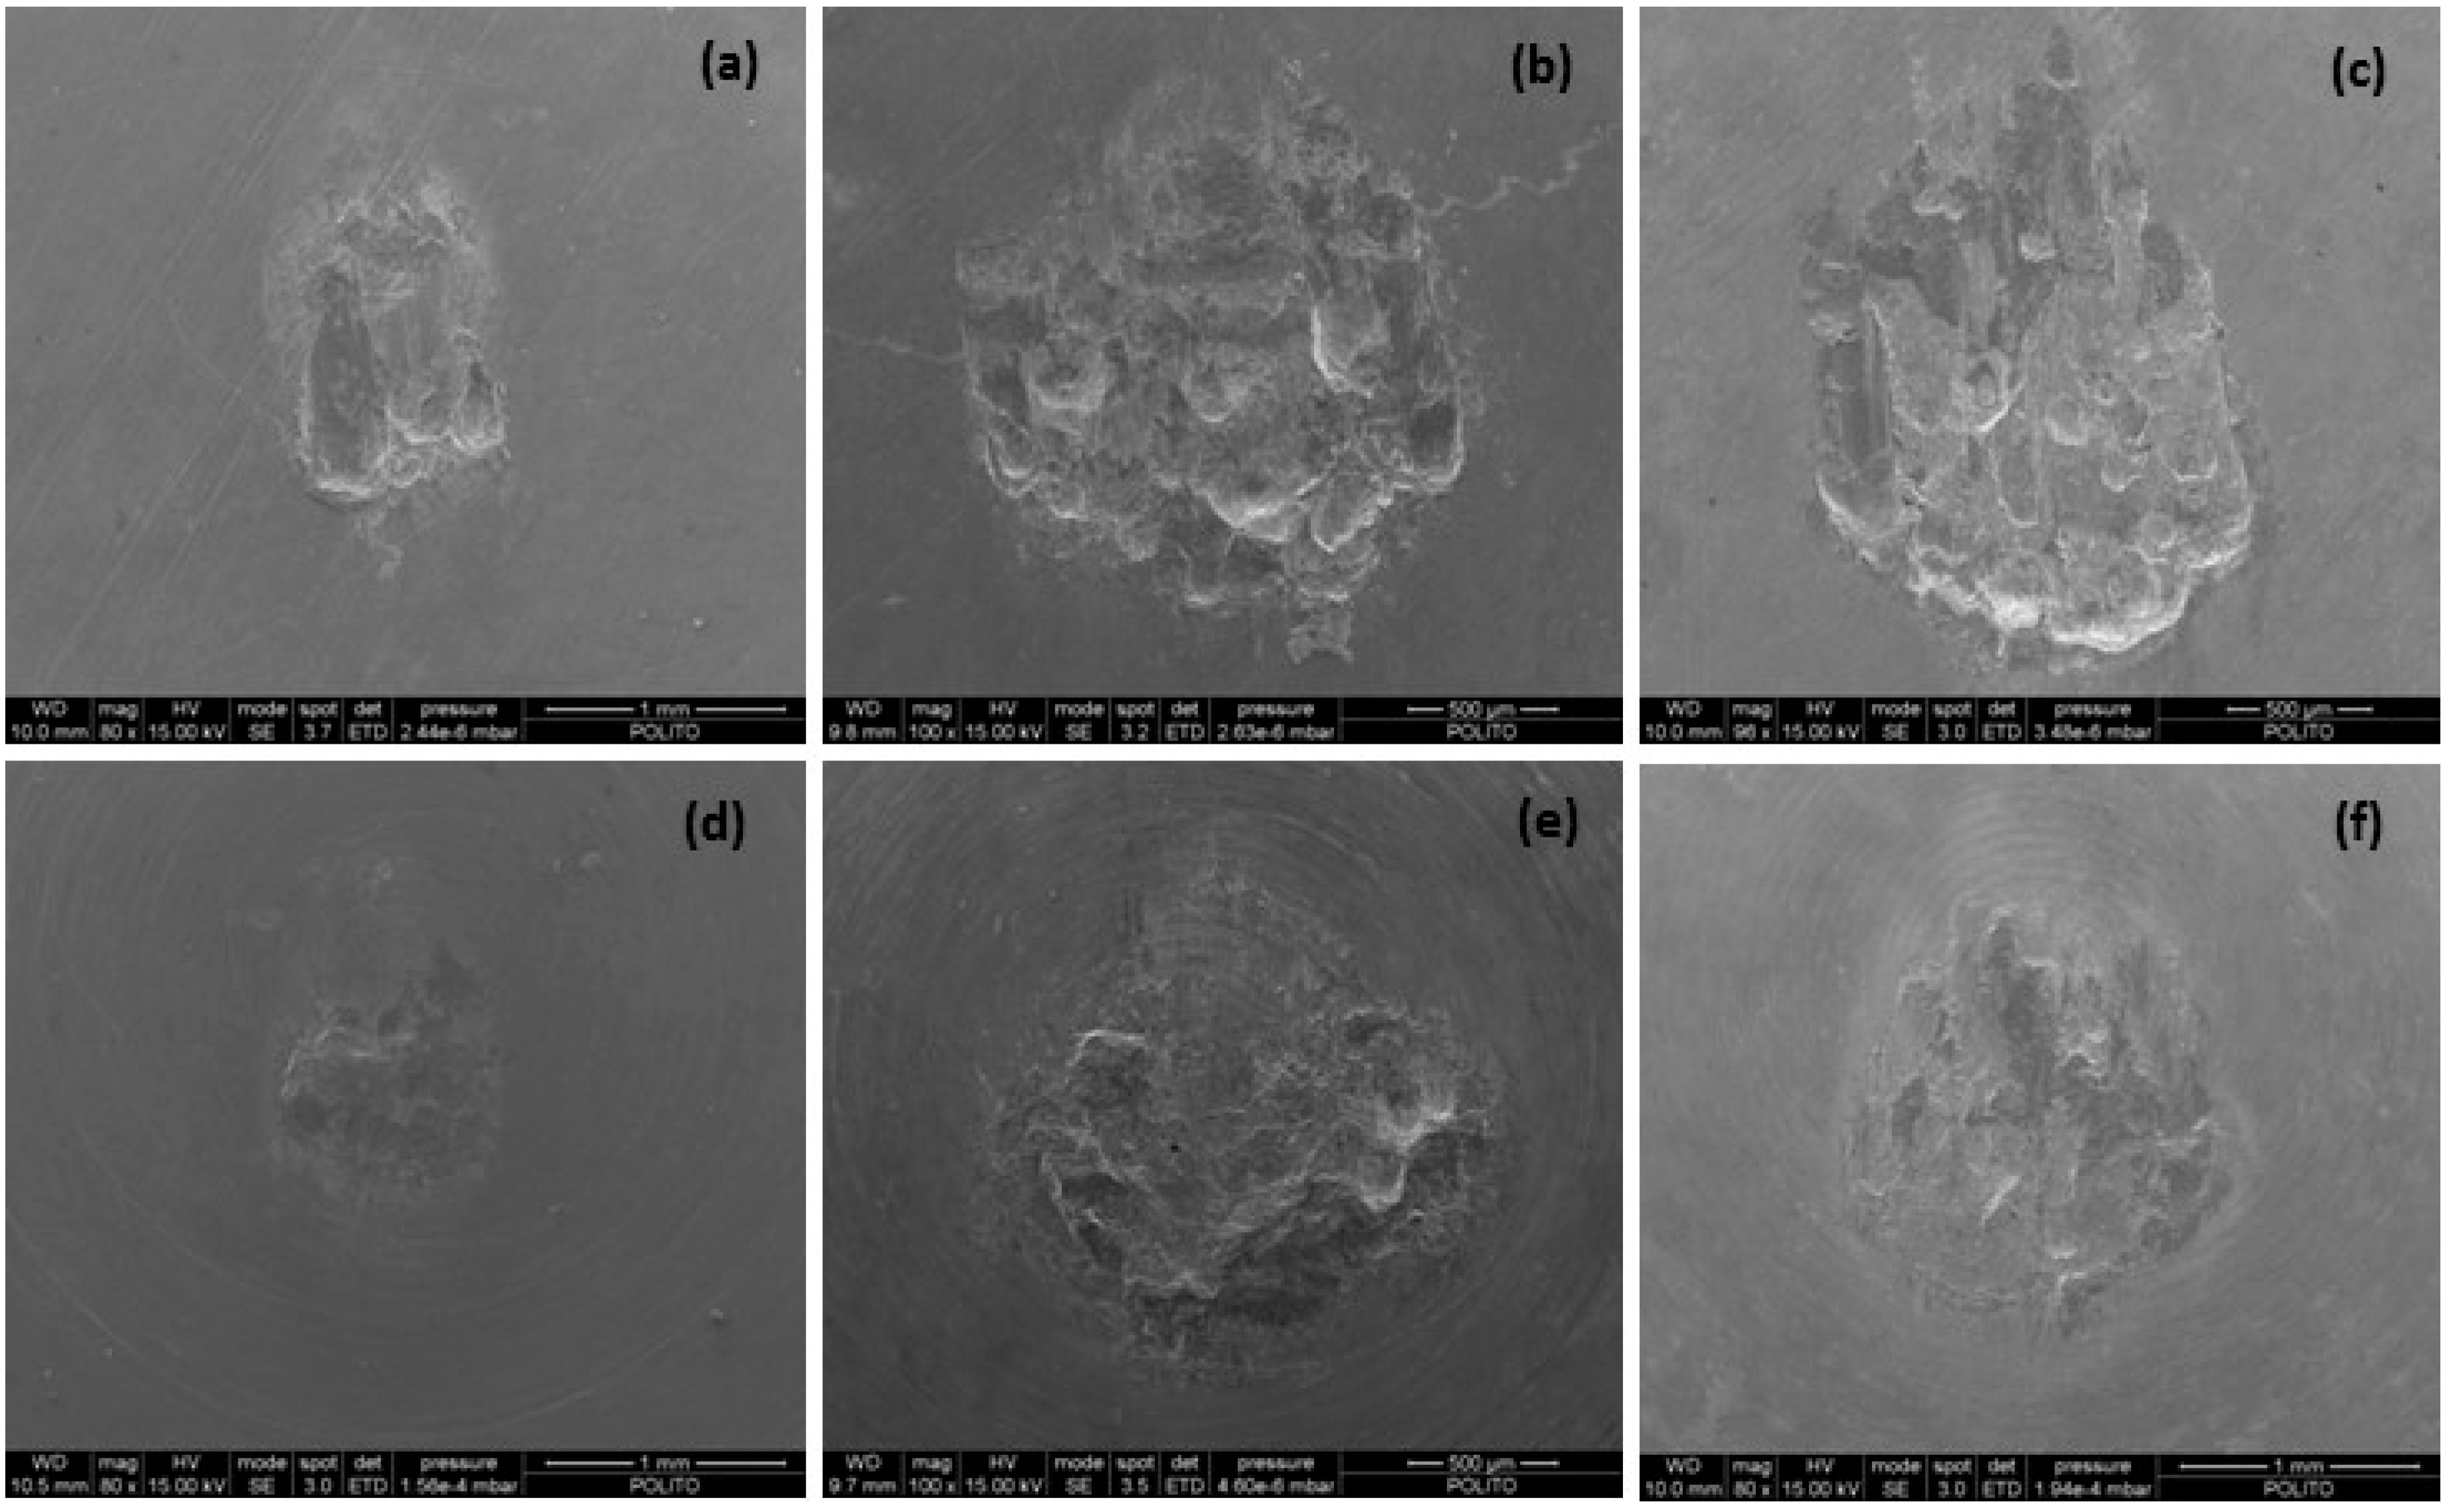
The fact that the sliding amplitude is lower, but not much lower, than the radius of the Hertzian contact area (reported in Table 2) seems to be in contrast with the difficulties of the system to expel debris. This contrast is not real because the dimensions of the real contact areas were much bigger than the Hertzian contact areas. The dimensions of contact areas of the pairs: 02 and 03 (30 µm, 600 °C, 10 and 15 million of wear cycles) and the pairs 05 and 07 (60 µm, 800 °C, 5 and 15 million of wear cycles) can be evaluate from the SEM micrographs shown in Figure 12. This is due to the fact that the point contact occurs only at the beginning of the wear process. After a few wear cycles, the contact evolves and becomes a contact among conformal surfaces. The results, in terms of contact pressure reported in [15], show that after 12,000 wear cycles, the analysed point contact becomes a conformal contact. Moreover, Figure 8 shows that the maximum volume growth was measured at 5 × 10⁶ wear cycles for the process at 600 °C and 30 µm. On the other hand, for the process at 800 °C and 60 µm, the maximum volume growth was measured at the same wear cycles, but with a lower magnitude. This can be explained by the fact that by increasing the stroke from 30 to 60 µm, the production of debris increases much less than the capability to expel debris. Furthermore these wear processes are also at two different temperatures. The increase of the characteristic contact length between 600 and 800 °C should be taken into account, although this difference is very small, thus, it can be neglected in this case. Figure 8b illustrates that, at the maximum volume growth, the process at high stroke and temperature (800 °C) was associated to a dissipated energy substantially double than that of the process at low stroke and temperature (600 °C). In other words, the oxide growth at half stroke is about double than that at one stroke, with a doubled cumulated energy loss.
Considering that the increase in temperature favours the oxide growth, the fundamental role of the stroke on the growth oxides clearly emerge. The negative minimum of the wear volumes suggests that there is a saturation effect in oxide growth. This is due to the equilibrium between two opposite trends, the debris produced and the debris expelled. Considering the flux of debris from the centre to the outside contact surfaces, the saturation volume can be interpreted as the volume of debris that remains between the contact surfaces. The comparison of wear volume evolution of Figure 8b, at the same level of energy loss, shows that wear volumes at 600 °C are higher than at 800 °C.
4. Conclusions
The fretting wear characterization of superalloy René 80 was performed at two temperatures (600; 800 °C) and two strokes (30; 60 µm). Contact parameters (friction coefficient and tangential contact stiffness) and wear volume were measured. Results show that the lowest dissipated energy and, consequently, the lowest friction coefficient, was found at a temperature of 800 °C. Taking into account that the wear volume is proportional to the cumulated energy loss, this temperature is an optimum working condition for the fretting wear process of René 80. Furthermore, the friction coefficient is imperceptibly higher at a temperature of 600 °C than at 800 °C, while at the temperature of 400 °C, it is 15% higher than 800 °C. Thus, this propitious working condition is extended for a wide range of temperatures. Even if, for this test plan, temperatures higher than 800 °C were not analysed, the favourable work condition found at 800 °C would likely lingers up to 900 °C. Future works should be oriented to investigate the fretting wear process of René 80 at temperatures up to 1000 °C.
With regard to the wear mechanism, a fundamental role of the sliding amplitude was found. In particular, the ratio between the sliding amplitude and the characteristic contact length has a significant influence on the oxides growth on the contact surfaces. This parameter controls, both the production of debris, and their expulsion from the contact surfaces. If this ratio increases, both the production and expulsion capability of debris increase. The equilibrium between production and expulsion of debris determines the amount of debris that remains on the contact surfaces. Future works should be oriented towards thoroughly investigating the oxide layer in terms of composition and thickness.
Conflicts of Interest
The author declares no conflict of interest.
References
- Boesch, W. Introduction Superalloys. In Superalloys, Supercomposites and Superceramics; Tien, J.K., Caulfield, T., Eds.; ACADEMIC PRESS INC: San Diedo, CA, USA, 1989; pp. 1–7. [Google Scholar]
- Eden, E.M.; Rose, W.N.; Cunningham, F.L. Endurance of metals. Proc. Inst. Mech. Eng. 1911, 4, 839–974. [Google Scholar] [CrossRef]
- Tomlinson, G.A. The rusting of steel surfaces in contact. Proc. R. Soc. Lond. Ser. A 1927, 115, 472–483. [Google Scholar] [CrossRef]
- Gean, M.; Tate, N.; Farris, T. Fretting Fatigue of Nickel Based Superalloys at Elevated Temperature. In Proceedings of the 50th AIAA/ASME/ASCE/AHS/ASC Structures, Structural Dynamics, and Materials Conference, Structures, Structural Dynamics, and Materials and Co-located Conferences, Palm Springs, CA, USA, 4–7 May 2009. [CrossRef]
- Rahmani, K.; Nategh, S. Low cycle fatigue mechanism of René 80 at high temperature-high strain. J. MSEA 2008, 494, 385–390. [Google Scholar] [CrossRef]
- Firrone, C.M.; Botto, D.; Gola, M.M. Modelling a friction damper: Analysis of the experimental data and comparison with numerical results. In Proceedings of the ASME ESDA 2006, Torino, Italy, 4–7 July 2006. [CrossRef]
- Firrone, C.M. Measurement of the kinematics of two underplatform dampers with different geometry and comparison with numerical simulation. JSV 2009, 323, 313–333. [Google Scholar] [CrossRef]
- McKnight, R.L.; Laflen, J.H.; Spamer, G.T. Turbine Blade Tip Durability Analysis; General Electric Company: Cincinnati, OH, USA, 1981. [Google Scholar]
- Fritz, L.J.; Koster, W.P. Tensile and Creep Rupture Properties of (16) Uncoated and (2) Coated Engineering Alloys at Elevated Temperatures; Metcut Research Associates Inc.: Cincinnati, OH, USA, 1977. [Google Scholar]
- Lavella, M.; Botto, D. Fretting wear characterization by point contact of nickel superalloy interfaces. Wear 2011, 271, 1543–1551. [Google Scholar] [CrossRef]
- Lavella, M.; Botto, D.; Gola, M.M. Design of a high-precision, flat-on-flat fretting test apparatus with high temperature capability. Wear 2013, 302, 1073–1081. [Google Scholar] [CrossRef]
- Hintikka, J.; Lehtovaara, A.; Mäntylä, A. Normal displacements in non-Coulomb friction conditions during fretting. Tribol. Int. 2016, 94, 633–639. [Google Scholar] [CrossRef]
- O’Connor, J.J.; Johnson, K.L. The role of surface asperities in transmitting tangential force between metals. Wear 1963, 6, 118–139. [Google Scholar] [CrossRef]
- Botto, D.; Lavella, M. High temperature tribological study of cobalt-based coatings reinforced whit different percentages of alumina. Wear 2014, 318, 89–97. [Google Scholar] [CrossRef]
- Botto, D.; Campagna, A.; Lavella, M.; Gola, M.M. Experimental and numerical investigation of fretting wear at high temperature for aeronautical alloys. In Proceedings of ASME Turbo Expo 2010: Power for Land, Sea and Air, Glasgow, UK, 14–18 June 2010. [CrossRef]
Figure 1.
Samples. (a) Drawing with main dimension; (b) picture in unworn conditions.

Figure 2.
(a) Test rig scheme; (b) detail of samples assembling; (c) picture of samples in work condition.
Figure 2.
(a) Test rig scheme; (b) detail of samples assembling; (c) picture of samples in work condition.

Figure 3.
Test procedure.

Figure 4.
(a) Macroscopic form removal; (b) peak and hole volume measurement; (c) reference plane and volume of peak and hole; (d) non-worn peak and hole volume measurement.
Figure 4.
(a) Macroscopic form removal; (b) peak and hole volume measurement; (c) reference plane and volume of peak and hole; (d) non-worn peak and hole volume measurement.

Figure 5.
Hysteresis loop as a function of some process parameters: (a) frequency; (b) temperature; (c) stroke; (d) wear state.
Figure 5.
Hysteresis loop as a function of some process parameters: (a) frequency; (b) temperature; (c) stroke; (d) wear state.

Figure 6.
(a) Cumulated energy loss; (b) friction coefficient as a function of temperature of the pair 07; (c) friction coefficient as a function of wear cycles at 100 Hz.
Figure 6.
(a) Cumulated energy loss; (b) friction coefficient as a function of temperature of the pair 07; (c) friction coefficient as a function of wear cycles at 100 Hz.

Figure 7.
Contact stiffness: (a) pairs 01, 02, 05, 06 in stick condition; (b) pairs 01, 02, 05, 06 in gross slip condition; (c) pair 03, 07 in stick condition; (d) pair 03, 07 in gross slip condition.
Figure 7.
Contact stiffness: (a) pairs 01, 02, 05, 06 in stick condition; (b) pairs 01, 02, 05, 06 in gross slip condition; (c) pair 03, 07 in stick condition; (d) pair 03, 07 in gross slip condition.

Figure 8.
Wear volume as a function of wear cycles (a) and cumulated energy loss (b).

Figure 9.
Volume growth on the pair 05 (a) flat; (b) sphere.

Figure 10.
SEM, accumulation and fracture: (a) pair 01—flat; (b) pair 07—flat; (c) pair 07—flat.

Figure 11.
SEM, crack on the oxide layer: (a) pair 03—flat; (b) pair 07—sphere; (c) shattered oxides pair 01—flat.
Figure 11.
SEM, crack on the oxide layer: (a) pair 03—flat; (b) pair 07—sphere; (c) shattered oxides pair 01—flat.

Figure 12.
damage at the end of the wear process: (a) pair 02—flat; (b) pair 02—spherical; (c) pair 03—flat; (d) pair 03—spherical; (e) pair 05—flat; (f) pair 05—spherical; (g) pair 07—flat; (h) pair 07—spherical.
Figure 12.
damage at the end of the wear process: (a) pair 02—flat; (b) pair 02—spherical; (c) pair 03—flat; (d) pair 03—spherical; (e) pair 05—flat; (f) pair 05—spherical; (g) pair 07—flat; (h) pair 07—spherical.


| Test ID | Temperature, °C | Stroke, µm | Frequency, Hz | Normal Load, N | Wear Cycles ×106 |
|---|---|---|---|---|---|
| René 80-01 | 600 | 30 | 100 | 32 | 5 |
| René 80-02 | 600 | 30 | 100 | 32 | 10 |
| René 80-03 | 600 | 30 | 100 | 32 | 15 |
| René 80-04 | 600 | 60 | 100 | 32 | 5 |
| René 80-05 | 800 | 60 | 100 | 32 | 5 |
| René 80-06 | 800 | 60 | 100 | 32 | 10 |
| René 80-07 | 800 | 60 | 100 | 32 | 15 |
| Normal Load, N | Radius of the Spherical Surface, mm | Temperature, °C | Modulus of Elasticity, GPa | Poisson’s Ratio | Radius of the Hertzian Contact Circle, mm | Area of the Hertzian Contact Circle, mm2 | Average Hertzian Pressure, MPa | Maximum Hertzian Pressure, MPa |
|---|---|---|---|---|---|---|---|---|
| 32 | 25 | 21 | 198.6 | 0.314 | 0.176 | 0.097 | 329 | 494 |
| 600 | 177,1 | 0.328 | 0.182 | 0.107 | 307 | 460 | ||
| 800 | 163,8 | 0.337 | 0.187 | 0.109 | 293 | 439 | ||
| 925 | 151.8 | 0.344 | 0.191 | 0.115 | 279 | 419 | ||
| 1000 | 138.6 | 0.354 | 0.196 | 0.121 | 264 | 396 |
© 2016 by the author; licensee MDPI, Basel, Switzerland. This article is an open access article distributed under the terms and conditions of the Creative Commons Attribution (CC-BY) license (http://creativecommons.org/licenses/by/4.0/).
Share and Cite
MDPI and ACS Style
Lavella, M. Contact Properties and Wear Behaviour of Nickel Based Superalloy René 80. Metals 2016, 6, 159. https://doi.org/10.3390/met6070159
AMA Style
Lavella M. Contact Properties and Wear Behaviour of Nickel Based Superalloy René 80. Metals. 2016; 6(7):159. https://doi.org/10.3390/met6070159
Chicago/Turabian StyleLavella, Mario. 2016. "Contact Properties and Wear Behaviour of Nickel Based Superalloy René 80" Metals 6, no. 7: 159. https://doi.org/10.3390/met6070159
Note that from the first issue of 2016, this journal uses article numbers instead of page numbers. See further details here.