Article

Constitutive Model Based on Dynamic Recrystallization Behavior during Thermal Deformation of a Nickel-Based Superalloy

1
School of Materials Science and Engineering, Harbin Institute of Technology at Weihai, Weihai 264209, China
2
Central Iron & Steel Research Institute, Beijing 100081, China
*
Author to whom correspondence should be addressed.
Metals 2016, 6(7), 161; https://doi.org/10.3390/met6070161
Submission received: 8 June 2016 / Revised: 28 June 2016 / Accepted: 7 July 2016 / Published: 13 July 2016
(This article belongs to the Special Issue Ni- and Co-Based Superalloys and Their Coatings)

Abstract

:
The thermal deformation and dynamic recrystallization (DRX) behavior of a nickel-based superalloy were investigated by the thermal compression test. The experimental results show that the process parameters have great influence on the flow stress of the superalloy. In addition, there is an inflection point on the DRX softening stage of the work-hardening rate versus stress curve. DRX under the conditions of higher temperatures and lower strain rates easily occurs when the strain reaches a critical level. Based on the classical dislocation density theory and the DRX kinetics models, a two-stage constitutive model considering the effect of work hardening-dynamic recovery and DRX is developed for the superalloy. Comparisons between the predicted and experimental data indicate that the values predicted by the proposed constitutive model are in good agreement with the experimental results.

Graphical Abstract

1. Introduction

Superalloys can be divided into three categories according to the matrix: nickel-based superalloy, cobalt-based superalloy, and iron-based superalloy. The latter has better comprehensive mechanical properties at high temperature, so is widely used in many fields, such as aerospare, navigation, nuclear energy, petroleum, etc. However, the high temperature plasticity of the superalloy is mediocre [1,2,3]. Therefore, investigation into the nickel-based superalloy is crucial, and it is of great significance to promote related applications.
Over the last decades, the development of numerical simulation technology has promoted the successful application of the finite element methods to a great extent, and it also has been widely used in the analysis and optimization of materials forming processes [4,5,6]. In order to establish a finite element simulation model, the constitutive model of materials has been considered as an input code to simulate the deformation behavior of materials under specific loading conditions [7]. Thus, the accuracy of numerical simulation is heavily dependent on the consistency between the actual deformation behaviors of materials and those predicted by a constitutive model.
In recent years, many constitutive models have been developed to describe the deformation behaviors of materials. Laasraoui et al. [8] investigated the constitutive equation, which can be used in applications such as hot-rolling to describe the plastic behavior of steels by taking into account dislocation density and deformation mechanism at high temperatures and strain rates. Lin et al. developed a new constitutive model that was proposed to describe the high-temperature flow behavior of the Al-Cu-Mg alloy according to the experimental results using the modified Johnson-Cook model [9], and investigated a comprehensive model that can describe the relationship of the flow stress, strain rate, and deformation temperature of the alloys on the compression deformation characteristics [10]. Watanabe et al. [11] developed the phenomenological constitutive equation to investigate the deformation mechanism of fine-grained superplasticity. Wang et al. [12] established a two-stage constitutive model, based on the dislocation density theory and kinetics of dynamic recrystallization (DRX), to predict the flow stress curves of the alloy at hot deformation condition. Based on the dislocation density theory and DRX kinetics, a physically based constitutive model was developed for a nitrogen alloyed ultralow carbon stainless steel by He et al. [13]. Comparison between the predicted and experimental flow stress indicates that the developed model has high accuracy and better predicting capacity by the statistical analysis. In addition, a physically based model considering dynamic recovery (DRV) and DRX mechanisms for a typical nickel-based superalloy was developed to describe the relationship between the flow stress, strain rate, and forming temperature [14].
During the hot deformation process of materials, flow behaviors are often very complex and the control of microstructure is also of great importance in optimizing the final mechanical properties [15,16,17,18]. Many researchers investigated that the work hardening, dynamic recovery (DRV), and DRX are often accompanied in metals and alloys during the hot deformation [19,20,21,22]. It is well known that DRX is not only a significant softening mechanism, but also an effective method to refine grain and reduce the hot deformation resistance. The deformation conditions (deformation temperature, strain rate, and deformation amount) of a material directly affect the degree of DRX. In order to control or obtain the ideal deformation microstructure, a series of specific parameters of the DRX, which include critical strain of DRX, DRX volume fraction, and so on, need to be quantitative when modeling the process of materials deformation. Shamsolhodaei et al. [23] studied the Arrhenius constitutive model, which is a common equation used to explain the relationship between flow stress, strain rate, and deformation temperature, and obtained the value of deformation activation energy. Gottstein et al. [24,25] and Mirzadeh et al. [26] investigated the critical strain conditions for DRX by a point of inflection on the θ-σ curve, where θ is the work-hardening rate. Xu et al. [27] and Chen et al. [22] developed a kinetics model and a volume fraction model of DRX for as-cast AZ91D alloy and a typical nickel-based superalloy during hot deformation, respectively.
In this study, based on the dislocation density theory and kinetics of DRX, the flow behavior constitutive model was also developed, which was established by the two stages of the work hardening-DRV dislocation density theory and DRX, respectively. Through the comparison analysis, it is found that the predicted results of the numerical modeling and the experimental data have a good consistency.

2. Materials and Methods

The studied material is a kind of aging precipitation strengthening feature nickel-based superalloy. The grain size before experiments is about 41 μm. The studied compressed cylindrical specimen was obtained through blooming. The chemical compositions (wt. %) of the nickel-based superalloy are shown in Table 1. The isothermal compression experiments were conducted on MTS810.13 testing machine under the deformation temperatures of 1223–1423 K, with a strain rate of 0.001–30 s−1, respectively. In order to make the results of the experiment representative, the core area and the edge of the fine grain zone were avoided. The size of cylindrical specimen is Φ10 × 16 mm. In order to reduce the influence of friction on the stress state, the end surfaces of the specimen were coated with glass lubricant with the thickness of 1 mm. In addition, the deformation conditions of the superalloy such as temperature and displacement velocity were automatically controlled by a computer system.
After the compression tests, the specimens were immediately immersed in water. Then the compression specimens were lapped and polished, and finally etched in a corrosive solution consisting of HCl (100 mL), C2H5OH (100 mL), and CuCl2 (20 g) at room temperature for 30–180 s. Eventually, the surfaces of the specimens were observed by optical microscope to observe the phenomenon of DRX. Then, in order to observe the distribution of defects such as dislocation, the specimens were cut into slices with the thickness of 5 mm firstly, and then the slices were eventually thinned into 20 μm by ion-thinning method. After the treatment, the microstructures of the specimens were observed by transmission electron microscope (TEM) [27].

3. Results and Discussion

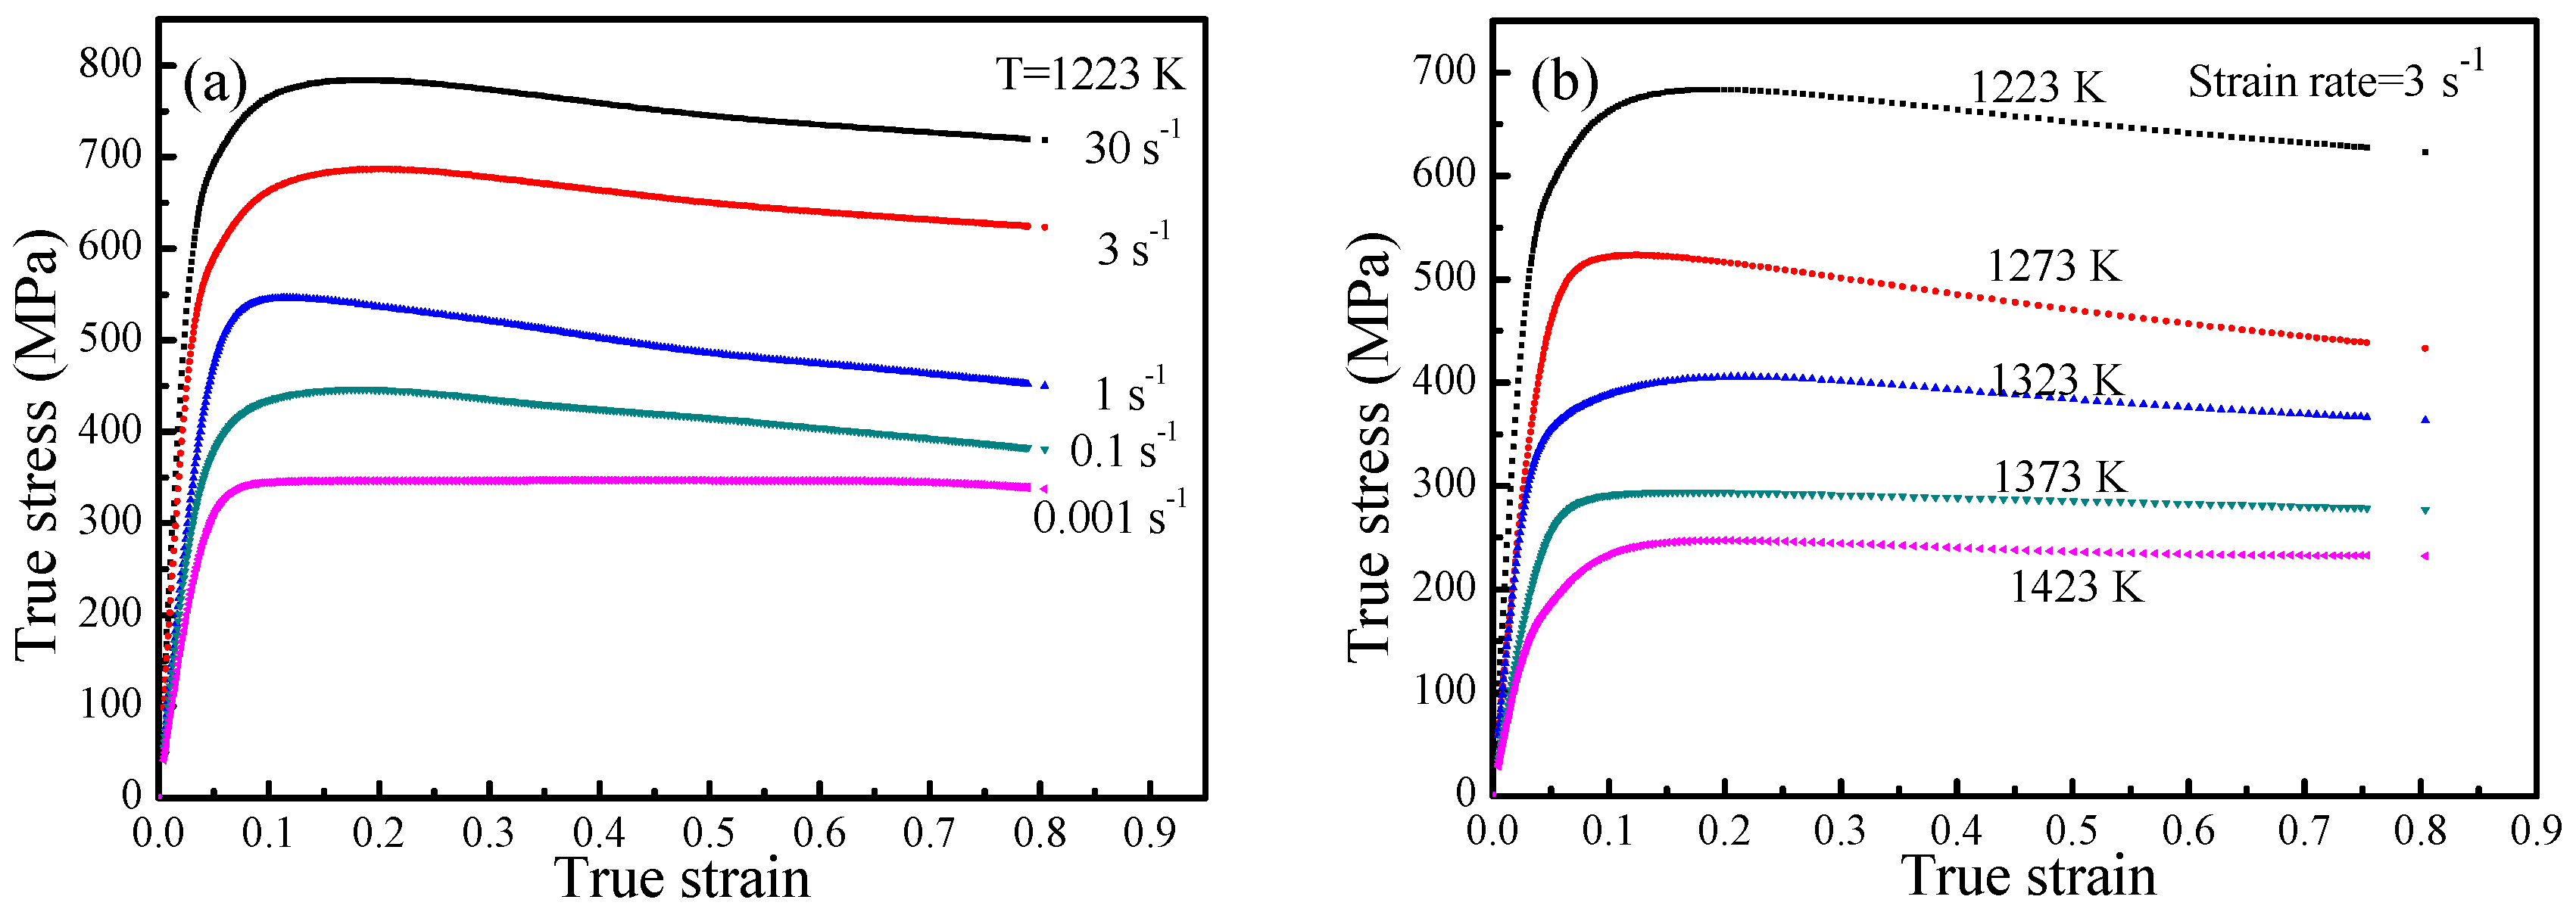
3.1. Thermal Deformation Behavior

The true stress-strain curves of the nickel-based superalloy under different forming temperatures and strain rates by thermal compression tests are illustrated in Figure 1. It can be seen that almost all experimental conditions have the same tendency. The flow stress rapidly increases to the peak value in initial stage, and then gradually decreases to a relatively steady state with the increase of the strain. This is due to the comprehensive influence of work-hardening and softening behavior in the thermal deformation process.
It can be found that the true stress-strain curve can be divided into three stages: work hardening stage, softening stage, and steady stage [22,28]. In the work hardening stage, the strain is lower, and the external stress contributes to internal defects such as dislocations, which constantly increase and rapidly accumulate with the diffusion of various alloying elements. Therefore, rapidly increased dislocation density and gathered residual stress lead to a sharp increase in subsequent deformation resistance. When the density of the accumulated dislocations reaches a threshold, recovery recrystallization occurs. However, the effect of DRV is too weak to balance the work hardening effect. As a consequence, the flow stress increases rapidly with the increase of strain. In the softening stage, the dislocations still continue to climb and accumulate with the effect of thermal deformation under different experimental conditions, and DRX occurs more easily. Thus, the softening effect is more dominant than the work hardening. In addition, the nucleation and grain growth are also constantly occurring, and the flow stress decreases slowly with the increase of strain in this period. In the steady stage, the flow stress is maintained at a relatively stable level due to the dynamic balance between the softening and the work-hardening effects.
In addition, a lot of information can be obtained from the true stress-strain curves. The flow stress of the superalloy is sensitive to the deformation temperature and strain rate under all experimental conditions. With the increase of deformation temperature and the decrease of the strain rate, the flow stress increases obviously. This indicates that the higher the deformation temperature and the lower strain rate are, the smaller the deformation resistance is. The reasons for this regular pattern are that the mobility of the grain boundaries increases with increasing deformation temperature, and the reduction of plasticity deformation time increases with the effect of work-hardening and restrains DRX at higher strain rate.
The metallographs of the superalloy under different deformation conditions are shown in Figure 2. It can be seen that the recovery and recrystallization promote grain refining in the process of thermal deformation. Figure 2c shows that the effect of recovery and recrystallization is more obvious than that in Figure 2b. The stronger the softening effect is, the smaller the sizes of grains are. Figure 3 shows the TEM microstructure photos of the superalloy under different deformation conditions. The Figure 3a is the TEM microstructure photo of the initial crystal grains of the alloy. The density of the dislocation is relatively lower. The Figure 3c shows the TEM microstructure of the material, and the dislocations pile up seriously under these deformation conditions. From Figure 3b,d, it can be seen that the density of dislocations or dislocation tangles is more serious and obvious. As mentioned above, this is due to the fact that the deformation resistance is smaller under a higher deformation temperature and lower strain rate.

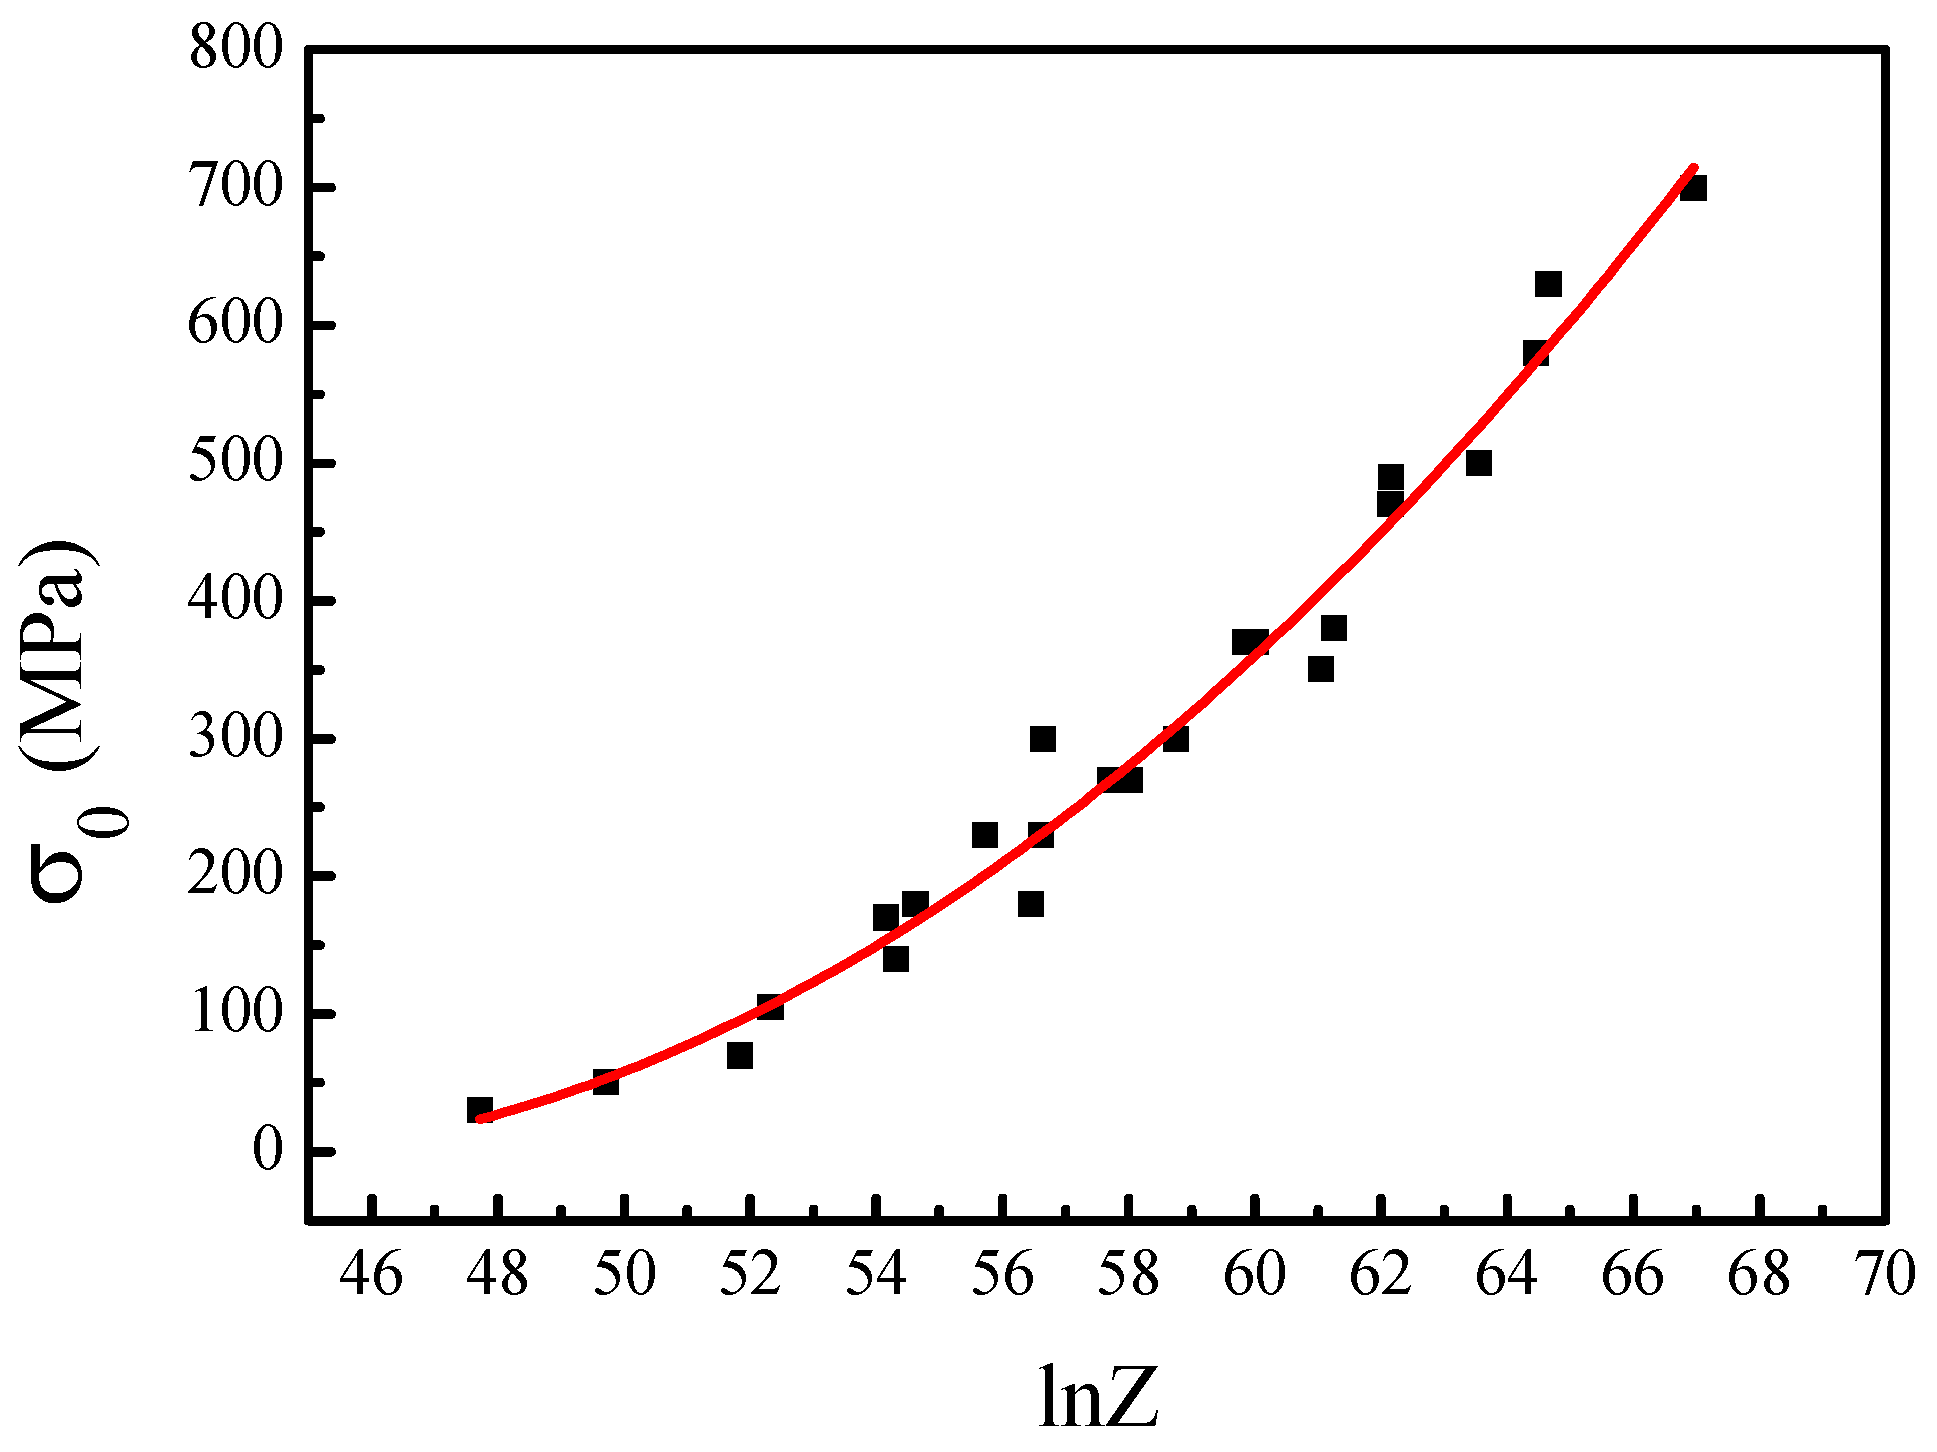
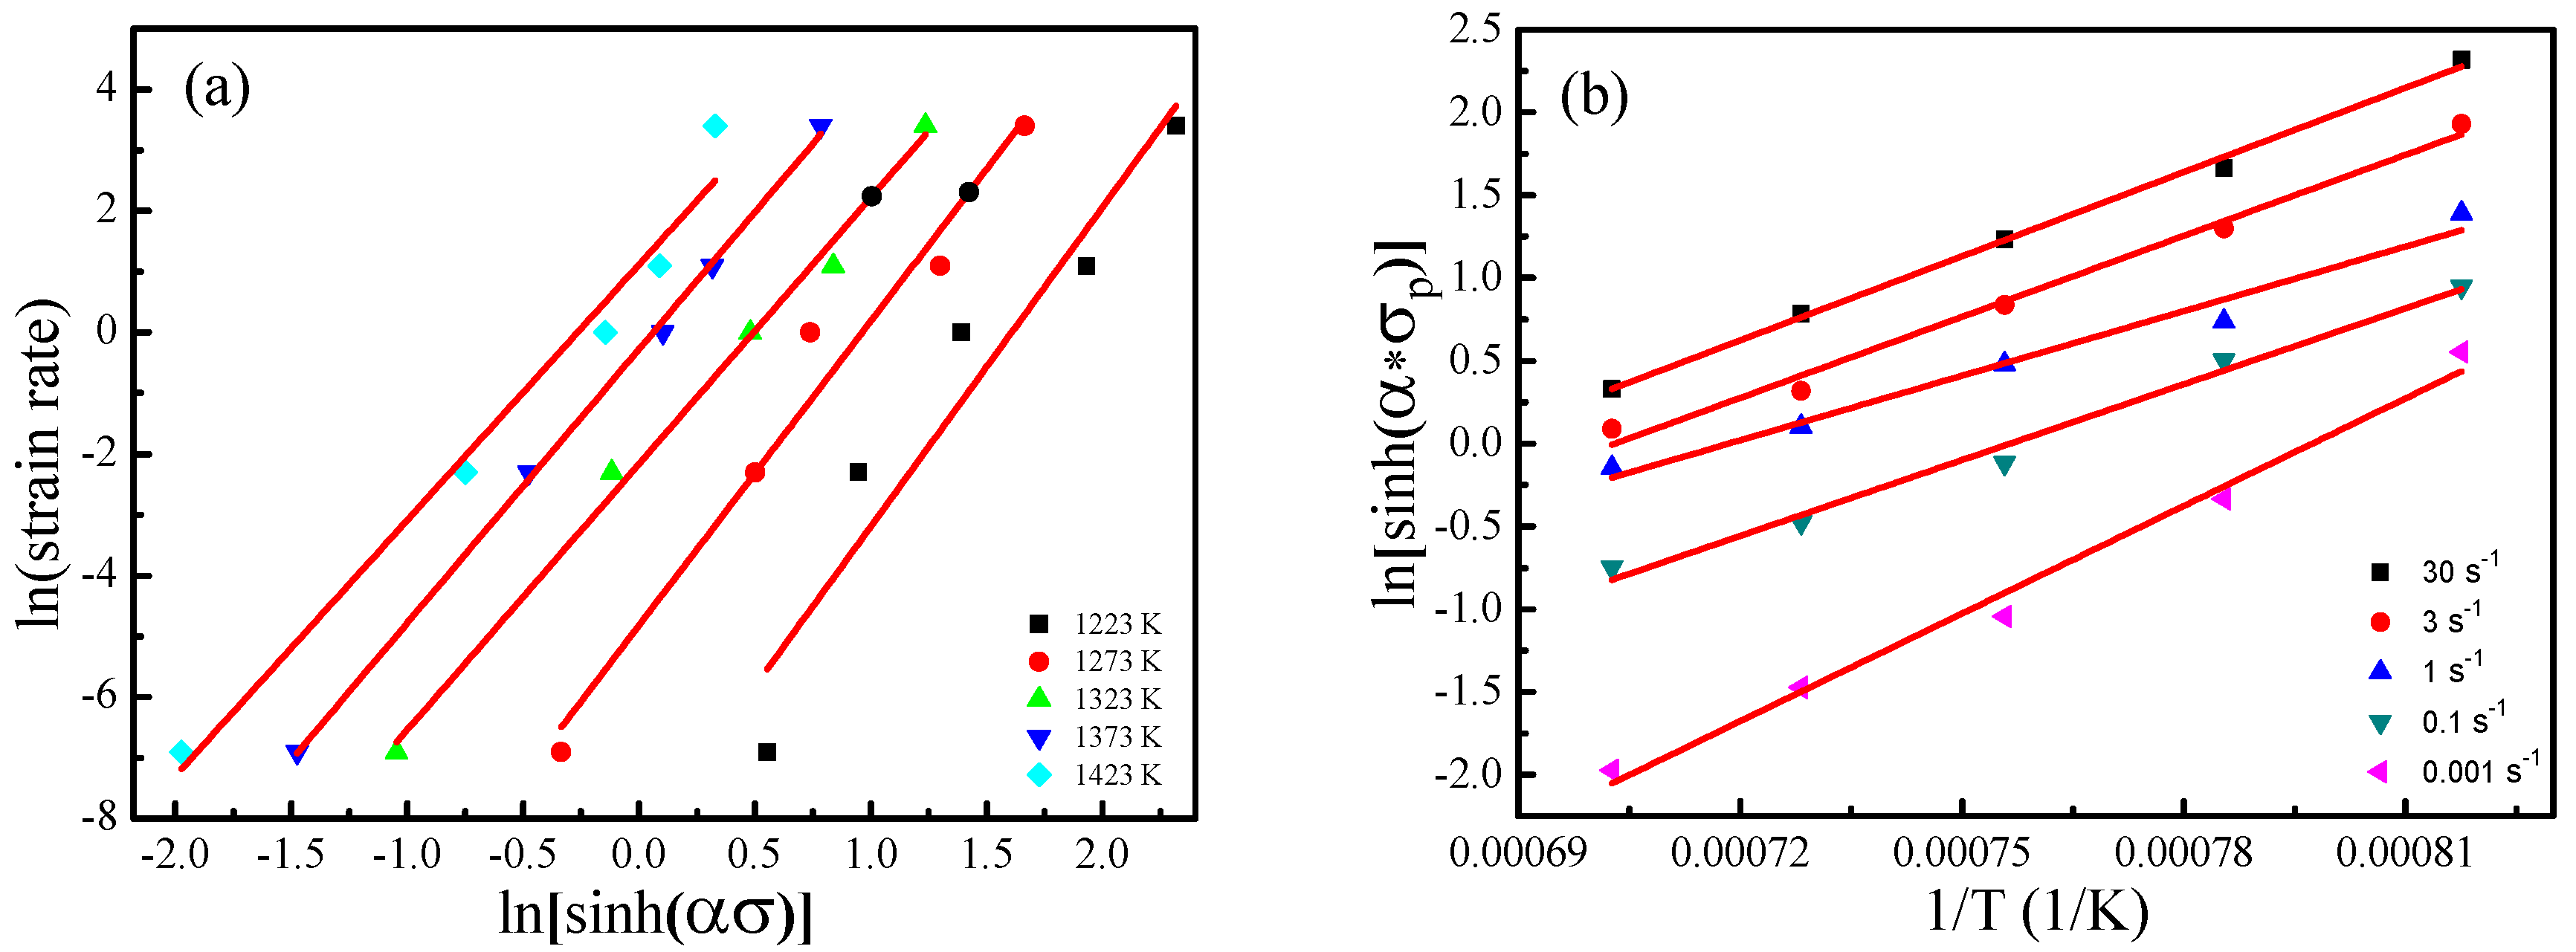
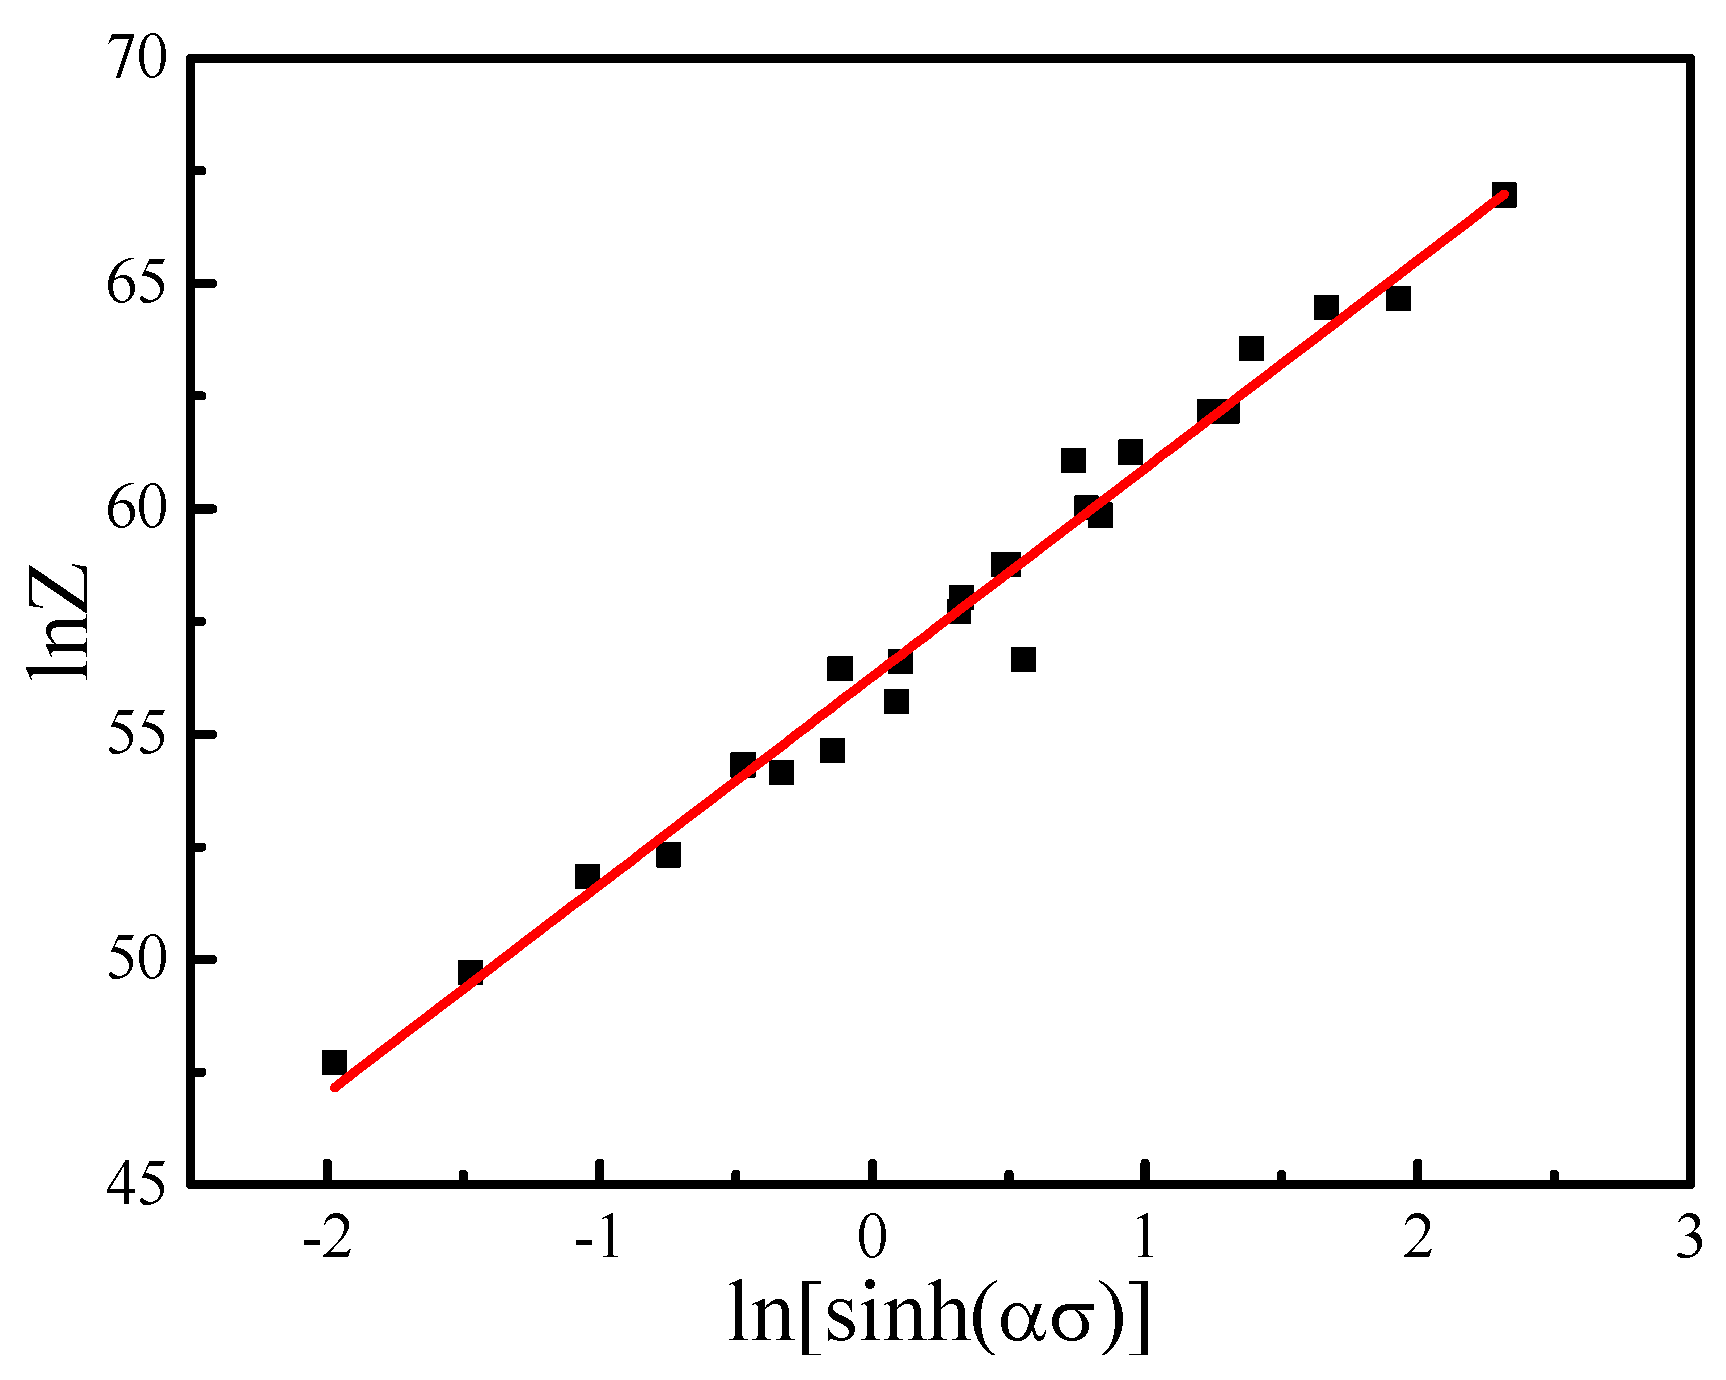
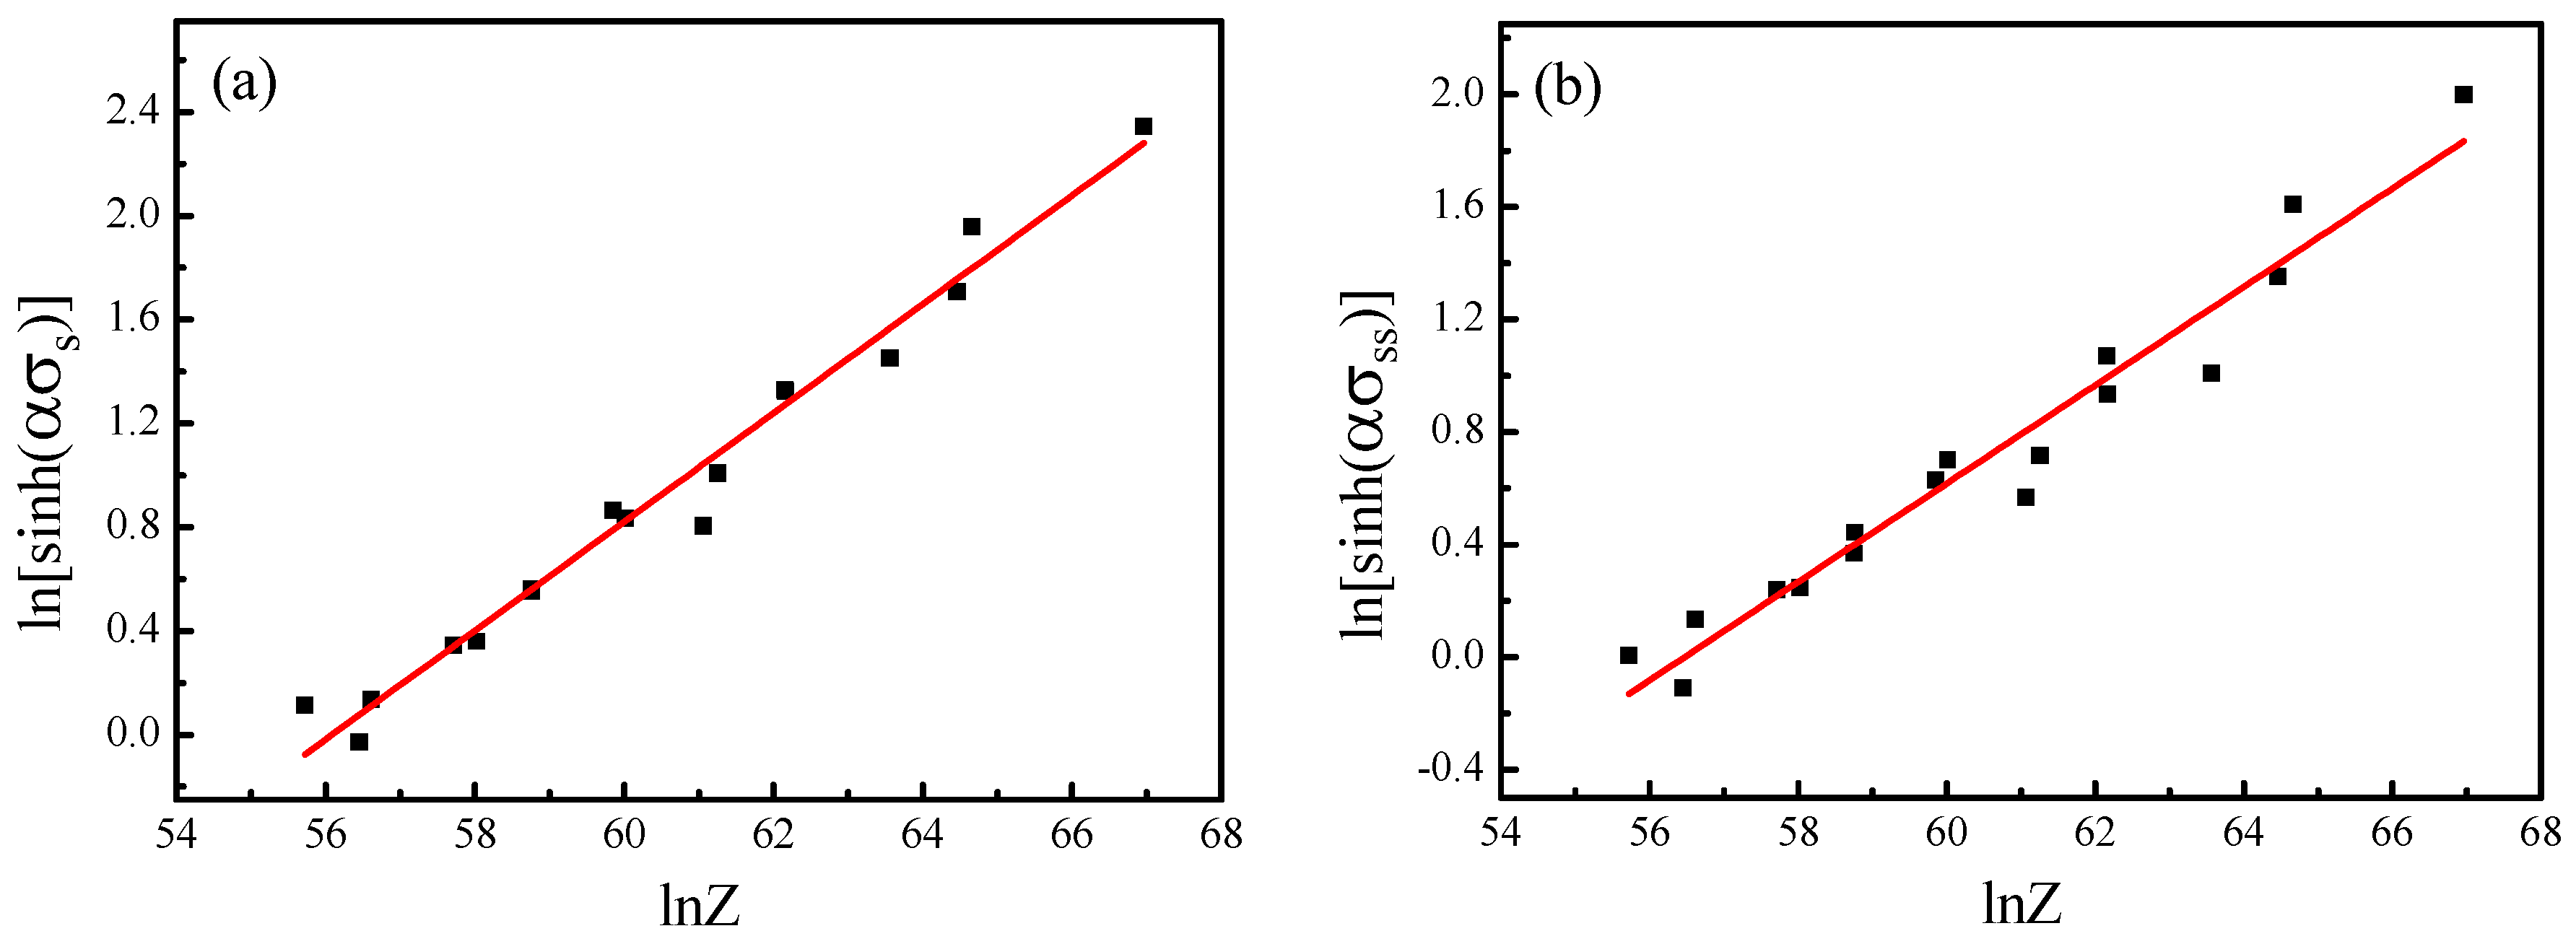
3.2. Arrhenius Constitutive Model

It is well known that thermal deformation of materials is controlled by thermal deformation parameters, such as deformation temperature and strain rate. The high temperature deformation of alloy belongs to a thermal activation process, and based on characteristics of different materials, a constitutive model is proposed to describe the relationship between flow stress, strain rate, and temperature, especially at high temperatures, by Sellars and Tegart [29,30]. That is the Arrhenius model, which is a widely used common equation. This equation is expressed as follows [31]:
ε ˙ = A F ( σ ) exp ( Q R T )
In this equation, A is the material constant, ε ˙ is the deformation strain rate (s−1), T is the absolute temperature in Kelvin (K), and Q is the thermal deformation activation energy, which is a very important parameter of mechanical properties in the process of thermal deformation and is also a standard to measure the degree of difficulty of thermal deformation of the material (J/mol). R is the gas constant (8.314 J/(mol·K)) and F(σ), the function of flow stress, can be expressed as follows:
F ( σ ) = { σ n 1 , α σ < 0.8 exp ( β σ ) , α σ > 1.2 [ sinh ( α σ ) ] n , for all  σ
Here α, β, n1, n are the material constants and α = β/n1. In general, the first equation is a power law description, which is suitable for relatively lower stress levels (i.e., ασ < 0.8). The second equation is an exponential law description, which is usually applied for higher stress levels (i.e., ασ > 1.2). The last one, the hyperbolic sine law, can be used for a wide range of stress levels. Therefore, the hyperbolic sine law is generally preferred to the power and exponential law description. However, the first two equations are commonly applied in order to determine β and n1, and then calculate α.
As mentioned above, the following equation is well suitable for all stress levels (including lower and higher stress levels):
ε ˙ = A sinh ( α σ ) n exp ( Q / R T )
The next step is to determine the deformation activation energy Q. Taking the natural logarithm of two sides of Equation (3) gives:
ln ε ˙ = ln A + n ln [ sinh ( α σ ) ] Q / R T
By partial differentiation of Equation (4), the following expression gives:
n = [ ln ε ˙ ln [ sinh ( α σ ) ] ] T
and
Q = R [ ln ε ˙ ln [ sinh ( α σ ) ] ] T [ ln [ sinh ( α σ ) ] ( 1 / T ) ] ε ˙
By applying the peak flow stress data, the values of n can be obtained for all slopes by plotting ln ε ˙ - ln [ sinh ( α σ ) ] at different deformation temperatures (Figure 4a). The final model parameters are listed in Table 2. Ultimately, the deformation activation energy of the studied superalloy is estimated at 646.341 kJ/mol, which is close to the result (691 kJ/mol) of Yu et al. [32].
In general, the combined effects of deformation temperature and strain rate on the forming performance of metals or alloys can be described by Zener-Hollomom (Z) parameter [33,34,35]. The function Z can be expressed as Equation (7):
Z = ε ˙ e Q R T = A [ sinh ( α σ ) ] n 2
where Q is the aforementioned thermal deformation activation energy and n2 is the material constant. By taking the natural logarithm of both sides of the Equation (7), the following result is obtained:
ln Z = ln A + n 2 ln [ sinh ( α σ ) ]
The straight line relationship is obtained by using the linear regression fit of ln Z - ln [ sinh ( α σ ) ] , the correlation coefficient of which reaches 0.97725, as follows in Figure 5. The hyperbolic sine model between the Z parameter and σ is validated to be suitable to describe the thermal compression deformation behavior of the nickel-based superalloy. By getting the slope and intercept of the fitted line individually, the value of n2 = 4.61991 can be obtained. Thus, the relationship between ε ˙ , T and σ can be expressed as follows:
ε ˙ = e 56.27881 [ sinh ( 0.0038486 σ ) ] 4.61991 exp ( Q / R T )
By substituting Z = ε ˙ exp [ Q / ( R T ) ] , the peak stress can be expressed as Equation (10):
σ = 1 0.0038486 ln { ( Z 2.764 × 10 24 ) 1 4.62 + [ ( Z 2.764 × 10 24 ) 1 2.31 + 1 ] 1 2 }
By substituting the strain rate and temperature of thermal deformation into Equation (10), the peak stress in the abovementioned function can be calculated under the corresponding deformation conditions. The comparison of the calculated and measured values under the constitutive relation of the aforementioned power-exponential function is shown in Figure 6. There is good correlation of the calculated and measured values, and the correlation coefficient is 0.97414.

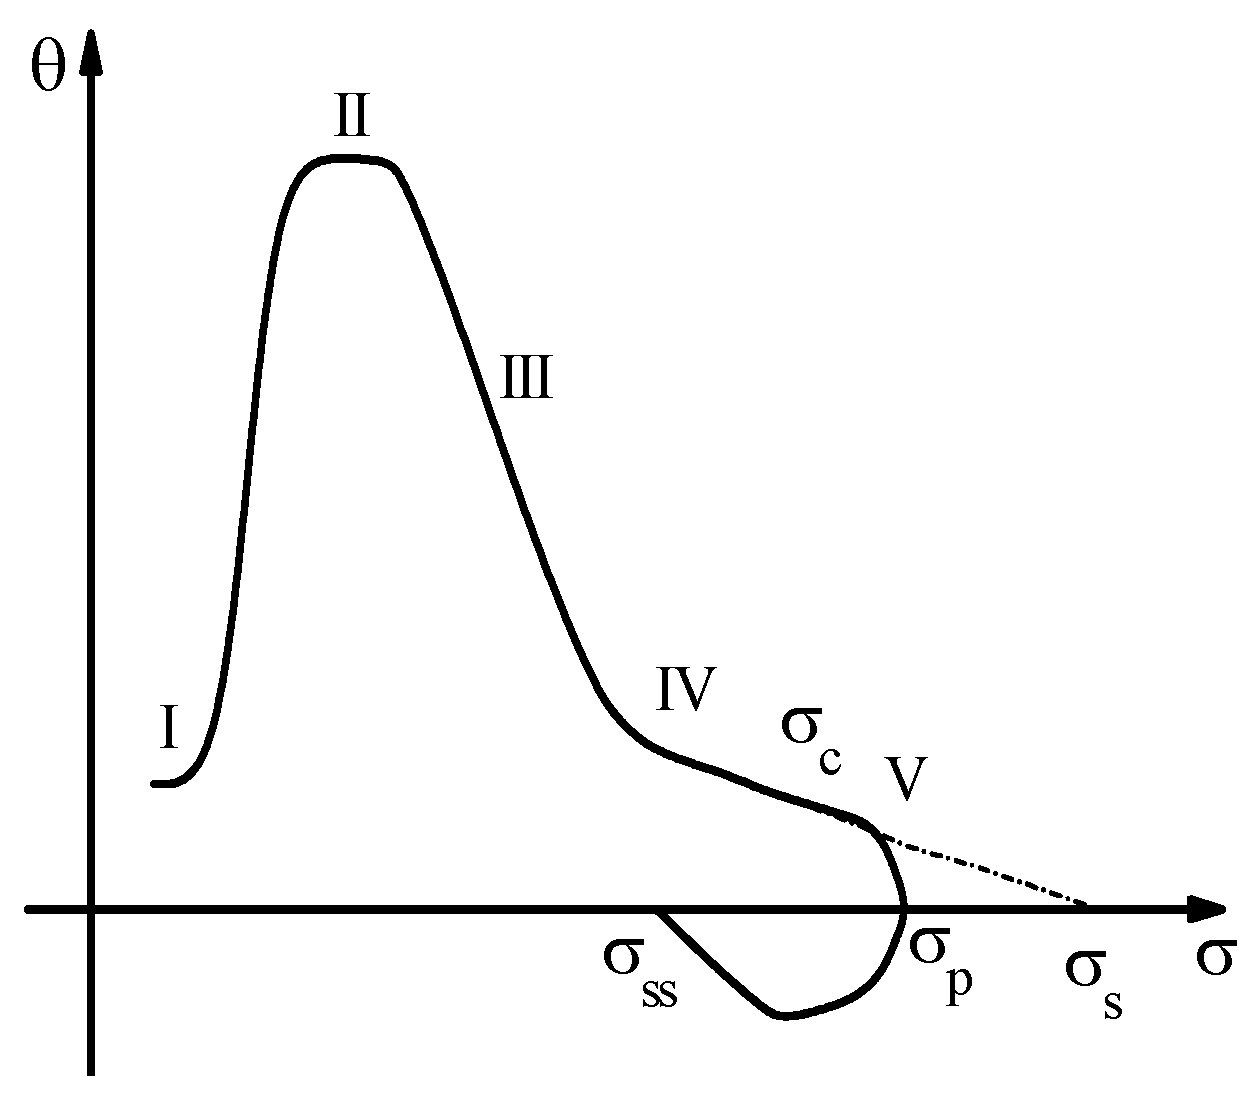
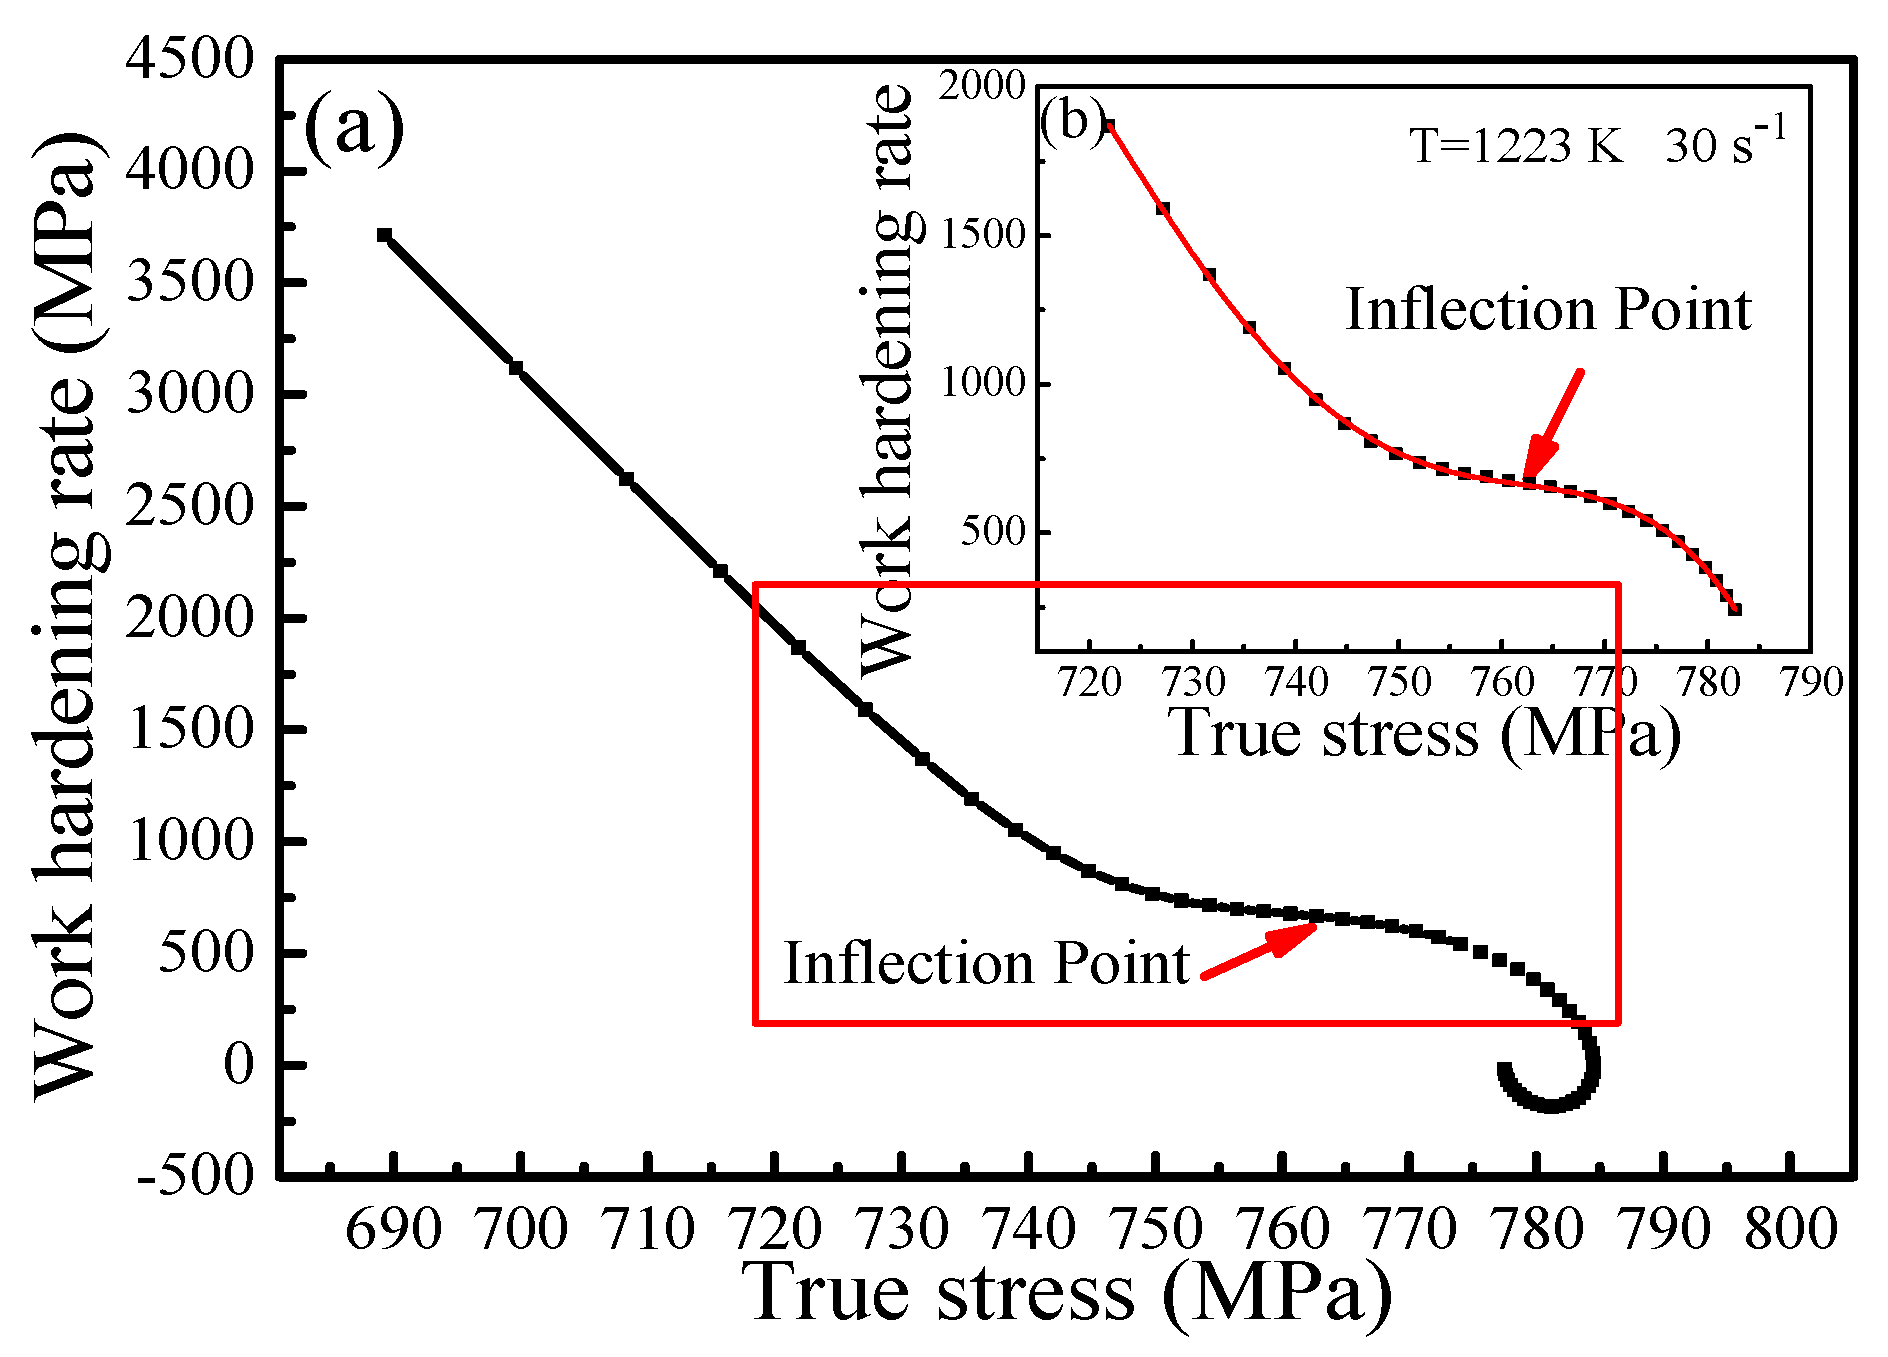
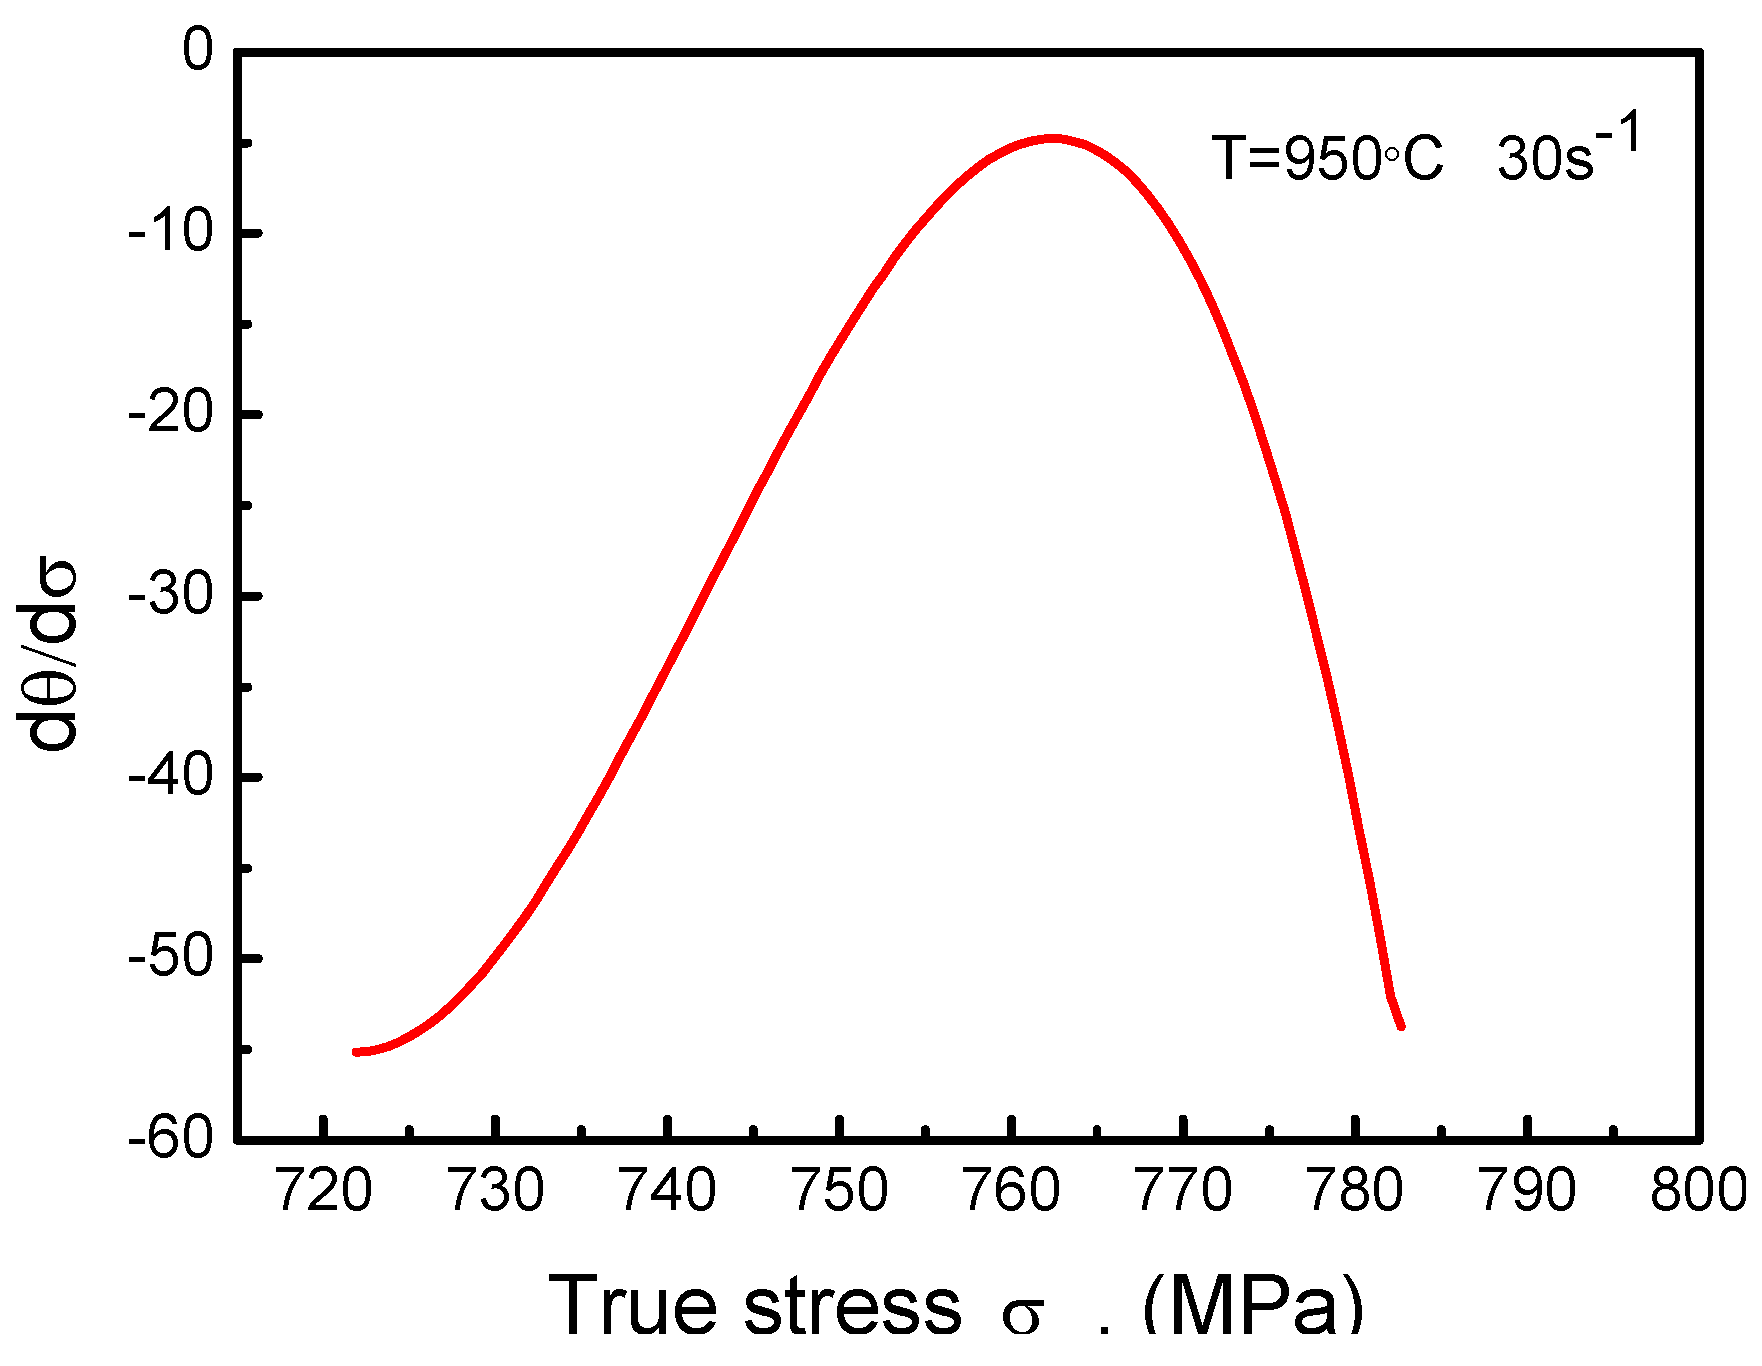
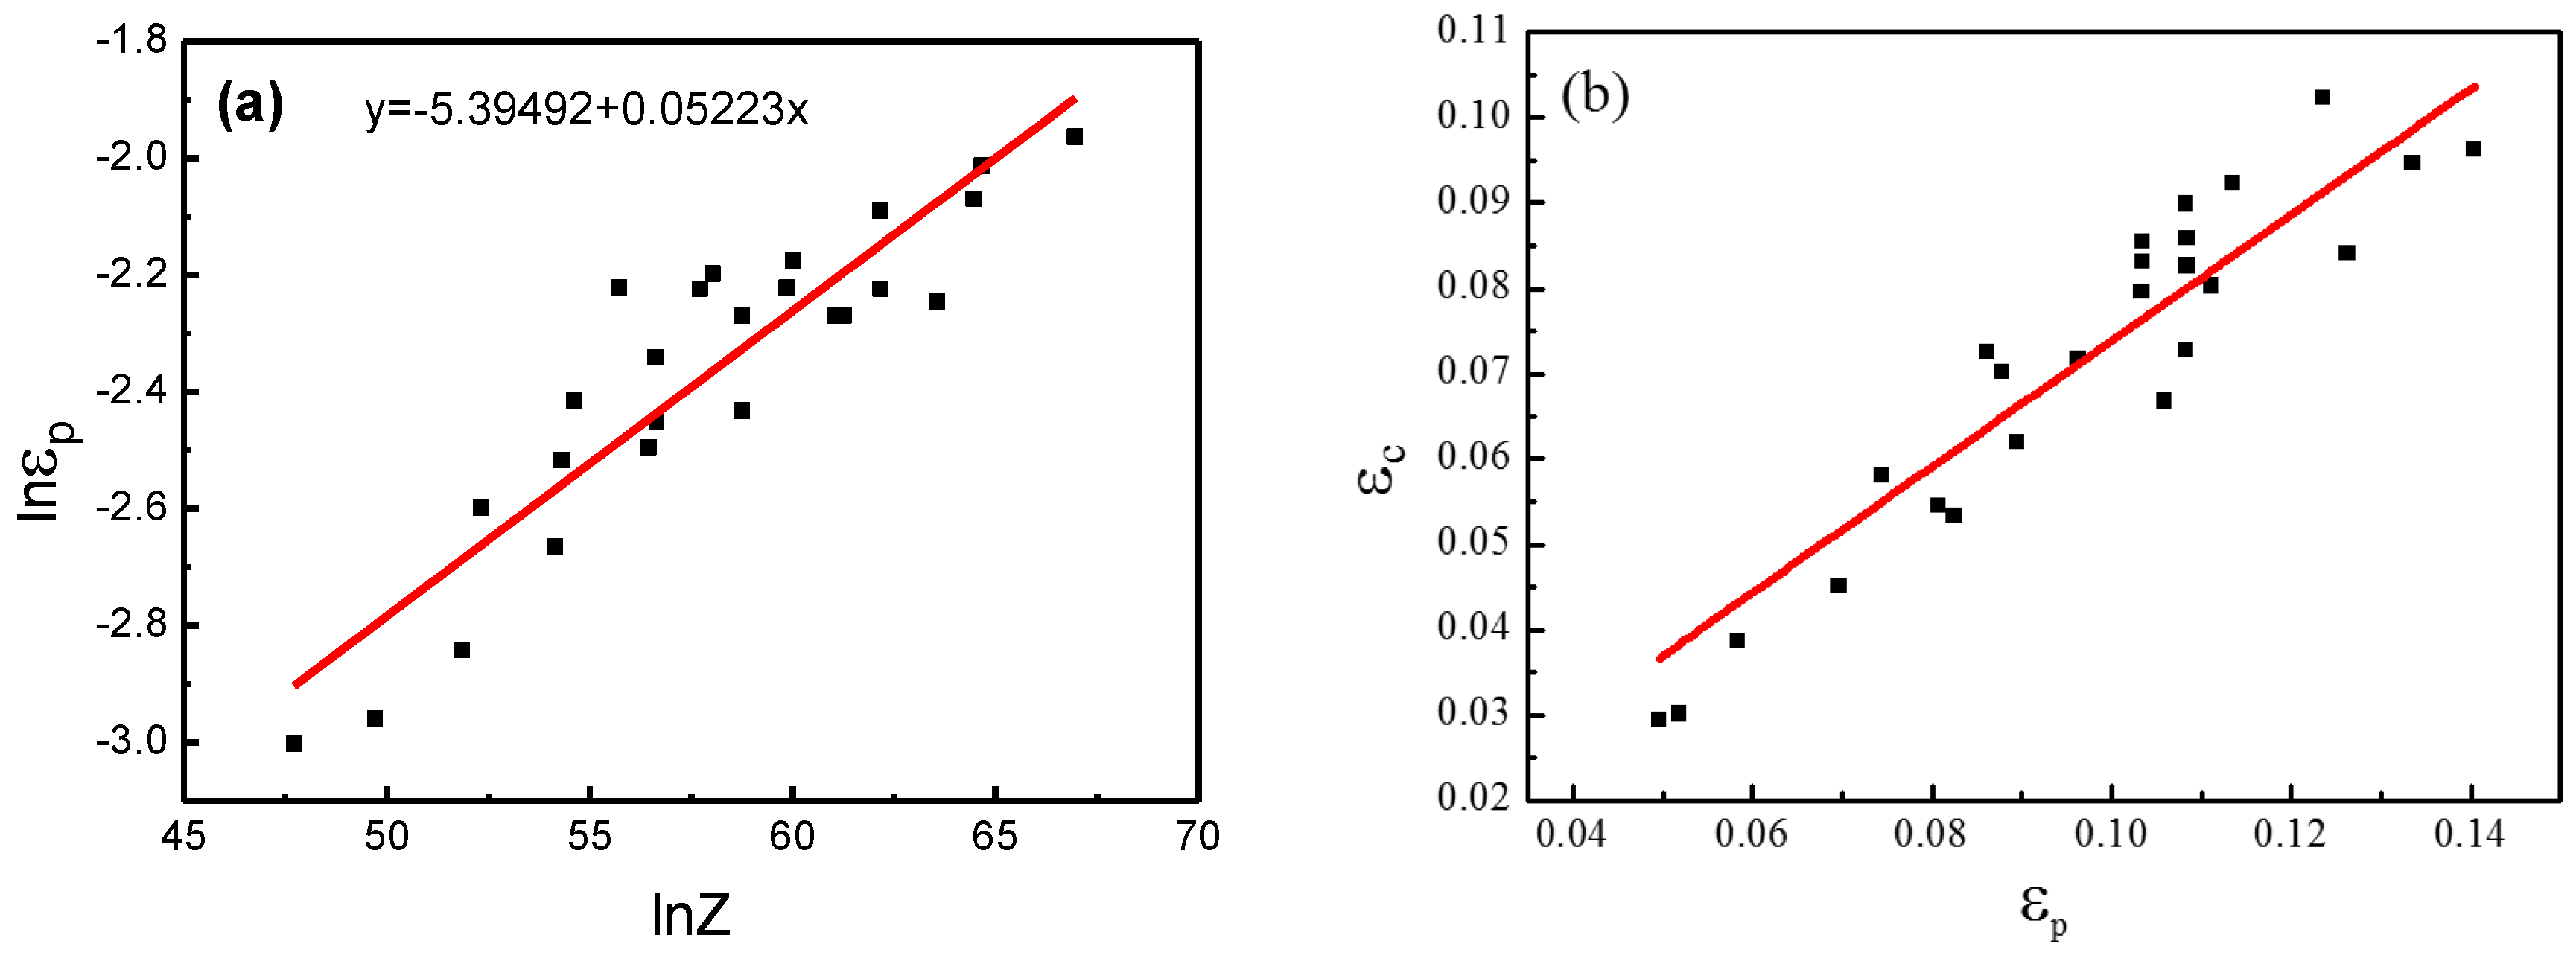
3.3. Determination of the Critical Strain

It is well known that the critical strain of DRX is indispensable data to calculate the recrystallization volume fraction. When the strain reaches a critical level, DRX will occur, so critical strain is an important parameter of DRX. Although it can be obtained from metallographic testing, this requires a great deal of work and often entails some measurement error, as well as difficulty in the observation and analysis of metallographic models [36,37]. Lin et al. [38] applied an empirical model (εc = 0.8 εp) to establish a flow stress constitutive model considering DRX. In fact, the empirical model could have large errors because it is very difficult to guarantee the applicability of an empirical model to a particular material. In recent years, some researchers put forward mathematical models to determine critical DRX strain: Poliak and Jonas [39] put forward a critical condition that is based on the one-way principle of thermodynamics and determined that the dynamic critical condition was corresponding to the minimum value in the plot of −∂θ/∂σ~σ and the inflection point on the curve of θ~σ (or lnθ~ε). The value of k (εc = k εp) was summarized as 0.618 for AISI 304 stainless steel [40], and it was determined to be 0.81 for AZ31B alloy [41]. Xu and Peng et al. [42] adopted the relationship between work-hardening and flow stress to determine the critical condition of DRX. Therefore, this paper will use the method of work-hardening rate θ (θ = dσ/dε) to determine the critical conditions of DRX of the superalloy.
The plots of θ~σ all show a turning point on the DRX softening stage, whether or not the stress peak appeared, as shown in Figure 7 [24]. Figure 7 illustrates work hardening rate versus flow stress variation. It can be seen that the θ~σ curve can be divided into five segments, and there is an inflection point in segments IV and V. The schematic shows that the work-hardening rate of the material decreases rapidly and becomes negative after the inflection point. Accordingly, the stress value of the inflection point is the critical stress, so the critical strain can be determined by the true stress–strain curve correspondingly. In addition, the value of the work-hardening rate is changed from positive to negative, which corresponds to the peak stress, and the slope of the stress-strain curve is zero.
We used the relationship between θ and σ to determine the critical condition of DRX of the superalloy. Considering the actual true stress-strain curve is not smooth, it is difficult to directly determine the accuracy value of θ. Firstly, a nonlinear fitting of the true stress-strain curve is necessary. Then, according to the fitting curve, θ is obtained. In this paper, the stress-strain curve under the deformation temperature of 1223 K and the strain rate of 30 s−1 is taken as an example to discuss the concrete steps to determine the critical conditions of the DRX. In order to fit the curve well, the critical strain value is lower than the peak one. Thus, selecting partial data before the peak stress to obtain the nonlinear fitting of the true stress-strain curve is an excellent idea. The fitting equation can be written as follows:
σ = 3.13487 × 10 8 ε 7 3.95426 × 10 8 ε 6 + 2.04824 × 10 8 ε 5 5.62187 × 10 7 ε 4 + 8.80879 × 10 6 ε 3 7.92089 × 10 5 ε 2 + 3.88259 × 10 4 ε 72.11378
By polynomial fitting the near partial curve of the inflection point in Figure 8a, the fitting curve can be obtained as shown in Figure 8b, and the fitting equation (Equation (12)) is expressed as follows:
θ = 3.79807 × 10 4 σ 4 + 1.12748 σ 3 1254.18557 σ 2 + 619566.6 σ 1.14676 × 10 8
The derivative of Equation (12) can be obtained as follows:
f ( σ ) = d θ / d σ = 1.51923 × 10 5 σ 3 + 3.38244 σ 2 2508.37114 σ + 619566.6
The relationship between dθ/dσ and σ can be obtained from Equation (13). When Equation (13) has a maximum value, the corresponding stress in the highest point of the Figure 9 is the critical stress, and σc = 762.4 MPa is obtained. Then, from the true stress–strain curves, the critical strain can be obtained from the corresponding critical stress, i.e., εc = 0.09623. According to the above method, the critical stress and corresponding critical strain can be obtained under other temperatures and strain rates.
Generally, the critical strain model of the DRX can be written in the following form [24]:
ε c = k ε p
ε p = a 1 × Z a 2
where εc is the critical strain of DRX, εp is the peak strain, a1 and a2 are material constants, and Z is the Zener-Hollomon parameter. In order to determine the unknown parameters of the Equations (14) and (15), the plots of lnεp-lnZ and εcp are shown as follows in Figure 10.
Through the analysis of the above, the critical strain model of the DRX of the superalloy can be obtained as follows (Equation (16)):
{ ε c = 0.73866 ε p ε p = 4.5396 × 10 3 Z 0.05223 ε c = 3.3532 × 10 3 Z 0.05223

3.4. Constitutive Model of Flow Stress

It can be found from the analysis of the true stress-strain curves for the material that the flow stress of the nickel-based superalloy can be divided into three stages. Figure 11 is a general schematic of stress-strain curves during the occurrence of recrystallization and the only occurrence of recovery in the deformation process of alloy [12]. In what follows, the constitutive model of flow stress for the nickel-based superalloy will be divided into two parts [13,14]: Part I. The constitutive model based on work hardening and DRV; Part II. The constitutive model based on DRX.

3.4.1. Part I. Constitutive Model Based on Work Hardening and Dynamic Recovery

Considering the work hardening and DRV, the evolution of the dislocation density with strain is generally controlled by the competition between the multiplication and annihilation of dislocation, and the dislocation density are depended on strain, which can be expressed by [14,43]:
d ρ d ε = U Ω ρ
where ρ is the dislocation density. U represents the dislocation multiplication caused by work hardening due to plastic deformation, and can be regarded as a constant with respect to strain; Ωρ represents the dislocation annihilation caused by DRV and Ω is often called the DRV coefficient [8]. Integrating Equation (17) gives:
ρ = U Ω ( U Ω ρ 0 ) exp ( Ω ε )
where ρ0 is the initial dislocation density. It is known that the effective stress is negligible compared to the internal stress at high temperature [44]. Thus, the applied stress can be related approximately to the square root of dislocation density:
σ = α μ b ρ
where α is a material constant, μ is the shear modulus, and b is the distance between atoms in the slip direction. Substituting Equation (19) into Equation (18), the flow stress of the studied alloy during the work-hardening and DRV period can be represented as:
σ = σ s 2 + ( σ 0 2 σ s 2 ) exp ( Ω ε )
where σ is the flow stress and σ0 and σs are the yield stress and the saturated stress due to DRV, respectively. σ0 and σs are equal to α μ b ρ 0 and α μ b U / Ω , respectively.
Obviously, in order to calculate the flow stress, the three parameters of σ0, σs, and Ω need to be determined. Usually, σs can be determined as the horizontal intercept of the tangent line of θ-σ plot through the inflection point, as shown in Figure 7. Figure 12 shows that there is a good linear relationship between σp and σs; the mathematical expression of this relationship can be expressed as:
σ s = 11.02788 + 0.99971 σ p
The σ0 at different deformation temperatures and strain rates can be directly obtained from the true stress-strain curves. Figure 13 shows the relationship between the σ0 and Zener-Hollomon parameter (Z). Thus, σ0 can be expressed as Equation (22). Figure 14 shows the relationship between Ω and Zener-Hollomon parameter. Ω can be expressed by Equation (23):
σ 0 = 2225.39918 104.61726 ( ln Z ) + 1.22546 ( ln Z ) 2
ln Ω = 1.82268 + 0.01213 ln Z
Therefore, the constitutive model of the superalloy during the work hardening and DRV period of thermal deformation can be determined through Equation (24):
{ σ = σ s 2 + ( σ 0 2 σ s 2 ) exp ( Ω ε ) σ s = 11.02788 + 0.99971 σ p σ 0 = 2225.39918 - 104.61726 ( ln Z ) + 1.22546 ( ln Z ) 2 ln Ω = 1.82268 + 0.01213 ln Z Z = ε ˙ exp [ 646.341 / ( R T ) ]

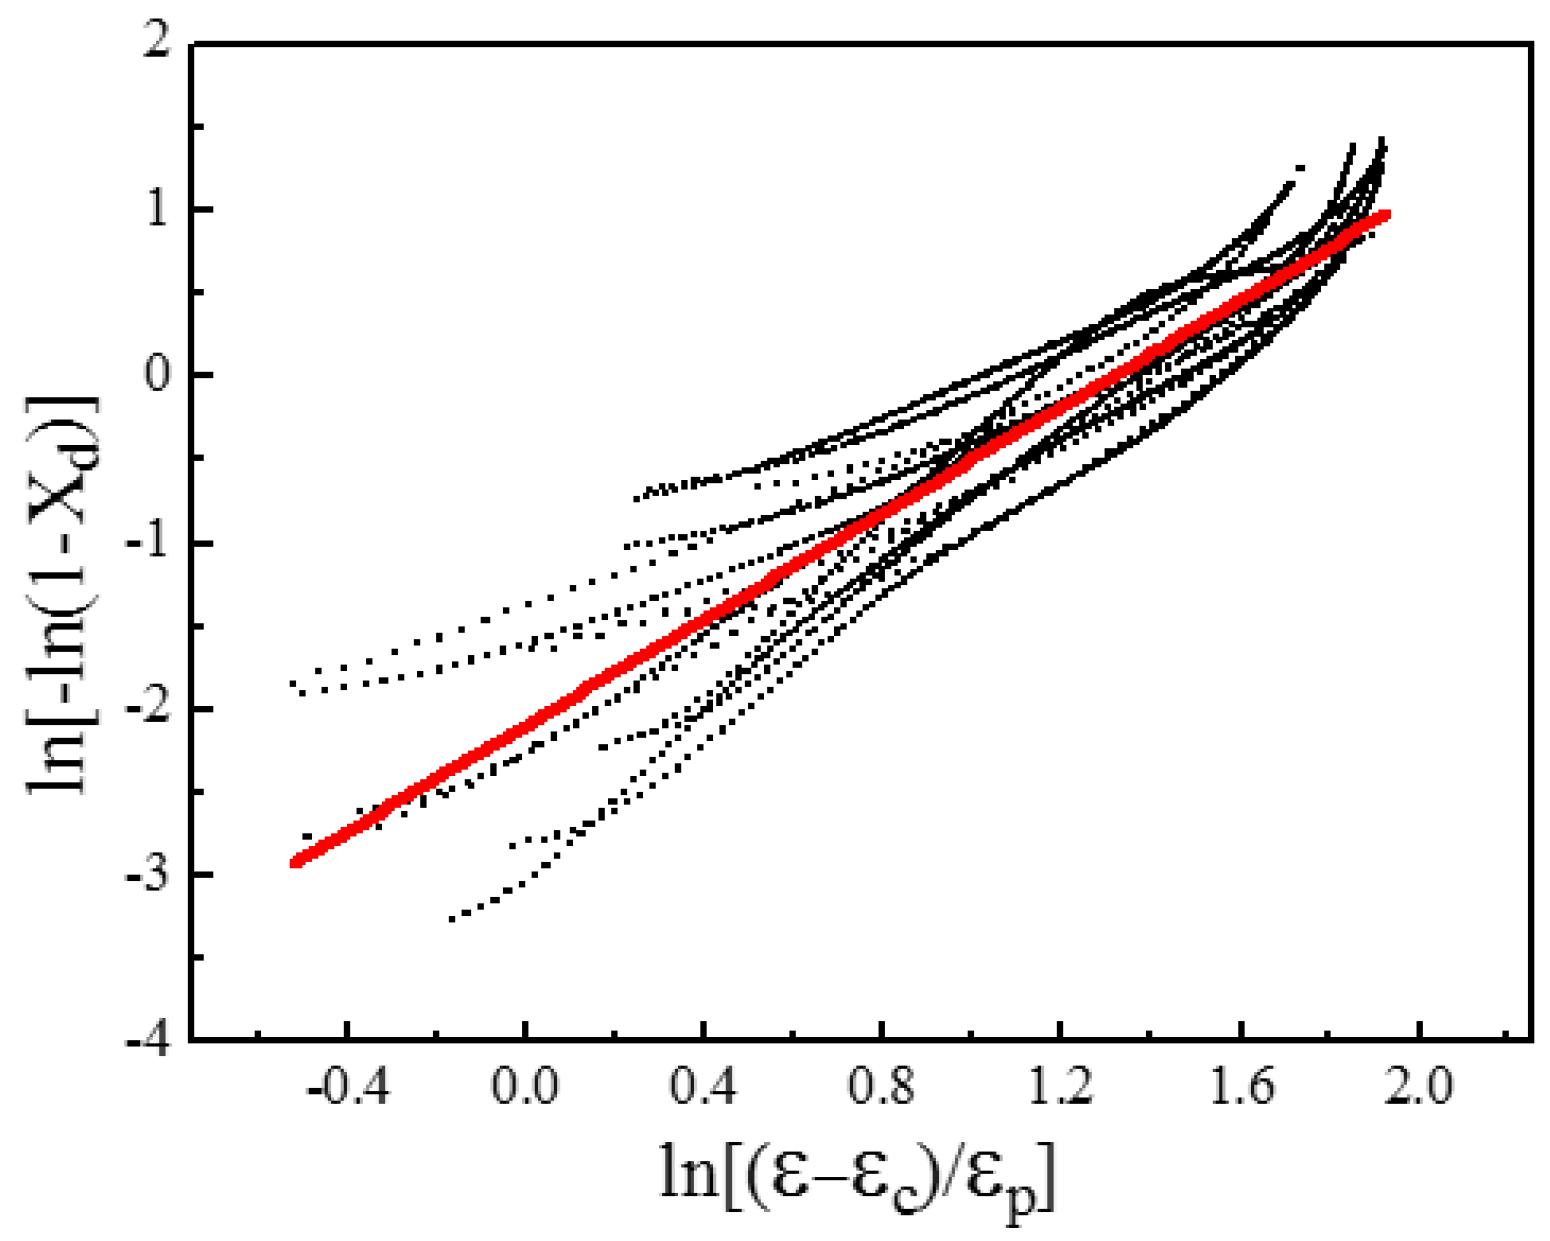
3.4.2. Part II. Constitutive Model Based on Dynamic Recrystallization

In the thermal deformation process, with the increase of the strain, the internal microstructure of the superalloy changes continuously. When the strain exceeds the critical strain, DRX occurs, nucleates, and grows gradually. Especially under the higher deformation temperature and lower strain rate, DRX occurs more easily.
It can be seen that the volume fraction of DRX can be estimated by using the extrapolation method on flow stress data from Figure 7 and Figure 11. The DRX volume fraction can be expressed as Equation (25):
X d = σ s σ σ s σ ss
where Xd is the DRX volume fraction, σs is the saturated stress on the curve of only recovery, σss is the steady stress on the curve of DRX, and σ is the corresponding stress at any time when the DRX occurs.
The saturated stress σs and the steady stress σss can be expressed as follows:
sinh ( α σ s ) = n 3 × Z n 4 sinh ( α σ ss ) = n 5 × Z n 6
where n3, n4, n5 and n6 are the material constants. Taking the natural logarithm of both sides of Equation (26) leads to:
ln [ sinh ( α σ s ) ] = ln n 3 + n 4 ln Z
ln [ sinh ( α σ ss ) ] = ln n 5 + n 6 ln Z
Eventually, the values of the material constants are obtained from the plots of ln [ sinh ( α σ s ) ] - ln Z and ln [ sinh ( α σ ss ) ] - ln Z (Figure 15a,b).
Therefore, the DRX volume fraction can be derived as the following equations:
{ X d = σ s σ σ s σ ss σ s = 259.835 × sinh 1 ( 7.793 × 10 6 Z 0.20971 ) σ ss = 259.835 × sinh 1 ( 5.145 × 10 5 Z 0.17486 )
It is well known that the conventional DRX kinetics is often modeled on the well-known equation as follows [14,35]:
X d = 1 exp [ k 1 × ( ε ε c ε p ) k 2 ] ( ε ε c )
Here, k1 and k2 are the material constants, εp is the peak strain, and εc is the critical strain of the DRX. In order to determine the material constants (k1 and k2), Equation (30) can be simply deduced as follows:
ln [ ln ( 1 X d ) ] = ln k 1 + k 2 ln ( ε ε c ε p )
By combining Equations (16) and (29), it is easy to attain the relationship between Xd and strain ε from Equation (31) through linear analysis as shown in Figure 16.
That is to say, the kinetic model of DRX of the superalloy is as follows:
X d = 1 exp [ 0.12424 × ( ε ε c ε p ) 1.59399 ]
Therefore, the constitutive model of the superalloy during DRX period of thermal deformation can be determined as:
{ σ = σ s - ( σ s - σ ss ) { 1 exp [ 0.12424 × ( ε ε c ε p ) 1.59399 ] } σ s = 259.835 × sinh 1 ( 7.793 × 10 6 Z 0.20971 ) σ ss = 259.835 × sinh 1 ( 5.145 × 10 5 Z 0.17486 ) ε p = 4.5396 × 10 3 Z 0.05223 ε c = 3.3532 × 10 3 Z 0.05223
From Equations (16) and (29), we know that the critical strain for recrystallization and the steady state stress are all affected by the deformation temperature and strain rate. Figure 17a,b show how the temperature and strain rate affect the critical strain model and steady stress, model respectively.

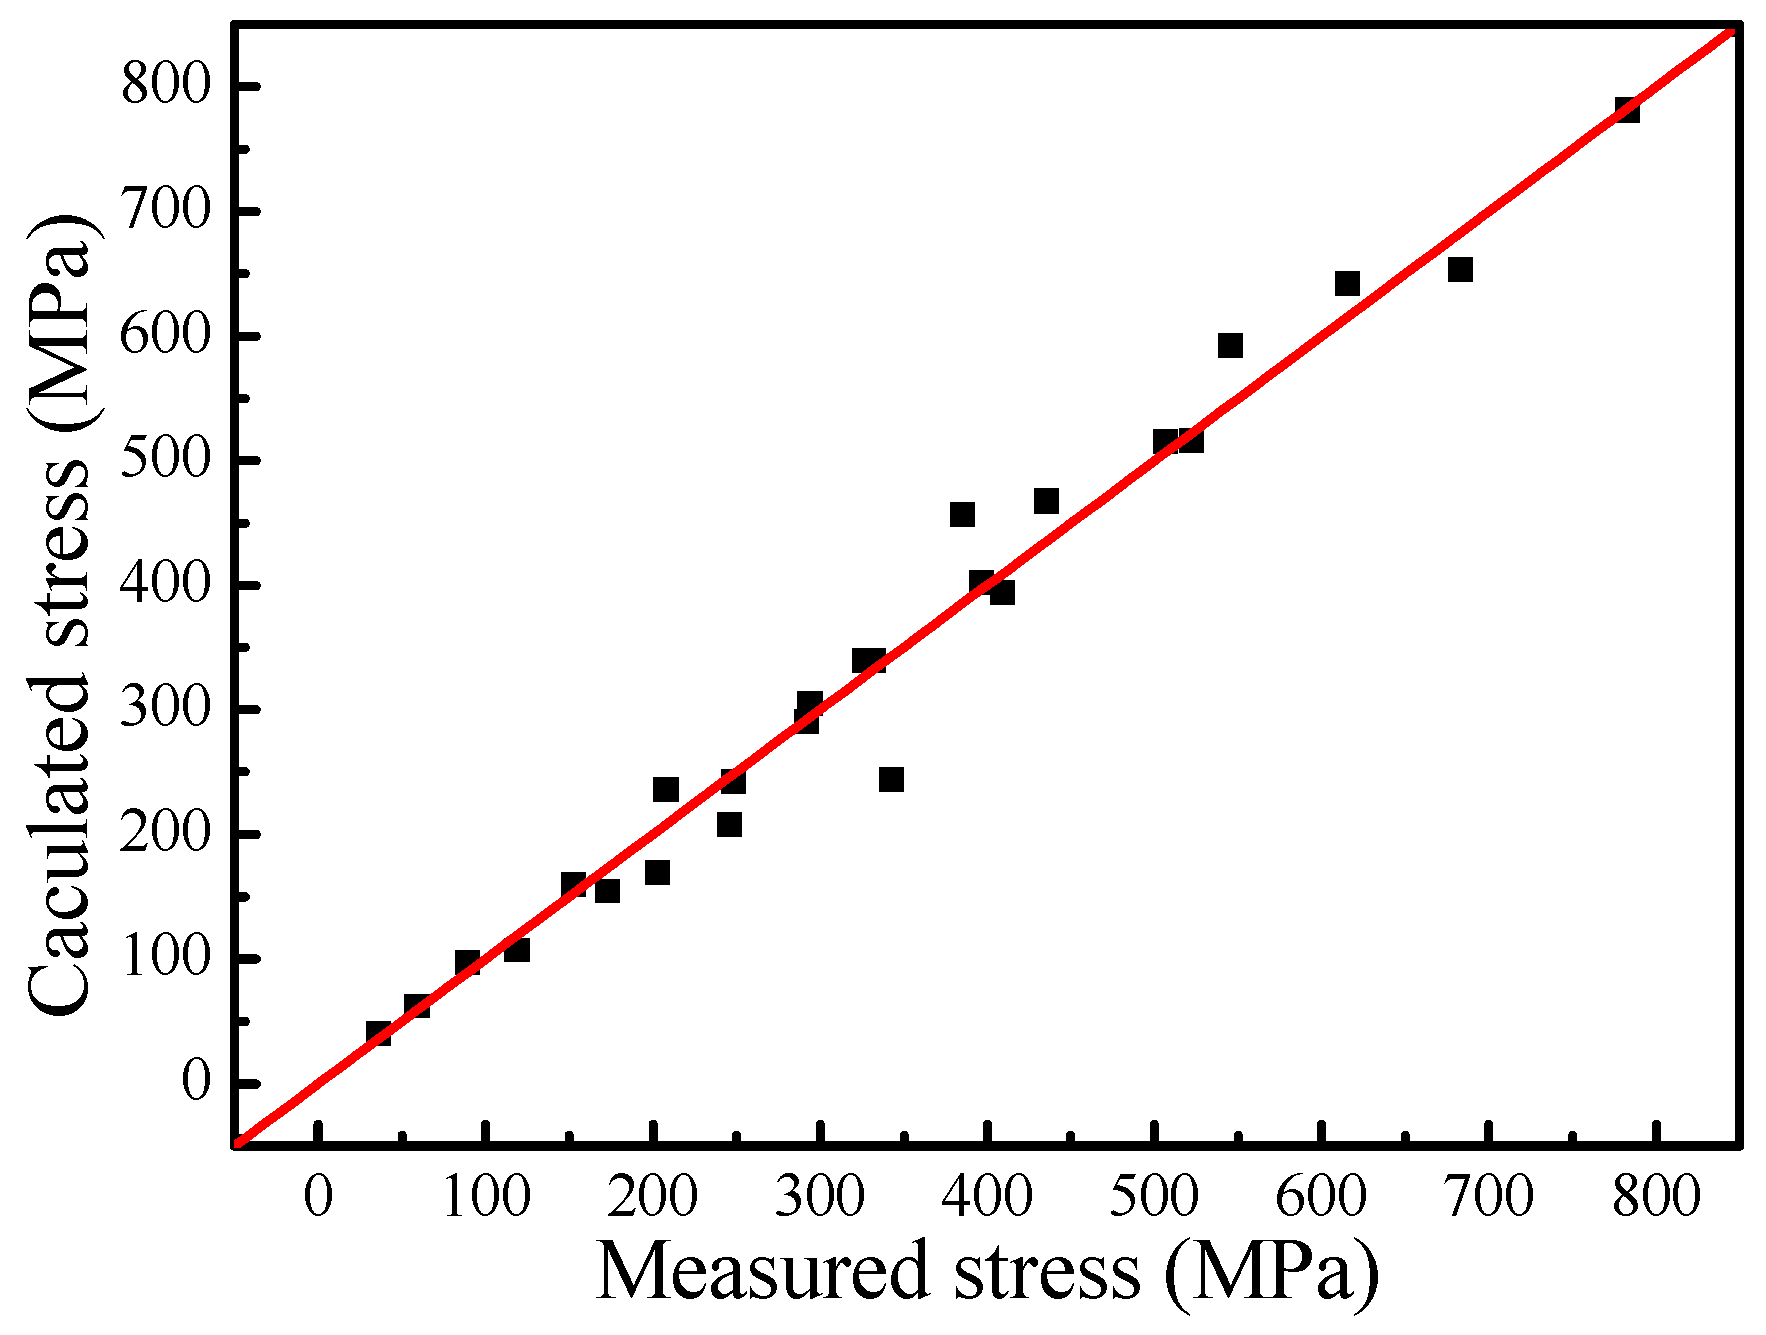
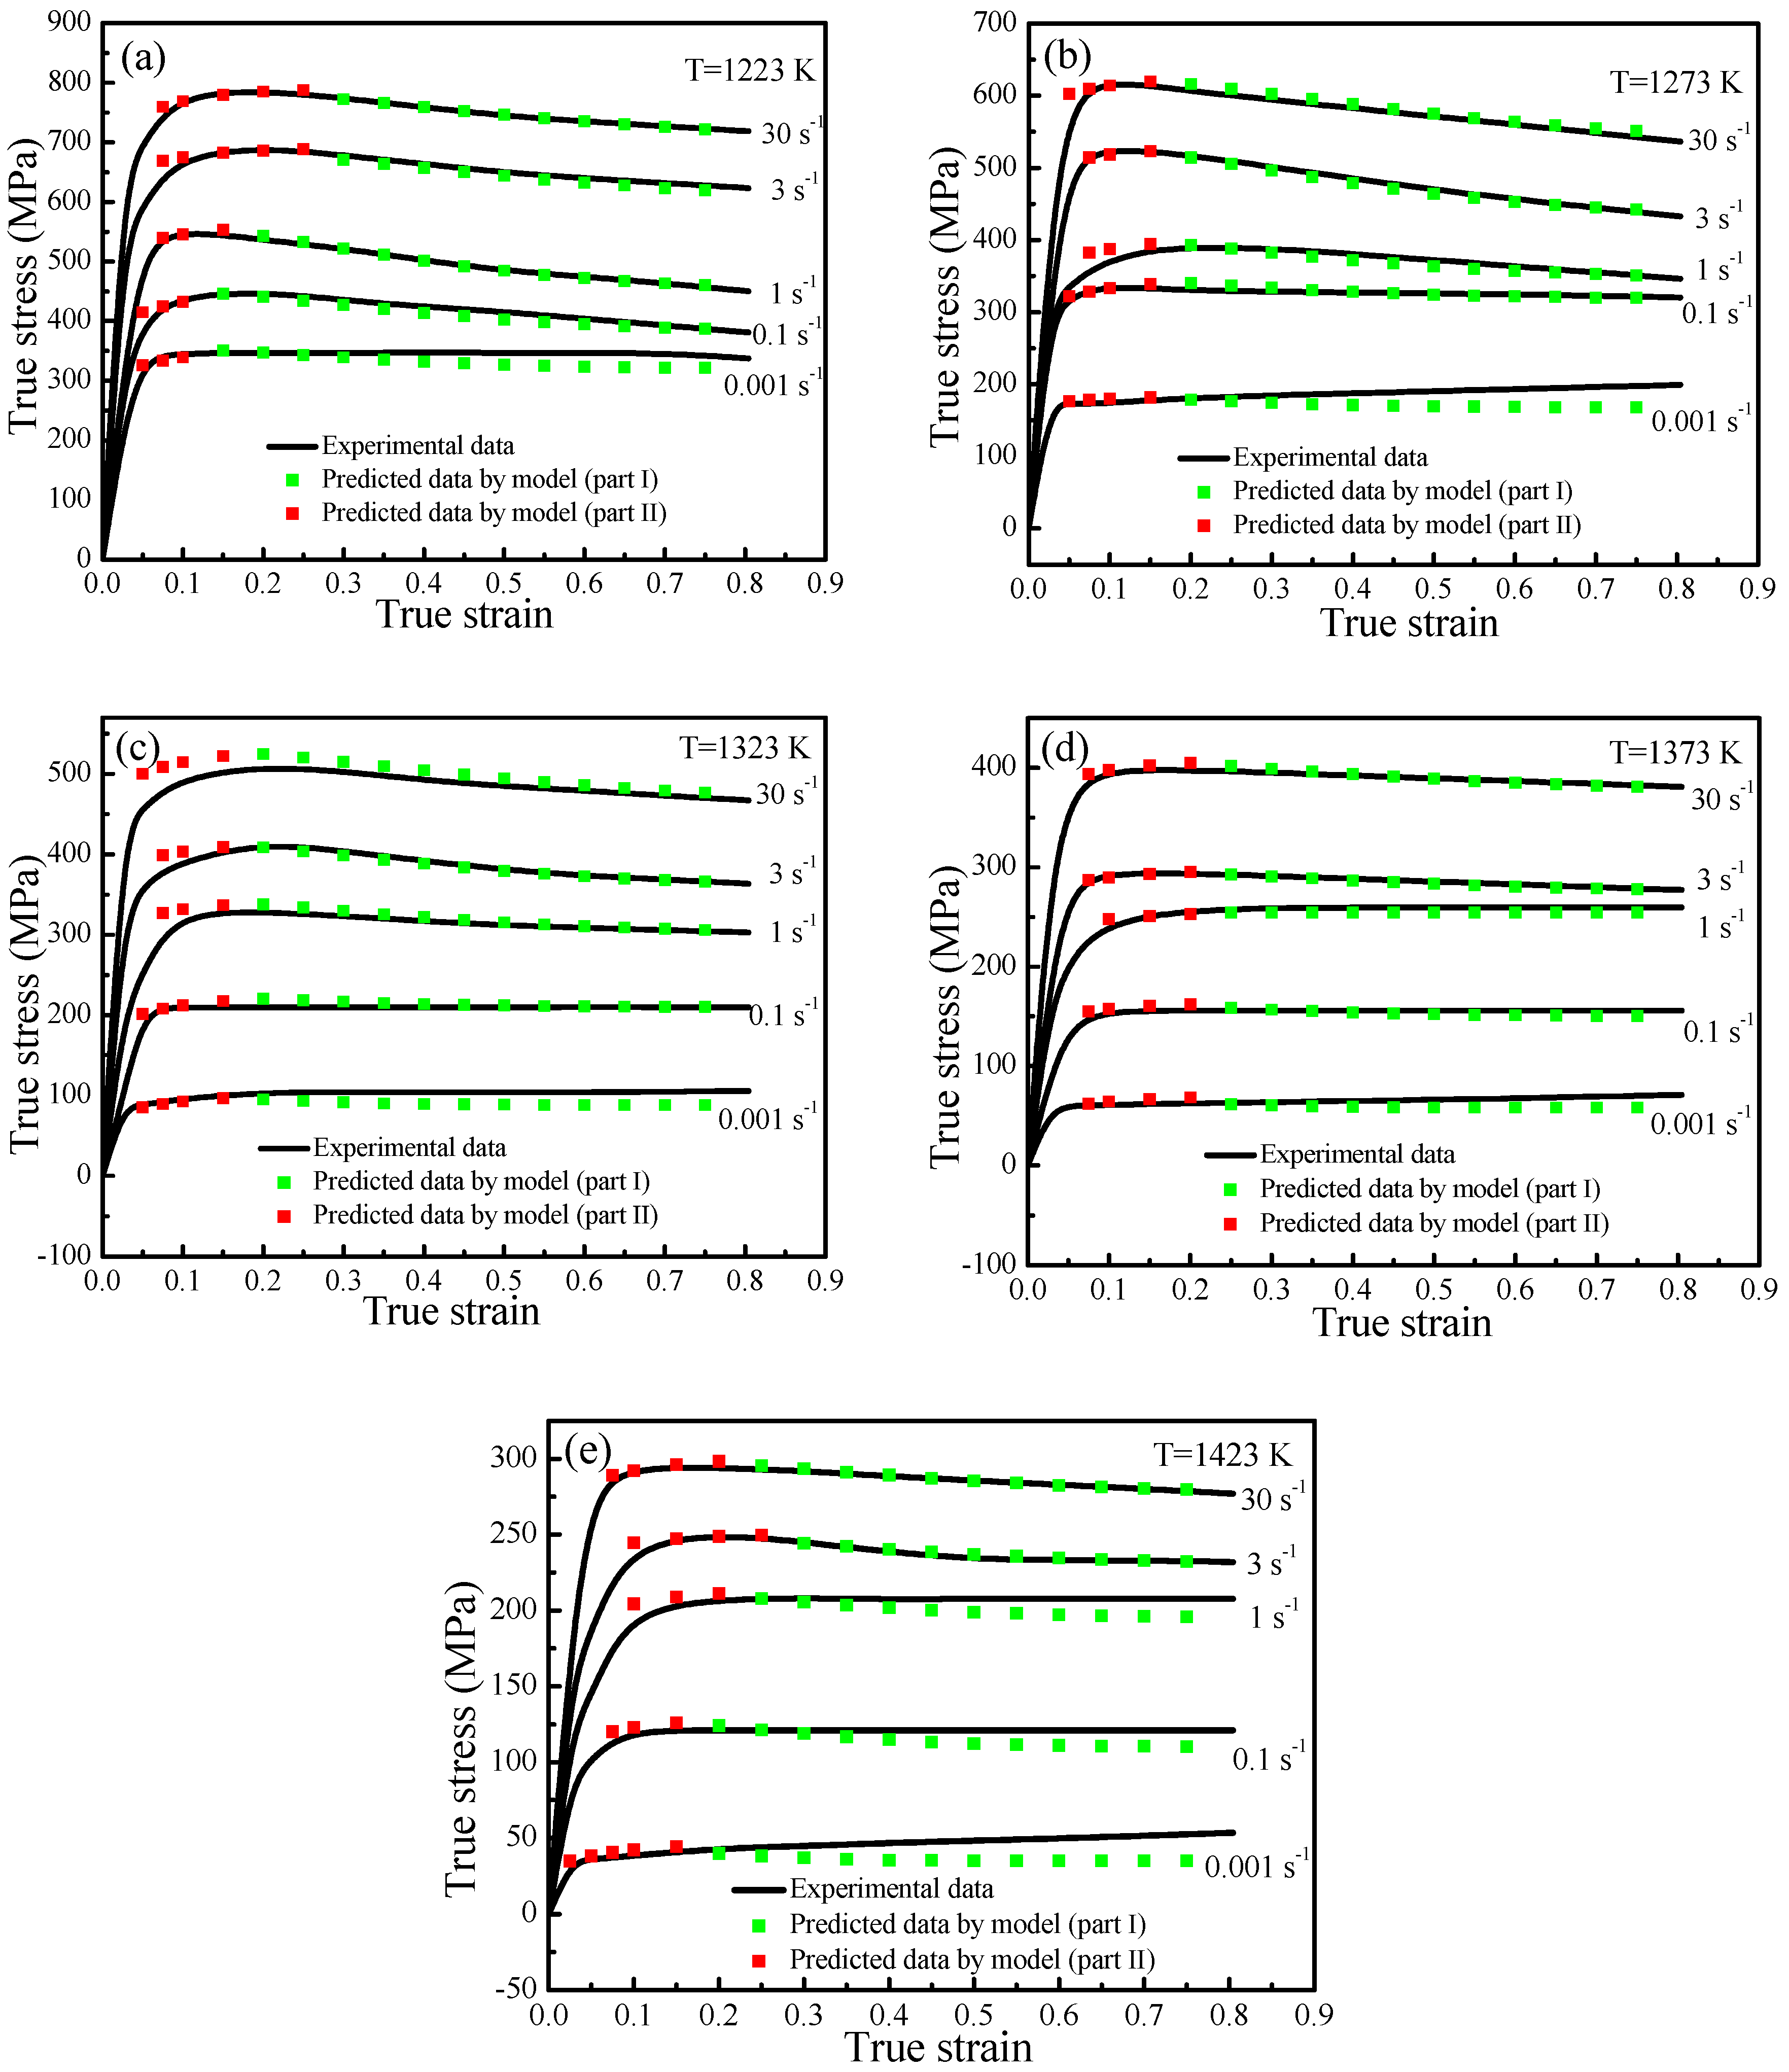
3.4.3. Verification of the Developed Constitutive Model

In order to verify the developed constitutive model for the superalloy, a comparison of the experimental data and predicted flow stress data by the model under the different test deformation conditions is shown in Figure 18. It indicates that the predicted flow stress data are in good agreement with the experimental data. Especially, the developed constitutive model considering DRX has higher accuracy. However, there is larger relative deviation between the predicted and experimental data for the developed constitutive model considering work hardening and DRV. The reasons for this phenomenon can be explained form the following two aspects. On the one hand, there are not obvious yield points on the true stress–strain curves of the superalloy, which makes it difficult to obtain more accurate yield stress. On the other hand, the calculation procedure contains many multiple steps of polynomial fitting, which may greatly decrease the accuracy of the model.
The accuracy of the constitutive model can also be expressed by quantitative parameters, such as correlation parameters R and AARE. They are expressed as:
R = i = 1 N ( E i E ¯ ) ( P i P ¯ ) i = 1 N ( E i E ¯ ) 2 i = 1 N ( P i P ¯ ) 2
A A R E ( % ) = 1 N i = 1 N | E i P i E i | × 100
where Ei is the experimental value, Pi is the predicted value, and N is the number of data points used. The correlation coefficient is a commonly used statistical parameter and provides information about the strength of the linear relationship between the experimental and the calculated values.
In order to further evaluate the prediction accuracy of the developed constitutive model, the scatter map of the predicted and experimental flow stress data for all the tested conditions are shown in Figure 19. The calculated correlation coefficient (R) is 0.998, which indicates that there is a good correlation between the predicted and experimental data. Meanwhile, the average absolute relative error (AARE) is only 3.58%, which indicates that the developed model has very good prediction capability. Therefore, the developed constitutive model can be used to describe the flow behavior of the nickel-based superalloy under thermal deformation conditions.

4. Conclusions

(1)
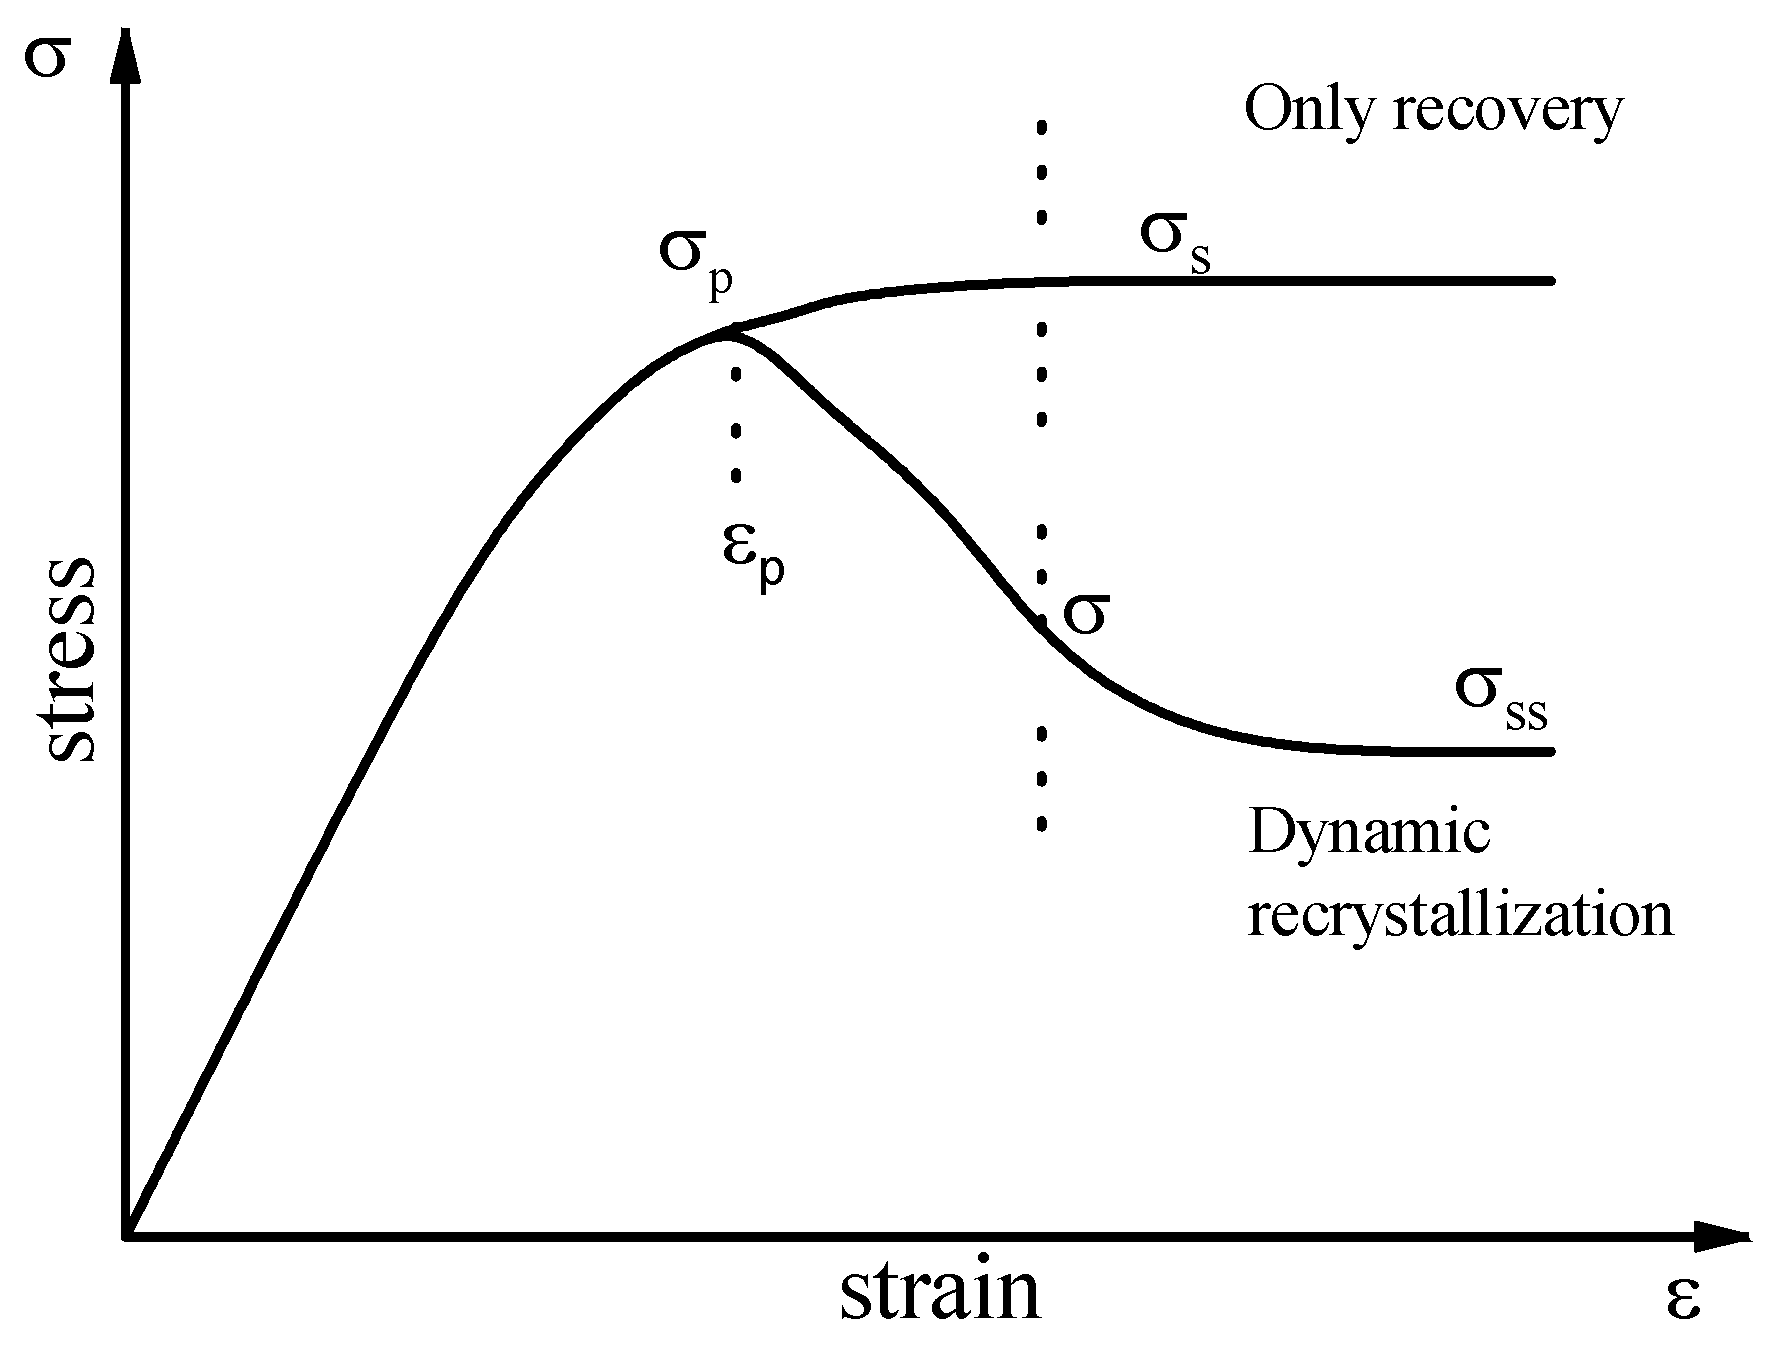
The flow stress of the nickel-based superalloy is significantly sensitive to the deformation temperature and strain rate under all experimental conditions. The flow stress decreases with the increase of temperature and the decrease of strain rate. In addition, DRX occurs more easily under higher deformation temperature and lower strain rate in the process of thermal deformation.
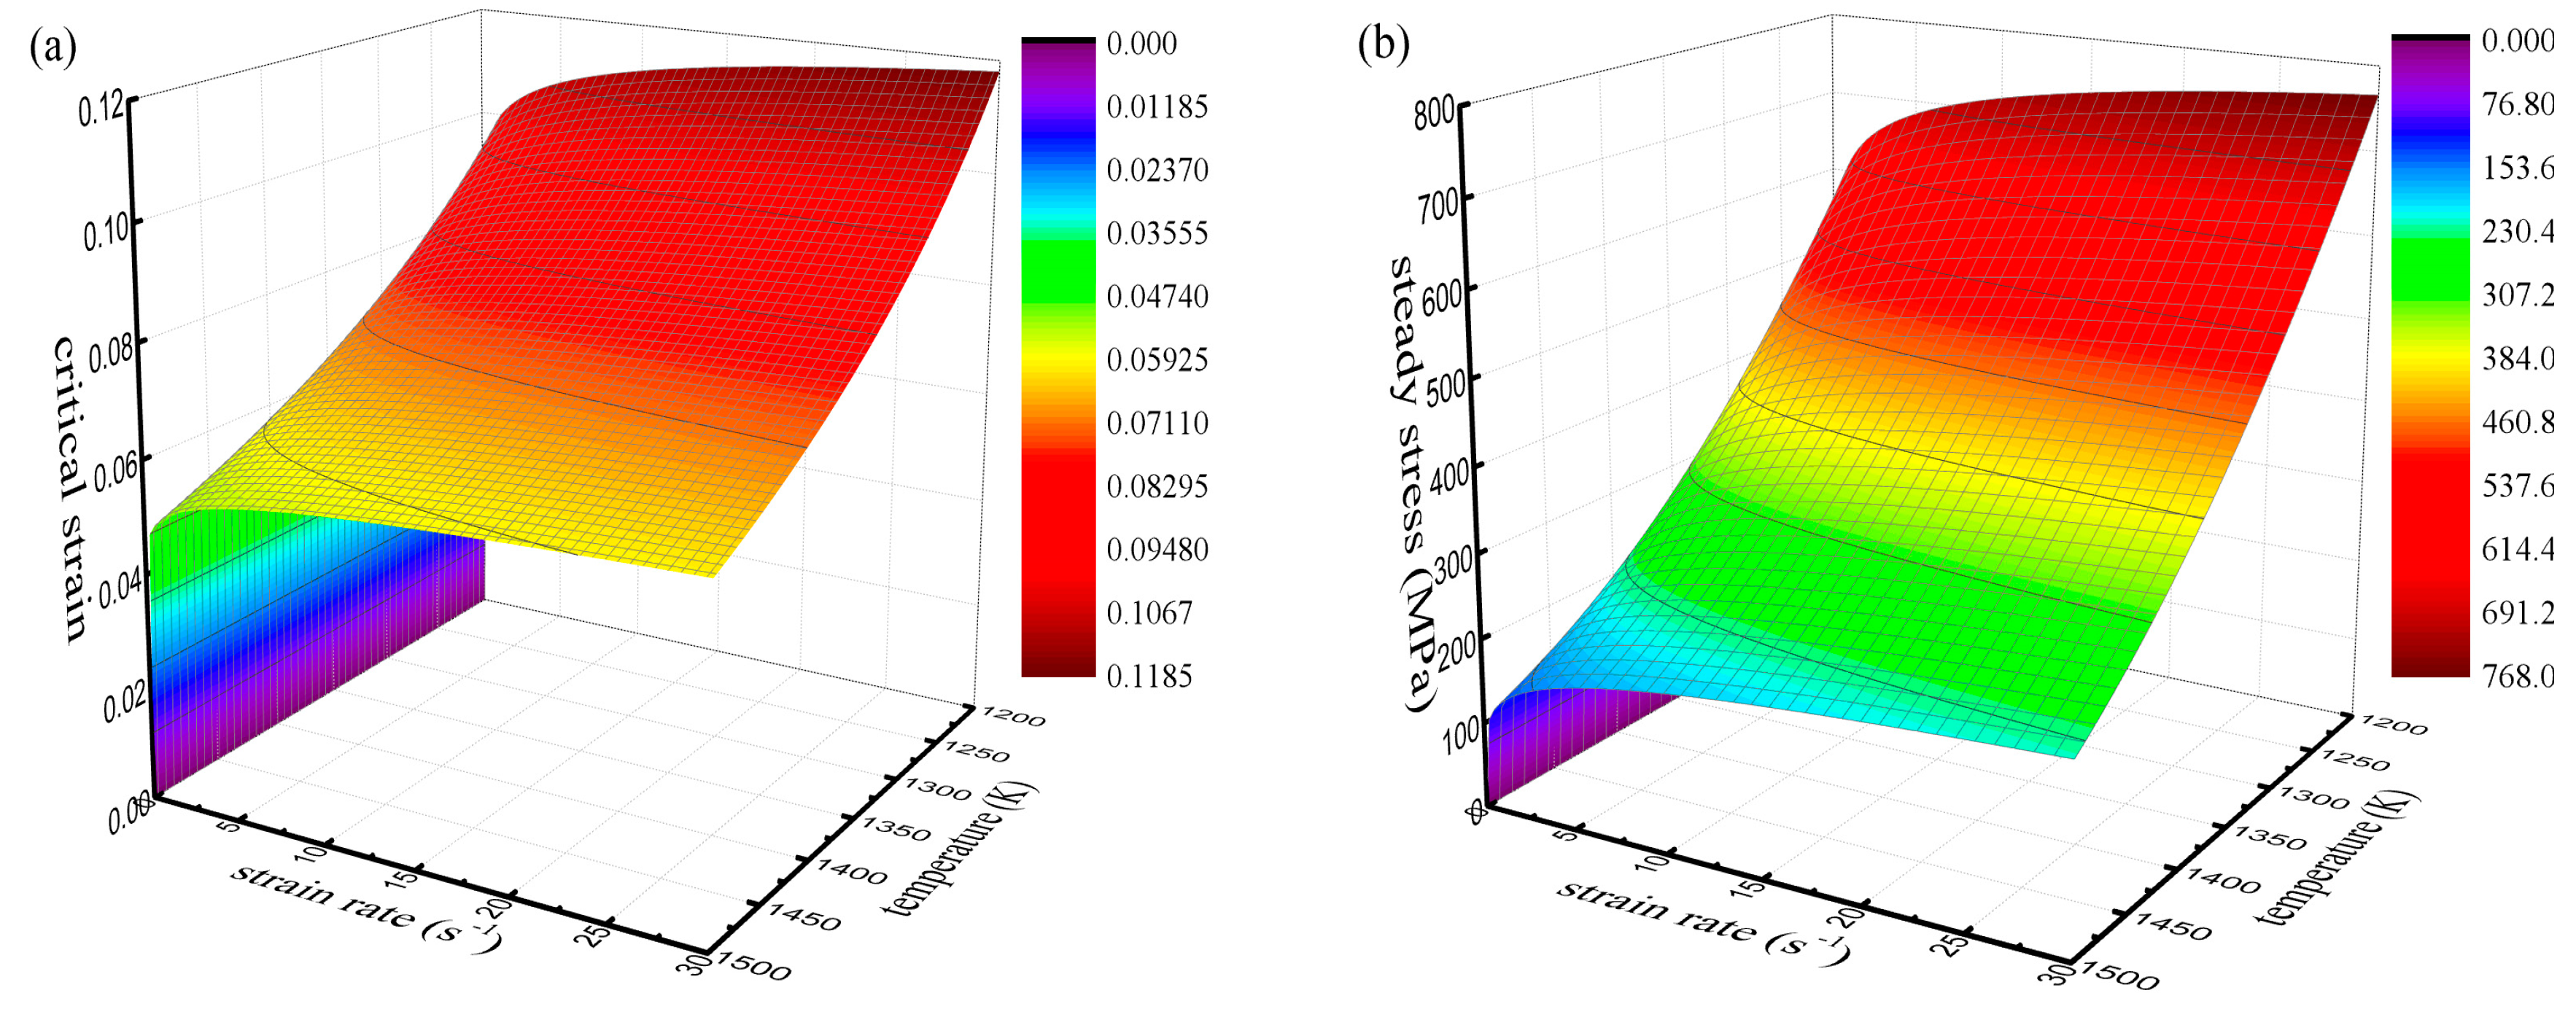
(2)
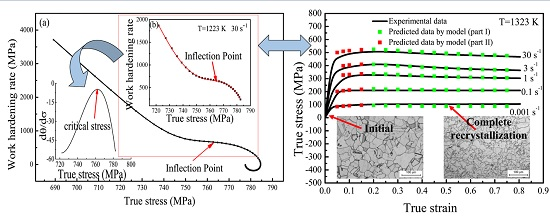
Critical strain of DRX is indispensable data to calculate the recrystallization volume fraction. The stress value of the inflection point is the critical stress. Based on the conventional work-hardening rate curves, the critical strain model can be determined by analyzing the θ~σ curve. There is a good linear relationship between peak strain and critical strain. This method for determining the critical strain is also more conducive to the establishment of a flow stress constitutive model.
(3)
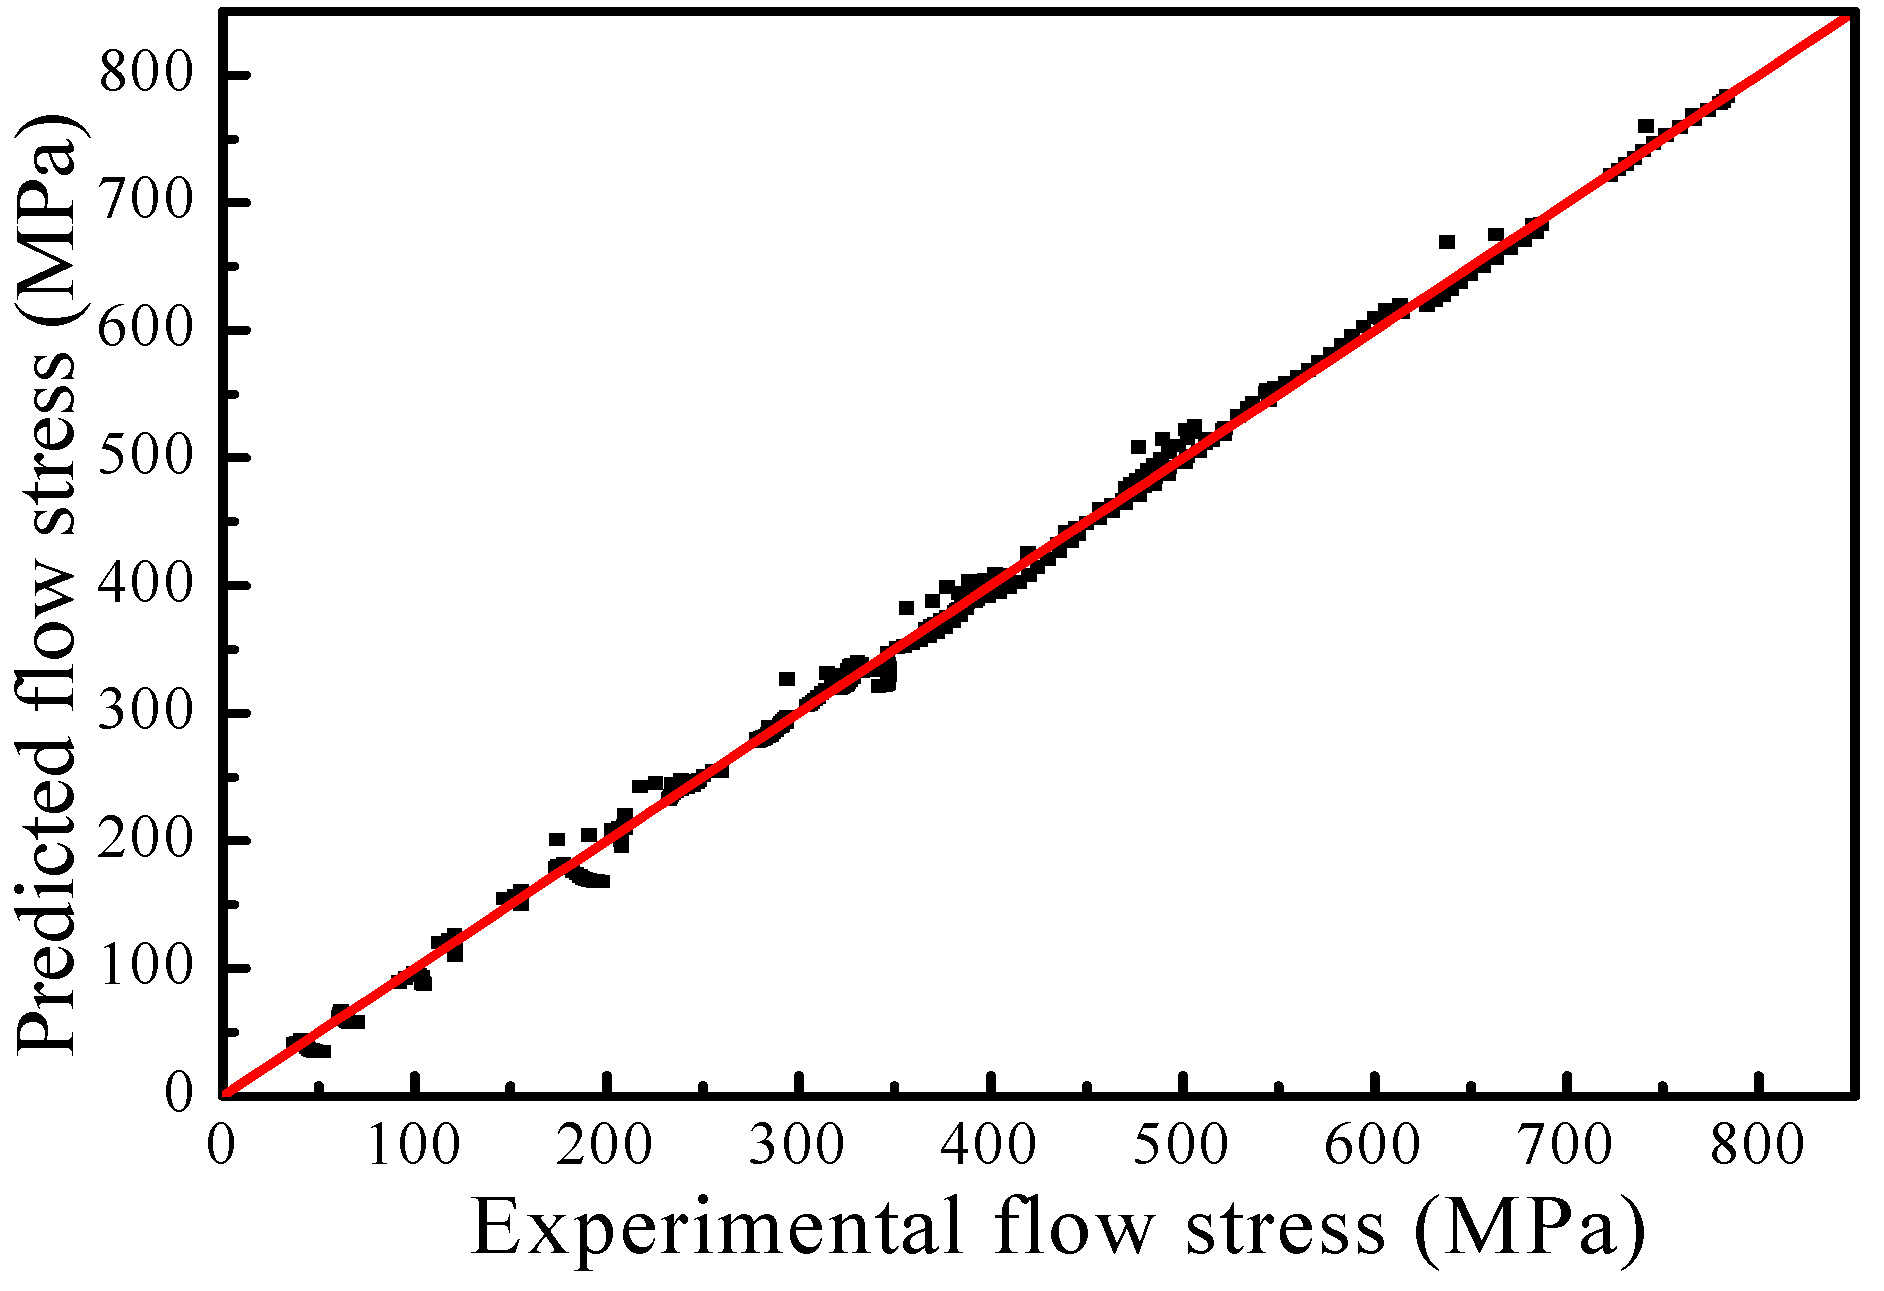
Based on the dislocation density theory and kinetics of DRX, the constitutive model of flow behavior for the nickel-based superalloy can be divided into two parts: Part I. The constitutive model based on work hardening and dynamic recovery. Part II. The constitutive model based on DRX. Comparisons between the predicted and experimental flow stress under different deformation conditions indicate that the developed constitutive model has very good prediction capability.

Acknowledgments

This study was financially supported by the National Natural Science Foundation of China (Grant No.51575129) and Shandong Province Higher Educational Science and Technology Program (Grant No. J15LA51).

Author Contributions

Peng Zhang and Chuanjie Wang conceived and designed the experiments; Cen Yi performed the experiments; Cen Yi and Gang Chen analyzed the data; Heyong Qin contributed the calculation and revision of this work; Cen Yi wrote the paper.

Conflicts of Interest

The authors declare no conflict of interest.

References

  1. Pollock, T.M.; Tin, S. Nickel-based superalloys for advanced turbine engines: Chemistry, microstructure and properties. J. Propuls. Power 2006, 22, 361–374. [Google Scholar] [CrossRef]
  2. Zhang, Y.; Zhang, Y.W.; Zhang, N.; Jia, J. Heat treatment processes and microstructure and properties research on P/M superalloy FGH97. J. Aeronaut. Mater. 2008, 28, 5–9. [Google Scholar]
  3. Zhang, M.J.; Li, F.G.; Wang, S.Y.; Liu, C.Y. Characterization of hot deformation behavior of a P/M nickel-base superalloy using processing map and activation energy. Mater. Sci. Eng. A 2010, 527, 6771–6779. [Google Scholar]
  4. Lee, H.W.; Im, Y.T. Numerical modeling of dynamic recrystallization during nonisothermal hot compression by cellular automata and finite element analysis. Int. J. Mech. Sci. 2010, 52, 1277–1289. [Google Scholar]
  5. El Mehtedi, M.; Gabrielli, F.; Spigarelli, S. Hot workability in process modeling of a bearing steel by using combined constitutive equations and dynamic material model. Mater. Des. 2014, 53, 398–404. [Google Scholar] [CrossRef]
  6. Arisoy, Y.M.; Guo, C.; Kaftanoglu, B.; Özel, T. Investigations on Microstructural Changes in Machining of Inconel 100 alloy using Face Turning Experiments and 3D Finite Element Simulations. Int. J. Mech. Sci. 2016, 107, 80–92. [Google Scholar] [CrossRef]
  7. Wang, K.L.; Fu, M.W.; Lu, S.Q.; Li, X. Study of the dynamic recrystallization of Ti-6.5Al-3.5Mo-1.5Zr-0.3Si alloy in β-forging process via Finite Element Method modeling and microstructure characterization. Mater. Des. 2011, 32, 1283–1291. [Google Scholar] [CrossRef]
  8. Laasraoui, A.; Jonas, J.J. Prediction of steel flow stresses at high temperatures and strain rates. Metall. Trans. A 1991, 22, 1545–1558. [Google Scholar] [CrossRef]
  9. Lin, Y.C.; Chen, X.M.; Liu, G. A modified Johnson-Cook model for tensile behaviors of typical high-strength alloy steel. Mater. Sci. Eng. A 2010, 527, 6980–6986. [Google Scholar] [CrossRef]
  10. Lin, Y.C.; Xia, Y.C.; Chen, X.M.; Chen, M.S. Constitutive descriptions for hot compressed 2124-T851 aluminum alloy over a wide range of temperature and strain rate. Comput. Mater. Sci. 2010, 50, 227–233. [Google Scholar] [CrossRef]
  11. Watanabe, H.; Mukai, T.; Higashi, K. Deformation mechanism of fine-grained superplasticity in metallic materials expected from the phenomenological constitutive equation. Mater. Trans. 2004, 45, 2497–2502. [Google Scholar] [CrossRef]
  12. Wang, L.; Liu, F.; Zuo, Q.; Chen, C.F. Prediction of flow stress for N08028 alloy under hot working conditions. Mater. Des. 2013, 47, 737–745. [Google Scholar] [CrossRef]
  13. He, A.; Xie, G.L.; Yang, X.Y.; Wang, X.T.; Zhang, H.L. A physically-based constitutive model for a nitrogen alloyed ultralow carbon stainless steel. Comput. Mater. Sci. 2015, 98, 64–69. [Google Scholar] [CrossRef]
  14. Lin, Y.C.; Chen, X.M.; Wen, D.X.; Chen, M.S. A physically-based constitutive model for a typical nickel-based superalloy. Comput. Mater. Sci. 2014, 83, 282–289. [Google Scholar] [CrossRef]
  15. Sun, Z.C.; Liu, L.; Yang, H. Microstructure evolution of different loading zones during TA15 alloy multi-cycle isothermal local forging. Mater. Sci. Eng. A 2011, 528, 5112–5121. [Google Scholar] [CrossRef]
  16. Mandal, S.; Bhaduri, A.K.; Sarma, V.S. A study on microstructural evolution and dynamic recrystallization during isothermal deformation of a Ti-modified austenitic stainless steel. Metall. Mater. Trans. A 2011, 42, 1062–1072. [Google Scholar] [CrossRef]
  17. Zhang, D.X.; Yang, X.Y.; Sun, H.; Li, Y.; Wang, J.; Zhang, Z.R.; Ye, Y.X.; Sakai, T. Dynamic recrystallization behaviors and the resultant mechanical properties of a Mg-Y-Nd-Zr alloy during hot compression after aging. Mater. Sci. Eng. A 2015, 640, 51–60. [Google Scholar] [CrossRef]
  18. Agnoli, A.; Bernacki, M.; Logé, R.; Franchet, J.M.; Laigo, J.; Bozzolo, N. Selective Growth of Low Stored Energy Grains During δ Sub-solvus Annealing in the Inconel 718 Nickel-Based Superalloy. Met. Mater. Trans. A 2015, 46, 4405–4421. [Google Scholar] [CrossRef] [Green Version]
  19. Liang, H.Q.; Guo, H.Z.; Ning, Y.Q.; Peng, X.N.; Shi, Z.F.; Nan, Y. Dynamic recrystallization behavior of Ti-5Al-5Mo-5V-1Cr-1Fe alloy. Mater. Des. 2014, 63, 798–804. [Google Scholar] [CrossRef]
  20. Xu, Y.; Hu, L.X.; Sun, Y. Dynamic recrystallization kinetics of as-cast AZ91D alloy. Trans. Nonferrous Met. Soc. China 2014, 24, 1683–1689. [Google Scholar] [CrossRef]
  21. Fang, B.; Ji, Z.; Liu, M.; Tian, G.F.; Jia, C.C.; Zeng, T.T.; Hu, B.F.; Chang, Y.H. Critical strain and models of dynamic recrystallization for FGH96 superalloy during two-pass hot deformation. Mater. Sci. Eng. A 2014, 593, 8–15. [Google Scholar] [CrossRef]
  22. Chen, X.M.; Lin, Y.C.; Wen, D.X.; Zhang, J.L.; He, M. Dynamic recrystallization behavior of a typical nickel-based superalloy during hot deformation. Mater. Des. 2014, 57, 568–577. [Google Scholar] [CrossRef]
  23. Shamsolhodaei, A.; Zarei-Hanzaki, A.; Ghambari, M.; Moeneni, S. The high temperature flow behavior modeling of NiTi shape memory alloy employing phenomenological and physical based constitutive models: A comparative study. Intermetallics 2014, 53, 140–149. [Google Scholar] [CrossRef]
  24. Gottstein, G.; Frommert, M.; Goerdeler, M.; Schafer, N. Prediction of the critical conditions for dynamic recrystallization in the austenitic steel 800H. Mater. Sci. Eng. A 2004, 387, 604–608. [Google Scholar] [CrossRef]
  25. Gottstein, G.; Brünger, E.; Frommert, M.; Goerdeler, M.; Zeng, M. Prediction of the critical conditions for dynamic recrystallization in metals: Dedicated to Professor Dr. Ottmar Vöhringer on occasion of his 65th birthday. Z. Metallkunde 2003, 94, 628–635. [Google Scholar] [CrossRef]
  26. Mirzadeh, H.; Najafizadeh, A. Prediction of the critical conditions for initiation of dynamic recrystallization. Mater. Des. 2010, 31, 1174–1179. [Google Scholar] [CrossRef]
  27. Zhang, P.; Hu, C.; Ding, C.; Zhu, Q.; Qin, H.Y. Plastic deformation behavior and processing maps of a Ni-based superalloy. Mater. Des. 2015, 65, 575–584. [Google Scholar] [CrossRef]
  28. Wu, K.; Liu, G.Q.; Hu, B.F.; Wang, C.Y.; Zhang, Y.W.; Tao, Y.; Liu, J.T. Effect of processing parameters on hot compressive deformation behavior of a new Ni-Cr-Co based P/M superalloy. Mater. Sci. Eng. A 2011, 528, 4620–4629. [Google Scholar] [CrossRef]
  29. Sellars, C.M.; McTegart, W.J. On the mechanism of hot deformation. Acta Metall. 1966, 14, 1136–1138. [Google Scholar] [CrossRef]
  30. Jonas, J.J.; Sellars, C.M.; Tegart, W.M. Strength and structure under hot-working conditions. Metall. Rev. 1969, 14, 1–24. [Google Scholar] [CrossRef]
  31. Quan, G.Z.; Mao, A.; Luo, G.C.; Liang, J.T.; Wu, D.S.; Zhou, J. Constitutive modeling for the dynamic recrystallization kinetics of as-extruded 3Cr20Ni10W2 heat-resistant alloy based on stress-strain data. Mater. Des. 2013, 52, 98–107. [Google Scholar] [CrossRef]
  32. Yu, Q.Y.; Yao, Z.H.; Dong, J.X. Deformation and recrystallization behavior of a coarse-grain, nickel-base superalloy Udimet720Li ingot material. Mater. Charact. 2015, 107, 398–410. [Google Scholar] [CrossRef]
  33. Li, H.Y.; Li, Y.H.; Wang, X.F.; Liu, J.J.; Wu, Y. A comparative study on modified Johnson Cook, modified Zerilli-Armstrong and Arrhenius-type constitutive models to predict the hot deformation behavior in 28CrMnMoV steel. Mater. Des. 2013, 49, 493–501. [Google Scholar] [CrossRef]
  34. Lin, Y.C.; He, M.; Zhou, M.; Wen, D.X.; Chen, J. New constitutive model for hot deformation behaviors of Ni-based superalloy considering the effects of initial δ phase. J. Mater. Eng. Perform. 2015, 24, 3527–3538. [Google Scholar] [CrossRef]
  35. Lv, B.J.; Peng, J.; Shi, D.W.; Tang, A.T.; Pan, F.S. Constitutive modeling of dynamic recrystallization kinetics and processing maps of Mg-2.0Zn-0.3Zr alloy based on true stress-strain curves. Mater. Sci. Eng. A 2013, 560, 727–733. [Google Scholar] [CrossRef]
  36. Galindo-Nava, E.I.; Rae, C.M.F. Microstructure evolution during dynamic recrystallisation in polycrystalline nickel superalloys. Mater. Sci. Eng. A 2015, 636, 434–445. [Google Scholar] [CrossRef]
  37. Galindo-Nava, E.I.; Rivera-Díaz-del-Castillo, P.E.J. Grain size evolution during discontinuous dynamic recrystallization. Scr. Mater. 2014, 72, 1–4. [Google Scholar] [CrossRef]
  38. Lin, Y.C.; Chen, M.S.; Zhong, J. Prediction of 42CrMo steel flow stress at high temperature and strain rate. Mech. Res. Commun. 2008, 35, 142–150. [Google Scholar] [CrossRef]
  39. Poliak, E.I.; Jonas, J.J. Initiation of dynamic recrystallization in constant strain rate hot deformation. ISIJ Int. 2003, 43, 684–691. [Google Scholar] [CrossRef]
  40. Kim, S.I.; Lee, Y.; Lee, D.L.; Yoo, Y.C. Modeling of AGS and recrystallized fraction of microalloyed medium carbon steel during hot deformation. Mater. Sci. Eng. A 2003, 355, 384–393. [Google Scholar] [CrossRef]
  41. Liu, J.; Cui, Z.; Ruan, L. A new kinetics model of dynamic recrystallization for magnesium alloy AZ31B. Mater. Sci. Eng. A 2011, 529, 300–310. [Google Scholar] [CrossRef]
  42. Xu, T.C.; Peng, X.D.; Qin, J.; Chen, Y.F.; Yang, Y.; Wei, G.B. Dynamic recrystallization behavior of Mg-Li-Al-Nd duplex alloy during hot compression. J. Alloy. Compd. 2015, 639, 79–88. [Google Scholar] [CrossRef]
  43. Lin, Y.C.; Chen, X.M. A critical review of experimental results and constitutive descriptions for metals and alloys in hot working. Mater. Des. 2011, 32, 1733–1759. [Google Scholar] [CrossRef]
  44. Honeycombe, R.W.K. Steels-Microstructure and Properties; Edward Arnold Ltd.: London, UK, 1981. [Google Scholar]
Figure 1. The true stress-strain curves of the superalloy under different conditions: (a) temperature of 1223 K; (b) strain rate of 3 s−1.
Metals 06 00161 g001
Figure 2. The microstructures of the superalloy under different deformation conditions: (a) initial; (b) 1323 K, 0.001 s−1, deformation amount = 40%; (c) 1323 K, 0.001 s−1, deformation amount = 70%.
Metals 06 00161 g002
Figure 3. The TEM photos of the superalloy under different deformation conditions: (a) initial; (b) 1273 K, 70%, 0.1 s−1; (c) 1373 K, 70%, 0.1 s−1; (d) 1373 K, 70%, 30 s−1.
Metals 06 00161 g003
Figure 4. The plots of (a) ln ε ˙ - ln [ sinh ( α σ ) ] ; and (b) ln [ sinh ( α σ ) ] - 1 / T .
Metals 06 00161 g004
Figure 5. Relationship between ln Z - ln [ sinh ( α σ ) ] .
Metals 06 00161 g005
Figure 6. The comparison of the calculated and the measured peak stress.
Metals 06 00161 g006
Figure 7. Schematic of the work-hardening rate versus flow stress [22].
Metals 06 00161 g007
Figure 8. The plot of θ~σ at 1223 K and 30 s−1.
Metals 06 00161 g008
Figure 9. The plot of dθ/dσ~σ at 1223 K and 30 s−1.
Metals 06 00161 g009
Figure 10. The plots of (a) lnεp-lnZ and (b) εcp.
Metals 06 00161 g010
Figure 11. Schematic of stress-strain curves.
Metals 06 00161 g011
Figure 12. The relationship between σs and σp.
Metals 06 00161 g012
Figure 13. The plot of σ0-lnZ.
Metals 06 00161 g013
Figure 14. The plot of lnΩ-lnZ.
Metals 06 00161 g014
Figure 15. The plots of (a) ln [ sinh ( α σ s ) ] - ln Z ; and (b) ln [ sinh ( α σ ss ) ] - ln Z .
Metals 06 00161 g015
Figure 16. The plot of ln [ ln ( 1 X d ) ] vs. ln ( ( ε ε c ) / ε p ) .
Metals 06 00161 g016
Figure 17. The influence of temperature and strain rate on (a) the critical strain model and (b) the steady stress.
Metals 06 00161 g017
Figure 18. The comparison between the predicted and experimental flow stress curves under different deformation conditions: (a) 1223 K; (b) 1273 K; (c) 1323 K; (d) 1373 K; (e) 1423 K.
Metals 06 00161 g018
Figure 19. The scatter map of the predicted and experimental stress values.
Metals 06 00161 g019
Table 1. Chemical compositions of the studied superalloy.
ElementCrCMoAlTiNbFeNi
Content (wt. %)14.500.0423.181.702.682.02<0.2Bal.
Table 2. Material parameters for peak stress.
Constantn1β (MPa−1)α (MPa−1)A (s−1)nQ (kJ/mol)
Value6.6914160.0267920.0038492.764 × 10244.672582646.341

