Article

Effect of Controlled Cooling on Microstructure and Tensile Properties of Low C Nb-Ti-Containing HSLA Steel for Construction

1
Laboratory of Metastable Materials Science and Technology, Yanshan University, Qinhuangdao 066004, China
2
Research Institue of Nanjing Iron & Steel Co., Ltd., Nanjing 210035, China
3
National Engineering Research Center for Equipment and Technology of Cold Strip Rolling, Yanshan University, Qinhuangdao 066004, China
*
Author to whom correspondence should be addressed.
Metals 2017, 7(1), 23; https://doi.org/10.3390/met7010023
Submission received: 16 November 2016 / Revised: 20 December 2016 / Accepted: 4 January 2017 / Published: 12 January 2017

Abstract

:
The thermo-mechanical control processing (TMCP) of low carbon (C) Nb-Ti-containing HSLA steel with different cooling rates from 5 to 20 °C/s was simulated using a Gleeble 3500 system. The samples’ microstructure was characterized and the tensile properties measured. The results show that a microstructure mainly consisting of quasi-polygonal ferrite (QPF), granular bainitic ferrite (GBF), and martensite/austenite (M/A) constituent formed in each sample. Furthermore, the accelerated cooling led to a significant grain refinement of the QPF and GBF, and an increase in the density of dislocations, as well as suppressed the precipitation of nanoscale particles; however, the overall yield strength (YS) still increased obviously. The accelerated cooling also brought about a decrease in amount of M/A constituent acting as a mixed hard phase, which weakened the overall strain-hardening capacity of the QPF + GBF + M/A multiphase steel and simultaneously elevated yield-to-tensile strength ratio (YR). In addition, the mechanisms in dominating the influence of controlled cooling on the final microstructure and tensile properties were discussed.

1. Introduction

High strength low alloy (HSLA) steel with a low yield-to-tensile strength ratio (YR) can inhibit an unexpected failure due to its high resistance to deformation from yielding to plastically destabilizing [1]. For this reason, HSLA steel for earthquake resistant construction normally requires a combination of high strength and low YR [2]. However, since high strength of plate steel due to fine-grained microstructure is basically correlated to high YR, it is difficult to produce such a high strength plate steel with low YR [2,3]. Furthermore, HSLA construction steel is currently produced by thermo-mechanical control processing (TMCP) of low carbon containing steel [4], leading to a highly grain-refined microstructure. Hence, an enhanced combination of weldablility, strength and toughness can be achieved at the expense of an elevated YR [4,5]. Extensive investigations [2,6,7,8] have indicated that an appropriate dual-phase microstructure containing granular bainitic ferrite (GBF) and/or quasi-polygonal ferrite (QPF) and M/A constituent is essential to balance the above described yield strength and YR in plate steel produced by TMCP. An increased amount of M/A constituent acting as a mixed hard phase [9,10,11,12] can enhance the stain-hardening capacity of the soft ferrite phase [2,6,7,8,13] and correspondingly lower the YR, which has been achieved by the addition of nitrogen to V-microalloyed steel [8], and the accelerated cooling followed by heat-treatment on-line process (HOP) of Nb-microalloyed steel [6,7]. Nevertheless, the M/A constituent acting as brittle islands can cause a toughness loss [14,15,16], which can be prevented by grain refinement of soft ferrite phase [17]. Mixed microstructure of suitably fine-grained QPF and/or GBF as the soft phase and an increasing amount of M/A constituent as the mixed hard phase, may also form in a low carbon Nb-Ti-containing HSLA steel, and the tensile properties of this type of multiphase plate steel are characterized by a combination of high strength and low YR. This multiphase plate steel may be prepared through an appropriate control of cooling route suitable for industrial process. However, the mechanisms in governing the overall tensile properties required for the development of such an advanced multiphase HSLA plate steel need further investigation in detail.
As such, in this attempt, the simulations on TMCP of low-carbon Nb-Ti containing HSLA steel with different controlled cooling rates were performed. The effect of controlled cooling on the microstructure and tensile properties of all the samples was evaluated.

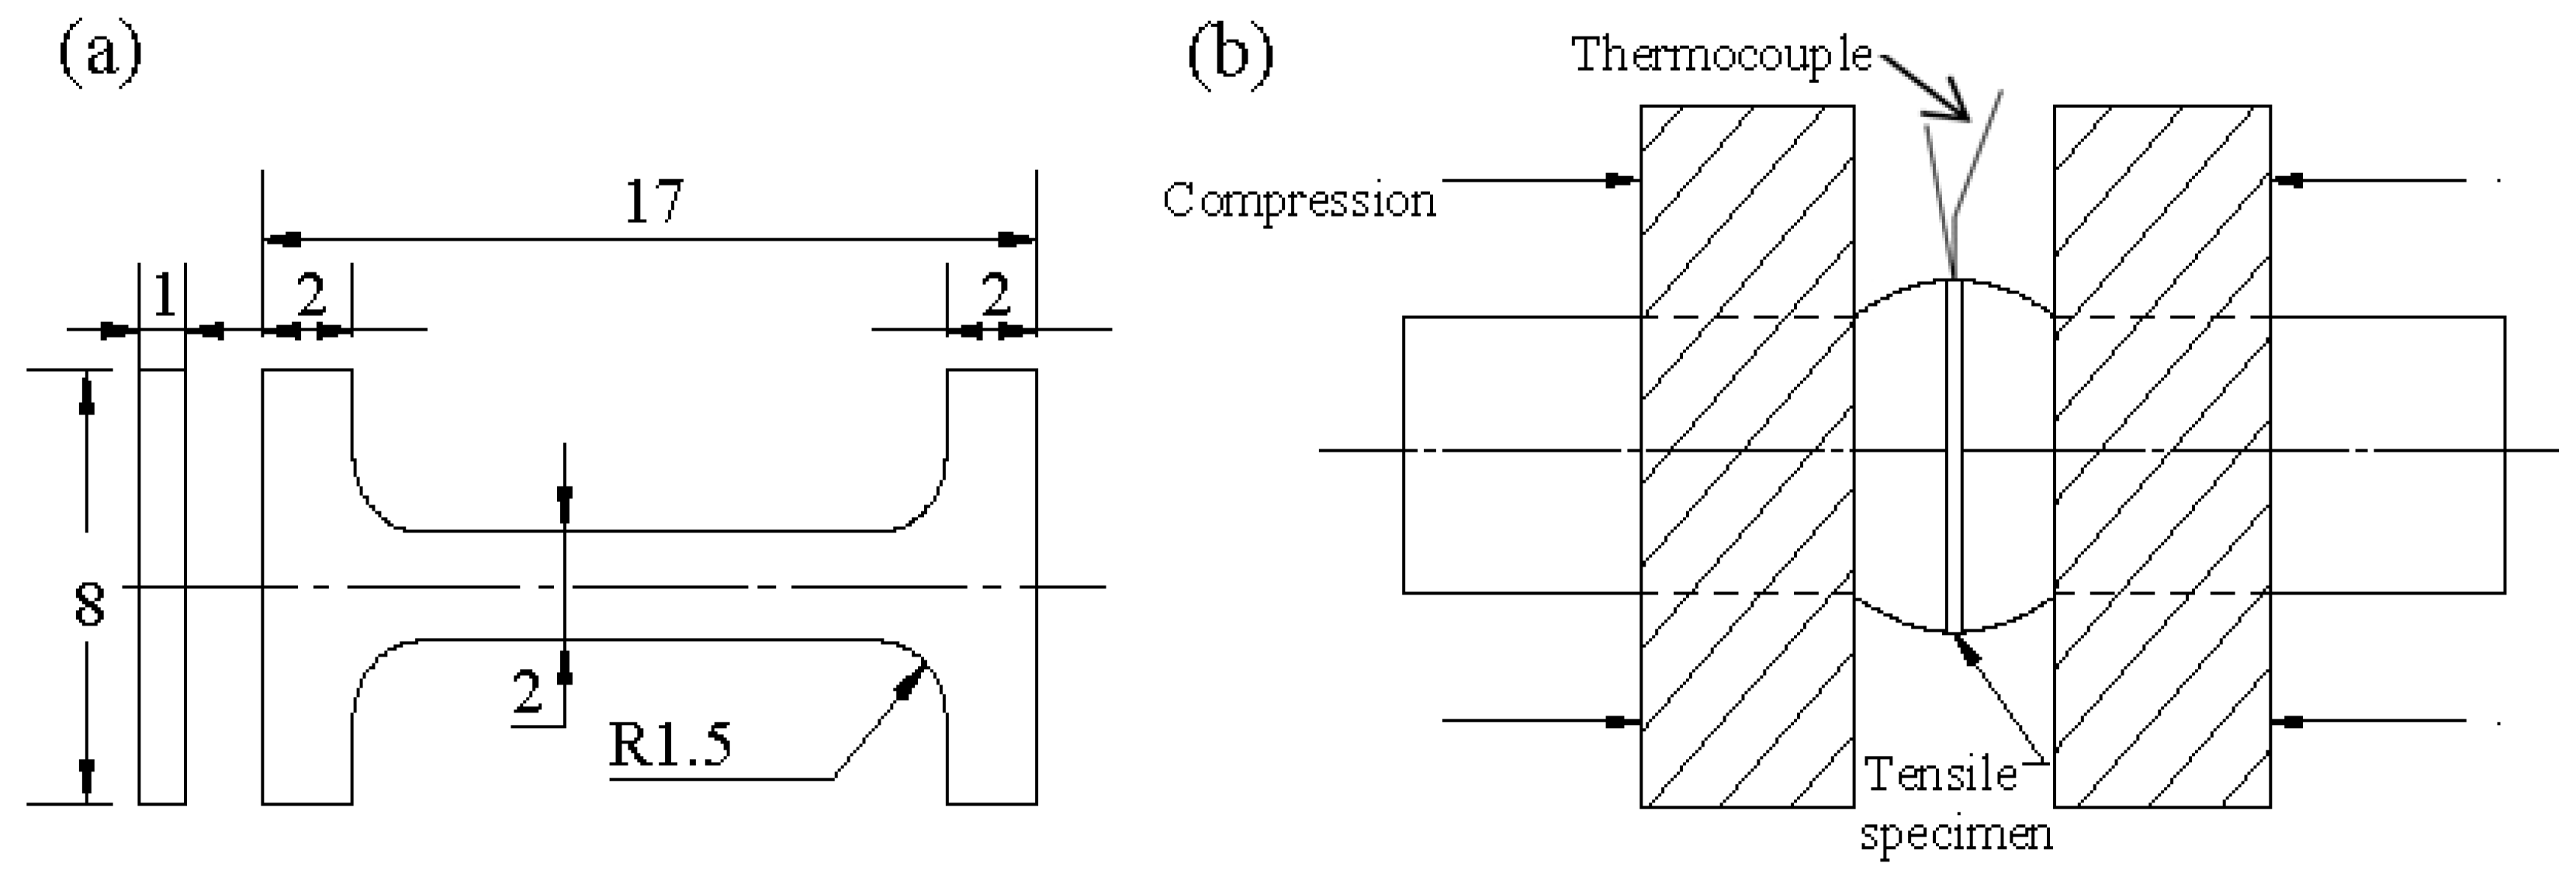
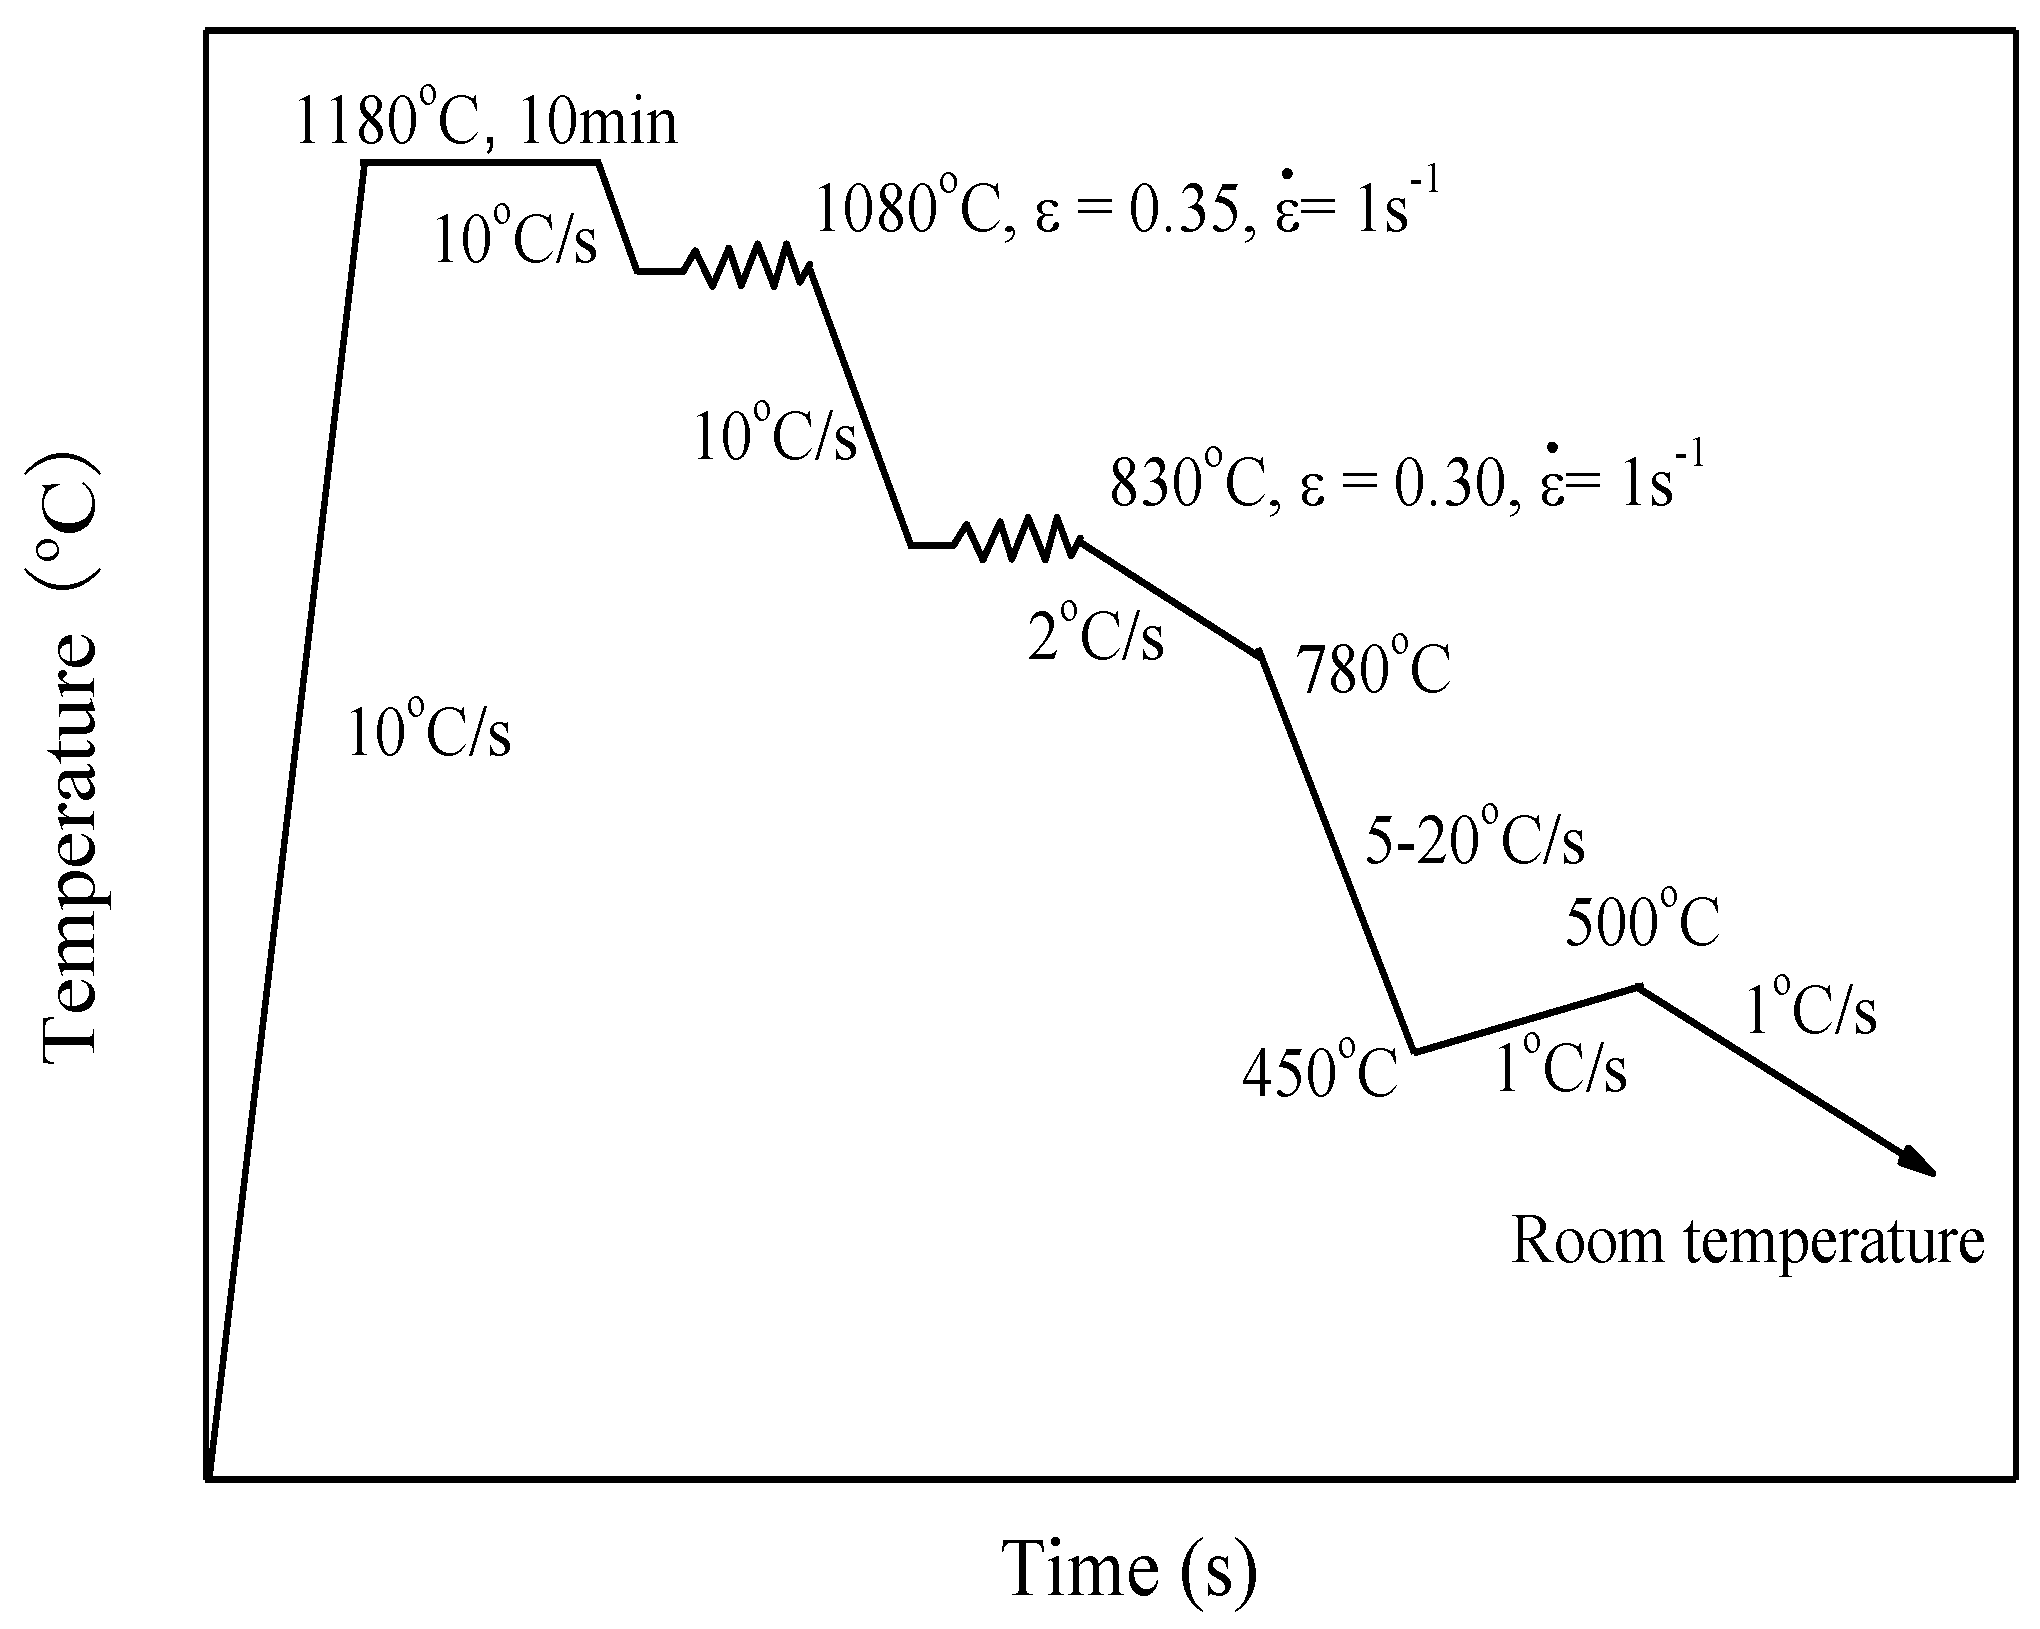
2. Experimental Materials and Methods

Low carbon Nb-Ti-containing steel was melted in a 50 kg vacuum furnace and hot-rolled to 16-mm-thick plates, with the chemical compositions listed in Table 1. The steel contains 0.06C, 1.47Mn, 0.20Mo, 0.23Cr, 0.25Ni and 0.19Cu (in wt. %); these elements serve to promote the formation of QPF and/or GBF containing M/A constituent. Furthermore, a small amount of Nb and Ti was added to prevent the coarsening of austenite grains during the subsequent TMCP.
Round bar specimens with length × diameter of Φ 75 × 15 mm were cut from the plates, and thermo-mechanically processed using a Gleeble 3500 system; the process routings are shown schematically in Figure 1. A group of specimens was produced by diffusion annealing at 1180 °C for 10 min, compressing at 1080 °C for a strain of 0.35 to simulate rough rolling, subsequently compressing at 830 °C for a strain of 0.30 to simulate finish rolling, and finally controlled cooling. The average strain rate for both compressions was 1 s−1. The controlled cooling processes were conducted with commencing at 780 °C, cooling to 450 °C at four different rates of 5–20 °C/s, re-reddening up to 500 °C for promoting the carbon atom diffusion from α to metastable austenite (γ′), and air-cooling to room temperature.
After the simulation, each sample for microstructural observations was cut along the cross-section where the thermocouple was located, polished, and etched in a 4% nital solution. The microstructure was observed via optical microscopy (OM) using an Axiover-200MAT microscope (Axiover, Jean, Germany). In addition, the M/A constituent was further characterized using metallographic samples etched in LePera’s reagent. The morphology of M/A constituent (in white) dispersed in the ferrite matrix (in gray) was estimated at 500×, and quantified from more than 500 particles in at least ten fields of view, using the Image-Pro Plus™ software (Media Cybernetics, Rockville, MD, USA). Furthermore, the ferrite matrix, M/A constituent, dislocations, and precipitate in each sample were characterized using a JEM-2010 transmission electron microscope (TEM, JEOL, Tokyo, Japan). The average size and volume fraction of the precipitated particles were also measured statistically by averaging over at least 1000 particles from the TEM image. Each sample for TEM observations was obtained by cutting thin slice parallel to the metallographic section, and the 3-mm-diameter disc made by a small punch was then thinned via electropolishing. The electropolishing was performed at a voltage and current of 25 V and 55–65 mA, respectively, using a 7% perchloric acid/glacial acetic acid mixture under room temperature.
The fraction of retained austenite (RA) and the density of dislocations in each sample were determined via quantitative X-ray diffraction (XRD) analysis. The XRD spectra were obtained by scanning in a Rigaku D/max-2500/PC diffractometer (Rigaku, Tokyo, Japan) using a Cu-Kα radiation source, over a scanning angle (2θ) range of 35°–105° with a step size of 0.02°, and the estimated penetration depth was 20 μm or so. For more precisely determining the low level of RA, six different sections of an identical sample were scanned and the average value was reported. A method offered by Ferreira et al. [18] was used to deal with the decomposition of XRD peaks and calculation. In addition, the X-ray method for determining dislocation density is based on the theory [19,20] below. Diffraction peaks are broadened by the presence of non-uniform strains that systematically shift atoms from their ideal positions and finite size of coherently diffracting domains. These two effects have a different dependence on the value of θ. The non-uniform strain effect can therefore be separated, since the slope of a plot of βhkl cos{θhkl} versus 4sin{θhkl} is equal to a measure of the non-uniform strain, ε. The parameter, β, is the measured peak broadening. The dislocation density, ρ, is calculated using the following equation [21]:
ρ = 6 π ε 2 b 2
where b stands for the Burgers vector of dislocations in α-Fe. ε and b can be determined by XRD line profiles [20].
Moreover, the mean equivalent diameter (MED) of ferrite grains with boundaries defined by a misorientation tolerance angle (MTA) ranging 2°–30° was determined for each sample. To quantify the MED, each sample was electropolished in a solution of 85% alcohol, 10% perchloric acid, and 5% glycerinum. The electropolished sample was then examined via Electron backscatter diffraction (EBSD) performed on a ZEISS ULTRA 55 Field-Emission Scanning Electron Microscope (FESEM, Hitachi, Tokyo, Japan) equipped with a HKL EBSD fast acquisition system, using a step size of 0.12 μm for the EBSD scans.
Tensile samples were made from each TMCP simulation specimen by cutting along the cross-section with the dimensions indicated in Figure 2. The room temperature tensile tests were carried out at an extension rate of 1 mm/min, using an Inspekt Table 3 KN model universal testing machine and the special fixture [2]. Two tensile samples were tested for each TMCP simulation specimen and the average value is reported. The yield strength was determined as the 0.2% offset stress.

3. Results

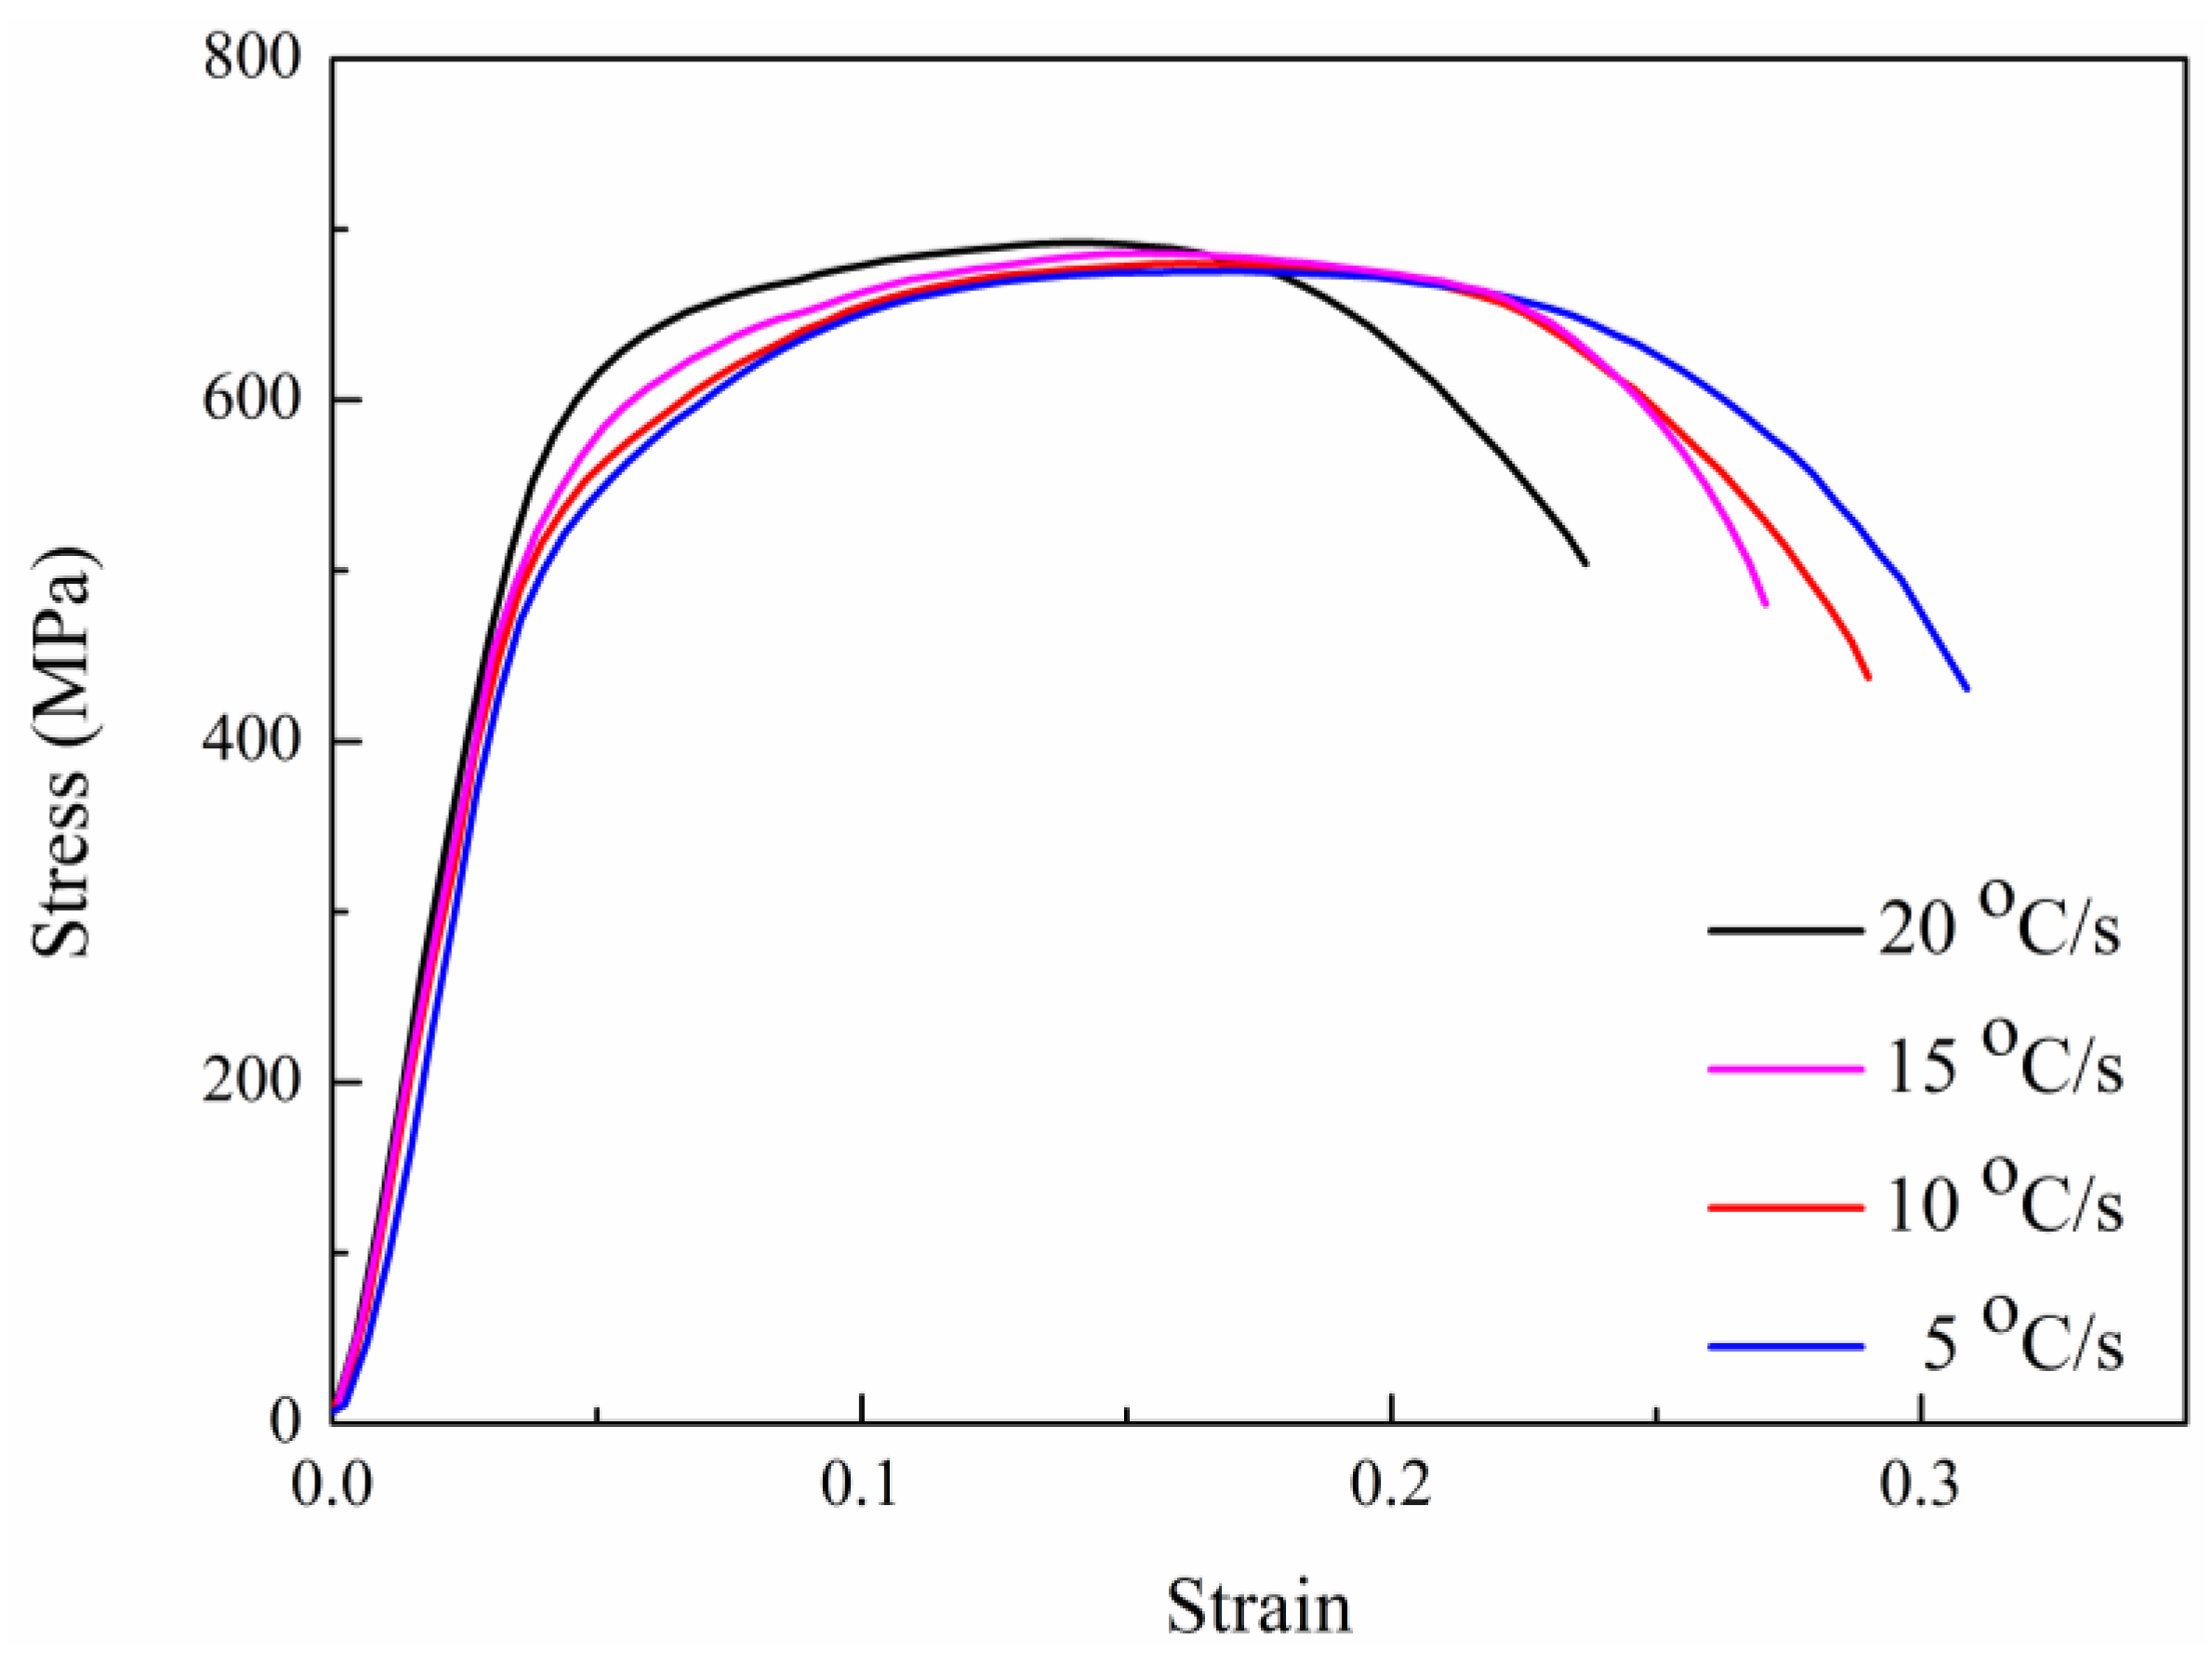
3.1. Tensile Properties
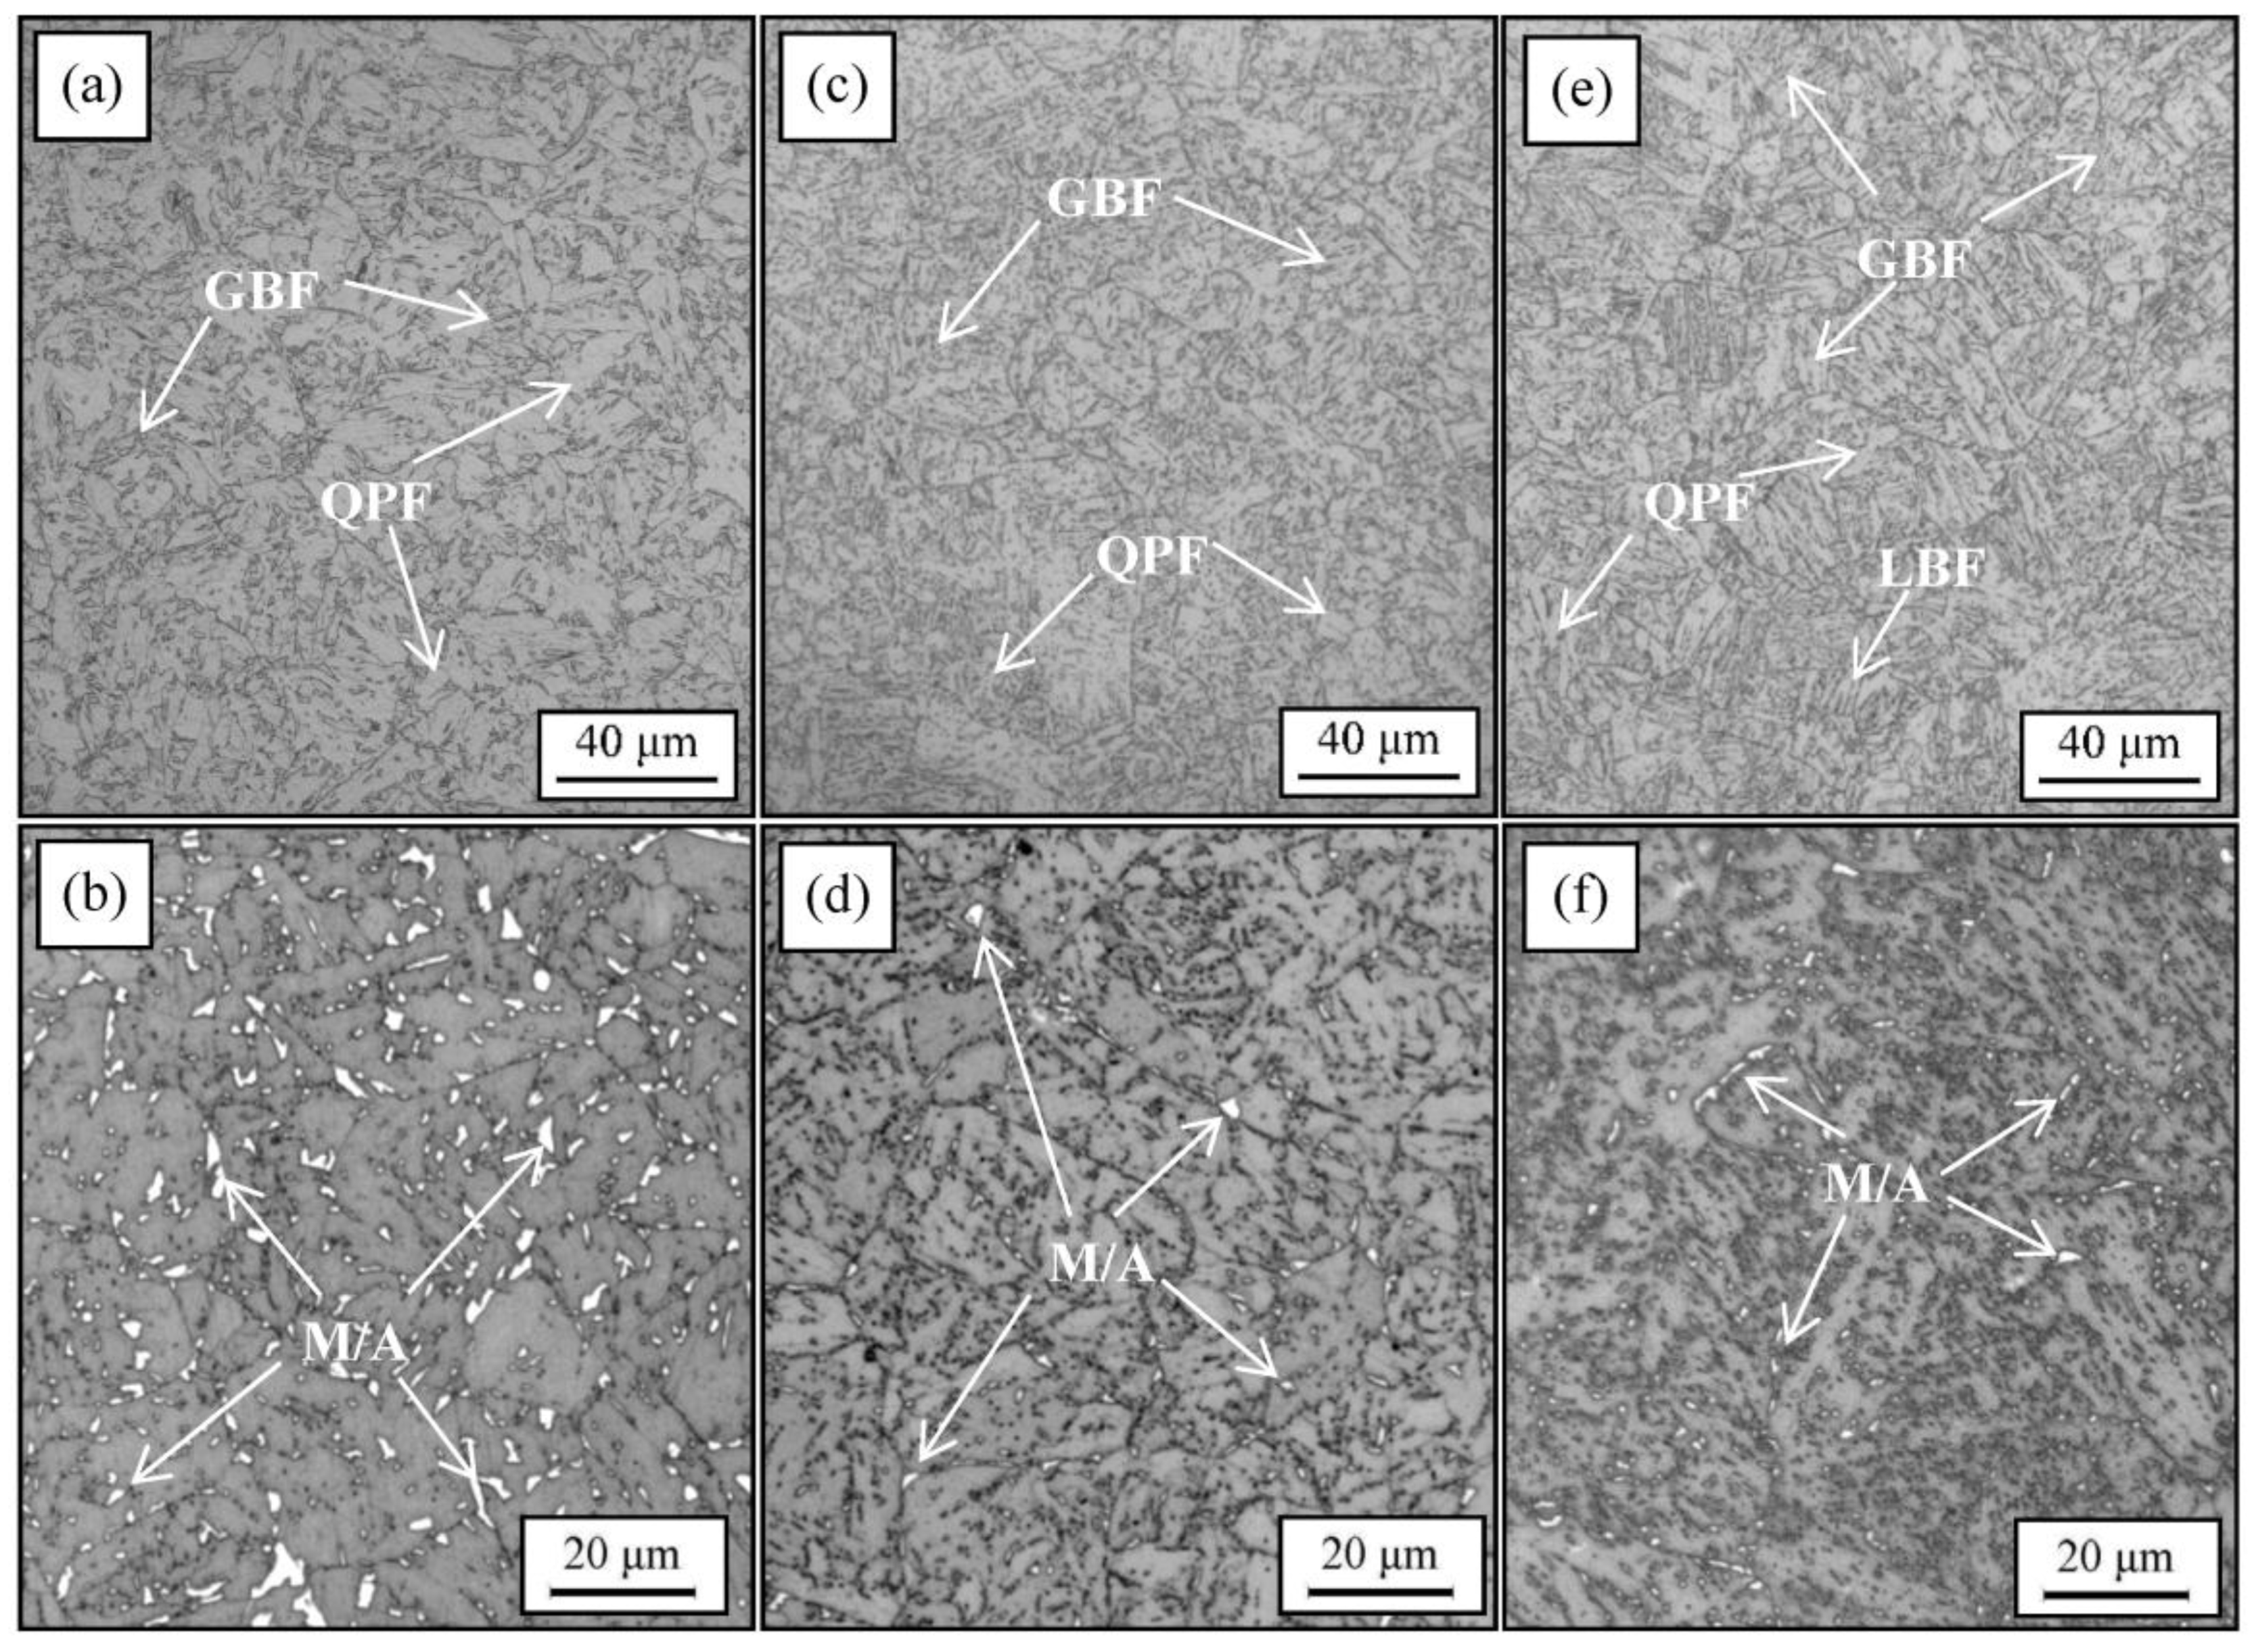
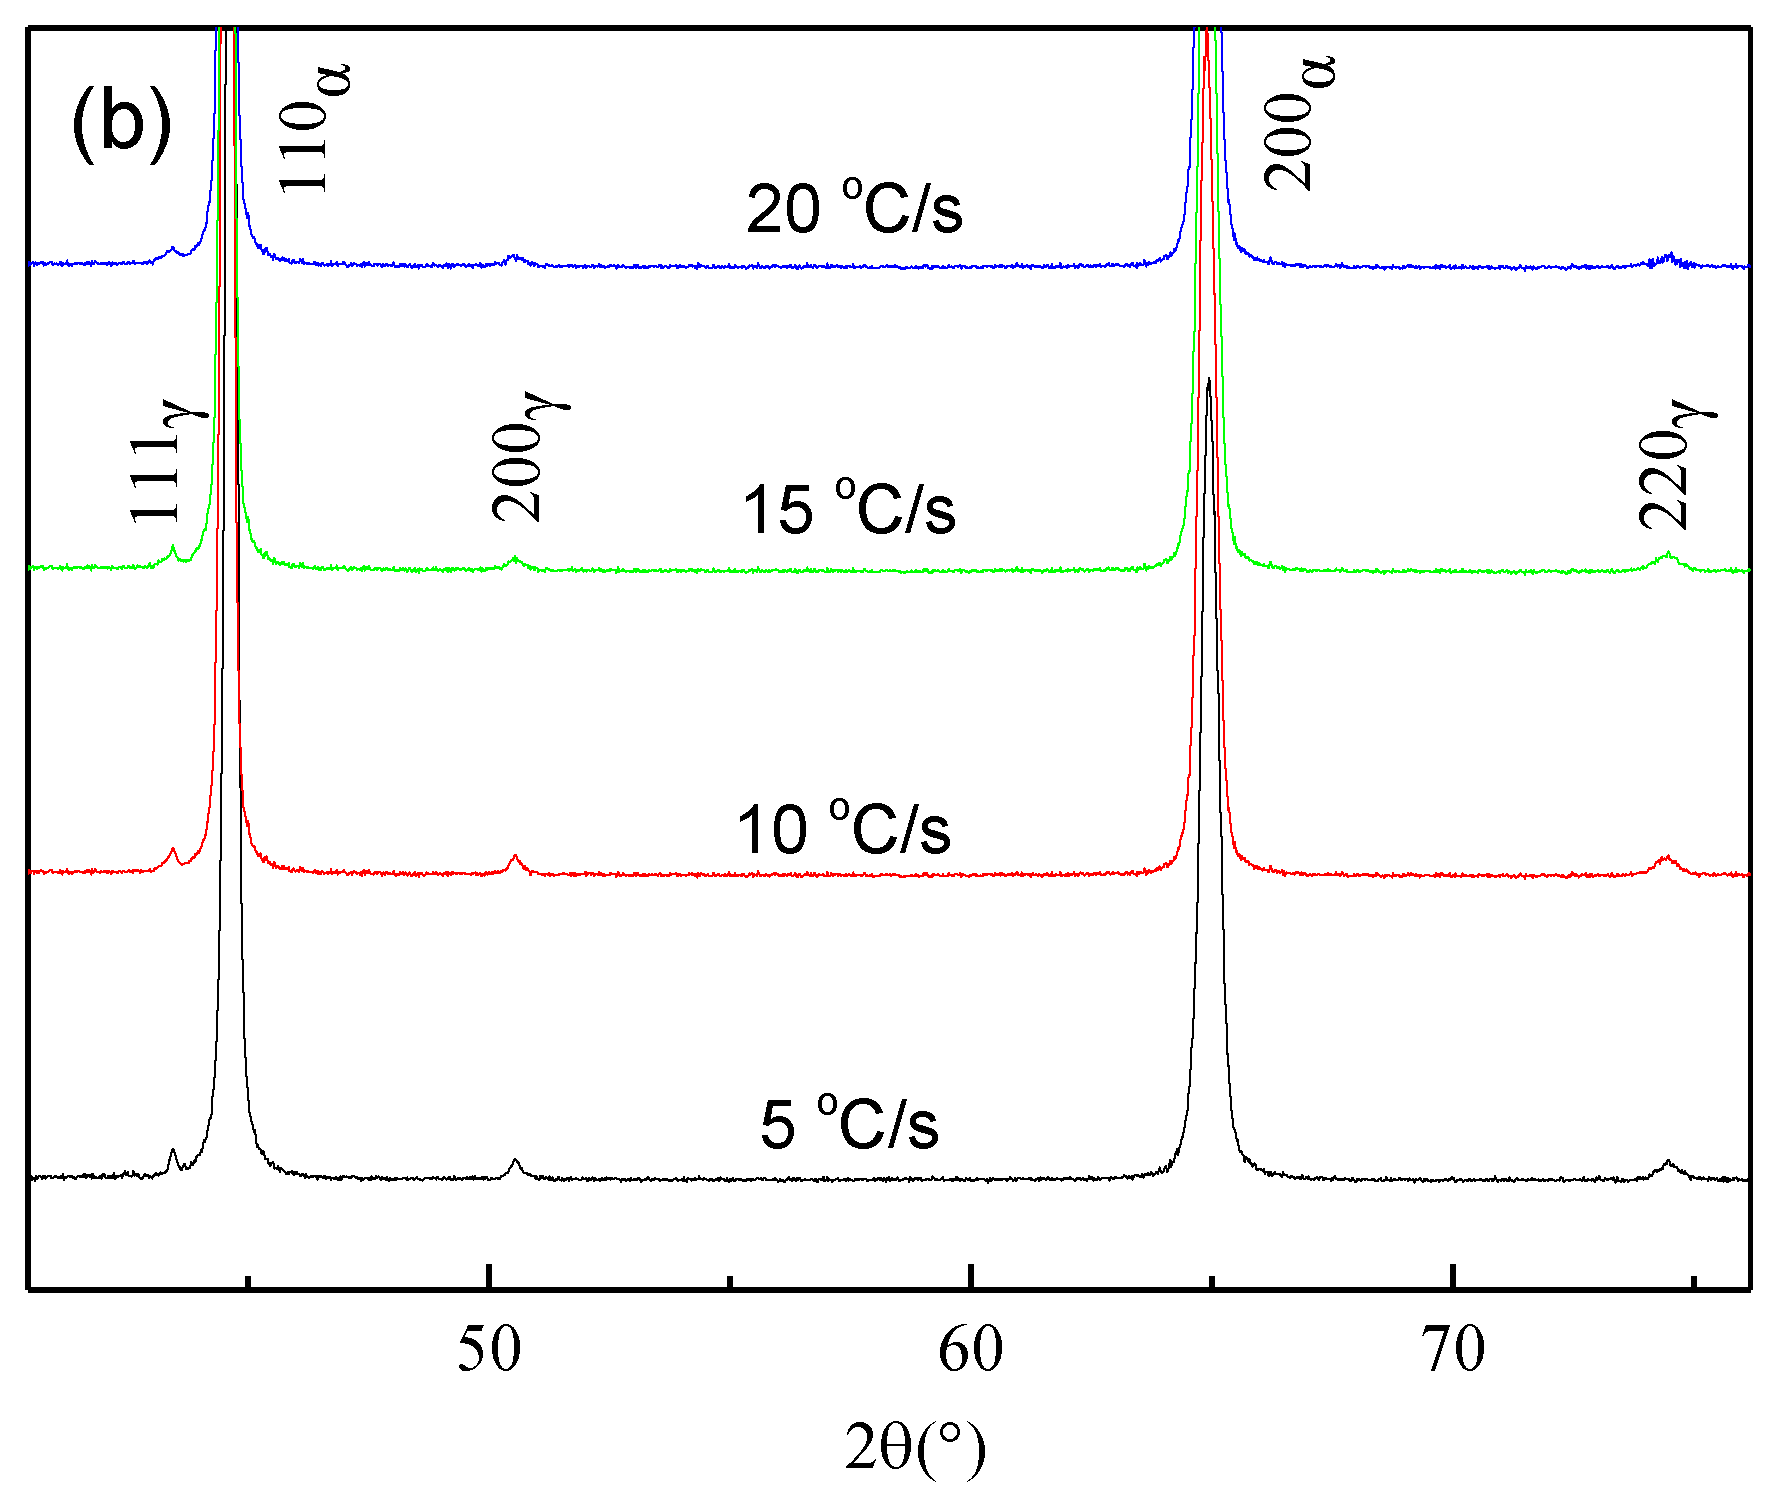
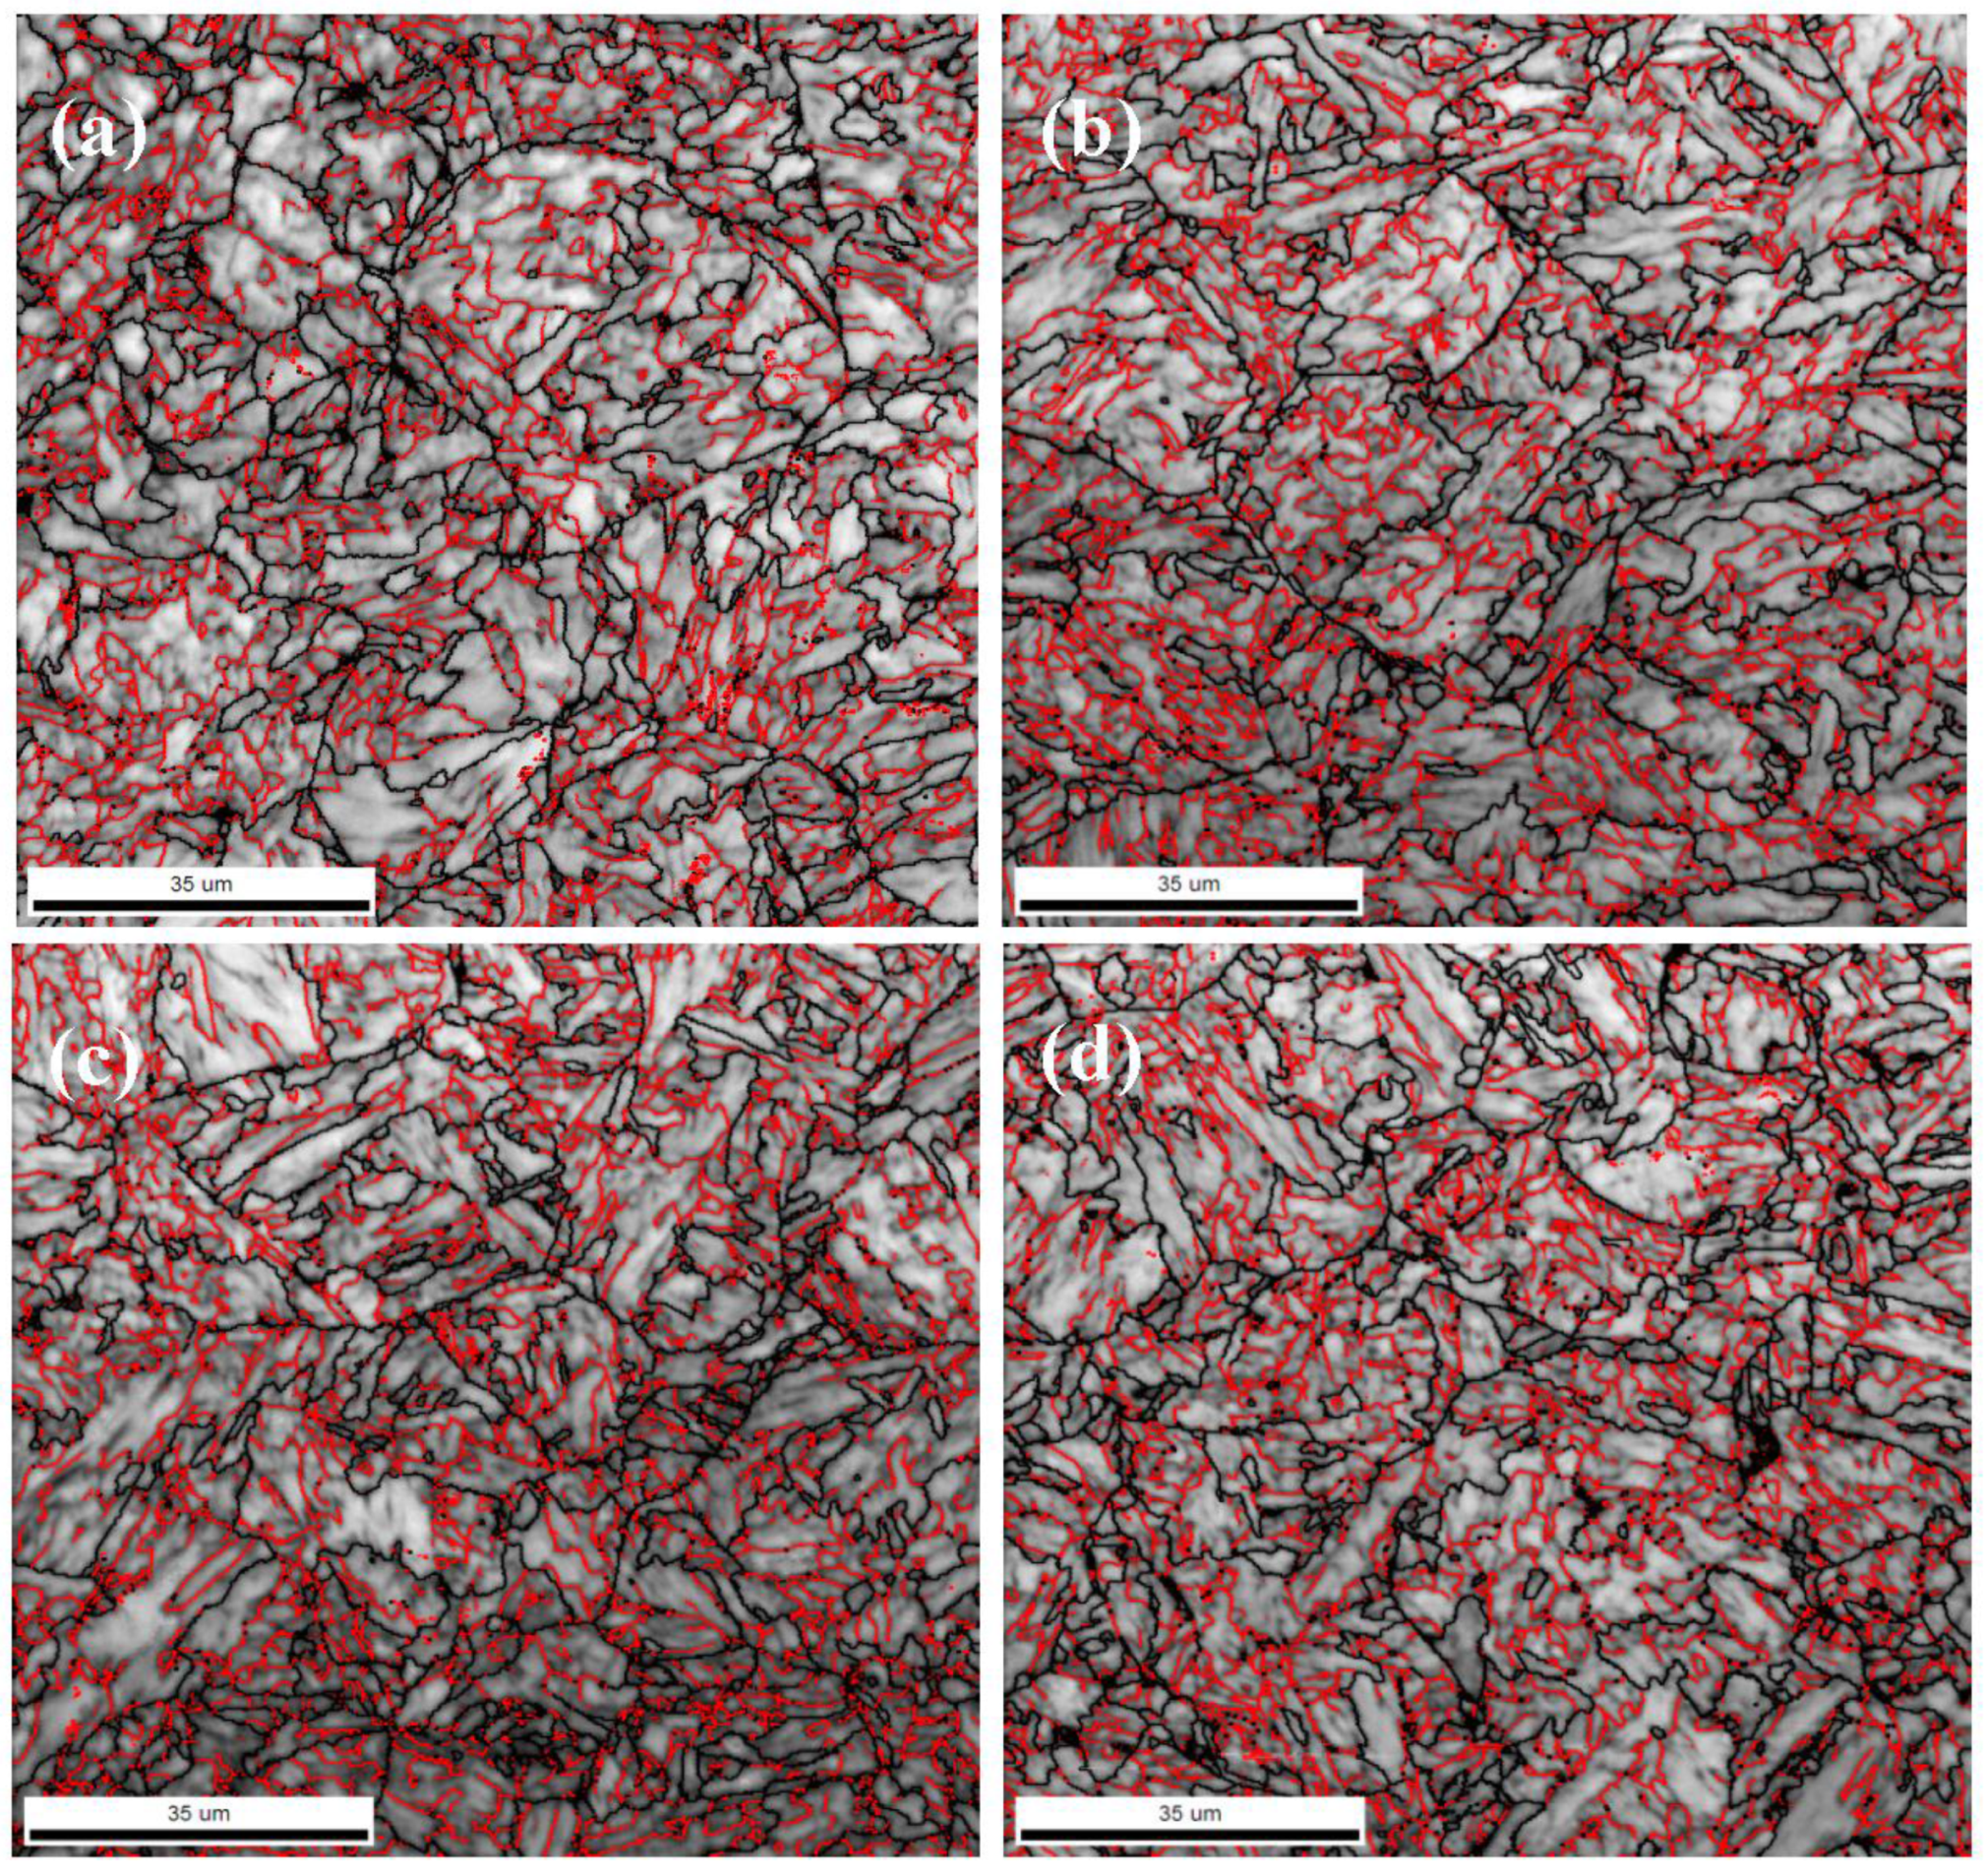
The typical tensile strain-stress curves are shown in Figure 3 with the tensile properties listed in Table 2. As the table indicates, the yield strength (YS) increases from 476 to 537 MPa, while the ultimate tensile strength (TS) also increases from 675 to 692 MPa, with an increase in cooling rate from 5 to 20 °C/s. Accordingly, the strain hardening magnitude, Δσ, which is equal to the difference between the TS and the YS, decreases from 199 to 155 MPa, and the YR increases from 0.70 to 0.78. The Δσ and the YR are secondary criteria for the indication of strain hardening, and a high Δσ or a low YR represents an excellent strain hardening capacity [22].

3.2. Microstructure

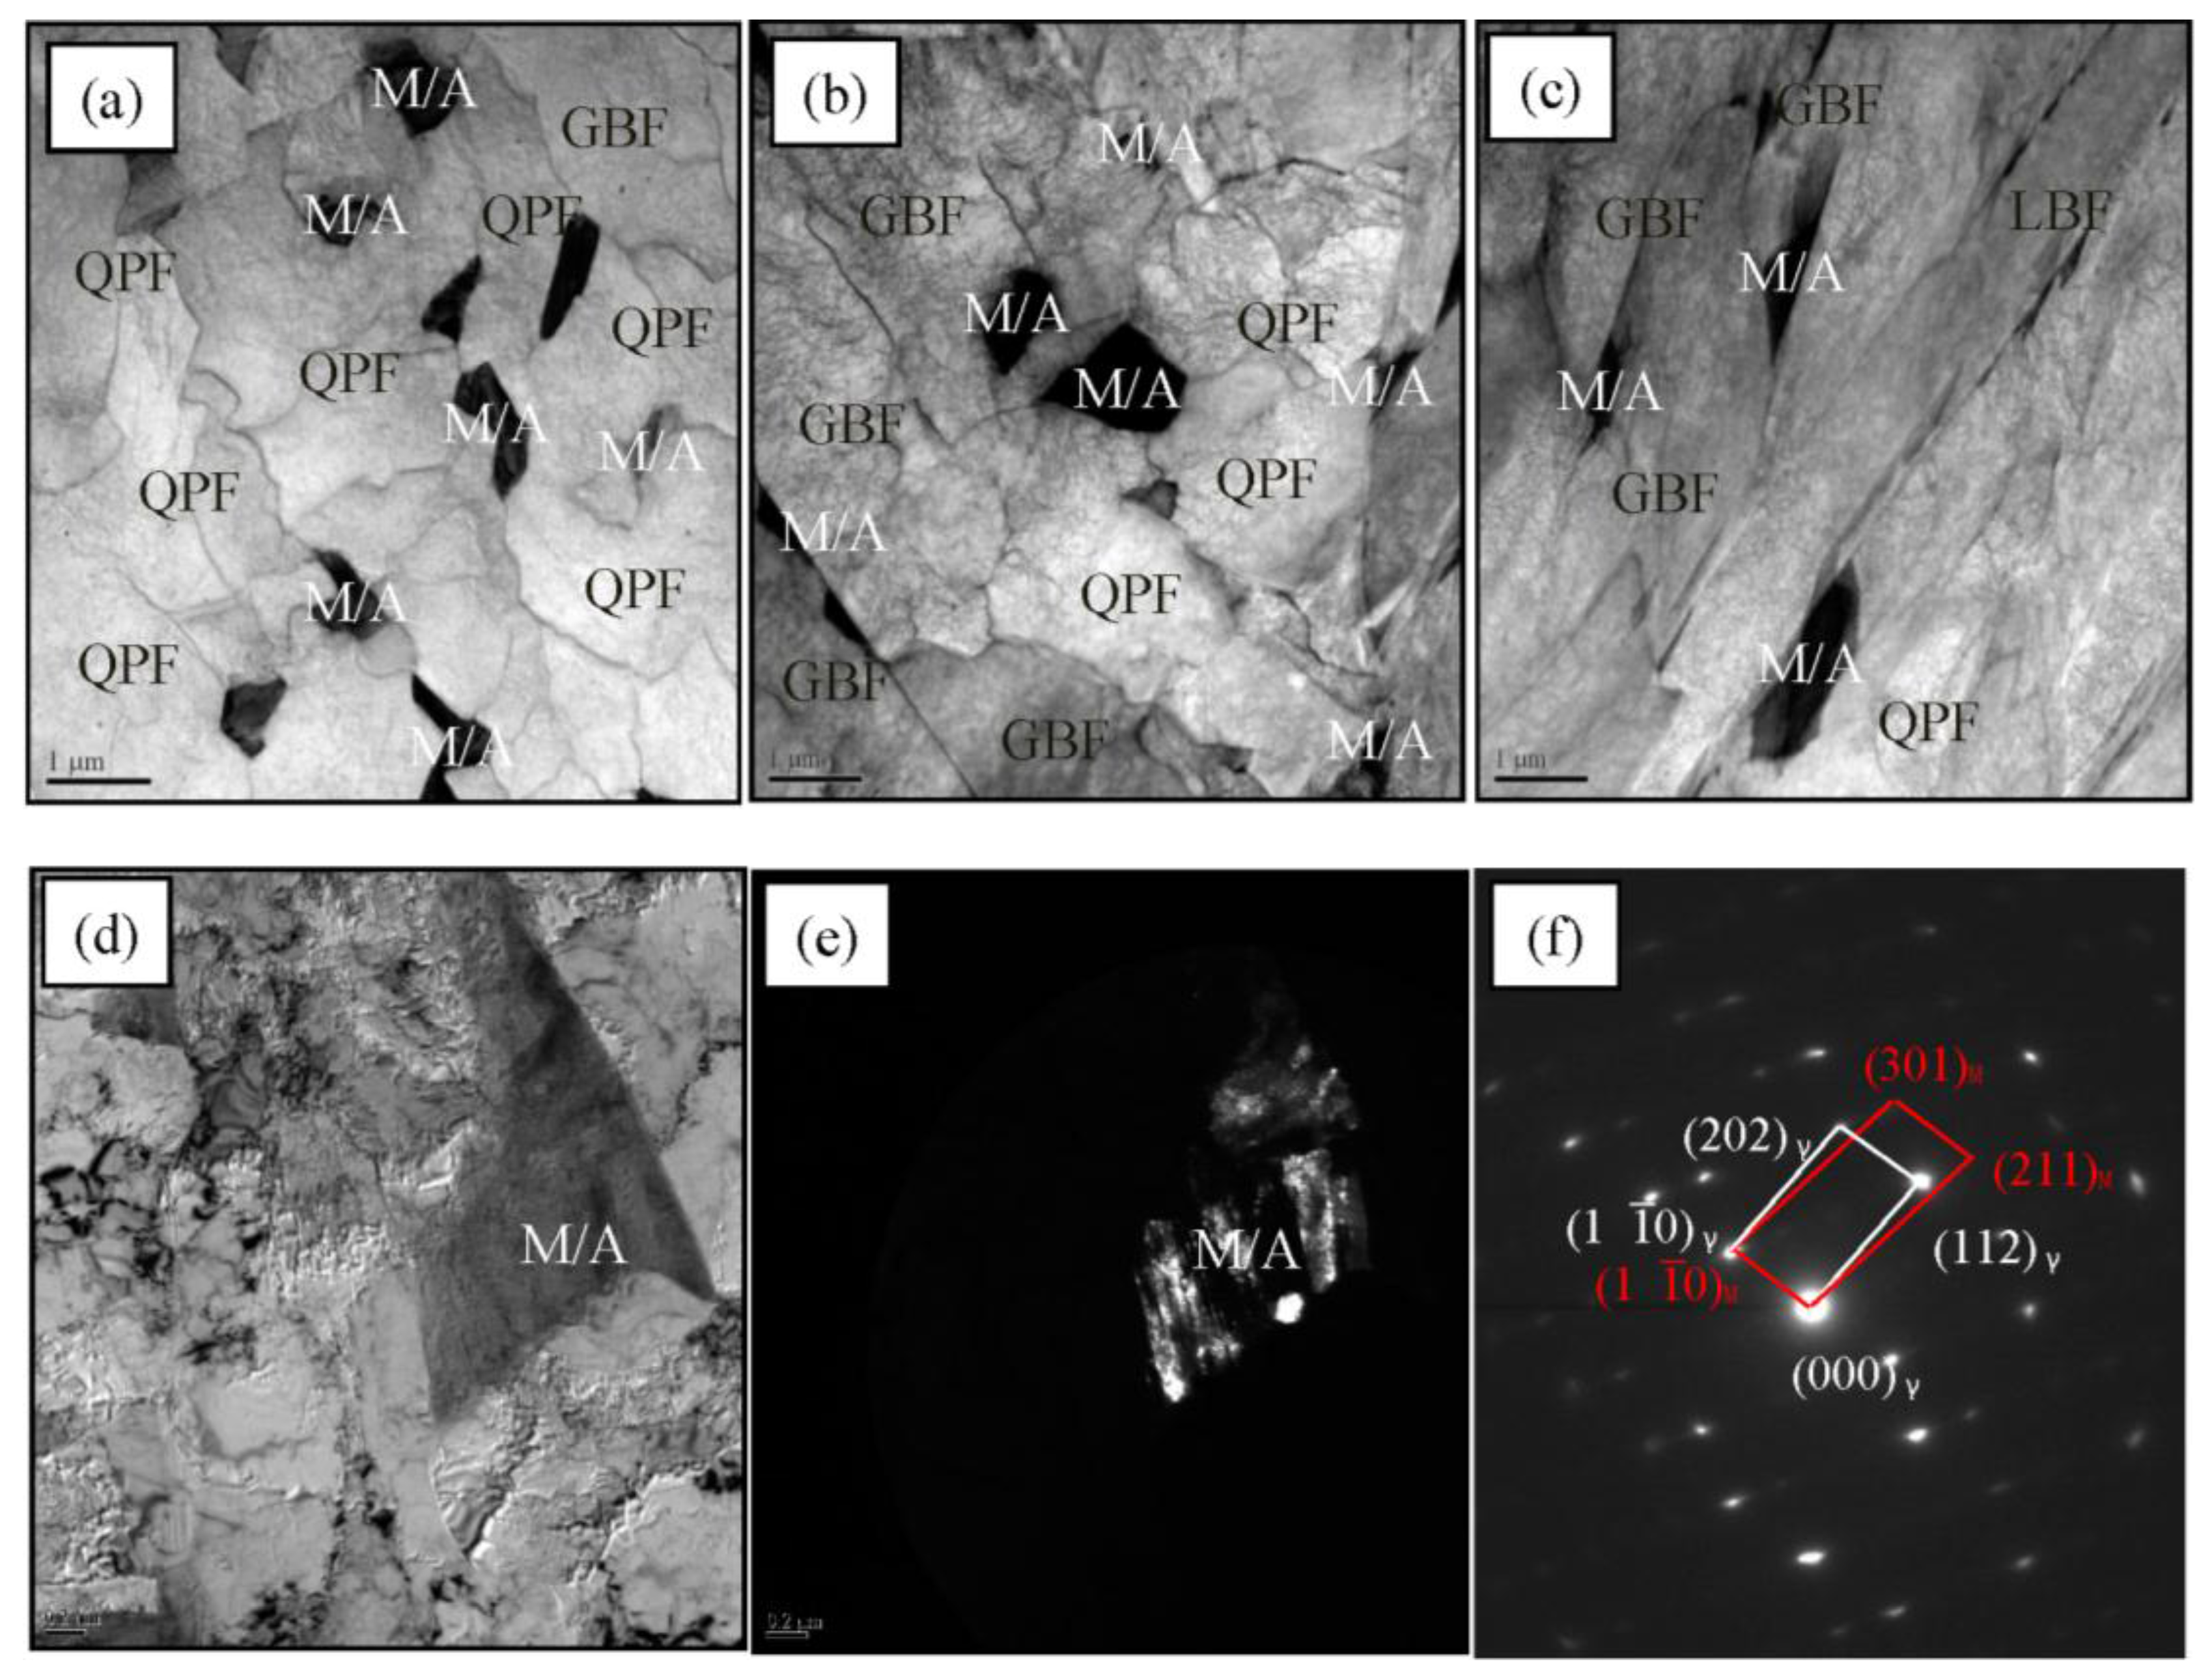
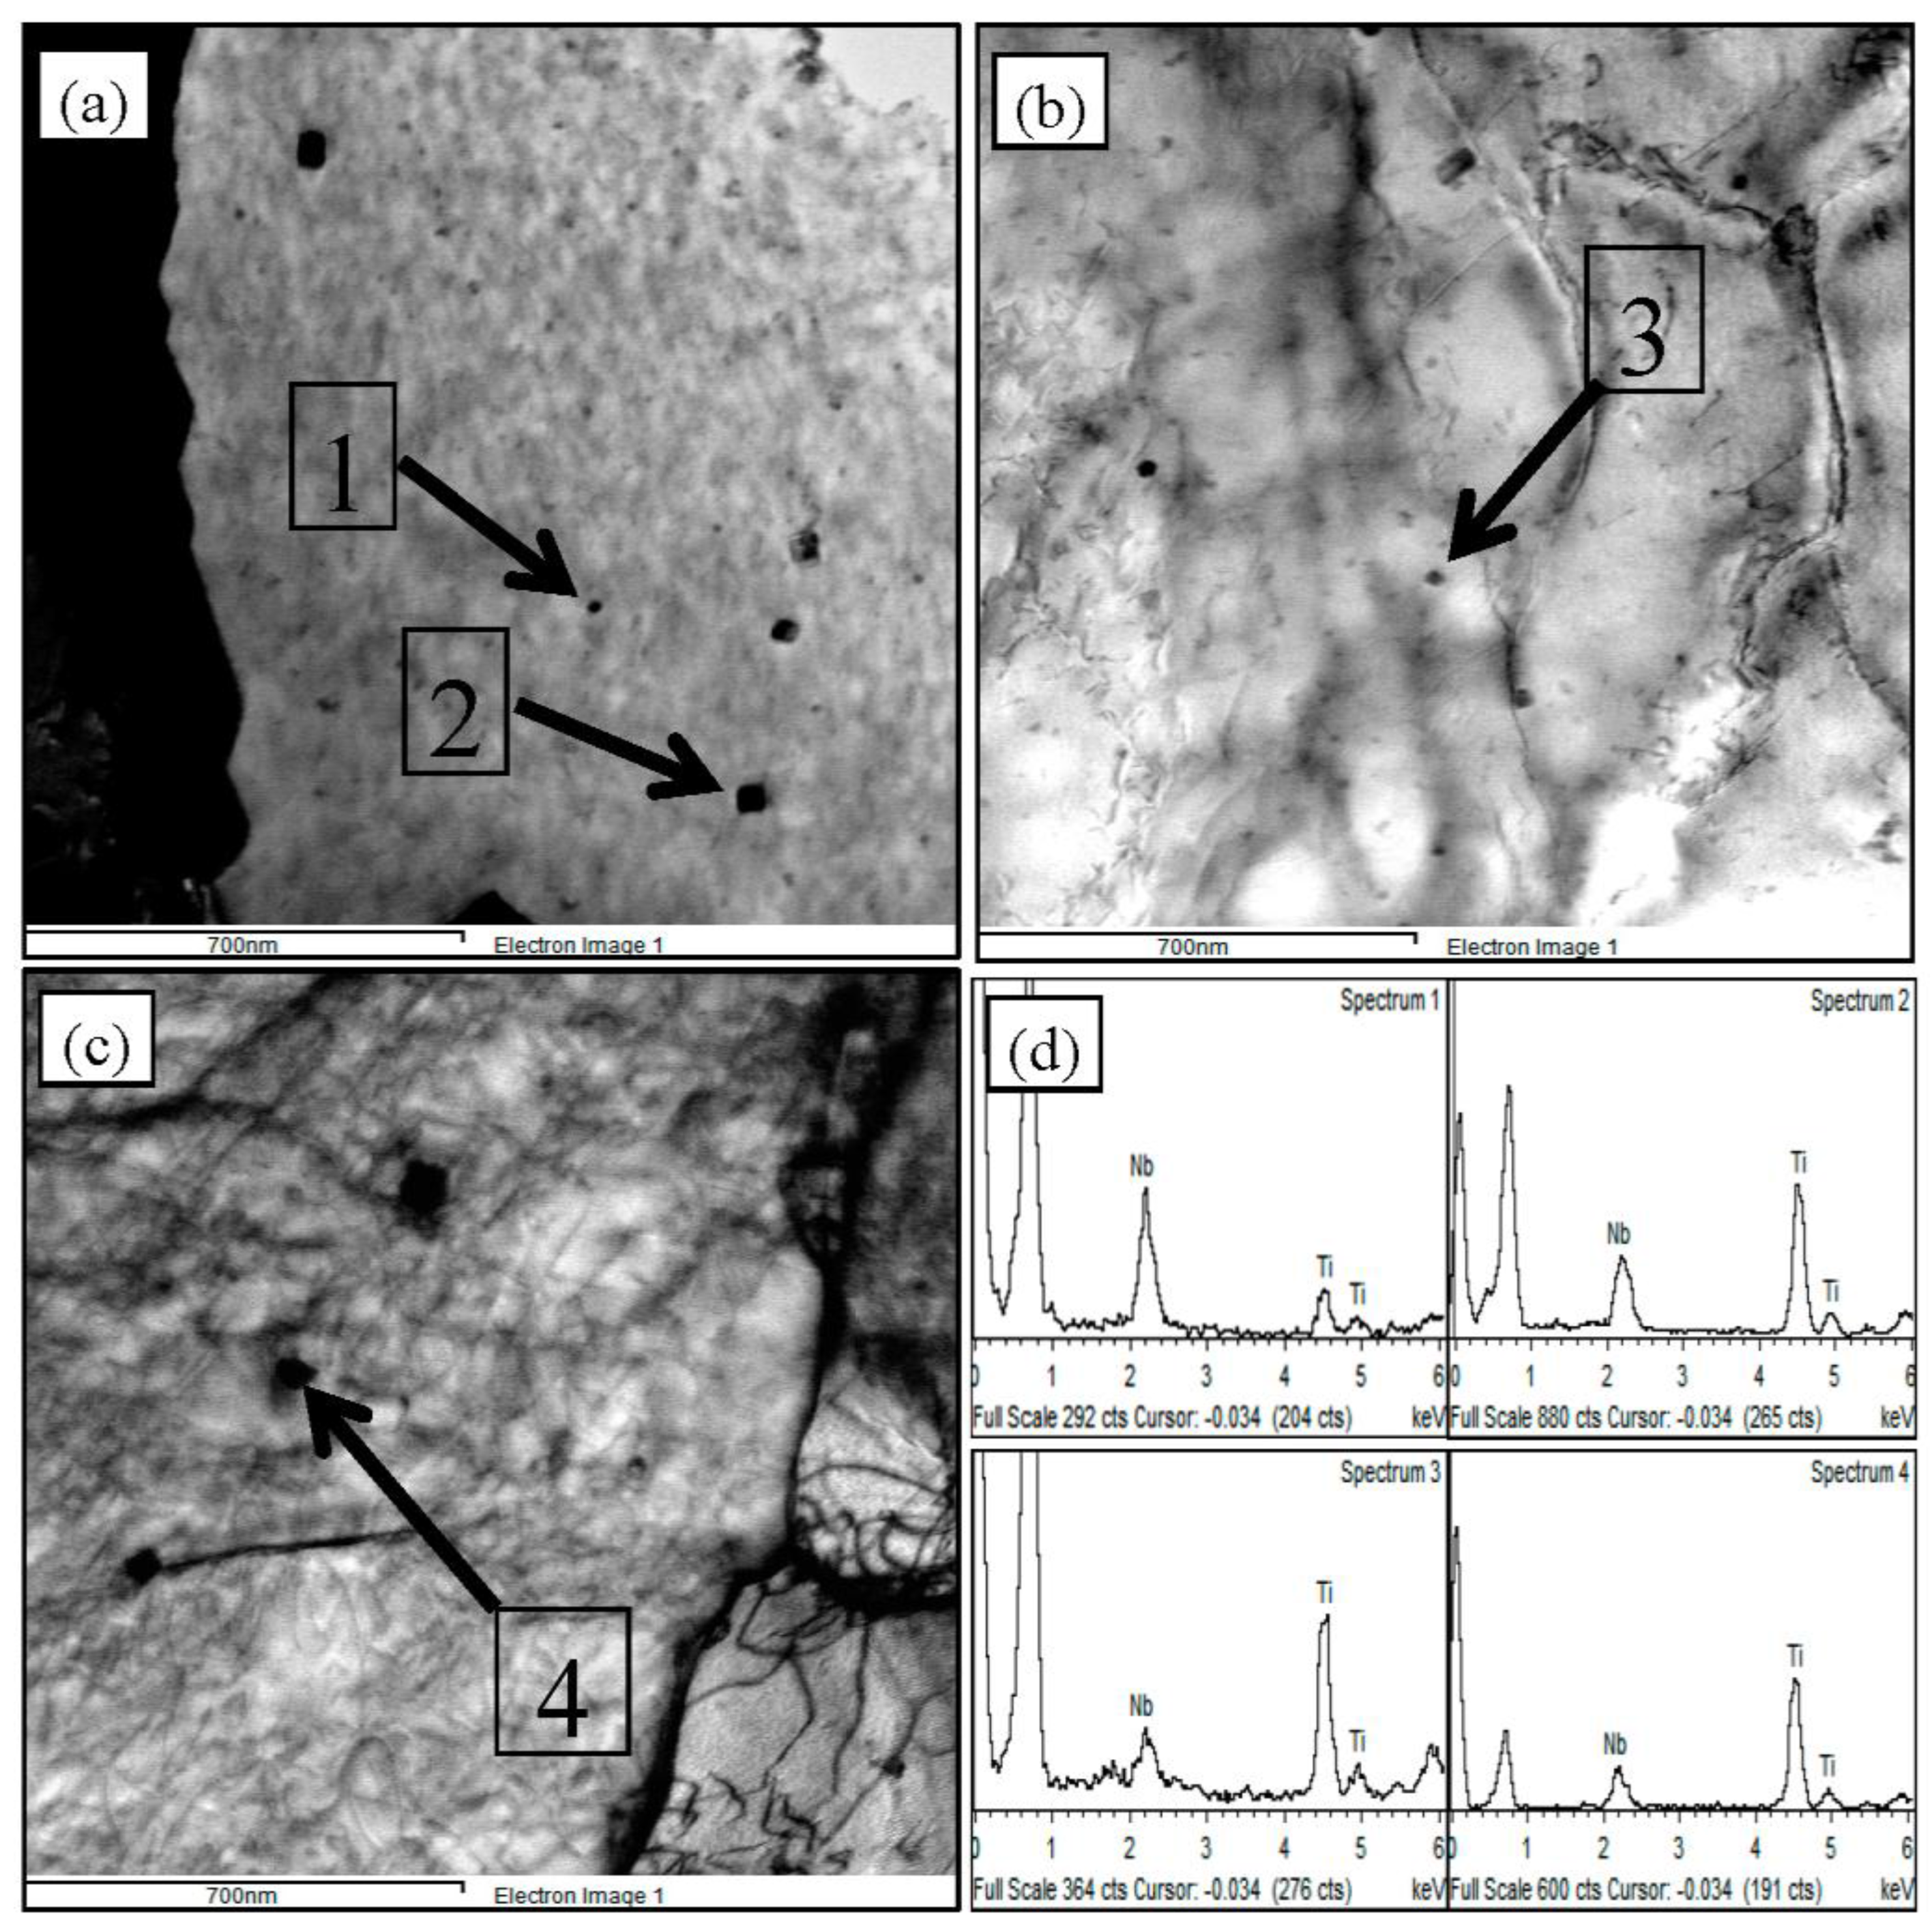
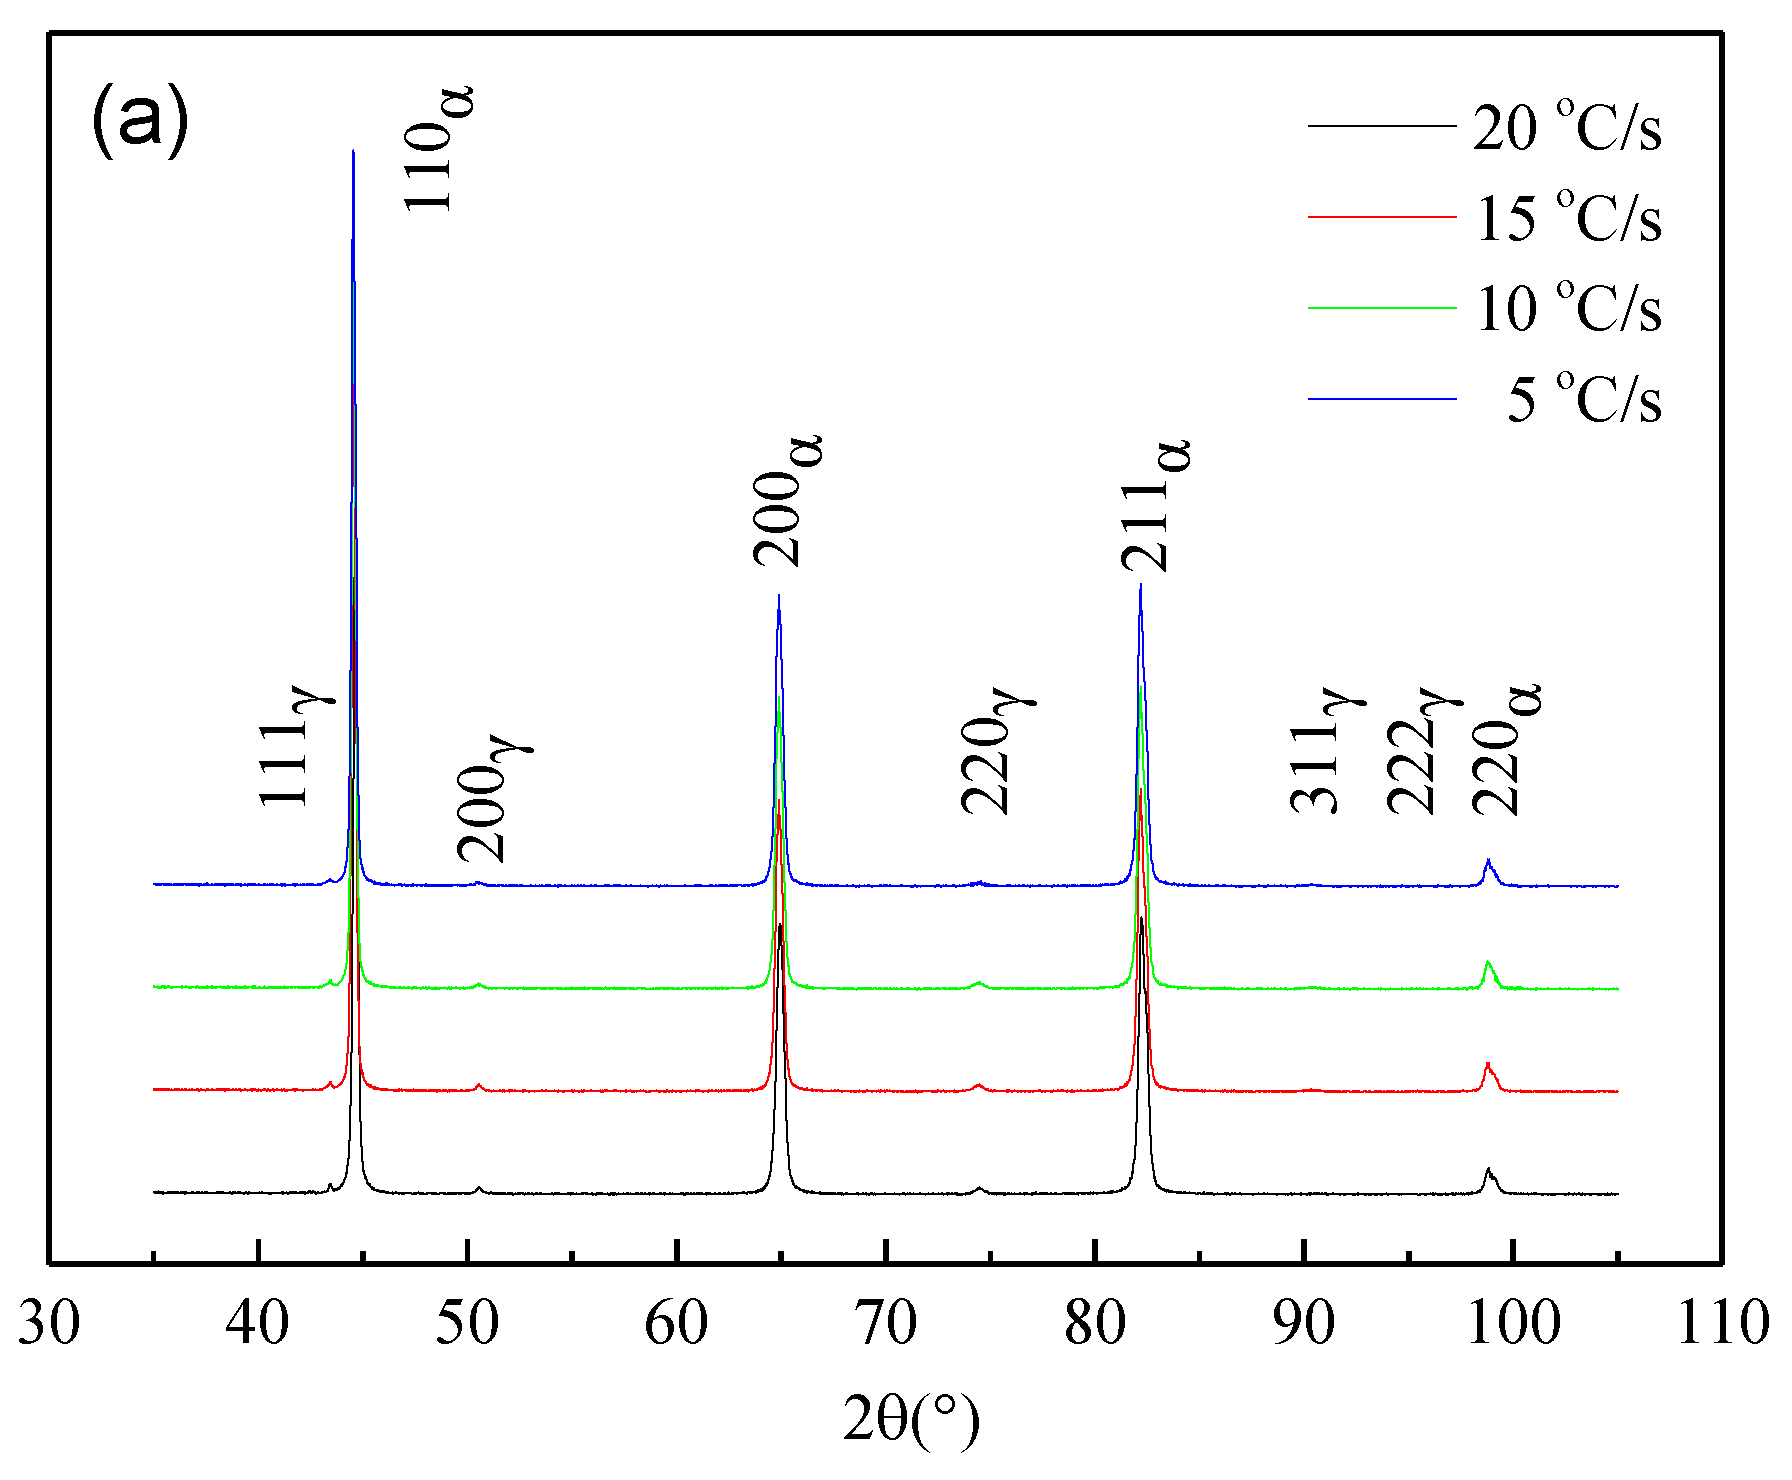
Multiphase Microstructure Observations

Typical optical micrographs displaying the microstructure (upper) and M/A constituent (lower) are shown in Figure 4, and the quantified features are summarized in Table 3. As the figure indicates, the microstructure of samples cooling at different rates is composed of QPF, GBF and a little lath bainitic ferrite (LBF), dispersed with M/A constituent. The two different morphologies of bainitic structure, i.e., GBF and LBF, are distinguished according to systematic descriptions by Bramfiti et al. [23] and Bhadeshia et al. [24]. The GBF as a transformation product during continuous cooling is essentially a mixture of blocky ferrite with dispersed granular constituent of martensite and retained austenite, which are more easily distinguished using Lepera’s reagent etched sample. However, after the QPF and GBF formation ends, the LBF can form in the region of residual austenite with carbon in rich, yet not rich enough to produce M/A constituent, and grows as sheaves with the transformation proceeding. The GBF forms mainly at the prior austenite grain (PAG) boundary and intragranular QPF. Moreover, the massive and slender M/A constituents are dispersed at the boundaries of the QPF, GBF, and even PAG. The amount of GBF increases gradually at the expense of the QPF with increased cooling rate. In addition, as the table shows, the area fraction, fM/A, and average size of the M/A constituent decreases from 7.7% to 3.5% and from 1.9 to 0.3 μm, respectively, with increased cooling rate; the amount of massive M/A constituent also decreases, whereas its slender counterpart increases.
The typical TEM observations are exhibited in Figure 5. The ferrite plates formed from the parent austenite phase in each sample, while the island-like phase remained. The irregular plates of QPF have a relatively low dislocation density (Figure 5a,b), whereas the parallel plates comprising the GBF and a little LBF possess a high density of dislocations (Figure 5b,c), Furthermore, the bright (Figure 5d) and dark (Figure 5e) field images, as well as the selected area diffraction pattern (Figure 5f) reveal that the island is a constituent phase of martensite and austenite. All slender, and a part of the massive M/A constituent, are located at the boundaries of the GBF plates; the other massive constituent is dispersed in the regions surrounded by the QPF plates or between the QPF and GBF plates.
Figure 6 reveal two types of precipitate embedded in the ferrite matrix, namely Ti-rich (Nb,Ti)(C,N) and Nb-rich (Nb,Ti)(C,N) particles, with the sizes of 40–80 nm and 10–30 nm, respectively. The former persisted possibly from the reheating stage and even synthesized during the hot deforming, while the latter mainly formed during the controlled cooling. Some of these fine particles pin dislocations. As Table 3 shows, the average size, Dp, and volume fraction, fp, of precipitates in each sample decrease with the increased cooling rate.
Figure 7a,b shows the XRD pattern and its enlarged details for each sample, and the fraction of retained austenite and the dislocation density are summarized in Table 3. As the table shows, both the volume fraction of retained austenite, fRA, and the dislocation density, ρ, increase with increased cooling rate.
The MED of the QPF and GBF grains of each sample was estimated using EBSD. The typical inverse pole figures are indicated in Figure 8 and the MED for MTA ranging 2°–30° and varied cooling rate in Figure 9. The MED of the QPF and GBF grains decreases monotonically with decreasing MTA and increasing cooling rate, respectively. Moreover, the boundaries of the QPF and GBF grains can be divided into two categories: high angle (θ > 15°) and low angle (2° ≤ θ ≤ 15°). The fraction of low-MTA boundaries, f2°≤θ≤15°, and the corresponding MED2°≤θ≤15° are listed in Table 3. As the table shows, the former increases, whereas the latter decreases with increased cooling rate.

4. Discussion

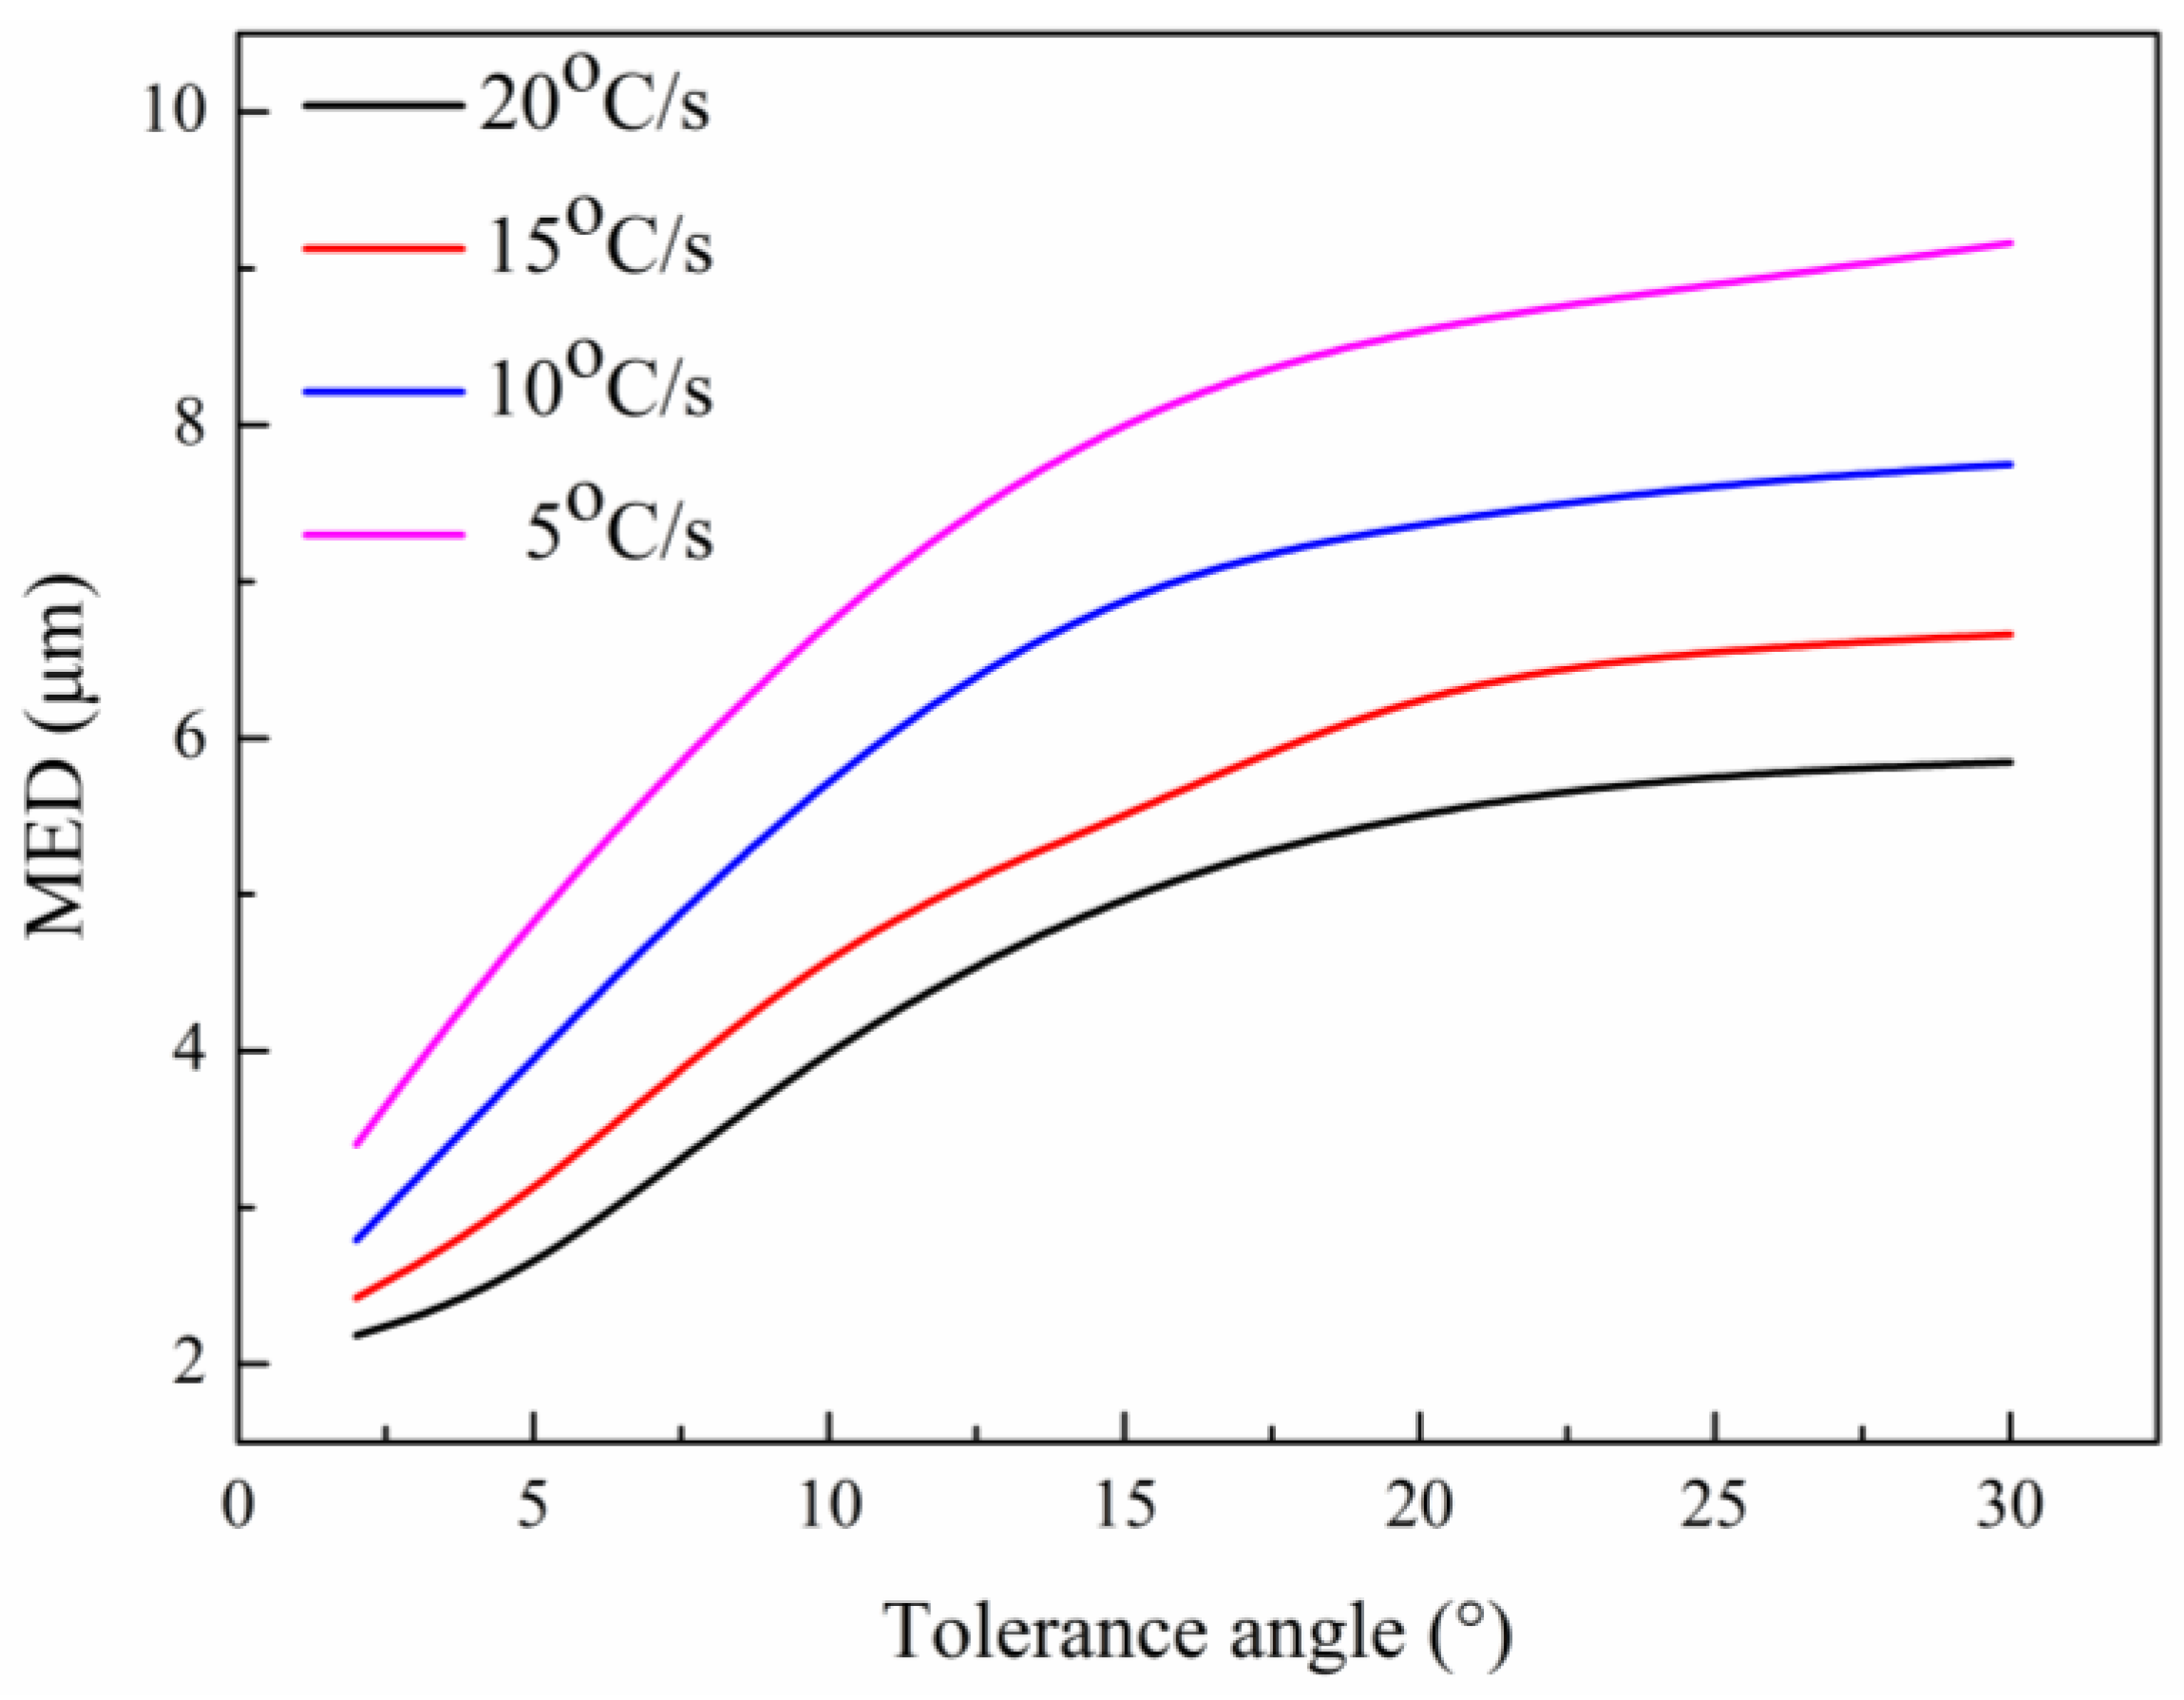
4.1. Effect of Cooling Rate on the Microstructure

As Figure 4 and Figure 5 show, a multiphase microstructure consisting of QPF + GBF + M/A constituent formed in each sample, with the quantified attributes summarized in Table 3. Obviously, the GBF increases, whereas the QPF and M/A constituents decrease with increased cooling rate. The mechanism governing the effect of accelerated cooling on this microstructure was determined experimentally.

4.1.1. Effect of Cooling Rate on the QPF + GBF

Dilatation curve (Figure 10) was measured during continuous cooling of each sample that was prior imposed by two-pass compressing and initial cooling to 780 °C as described in Section 2; the starting temperature (Ar3) for the transformation of γ → QPF + GBF in each sample is also indicated in the figure.
As Figure 10 shows, the sample with the highest cooling rate (20 °C/s) has the lowest Ar3 (613 °C). As one of transformed products (Figure 4e and Figure 5c) under this highest-rate cooling condition, the GBF, which nucleates and grows mainly from the PAG boundaries in high densities, is the dominant phase of this mixed-microstructure steel. The QPF, in contrast, nucleates and grows intragranually and only in small amounts. Therefore, the thermodynamic driving force for the nucleation of GBF in the sample cooling at 20 °C/s is higher than that of the QPF. This result is in agreement with previous works on continuous cooling transformation of bainitic steel [19,25]. Moreover, the Ar3 increases to 622, 631, and 652 °C, when the cooling rate is lowered to 15, 10, and 5 °C/s, respectively. This indicates that the γ/α transformation in the sample cooling at a lower rate begin at an elevated temperature. In addition, although the GBF is still the dominant phase in the mixed QPF GBF microstructure, the amount of QPF increased significantly with decreased cooling rate. The nucleation and growth of the QPF during slower cooling therefore gradually constitutes the dominant transformation. In addition, QPF mainly nucleates in the dislocation substructure of TMCP-processed steel [15,18] and grows intragranually (Figure 4 and Figure 5); the amount of QPF increases with decreased cooling rate from 20 to 5 °C/s. The above-mentioned results confirm that the increased cooling rate promoted the formation, and thereby resulted in increasing fractions of GBF.
On the other side, the sample (cooling at 20 °C/s) with the lowest Ar3 has the highest degree of supercooling for the transformation of γ → QPF + GBF. This probably leads to the nucleation of the QPF and GBF at the highest rate and results ultimately in the finest equivalent grain. Furthermore, as Figure 8 shows, the accelerated cooling and hence the decreasing Ar3 brings about a decreasing equivalent grain size of the QPF and GBF (i.e., the MED) at any given MTA.
The dislocation density, ρ, in the QPF + GBF matrix of the samples also varies with the Ar3. That is, the ρ increases with decreasing Ar3, due to increased cooling rate, which concurs with the works of Bhadeshia et al. [24,26]. In those studies, they proposed that the ρ of bainite increases with decreasing Bs (the starting temperature for bainite transformation), and could be described empirically as a function of the Bs, indicating a strong negative correlation between the ρ and the Bs.

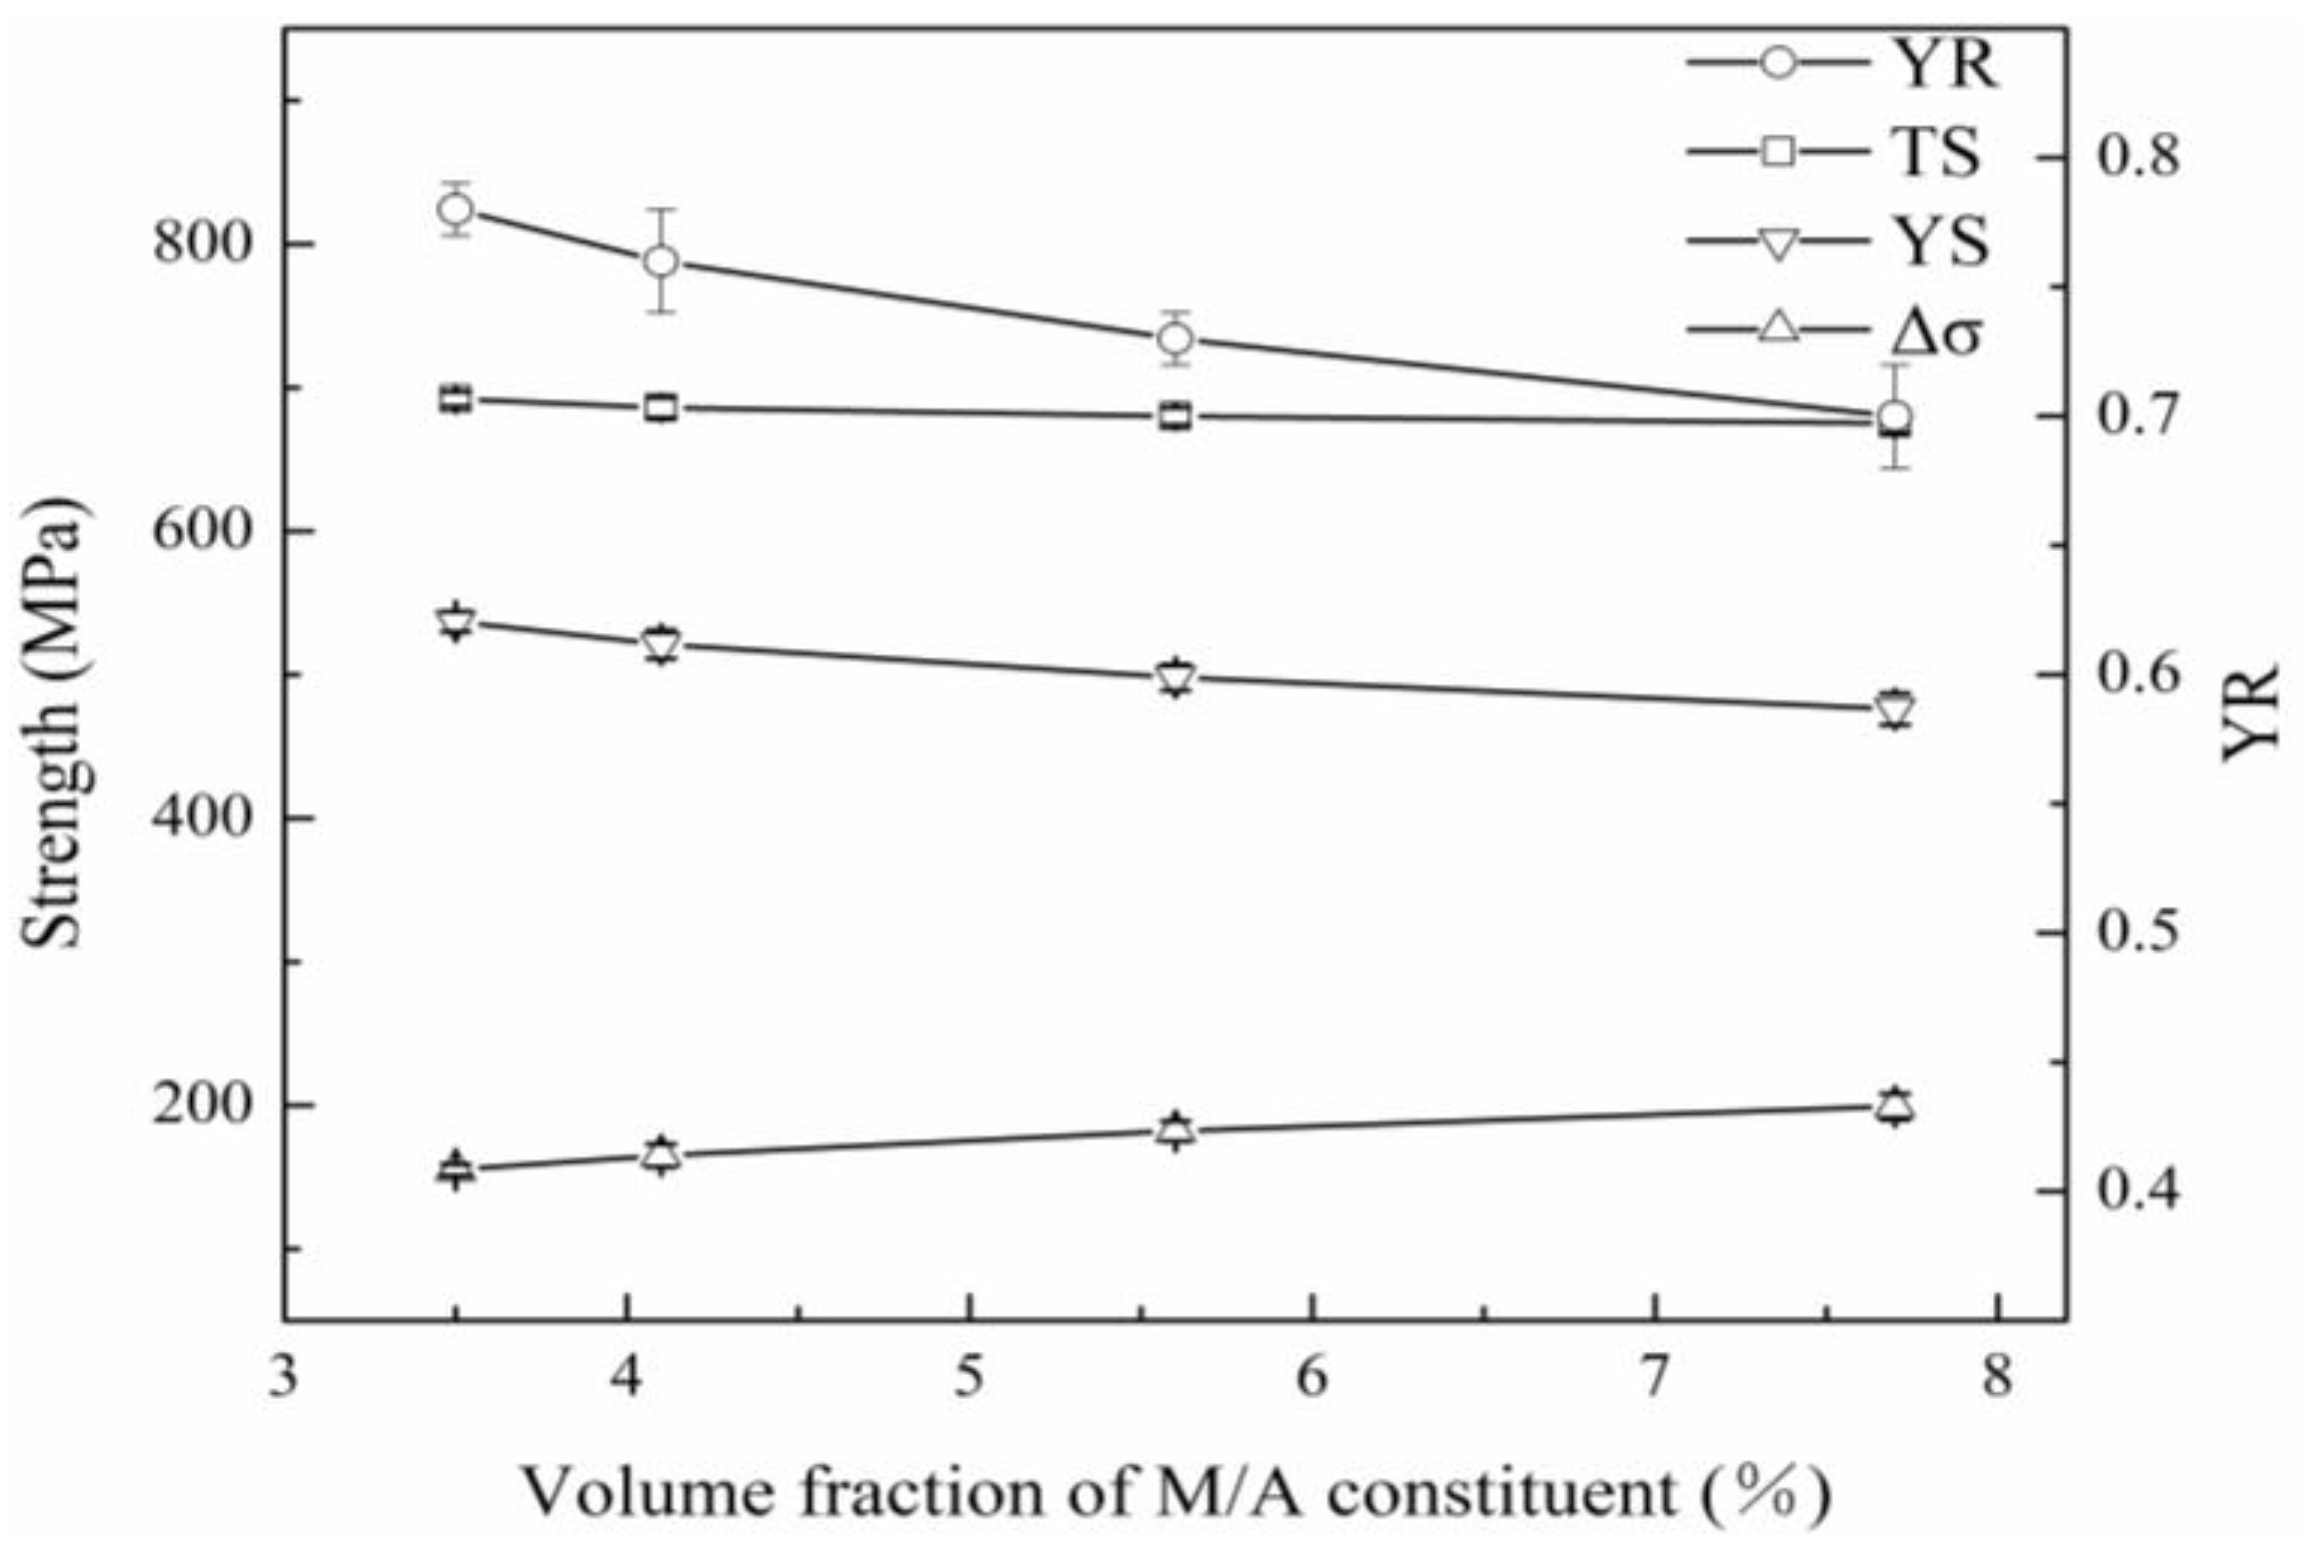
4.1.2. Effect of Cooling Rate on the M/A Constituent

As Figure 4 and Figure 5 show, the amount of QPF in the samples increases with decreased cooling rate. In fact, the surrounded regions by adjacent QPF plates increase with increasing number of growing QPF plates, which leads to an increasing amount of metastable austenite (γ′) during the continuous transformation occurred in cooling and subsequent re-reddening. The transition of γ → QPF + GBF + γ′ is, however, accompanied by the diffusion of C atoms from the QPF and the GBF to γ′. This leads to the C-enrichment of γ′ and correspondingly an increasing amount of M/A constituent with decreased cooling rate, as shown in Figure 4 and Figure 5 and Table 3.
Moreover, the carbon level in M/A (in wt. %) for each sample with different cooling rate can be estimated by considering the following simplistic carbon balance:
C e = f α × C α + f M / A × C M / A
where fα and fM/A are volume fraction of ferrite and M/A constituent (fα + fM/A = 100%), respectively; Ce, Cα and CM/A are carbon content in experimental alloy (0.06 wt. %), and ferrite (assumed to be 0.02 wt. %), and M/A constituents, respectively. The estimated results are summarized in Table 3, indicating that the carbon level in M/A constituent increases with increasing cooling rate. Although less M/A is present at the highest cooling rate, a larger fraction remains austenite. This result might imply that the thermal stabilization of austenite is enhanced by higher carbon content. Therefore, increased cooling rate can eventually lead to increasing fraction of retained austenite in the M/A constituent, as determined from XRD analyses (Figure 7) and quantifications (Table 3).
It is worth noting that subsequent to accelerated cooling, the re-reddening process can enhance the diffusion of carbon atoms from the QPF and the GBF to γ′, and accordingly promote the formation of M/A constituent and retained austenite in them.

4.2. Effect of Cooling Rate on the YS

The final microstructure of the sample, consisting of QPF + GBF + M/A, possesses a variety of microstructural features, such as the effective grain boundaries of the QPF + GBF, dislocations, carbonitride precipitates, and the M/A constituent. These features all have the corresponding effects on the YS. Each microstructural feature and its effect on the YS, varies with the cooing rate (Table 2). the YSy) of low-C microalloyed bainitic steel can be described by a linear sum of the individual strengthening contributions, according to [19]:
σ y = σ 0 + σ s + σ d + σ p + σ M / A
where σ0 is the lattice friction stress; σs is the solid solution strengthening; σd is the strengthening originated from the boundaries of the QPF + GBF effective grain; σρ is the strengthening provided by dislocations of the QPF + GBF; σp is the carbonitride induced precipitation strengthening; and σM/A is the strengthening due to the hard M/A constituent. The YS is contributed by each of these strengthening factors.
The YS, σy, can be described as a function of the grain size using the Hall-Petch relation [27,28], which is given as follows:
σ y = σ 0 + k HP d 1 / 2
where kHP × d−1/2 and σ0 are the contributions from boundary strengthening and strengthening provided by other mechanisms, respectively. In this attempt, kHP is the structural constant that stands for the effect of the effective grain size of matrix QPF + GBF on the strength; d is the effective grain size corresponding to the MEDθ, which represents the MED of the QPF and GBF grains with boundaries at a certain MTA, θ. Low-MTA boundaries can control the movement of dislocations, according to previous works [29,30]. Furthermore, I. Gutierrez [31] proposed that an effective grain with low-MTA boundaries at a threshold angle of 2°, comprises the smallest microstructural unit that controlled the YS. Low angle boundaries (2° ≤ θ ≤ 15°) are related to the ferrite sub-units within the bainitic packets/sheave, while high angle boundaries (θ > 15°) are relevant to the bainitic packets/sheaves, according to [32]. The effect of MED of QPF grains with MTA ranging 2°–30° on the YS was also estimated in our previous work, producing a minimum correlation of 95% between the YS and MED−1/2, for MTA values of 2°–6° [2], which gave a definition of the effective grain size. A similar study was also carried out in the present work. For MTA values of 2°–30°, σy was plotted as a function of MED−1/2 for the QPF and GBF grains; for low MTA ranging 2°–15°, σy exhibited a strong linear relation to MED−1/2 with correlation coefficients of 0.95–0.99. As such, a linear fitting of the σy vs. MED−1/22°≤θ≤15° was made for all effective grains with an MTA of 2° ≤ θ ≤ 15°, as indicated in Figure 11, yielding a correlation coefficient of 0.97. The obtained linear regression equation is:
σ d = 306 + 420.6 d 1 / 2
where d is the effective grain size, MED2°≤θ≤15°, in μm. The strengthening contribution from the effective grain of the QPF and GBF in the samples cooling at different rates is summarized in Table 4. As the table shows, the contribution from boundary strengthening increases with increased cooling rate, owing to decreasing effective grain size of the matrix QPF + GBF (Table 3).
The estimations on contribution of dislocation strengthening (σρ) to the YS were made according to [32]:
σ p = α M G b ρ 1 / 2
where α, M, G, b, and ρ are a constant (i.e., 0.15) [32], Taylor factor (2.73 for ferrite steel [32]), shear modulus (81.6 GPa for Fe), Burger’s vector (0.248 nm for Fe), and the average dislocation density, respectively. The value of ρ was determined quantitatively from the XRD spectrum of each sample shown in Figure 7. The strengthening contribution from the dislocations of matrix QPF + GBF to the YS of each sample is summarized in Table 4. As the table shows, the average dislocation density of matrix QPF + GBF increases with increased cooling rate, thus leading to an increasing contribution from dislocation strengthening.
A high density of small Nb-rich (Nb,Ti)(C,N) precipitated particles mainly in ferrite can provide a significant strengthening contribution [33]. Figure 6 and Table 3 confirm that a high volume fraction of Ti- and Nb-rich particles, with average sizes of 16–28 nm, formed in the QPF and GBF matrix of the present Nb-Ti-containing HSLA steel. Therefore, the estimations on strengthening contribution from fine dispersed precipitates must be made, and were performed using the following equation [34]:
σ ppt = 11.3 f p 1 / 2 D p ln ( D p / 0.496 ) × 10 3
where fp and Dp are the volume fraction and average size (in nm) of precipitated particles, as shown in Figure 6 and Table 3. The contribution of precipitation strengthening to the YS is summarized in Table 4. As the table shows, the decreasing cooling rate lead to simultaneous decreases in Dp and increases in and fp (Table 3), thereby resulting in increasing contribution from precipitation strengthening.
In addition to the aforementioned strengthening mechanisms, the sum (110 MPa ± 5 MPa) of other individual strengthening contributions, σ0 + σs + σM/A, is approximately the same for all the steels considered (Table 4).
Except for the sum σ0 + σs + σM/A, the individual factors can be described in descending order of their strengthening contribution as, effective grain of the GBF and QPF, dislocations and precipitates. In another aspect, the increasing cooling rate led to a decreased density of fine precipitates (Table 3) and in turn to a decreased strengthening contribution. However, this increased cooling rate also resulted in simultaneous a decreasing effective grain size of the GBF and the QPF and an increasing dislocation density, yielding in turn an enhanced strengthening contribution. As a result, the overall YS increases with the increasing cooling rate.

4.3. Effect of Cooling Rate on the TS and YR

The TS and YS simultaneously decrease with decreasing cooling rate, as shown in Figure 3 and Table 2; the YS decreases, however, in a magnitude higher than the TS. Accordingly, the strain-hardening magnitude Δσ increases, whereas the YR decreases, indicating an improved capacity for work-hardening or an enhanced resistance to overloading. This also indicates an enhanced integrity of the steel structure for unexpected deformation [35] and an improved tolerance for defects [36], from an engineering viewpoint.
The final microstructure of the steels with different cooling rates, as shown in Figure 4 and Figure 5, is a mixture of QPF + GBF + M/A constituent. the micro-hardness of the M/A constituent is higher than that of the bainitic ferrite matrix, according to previous studies [16,37]; The M/A constituent can act as a mixed hard phase during tension, and hence induce a high degree of plastic deformation of ductile ferrite phase via two- or three-stage work-hardening, according to the mechanism of typical dual-phase steel [38]. Therefore, the overall strain-hardening capacity can be improved by increasing the amount of hard phase [35,38].
The effect of M/A constituent on the Δσ, TS, and YR of the samples was also estimated intuitively. As Figure 12 and Table 3 indicate, the area fraction of M/A constituent, fM/A, increases from 3.5% to 7.7% with decreasing cooling rate from 20 to 5 °C/s, correspondingly, the Δσ, in turn, increases with increasing fM/A, and effective grain size of GBF and QPF. Accordingly, the YR declines. The decreasing YR suggests that the TS decreases much slower than the YS with increasing effective grain size, due to decreasing cooling rate. This is mainly because the TS is less sensitive to grain size than the YS [39,40]. Nevertheless, the results revealed that the overall tensile properties including the Δσ, TS, and YR can be regulated with the cooling rate properly controlled.

5. Conclusions

The effect of controlled cooling on the microstructure and tensile properties of low C Nb-Ti containing HSLA steel undergoing a group of simulated TMCPs has been investigated. The conclusions are made as follows:
(1)
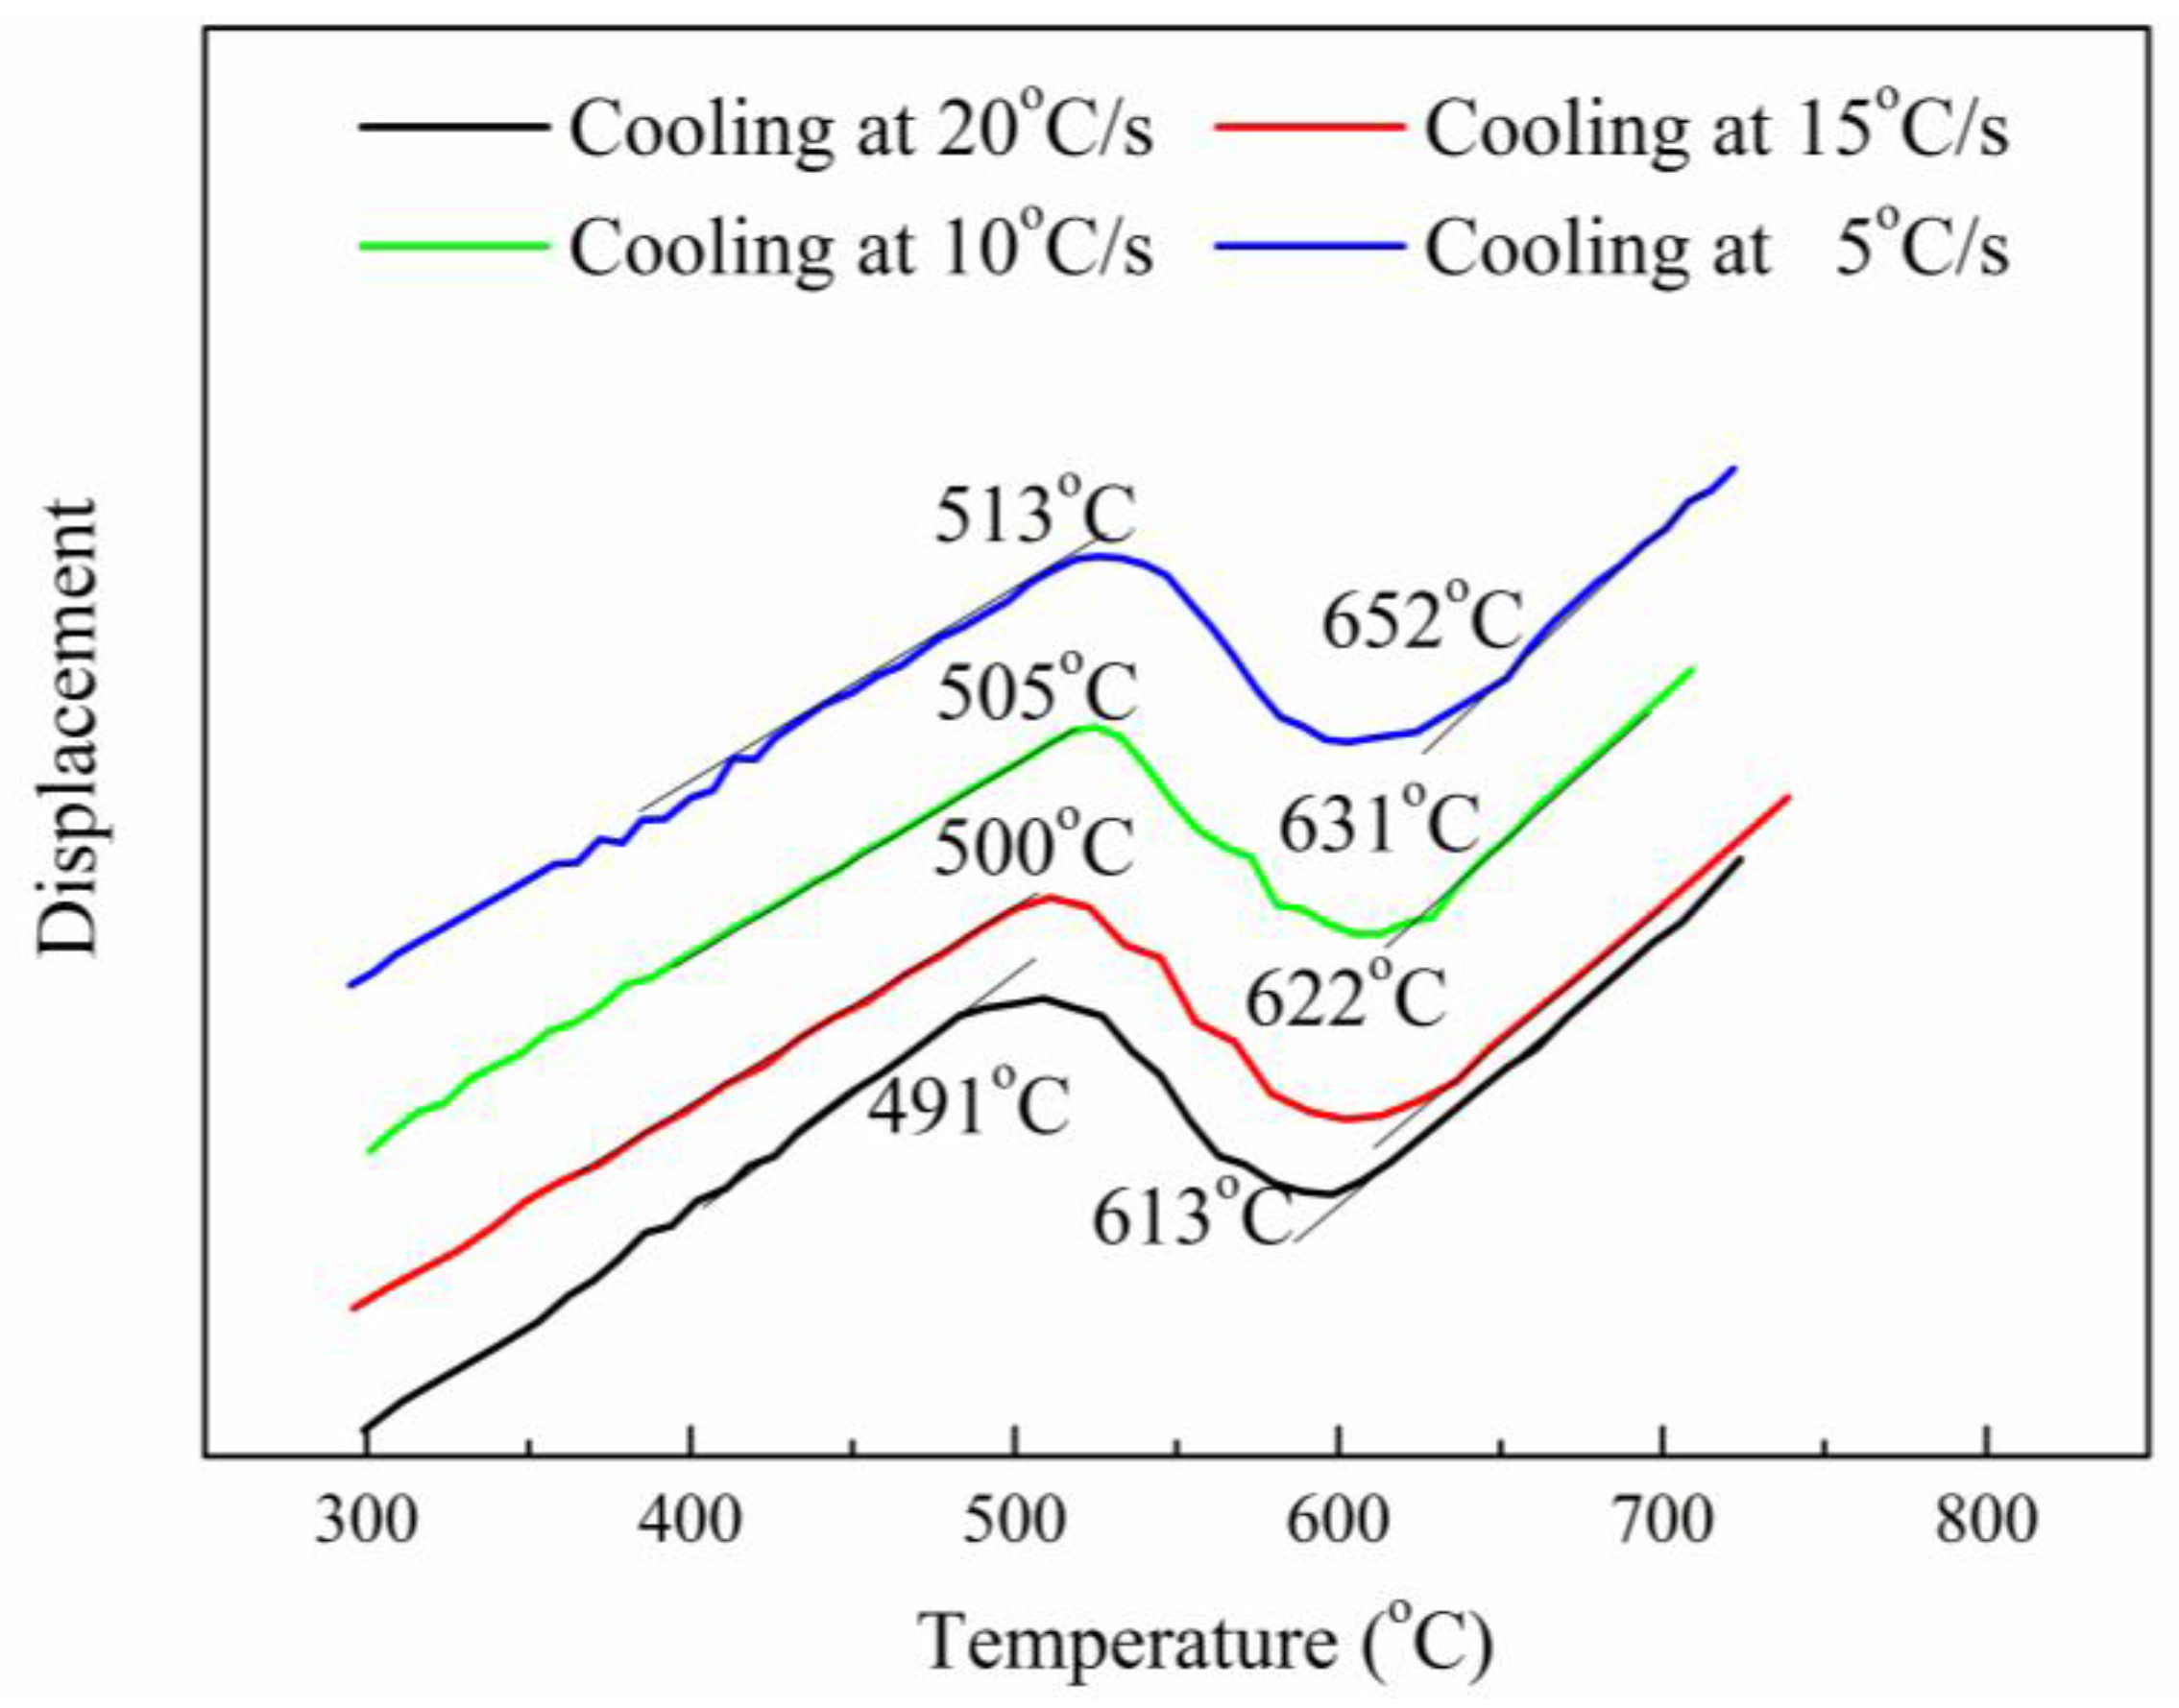
The microstructure consisting of QPF + GBF + M/A constituent forms in samples with varied cooling rate of 5–20 °C/s. The Ar3 decreased with increasing cooling rate, resulting in increasing GBF, and decreasing QPF and M/A constituents.
(2)
The increasing cooling rate reduces the precipitation of fine particles, but leads to a decreasing effective grain size of GBF and QPF, and an increasing density of dislocations, thereby resulting in an increase in the overall YS.
(3)
The decreasing cooling rate leads to increased amounts of M/A constituent, and hence an improved overall strain-hardening capacity of the multiphase microstructure, accordingly resulting in a lowered YR.

Acknowledgments

This work is supported by the National Natural Science Foundation (Grant No. 51471142 and 51671165) and the Natural Science Foundation—Steel and Iron Foundation of Hebei Province (Grant No. E2013203373), P. R. China.

Author Contributions

Qingfeng Wang and Yi Fan conceived and designed the experiments; Qian Wang performed the experiments; Fucheng Zhang and Hongwu Liu analyzed the data; Tongliang Wang contributed analysis tools; and Qingfeng Wang and Yi Fan wrote the paper.

Conflicts of Interest

The authors declare no conflict of interest.

References

  1. Kim, Y.M.; Kim, S.K.; Lim, Y.J.; Kim, N.J. Effect of microstructure on the yield ratio and low temperature toughness of line-pipe steels. ISIJ Int. 2002, 42, 1571–1577. [Google Scholar] [CrossRef]
  2. Fan, L.; Zhou, D.; Wang, T.; Li, S.; Wang, Q. Tensile properties of an acicular ferrite and martensite/austenite constituent steel with varying cooling rates. Mater. Sci. Eng. A 2014, 590, 224–231. [Google Scholar] [CrossRef]
  3. Tomma, K.; Tanaka, M.; Matsuoka, K.; Kasuya, T.; Kawasaki, H. Development of Application Technologies for Bridge High-performance Steel, BHS. Nippon Steel Tech. Rep. 2008, 97, 51–57. [Google Scholar]
  4. Kimihiro, N.; Kazuyuki, M.; Naoyoshi, T. High performance steel plates for bridge construction-high strength steel plates with excellent weldability realizing advanced design for rationalized fabrication of bridges. JFE Tech. Rep. 2005, 5, 30–36. [Google Scholar]
  5. Tatsumi, K.; Hiroyuki, S.; Yasushi, K. High tensile strength steel plates and welding consumables for architectural construction with excellent toughness in welded joint. JFE Tech. Rep. 2005, 5, 45–52. [Google Scholar]
  6. Ishikawa, N.; Endo, S.; Kondo, J. High performance UOE linepipes. JFE Tech. Rep. 2006, 1, 20–26. [Google Scholar]
  7. Fan, L.; Wang, T.; Fu, Z.; Zhang, S.; Wang, Q. Effect of heat-treatment on-line process temperature on the microstructure and tensile properties of a low carbon Nb-microalloyed steel. Mater. Sci. Eng. A 2014, 607, 559–568. [Google Scholar] [CrossRef]
  8. Zhang, S.; Liu, K.; Chen, H.; Xiao, X.; Wang, Q.; Zhang, F. Effect of increased N content on microstructure and tensile properties of low-C V-microalloyed steels. Mater. Sci. Eng. A 2016, 651, 951–960. [Google Scholar] [CrossRef]
  9. Jang, J.; Ju, J.; Lee, B.; Kwon, D.; Kim, W. Effects of microstructural change on fracture characteristics in coarse-grained heat-affected zones of QLT-processed 9% Ni steel. Mater. Sci. Eng. A 2003, 340, 68–79. [Google Scholar] [CrossRef]
  10. Komizo, Y.; Fukada, Y. CTOD properties and M-A constituent in the HAZ of C-Mn microalloyed steel. Trans. Jpn. Weld. Soc. 1988, 6, 41–46. [Google Scholar] [CrossRef]
  11. Okada, H.; Ikeuchi, K.; Matsuda, F.; Hrivnak, I.; Li, Z. Metallographic investigation of M-A constituent-toughness deterioration and its improvement of weld HAZ with high heat inputs in 780 and 980 MPa class HSLA steel (Report 2). Trans. Jpn. Weld. Soc. 1994, 12, 236–242. [Google Scholar] [CrossRef]
  12. Kweon, K.; Kim, J.; Hong, J.; Lee, C. Microstructure and toughness of intercritically reheated affected zone in reactor pressure vessel steel weld. Sci. Tech. Weld. Join. 2000, 5, 161–167. [Google Scholar] [CrossRef]
  13. Tong, M.W.; Venkatsurya, P.K.C.; Zhou, W.H.; Misra, R.D.K.; Guo, B.; Zhang, K.G.; Fan, W. Structure–mechanical property relationship in a high strength microalloyed steel with low yield ratio: The effect of tempering temperature. Mater. Sci. Eng. A 2014, 609, 209–216. [Google Scholar] [CrossRef]
  14. Lambert, A.; Drillet, J.; Gourues, A.F.; Sturel, T.; Pineau, A. Microstructure of M–A constituent in HAZ of HSLA steel welds in relation with toughness properties. Sci. Technol. Weld. Join. 2000, 5, 1–13. [Google Scholar] [CrossRef]
  15. Akselsen, O.M.; Solberg, J.K.; Grong, O. Effects of M-A islands on intercritical HAZ of low carbon microalloyed steels. Scand. J. Met. 1988, 17, 194–200. [Google Scholar]
  16. Xu, W.W.; Wang, Q.F.; Pan, T.; Su, H.; Yang, C.F. Effect of welding heat input on simulated HAZ Microstructure and Toughness of a V–N Microalloyed Steel. J. Iron Steel Res. Int. 2007, 14, 234–239. [Google Scholar] [CrossRef]
  17. Wang, Y.; Wang, Q.; Liu, L.; Xu, W. Fracture mode of martensite-austenite constituents containing multiphase steel controlled by microstructural and micromechanical aspects. Mech. Adv. Mater. Struct. 2015, 22, 591–596. [Google Scholar] [CrossRef]
  18. Ferreira, H.C.; Boratto, F.J.M.; Buono, V.T.L. Determination of low levels of retained austenite in low-carbon high-manganese steel using X-ray diffraction. Mater. Sci. Eng. A 2015, 628, 110–115. [Google Scholar] [CrossRef]
  19. Yakubtsov, I.A.; Poruks, P.; Boyd, J.D. Microstructure and mechanical properties of bainitic low carbon high strength plate steels. Mater. Sci. Eng. A 2008, 480, 109–116. [Google Scholar] [CrossRef]
  20. García-Mateo, C.; Caballero, F.G.; Bhadeshia, H.K.D.H. Mechanical properties of low-temperature bainite. Mater. Sci. Forum 2005, 500–501, 495–502. [Google Scholar] [CrossRef]
  21. Williamson, G.K.; Smallman, R.E. Dislocation densities in some annealed and cold-worked metals from measurements on the X-ray debye-scherrer spectrum. Philos. Mag. 1956, 1, 34–36. [Google Scholar] [CrossRef]
  22. Zare, A.; Ekrami, A. Effect of martensite volume fraction on work hardening behavior of triple phase (TP) steels. Mater. Sci. Eng. A 2011, 528, 422–426. [Google Scholar] [CrossRef]
  23. Bramfitt, B.L.; Speer, J.G. A perspective on the morpholoy of bainite. Metall. Trans. A 1990, 21, 817–829. [Google Scholar] [CrossRef]
  24. Bhadeshia, H.; Christian, J.W. Bainite in steels. Metall. Trans. A 1990, 21, 767. [Google Scholar] [CrossRef]
  25. Yakubtsov, I.A.; Boyd, J.D. Bainite transformation during continuous cooling of low carbon microalloyed steel. Mater. Sci. Technol. 2001, 17, 296–301. [Google Scholar] [CrossRef]
  26. Takahashi, M.; Bhadeshia, H. Model for transition from upper to lower bainite. Mater. Sci. Technol. 1990, 6, 592. [Google Scholar] [CrossRef]
  27. Hall, E.O. The deformation and ageing of mild steel: III discussion of results. Proc. Phys. Soc. Sect. B 1951, 64, 747. [Google Scholar] [CrossRef]
  28. Petch, N.J. The cleavage strength of polycrystals. J. Iron Steel Inst. 1953, 174, 25–28. [Google Scholar]
  29. Kaijalainen, A.J.; Suikkanen, P.P.; Limnell, T.J.; Karjalainen, L.P.; Kömi, J.I.; Porter, D.A. Effect of austenite grain structure on the strength and toughness of direct-quenched martensite. J. Alloy. Compd. 2013, 577, S642–S648. [Google Scholar] [CrossRef]
  30. Olasolo, M.; Uranga, P.; Rodriguez-Ibabe, J.M.; López, B. Effect of austenite microstructure and cooling rate on transformation characteristics in a low carbon Nb–V microalloyed steel. Mater. Sci. Eng. A 2011, 528, 2559–2569. [Google Scholar] [CrossRef]
  31. Gutiérrez, I. Effect of microstructure on the impact toughness of Nb-microalloyed steel. Mater. Sci. Eng. A 2013, 571, 57–67. [Google Scholar] [CrossRef]
  32. Iza-Mendia, A.; Gutiérrez, I. Generalization of the existing relations between microstructure and yield stress from ferrite-pearlite to high strength steels. Mater. Sci. Eng. A 2013, 561, 40–51. [Google Scholar] [CrossRef]
  33. Zhang, J.; Ding, H.; Misra, R.D.K.; Wang, C. Microstructural evolution and consequent strengthening through niobium-microalloying in a low carbon quenched and partitioned steel. Mater. Sci. Eng. A 2015, 641, 242–248. [Google Scholar] [CrossRef]
  34. Rosenberg, J.M.; Piehler, H.R. Calculation of the Taylor factor and lattice rotations for bcc metals deforming by pencil glide. Metall. Trans. 1971, 2, 257–259. [Google Scholar] [CrossRef]
  35. Zare, A.; Ekrami, A. Influence of martensite volume fraction on tensile properties of triple phase ferrite–bainite–martensite steels. Mater. Sci. Eng. A 2011, 530, 440–445. [Google Scholar] [CrossRef]
  36. Langenberg, P. Relation between design safety and Y/T ratio in application of welded high strength structural steels. In Proceedings of the International Symposium on Applications of High Strength Steels in Modern Constructions and Bridges-Relationship of Design Specifications, Safety and Y/T Ratio, Beijing, China, 2008; pp. 28–46.
  37. Taylor, M.D.; Choi, K.S.; Sun, X.; Matlock, D.K.; Packard, C.E.; Xu, L.; Barlat, F. Correlations between nanoindentation hardness and macroscopic mechanical properties in DP980 steels. Mater. Sci. Eng. A 2014, 597, 431–439. [Google Scholar] [CrossRef]
  38. Hüper, T.; Endo, S.; Ishikawa, N.; Osawa, K. Effect of volume fraction of constituent phases on the stress-strain relationship of dual phase steels. ISIJ Int. 1999, 39, 288–294. [Google Scholar] [CrossRef]
  39. Tang, Z.; Stumpf, W. The effect of microstructure and processing variables on the yield to ultimate tensile strength ratio in a Nb–Ti and a Nb–Ti–Mo line pipe steel. Mater. Sci. Eng. A 2008, 490, 391–402. [Google Scholar] [CrossRef]
  40. Prasad, S.N.; Sarma, D.S. Influence of thermomechanical treatment on microstructure and mechanical properties of Nb bearing weather resistant steel. Mater. Sci. Eng. A 2005, 408, 53–63. [Google Scholar] [CrossRef]
Figure 1. Schematic illustration of simulation schedule for thermal-mechanical controlled processing.
Metals 07 00023 g001
Figure 2. Wire-cut tensile sample (a) (in mm) from the cross section of TMCP simulation specimen (b) with 10 × 2 mm2 gauge length located in the center of the formerly compressed section.
Metals 07 00023 g002
Figure 3. Typical tensile stress-strain curves for different nitrogen content steels.
Metals 07 00023 g003
Figure 4. Optical micrographs of 4% Nital solution and Lepera’s reagent etched samples of: (a,b) 5 °C/s; (c,d) 15 °C/s; and (e,f) 20 °C/s. QPF—quasi-polygonal ferrite, GBF—granular bainite ferrite, LBF—Lath bainite ferrite, M/A—Martensite/austenite constituent.
Metals 07 00023 g004
Figure 5. Typical TEM observations of GBF, AF and LBF plates with M/A constituent in samples of: (a) 5 °C/s; (b) 15 °C/s ;and (c) 20 °C/s; and a typical M/A constituent indicated by: (d) bright field; (e) dark field; and (f) selected area diffraction pattern. QPF—quasi-polygonal ferrite, GBF—granular bainitic ferrite, LBF—Lath bainitic ferrite and M/A—martensite/austenite.
Metals 07 00023 g005
Figure 6. TEM observations of precipitate in samples of: (a) 5 °C/s; (b) 15 °C/s; and (c) 20 °C/s; and (d) their energy dispersive X-ray (EDX) analyses.
Metals 07 00023 g006
Figure 7. XRD spectra of samples with controlled cooling rate of 5–20 °C/s (a); and partial enlarged detail (b).
Metals 07 00023 g007aMetals 07 00023 g007b
Figure 8. EBSD orientation maps of samples with varied cooling rates: (a) 5 °C/s; (b) 10 °C/s; (c) 15 °C/s; and (d) 20 °C/s. The red line and the black line represent the misorientation angle in the range 2°–15° and greater than 15°, respectively.
Metals 07 00023 g008
Figure 9. EBSD MED of QPF and GBF grains as a function of MTA and cooling process. MED—mean equivalent diameter, MTA—misorientation tolerance angle, QPF—quasi-polygonal ferrite and GBF—granular bainitic ferrite.
Metals 07 00023 g009
Figure 10. Dilatation curves and Ar3 and Ar1 points for samples cooling at different rates.
Metals 07 00023 g010
Figure 11. YS of samples with different nitrogen contents as a function of the reciprocal square root of QPF + GBF effective grain size, MED2°≤θ≤15°. YS—yield strength, MED—misorientation equivalent diameter, PF—quasi-polygonal ferrite and GBF—granular bainitic ferrite.
Metals 07 00023 g011
Figure 12. TS, YS, Δσ and YR of experimental steels varied with the area fraction of M/A constituent, fM/A. TS—tensile strength, YS—yield strength, Δσ—strain hardening magnitude, YR—yield-to-tensile strength ratio and M/A—martensite/austenite.
Metals 07 00023 g012
Table 1. Chemical compositions of experimental steel (wt. %).
CSiMnPSCrNiMoCuNbTiAlS
0.060.281.470.0080.0020.230.250.200.190.0350.0180.024
Table 2. Summary of the tensile test results.
CR/°CYS/MPaTS/MPaΔσ/MPaYR
5476 ± 11675 ± 7199 ± 90.70 ± 0.02
10498 ± 9680 ± 6182 ± 70.73 ± 0.01
15521 ± 10686 ± 7165 ± 80.76 ± 0.02
20537 ± 7692 ± 5155 ± 40.78 ± 0.01
CR—Cooling rate, YS—yield strength, TS—tensile strength, Δσ—Strain hardening magnitude, and YR—yield-to-tensile strength ratio.
Table 3. Summary of microstructure observations and quantifications.
CR °C/sPhase CompositionfM/A/%fRA/%CM/A/wt. %f2°≤θ≤15°/%MED2°≤θ≤15°/μmDp/nmfp/%ρ/×1014 m−2
5QPF + GBF + M/A7.7 ± 0.40.76 ± 0.170.54456.0530.7 ± 0.55.6 ± 0.3 × 10−43.82 ± 0.05
10QPF + GBF + M/A5.6 ± 0.21.28 ± 0.150.73514.9026.8 ± 0.23.0 ± 0.4 × 10−44.10 ± 0.03
15QPF + GBF + M/A4.1 ± 0.31.67 ± 0.131.00543.7122.6 ± 0.31.7 ± 0.3 × 10−44.21 ± 0.06
20QPF + GBF + LBF + M/A3.5 ± 0.22.31 ± 0.161.16593.3720.4 ± 0.30.8 ± 0.2 × 10−44.39 ± 0.04
CR—cooling rate, QPF—quasi-polygonal ferrite, GBF—granular bainitic ferrite, LBF—lath bainitic ferrite, M/A—martensite/austenite constituent, RA—retained austenite, fM/A—area fraction of M/A constituent, fRA—volume fraction of retained austenite, CM/A—carbon content in M/A constituent, f2°≤θ≤15°—fraction of boundaries at low misorientation tolerance angle 2°–15°, MED2°≤θ≤15°—mean equivalent diameter of ferrite grain with boundaries at low misorientation tolerance angle 2°–15°, determined as effective grain size, Dp—average size of precipitates, fp—volume fraction of precipitates, ρ—the density of dislocations.
Table 4. Summary of individual strengthening contributions from different microstructural features of all steels.
CR/°C/sYS/MPaσ0 + σs + σM/A/MPaσd(MED2°≤θ≤15°)/MPaσρ/MPaσppt/MPa
547610617116336
1049811019016929
1552110721817125
2053711522917518
CR—cooling rate, YS—yield strength, σ0 + σs + σM/A—sum of strengthening contribution from lattice friction stress, solid solution and M-A constituent, σd—boundary strengthening, MED2°≤θ≤15°—mean equivalent diameter of ferrite grain with boundaries at misorientation tolerance angle 2°–15° determined as the effective grain size, σρ—dislocation strengthening, and σppt—precipitation strengthening.

