Article

Study on the Tribological Properties of Porous Titanium Sliding against Tungsten Carbide YG6

School of Mechanical Engineering, Jiangsu University of Science and Technology, Zhenjiang 212003, China
*
Author to whom correspondence should be addressed.
Metals 2017, 7(1), 28; https://doi.org/10.3390/met7010028
Submission received: 6 September 2016 / Revised: 2 January 2017 / Accepted: 11 January 2017 / Published: 20 January 2017

Abstract

:
In the metal cutting process, the friction and wear behavior between the cutting tool and machined surface is the most important factor that affects the surface quality and the service life of the cutter. The irregular pore structure of porous titanium alloy has changed its mechanical properties and the processing technology. The friction and wear mechanism of the cutting tool and the machined surface is greatly different from the traditional dense metal processing because of the crumbling at the edges, tearing phenomenon and the pore agglomeration effect of chips. In this paper, the tribological characteristics and the wear mechanism of friction pair which was formed by porous titanium alloy material and hard alloy cutter were studied from cutting force, cutting speed and temperature in micro-cutting condition, and the influence of porosity on the wear rate and friction coefficient was analyzed. Results show that the main factor which influences the friction coefficient and wear rate is the porosity. The wear mechanisms of porous titanium materials were abrasive and oxidation wear while the wear mechanism of tungsten carbide YG6 was abrasive wear. The friction coefficient and wear rate of the relatively stable state are beneficial to improve the surface quality and tool life. As a result, in the micro-cutting process of porous titanium alloys, the best choice of machining parameters for different porosity materials are as follows: the load is about 8 N, the sliding speed is about 400 r/min and the temperature is about 300 °C.

1. Introduction

Porous titanium is an important structural metal that is widely used in aerospace, automobiles, shipbuilding, power generation equipment and other fields because of its high strength, low density, seismic resistance, good adsorption and other characteristics [1,2,3]. However, the porous titanium is hard to machine due to its low thermal conductivity, poor wear resistance, high chemical affinity, low elastic modulus and high-temperature oxidation resistance [4]. Especially, the friction and wear behavior between the tool and the machined surface have the most important impact on the surface quality and the machining precision.
In the friction pair formed by the cutting tool and the machined surface, the tool material is an important factor of the performance of the machined surface. Due to the high strength of porous titanium alloy and the characteristics of its pore structure, the phenomenon that cutting tool impacts pore edges is serious [5]. Therefore, the tungsten carbide cutter with a higher hardness is the best choice and the commonly used cutters are YG6, YG8, K20, P30 and so on [6,7,8]. The sharp friction between the tool and the workpiece causes the temperature to rise, while the poor thermal conductivity of the porous titanium makes the temperature unable to diverge well [9]. On the one hand, oxidation will appear if the temperature becomes too high, and oxide will stick to the tool, resulting in adhesive wear if the temperature reaches approximately 300 °C [10,11]. On the other hand, as the temperature increases, the nitrogen in the titanium undergoes chemical reactions with the oxygen in air, which would deposit a hard layer on the cutting surface that hardens the work surface [12,13,14]. All these lead to more difficult cutting.
Similarly, cutting fluid is another important factor that affects the performance of machining quality and reduces the temperature in the friction pair. In most cases, the cutting fluid plays a role in lubricating and cooling. However, the cutting fluid can also create the vibration of the cutter which affects the machining accuracy in the micro-machining of porous titanium [15]. Besides that, the cutting fluid contains some chemicals that could have reactions with some components of porous titanium. Furthermore, due to the pore structure of porous titanium, some of the lubricant remains in the pores, and is not easy to remove. Additionally, the lubrication creates some harmful gas at high temperatures that is not friendly to the environment [16]. Moreover, when the porous titanium is applied in the medical field, the residual component of the cutting fluid may cause harm to the human body [17,18]. Taking into account the above reasons, either dry or near dry cutting is generally used instead of lubrication design [19,20]. However, this method can also bring another problem: much heat will be produced, so it is necessary to investigate the influence of the temperature parameter.
Micro-scale cutting is often used in modern industries and research on micro-cutting is mainly from three aspects: cutting speed, cutting depth and feed rate [21]. However, for micro-machining of porous materials, different loads, sliding speeds and other parameters have relationships with the surface quality as well [22]. Changing these parameters will also bring a rising surface temperature and a faster wear rate. In order to accomplish higher cutting accuracy, the load of the micro-machining of porous titanium should not fluctuate greatly.
During the cutting process of porous titanium material, the friction and wear behavior is the main cause that leads to a short service life of the cutter. It is necessary to study the tribological properties, wear morphology and mechanism of porous titanium sliding against tungsten carbide tools [23]. The investigation is beneficial to further improve the friction and wear properties of porous titanium. Then, the friction and wear behavior was simulated using a tungsten carbide YG6 tool and two kinds of porous titanium with different porosity to trough a ball-on-flat sliding friction apparatus UMT-2. The first step is to prepare the titanium samples with porosities of ~24%–26% and ~38%–42% by sintering [24]. Next, we take advantage of a variable-controlled approach to carry out a single factor test from four aspects, porosity, load, sliding speed and temperature, and analyze the relationship between these factors and the friction coefficient and wear rate. In addition, we use a VHX-900 Super Depth of Field Digital Microscope and a JSM-6480 Scanning Electron Microscopy (SEM) to observe the surface of the wear trace and the micro-morphology of the carbide YG6 ball. Finally, the wear mechanism and the friction and wear properties of the porous titanium are obtained using an INCA Energy Spectrometer (EDS) to analyze the micro region and the spots of the wear surface. Consequently, the different studies conducted are beneficial to improve the processing technology, enhance the surface quality and reduce the friction and wear.

2. Experimental Procedures

2.1. Materials

A pure titanium sample in the friction and wear experiments was obtained using the following procedure. First, two types of porous titanium materials with different porosities are created by sintering the sample. Second, the samples are processed into standard workpieces by Wire Cut Electrical Discharge Machining (WEDM, Suzhou Zhonghang Changfeng Technology Equipment Co., Ltd., Suzhou, China). After the cutting is finished, the friction surface is polished to eliminate the residual stress which may exist. Third, a scanning electron microscope (SEM, Shanghai Juyue Electronics Co., Ltd., Shanghai, China) is used to characterize the porosity and pore size of the sample surface. Finally, the SEM images are analyzed to choose test samples with uniform porosity distribution.
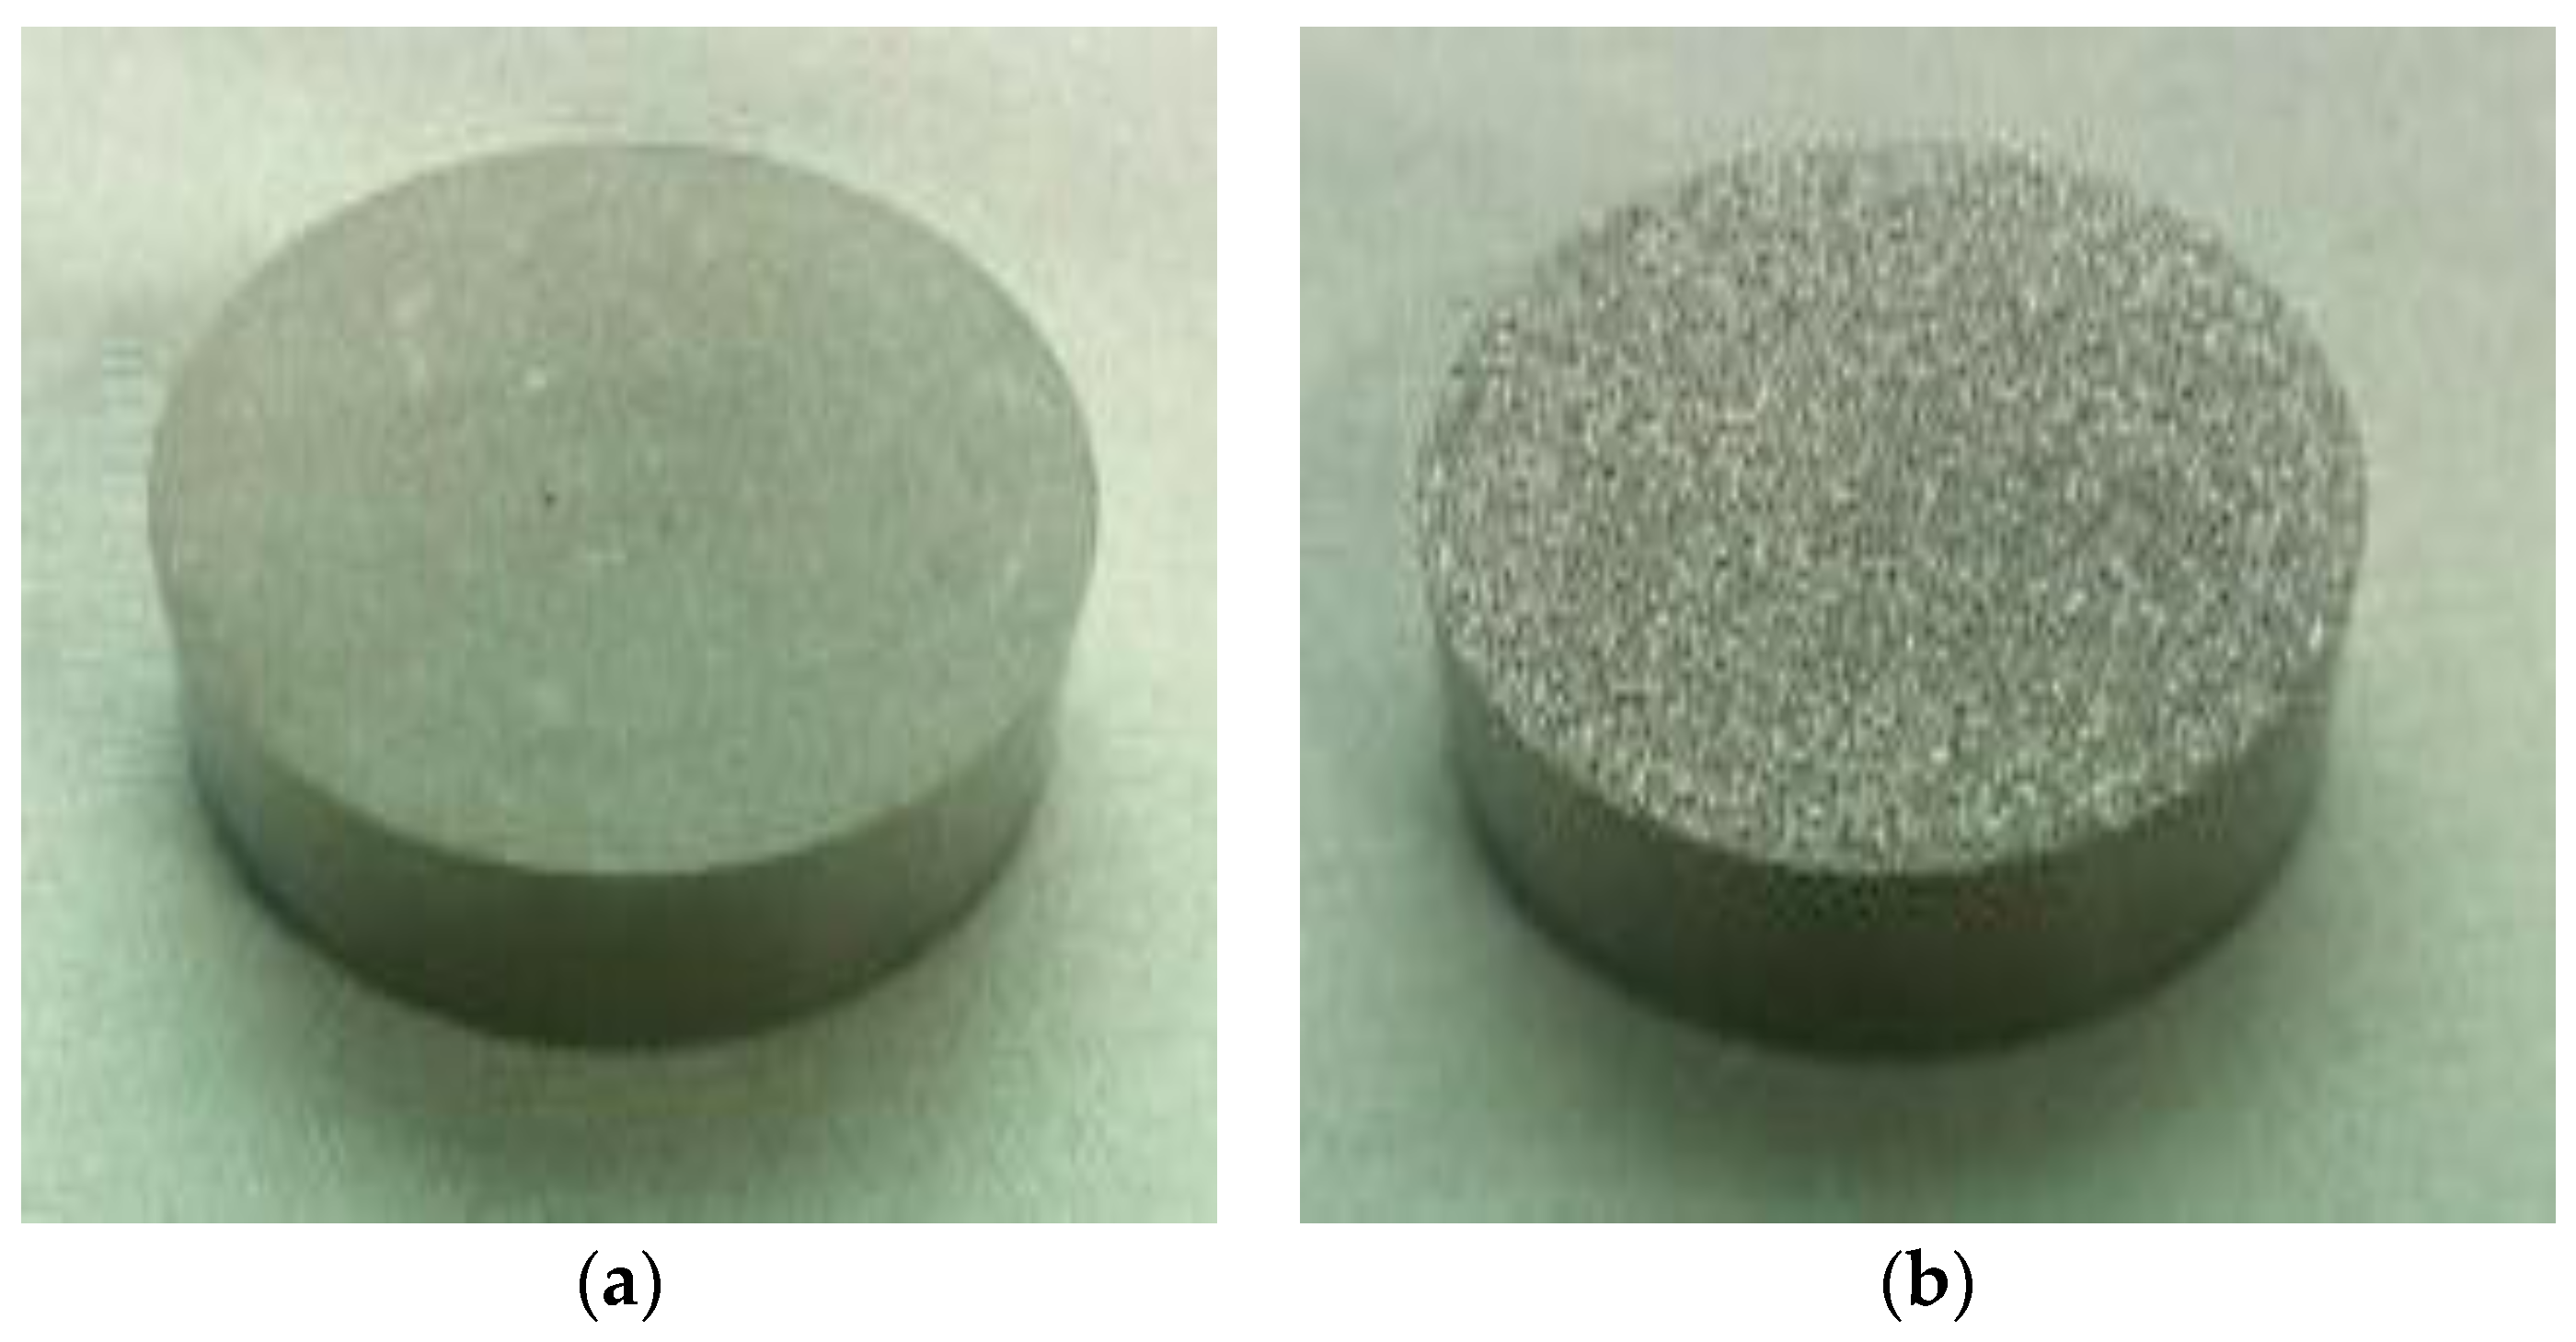
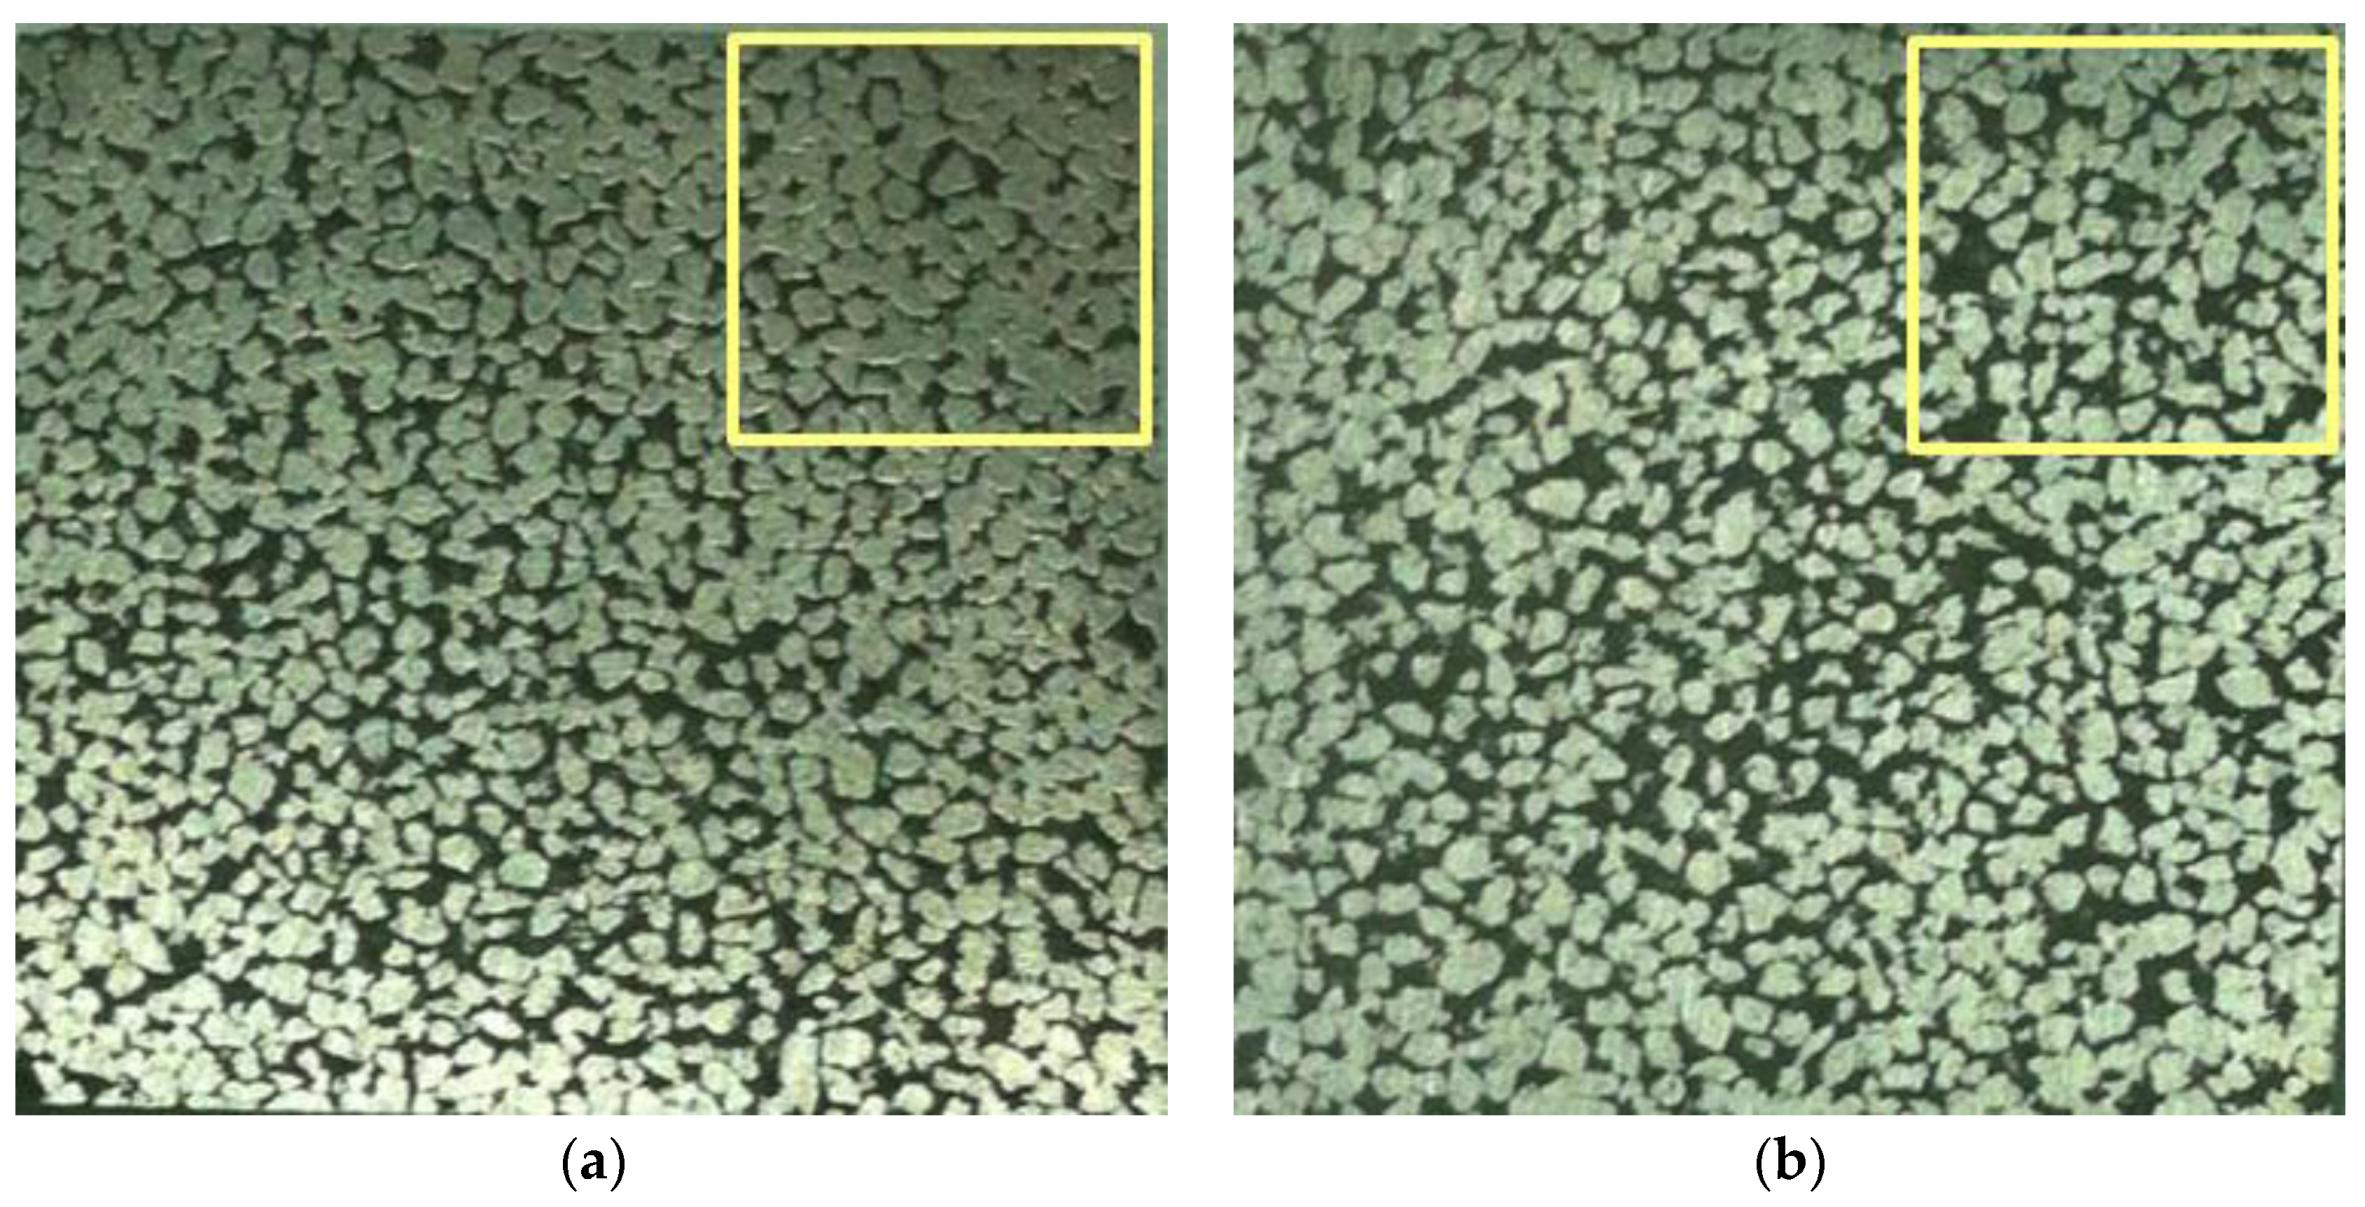
Two titanium powders, made by Shijiazhuang Yida Co., Ltd., Shijiazhuang, China, 500# and 200#, with diameters less than 27 μm and 74 μm, respectively, are used. The chemical composition of the two titanium powders is shown in Table 1 and the powder particles can be seen in Figure 1.
The sintering additive is an aqueous solution containing polyvinyl alcohol (2 wt %). The mixture was fed into the titanium body, with a diameter of 25 mm, by compression molding at a forming pressure of 180 MPa. Due to titanium’s high chemical reactivity and its tendency to react with carbon, nitrogen, oxygen, hydrogen and other elements, the sintering was performed under vacuum at 10−4 Pa. The sample was kept at 1200 °C for 2 h and then cooled naturally to obtain a titanium powder with a particle size of 500#. Conversely, a temperature of 1100 °C was used for the process to acquire the sample with a particle size of 200#. As shown in Figure 1, there are two types of specimens with different porosities.
Next, in order to facilitate the clamping in the UMT-2 high temperature friction and wear testing machine, the samples were cut into cubes by WEDM, with each cube measuring 15 mm (length) × 15 mm (width) × 4 mm (height). In addition, to obtain the minimum error, the parallelism of the sample was controlled to within 0.1 mm. The terminal faces of the samples were then polished in a metallographic pre-grinding machine (M-2, Shandong Laizhou Huayin Testing Instrument Co., Ltd., Shandong, China) after the samples had been washed in water. The sanding process was divided into three stages: coarse grinding, fine grinding and burnishing. Coarse grinding was first performed by using metallographic paper, with the types of 360# and 600#, during the rough milling process. Likewise, at the fine grinding stage, the papers were replaced with metallographic paper with the types 800#, 1000#, 1200#, 1500# and 2000#, and grinding was performed sequentially with each paper. Subsequently, specimens were polished on the M-2 using a diamond-abrading agent with W1.0 to ensure that the surface roughness reached a value of 0.1 mm. The samples were then cleaned with 90% alcohol and dried in the shade.
Porosity of materials can be nowadays well defined with many methods such as the scanning and subsequent computational analysis, porosimetry and the simple mass and volume measurements and so on [24]. The porosity was defined by the scanning and subsequent computational analysis in this experiment, and was checked by the simple mass and volume measurements. Figure 2 shows the surface morphology of the standard workpieces. The total area of observation is described by the parameter A (mm2). The area of the gap is expressed as Ap (mm2). The porosity of the material is given as follows:
ε = A p A × 100 %
where ε is the percentage of voids in the total area.
Due to the complexity of the pore structure, it is difficult to define the exact aperture. Under this circumstance, the concept of “equivalent pore size” is used by the Porous Materials Corporation in America. The core idea is that the perimeter of the pore is actually equivalent to the diameter D. Hence, the equation for the aperture equivalent (D) is given below as follows:
D = 4 A c P c
where Ac is the true area of hole and Pc is the girth of concrete pore.
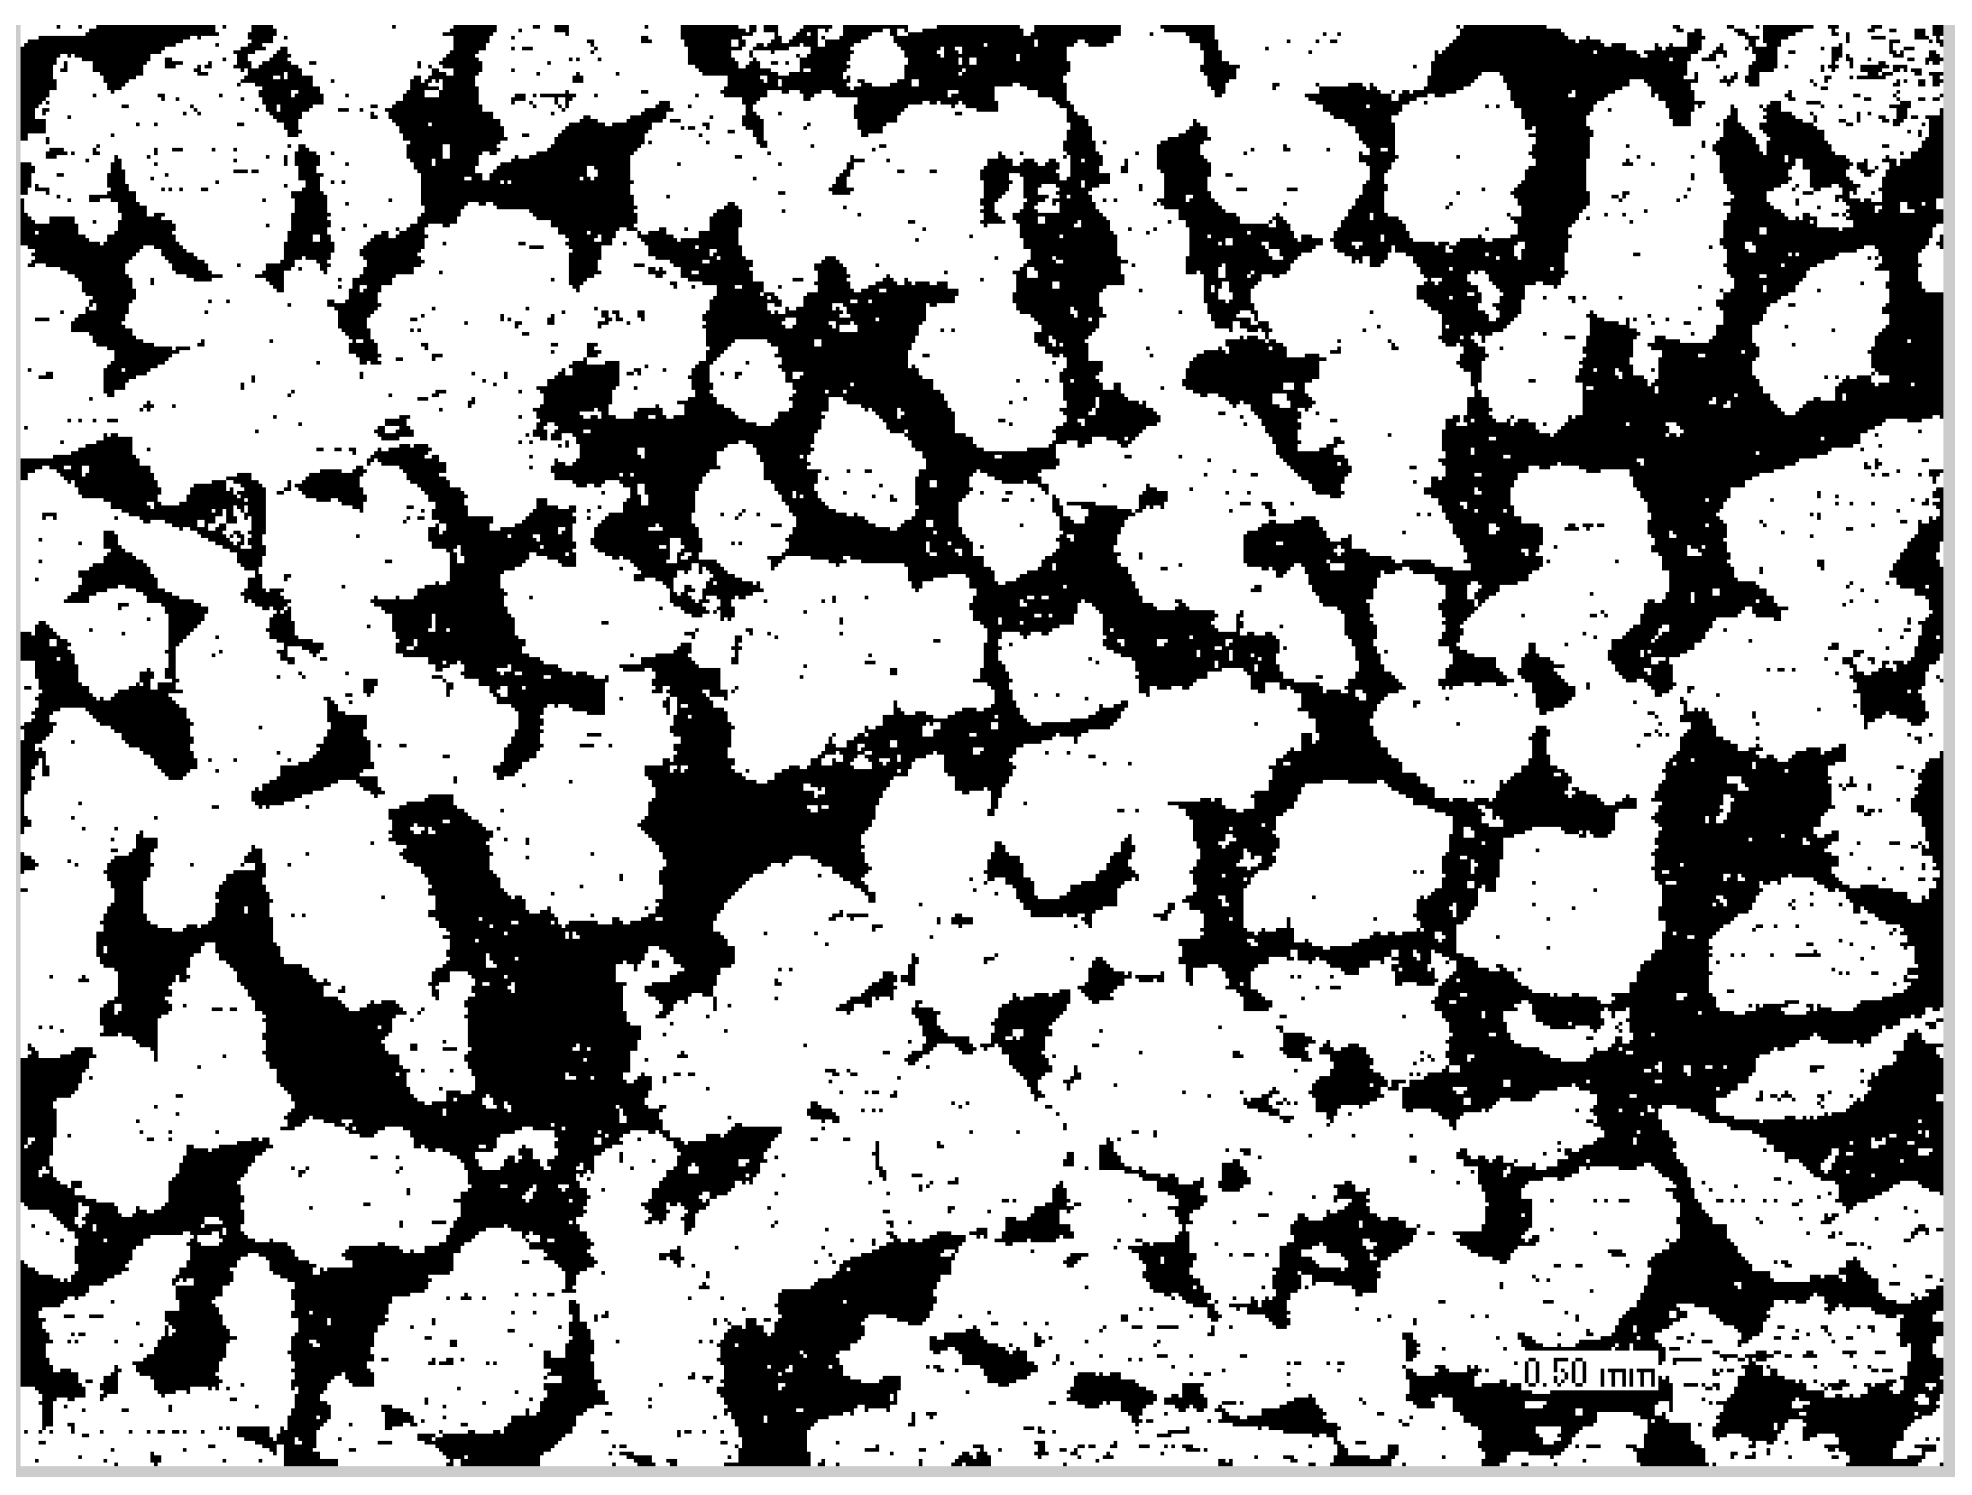
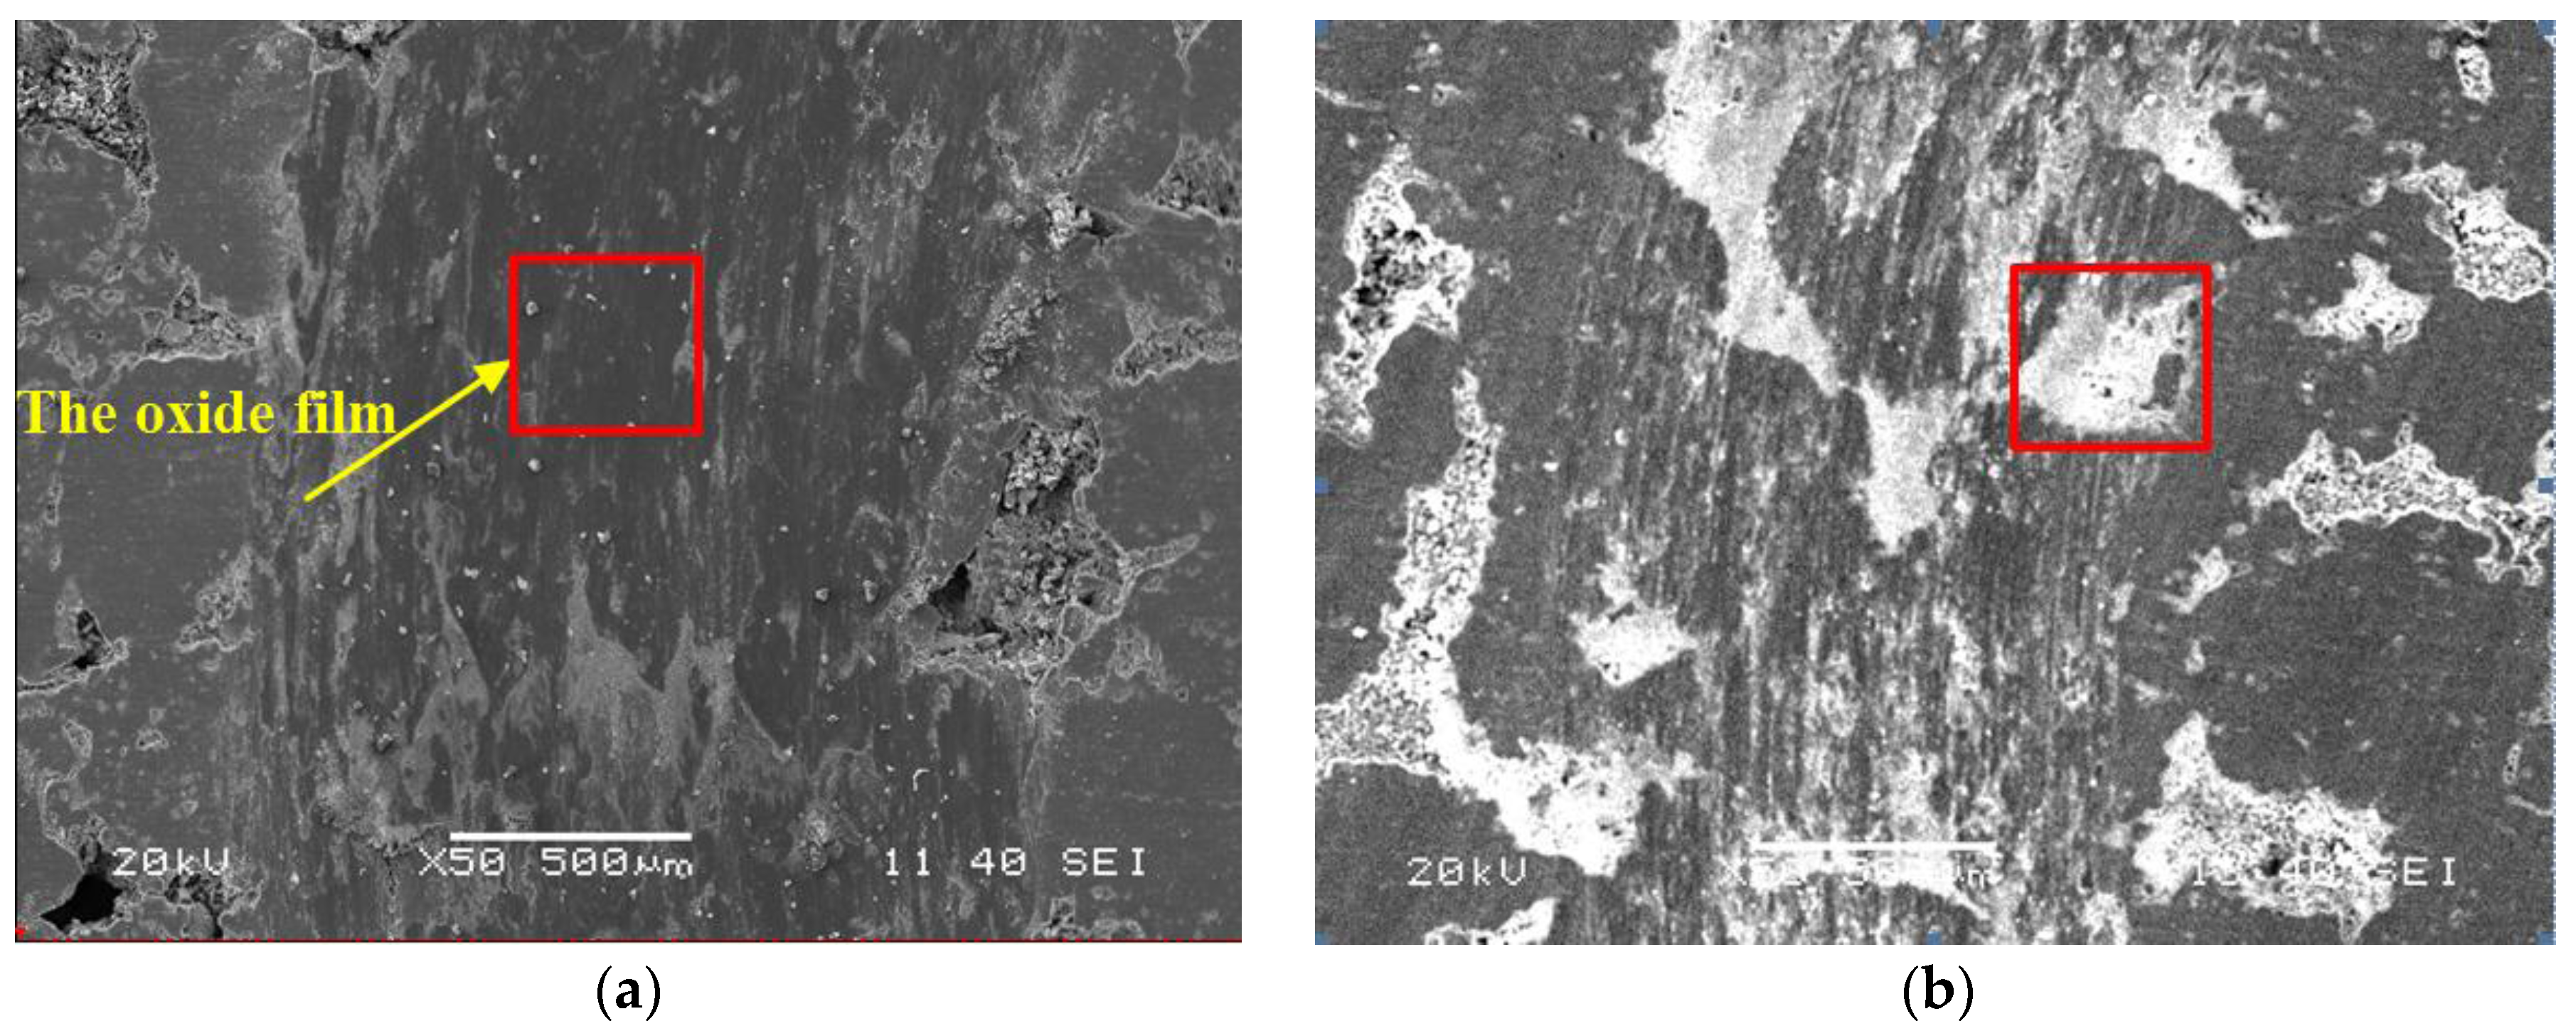
The surface morphology by SEM were analysed as shown in Figure 3. Here, the black shaded region is the aperture gap while the white part is the material base. The porosity and equivalent aperture are calculated from Equations (1) and (2). The average is taken and is used as the diameter of the piece.
Because the pore structures of the porous titanium are not uniformly distributed, the measured values of different samples are not unique. To improve the reproducibility of the test data, which are influenced by the dispersion in sample porosity, test pieces with sizes that were either too large or too small were removed. Finally, two groups of samples meeting the requirements are selected. Table 2 shows the two groups of experimental data, along with the equivalent porosity and aperture.

2.2. Friction and Wear Tests

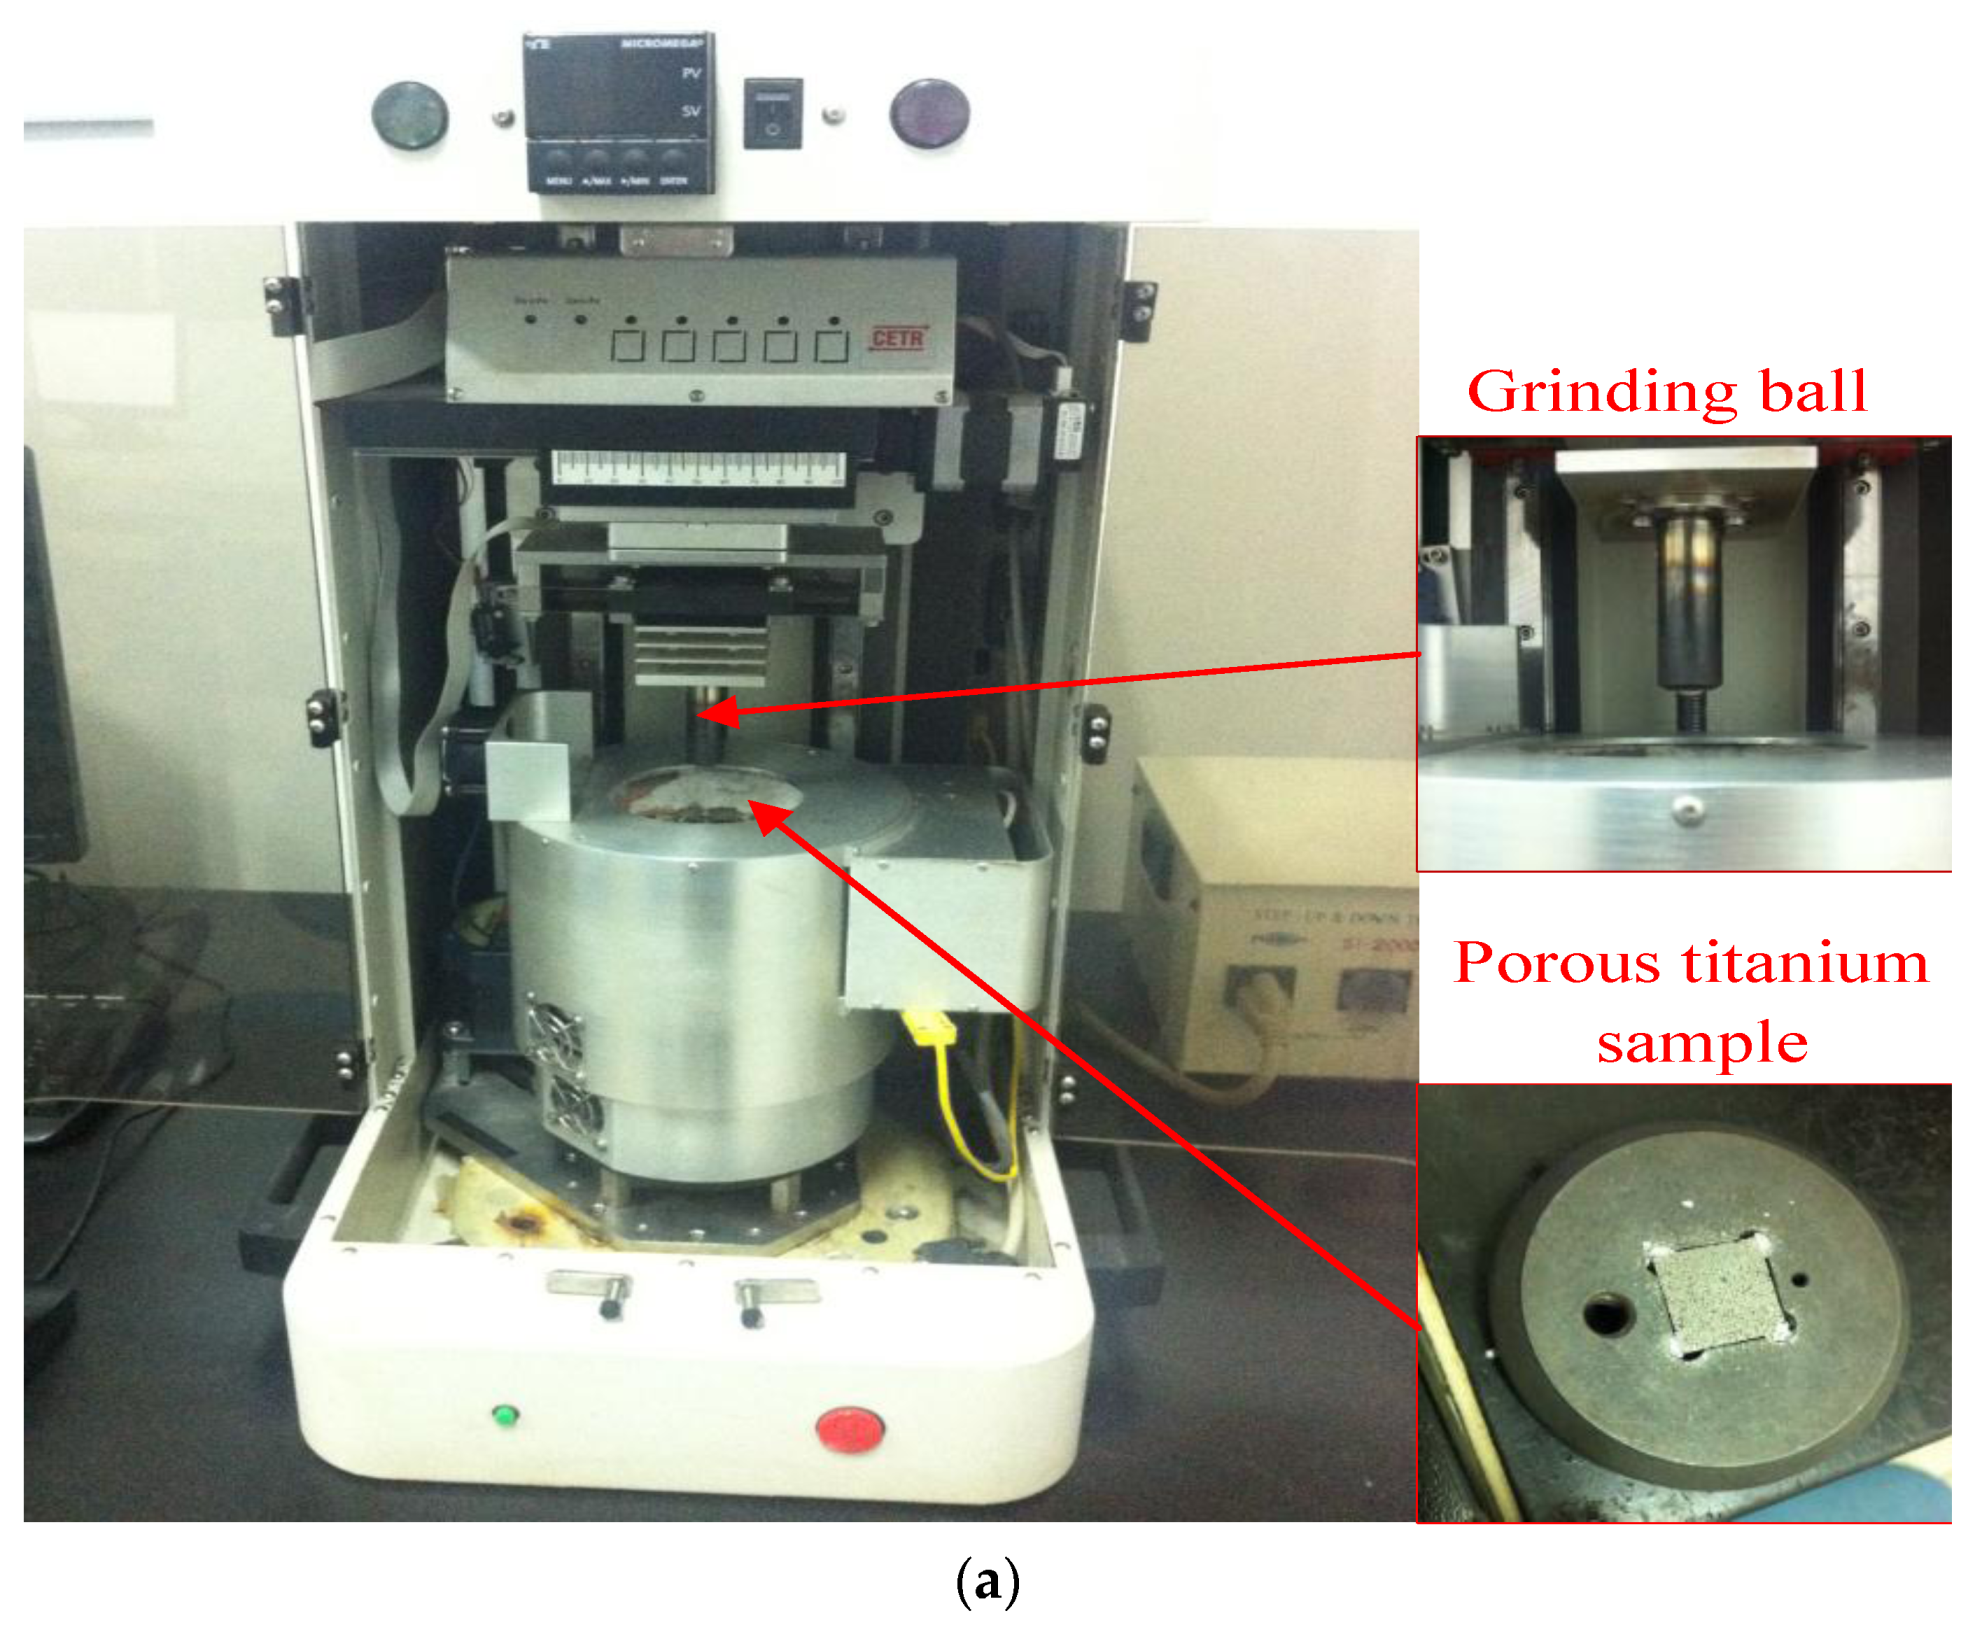
In order to simulate the friction and wear behavior of the cutting tool and the machined surface during the micro-machining process, the tests were carried out with the UMT-2 high temperature friction and wear testing machine (Nanjing Ranrui Technology Co., Ltd., Nanjing, China), which is a ball-on-flat machine specifically for the friction and wear test. As observed in Figure 4a, the porous titanium sample was glued to the plate. The grinding ball on the upper part of the machine consists of Carbide YG6 material; its detailed parameters are shown in Table 3.
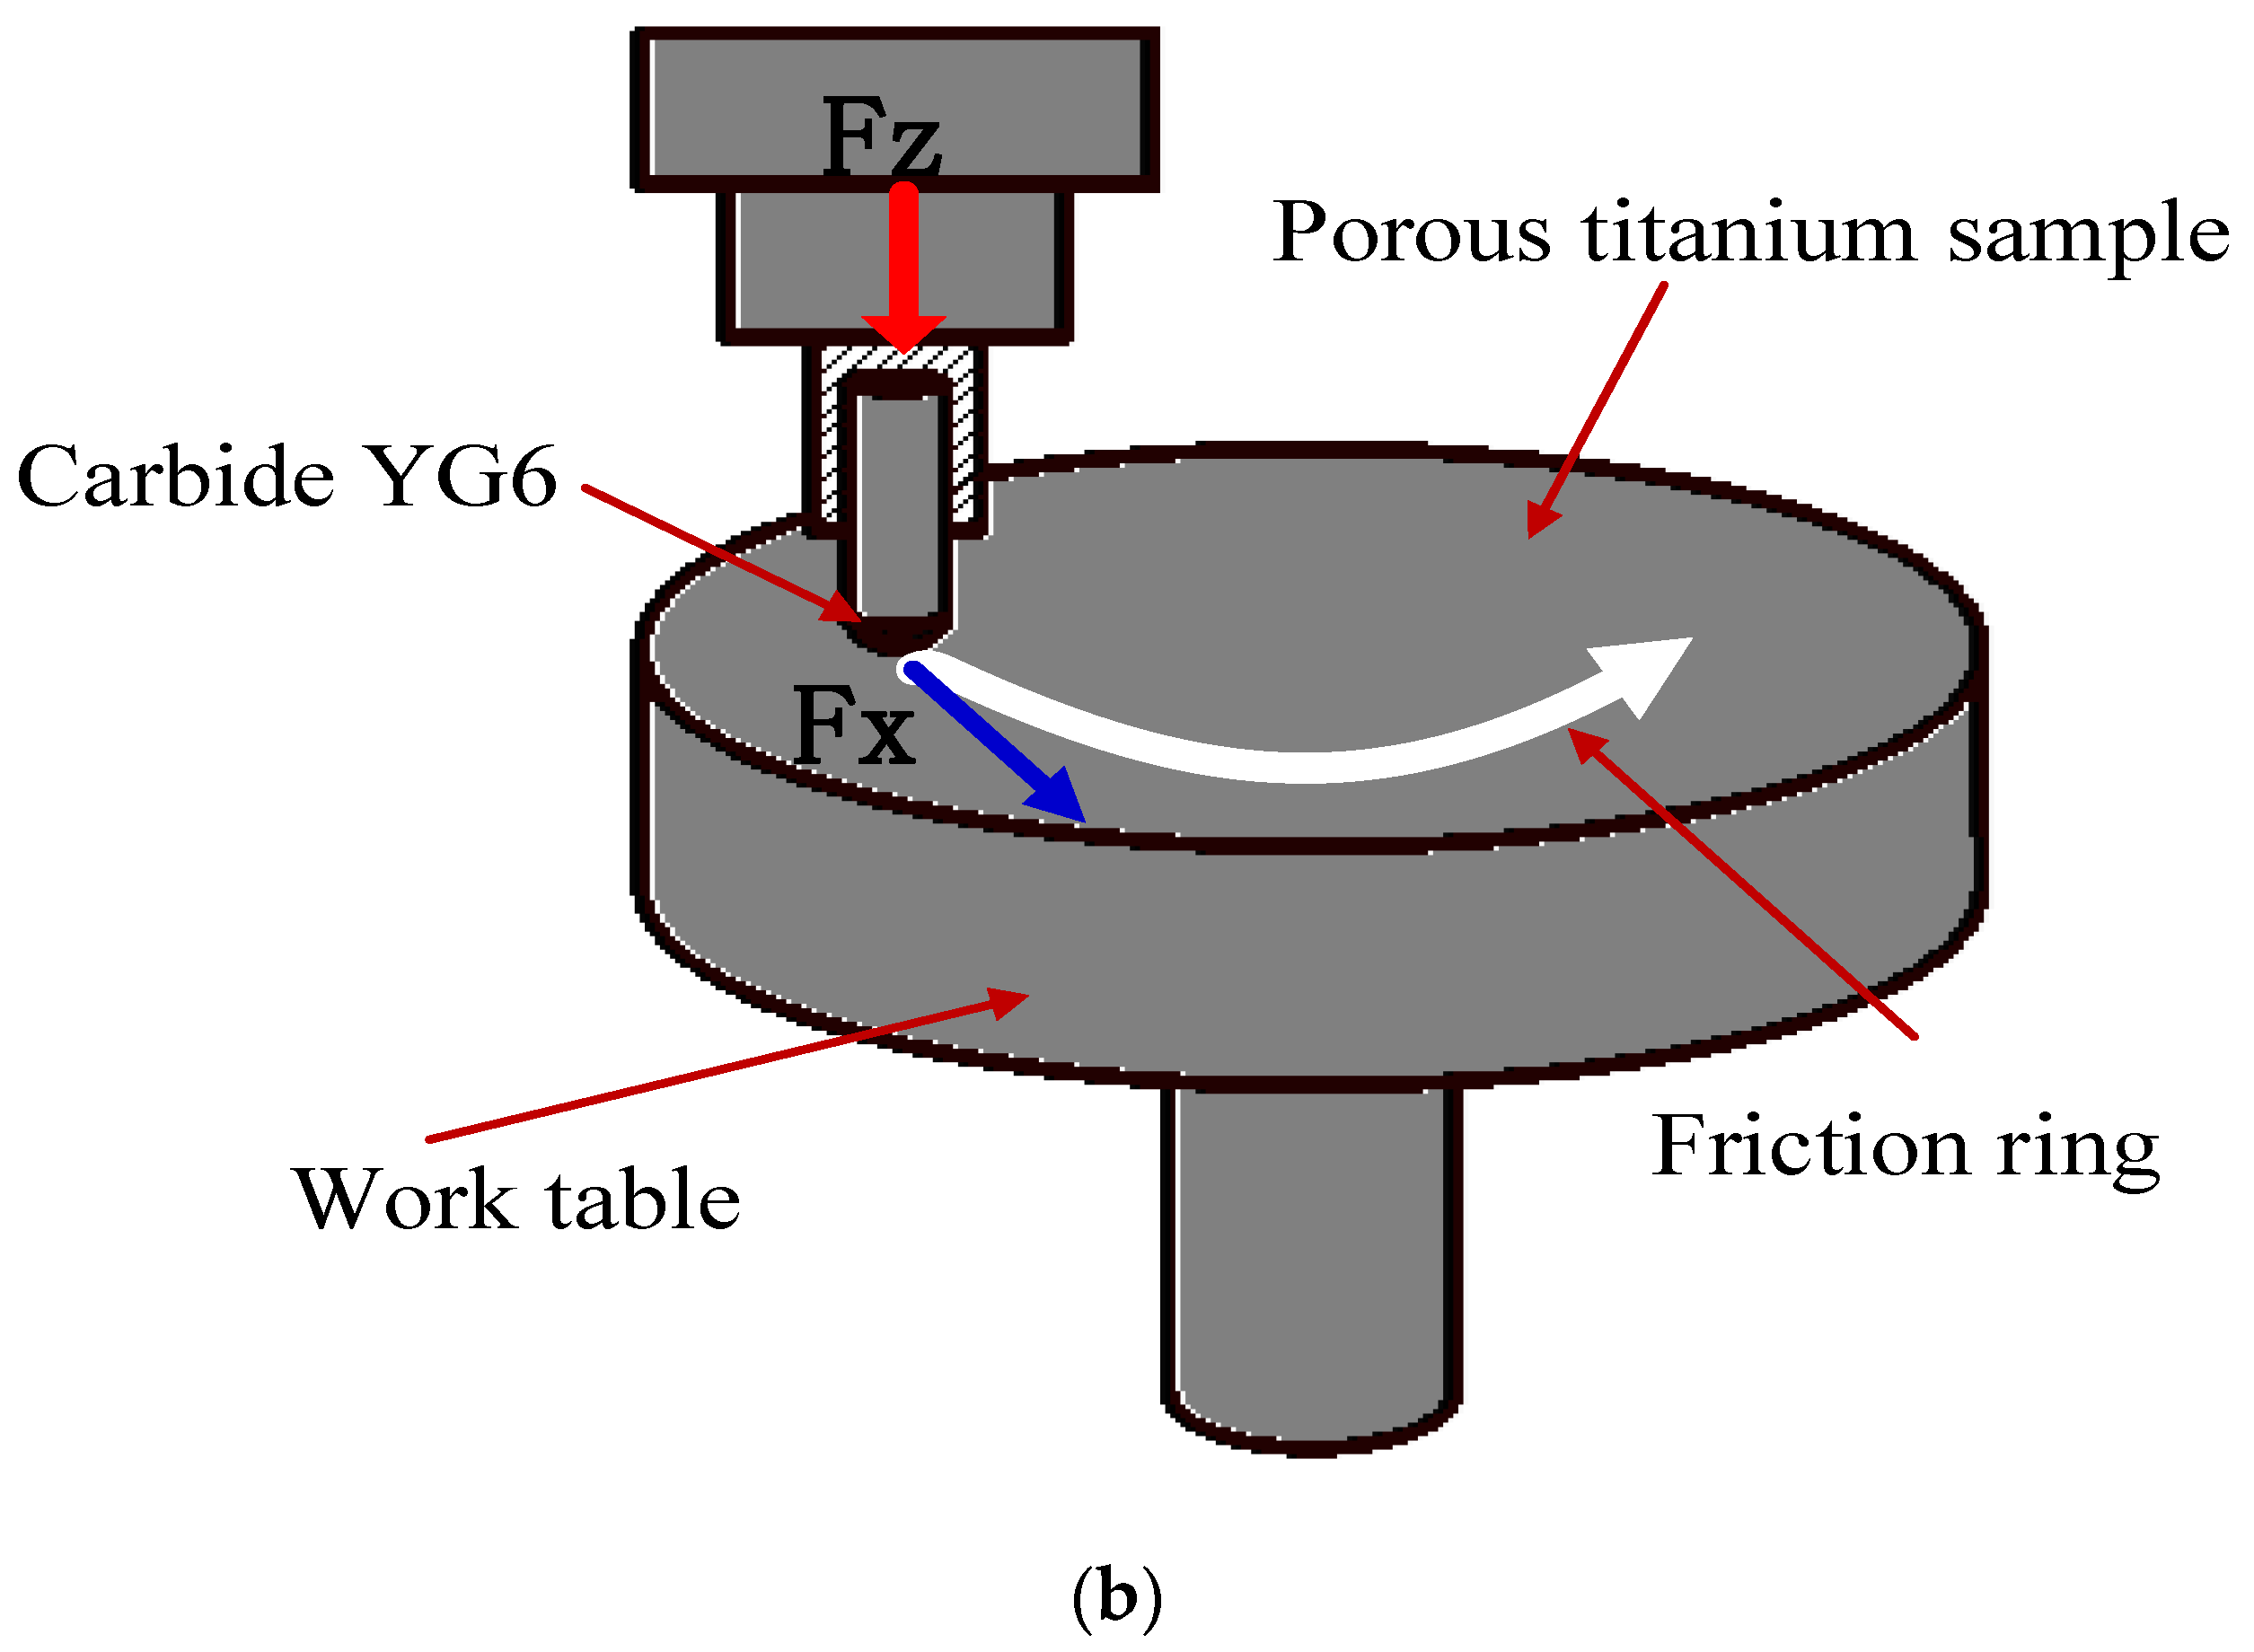
During the experiment, the ball was fixed while the workpiece rotated on the work table. In this state, the contact area formed a friction ring, as shown in Figure 4b. Meanwhile, data for the load ( F z ) and friction ( F x ) were collected by a computer.
The experiment was designed as a single-factor test, i.e., changes were only made to one factor, while the other factors were kept unchanged.
In micro-cutting, the cutting force is suitable from 0 N to 18 N and the spindle speed is about 735 r/min [21]. However, considering the impact of pore structure and the heat dissipation of porous materials that seriously affect the wear rate of the micro-machining tool and the quality of the machined surface, the speed and load should be at a lower level. In order to obtain a clear difference between the experimental phenomena and exclude the impact of temperature caused by large load or high speed, the range of test loads are from 2 N to 15 N and the speed should be kept between 40 r/min and 735 r/min. More specific parameters are listed in Table 4.
In addition, the tests also meet the following conditions: a dry friction in atmospheric environment, an external temperature of 20 °C, a relative air humidity range of ~20%–30%, a friction ring diameter of 10 mm, a friction time of 20 min, a frequency of 0.65 Hz for the acquisition of friction data and a force sensing accuracy of 0.1 mN.
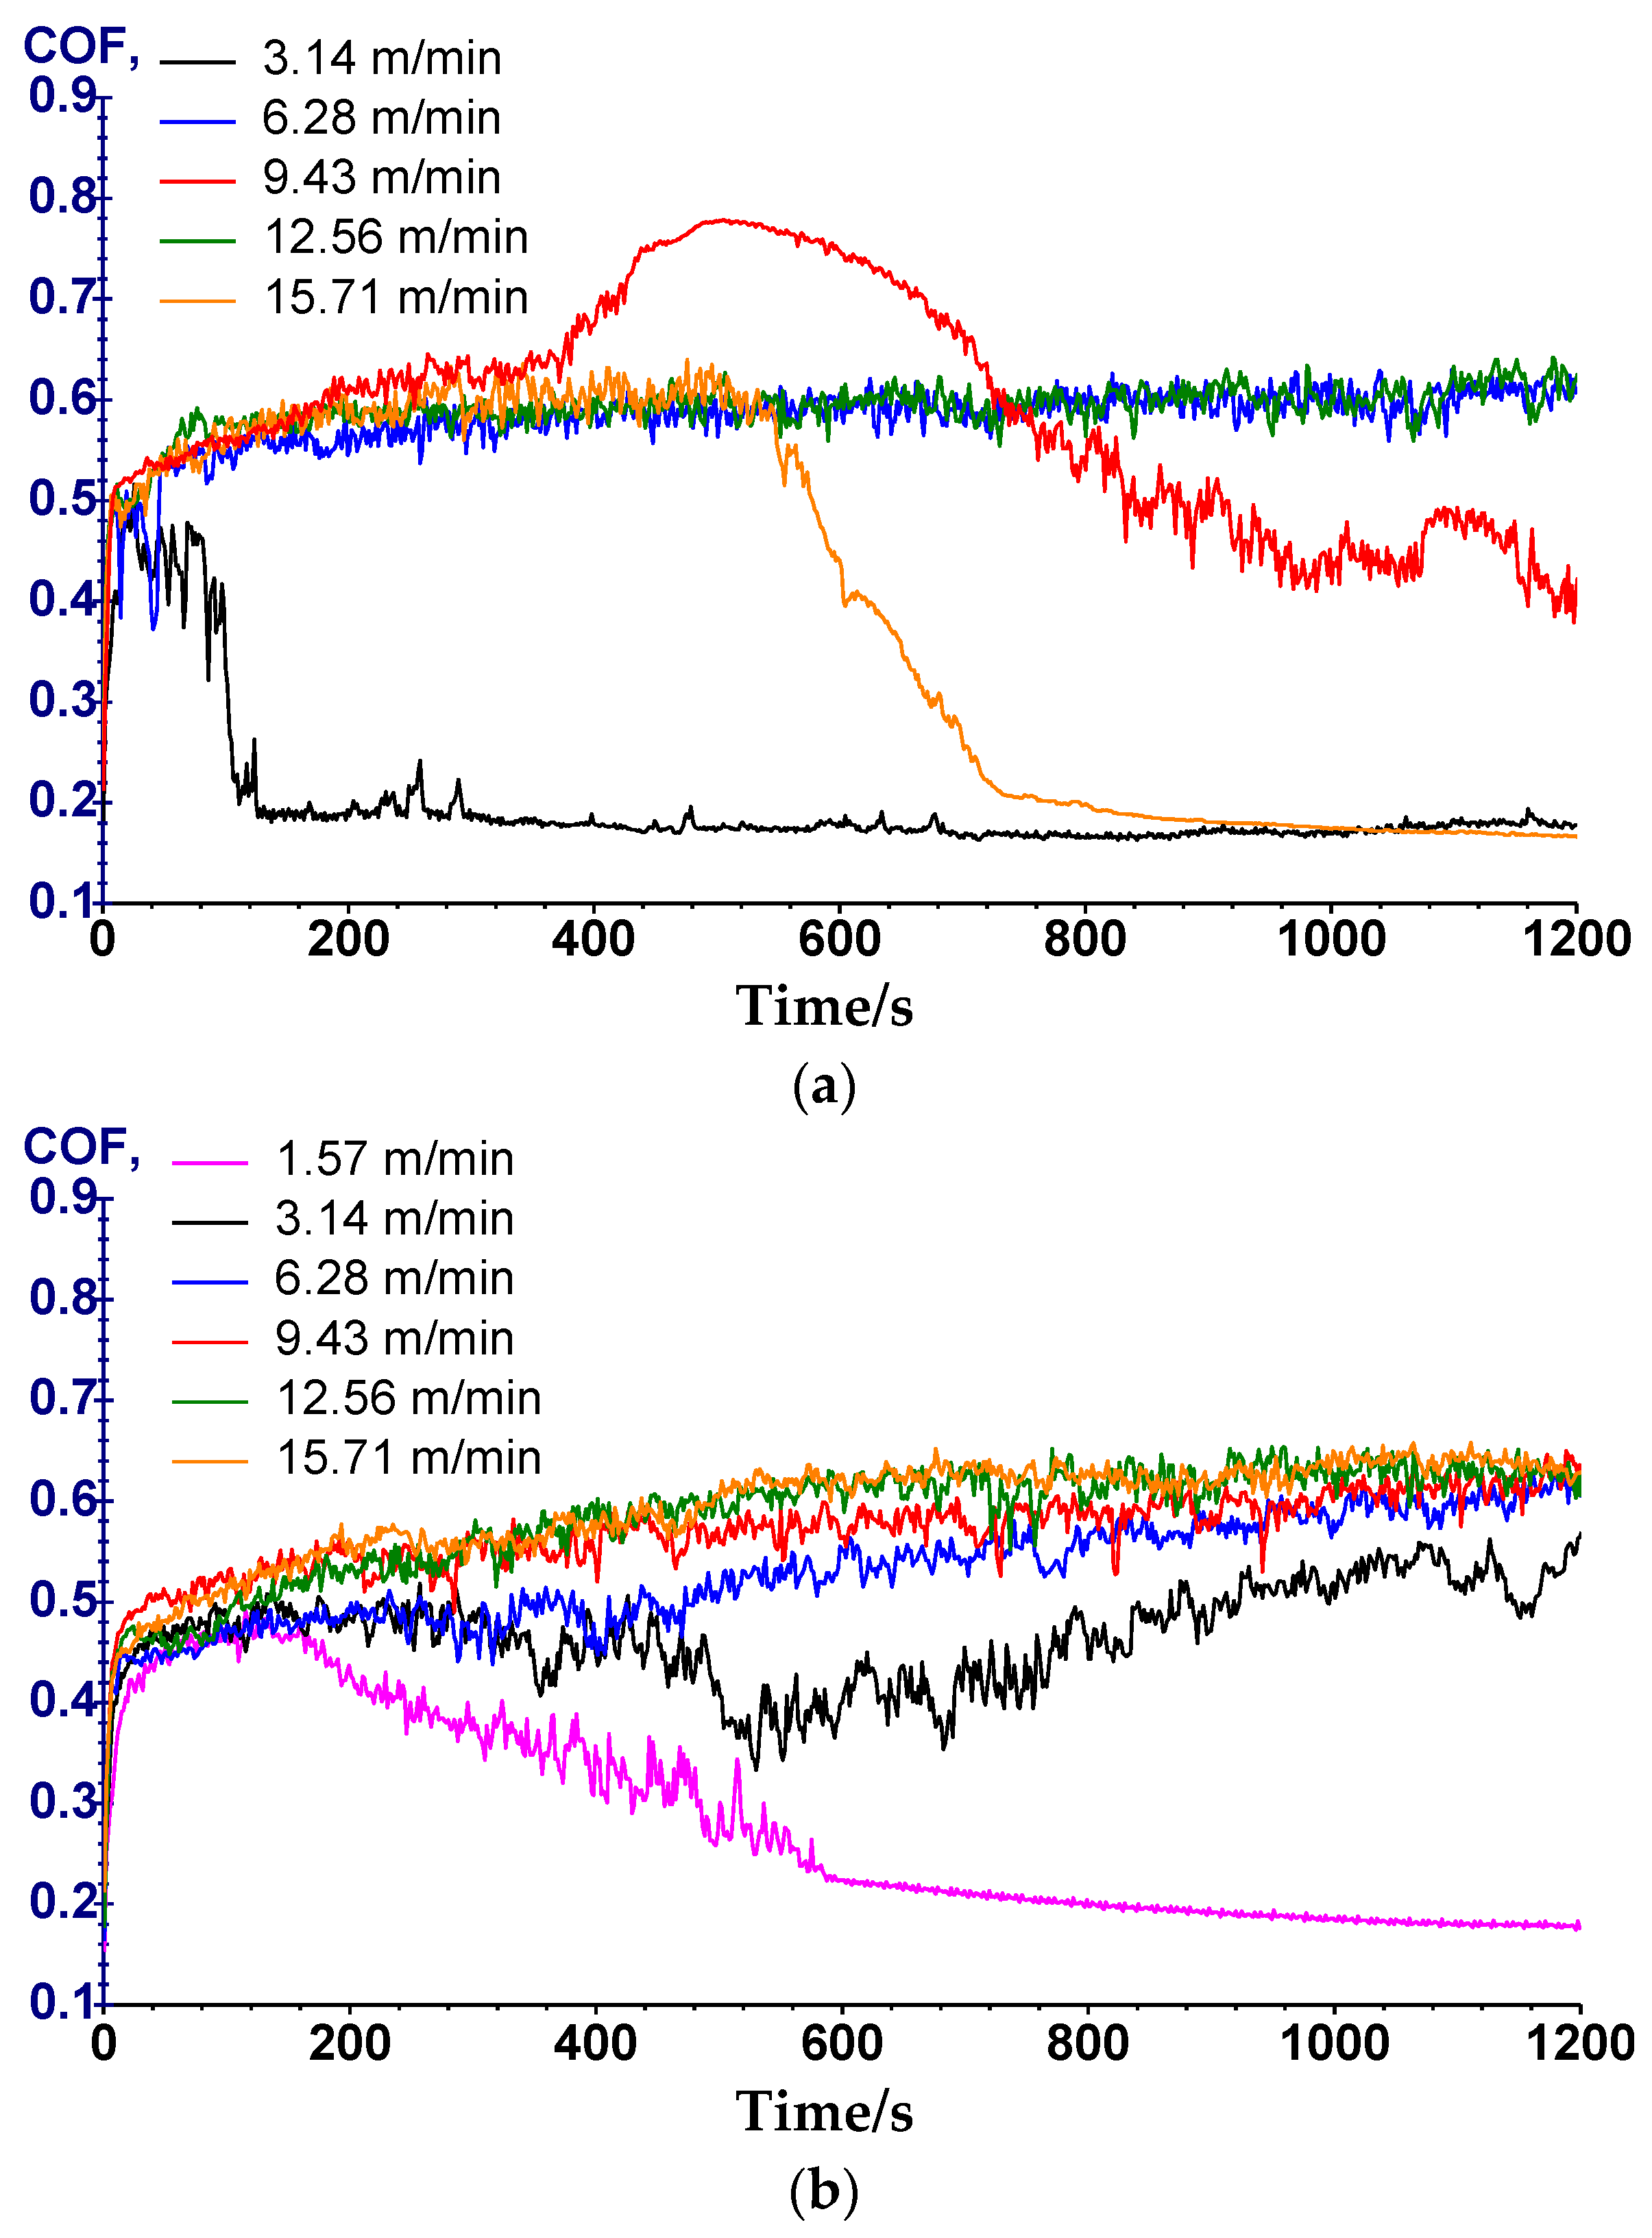
To obtain a clear comparison of the effect of friction under different conditions, different testing schemes were used, as shown in Table 5. In order to obtain convincing results, each group of samples were tested several times, and finally the most stable and the most representative data were selected.
As observed in 
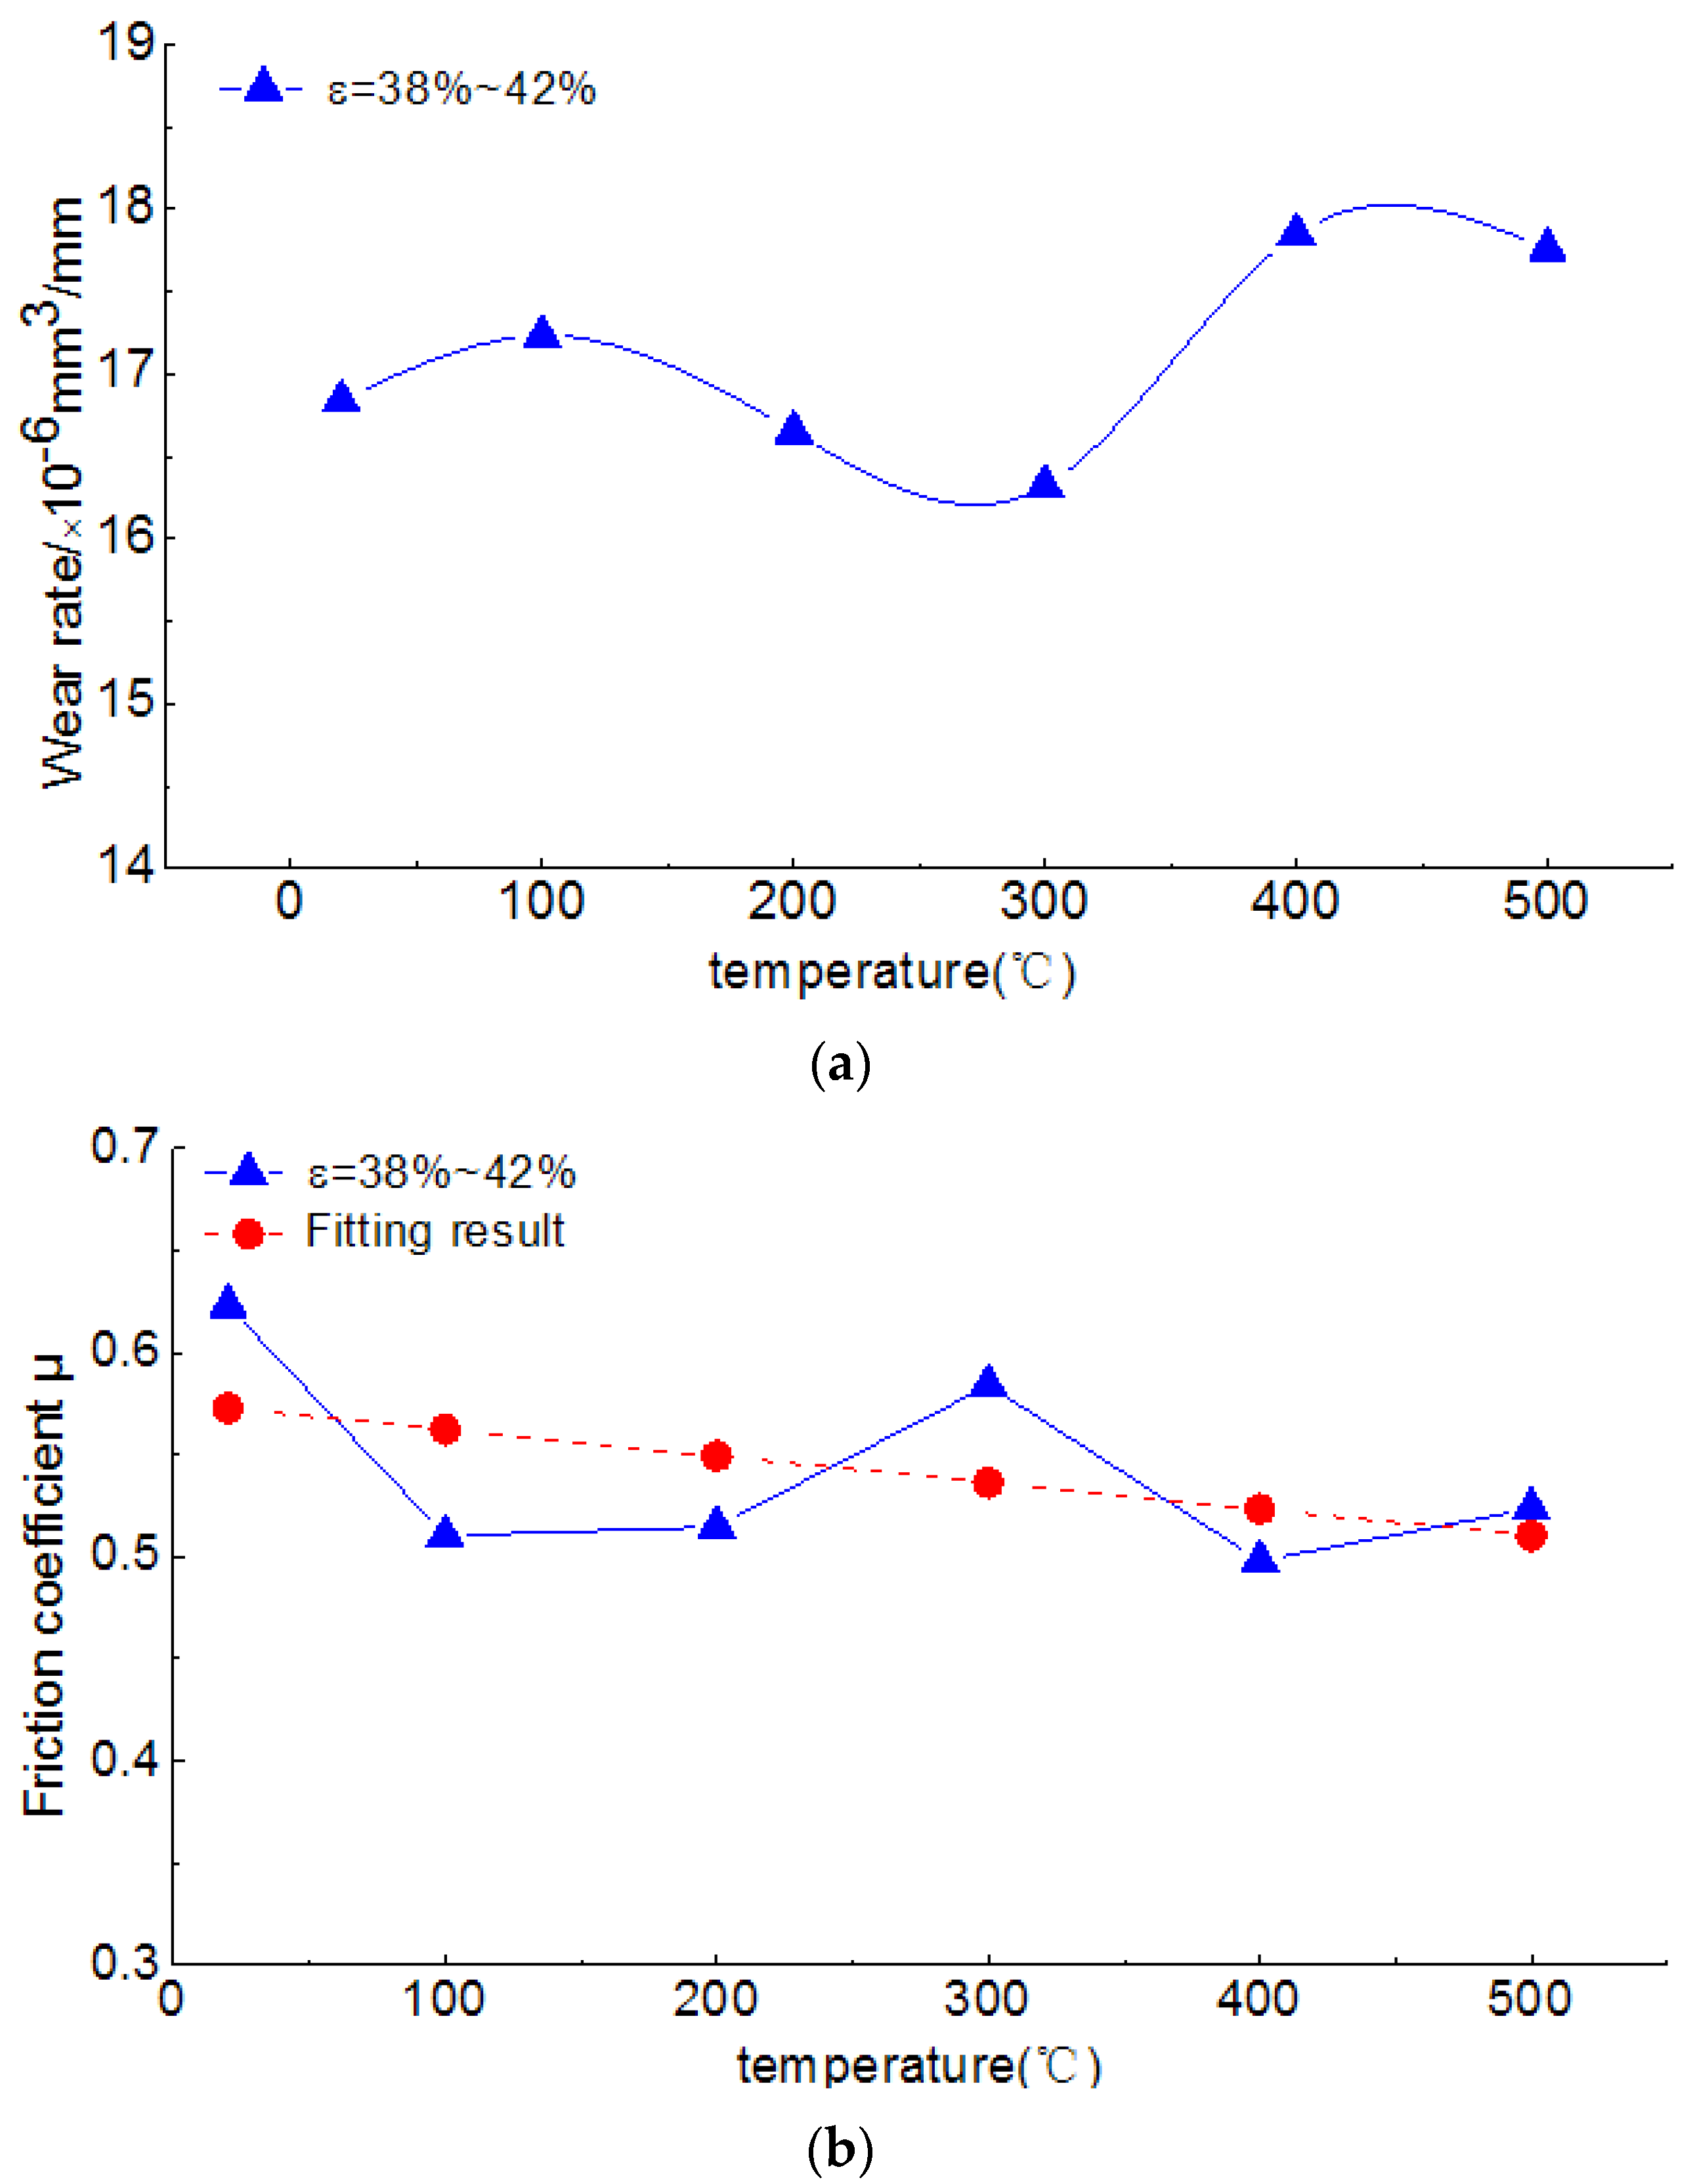
Table 5, five groups of experiments were conducted for each scheme. The friction coefficient is the ratio of the load and the friction, i.e.,
μ = F X F Z
Because the oil and powder particles can easily infiltrate in the process of wear and tear, the traditional wear measurements, referred to as the weighing method, would result in obvious errors. Accordingly, the contour graph method was used to measure the wear volume. As shown in 
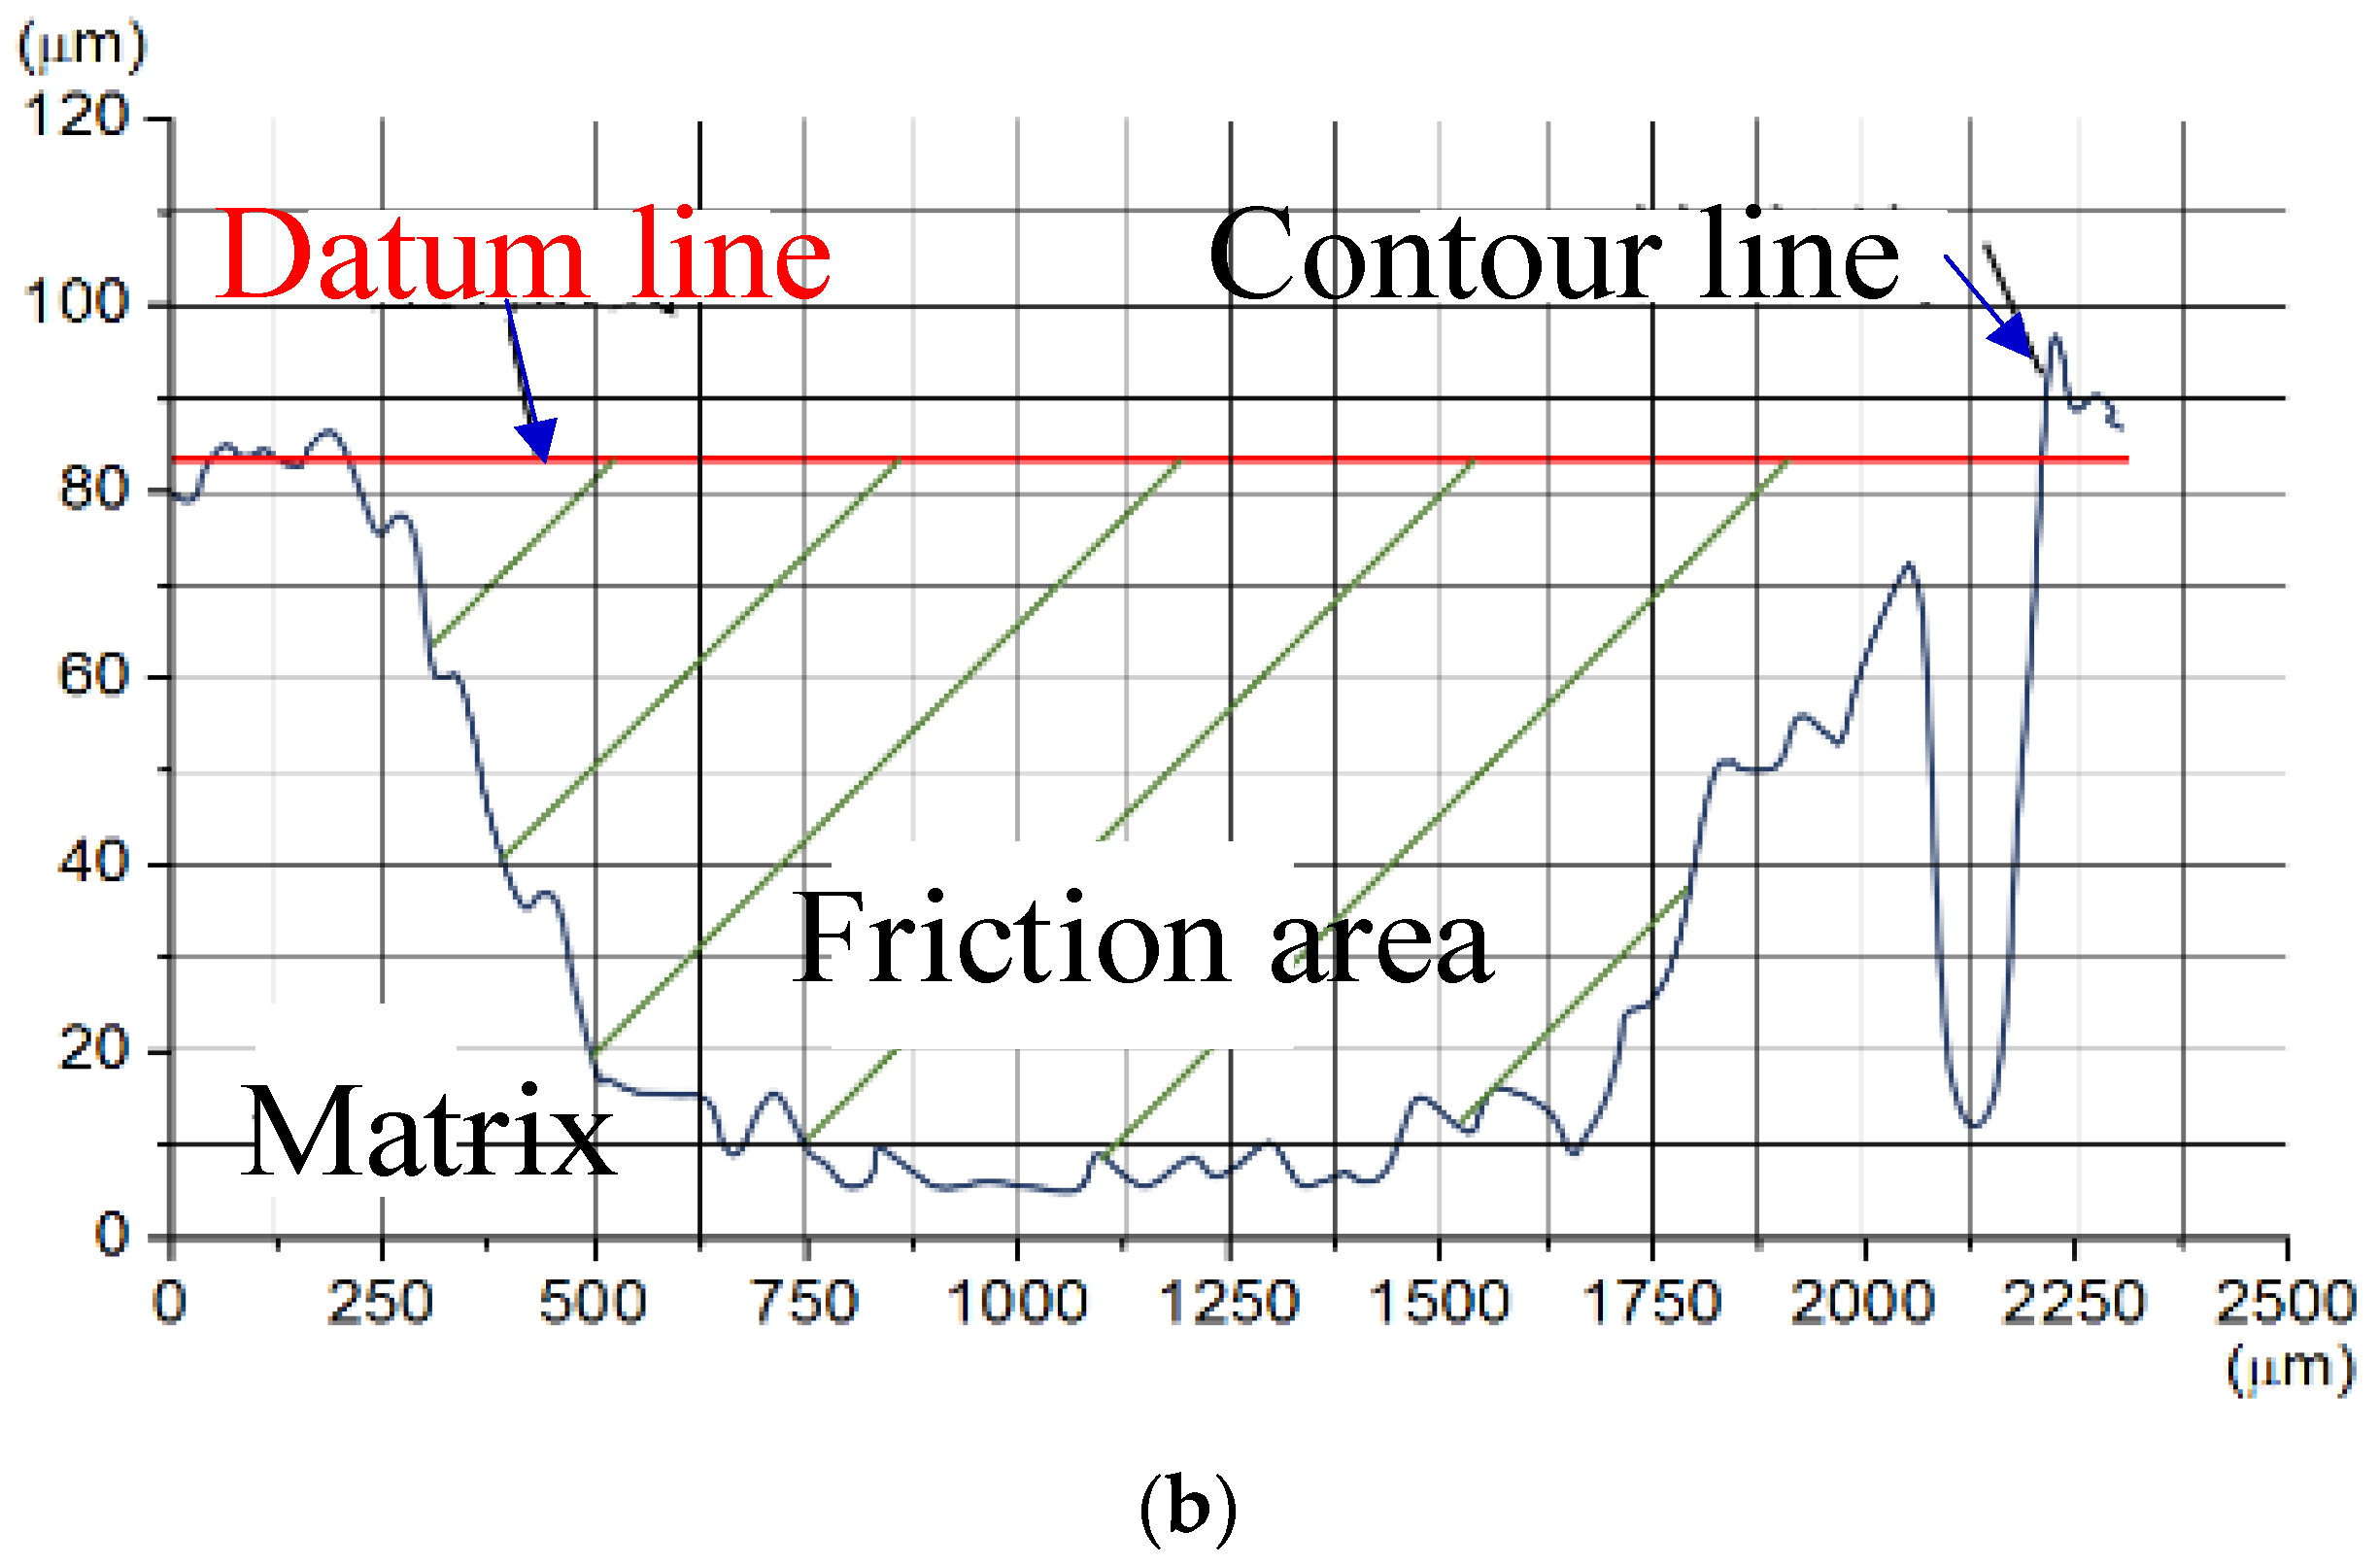
Figure 5a, perpendicular grinding marks of the wear track profile were acquired using the depth extension function of the OLYMPUS DSX500 optical digital microscope (Nanjing Dongtu Technology Co., Ltd. Nanjing, China).
In Figure 5b, a line is first selected to obtain the wear rate. Next, the area between the datum line and the contour line is counted using the grid method. Then, the same method is used repeatedly to measure the area of the wear trace contour and an average value is obtained. Lastly, the wear rate can be expressed as follows:
W r = Δ V S = A p n T
where W r is the wear rate, Δ V is the wear volume, S is the sliding distance, A p is the average of the wear scar contour area, n is the rotational speed of the plate (which can be observed in Figure 4b), and T is the friction time.
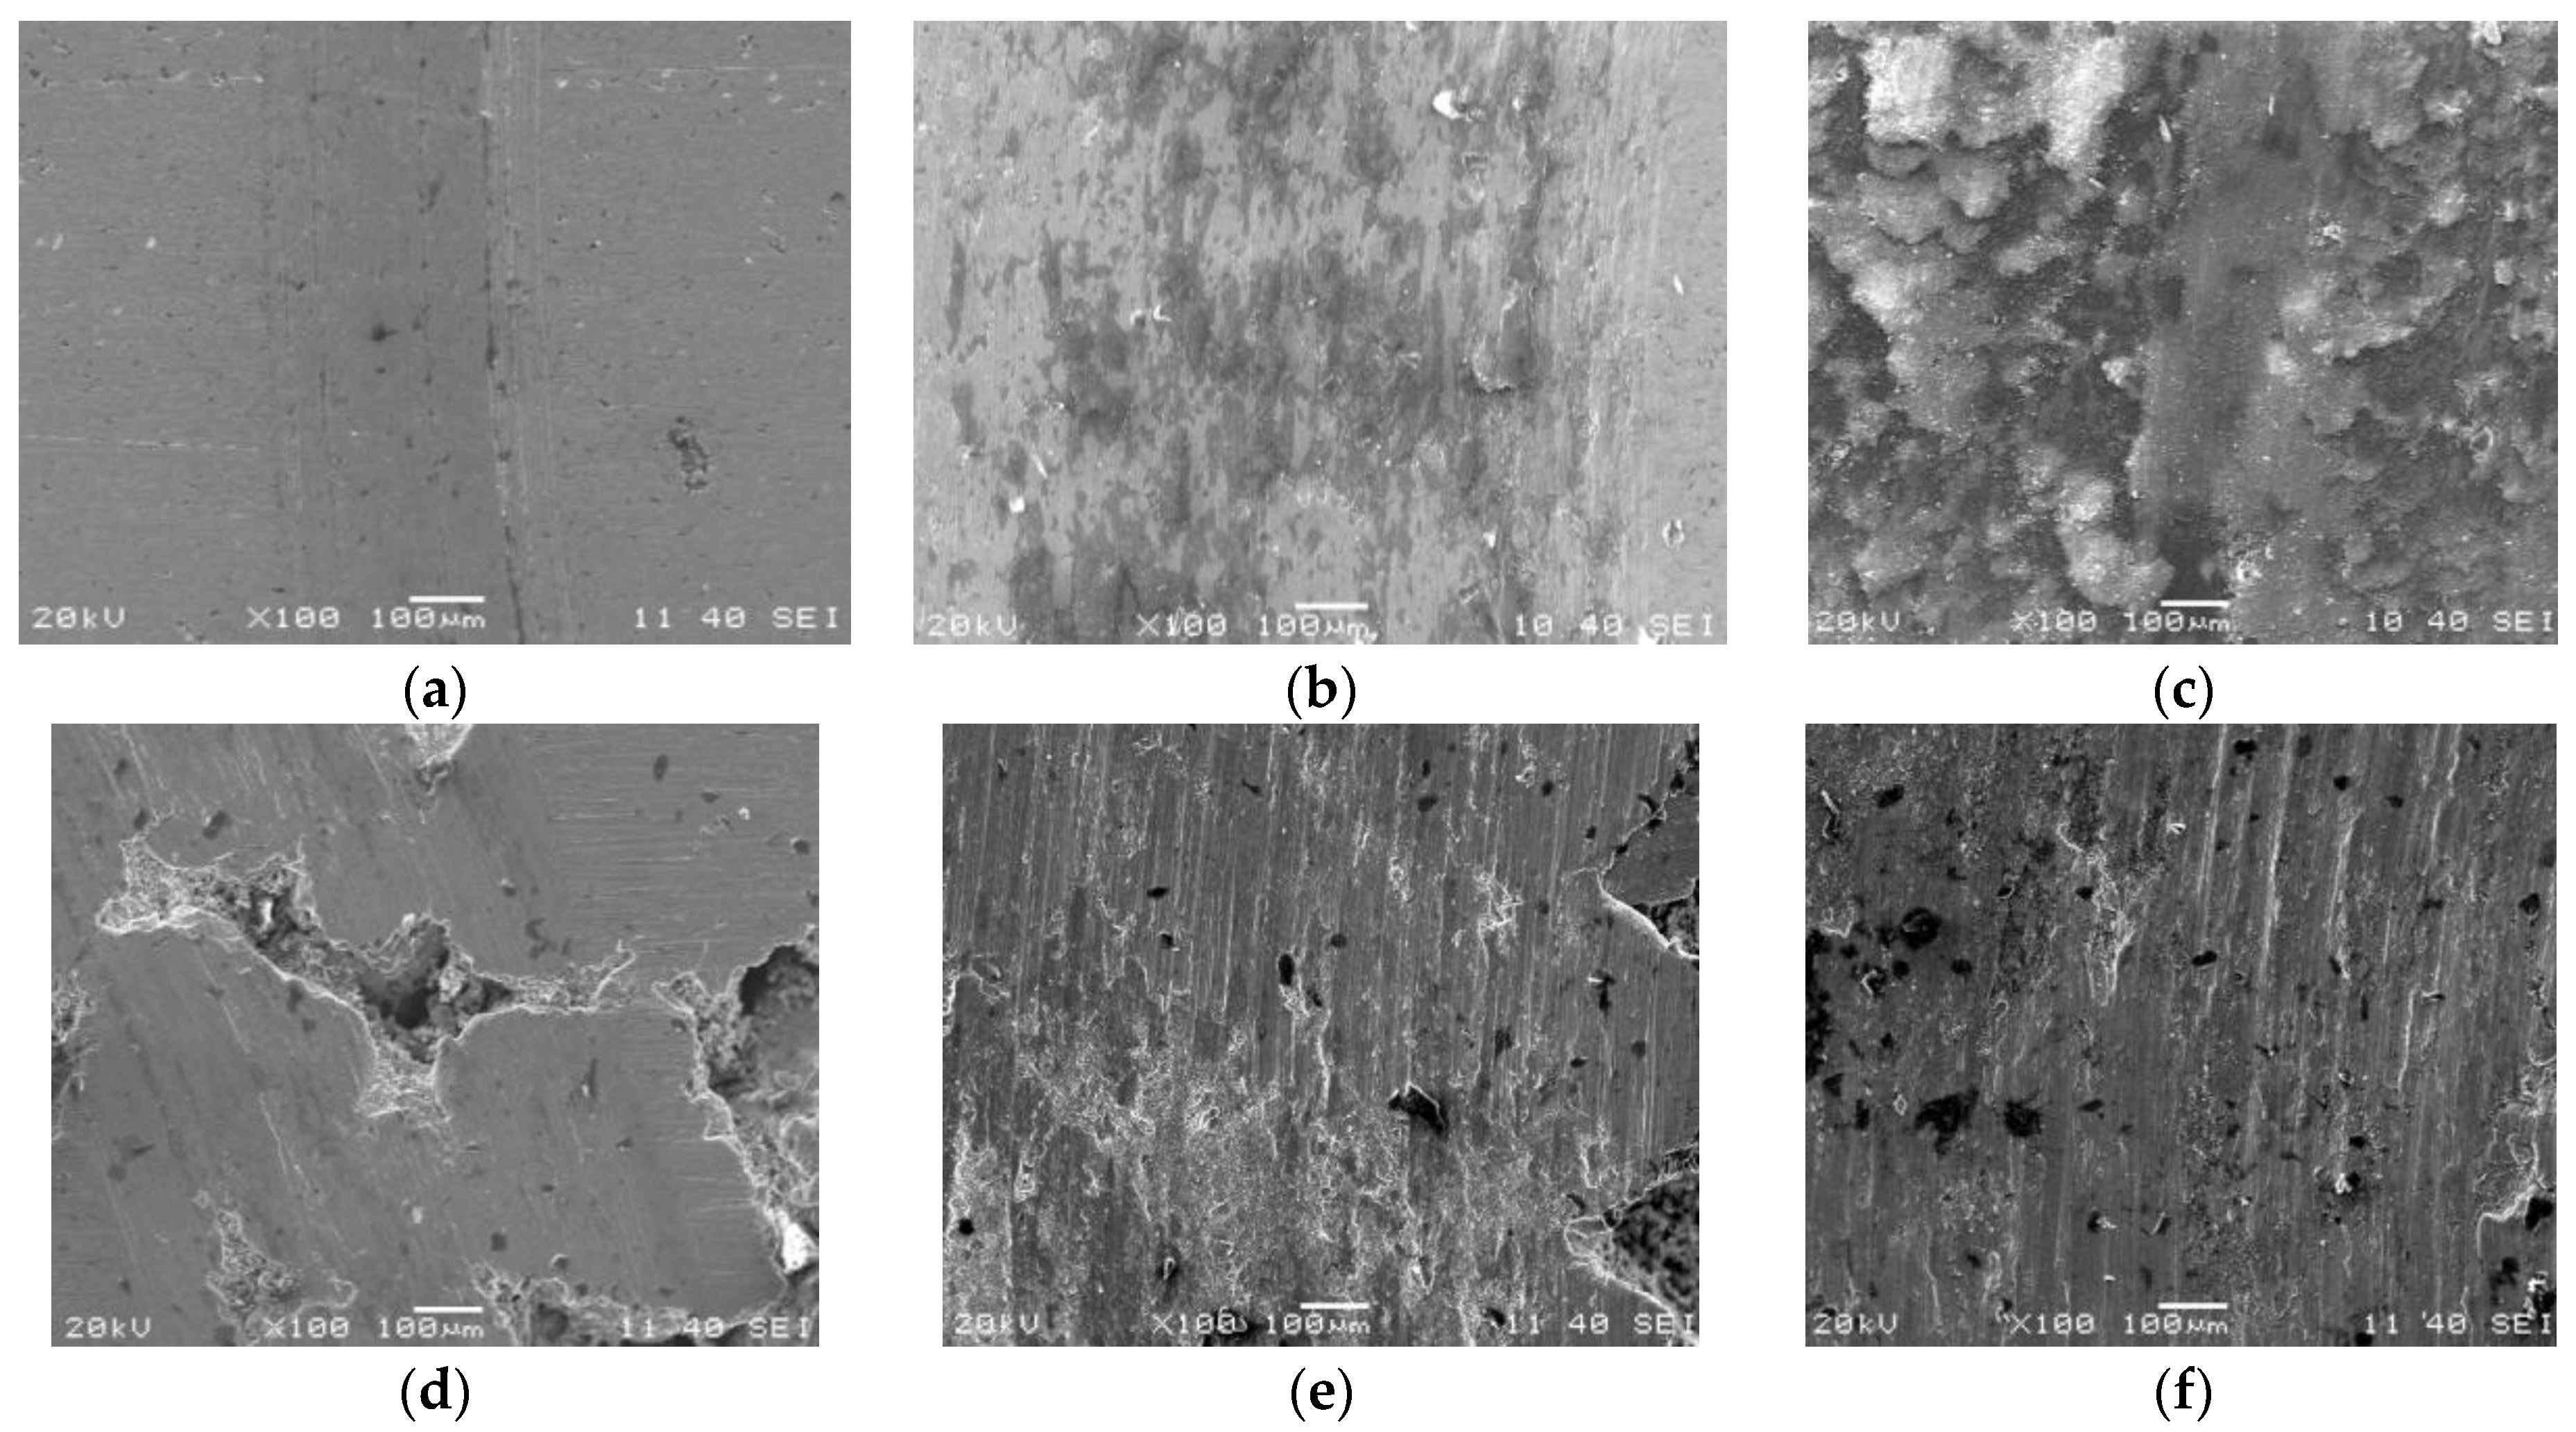
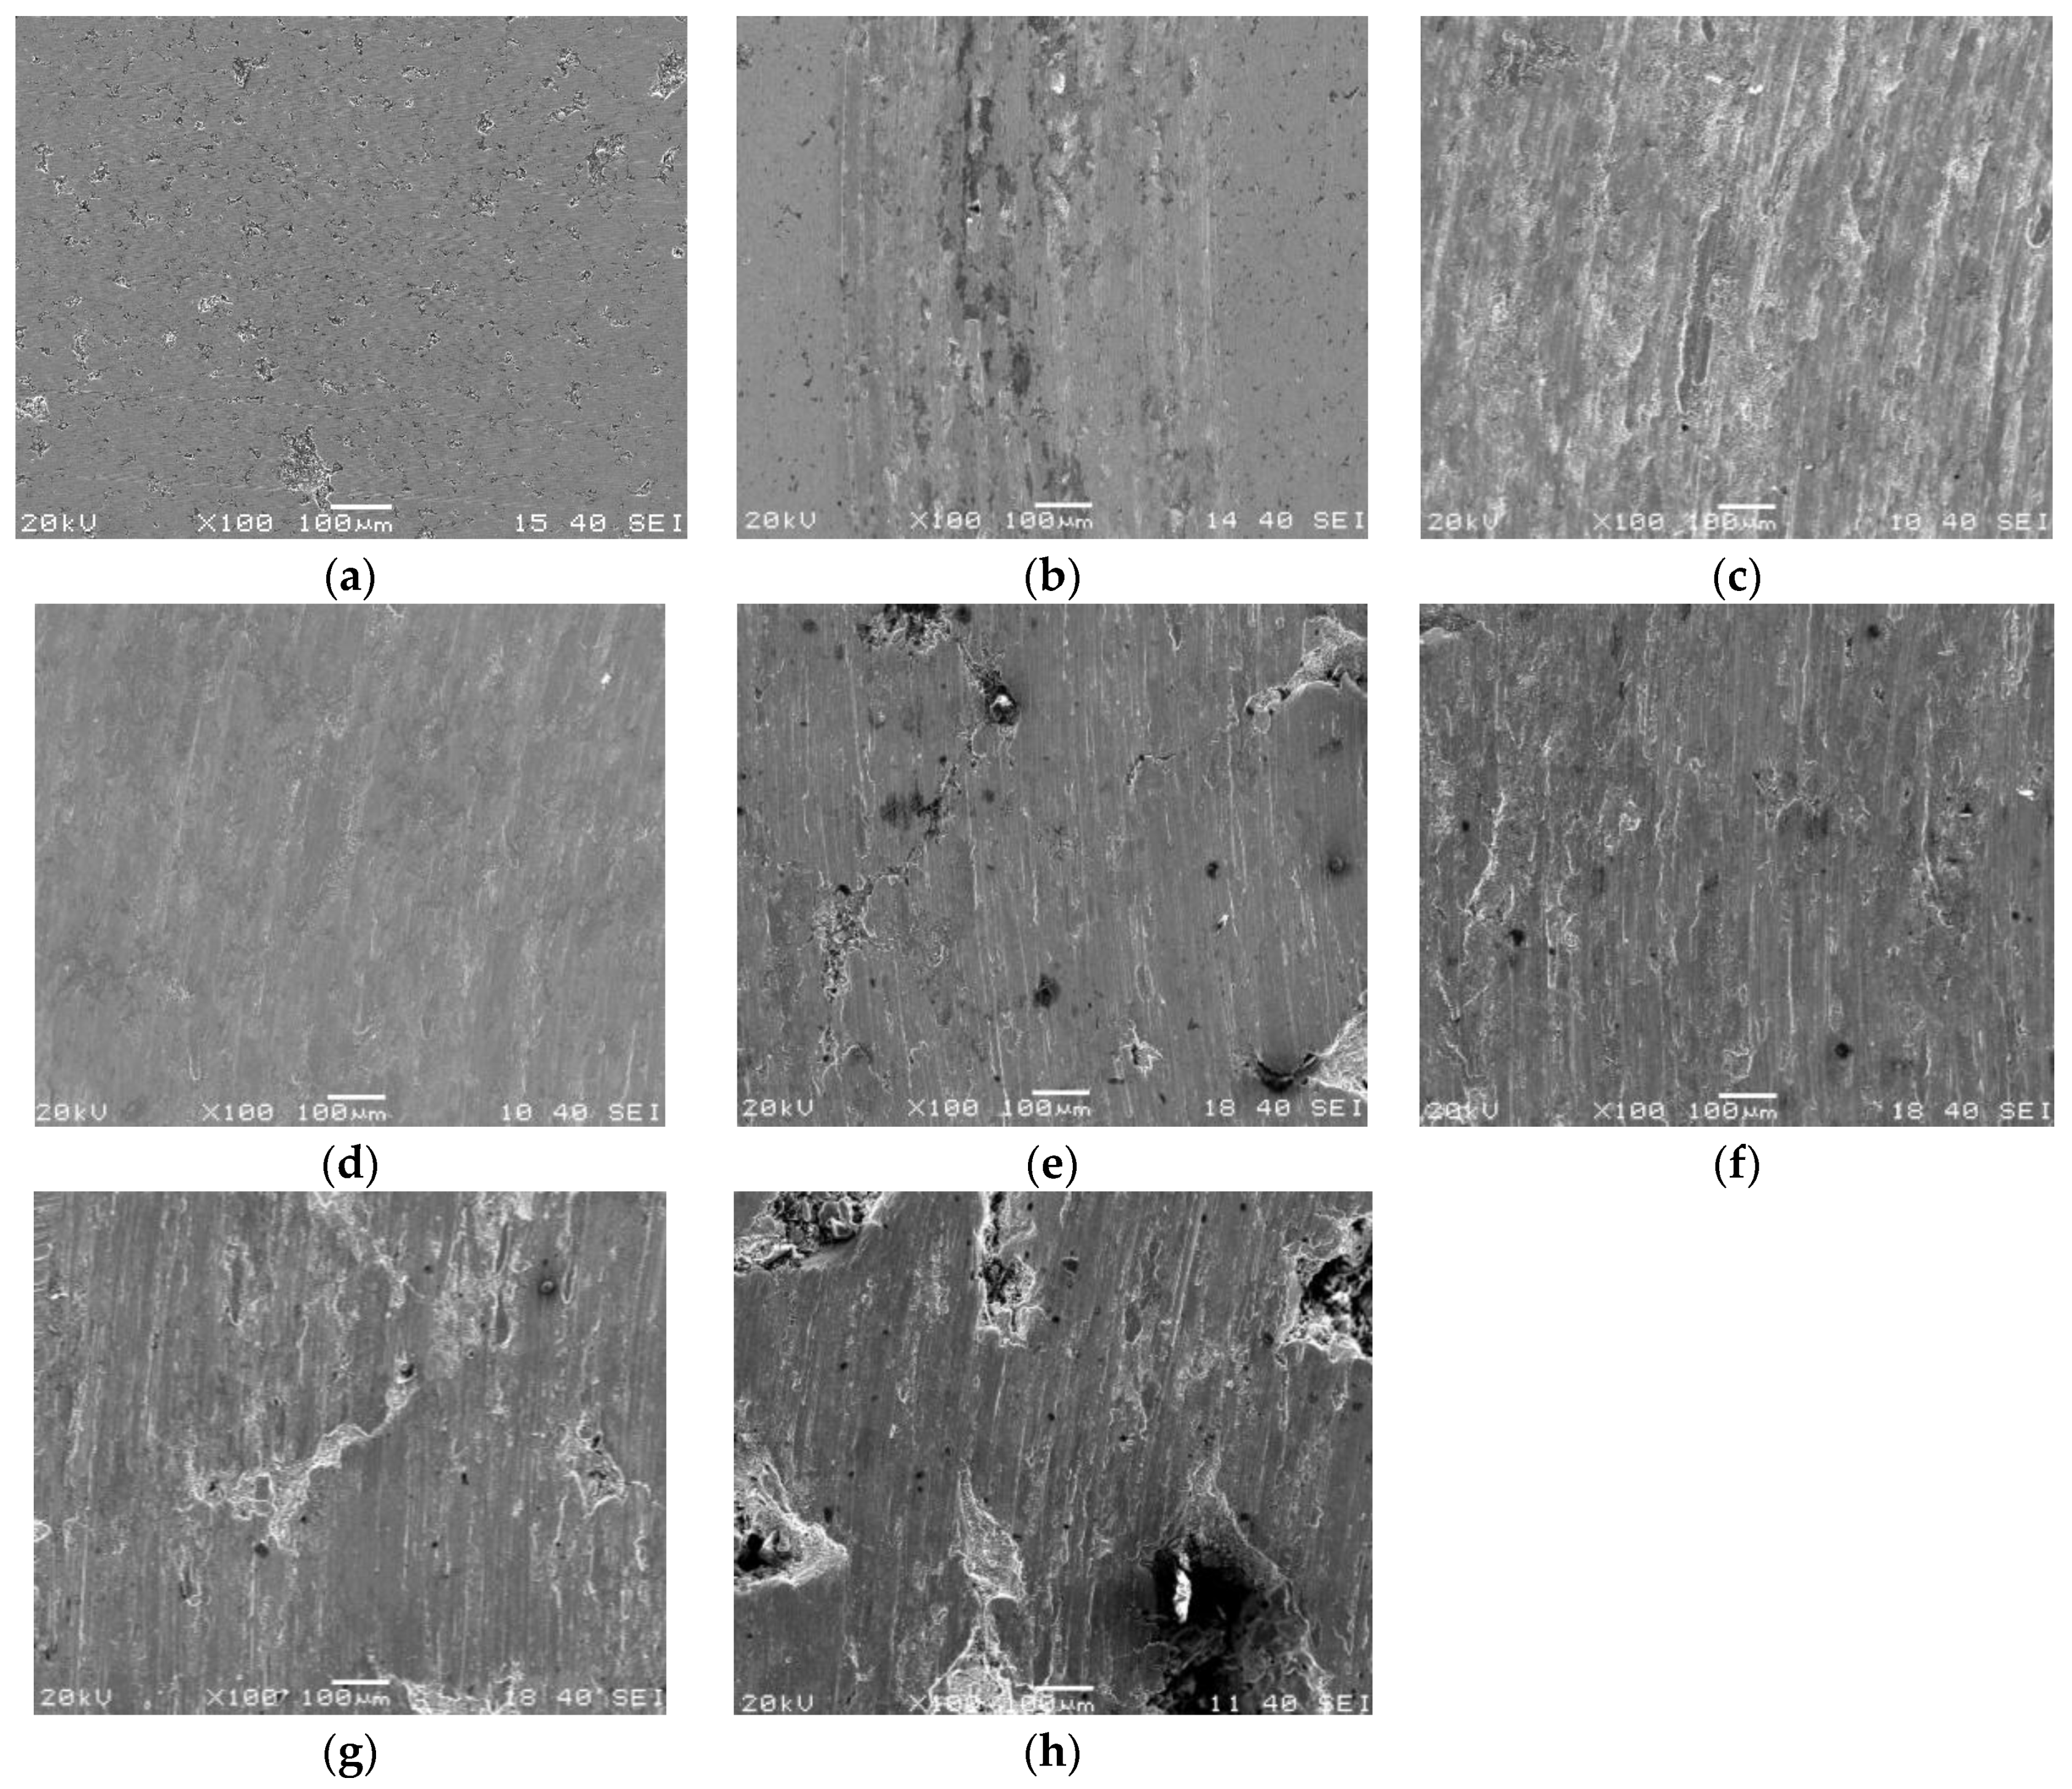
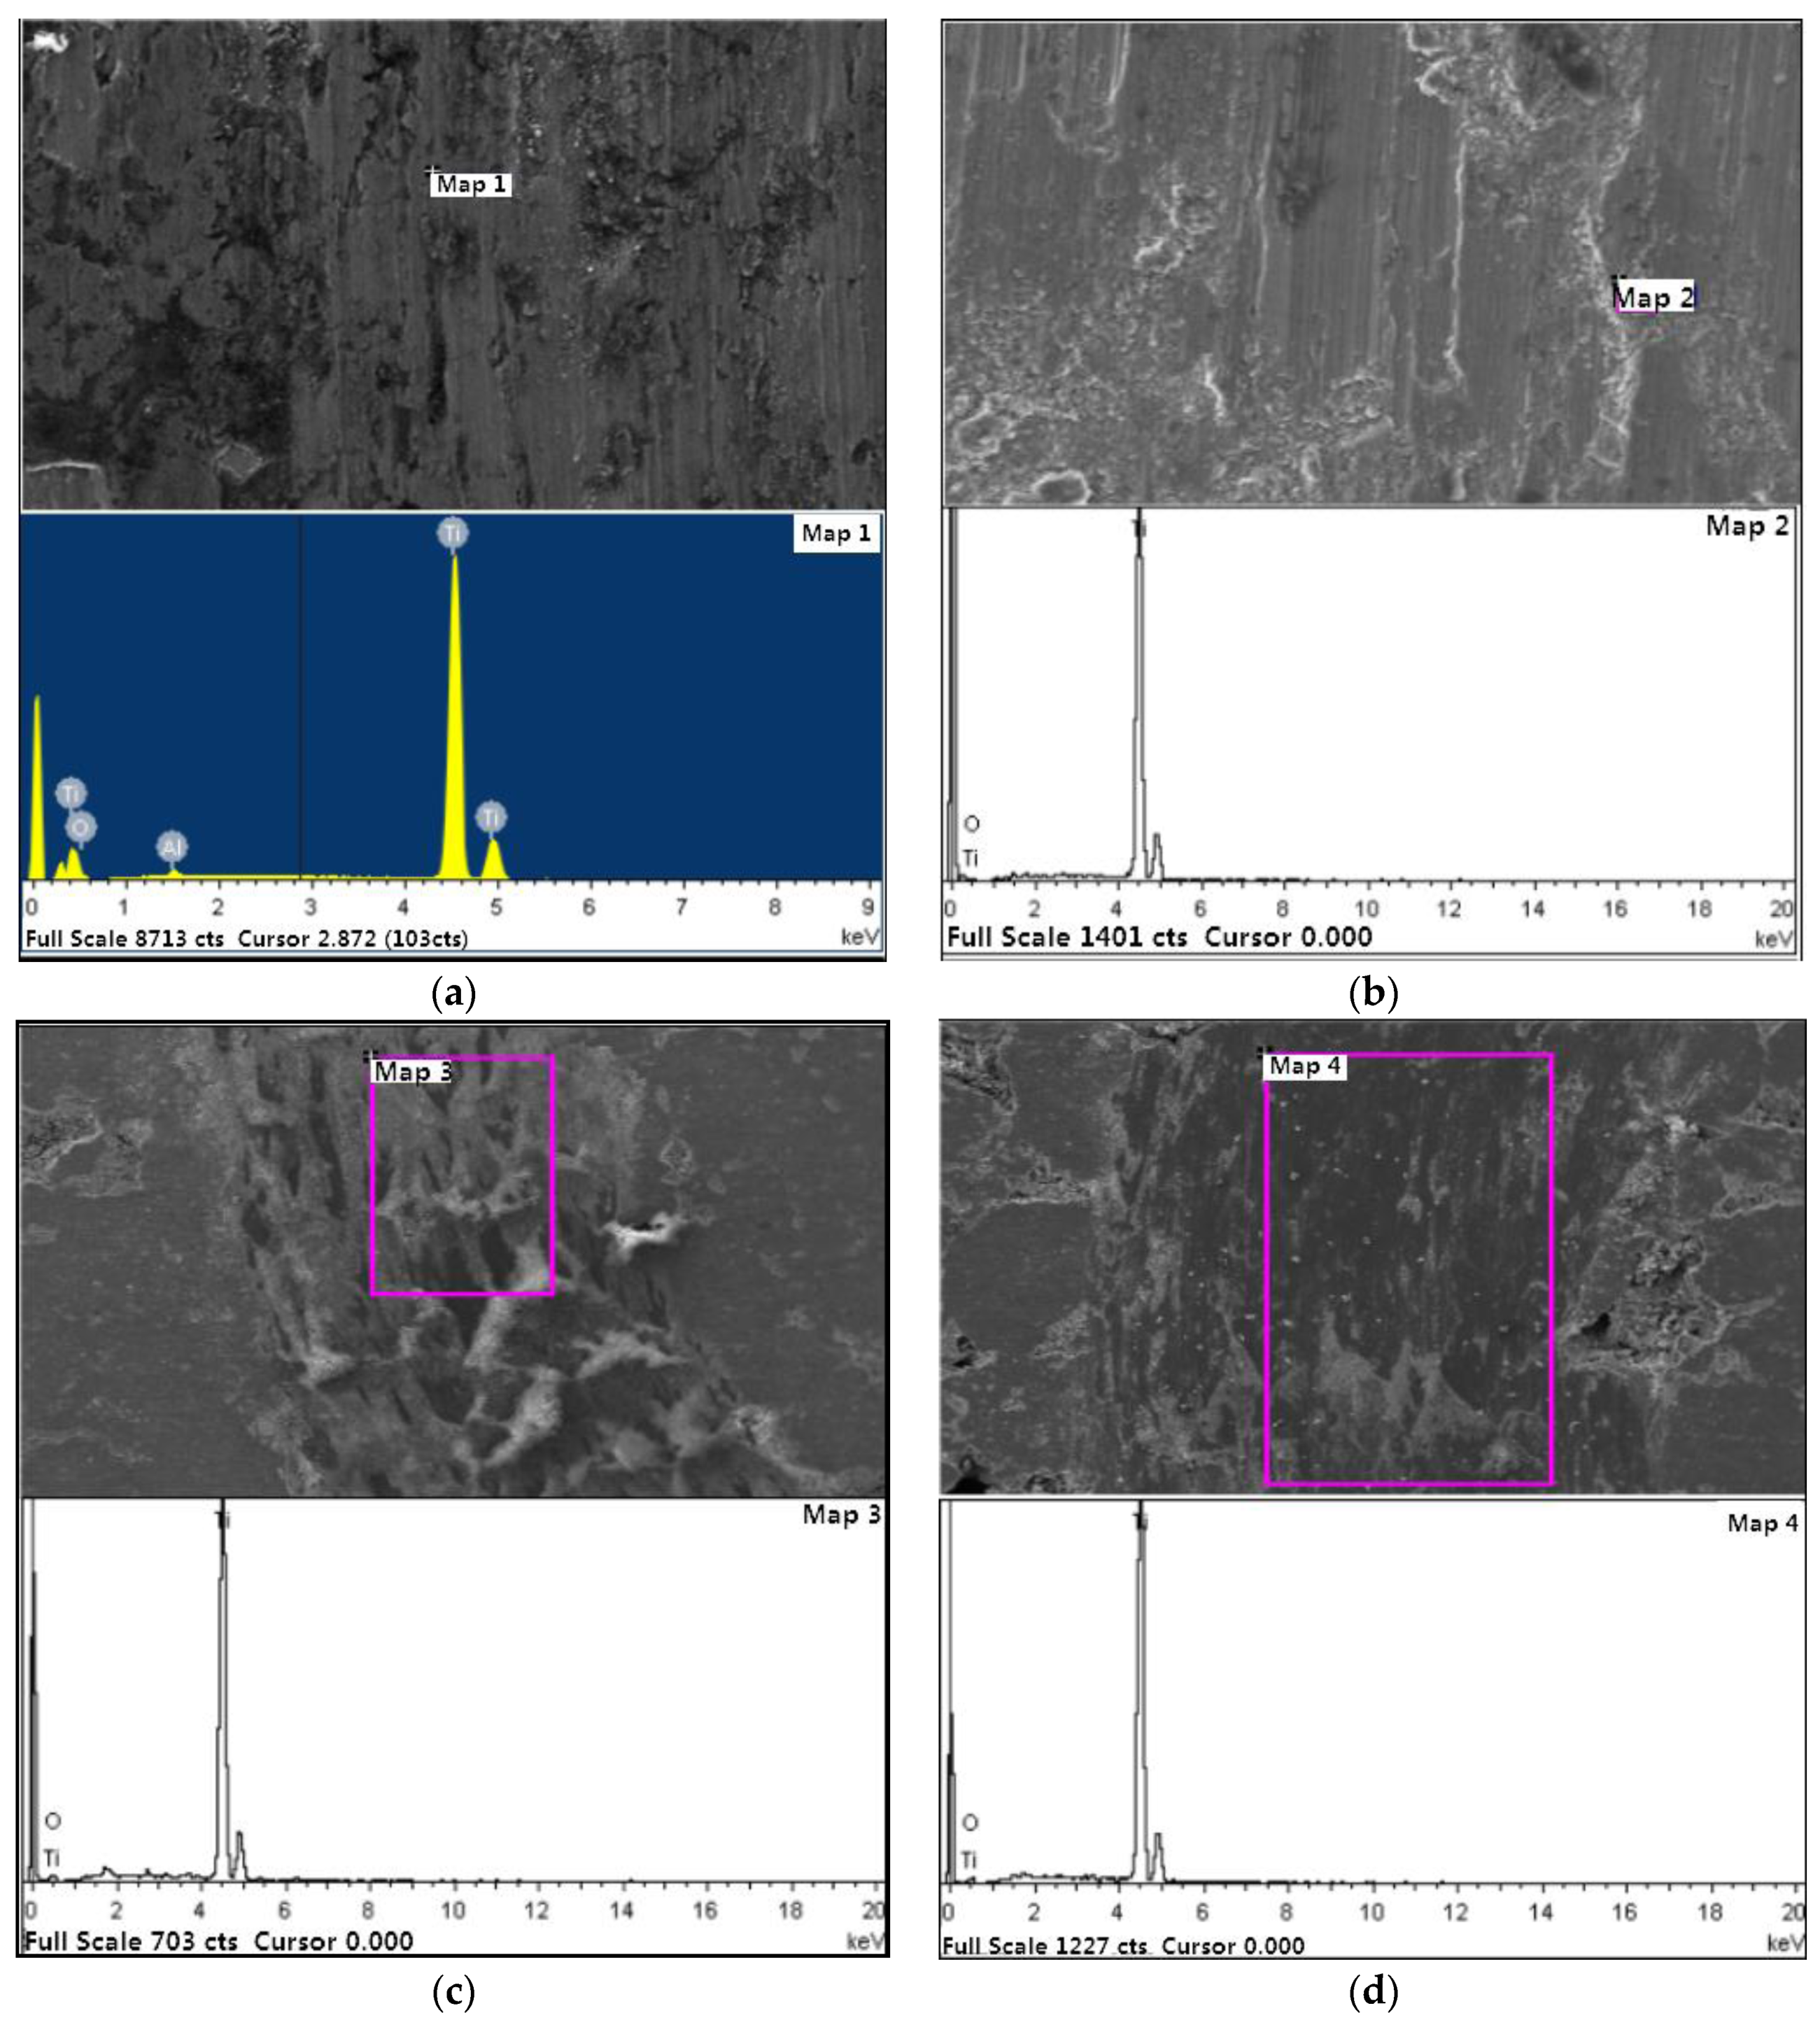
The VHX-900 super depth of field digital microscope (Keyence Co., Ltd., Osaka, Japan) and the JSM-6480 scanning electron microscope (SEM, Shanghai Zhujin Analysis Instrument Co., Ltd., Shanghai, China) are both used to observe the wear trace of the surface and the micro-topography wear region of the carbide ball to analyze the friction characteristics of the friction pairs formed by the cutting tool and the machined surface. In addition, the INCA energy disperse spectroscopy (EDS, Oxford instrument (Shanghai) Co., Ltd., Shanghai, China) is used to analyse the micro area and the spots of the wear surface. The purpose is to obtain the wear mechanism of the cutting tool and the machined surface.

3. Results and Discussion

3.1. Friction Coefficient and Wear Rate Curve

3.1.1. Effects of Load on Friction Coefficient and Wear Rate

Two kinds of samples, small-porosity and large-porosity, were tested with loads of 4 N, 6 N, 8 N, 10 N, and 14 N in order to study the effect of load on the friction coefficient and wear rate of porous materials in micro-cutting. Samples are all at the same sliding speed (300 r/min) and the temperature (20 °C). As shown in Figure 6, the changes in the friction coefficient were acquired by the UMT-2. In Figure 6a, the friction coefficients of small porosity sample with the load less than 8 N increase firstly after declining. Finally, it tends to stabilize because the small-porosity sample has an aperture with a larger contact area at the start of rubbing. As the friction develops, the phenomena of pore edge peeling and tearing becomes more serious, which leads to decrease in the contact area and friction coefficient. When the load is 8 N, the effect of a larger contact area of the small-porosity and the influence of the pore edge peeling and tearing disappears, which leads to the small contact area canceling each other out. Thus, the curve is smooth and almost a straight line. With the increase of load, the temperature increases dramatically because the friction decreases the shear yield strength of the material and reduces the friction coefficient at first. Figure 6a shows that the load has a great influence on the friction coefficient of porous titanium alloys under the micro-machining. However, Figure 6b shows that the friction coefficient of the large-porosity sample under different load is basically the same. The curves of the large porosity change smoothly due to that the porosity has greater impact on the friction coefficient than the factor of the load. As a result, the contact area changes little in the process of friction.
In order further investigate the influence of load and porosity on the friction coefficient and wear rate, the experimental data were analyzed. As shown in Figure 7a, the wear rate of each group is consistent with the change of loads. However, comparison of the two groups of different porosity samples finds that the wear rate decreases as the porosity increases, which results in a reduction of the wear resistance of the material. The effect of porosity on the wear resistance of materials is mainly to reduce the mechanical properties of materials, such as hardness, elastic modulus and so on. Moreover, the increase in the porosity of the material leads to an increase in the fracture phenomenon of the material edge and the wear debris, which results in the aggravation of the wear and tear. From Figure 7a, when the load is 8 N–10 N, another important phenomenon is shown as the wear rate of the two groups of samples changes slowly. Similarly, the friction coefficients of the two samples in Figure 7b reach the same value when the load is 8 N–9 N. Thus, it can be concluded that the wear resistance of different porosity materials is relatively stable in the micro-cutting of porous titanium alloys. In addition, the effect of porosity on the friction coefficient is minimum when the load is about 8 N.
Figure 7b shows the variation of the friction coefficient with the load and indicates that the friction coefficient changes smoothly as the load increases. This is because the contact surface of the friction pairs is dominated by plastic contact in the micro-cutting process. The slight decrease in the friction coefficient of the small-porosity samples is due to the nonlinear relationship between the load and the contact area. It can also be observed from the image that the friction coefficient of the material would increase with increasing porosity.

3.1.2. Effects of Sliding Speed on Friction Coefficient and Wear Rate

To study the effect of different sliding speeds on the friction coefficient and wear rate, the load applied to the test remained unchanged at 6 N and the temperature was maintained at room temperature. The friction and wear tests were carried out at sliding speeds of 1.57 m/min, 3.14 m/min, 6.28 m/min, 9.43 m/min, 12.56 m/min, and 15.71 m/min. As shown in Figure 8a, it can be observed that the coefficient of friction for small-porosity samples varies dramatically with speed. The cause of this phenomenon is that debris is collected within the pores at low sliding speeds, and the surface gets rougher under this condition. As a result, it leads the low value of the friction coefficient. If the sliding speed is very high, the contact surface temperature will rise sharply, which may soften the contact surface and lead to a decrease in the coefficient of friction. It also indicates that the friction coefficient of the large-porosity sample seems to decrease at a low sliding velocity when the sliding speed increases. Comparing Figure 8a,b, it can be found that the friction coefficients of the two porosities are most stable state when the sliding speed is about 400 r/min.
Furthermore, the influence of the sliding speed on the wear rate and friction coefficient of the two groups is shown in Figure 9. In Figure 9a, it can be observed that, at the same sliding speed, the wear resistance of the materials decreases as the porosity increases. Besides that, the wear rate decreases as the sliding speed increases. In particular, because of the uneven distribution of space, the wear rate of the sample with large porosity decreases abruptly at the speed of 9.43 m/min.
In Figure 9b, the friction coefficient increases as the sliding speed increases generally. Twists in the small-porosity and large-porosity samples are observed at sliding speed in the vicinity of 6.28 m/min and 3.14 m/min, respectively. Because the influence of the sliding speed on the friction coefficient is mainly through the change in temperature, high temperature can soften the material so as to slow down the change trend of friction coefficient. Larger pore lead to poorer heat dissipation.

3.1.3. Effects of Temperature on Friction Coefficient and Wear Rate

To distinguish the effects of different temperatures on the friction coefficient and wear rate, large porosity samples were chosen. In addition, the test is carried out at the same sliding speed (300 r/min) and load (6 N). The testing temperatures were 20 °C, 100 °C, 200 °C, 300 °C, 400 °C and 500 °C. As observed in Figure 10, the fluctuation of the friction curve is more intense than at room temperature. The increase in temperature softens the material and leads to a decrease in the mechanical properties and spalling of the sharp edges at the voids. Therefore, the contact surface area changes, and this results in an increase in the fluctuation of the friction curve.
In Figure 11a, the effects of the temperature on the wear rate and friction coefficient are shown. With an increase in temperature, the wear rate first decreases and then increases. An inflection point appears near 300 °C. The point in the material wear mechanism is explained as a progression from minor to severe wear and tear. The main factors influencing this phenomenon are the production of an oxide film on the friction surface and the temperature that results in the softening of the material. Before the inflection point, the wear rate decreases as a result of the production of the oxide film on the friction surface. However, after the inflection point, the phenomenon of temperature softening controls the wear rate, and the wear rate increases as a result.
Figure 11b shows that the friction coefficient of the material decreases as the temperature rises. The relationship between the friction coefficient and the temperature can be simulated as a linear equation, which was obtained by fitting the data and is given as follows:
μ ( T ) = 0.5727 0.1304 ( T 20 ) / 1000
where T (°C) is the temperature of the contact surface.

3.2. Wear Morphology and Mechanism of Porous Titanium Materials

The wear morphology of the two groups of samples with different porosities was recorded by SEM under different loads in Figure 12. Among them, Figure 12a–c shows that there is a slight furrow and delamination peeling phenomenon with the load and roughness increase. The surface roughness of the sample is small and the main wear mechanism is abrasive wear. The images in Figure 12e–f more evidently indicate that, as the load and roughness increases, the furrows become deeper and a dense black oxide film is created. The wear mechanism is replaced by abrasive wear, which is accompanied by slight oxidation wear.
Furthermore, compared with the small-porosity sample, the sample with large porosity has more serious wear on the surface and deeper furrows, which is mainly because the high porosity causes the aperture edge to tear leading to more obvious spalling. The gap becomes larger and the debris that peels off participates in wearing the surface. These factors form a three-body abrasion process. Moreover, with the ongoing friction, a membrane body appears because of the repeated extrusion between the sample and the sphere (Carbide YG6); this membrane can reduce the surface roughness and is conducive for improving the frictional performance.
The wear morphology of the porous titanium materials with different porosity under different sliding speeds is shown in Figure 13. As the sliding speed increases, the wear surface deforms plastically and the growing furrows roughen the surface. The increasing sliding speed also leads to an increase of temperature which produces the oxide film between the contact surfaces.
This film can reduce the wear rate. The sliding speed used in this experiment is relatively small, and the heat produced by friction behavior is not enough to cause the material to soften.
Therefore, the phenomenon that sliding rate increases while the wear rate reduction is due to the oxide film generated on the machined surface.
Furthermore, in Figure 14, the wear surface morphology of the porous titanium samples with the porosity of ~38%–42% is shown at different temperatures. When the temperature is 300 °C, the surface is covered with a dense black oxide film and the pore edge fragmentation slows down, resulting in a low wear rate. On the other hand, when the temperature increases to 500 °C, the film is damaged and the fracture of the pore edge worsens, resulting in a more severe wear.
The micro region and the spots on samples were analysed by INCA Energy Disperse Spectrometer (EDS), and the results are shown in Figure 15 and Table 6. Figure 15a,b shows images of samples with different porosities at a sliding speed of 300 r/min. However, Figure 15b–d shows images of the large porosity samples with increasing temperatures. In addition, Table 6 shows the variation of the proportions of the elements in titanium samples under different conditions. A comparison of Figure 15c,d shows that with the increasing temperature, the Oxygen element content in the titanium sample increases. Although titanium is very stable at room temperature, the increased temperature is the main factor for oxidation. The EDS analysis shows that the wear process of porous titanium is accompanied by oxidation wear. Moreover, when the load is over 10 N, the oxidation wear is obvious, and the oxidation phenomenon is violent at a high temperature.
Finally, the VHX-900 super depth of field digital microscope and the OLYMPUS DSX500 digital microscope are used to observe the wear morphology of the YG6 carbide grinding ball under the load of 6 N. The images are shown in Figure 16. The difference between Figure 16a,b is the sliding speed. As observed in Figure 16b, there are clearer scratches in the wear area due to furrows effects along the rubbing direction and abrasive grooves on the surface. Moreover, the furrows are unevenly distributed on the surface that along the sliding direction of the YG6 carbide grinding ball. In particular, the black region is the accumulation area of the debris. An apparent crack can be observed in Figure 16c, which is a result of the fatigue damage caused by abrasive wear. The peeling phenomenon can be observed in Figure 16d; the peeling occurs because the surface of the metal becomes brittle after being deformed and then strengthened. Then, micro-cracks are produced and the metal surface is peeled off under the load. As a result, the main form of wear in the contact area of the YG6 carbide grinding ball is abrasive wear.

4. Conclusions

A study on the friction and wear of porous titanium has been carried out under different porosity, load, sliding speed and temperature conditions. The following conclusions can be drawn from this study:
(1)
In the micro-cutting process of porous titanium alloys, the best choice of machining parameters for different porosity materials are as follows: the load is about 8 N, the sliding speed is about 400 r/min and the temperature is about 300 °C. This choice can satisfy the requirements that the material’s friction coefficient and wear rate should be kept at a relatively stable value to the maximum extent possible, to improve the quality of the machined surface and the service life of the cutter.
(2)
The wear mechanism of porous titanium material is abrasive wear and slight oxidation wear at room temperature. However, the mechanism will change to severe oxidation wear and abrasive wear if the temperature is high. In addition, the main wear mechanism in the contact area of the YG6 carbide grinding ball is abrasive wear.
(3)
Among the parameters of porosity, load, sliding velocity and temperature, the main factor that influences the friction coefficient and wear rate is the porosity. Porosity reduces the wear resistance of the material. In addition, due to the existence of the porosity, the abrasive wear mainly occurs between the friction pair, while the oxidation wear occurs only under large load.
(4)
Under the micro-cutting condition, the contact surface of the friction pair is mainly plastic contact. The black oxide film formed on the surface of the processed surface at high speed or high temperature is mainly compounds of titanium and oxygen.

Acknowledgments

The work is supported by the National Natural Science Foundation of China (No. 51305174).

Author Contributions

Zhiqiang Liu and Feifei Ji conceived and designed the experiments; Tianyu Zhu performed the experiments; Mingqiang Wang analyzed the data; Zhiqiang liu contributed reagents/materials/analysis tools; and Feifei Ji wrote the paper.

Conflicts of Interest

The authors declare no conflict of interest. The funding sponsors had no role in the design of the study; in the collection, analyses, or interpretation of data; in the writing of the manuscript, and in the decision to publish the results.

References

  1. Ezugwu, E.O.; Wang, Z.M. Titanium alloys and their machinability—A review. J. Mater. Process. Technol. 1997, 68, 262–274. [Google Scholar] [CrossRef]
  2. Liu, Y.; Jiang, G.F.; He, G. Enhancement of entangled porous titanium by BisGMA for load-bearing biomedical applications. Mater. Sci. Eng. C 2016, 61, 37–41. [Google Scholar] [CrossRef] [PubMed]
  3. Yetim, A.F. Investigation of wear behavior of titanium oxide films, produced by anodic oxidation, on commercially pure titanium in vacuum conditions. Surf. Coat. Technol. 2010, 205, 1757–1763. [Google Scholar] [CrossRef]
  4. Sui, X.D.; Li, G.J.; Qin, X.S. Relationship of microstructure, mechanical properties and titanium cutting performance of TiAlN/TiAlSiN conposite coated tool. Ceram. Int. 2016, 42, 7524–7532. [Google Scholar] [CrossRef]
  5. Ayed, Y.; Germain, G.; Ammar, A. Tool wear analysis and improvement of cutting conditions using the high-pressure water-jet assistance when machining the Ti17 titanium alloy. Mater. Lett. 2015, 42, 294–301. [Google Scholar] [CrossRef]
  6. Zhao, X.X.; Ke, W.; Zhang, S.S. Potential failure cause analysis of tungsten carbide end mills for titanium alloy machining. Eng. Fail. Anal. 2016, 66, 321–327. [Google Scholar] [CrossRef]
  7. Dearnley, P.A.; Grearson, A.N.; Aucote, J. Wear mechanisms of cemented carbides and ceramics used for machining titanium alloys. High Technol. Ceram. 1987, 38, 2699–2712. [Google Scholar]
  8. Corduan, N.; Hirnbert, T.; Poulachon, G. Wear mechanisms of new tool materials for Ti-6Al-4V high performance machining. CIRP Ann. 2003, 52, 73–76. [Google Scholar] [CrossRef]
  9. Igor, V.; Florian, A.; Stefan, K. The influence of temperature on friction and wear of unlubricated steel/steel contacts in different gaseous atmospheres. Tribol. Int. 2016, 98, 155–171. [Google Scholar]
  10. Dai, J.J.; Zhu, J.Y.; Chen, C.Z. High temperature oxidation behavior and research status of modification on improving high temperature oxidation resistance of titanium alloy and titanium aluminides: A review. J. Alloy. Compd. 2016, 685, 784–798. [Google Scholar] [CrossRef]
  11. Guo, C.; Zhou, J.; Chen, J.M. Improvement of the oxidation and wear resistance of pure Ti by laser cladding at elevated temperature. Surf. Coat. Technol. 2010, 205, 2142–2151. [Google Scholar] [CrossRef]
  12. Long, M.; Rack, H.J. Friction and surface behavior of selected titanium alloys during reciprocating-sliding motion. Wear 2001, 249, 157–167. [Google Scholar] [CrossRef]
  13. Matikas, T.E.; Nicolaou, P.D. Prediction of contact temperature distribution during fretting fatigue in titanium alloys. Tribol. Trans. 2009, 52, 346–353. [Google Scholar] [CrossRef]
  14. Yang, Y.; Zhang, C.H.; Wang, Y. Friction and wear performance of titanium alloy against tungsten carbide lubricated with phosphate ester. Tribol. Int. 2016, 95, 27–34. [Google Scholar] [CrossRef]
  15. Wang, X.H.; Li, J.S.; Hu, R. Mechianical properties and pore structure deformation buhaviour of biomedical porous titanium. Trans. Nonferr. Met. Soc. China 2015, 25, 1543–1550. [Google Scholar] [CrossRef]
  16. Wang, G.; Rahman, M.; Wong, Y.S. Study on orthogonal turning of titanium alloys with different coolant supply strategies. Int. J. Adv. Manuf. Technol. 2009, 42, 621–632. [Google Scholar] [CrossRef]
  17. Quan, H.X.; Gao, S.S.; Zhu, M.H.; Yu, H.Y. Comparison of the torsional fretting behavior of three porous titanium coatings for biomedical applications. Tribol. Int. 2015, 192, 29–37. [Google Scholar] [CrossRef]
  18. Molinari, A.; Straffelini, G.; Tesi, B.; Baccai, T. Dry sliding wear mechanism of the Ti6Al4V alloy. Wear 1997, 208, 105–112. [Google Scholar] [CrossRef]
  19. Yang, D.; Liu, Z.Q. Surface topography analysis and cutting parameters optimization for peripheral milling titanium alloy Ti-6Al-4V. Int. J. Refract. Met. Hard Mater. 2015, 51, 192–200. [Google Scholar] [CrossRef]
  20. Tutunea Fatan, O.R.; Fakhri, M.A.; Bordatchev, E.V. Porosity and cutting forces: From macroscale to microscale machining correlations. Proc. Inst. Mech. Eng. 2011, 255, 619–630. [Google Scholar] [CrossRef]
  21. Lauro, C.H.; Filho, S.L.M.R.; Brandão, L.C.; Davim, J.P. Analysis of behaviour biocompatible titanium alloy (Ti-6Al-7Nb) in the micro-cutting. Measurement 2016, 93, 529–540. [Google Scholar] [CrossRef]
  22. Attanasio, A.; Gelfi, M.; Giardini, C.; Remino, C. Minimum quantity lubrication in turning. Wear 2006, 160, 333–338. [Google Scholar] [CrossRef]
  23. Farokhzadeh, K.; Edrisy, A. Transition between mild and severe wear in titanium alloys. Tribol. Int. 2016, 94, 98–111. [Google Scholar] [CrossRef]
  24. Fakhri, M.A.; Bordatchev, E.V.; Tutunea Fatan, O.R. An image-based methodology to establish correlations between porosity and cutting force in micromilling of porous titanium foams. Int. J. Adv. Manuf. Technol. 2012, 60, 841–851. [Google Scholar] [CrossRef]
Figure 1. Preparation of porous titanium test samples: (a) specimen with small porosity; and (b) specimen with large porosity.
Metals 07 00028 g001
Figure 2. Highly processed test samples observed by VHX-900 super depth of field digital microscope with a magnification of 20: (a) specimen with small porosity; and (b) specimen with large porosity.
Metals 07 00028 g002
Figure 3. Image analysis of surface topography (QSTU threshold segmentation which was proposed by the Japanese scholar named Otsu (Nobuyuki Otsu) in 1979).
Metals 07 00028 g003
Figure 4. The diagram of the experimental equipment: (a) the testing instrument; and (b) the principle of friction and wear.
Metals 07 00028 g004aMetals 07 00028 g004b
Figure 5. Image of the wear trace contour: (a) interception of grinding marks by the contour graph; and (b) calculation of the wear scar cross-section area by dividing the meshed region.
Metals 07 00028 g005aMetals 07 00028 g005b
Figure 6. Friction coefficient curves of the two groups of samples with different porosities under different loads: (a) friction coefficient curves with the porosity ε = ~24%–26%; and (b) Friction coefficient curves with the porosity ε = ~38%–42%.
Metals 07 00028 g006
Figure 7. The variation curves of the wear rate and friction coefficient with the load: (a) relationship between the wear rate and the load of materials with different porosities; and (b) relationship between the friction coefficient and the load of materials with different porosities.
Metals 07 00028 g007
Figure 8. Friction coefficient curves of the two groups of samples with different porosities under different sliding speeds: (a) friction coefficient curves with the porosity ε = ~24%–26%; and (b) friction coefficient curves with the porosity ε = ~38%–42%.
Metals 07 00028 g008
Figure 9. The variation curves of the wear rate and friction coefficient with the sliding speed: (a) relationship between the wear rate and sliding speed of materials with different porosities; and (b) relationship between the friction coefficient and sliding speed of materials with different porosities.
Metals 07 00028 g009
Figure 10. Friction coefficient curves of sample with ε = ~38%–42%, under different temperatures.
Metals 07 00028 g010
Figure 11. Influence of different temperatures on the wear rate and friction coefficient under the same load and sliding speed: (a) relationship between the wear rate and the temperature; and (b) experimental and theoretical curves of the friction coefficient at different temperatures.
Metals 07 00028 g011
Figure 12. Two groups of SEM images showing the surface morphology of the samples with different loads: (a) the porosity of the sample is ~24%–26% and the load is 4 N; (b) the porosity of the sample is ~24%–26% and the load is 10 N; (c) the porosity of the sample is ~24%–26% and the load is 14 N; (d) the porosity of the sample is ~38%–42% and the load is 4 N; (e) the porosity of the sample is ~38%–42% and the load is 10 N; and (f) the porosity of the sample is ~38%–42% and the load is 14 N.
Metals 07 00028 g012
Figure 13. Two groups of SEM images showing the surface morphology of the samples with different sliding speeds: (a) the porosity of the sample is ~24%–26% and the speed is 100 r/min; (b) the porosity of the sample is ~24%–26% and the speed is 200 r/min; (c) the porosity of the sample is ~24%–26% and the speed is 400 r/min; (d) the porosity of the sample is ~24%–26% and the speed is 500 r/min; (e) the porosity of the sample is ~38%–42% and the speed is 100 r/min; (f) the porosity of the sample is ~38%–42% and the speed is 200 r/min; (g) the porosity of the sample is ~38%–42% and the speed is 400 r/min; and (h) the porosity of the sample is ~38%–42% and the speed is 500 r/min.
Metals 07 00028 g013
Figure 14. SEM images showing the surface morphology of porous titanium materials at different temperatures: (a) the temperature of the sample is 300 °C; and (b) the temperature of the sample is 500 °C.
Metals 07 00028 g014
Figure 15. Wear surface analysis of porous titanium materials by EDS: (a) the porosity of the sample is ~24%–26%, the load is 10 N and the temperature is 20 °C; (b) the porosity of the sample is ~38%–42%, the load is 10 N and the temperature is 20 °C; (c) the porosity of the sample is ~38%–42%, the load is 6 N and the temperature is 200 °C; and (d) the porosity of the sample is ~38%–42%, the load is 6 N and the temperature is 300 °C.
Metals 07 00028 g015
Figure 16. Surface morphology of the YG6 carbide grinding ball: (a) the sliding speed is 9.43 m/min and the magnification is 139×; (b) the sliding speed is 12.56 m/min and the magnification is 139×; (c) the sliding speed is 12.56 m/min and the magnification is 800×; and (d) the sliding speed is 12.56 m/min and the magnification is 600×.
Metals 07 00028 g016
Table 1. Chemical composition of titanium powder (wt %).
TypeTiFeCuCON
500#≥99.7%≤0.02%≤0.005%≤0.02%≤0.06%≤0.02%
200#≥99.7%≤0.03%≤0.006%≤0.02%≤0.02%≤0.03%
Table 2. Characteristics of porous titanium samples.
TypePorosity (%)Equivalent Aperture (mm)
200#~24–260.015
500#~38–420.25
Table 3. Detailed parameters of the grinding ball.
MaterialDiameter (mm)Hardness (HAR)Roughness (μm)
Carbide YG69.53~89–920.01
Table 4. Range of experimental conditions.
Experimental ConditionSpeed of Revolution (r/min)Load (N)Temperature (K)
Range50–5004–14293–773
Table 5. Schemes of tests.
Test SchemeSpeed of Revolution ( r / min )Load (N)Temperature (°C)
1300620
3006100
3006200
3006300
3006400
3006500
250 (1.57 m/min)620
100 (3.14 m/min)620
200 (6.28 m/min)620
300 (9.43 m/min)620
400 (12.56 m/min)620
500 (15.71 m/min)620
3300420
300620
300820
3001020
3001420
Table 6. Element composition in porous titanium samples under different conditions.
NumberPorosity (%)Load (N)Temperature (°C)ElementWeight (%)Atom (%)
a~24–261020O2.266.43
Al1.031.74
Ti96.7191.83
b~38–421020O6.4017.00
Ti93.6083.00
c~38–426200O10.7726.55
Ti89.2373.45
d~38–426300O11.8928.77
Ti88.1171.23

