Article

Microstructure, Residual Stress, Corrosion and Wear Resistance of Vacuum Annealed TiCN/TiN/Ti Films Deposited on AZ31

1
College of Material Science and Engineering, Jiamusi University, Jiamusi 154007, China
2
College of Material Science and Engineering, Jilin University, Changchun 130022, China
*
Authors to whom correspondence should be addressed.
Metals 2017, 7(1), 5; https://doi.org/10.3390/met7010005
Submission received: 7 November 2016 / Revised: 15 December 2016 / Accepted: 20 December 2016 / Published: 29 December 2016
(This article belongs to the Special Issue Corrosion of Magnesium Alloys)

Abstract

:
Composite titanium carbonitride (TiCN) thin films deposited on AZ31 by DC/RF magnetron sputtering were vacuum annealed at different temperatures. Vacuum annealing yields the following on the structure and properties of the films: the grain grows and the roughness increases with an increase of annealing temperature, the structure changes from polycrystalline to single crystal, and the distribution of each element becomes more uniform. The residual stress effectively decreases compared to the as-deposited film, and their corrosion resistance is much improved owing to the change of structure and fusion of surface defects, whereas the wear-resistance is degraded due to the grain growth and the increase of surface roughness under a certain temperature.

1. Introduction

Magnesium alloys are one of the lightest modern structural materials, which have broad prospect and are widely used due to their good physical and mechanical properties, including high strength–weight ratio and specific stiffness, high resistance to shocks and vibration loads, good conductivity of heat and electricity, good electromagnetic shielding and recycling potential [1,2,3,4,5]. However, the poor corrosion resistance and wear resistance have restricted the application of magnesium alloys. In order to solve these two problems, the most effective method is to form a coating on the surface between the magnesium alloy and its environment. At present, various techniques are utilized for depositing the desired coatings on the magnesium alloys to improve corrosion resistance and wear resistance, such as micro-arc oxidation and arc ion plating. Of these techniques, magnetron sputtering is a favorable green technology for magnesium alloy, with the characteristics of low temperature and high speed deposition.
Titanium carbonitride (TiCN) thin film presents good corrosion resistance and wear resistance, thermodynamic stability, high hardness and good chemical inertness [6,7,8]. However, the residual stress exists in the film, which may reduce the adhesion between film and substrate [9]. In this paper, the nano-composite TiCN/TiN/Ti films were fabricated by DC/RF magnetron sputtering, and the residual stress of nano-composite TiCN/TiN/Ti film was effectively reduced by vacuum annealing. The microstructure, elements distribution, corrosion behavior and wear resistance of annealed TiCN/TiN/Ti film were systematic investigated with respect to the application of Mg alloys, such as biological degradation of magnesium alloy.

2. Experimental Section

2.1. Sample Deposition

The AZ31 substrates (Zn: 0.75 wt %; Al: 3.09 wt %; Mn: 0.28 wt %; Mg: balance wt %) with dimensions of 20 mm × 20 mm × 3 mm were ground with SiC emery paper up to #2000, polished with Al2O3 paste and cleaned by rinsing in ultrasonic bath of acetone, alcohol and DI water before deposition [10,11,12]. TiCN/TiN/Ti composite films were prepared by application of the unbalanced magnetron sputtering of DC and RF to sputter a titanium target (purity ≥ 99.99 wt %), and the base pressure of the chamber was 2 × 10⁻³ Pa. A thin Ti buffer layer was produced firstly to avoid a failure caused by the physical difference between the ceramic film and the substrate, using the parameters: bias voltage of −45 V, total pressure of 0.5 Pa, and DC target current of 0.4 A. Afterwards, a TiN film was deposited in a gaseous mixture of Ar (99.99%) and N2 (99.99%), and a TiCN coating was deposited by reactive magnetron sputtering in an Ar, N2 and C2H2 (99.99%) mixed atmosphere. The bias voltage, total pressure and target current or power were kept constant at −45 V, 0.5 Pa, 0.4 A (DC) and 160 W (RF, 13.56 MHz), respectively. The gas flow ratio of Ar/N2 for preparation of the middle TiN layer was 20/5, and the gas flow ratio of Ar/N2/C2H2 for preparation of the outer TiCN layer was 20/5/3. After deposition, vacuum annealing was carried out on the composite films at 250 °C, 300 °C and 350 °C for 60 min, respectively.

2.2. Microstructure and Residual Stress

The microstructure of as-deposited film and annealed films were characterized by transmission electron microscopy (TEM, Tecani-F20, FEI, Hillsboro, OR, USA) operating at 200 kV accelerating voltage and glancing angle X-ray diffraction (GAXRD) thanks to a D8 diffractometer (Bruker, Karlsruhe, Germany) operating at 40 kV and 40 mA with Cu Kα radiation (λ = 1.5406 Å) [13,14,15]. Details of the residual stress calculation can be found in our previous paper [16]. The surface and cross-section were observed by field emission scanning electron microscopy (FESEM, JSM-6700F, JEOL, Tokyo, Japan).

2.3. Composition, Thickness and Property

The chemical composition and element distribution of the coatings were determined by X-ray Fluorescence (XRF, Shimadzu-1800, Shimadzu, Kyoto, Japan) [16,17] as follows: tube power of 40 KV and 95 mA, aperture of 10 mm for element content, and 0.5 mm for element distribution. Thickness of film is also investigated by XRF with the same condition as composition. The potentiodynamic polarization curve and electrochemical impedance spectroscopy (EIS) were performed in a 3.5 wt % NaCl solution to evaluate the corrosion property employed by electrochemical workstation (Princeton VersaSTAT3, Ametek, Berwyn, IL, USA). The potential was referred to a saturated calomel electrode (SCE); the counter electrode was a platinum sheet and working electrode was samples. Prior to measurement, the specimens were exposed to the corrosion solution at open circuit potential for 20 min to ensure the stabilization potential [12,18,19], then the polarization scan was executed at a rate of 1 mV/S at room temperature, EIS measurements were conducted from 10 KHz down to 0.1 Hz using 10 mV amplitude sinusoidal perturbations. All the electrochemical tests were repeated twice to obtain reproducibility of results. The corrosion morphology was observed by SEM (JSM-6360LV, JEOL, Tokyo, Japan), equipped with energy dispersive spectroscopy (EDS-Falcon, EDAX Inc., Mahwah, NJ, USA). A pin-on-disk tribometer was used to serve dry rotating friction at room temperature under a load of 0.1 Kg. A 3-mm diameter GCr15 (HRC 61) ball was selected as the counter body to create a wear track on the coatings surface. The rotational speed of the electrical machine was 300 rpm.

3. Results and Discussion
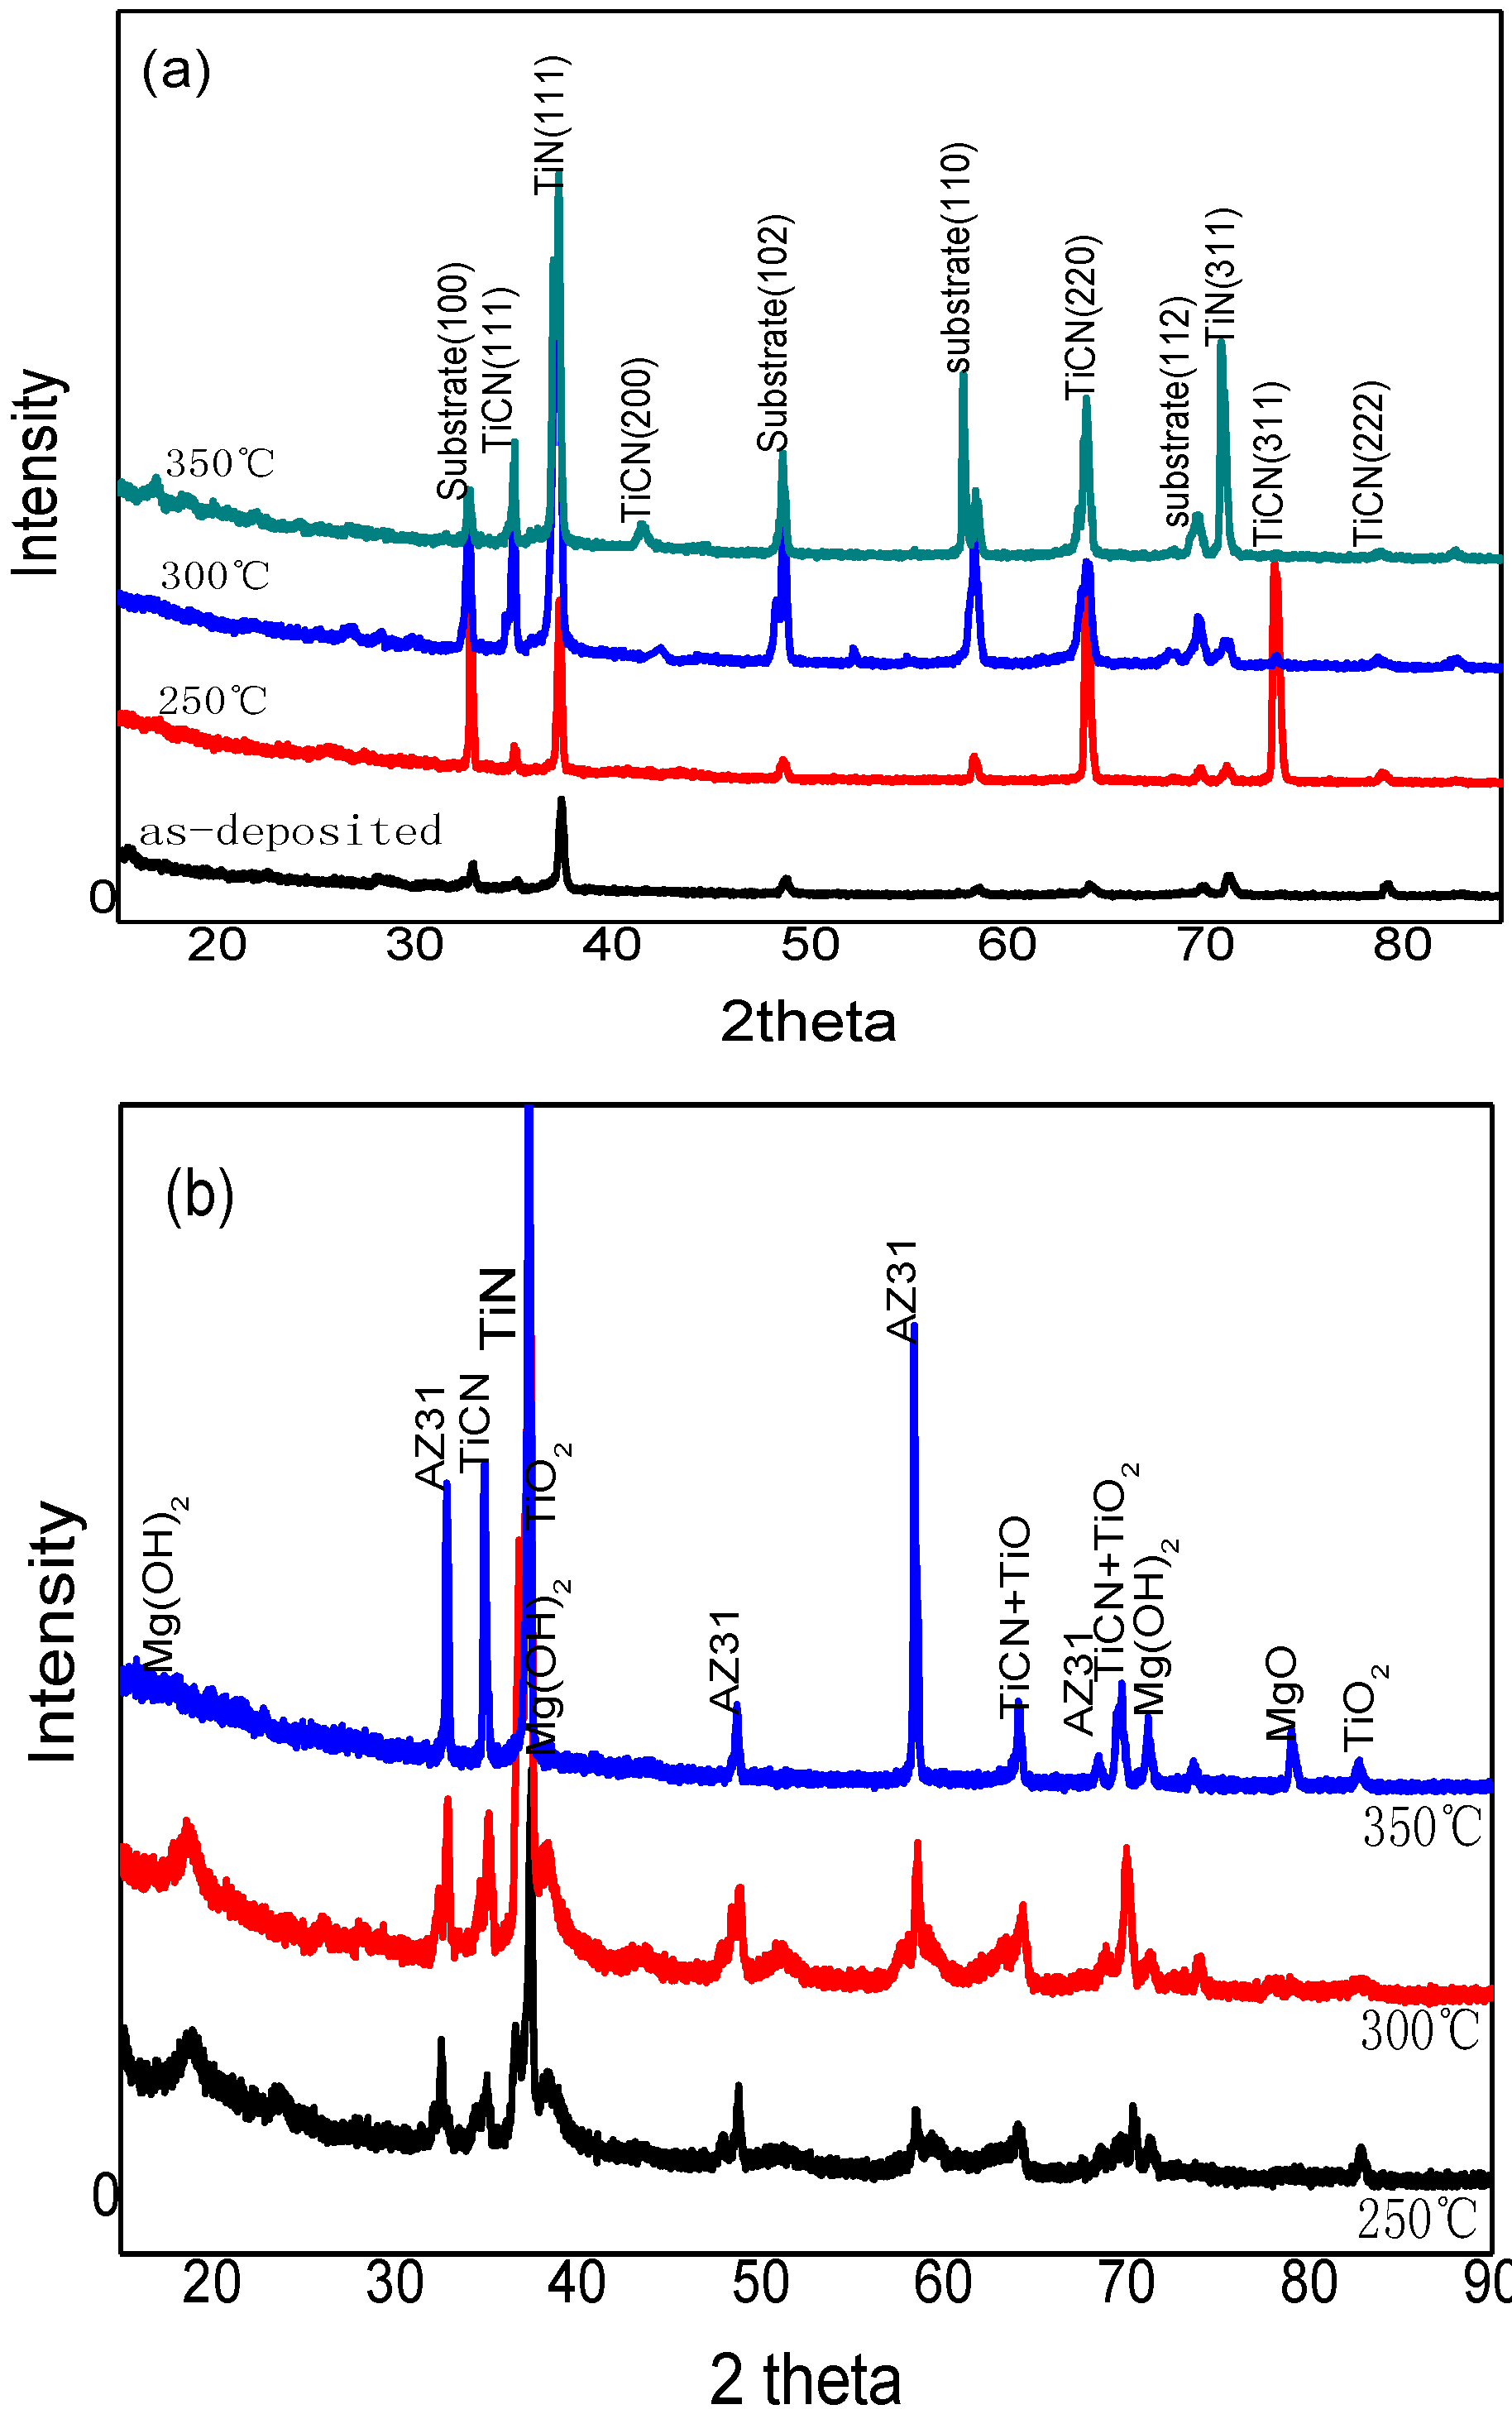
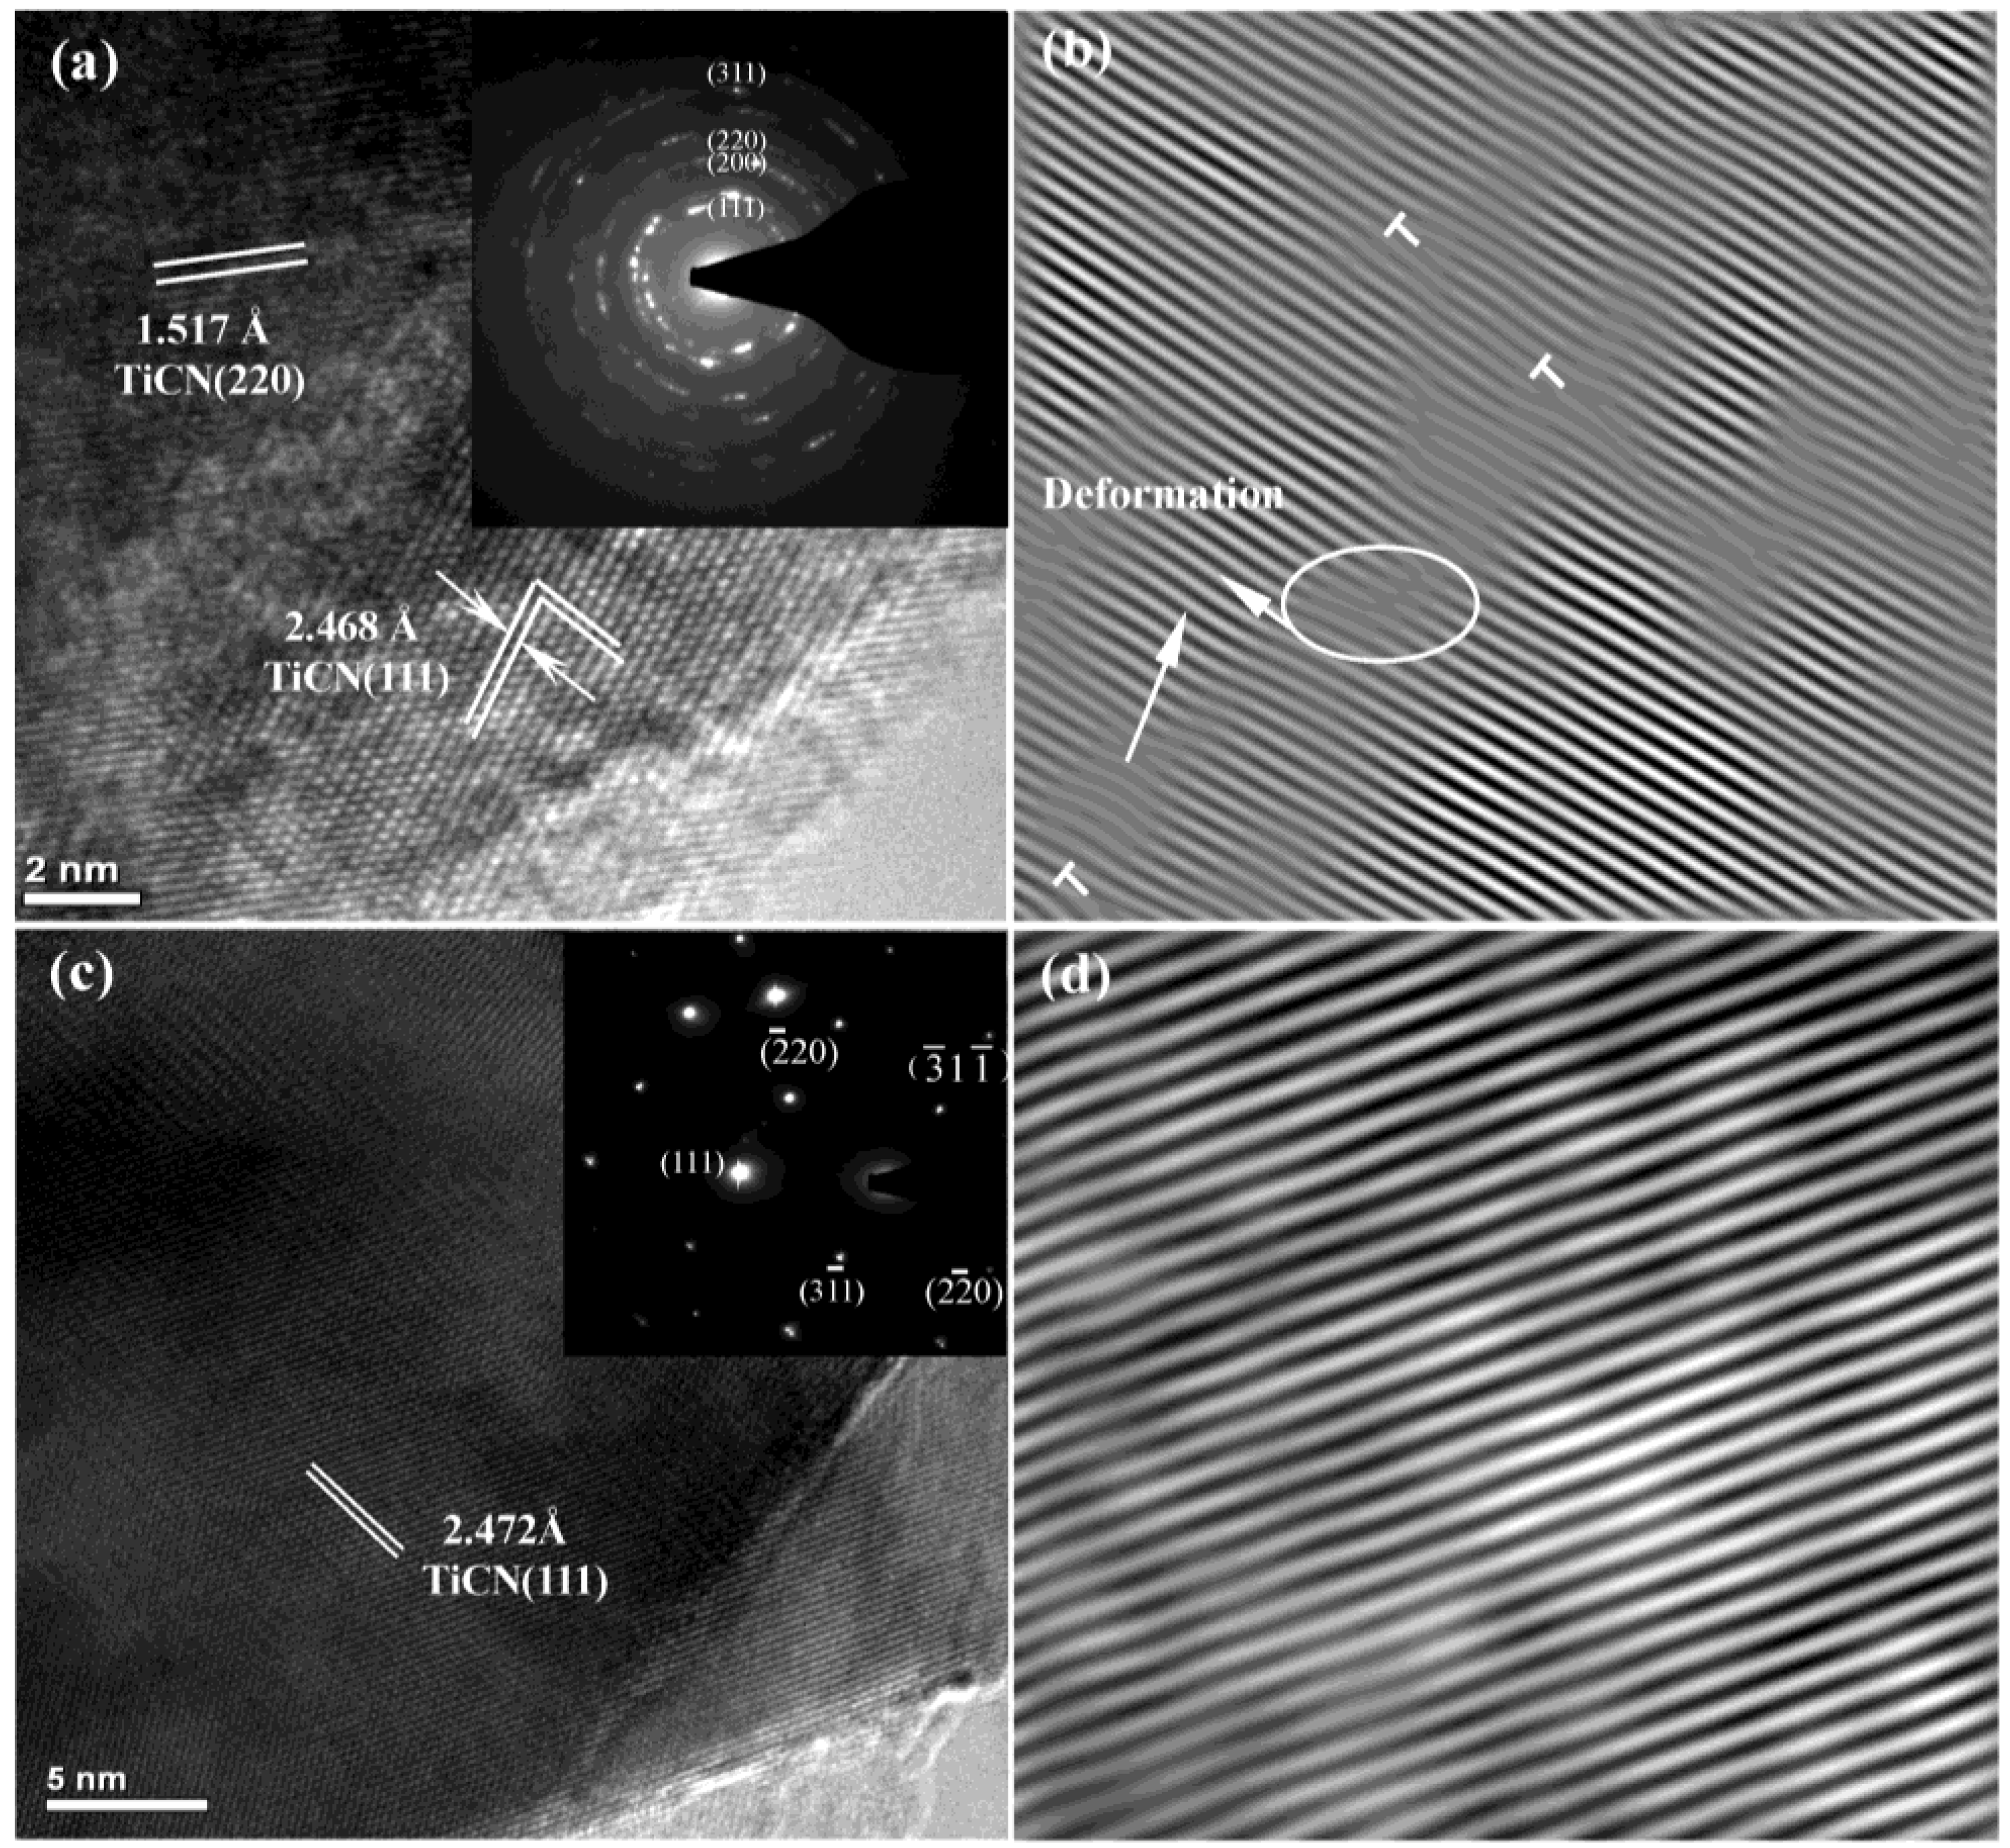
3.1. Microstructure

Figure 1 shows the XRD patterns of annealed films and electrochemical test films. As shown in Figure 2a, both as-deposited film and annealed films show a similar set of peaks consisting of TiN and TiCN two phase, but the annealed films exhibit sharper reflections with a lower Full Width at half maximum (FWHM), and the peak width decreases with an increase of annealing temperature. Moreover, the annealed films show two strong peaks associate to (111) and (220) planes. The reason for this crystalline behavior is related to a larger number of oriented crystallites in (111) and (220) directions; therefore, the oriented crystallites generate more constructive reflections for these crystallographic planes, which produce a strong increase in intensity signal. The peaks of substrate can also be observed due to the fact that the maximum thickness of the film is only detected by XRF as 1.83 μm (shown in Table 1). Another physical effect exhibited in the XRD patterns after vacuum annealing is a slight shift of the peak positions to higher angles. This is probably due to the decrease in the compressive residual stress. It can be seen in Figure 1b, after electrochemical test, the corrosion products are Mg(OH)2 and TiO2.
Figure 2a reveals the high resolution transmission electron microscopy (HRTEM) micrograph of as-deposited film, where the inset is a corresponding selected area electron diffraction pattern (SAEDP). The plan view HRTEM exhibits a dense microstructure with no porosity, and the SAEDP displays the multi-ring pattern of the polycrystalline phases with small crystalline grains, which is confirmed the cubic TiCN phase that is composed of diffracted plane indices at (111), (200), (220), and (311) indexes. The preferred orientation is (111) and the lattice fringes with a(111) is 2.468 Å. Figure 2b shows an inverse fast Fourier transform (IFFT) image of as-deposited film. It revealed that the lattice distorted severely and a small amount of dislocations were found that were marked by the ‘‘T’’ symbol in Figure 2b. The generation of dislocation and lattice distortion indicated the existence of residual stress in the film. Figure 2c reveals the HRTEM image of annealed film at 300 °C. The annealed film exhibits a regular arrangement of single crystal diffraction spots with bigger crystalline grains, and the cubic TiCN phase that is composed of diffracted plane indices at (111), (220), and (311) indexes is also confirmed. Figure 2d shows an IFFT image of annealed film, revealing that the lattice distorted slightly and all the dislocation disappeared after annealing.

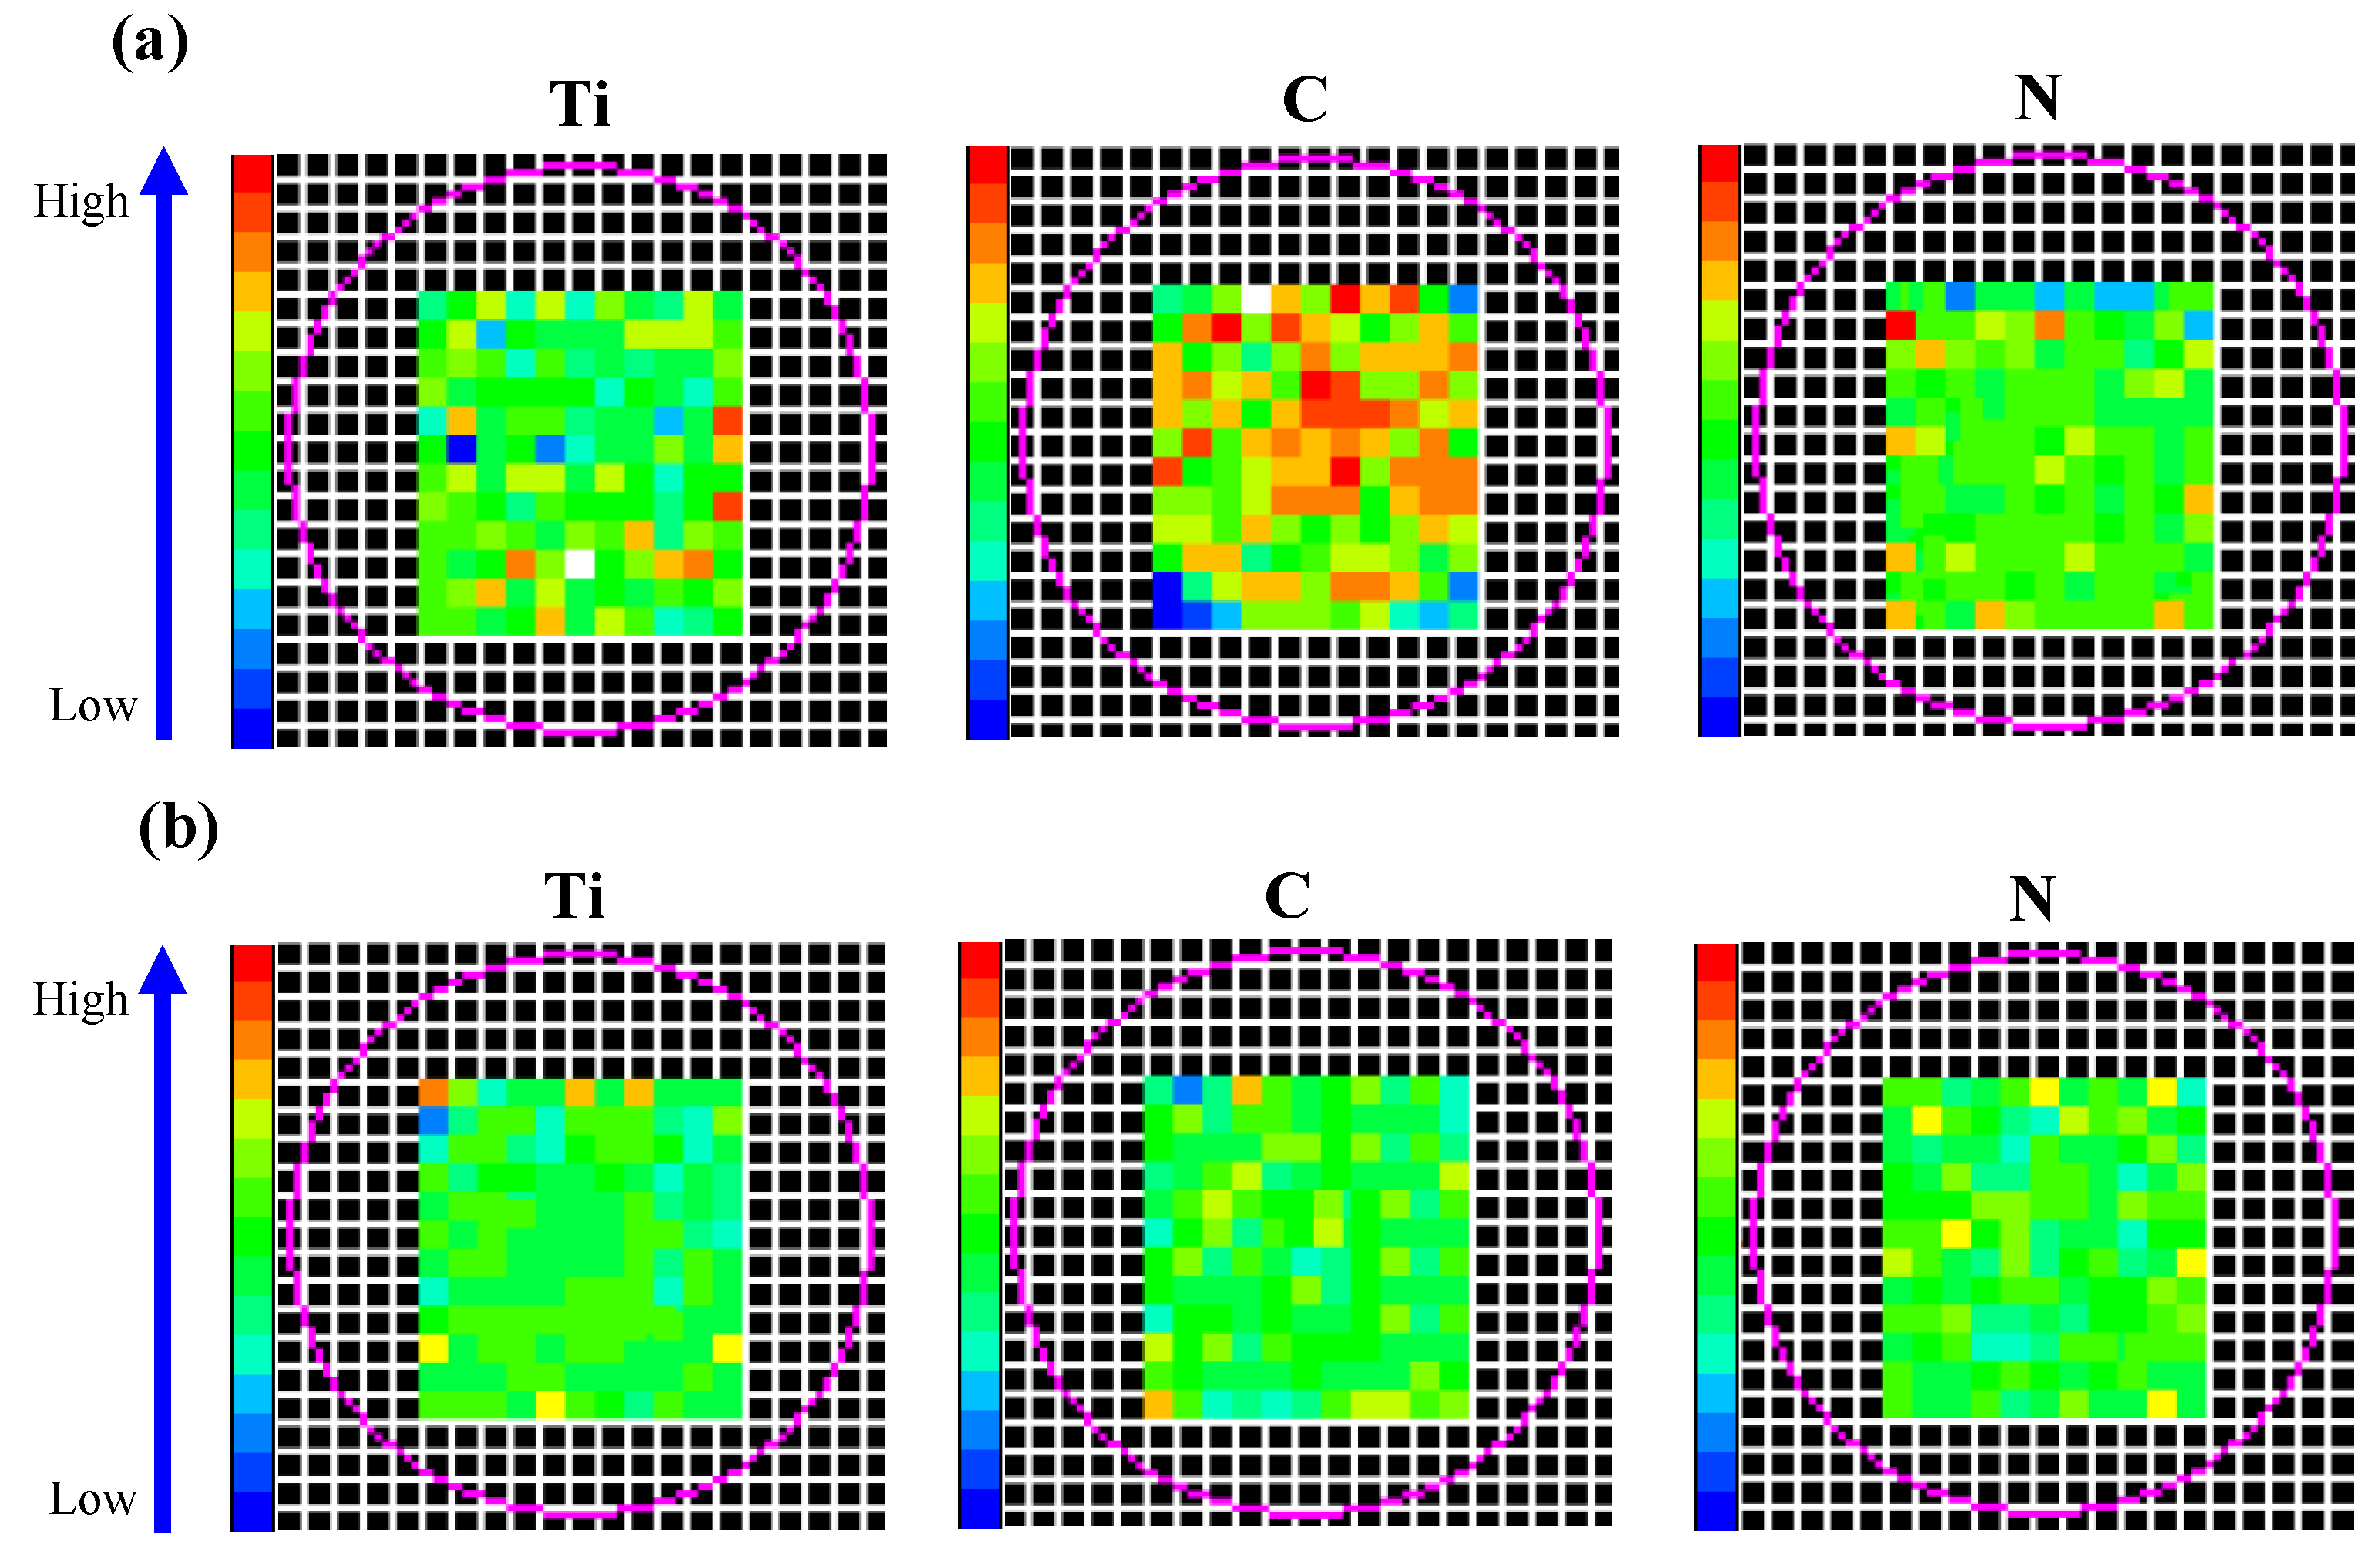
3.2. Composition and Thickness

Table 1 lists element content and thickness of as-deposited film and annealed films investigated by XRF. It can be observed that vacuum annealing has little influence on chemical composition content. With the increase of annealing temperature, the thickness of coating increases, which is the result of grain growth in a certain temperature.
Figure 3 shows element distribution of as-deposited film and annealed film at 300 °C. As seen from the figure, the elements distribute unevenly before annealing, but they become more uniform after annealing. The center of film is nearly unitary, only a partial region on the edge presents lower or higher values. It indicates that vacuum annealing has strong effect on element distribution because of the elements’ diffusion and grain growth under a certain temperature, which can prompt the uniformity of element distribution. However, element distribution does not linearly change with the increase of annealing temperature; the state of element distribution at 300 °C is significantly better than the other.

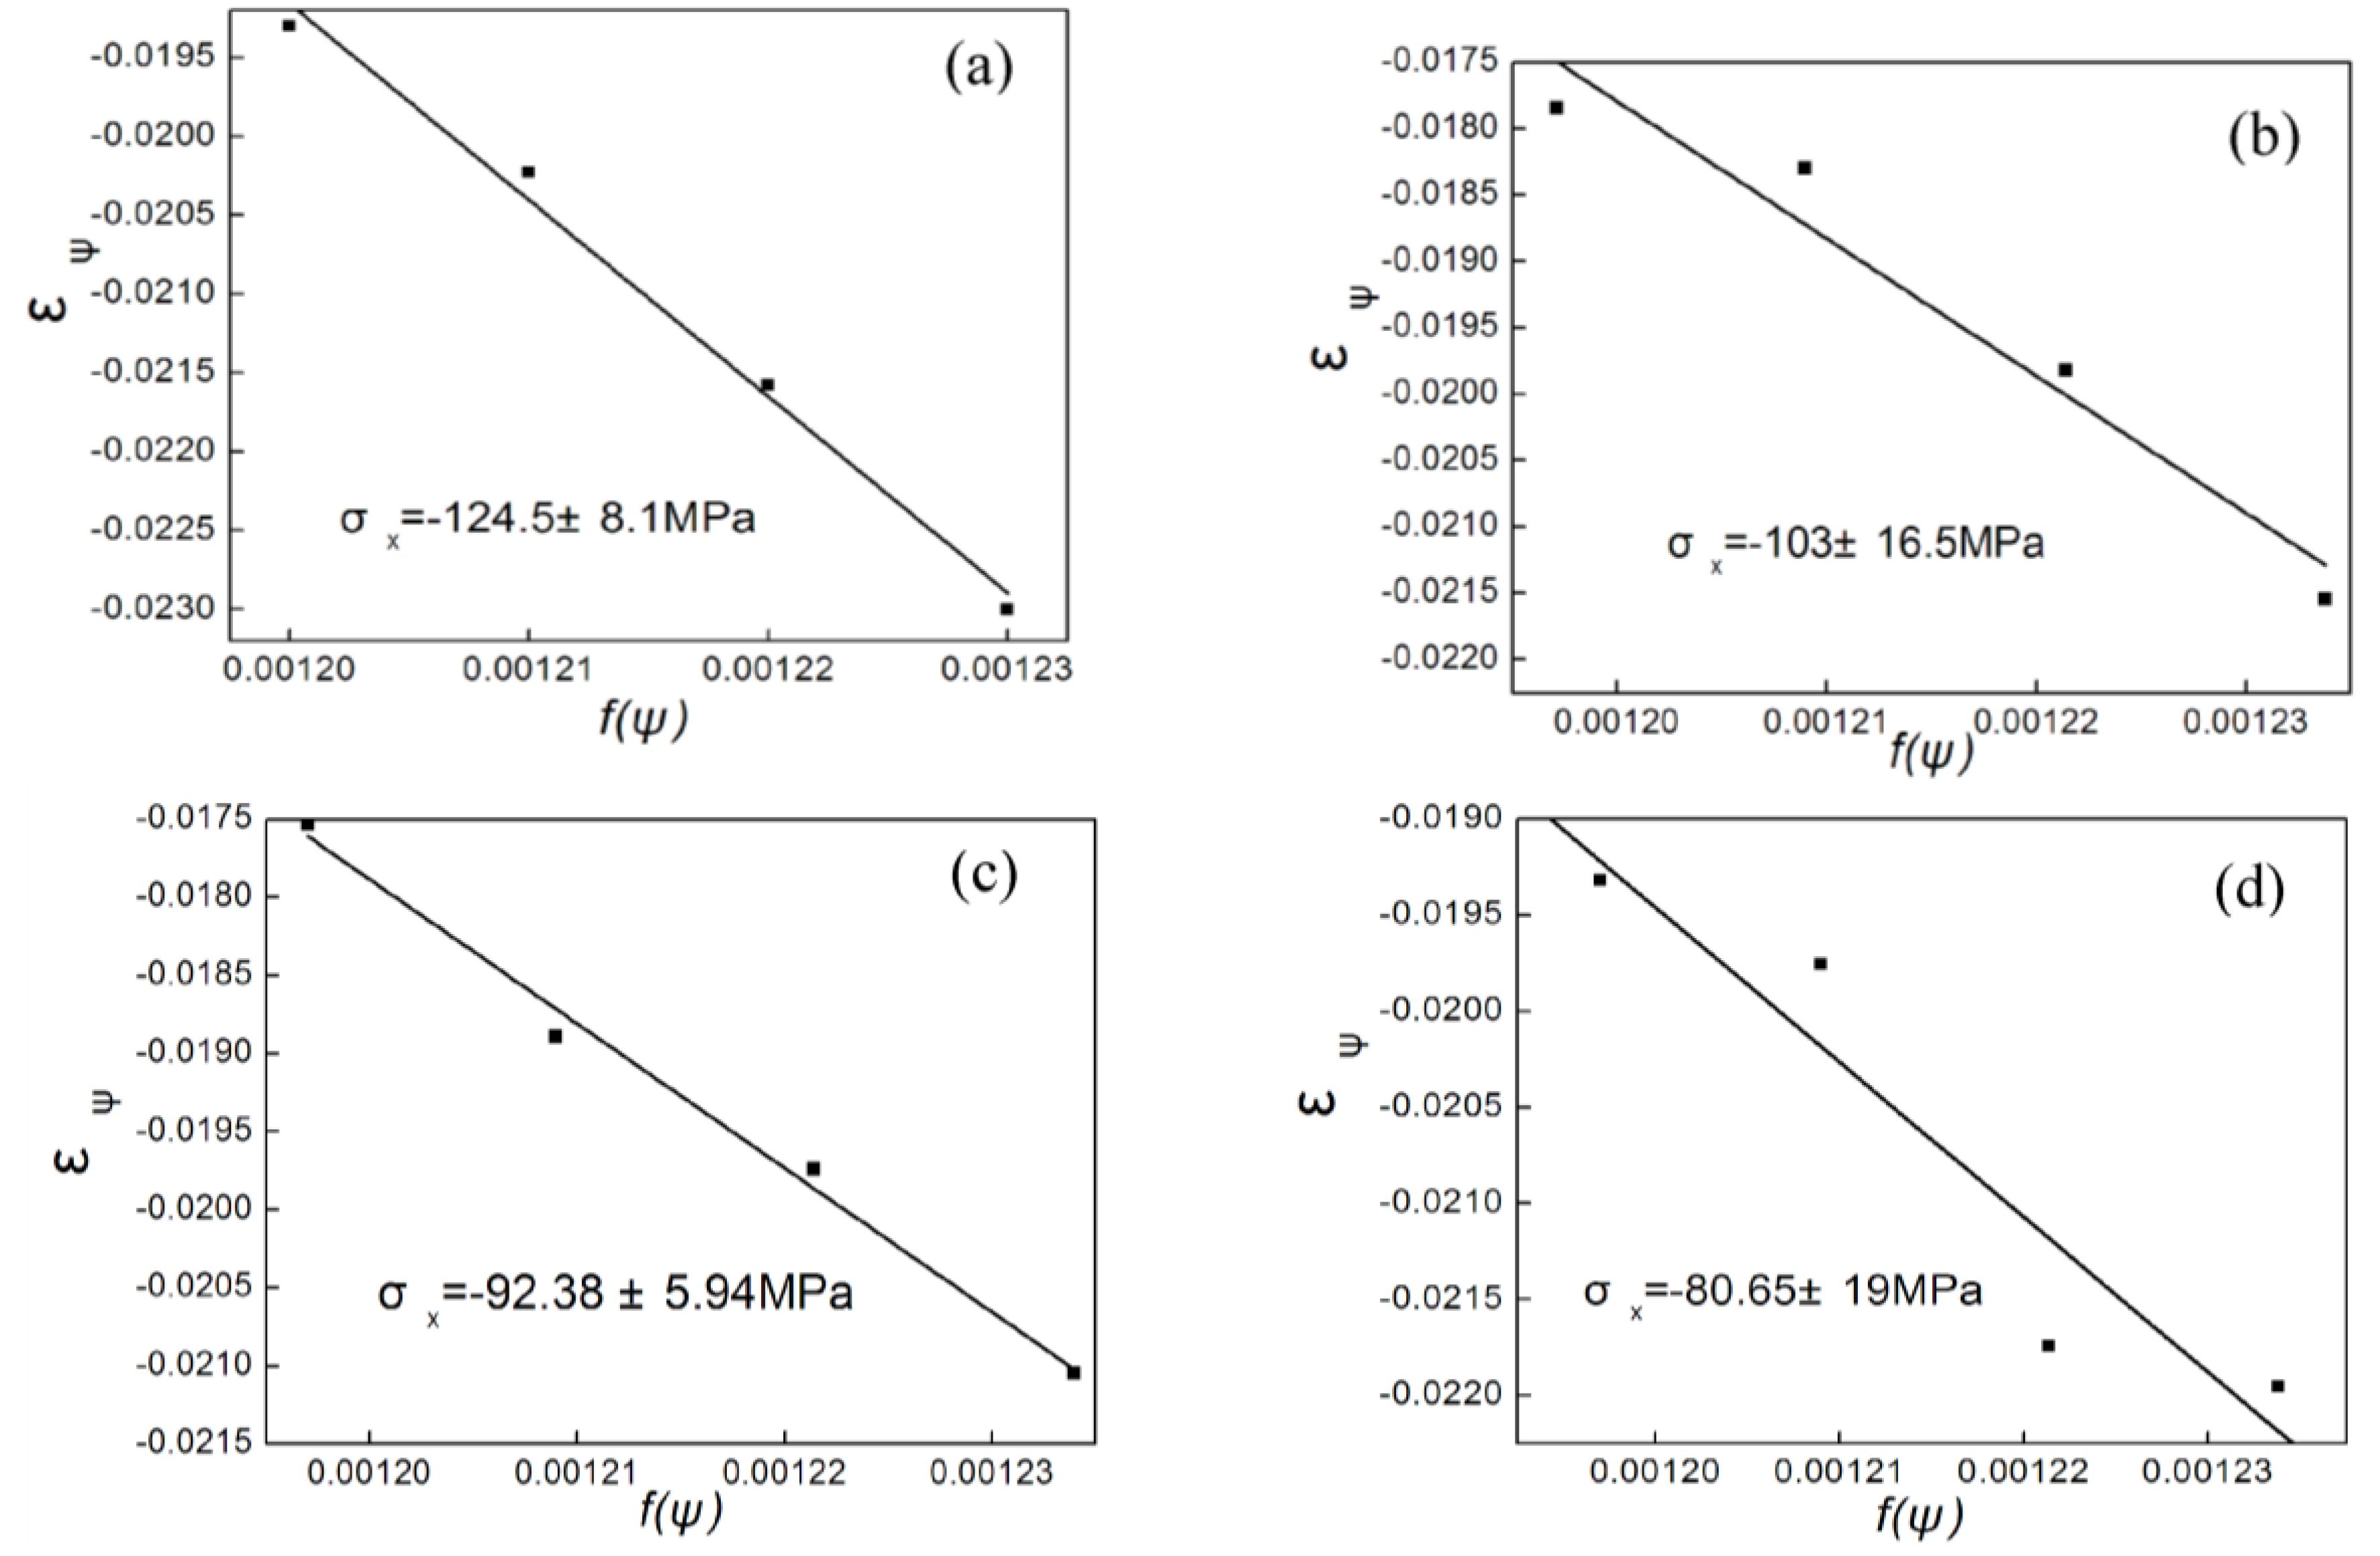
3.3. Residual Stress

Figure 4 shows the residual stress curves according to Glancing Angle X-ray diffraction (GAXRD) by different grazing incident angles. It demonstrates that the residual compressive stress can be effectively reduced by vacuum annealing. The decreasing residual stress during annealing, measured by XRD peak shifts, bears a close resemblance to the decreasing peak widths discussed earlier, indicating that stress relaxation occurrs by defect annihilation processes. The magnitude of the residual stress level progressively decreases with increase of annealing temperature; the minimum value of residual stress is 80.65 ± 19 MPa when annealing at 350 °C. The residual stress in thin film is composed of the structural stress and the thermal stress; the structural stress is mainly caused by lattice mismatch and growth defects. In the process of annealing, the defects in film can be reduced, grains grow and crystal structure changes under a certain temperature, the thickness of coating increases, part of stress releases and balances, which all makes the residual stress decrease effectively.

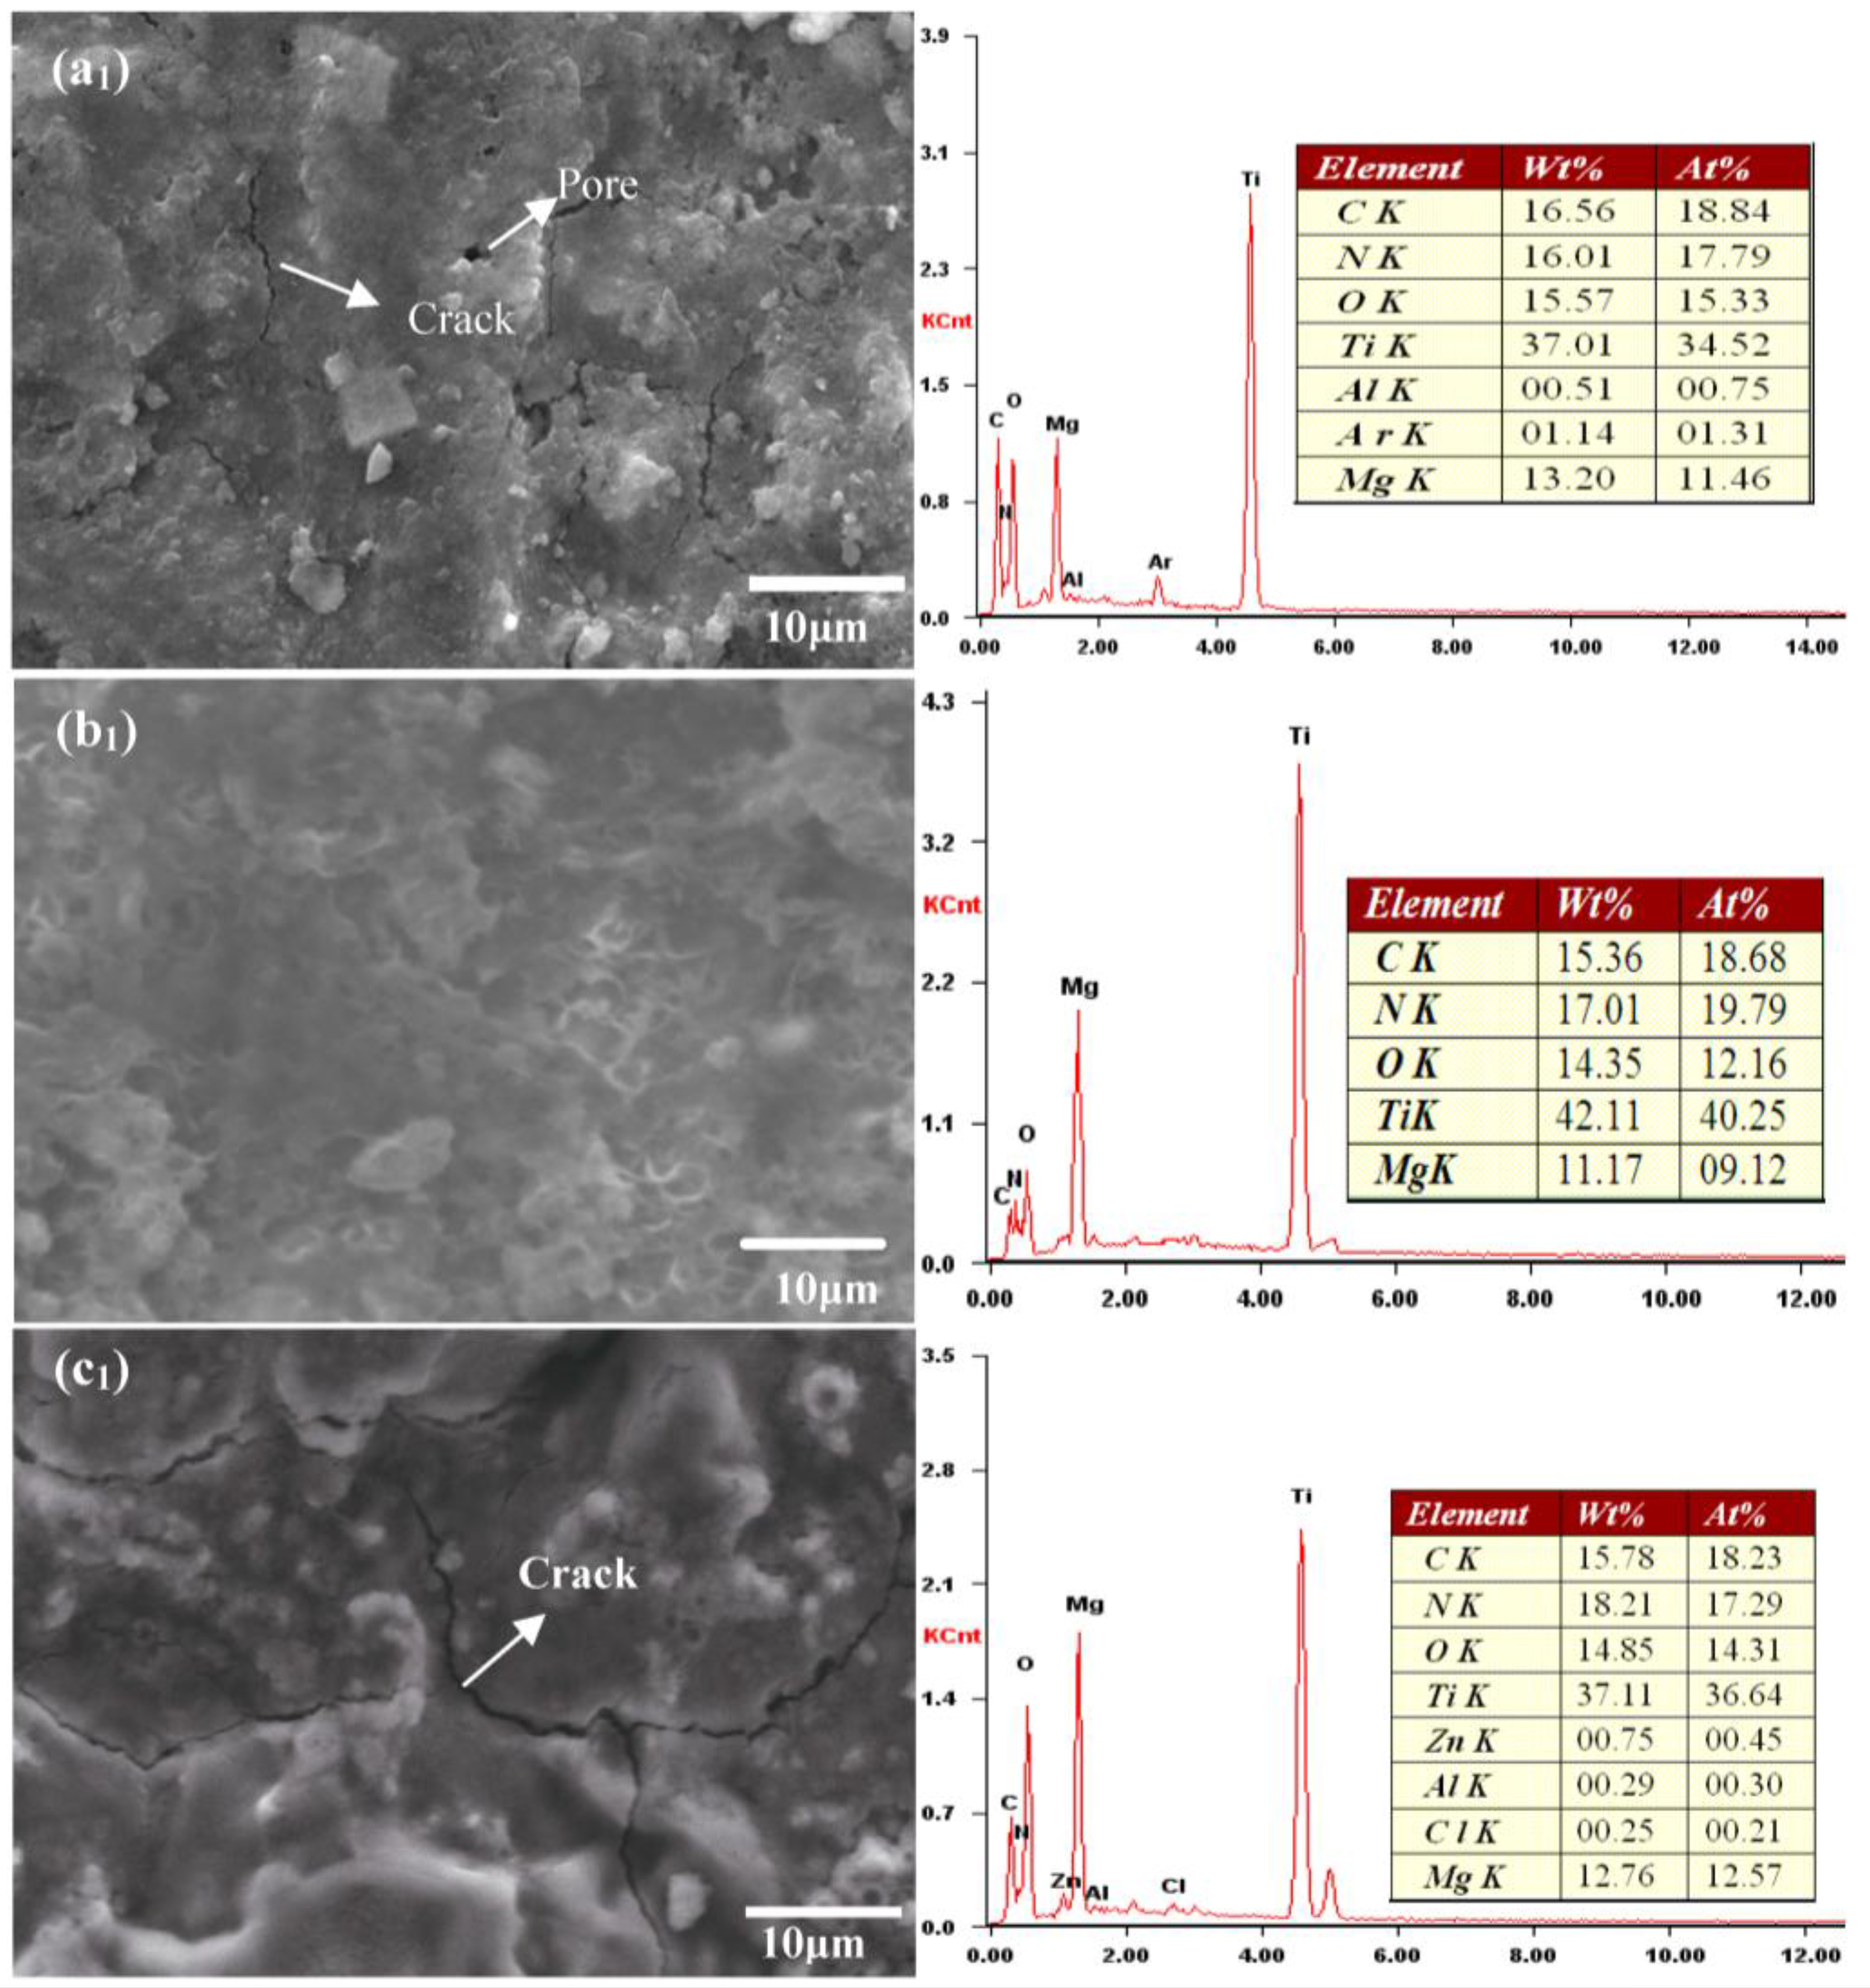
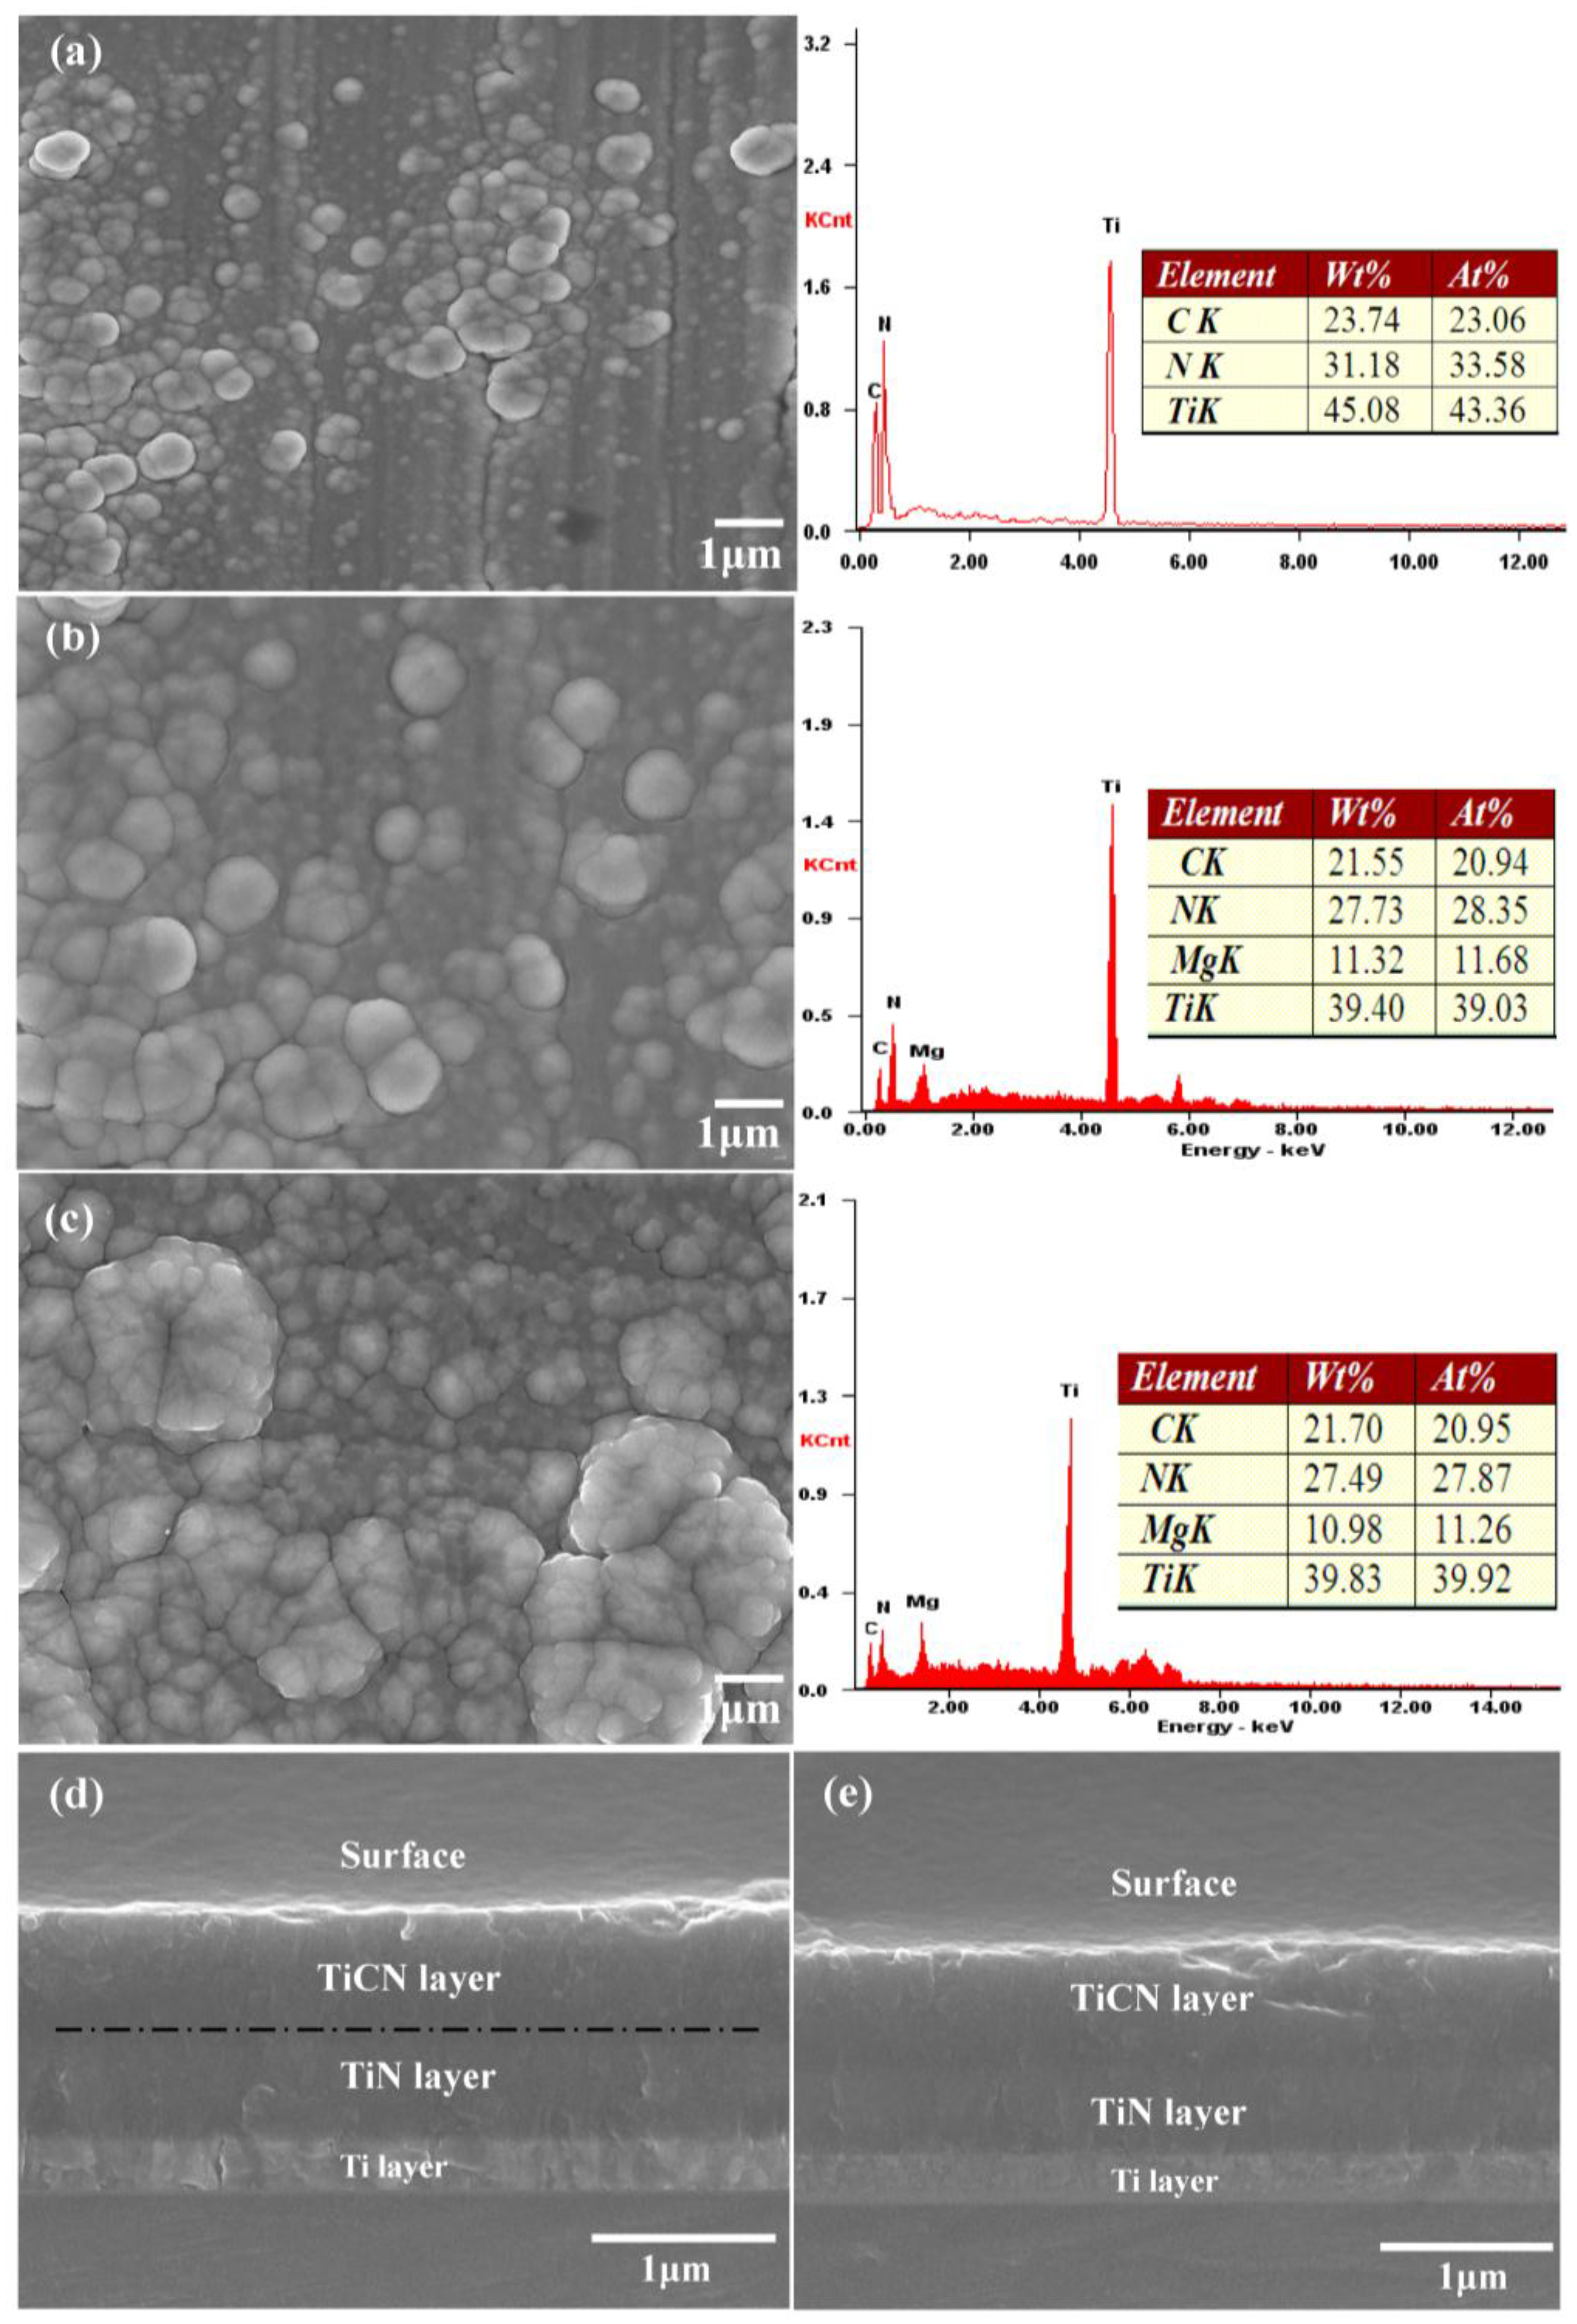
3.4. Morphology and EDS Analysis

Surface morphology and corrosion morphology with EDS analysis of annealed films and electrochemical films were examined, as shown in Figure 5. The surface of deposited film is dense and uniform. From the EDS result, the values of C, N and Ti are 23.74, 31.18 and 45.08 wt %, respectively, which are consistent with XRF testing result. Figure 5a–e indicates that after annealing, the grain has increased to some extent, the films are more compact and uniform, the defects between the inner layer interfaces are greatly reduced and the films present an obvious island growth pattern, the growth tendency in (111) preferential orientation is weakened, and the columnar crystal is effectively refined. With an increase of annealing temperature, the thickness, roughness and the average grain diameter of the film all increase.
After the electrochemical experiment, some cracks, pits and pores were found on the surface of as-deposited film and annealed films. The coating with annealing temperature of 300 °C has better protection without any corrosion crack due to its best density and uniformity. As also shown from Figure 5, the Mg content was observed by EDS in the annealed film, which was derived from substrate diffusion under a certain temperature. The value of Ti is the highest and O is the lowest in the annealed film at 300 °C compared to 250 °C and 350 °C, which suggests that the film annealed at 300 °C forms relatively small amount of corrosion products and has the best protection.

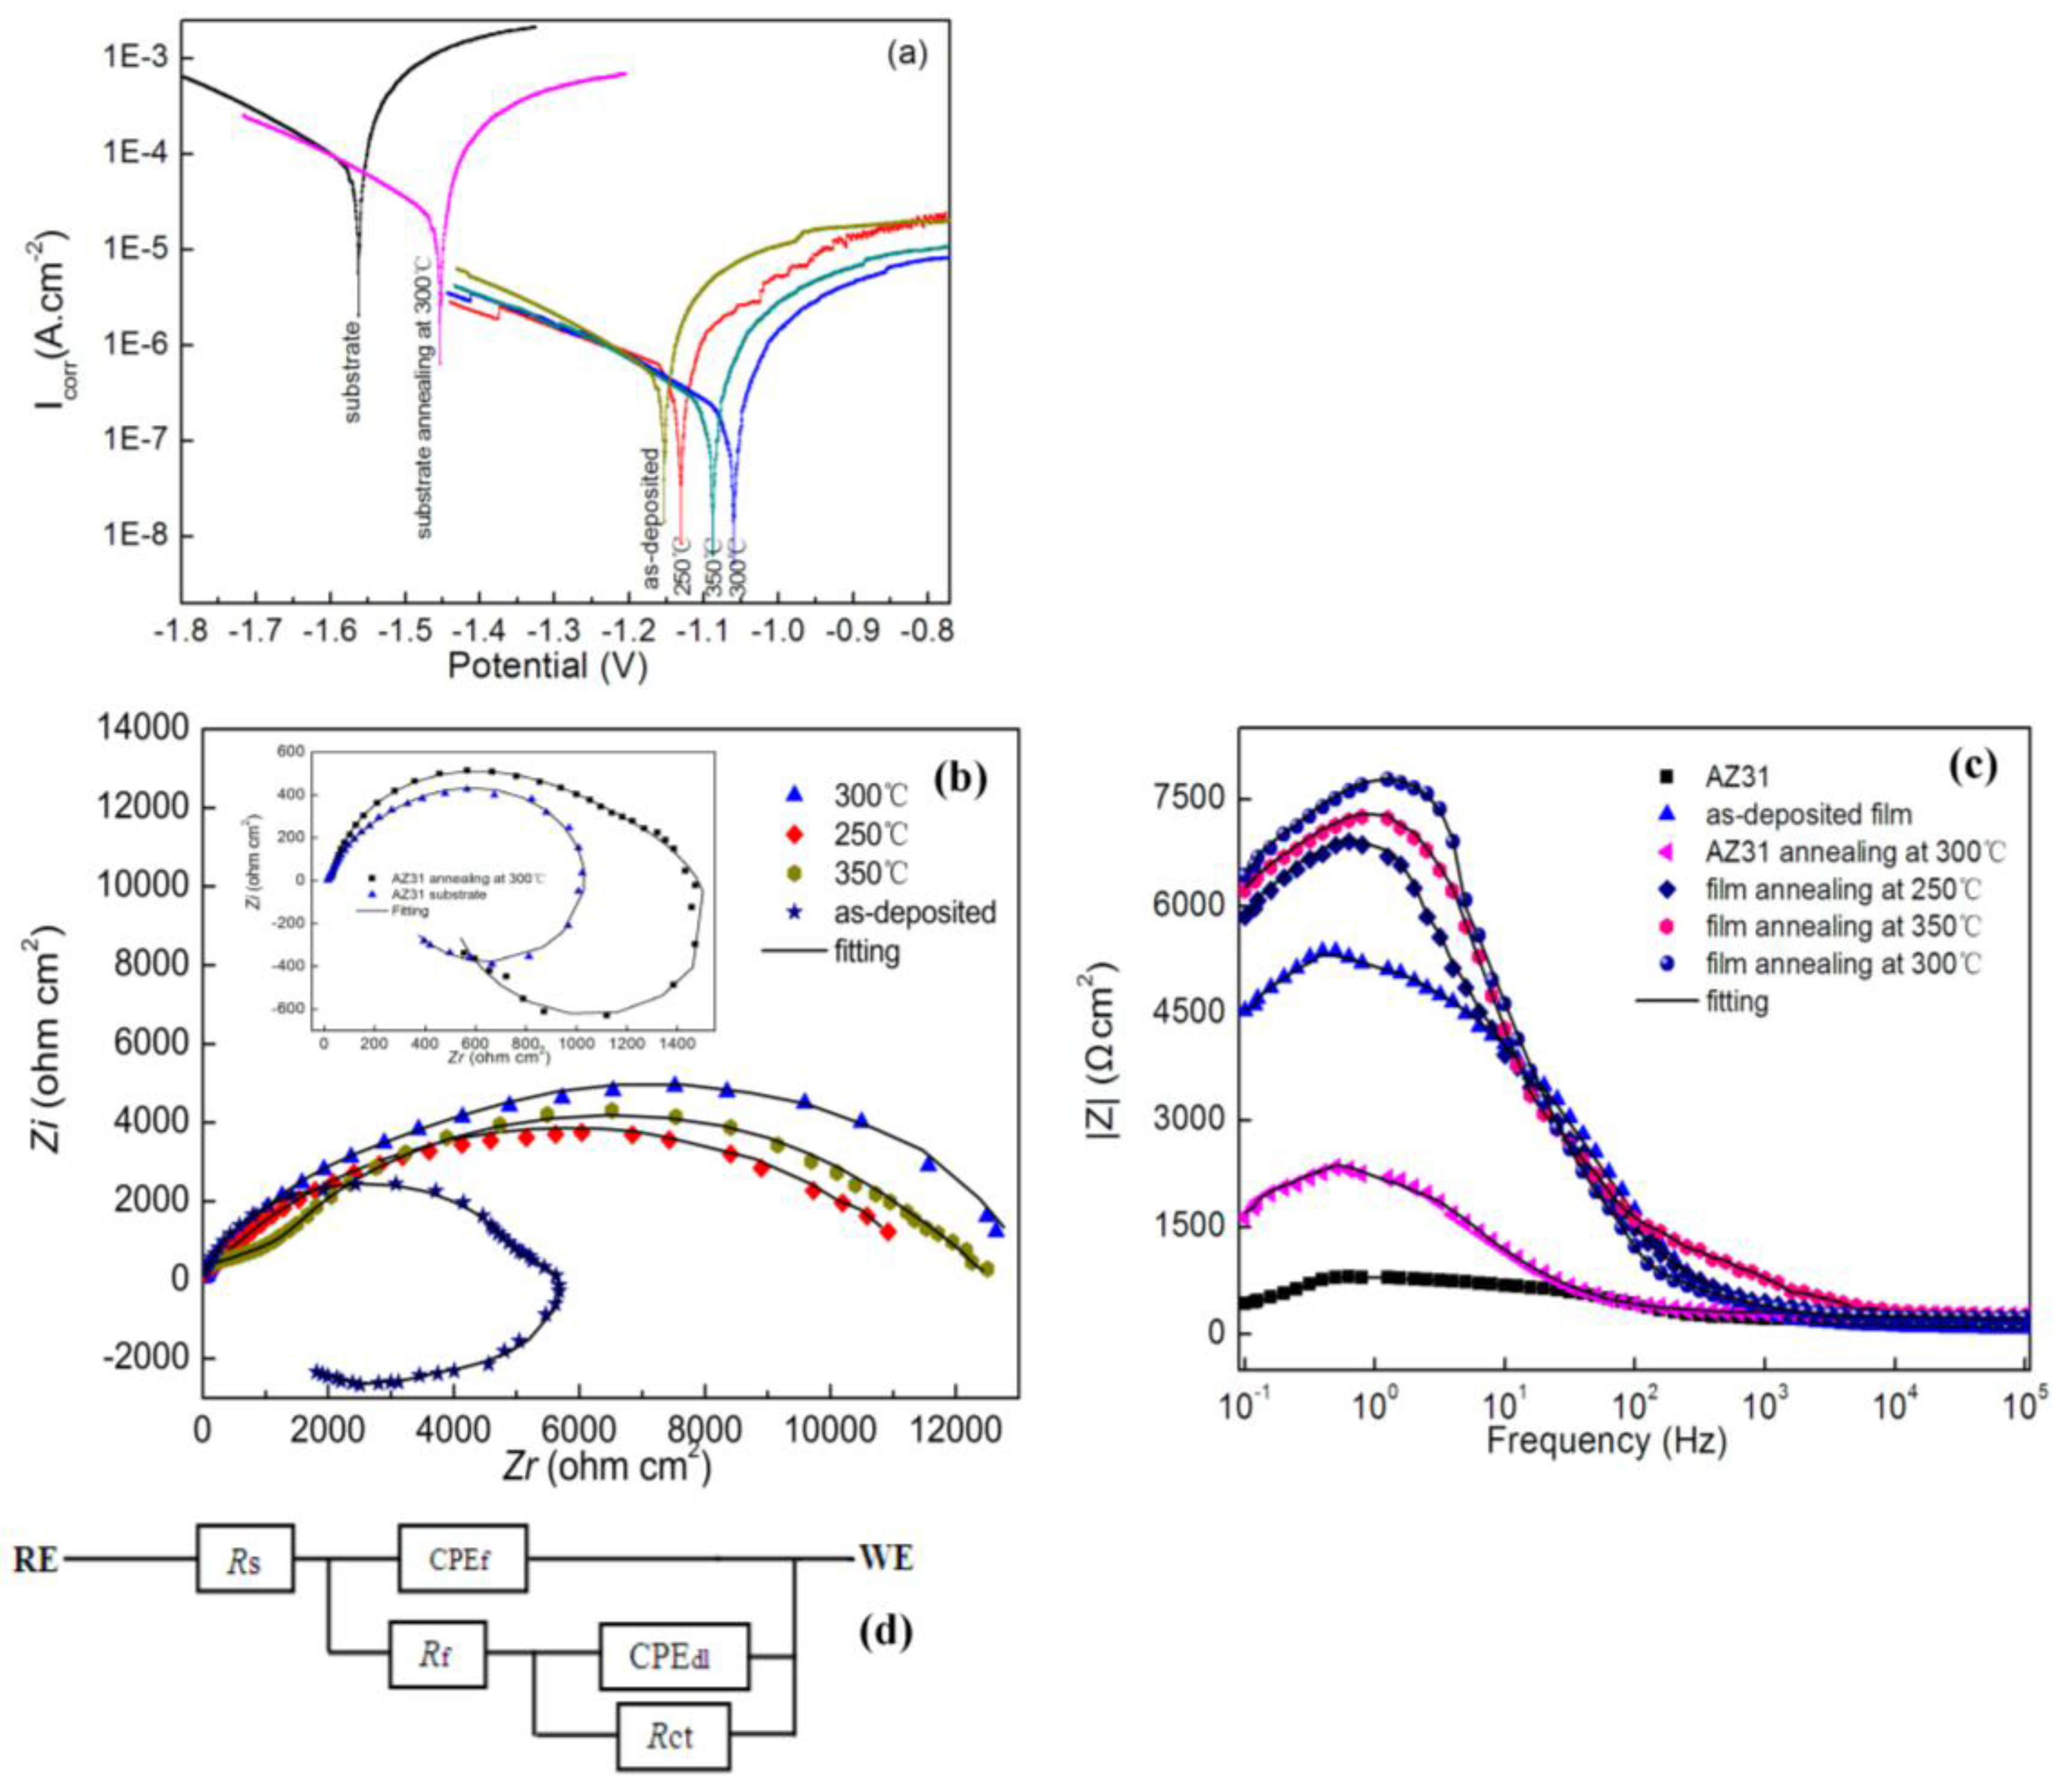
3.5. Corrosion Behavior

Figure 6a shows the polarization curves of samples. Corrosion current density can be directly derived from the cathodic polarization curves by Tafel extrapolation, the values of corrosion potential Ecorr and corrosion current density Icorr are shown in Table 2. In view of the fact that magnesium alloys are sensitive to annealing, the annealed AZ31 was also investigated. It is clear that both the annealed films and annealed AZ31 decrease the anodic current densities and increase the anode potential compared to that of the unannealed samples. The Ecorr of the annealed AZ31 is increased from −1.562 V to −1.448 V, and the Icorr is decreased from 8.15 × 10⁻⁴ A/cm2 to 1.03 × 10⁻⁴ A/cm2. The Ecorr of the coated sample is increased from −1.562 V to −1.151 V and increased from −1.151 V to −1.062 V after vacuum annealing at 300 °C. The Icorr of the coated sample is decreased from 8.15 × 10⁻⁴ A/cm2 to 7.65 × 10⁻⁷ A/cm2 and decreased from 7.65 × 10⁻⁷ A/cm2 to 4.69 × 10⁻⁷ A/cm2 after vacuum annealing at 300 °C. This indicates that the corrosion resistance of the coated samples and annealed samples are improved in the 3.5 wt % NaCl solution, and annealed coatings improved more than as-deposited coating.
Figure 6b shows a typical Nyquist plot, the Nyquist plot employed to evaluate the degradation process of samples. As shown in Figure 6b, the real impedance (Zr) and imaginary impedance (Zi) of annealed AZ31 is higher than the unannealed substrate, and annealed coatings are much higher than that of as-deposited coating and annealed AZ31. There is a common feature on the Nyquist plots of all annealed coatings, a single capacitive semicircle existing in the measured frequency range. The sizes of the semicircles of annealed coatings are bigger than the as-deposited film, and the semicircle size of annealed film at 300 °C is bigger than that of 250 °C and 350 °C. The larger radius of annealed coatings proves that the coatings after vacuum annealing possess a higher corrosion resistance, and the coating annealed at 300 °C possesses the highest corrosion resistance property due to the largest radius of the curvature.
Figure 6c shows the corresponding Bode plots of all samples. The model values of impedance (|Z|) are often used to evaluate the stability of passive film. The impedance evolution in low frequency range presents the response of the double layer at the interface of AZ31 substrate and the corrosion media. The presentation of a decrease of impedance values in high frequency range because of induction was the result of the onset of the corrosion process. The higher the value of Z modulus, the more stable the passive film is. It can be seen that the values of impedance of the annealed AZ31 and annealed coatings are bigger than unannealed AZ31 and as-deposited film, and the film annealed at 300 °C shows the biggest impedance at the low frequency among all samples. The bare AZ31 is the smallest and represents the coating annealed at 300 °C possesses a best corrosion resistance among all samples.
Figure 6d gives the equivalent circuits, which are typical of a metallic material with a defective coating layer, and Table 3 shows the fitting data of EIS plot. In the equivalent circuit, Rs represents the aqueous impedance, originating from the ohmic contribution of the electrolyte solution between working and reference electrodes; Rct represents the charge transfer resistance and CPEdl represents the charging electric double layer capacitance; Rf represents film blocking effect, CPEf represents the capacitance of TiCN film. As seen from Table 3, the CPEf is the minimum and Rct, Rf values are the largest when the film annealed at 300 °C, which indicates that the film annealed at 300 °C has the best anti-corrosion performance.
The improvement of corrosion resistance after annealing can be described as follows: before annealing, when TiCN films subjected to NaCl solution, chloride ions penetrate the film through some small defects and columnar crystal structure, the exposed area will experience anodic dissolution, the corrosive compounds are formed, which will usually extend laterally along the interface between the film and the substrate [1,20]. After annealing, the films become denser owing to the atoms rearrangement and the reduction of defects and interspaces. The annealing coatings with tiny defects and fine columnar crystal structure can effectively prevent the diffusion/penetration of the chloride ions to the films and AZ31, which enhances the corrosion resistance of as-deposited film and substrate.

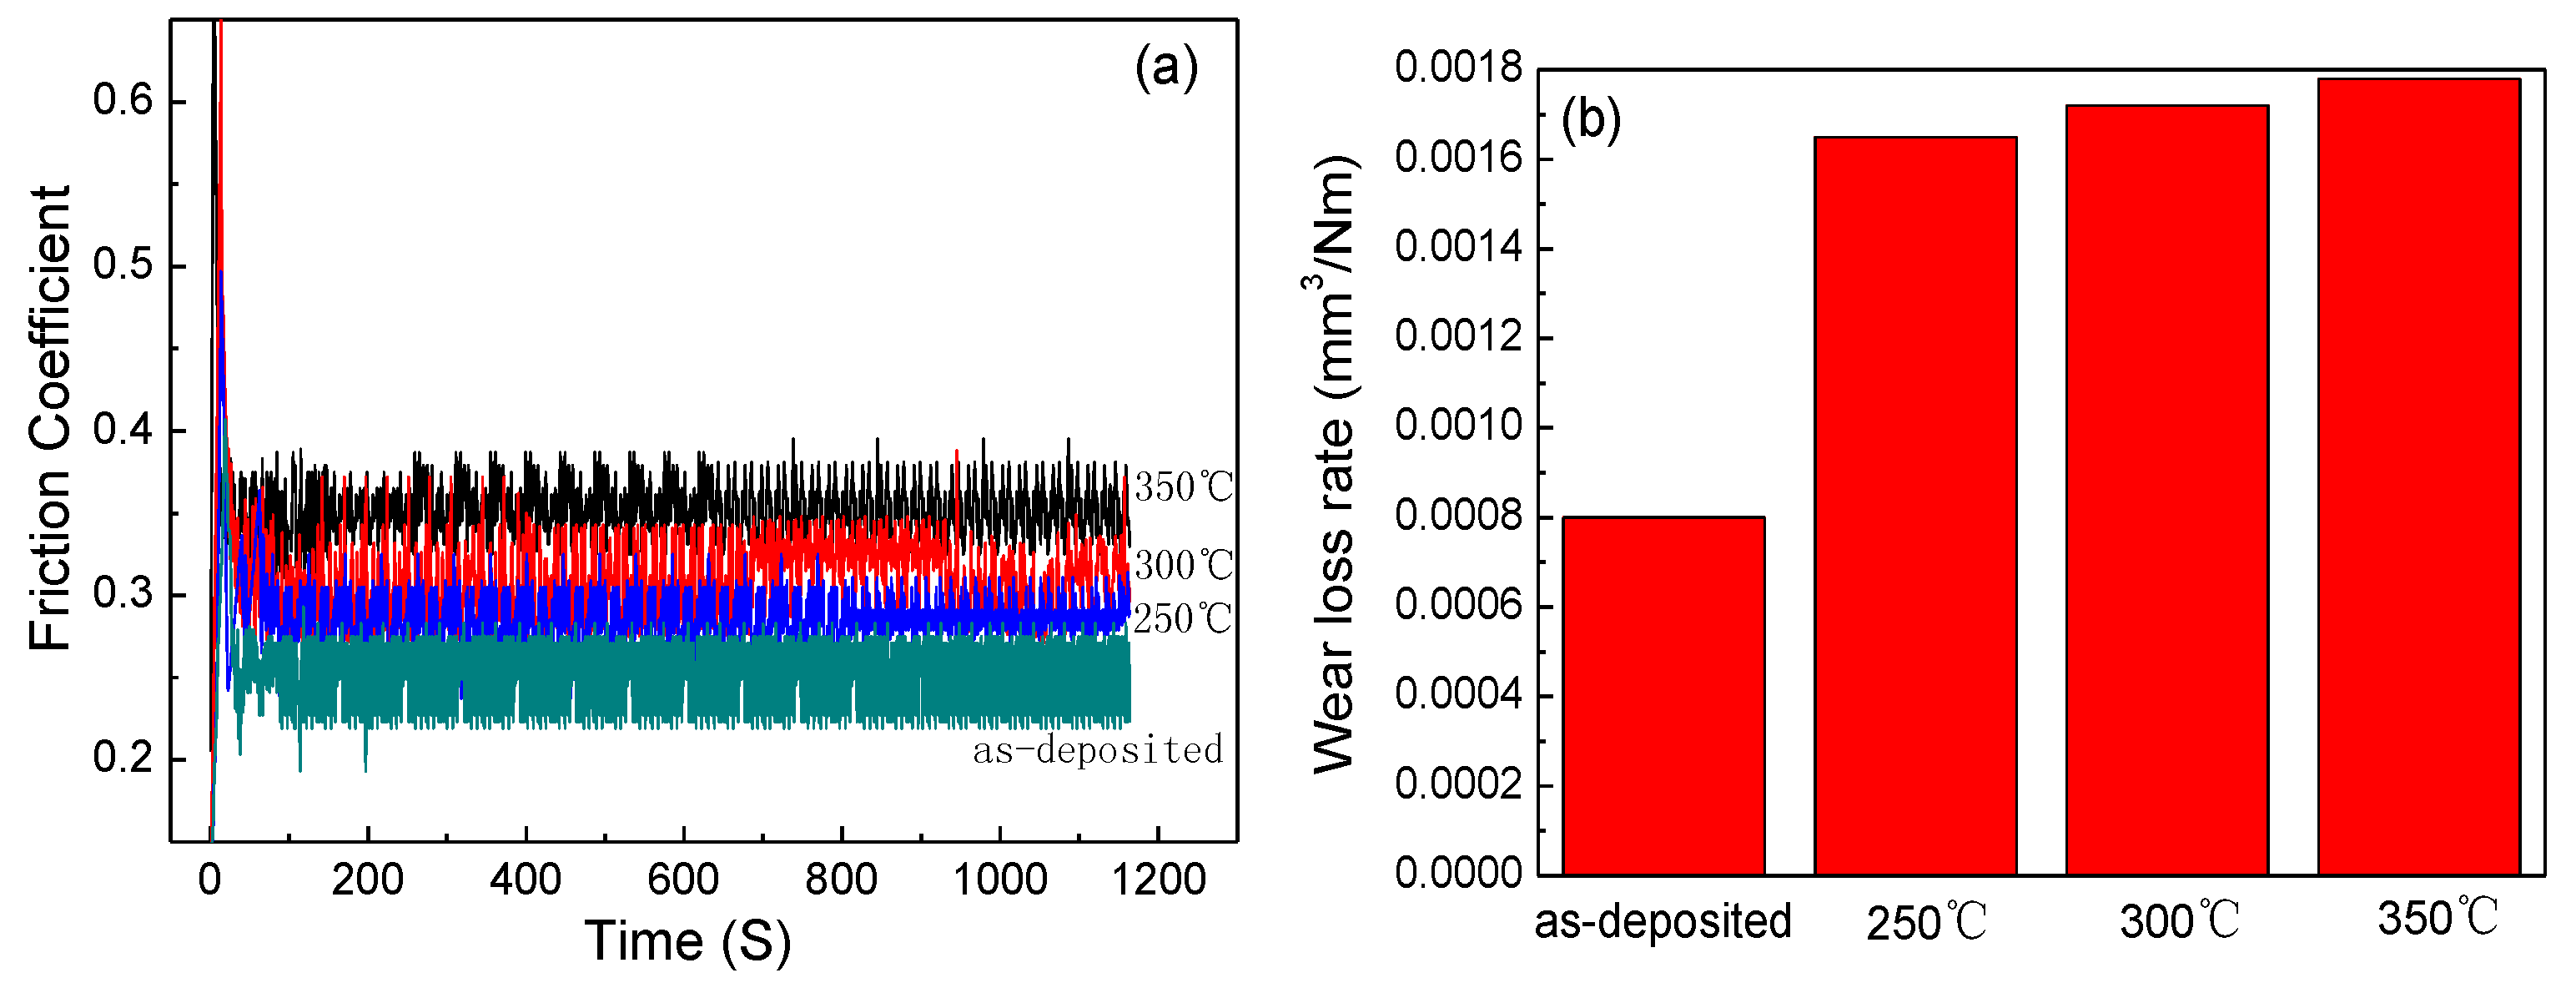
3.6. Tribological Behavior

Figure 7a reveals the friction coefficient–time relation for the as-deposited film and annealed films. As seen from Figure 7a, during the testing, the friction coefficients of all specimens are stable and possess similar features: the friction coefficients first increase to the maximum value, and then reach the relative steady wear stage after about 50 s. It is found that the friction coefficient of the annealed film increases from 0.26 (as-deposited) to 0.35 (350 °C) due to the increase of surface roughness when more surface diffusion effects are occurring during the film nucleation and growth under a certain temperature, as can be seen in Figure 5.
Figure 7b shows wear loss (rate) for the as-deposited film and annealed films. As demonstrated in the figure, the annealed films caused a decrease of the wear resistance compared to that of as-deposited film. The as-deposited film presents relatively slighter wear, compared with the annealed films’ apparent higher friction coefficients and wear loss rate. Moreover, it is observed that the wear resistance of 350 °C annealed film is weaker than the annealed films of 300 °C and 250 °C. The main reason that the 350 °C annealed film has weaker wear resistance, as mentioned previously, is that 350 °C annealed film possesses the biggest grain size and surface roughness.

4. Conclusions

In summary, the TiCN/TiN/Ti multilayer coatings were deposited on AZ31 via DC/RF reactive magnetron sputtering. After vacuum annealing, the composite films exhibit sharper reflections with a lower FWHM, the peak width decreases with an increase of annealing temperature, the SAEDP image changes from polycrystalline diffraction ring to single crystal diffraction spots, the content values of chemical composition change slightly, and the elements distribute more uniformly. Vacuum annealing makes the grain grow and structure refine, and the volume of defects and interspaces reduce, which leads to an effective reduction of residual stress of annealed films and a more compact structure of the coatings. The polarization curves and EIS suggested that the corrosion resistance of annealed film has been improved. However, the increase of friction coefficient and wear loss rate indicated that annealing decreases the wear resistance performance due to the grain growth and the increase of surface roughness under a certain temperature. Vacuum annealing is an effective technology for films to reduce residual stress and improve the corrosion resistance, and the best annealing temperature was found to be 300 °C for this TiCN/TiN/Ti coating in our work.

Acknowledgments

The authors wish to acknowledge the assistance of Engineering Experiment Center belongs to College of Materials science and engineering of Jiamusi University, China, for providing tests of XRD and XRF. The authors wish to acknowledge the financial support of the Key project of Jiamusi University (12Z1201521) of Heilongjiang province, China.

Author Contributions

Haitao Li and Shoufan Rong conceived and designed the experiments; Haitao Li performed the experiments; Pengfei Sun and Qiang Wang analyzed the data; Haitao Li wrote the paper.

Conflicts of interest

The authors declare no conflict of interest.

References

  1. Altun, H.; Sen, S. The effect of PVD coatings on the corrosion behaviour of AZ91 magnesium alloy. Mater. Des. 2006, 27, 1174. [Google Scholar] [CrossRef]
  2. Wu, G.S.; Wang, X.M.; Ding, K.J.; Zhou, Y.Y.; Zeng, X.Q. Corrosion behavior of Ti-Al-N/Ti-Al duplex coating on AZ31 magnesium alloy in NaCl aqueous solution. Mater. Charact. 2009, 60, 803–807. [Google Scholar] [CrossRef]
  3. Yao, X.H.; Tian, L.H.; Zhang, Y.; Ma, Y.; Tang, B. Adhesion and Wear Properties of Cr-N Coatings on Magnesium Alloy by Unbalanced Magnetron Sputtering. Rare Met. Mater. Eng. 2013, 42, 589. [Google Scholar]
  4. Zhang, Y.; Yan, C.; Wang, F.; Lou, H.; Cao, C. Study on the environmentally friendly anodizing of AZ91D magnesium alloy. Surf. Coat. Technol. 2002, 161, 36–43. [Google Scholar] [CrossRef]
  5. Niu, L.; Chang, S.; Tong, X.; Li, G.; Shi, Z. Analysis of characteristics of vanadate conversion coating on the surface of magnesium alloy. J. Alloy. Compd. 2014, 617, 214–218. [Google Scholar] [CrossRef]
  6. Shan, L.; Wang, Y.X.; Li, J.L.; Li, H.; Wu, X.D.; Chen, J.M. Tribological behaviours of PVD TiN and TiCN coatings in artificial seawater. Surf. Coat. Technol. 2013, 226, 40. [Google Scholar] [CrossRef]
  7. Yan, Y.; Zheng, Y.; Yu, H.; Pu, H. Research Development of the Preparation Technology of Titanium Carbonitride Coating. Mater. Rev. 2007, 21, 55. [Google Scholar]
  8. Wang, L.; Dong, S.; You, J.; Yu, L.; Li, X.; Xu, J. Microstructure and microhardness of TiCN and TiN/TiCN multilayer films. Trans. Mater. Heat Treat. 2010, 31, 113. [Google Scholar]
  9. Cheng, G.A.; Han, D.Y.; Liang, C.L.; Wu, X.L.; Zheng, R.T. Influence of residual stress on mechanical properties of TiAlN thin films. Surf. Coat. Technol. 2013, 228, S329. [Google Scholar] [CrossRef]
  10. Sanjeev, K.S.; Deuk, Y.K. Abnormal residual stress in nanostructured Al thin films grown on Ti/glass substrates. Curr. Appl. Phys. 2013, 13, 1875. [Google Scholar]
  11. Li, M.; Cheng, Y.; Zheng, Y.F.; Zhang, X.; Xi, T.F.; Wei, S.C. Surface characteristics and corrosion behaviour of WE43 magnesium alloy coated by SiC film. Appl. Surf. Sci. 2012, 258, 3075. [Google Scholar] [CrossRef]
  12. Zhang, F.; Zhang, C.; Song, L.; Zeng, R.; Li, S.; Cui, H. Fabrication of the Superhydrophobic Surface on Magnesium Alloy and Its Corrosion Resistance. J. Mater. Sci. Technol. 2015, 31, 1139–1143. [Google Scholar] [CrossRef]
  13. Liu, H.; Xu, Q.; Zhang, X.; Wang, C.; Tang, B. Residual stress analysis of TiN film fabricated by plasma immersion ion implantation and deposition process. Nucl. Instrum. Methods Phys. Res. B 2013, 297, 1–3. [Google Scholar] [CrossRef]
  14. Chen, Z.; Prud’homme, N.; Wang, B.; Ji, V. Residual stress gradient analysis with GIXRD on ZrO2 thin films deposited by MOCVD. Surf. Coat. Technol. 2011, 206, 405–407. [Google Scholar] [CrossRef]
  15. Li, M.; Zhuang, M.; Yin, K.; Wang, J. Residual stress analysis on the Ti-bioglass coatings produced by high velocity flame spraying. Trans. China Weld. Inst. 2009, 30, 66. [Google Scholar]
  16. Li, H.; Wang, Q.; Zhuang, M.; Wu, J. Characterization and residual stress analysis of TiN/TiCN films on AZ31 magnesium alloy by PVD. Vacuum 2015, 112, 66–69. [Google Scholar] [CrossRef]
  17. Li, H.; Li, M.; Han, T.; Sun, J.; Wang, J. Elemental distribution in weld metal of low alloy steel during TIG welding. Trans. China Weld. Inst. 2014, 35, 91–92. [Google Scholar]
  18. Meng, G.; Li, Y.; Shao, Y.; Zhang, T.; Wang, Y.; Wang, F.; Cheng, X.; Dong, C.; Li, X. Effect of Microstructures on Corrosion Behavior of Nickel Coatings: (II) Competitive Effect of Grain Size and Twins Density on Corrosion Behavior. J. Mater. Sci. Technol. 2016, 32, 465–469. [Google Scholar] [CrossRef]
  19. Lu, Y.; Dong, J.; Ke, W. Effects of Cl Ions on the Corrosion Behaviour of Low Alloy Steel in Deaerated Bicarbonate Solutions. J. Mater. Sci. Technol. 2016, 32, 341–348. [Google Scholar] [CrossRef]
  20. Hollstein, F.; Wiedemann, R.; Scholz, J. Characteristics of PVD-coatings on AZ31hp magnesium alloys. Surf. Coat. Technol. 2003, 162, 261–268. [Google Scholar] [CrossRef]
Figure 1. X-ray Diffraction (XRD) patterns of (a) annealed films (b) after executed electrochemical test.
Metals 07 00005 g001
Figure 2. High resolution transmission electron microscopy (HRTEM) and Inverse Fast Fourier Transform (IFFT) images of (a,b) as-deposited film; (c,d) annealed film at 300 °C.
Metals 07 00005 g002
Figure 3. Elements distribution images of films obtained by XRF measurement: (a) as-deposited film (b) annealed film at 300 °C.
Metals 07 00005 g003
Figure 4. Residual stress curves of annealed coatings performed at different temperature (a) as-deposited film; (b) 250 °C; (c) 300 °C; (d) 350 °C.
Metals 07 00005 g004
Figure 5. (a,a1) Surface morphology, corrosion morphology and EDS analysis of as-deposited film; (b,b1) surface morphology, corrosion morphology and EDS analysis of annealed film at 300 °C; (c,c1) surface morphology, corrosion morphology and EDS analysis of annealed film at 350 °C; (d) cross-section of as-deposited film; (e) cross-section of annealed film at 300 °C.
Metals 07 00005 g005aMetals 07 00005 g005b
Figure 6. The results of electrochemical test for AZ31 and coatings with different annealing temperature. (a) Potentiodynamic polarization curves; (b) Nyquist plots; (c) Bode plots of |Z| vs. frequency; (d) The equivalent circuit.
Metals 07 00005 g006
Figure 7. (a) Friction coefficients of as-deposited film and annealed films; (b) wear loss (rates) of as-deposited film and annealed films.
Metals 07 00005 g007
Table 1. Element content values and thickness of deposited film and annealing films at different temperature by X-ray Fluorescence (XRF) (wt %).
Temperature (°C)Element ContentsThickness (μm)
TiNC
As-deposited46.263430.739722.99691.75
25048.235828.204123.56011.77
30047.923328.885523.19121.79
35048.099528.527723.37281.83
Table 2. Electrochemical data of samples obtained from potentiodynamic polarization curves.
SamplesCorrosion Potential Ecorr (V)Current Density Icorr (A·cm−2)
Uncoated AZ31−1.5628.15 × 10−4
Annealing AZ31−1.4481.03 × 10−4
Deposited film−1.1517.65 × 10−7
250 °C film−1.1386.42 × 10−7
300 °C film−1.0624.69 × 10−7
350 °C film−1.0846.08 × 10−7
Table 3. Fitting results of electrochemical impedance spectroscopy (EIS) plot of annealed films.
SamplesRs (ohm·cm2)CPEf (cm−2·sn·Ω)nRct (ohm·cm2)CPEdl (cm−2·sn·Ω)Rf (ohm·cm2)
250 °C88.634.58 × 10−60.7951643.76 × 10−5898
300 °C95.352.05 × 10−60.7958591.35 × 10−51156
350 °C99.844.19 × 10−60.7853623.42 × 10−51009

