Analytical Investigation of the Cyclic Behavior of Smart Recentering T-Stub Components with Superelastic SMA Bolts

1
Department of Civil and Environmental Engineering, South Dakota State University, Brookings, SD 57007, USA
2
Department of Civil and Environmental Engineering, Incheon National University, Incheon 22012, Korea
3
Incheon Disaster Prevention Research Center, Incheon National University, Incheon 22012, Korea
*
Author to whom correspondence should be addressed.
Metals 2017, 7(10), 386; https://doi.org/10.3390/met7100386
Submission received: 16 July 2017
/
Revised: 10 September 2017
/
Accepted: 12 September 2017
/
Published: 21 September 2017
(This article belongs to the Special Issue Shape Memory Alloys 2017)
Abstract
:Partially restrained (PR) bolted T-stub connections have been widely used in replacement of established fully restrained (FR) welded connections, which are susceptible to sudden brittle failure. These bolted T-stub connections can permit deformation, easily exceeding the allowable limit without any fracture because they are constructed with a design philosophy whereby the plastic deformation concentrates on bolt fasteners made of ductile steel materials. Thus, the PR bolted connections take advantage of excellent energy dissipation capacity in their moment and rotation behavior. However, a considerable amount of residual deformation may occur at the bolted connection subjected to excessive plastic deformation, thereby requiring additional costs to recover the original configuration. In this study, superelastic shape memory alloy (SMA) bolts, which have a recentering capability upon unloading, are fabricated so as to solve these drawbacks, and utilized by replacing conventional steel bolts in the PR bolted T-stub connection. Instead of the full-scale T-stub connection, simplified T-stub components subjected to axial force are designed on the basis of a basic equilibrium theory that transfers the bending moment from the beam to the column and can be converted into equivalent couple forces acting on the beam flange. The feasible failure modes followed by corresponding response mechanisms are taken into consideration for component design with superelastic SMA bolts. The inelastic behaviors of such T-stub components under cyclic loading are simulated by advanced three-dimensional (3D) finite element (FE) analysis. Finally, this study suggests an optimal design for smart recentering T-stub components with respect to recentering and energy dissipation after observing the FE analysis results.
1. Introduction
After the 1994 Northridge (CA, USA) and 1995 Kobe (Japan) earthquakes, partially restrained (PR) bolted connections have been utilized as an alternative to fully restrained (FR) welded connections that exhibit brittle failure within the allowable deformation limit [1,2,3]. In these PR bolted connections, beam members are connected by fastening connection components (i.e., end-plate, T-stub, and clip angle components) to column members with tension bolts, and thus bending moments transferred from beams are delivered to connections, including shear forces. The PR bolted connections can accommodate a rotation angle greater than the allowable limit (i.e., typically 0.03 radian for plastic deformation) before structural beam members reach full plastic moment. This is because tension bolts where plastic deformation may concentrate are fabricated with carbon steel materials, which are rich in ductility [4,5,6]. Contrary to the FR welded connections, the PR bolted connections cope flexibly with axial couple forces converted from bending moment, and simultaneously possess excellent energy dissipation capacity without rapid strength degradation [7,8,9]. When structural beam members are subjected to either initial yielding or local buckling as preliminary collapse, the typical PR bolted connections exhibit delayed deterioration to withstand additional force until the tension bolts installed arrive at ultimate strength [9,10,11].
Although the PR bolted connections can be substituted for the existing FE welded connections, they are restricted to modern structures, which are becoming larger and higher, and thus it is necessary to improve their performance. The tension bolts made of ductile carbon steel prevent breaking or brittle failure by permitting the concentration of plastic deformation, but immoderate residual deformation may occur at the PR bolted connection [4,5,6,12]. Extra cost is required to recover the original condition after strong excitation. For this reason, this study suggests new PR bolted connections that are integrated with superelastic shape memory alloy (SMA) bolts replacing conventional steel bolts in an effort to reduce the residual deformation at the connection, enhancing the recentering capability. Unless other connection members are prone to generate plastic yielding, superelastic SMA-bolted connections can recover the initial shape without any permanent displacement after the removal of the applied load.
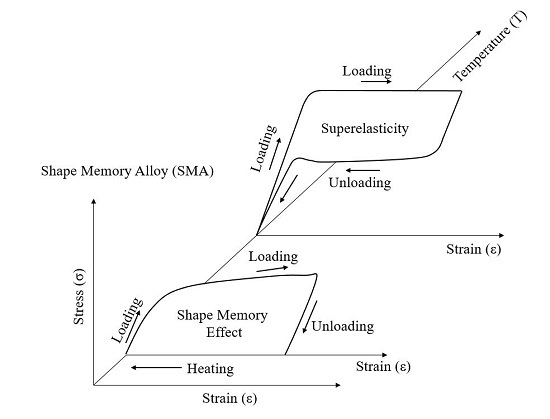
Temperature-dependent stress and strain curves for SMA materials are presented in Figure 1. At the martensite phase transformation temperature, SMA materials are susceptible to residual deformation upon unloading, and exhibit a shape memory effect where an additional heating process is required to revert to the original shape [13]. The crystallographic conversion from martensite phase to austenite phase, which provides a recentering capability to the SMA material, takes place during this heating process [13,14]. The superelastic effect, which can automatically recover the original conditions without heating, may be observed at the austenite phase transformation temperature, which is above the martensite one, and thus superelastic SMA materials behave according to the flag-shaped hysteresis loop shown in the figure [14]. Due to the improvement of manufacturing technology, SMA materials have been able to generate the superelastic effect at room temperature for the last 30 years. In addition to medical, mechanical, and electronic instruments, superelastic SMA materials have been utilized as dampers, passive control devices, and fasteners in the civil engineering field since the early 2000s [13,14]. In particular, some representative studies on the behavioral characteristics of superelastic SMA bolted moment connections (e.g., end plate and T-stub connections) in terms of recentering and energy dissipation have been recently carried out by researchers [15,16,17,18].
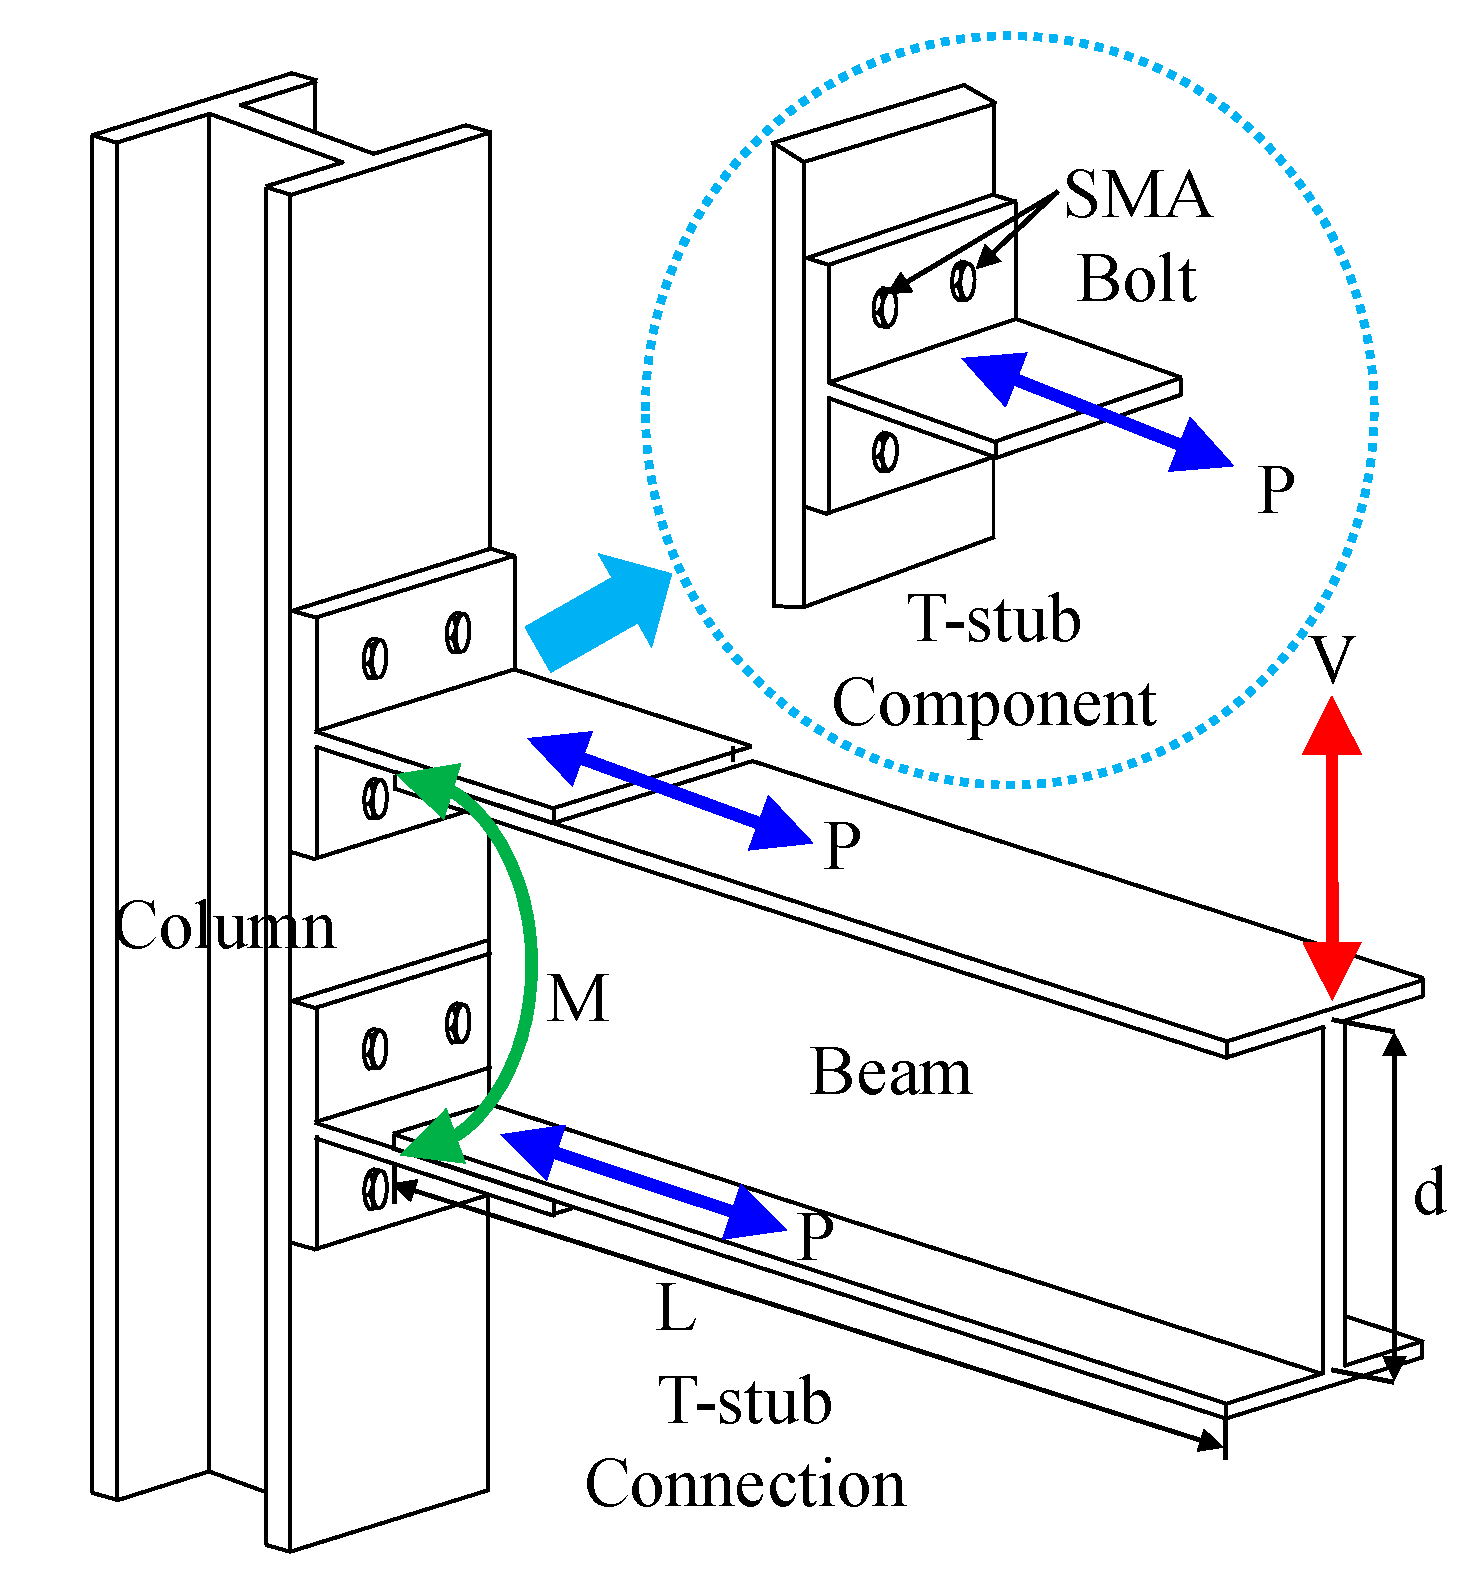
In this study, T-stub connections that firmly clamp structural beams to column members are designed with tension bolts made by superelastic SMAs, as shown in Figure 2. The T-stub connections can delivery bending moment (M) as well as shear force (V) from beams to columns. T-stub components including tension bolts are subjected to couple forces (P) transferred from bending moment (M), as follows:
where L indicates the length of the beam and d denotes the depth of the beam. The simplified T-stub components instead of the full-scale T-stub connections are intended to simulate inelastic behavior under cyclically axial loads and directly evaluate the performance of superelastic SMA bolts in the T-stub component. The several T-stub components are designed with variable design parameters such as T-stub flange thickness and bolt gauge length, which can determine the extent of the prying action mechanism, and then their possible failure modes are investigated through the study of the theoretical prying action model. In lieu of experimental tests, the behaviors of such T-stub components are reproduced by advanced finite element (FE) analysis, generally used for estimating structural performance. According to the occurrence of plastic yielding in the steel T-stub member, recentering and energy dissipation capacity for T-stub components will be evaluated together with accompanying SMA bolt behavior. Finally, optimal design methodology is proposed to make the best of structural performance with respect to recentering capability and energy dissipation capacity in the T-stub component.
2. Prying Model
The prediction of the ultimate capacity for the T-stub component is quite complex in that several failure modes (e.g., yielding and fracture) correlate with each other and are tied up with uncertainties related not only to material properties but also to fabrication tolerances [7,8]. The prying action mechanism achieved by some assumption that T-stub flanges and tension bolts are considered to be beam members and spring supports, respectively, becomes a representative model to predict its response and failure mode. In this study, the prying action model specified in the AISC-LRFD (American Institute of Steel Construction-Load Resistance Factored Design) design guideline is adopted to evaluate the ultimate capacity of the T-stub component [18]. This prying action model was based upon one of the most popular models proposed by Kulak et al. [19]. The T-stub components subjected to axial force are accompanied by the yielding of the T-stub flange and the fracture of the tension bolt according to the increase of the applied load. The failure modes determined by the prying action mechanism have a significant influence on recentering and energy dissipation at the T-stub component. Thus, several T-stub components are designed by regulating the amount of prying action, which can be simultaneously affected by T-stub flange thickness and bolt gauge length.
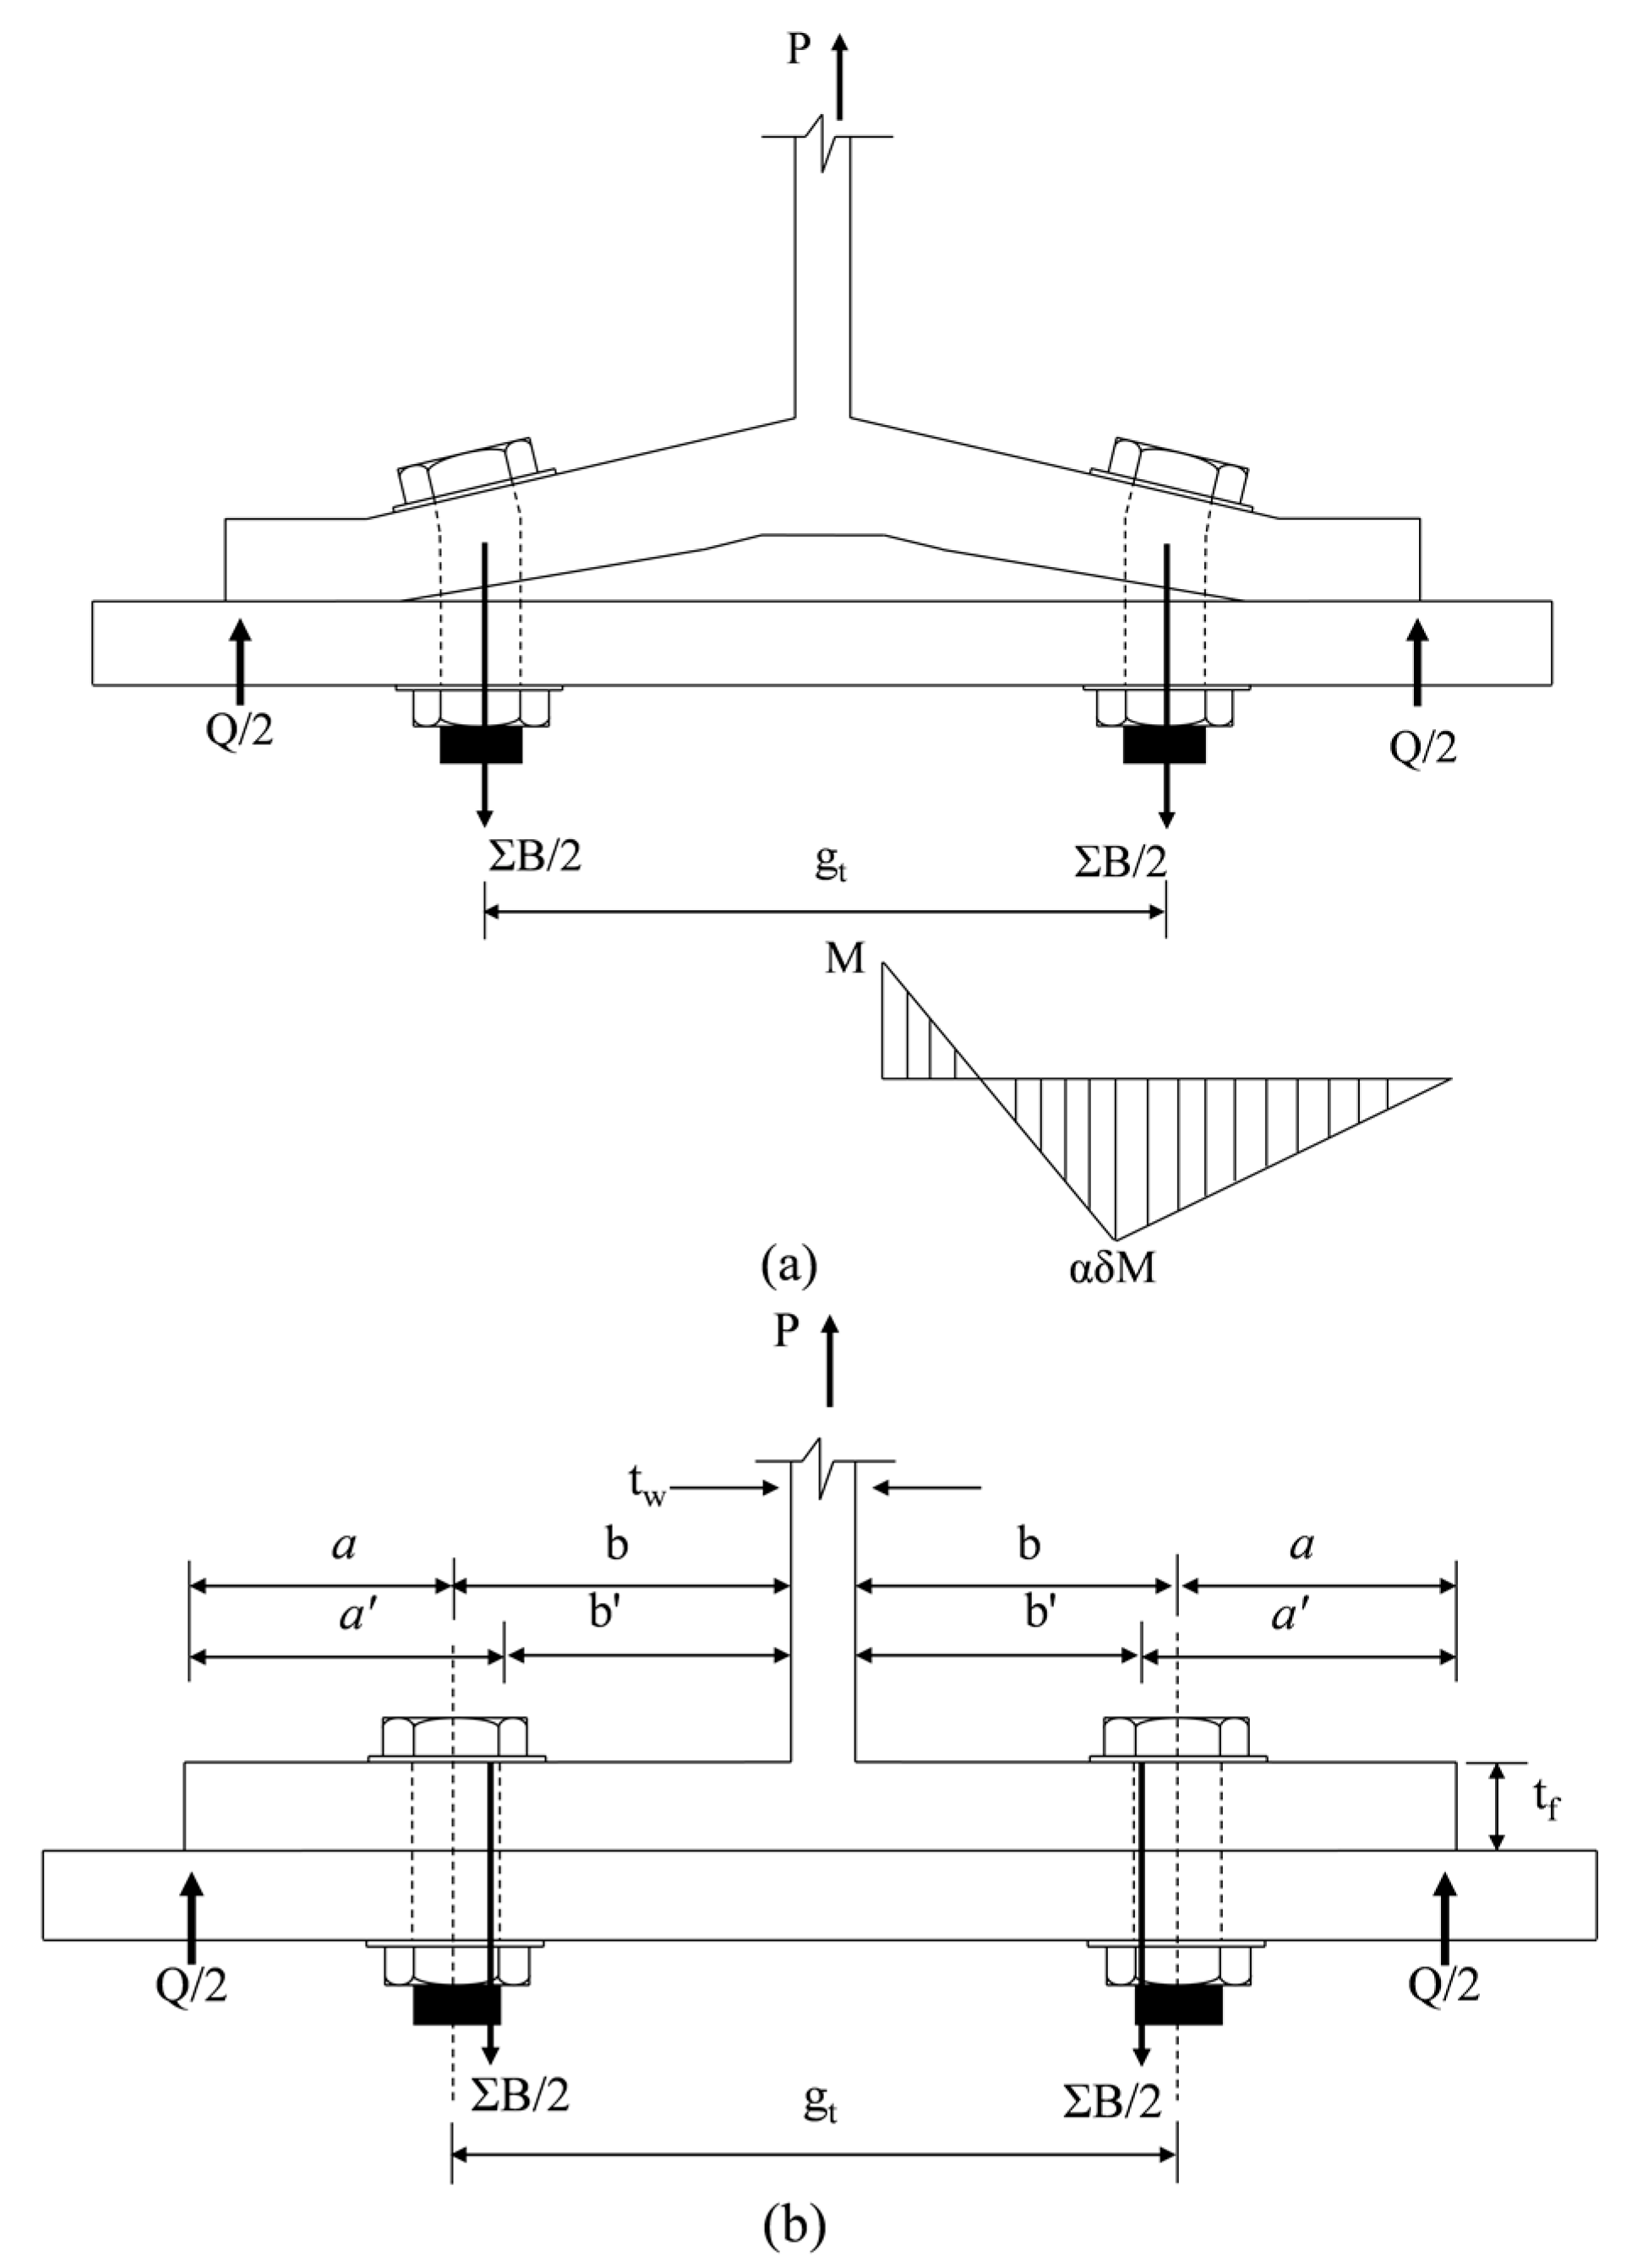
The typical prying action mechanism occurring at the T-stub component is illustrated in Figure 3. When axial force is applied to the T-stub web, as shown in Figure 3a, T-stub flanges with relatively thin thickness are susceptible to deflection dominated by bending moment. The tension bolts can be modeled as deformable spring elements acting as flexible supports, and clamped to the column flange. As seen in this figure, prying force (Q), referred as to surplus reaction force, takes place at the edge of the T-stub flange, and increases the summation of bolt reaction forces, thereby stirring up preliminary failure. The equilibrium state defined in Equation (3) can be established by this prying action mechanism in the T-stub component. The amount of such prying force can be minimized by either increasing the thickness of the T-stub flange (tf) or decreasing the length of the bolt gauge (gt). When the intensity of the prying force gradually increases, the deformation caused by the deflection of the T-stub flange and the tension bolt becomes dominant [16]. This degrades the ultimate capacity of the T-stub component because the resistance strength against bending moment is relatively smaller than that against axial force. In this case, the T-stub component has a tendency to easily create the yielding of the T-stub flange as the preliminary failure. The geometric definition of the prying action model, which is appropriate to determine the ultimate capacity of the T-stub component, is presented in Figure 3b. In the prying action model suggested by Kulak et al., equivalent bolt reaction forces and maximum bending moments are assumed to act at the inside edge of the bolt shank rather than at the center of the bolt shank [16]. This prerequisite is based on the fact that more bolt head pressure is distributed into the T-stub flange inside the bolt head than outside the bolt head. It is adequate to use a′ and b′, defined in Equations (3) and (4), instead of a and b, with the aim of elucidating static equilibrium.
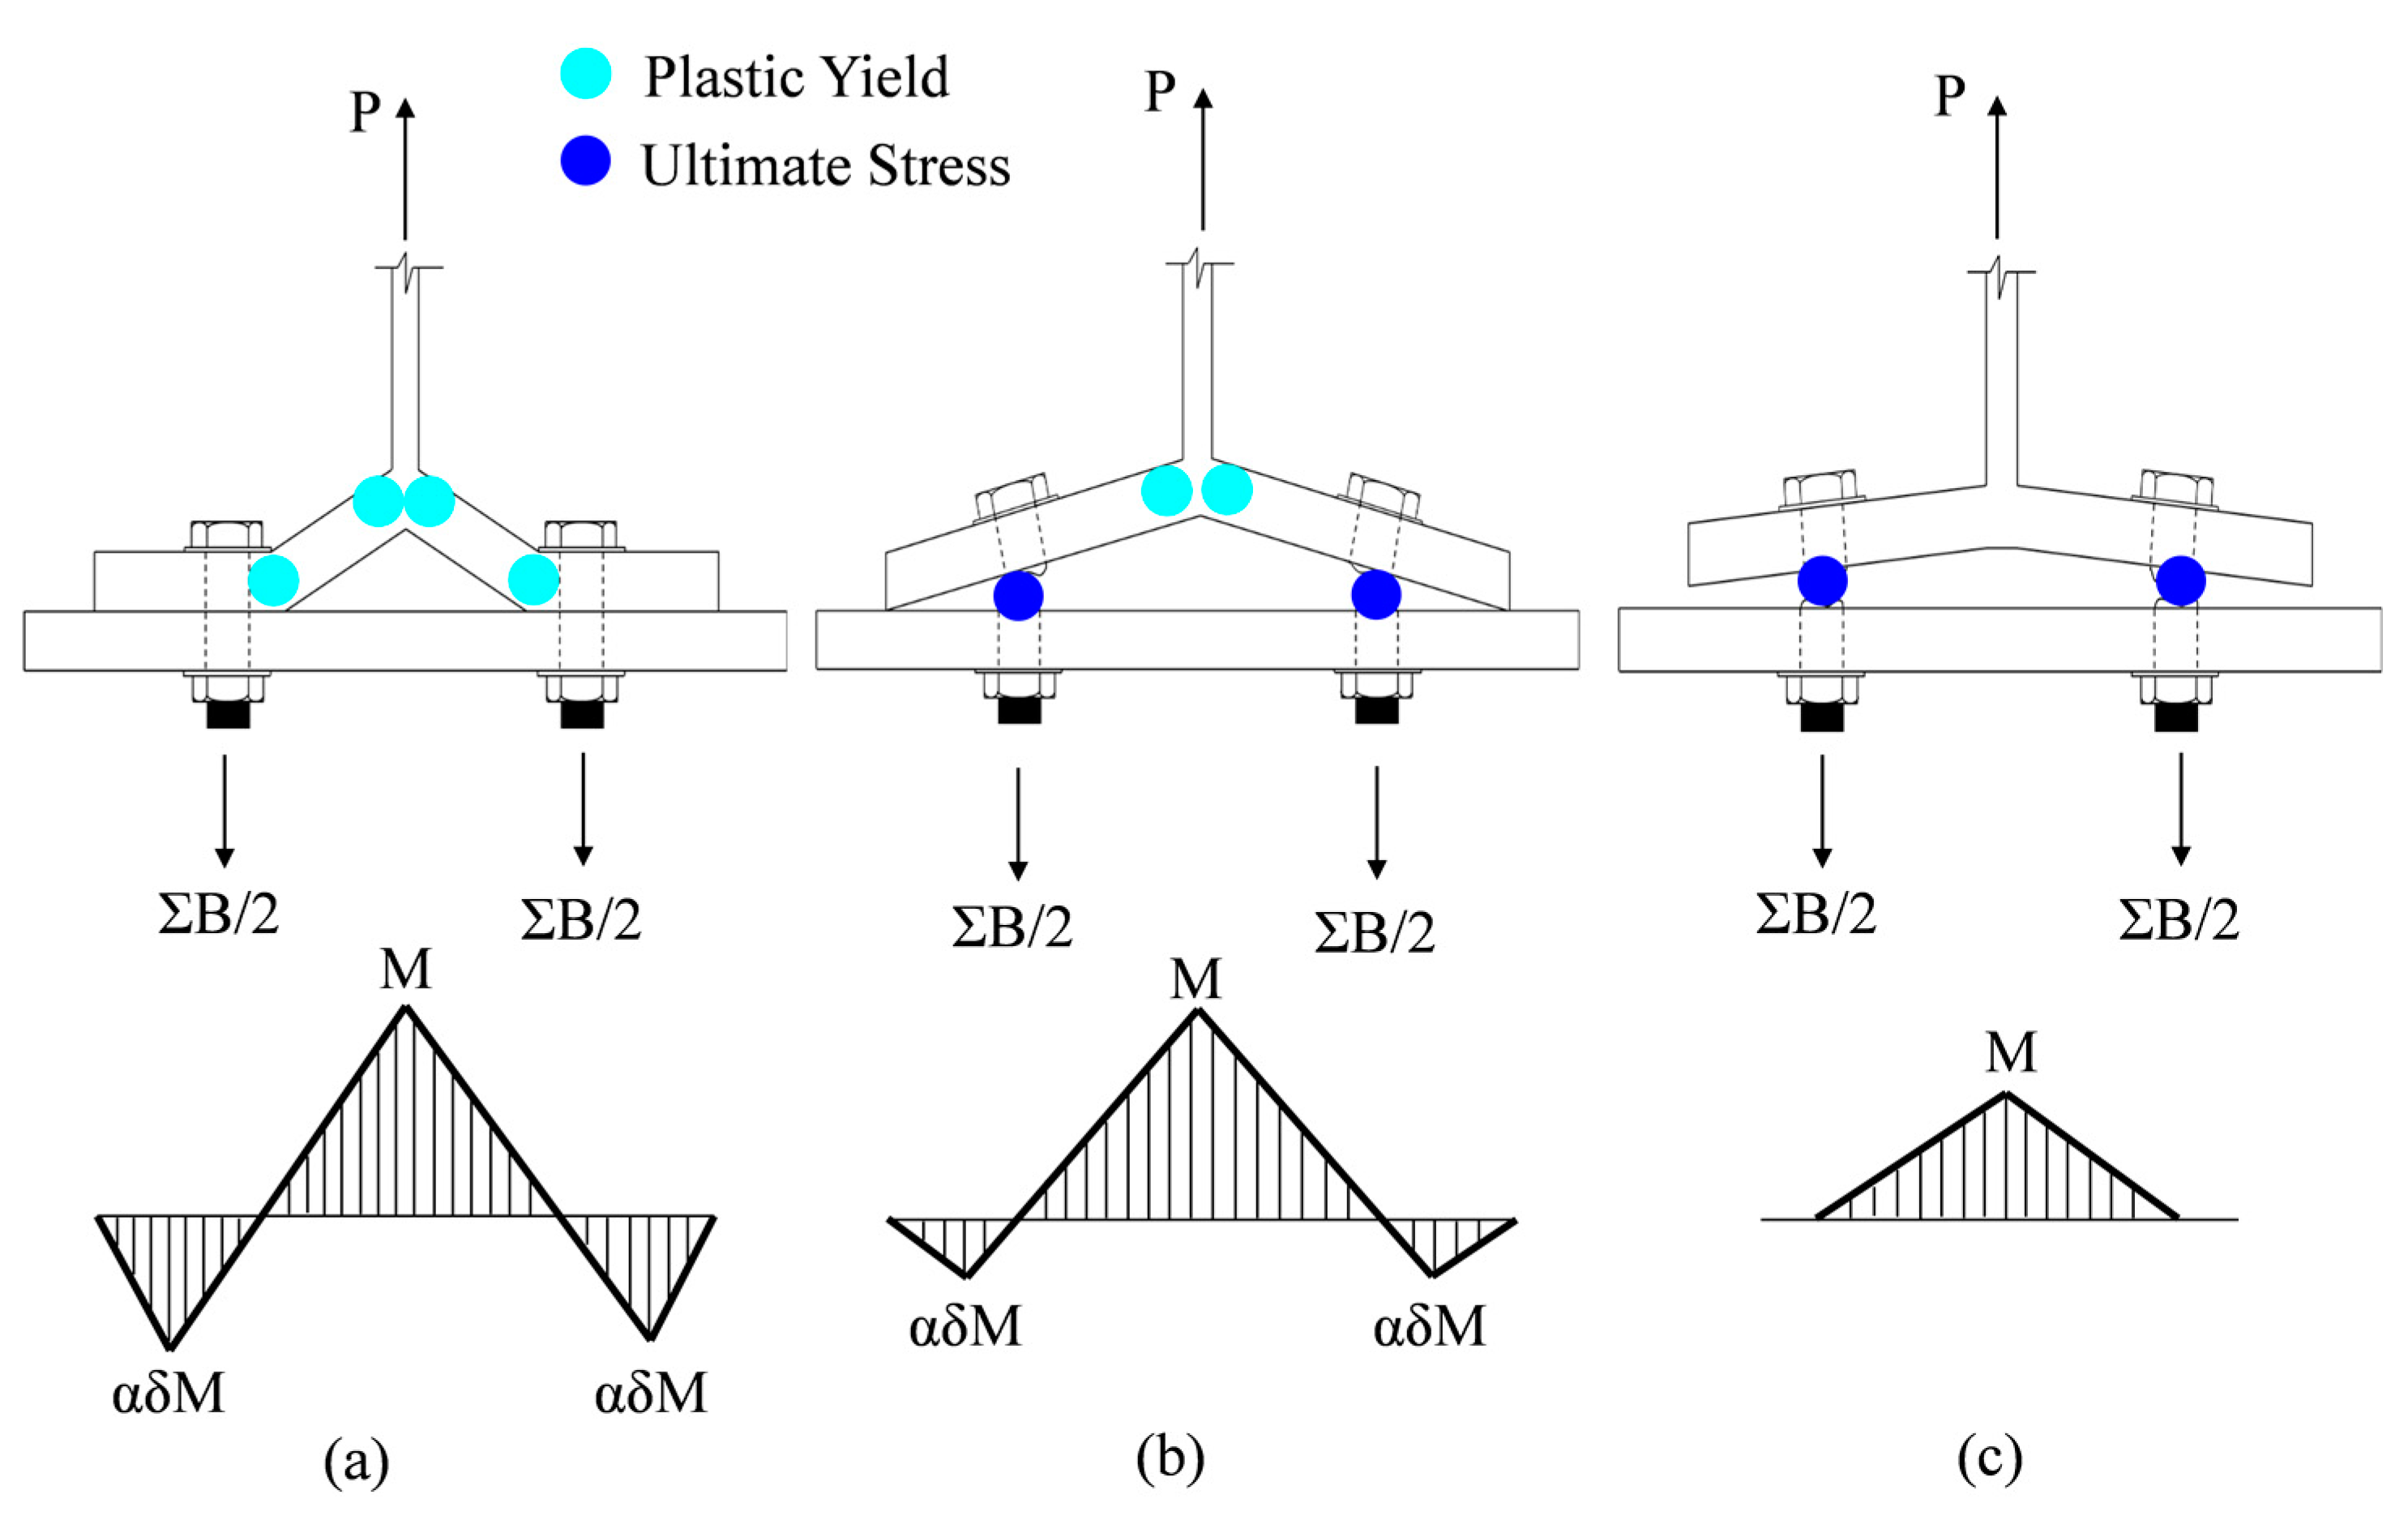
where db indicates the diameter of bolt shank. The ultimate capacity of the T-stub component can be estimated on the basis of three failure modes formed by taking the relationship between T-stub flanges and tension bolts into consideration (see Figure 4). These three failure modes consist of the formation of plastic yielding in the T-stub flange (see Figure 4a), tension bolt fractures combined with flange yielding (see Figure 4b), and pure tension bolt fracture without any prying action (see Figure 4c), which correspond to Equations (6)–(8), respectively:
where Fy indicates the yield stress of the T-stub flange fabricated by general carbon steel, and ΣB represents the summation of bolt reaction forces under ultimate stress. Fy and ΣB are applied to 325 MPa and 540 MPa, respectively. Moreover, p and δ represent the effective width of the T-stub flange and the ratio of the net section area to the gross section area, respectively, and thus are expressed as follows:
where ntb and dh stand for the number of the used tension bolts and the diameter of the bolt hole. WT-stub represents the width of the T-stub.
The intensity of the prying action mechanism can be classified to use the parameter defined in Equation (11) as follows:
This parameter for the level of the prying action present (α) is determined by the ratio of the moment on the centerline of the T-stub component to the moment on the centerline of the bolt shank, including the magnitude of prying force on the edge of the T-stub flange [8,19]. When the prying action parameter exceeds one (α > 1.0), the thickness of the T-stub flange is sufficient to generate yielding caused by bending deflection. Therefore, in this case (Mode 1), the T-stub flange can be considered a fixed support beam, and the plastic hinges presented in Figure 4a take the place of the T-stub flange. Compared to the other two failure modes (Mode 2 and Mode 3), this failure mode provokes a relatively larger bending moment and prying force on the T-stub flange.
The prying action mechanism under this failure mode may serve as one of the significant points to degrade strength capacity for the entire T-stub component. The T-stub flange fabricated with carbon steel undergoes the stage of its material strain hardening after initial yielding, thereby providing extra resistance against external force until ultimate stress comes to the T-stub flange. If ultimate bolt fractures happen prior to reaching ultimate stress in the T-stub flange, tension bolt prying combined with flange yielding (Mode 2) will be preceded by initial yielding failure of the T-stub failure which is referred to as Mode 1. Once T-stub flanges are redesigned with increasing thickness and decreasing bolt gauge length, T-stub components have a high possibility to generate Mode 2 or Mode 3 failure shape. When 0 < α ≤ 1, tension bolt fractures mainly produced by bending prying deflection and flange yielding take place at the same time (Mode 2). Finally, when the prying action parameter is below zero (α < 0), the prying force becomes zero in that the T-stub flange completely separates from the column plate. Due to the absence of prying action in the tension bolt, ultimate fracture caused by pure axial force may occur after reaching ultimate stress.
On the basis of the prying action model, the general solution used for determining the capacity of the T-stub component can be plotted as the function of the T-stub flange thickness (tf). The theoretical solution for the failure modes according to increasing flange thickness is presented in Figure 5. The line segment OB computed by Equation (6) stands for the capacity of the T-stub component, which can be determined based on the preliminary yielding failure mainly caused by prying action on the T-stub flange. The bolt fractures combined with flange yielding are displayed in the line segment BC formulated by Equation (7), while pure tension bolt fractures without any prying action are reproduced in the line segment CE computed by Equation (8). The line segment CE remains constant over flange thickness, regardless of T-stub flange capacity. In this study, the summation of bolt reaction forces (ΣB) is taken as the value of 430 kN obtained from the product of ultimate stress (540 MPa) to the total bolt shank area. In Figure 5, a′ and b′ are applied to 108 mm and 32 mm, respectively (Case 1 to Case 8, see Table 1). The expanded line segment AB can be computed by Equation (7) under the condition where the prying action parameter α exceeds 1.0. This line segment can be utilized for determining the capacity of the T-stub component when ultimate bolt fractures preceded by initial flange yielding occur due to bolt prying. As shown in Figure 5, the capacity of the T-stub component whose flange thickness is less than 22.5 mm can be evaluated by the line segment OB indicating initial flange yielding (Mode 1), and then finally determined by tension bolt fractures on the extended line segment AB (Mode 2) during the increase of loading capacity. In this case, tension bolts are subjected to not only axial displacement but also bending deflection caused by prying action, and thus have a tendency to more easily fail under relatively smaller external force as compared to the T-stub component belonging to the line segment CE. This implies that prying action acting on the head of the tension bolt can weaken resistance strength capacity for the T-stub component. The design of the T-stub component models in accordance with the prying action mechanism will be treated in the next section.
3. Model Design
3.1. Specimen Design
At the behavior of the T-stub component with superelastic SMA bolts, the extent of recentering capability and energy dissipation capacity depends on the level of the prying action present. The T-stub component models presented herein were designed with several prying action levels and different failure modes, which were regulated by flange thickness and bolt gauge length. After completing the design of the T-stub component models, their behaviors were simulated by advanced nonlinear finite element (FE) analyses. Ultimately, optimal design methodology for smart recentering T-stub components with superelastic SMA bolts is intended to be proposed through the observation of the FE analysis results in an effort to make the best use of their recentering capability and energy dissipation capacity.
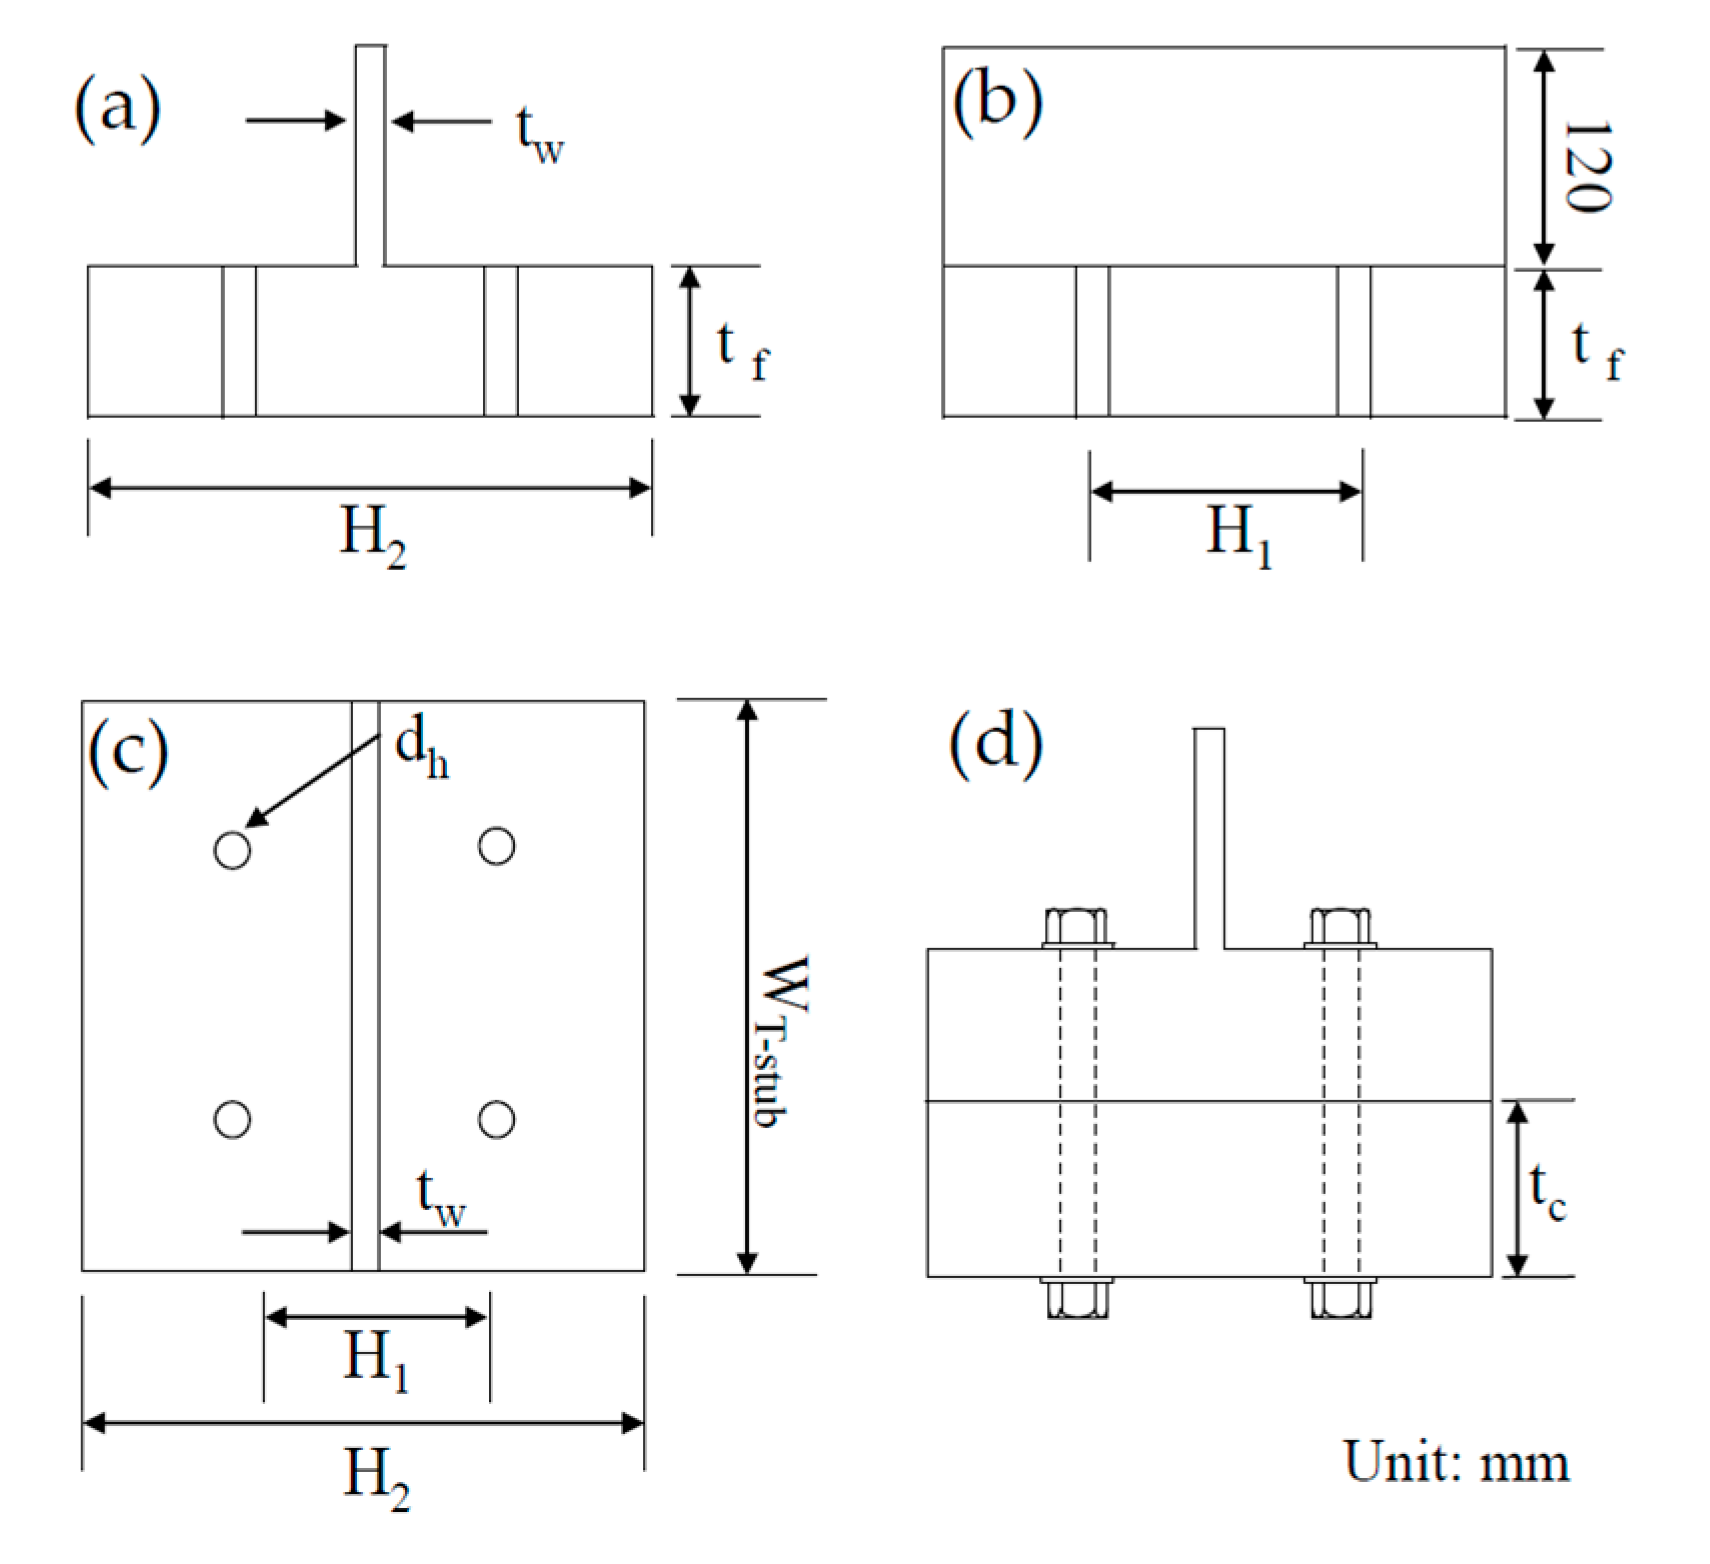
The component details including the dimensions of the component models are illustrated in Figure 6. The geometric sizes for individual dimensions defined in the Figure 6 are summarized in Table 1 for all T-stub component models. These component models can be classified as two groups in accordance with the ratios of H1 to H2 (i.e., H1/H2 = 1/3 and H1/H2 = 2/3), which can regulate the amount of prying action. The first group models ranging from Case 1 to Case 8 was designed with H1/H2 = 1/3. On the other hand, the second group models ranging from Case 9 to Case 16 was designed with H1/H2 = 2/3 indicating relatively larger prying action than the first group models. The thickness of the T-stub flange varied from 50 mm to 15 mm, and was equally divided into eight model cases. All T-stub component models were designed with 20 mm web thickness (tw), 16 mm bolt diameter (dh), and 140 mm bolt length. According to the thickness of the T-stub flange, the thickness of the column plate (tc) was varied to fit the net length of the tension bolt (e.g., tf + tc = 140 mm). The superelastic SMA bolts were designed with 430 kN ultimate strength computed by the product of ultimate stress (540 MPa) to total bolt shank area.
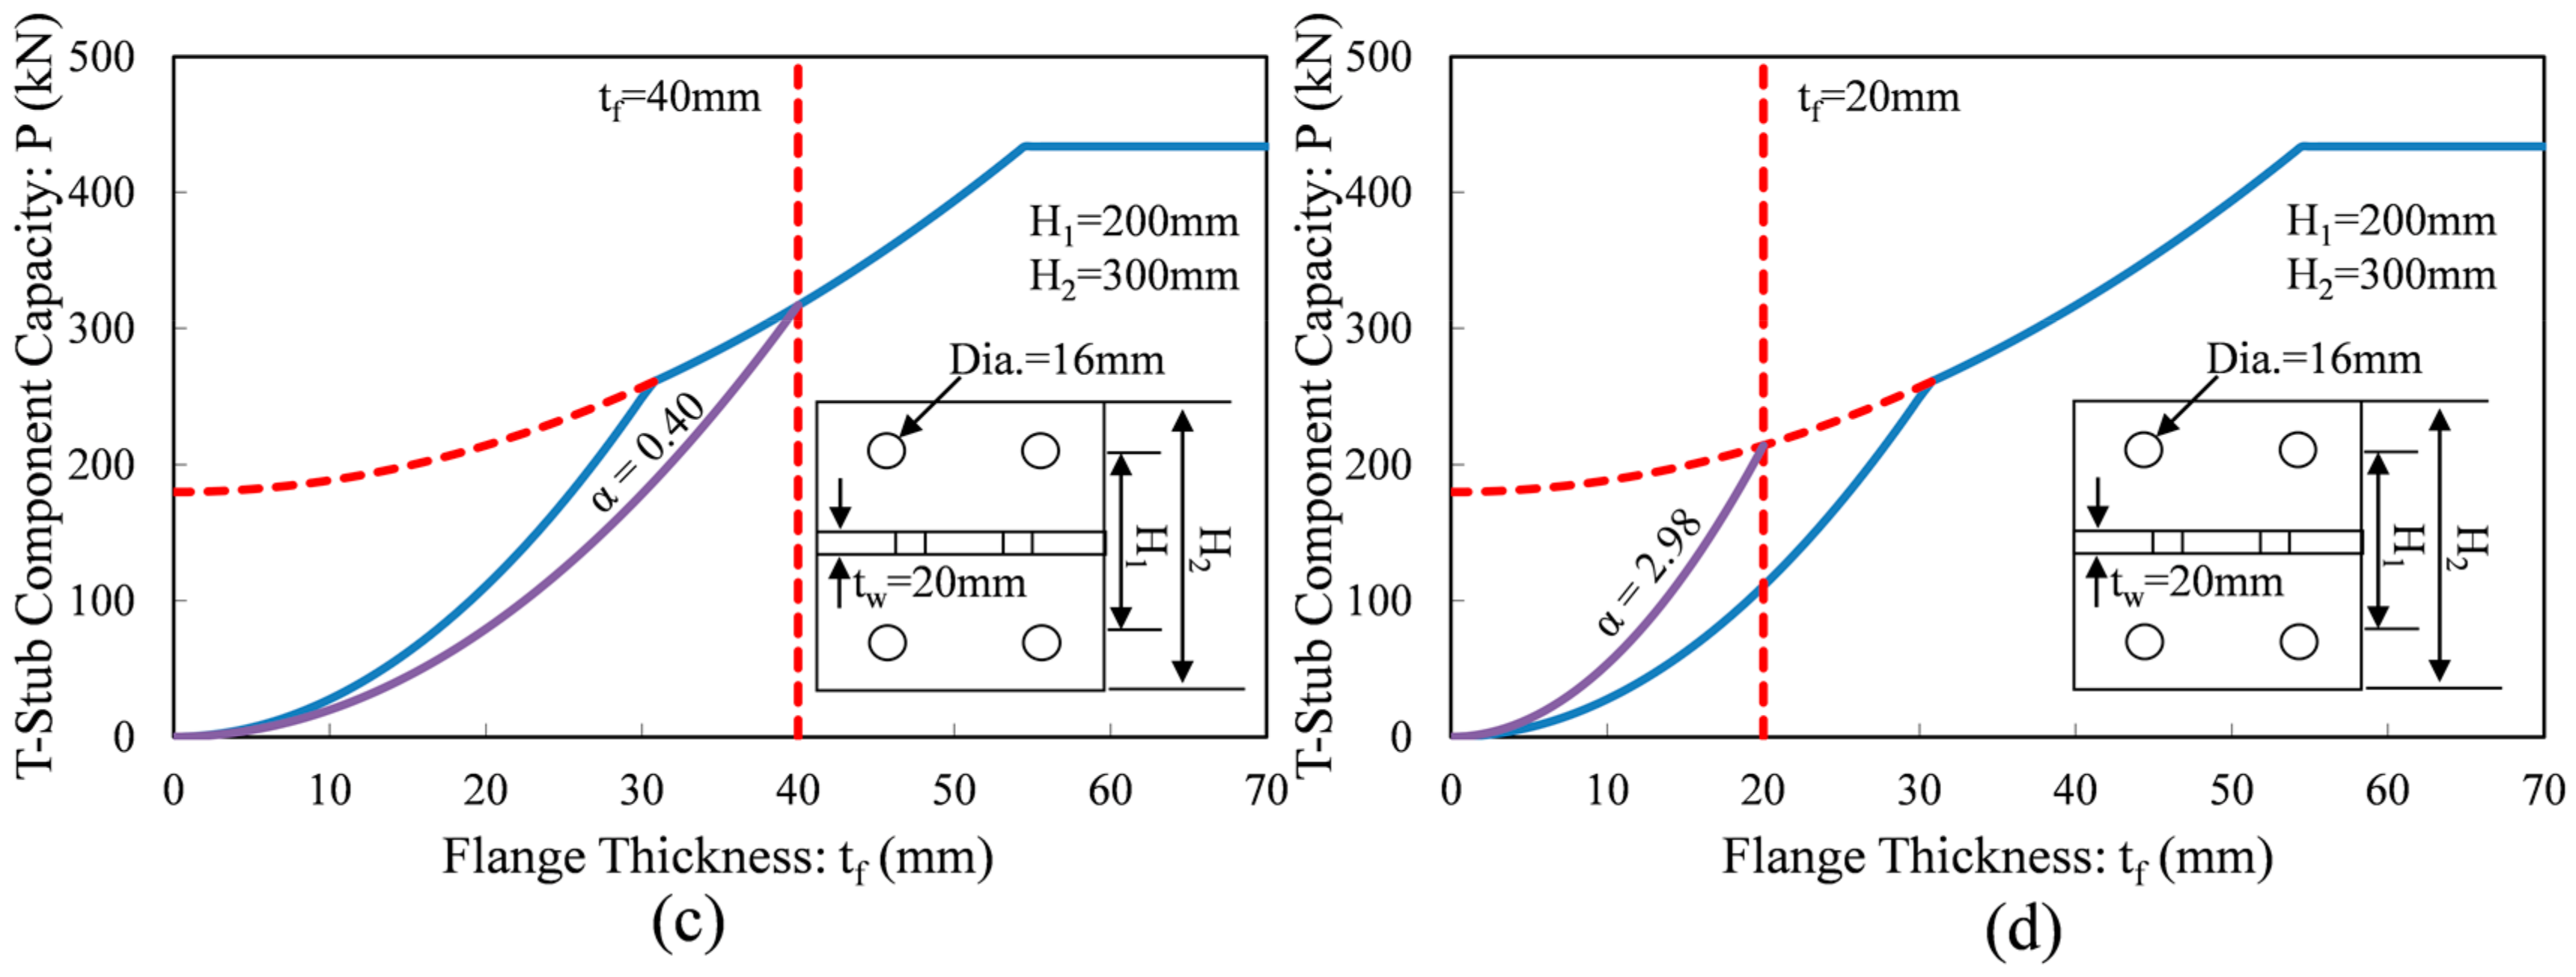
The design results based on the prying action mechanism for the four selected models are presented in Figure 7. The Case 3 model and the Case 7 model belong to the first group designed in accordance with H1/H2 = 1/3, but the flange thickness of the Case 3 model is twice more thick than that of the Case 7 model. In addition, the Case 11 and Case 15 models were designed with H1/H2 = 2/3. The Case 11 has 40 mm flange thickness, meaning that its flange thickness is also twice more thick than the flange thickness of the Case 15 model. Therefore, the Case 3 model and the Case 7 model lie in similar H1/H2 ratios comparable to the Case 11 and Case 15, respectively. The capacity of the T-stub component grows to be deteriorate when the level of the prying action present controlled by the ratio of H1/H2 begin to increase under the same flange thickness. It can be also found that the failure mode may shift from bolt fracture to flange yielding. The Case 3 model subjected to pure bolt fracture (α = −0.31 for Mode 3) possesses 430 kN ultimate strength while the Case 11 model experiencing bolt fracture combined with flange yielding (α = 0.40 for Mode 2) has smaller 317 kN ultimate strength. The Case 7 model undergoing Mode 1 failure shape (α = 1.64) is subjected to preliminary flange yielding when force arrives at 284 kN. Thereafter, it will ultimately fail by bolt fracture combined with plastic hinge on the T-stub flange when force increases to 369 kN. Similarly, the Case 15 model undergoes Mode 2 failure shape at 215 kN force after preceded by Mode 1 failure shape at 111 kN force. The ultimate capacity and failure mode of individual T-stub component models are summarized in Table 1.
3.2. 3D Finite Element Models
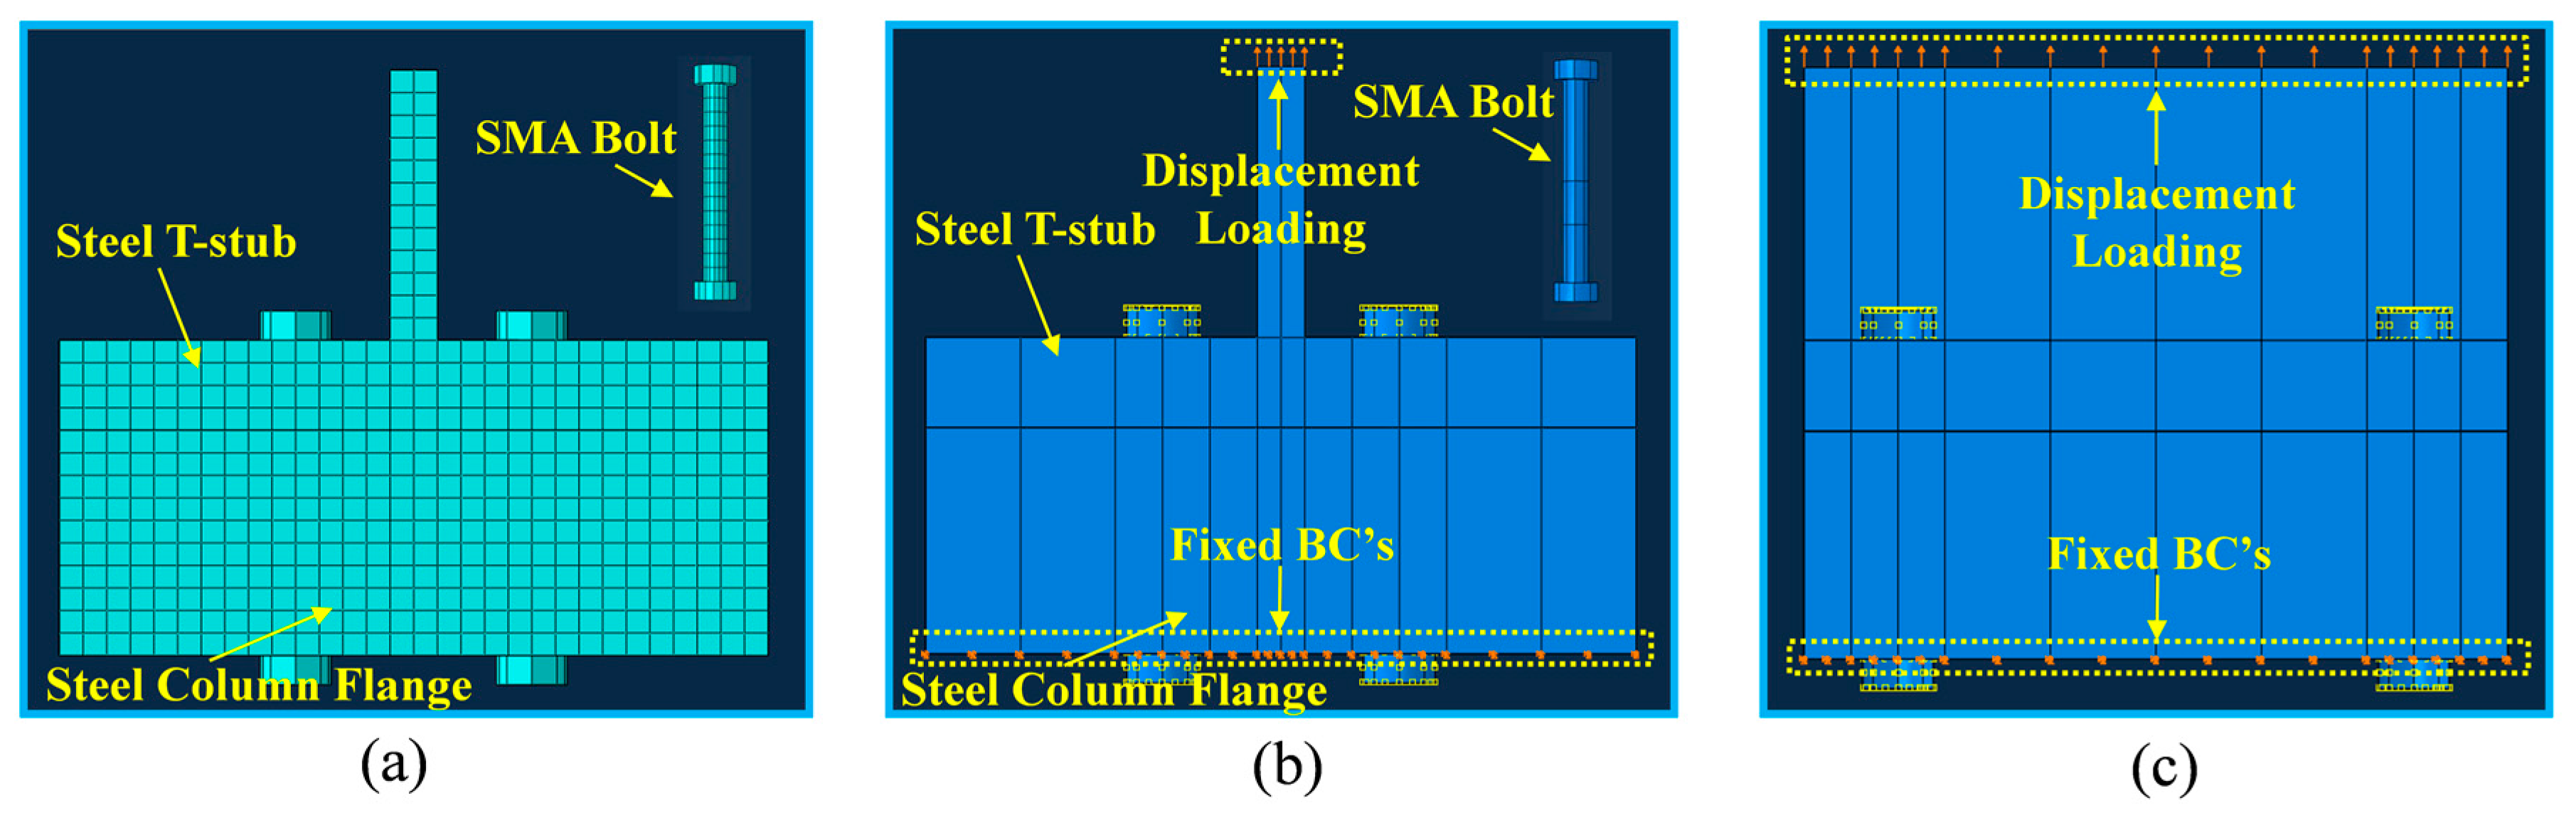
In lieu of experimental tests, cyclic behaviors for the T-stub components incorporating superelastic SMA tension bolts are simulated through nonlinear FE analyses, and evaluated in terms of recentering effect and energy dissipation capacity. The ABAQUS program (Version 6.12, Simulia, Pawtucket, RI, USA) was used to perform these nonlinear FE analyses [20]. The FE models were fabricated with 16 T-stub component specimens presented in Table 1, as considering not only geometric nonlinearity but also nonlinear material property during analyses. The FE models composed of element mesh, loading, and boundary conditions (BCs) are illustrated in Figure 8. These FE models are made up of 3D eight-node solid elements (C3D8) with nonlinear material properties. All 3D eight-node solid elements used in the Case 3 model were made in the form of the 10 mm × 10 mm × 10 mm cube (16,300 element numbers). The number of the used elements varies according to the model cases. The individual parts were divided by structural meshes in order to align the solid elements in an effective manner, and thus the analytical prediction becomes more accurate. The separate step was generated with an intention to impose initial adjustment displacement acting as pretension force on the middle surface of the tension bolt. Instead of modeling the entire column, the BCs applied to the column plate can be substituted to save time and cost.
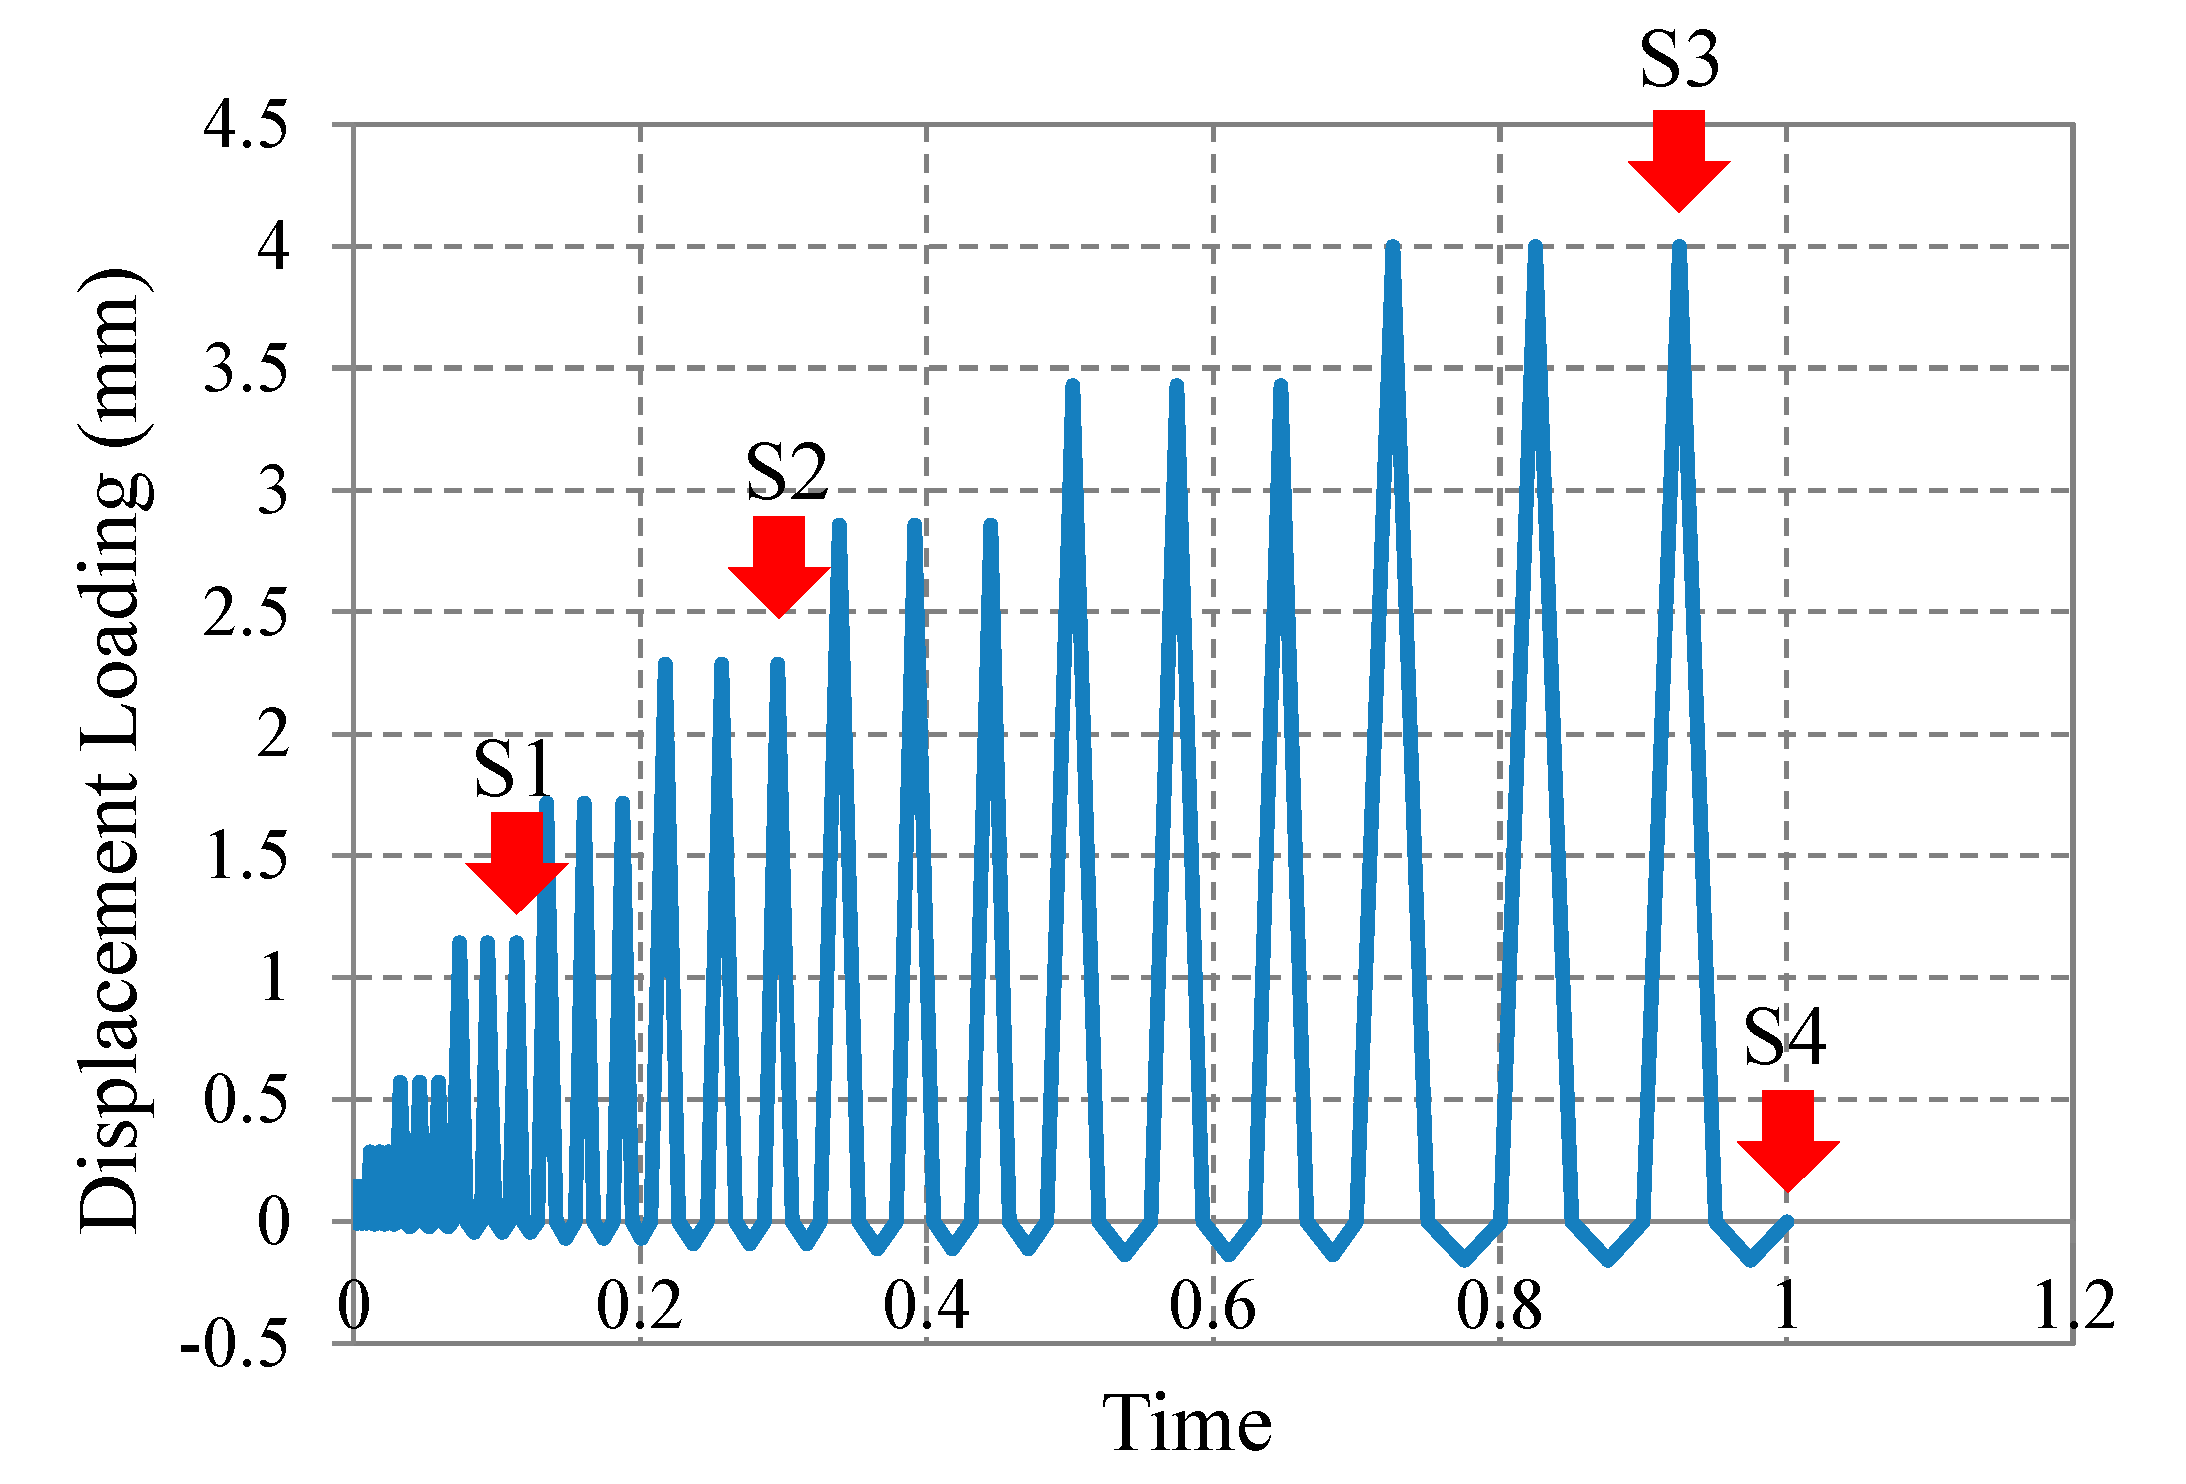
After applying initial adjustment displacement, the second step was independently generated to impose displacement-controlled cyclic loading on the edge of the T-stub web as shown in Figure 8a,b. Figure 9 shows the used displacement loading history, where the amplitude of the cycle ascends to 4mm maximum displacement as time goes on. This displacement loading history was reproduced by utilizing the amplitude function provided in the ABAQUS program, and assigned to the released BCs (loading points) imposed on the edge of the T-stub web. The displacement-controlled loading history can be converted into reaction force by the summation of the forces at the loading faces. During compression, referred to as minus displacement loading, compression bearing occurs at the contact surface between T-stub flange and column plate, and reaction force including stiffness increase very fast. When applying compression to the T-sub component, the summation of bolt reaction forces is negligible. Accordingly, the amplitude of compression displacement, which is much smaller than that of tension displacement, should be applied to FE models. The stress contour fields were measured at the specific displacement loading points such as S1, S2, S3, and S4.
Besides geometric nonlinearity, material nonlinearity was considered during FE modeling for the purpose of performing accurate analyses. Including column plates, T-stub members were constructed with typical Gr.50 carbon steel materials which include 325 MPa yield stress, 200 GPa elastic modulus, and 1.5% strain hardening ratio. The behavior of this steel material was reproduced by utilizing the isotropic hardening material model, which displays stress relaxation, Bauschinger effect, and ratchetting response [20]. The nonlinear material properties were assigned to individual parts composed of 3D solid elements. The default material model used to numerically simulate the behavior of the superelastic SMA material is absent in the ABAQUS program, and thus the user-defined material (UMAT) model was employed to FE modeling [21]. The material input properties required to operate the UMAT model were obtained from uni-axial pull-out tests performed by DesRoches et al. [14]. The stress and strain curves for superelastic SMA materials are shown in Figure 10. The material input properties needed to reproduce the behavior of the superelastic SMA during FE analyses were taken as 40 GPa for elastic modulus, 0.33 for Poisson’s ratio, 440 MPa for martensite start stress, 540 MPa for martensite finish stress, 250 MPa for austenite start stress, 140 MPa for austenite finish stress, 0.045 radian for slip strain, and 25 °C for transformation reference temperature. The simulated stress and strain curve was modeled as a series of straight lines, which reflect the path of each phase transformation. In general, the simulated stress and strain curve exhibits good agreement with the experimental stress and strain curve.
4. Analysis Results
4.1. Behavior of T-Stub Components
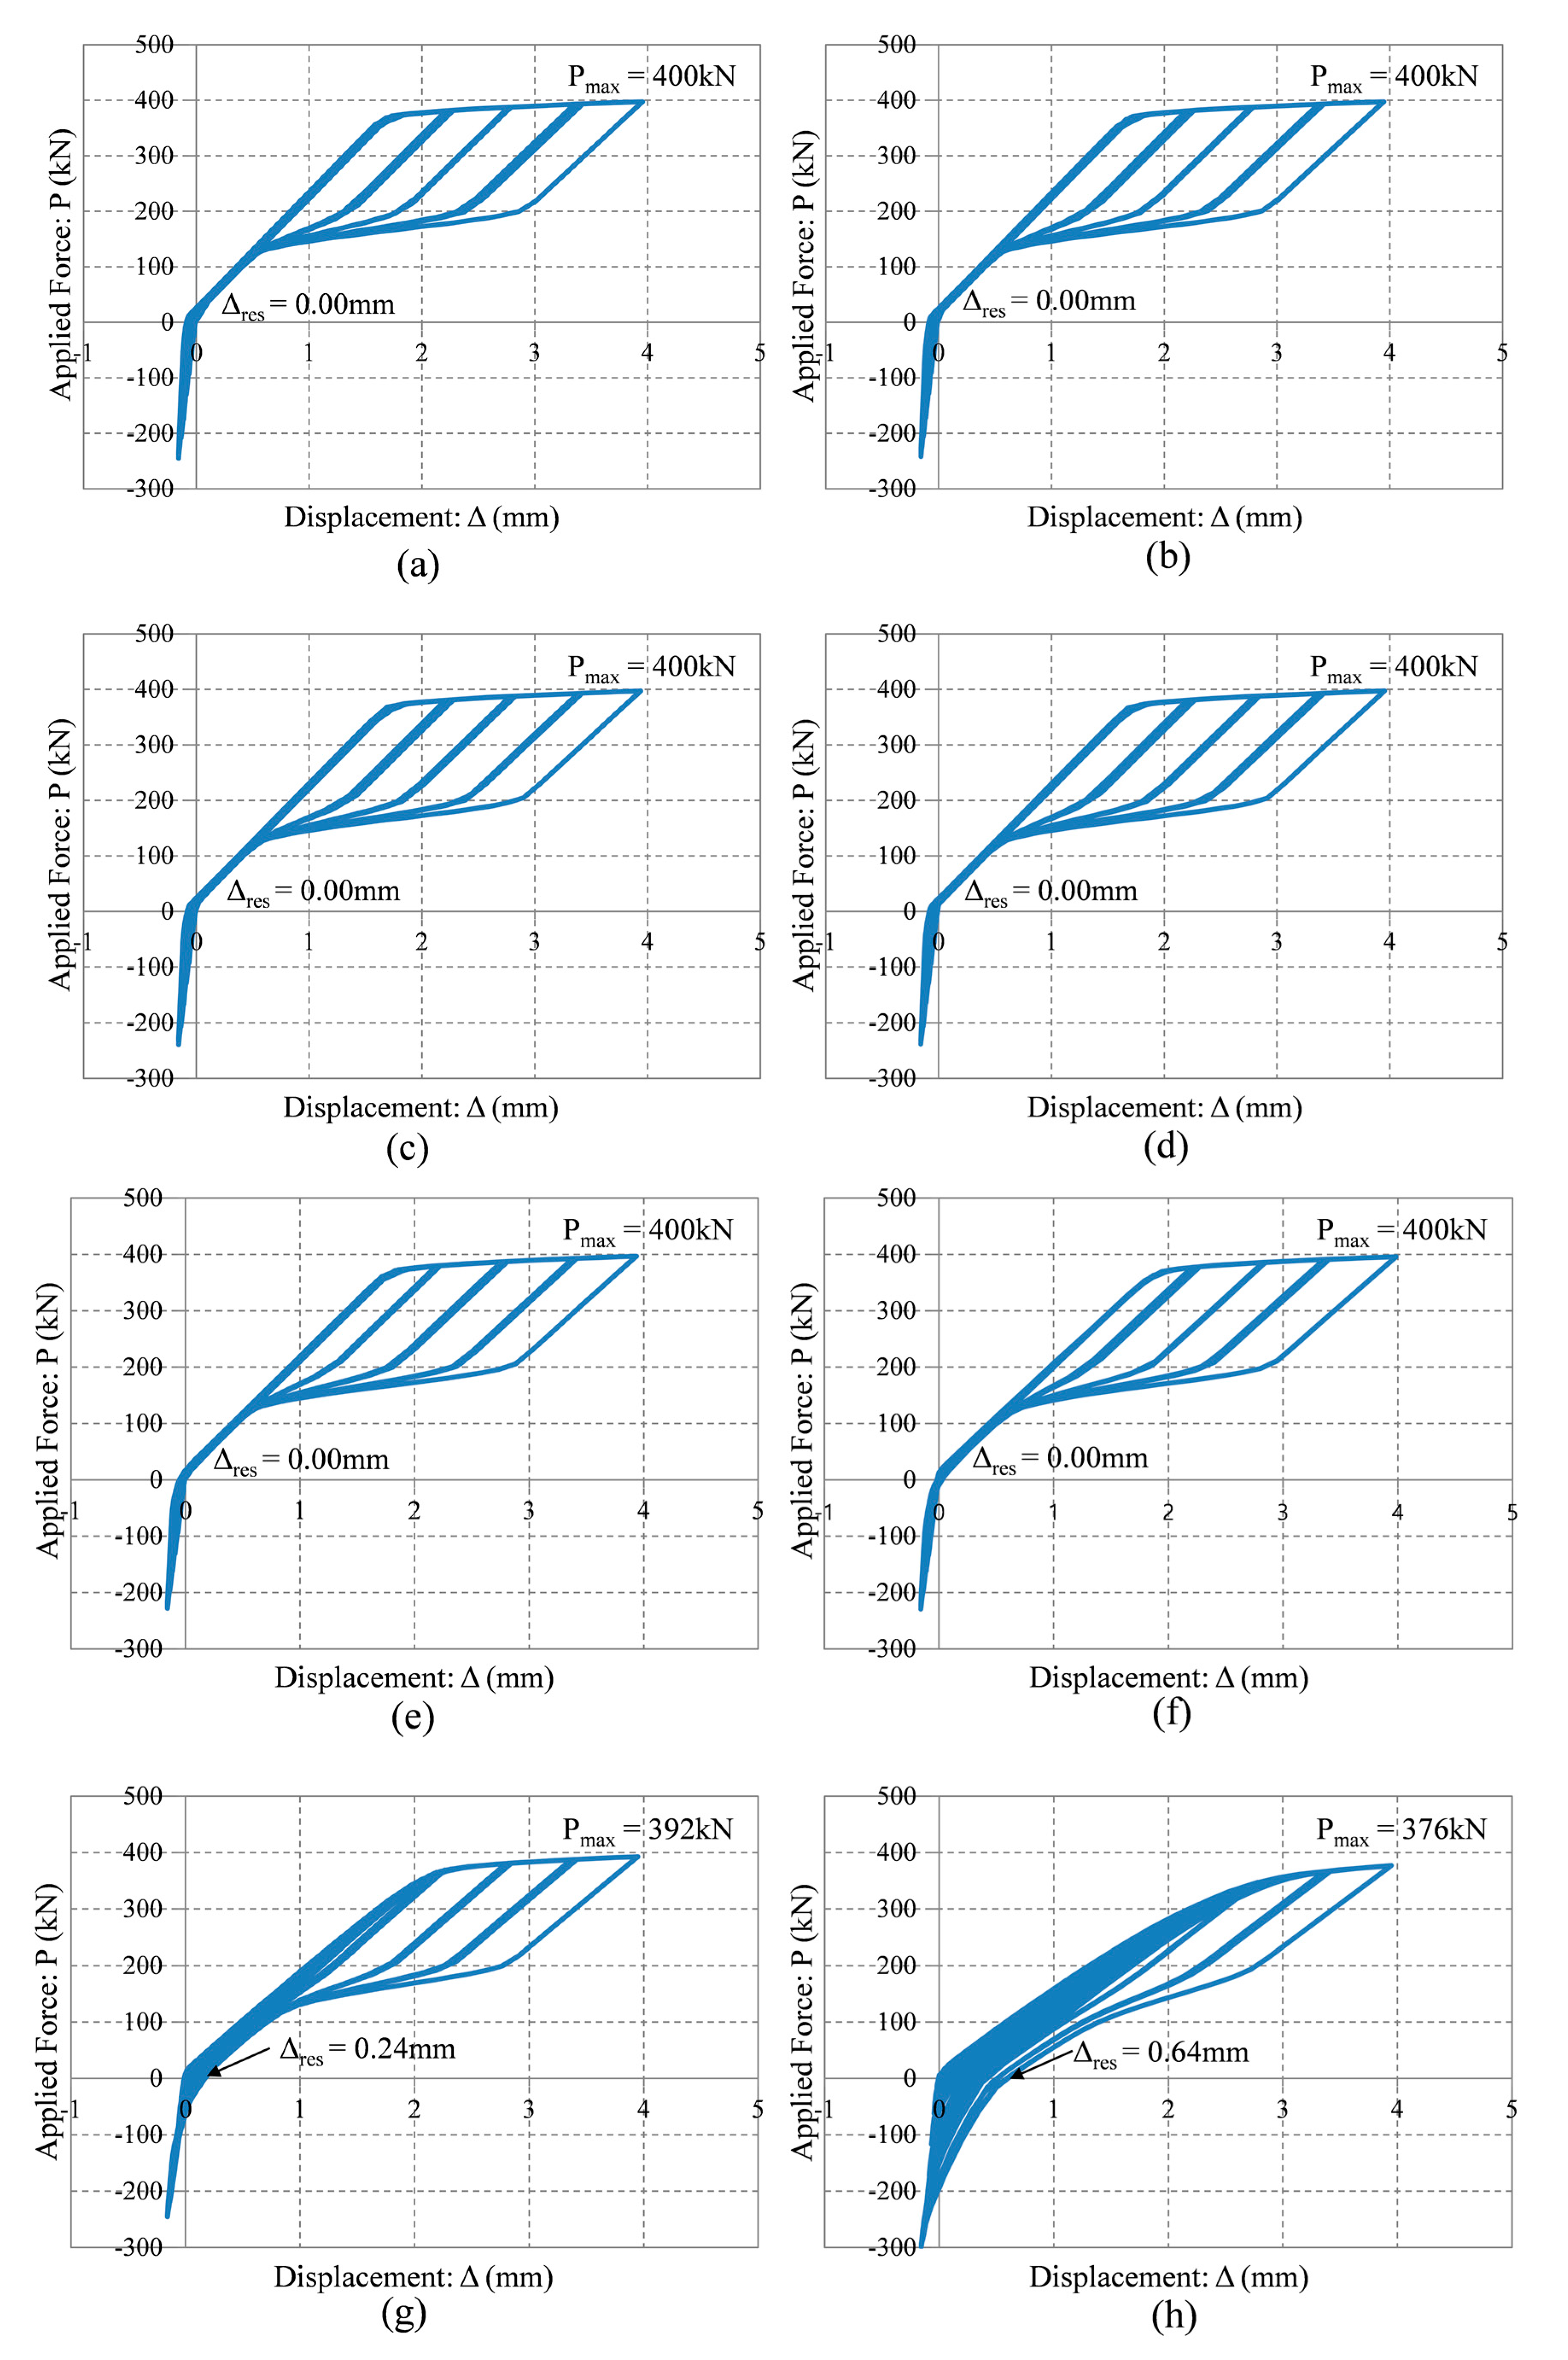
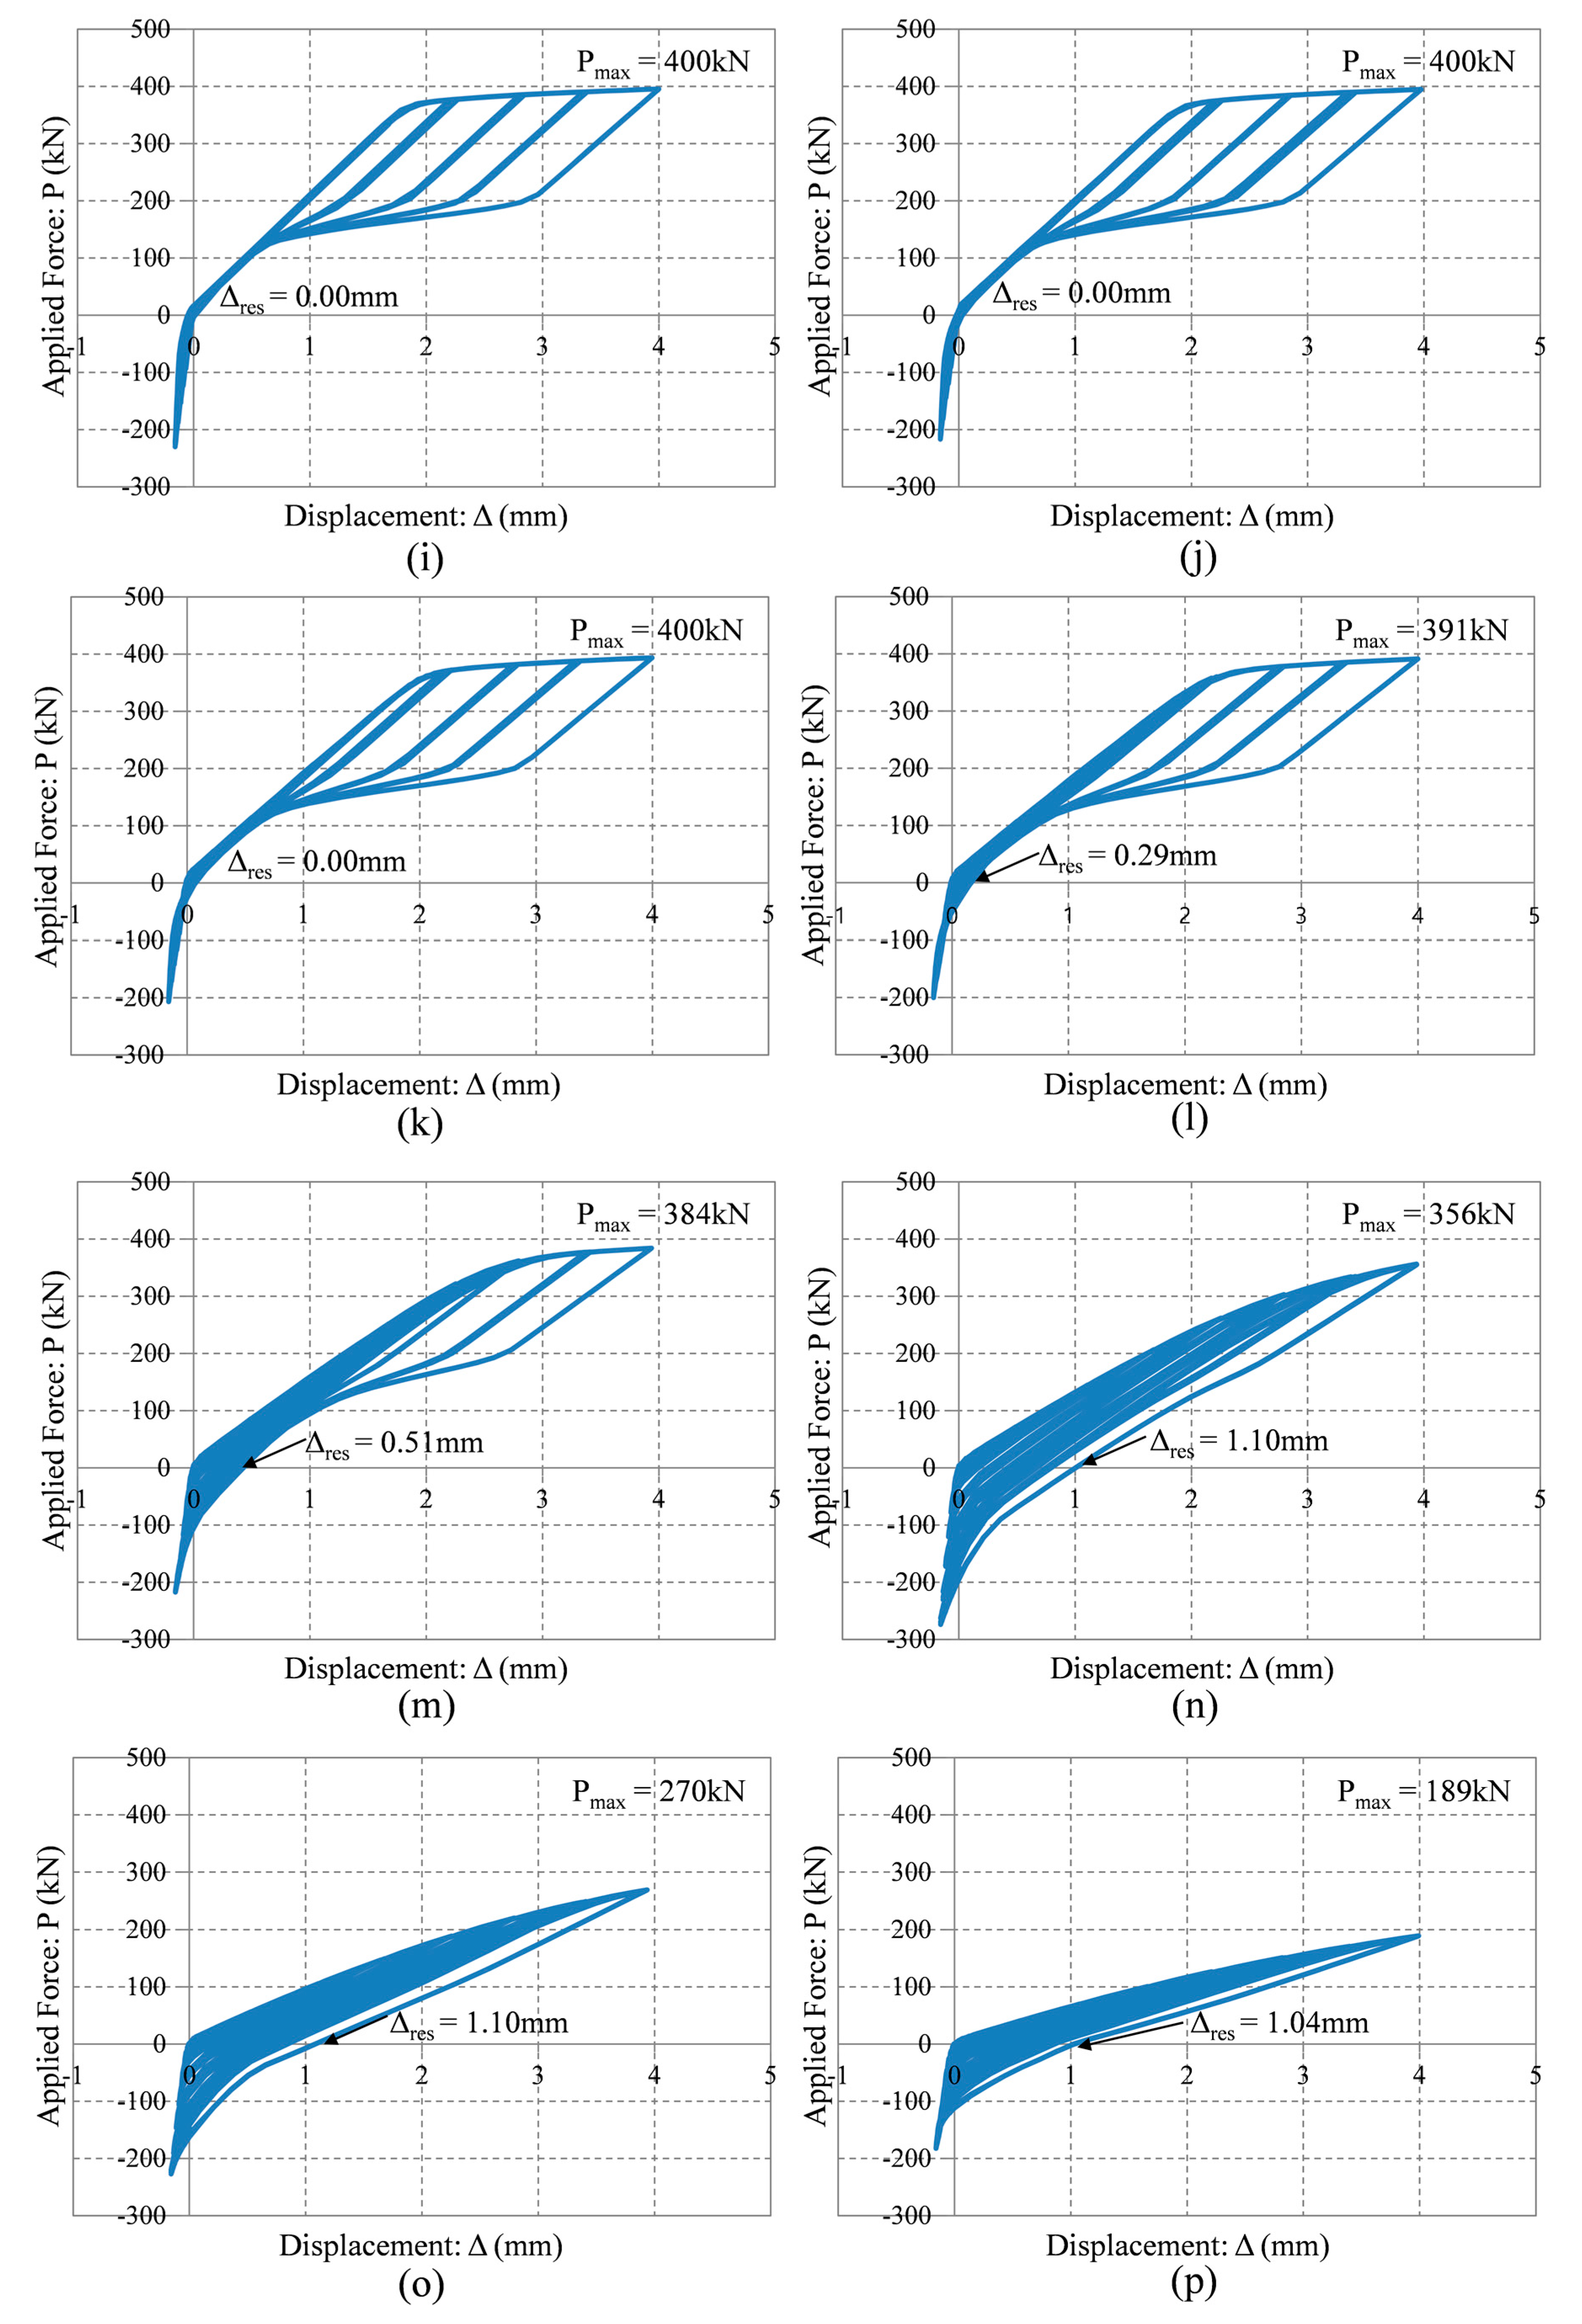
The behavior of the T-stub component models constructed with variable flange thickness and bolt gauge length was reproduced through advanced nonlinear FE analyses, and then their performance was appraised based on the observation of the analysis results according to design parameters. The intensity of the prying action mechanism as well as the magnitude of prying force will be evaluated by examining the deflection of the T-stub flange, which is measured at the specific loading points. The force and displacement curves simulated by FE analyses are presented in Figure 11. These curves are obtained by imposing the displacement-controlled loading history (see Figure 9) on the edge of the T-stub web. When applying 4 mm maximum displacement, residual displacements upon unlading (Δres) are also examined to assess recentering capability according to each model case. The Case 1 model as one of the representative cases with Mode 3 failure shape exhibits the flag-shaped hysteresis loop which completely coincides with the behavior of the superelastic SMA materials, and arrives at 400 kN maximum force under 4 mm displacement. Overall, the four models classified as the first group with Mode 3 failure shape (Case 1 to Case 4) completely recovered their original configuration without residual displacement, meaning that T-stub flanges maintain an elastic state throughout FE analyses and that plastic deformation concentrates on the superelastic SMA bolts. The yielding of the hysteresis loop generally occurs at approximately 380 kN force under below 1.7 mm. It is affirmed that these four models are able to permit 7 mm displacement to reach 430 kN force corresponding to ultimate strength capacity for superelastic SMA bolts, as considering their post-yield stiffness in the hysteresis loop.
As the parameter α is close to the unit, the T-stub component models that fail by Mode 2 failure shape begin to create residual displacement upon unloading. Furthermore, ultimate strength measured at 4 mm starts to decrease below 400 kN force. Although the T-stub component models whose the parameter α is close to zero arrive at 400 kN force under 4 mm displacement, they are not expected to reach the ultimate strength of the tension bolts (430 kN) due to flange yielding and bolt prying. There is a tendency to augment the amount of residual displacement and to reduce the capacity of the T-stub component when the parameter α regulated by flange thickness and bolt gauge length starts to increase. The T-stub component models which fail by Mode 1 failure shape exhibit strength capacity well below 400 kN force under 4 mm displacement, and engender considerable amount of residual displacement. Strength degradation mainly happens due to plastic hinge caused by the prying action mechanism on the T-stub flange. The Case 16 model which has the largest prying action present just generates 189 kN force at 4 mm displacement and as much as 4 mm residual displacement upon unloading. In addition to residual displacement, the lowering of the energy dissipation capacity represented by the area of the hysteresis loop can be attributed to the large amount of the prying action mechanism. As compared with the first group models with H1/H2 = 1/3, the second group models with relatively larger H1/H2 = 1/3 are prone to strength degradation and residual displacement under the same flange thickness because of more severe prying action.
4.2. Stress Filed Contours
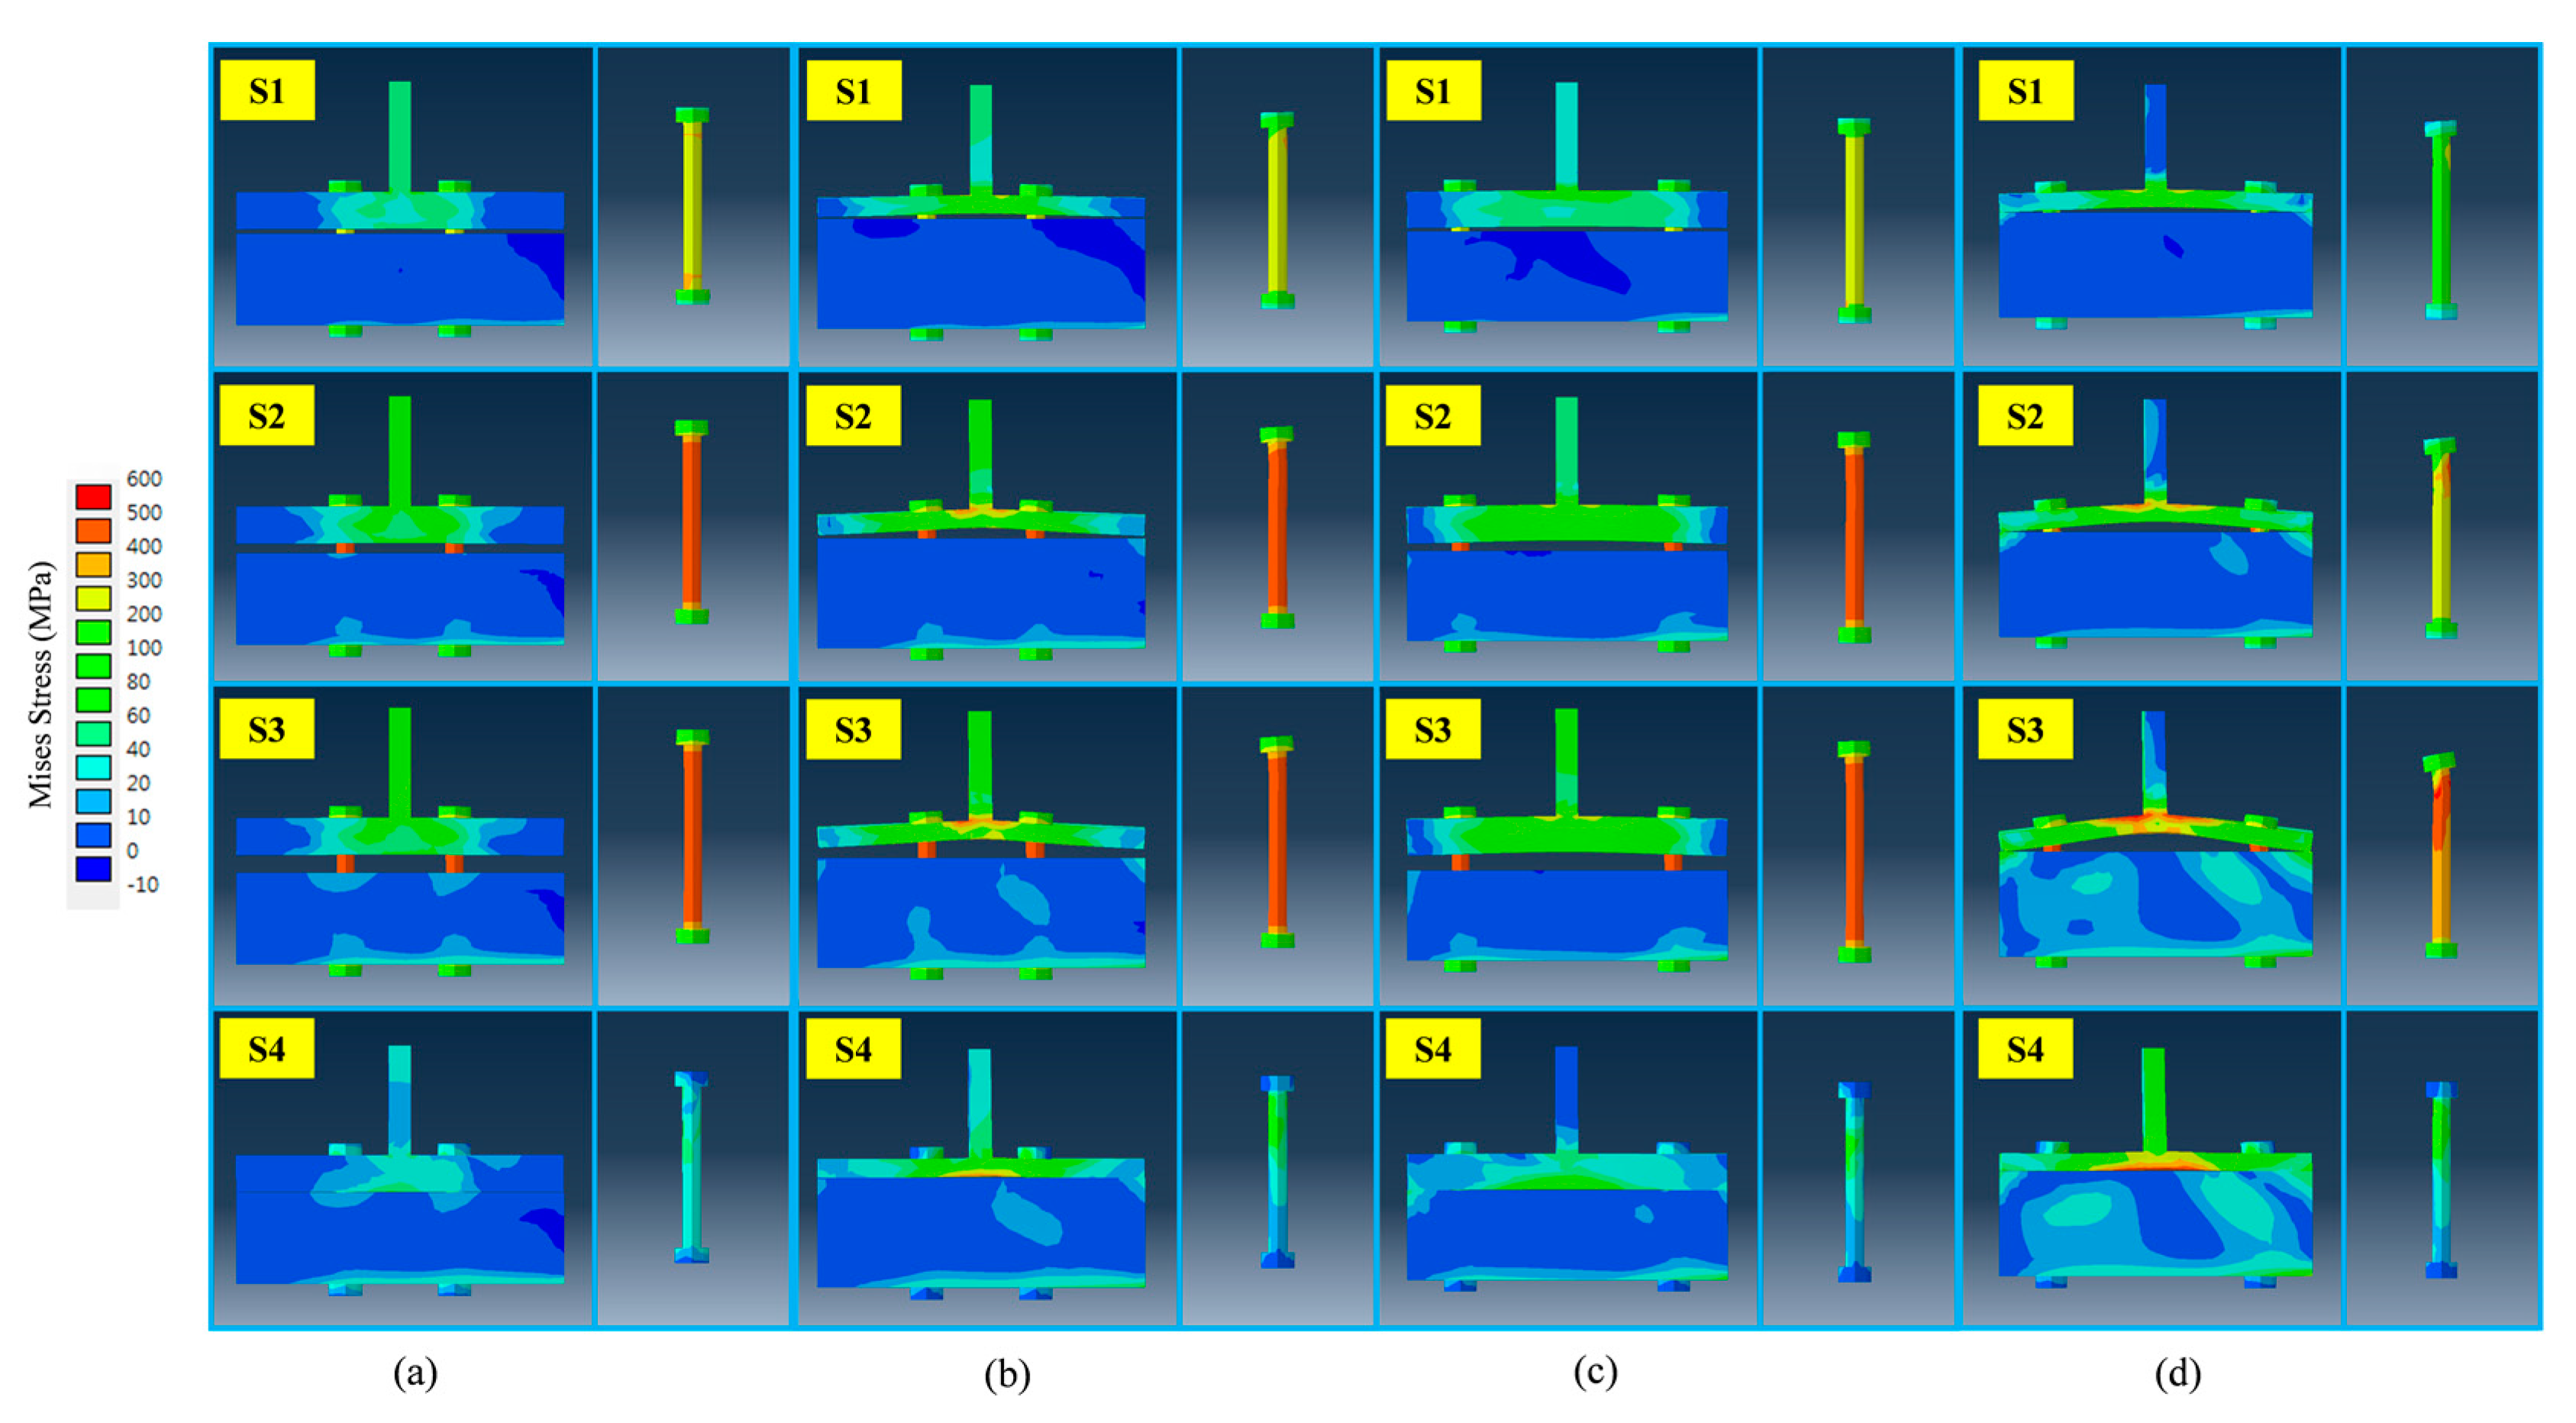
It is also necessary to check both deformed configurations and stress field contours so as to elucidate the response mechanism acting on the T-stub component. According to the individual displacement loading steps (S1 to S4 defined in Figure 9), stress field contours distributed over the T-stub components and deformed configurations with five times the deformation scale factor (DSF) are presented in Figure 12. The Case 3 model completely separates the T-stub flange from the column plate, and relatively thick flange thickness enables this model to maintain original configuration with nearly zero deflection. The stress field contours distributed over the Case 3 model show that the T-stub member remain elastic during all displacement loading steps. Instead, stress concentration takes place at the tension bolts subjected to axial force without bolt prying. The Case 7 model and the Case 11 model separate the T-stub flange from the column plate, but deformed like an arch with the distribution of slightly higher stress as compared to the Case 3 model. The T-stub flange of the Case 15 model subjected to Mode 1 failure shape is still attached to the column plate when even applied to 4 mm displacement loading. This model is perfectly bent as a bow by severe prying action, and plastic hinges are found at the stress filed contour distributed over the T-stub flange. Although the Case 7 model and the Case 15 model completely recover to original shape, residual stress greater than their yield stress is observed at the T-stub flange. Both models are prone to generating bending deflection arising due to the prying action mechanism, and susceptible to severe damage even under relatively small loading. It can be shown that the intensity of prying action on the T-stub flange leads to directly decreasing the capacity of the T-stub component. As we expect, superelastic SMA bolts show nearly zero residual stress at their original position (S4).
4.3. Recentering Capabilities of Shape Memory Alloy (SMA) Bolts
In this section, the behavior of the superelastic SMA bolts is required to be examined with an intention to verify the adequacy of FE modeling and to clarify the response of the T-stub component, including energy dissipation capacity. The T-stub members presented herein are connected to the column plates by using four superelastic SMA bolts. The average bolt reaction force versus uplift displacement curves for four model cases selected in this study are presented in Figure 13. The T-stub component models with Mode 3 failure shape indicating relatively smaller prying action response display good energy dissipation at the behavior of the superelastic SMA bolts. For instance, the Case 3 model has the largest area of the hysteresis loop standing for energy dissipation capacity while the Case 15 model dissipate nearly zero amount of kinetic energy within the elastic range. In the Case 3 model, the maximum bolt uplift is able to reach almost 4 mm displacement, equal to the maximum displacement load because the superelastic SMA bolts majorly undergo axial force without bolt prying. Small discrepancy only results from the deformation of the T-stub web. On the other hand, the maximum bolt uplift of the Case 15 model only reaches 1.5 mm under maximum displacement loading, indicating that most of the deformable contributions may be attributed to the deformation of the T-stub flange arising due to prying. For these reasons, the Case 3 model that can produce the largest bolt uplift among other models makes the best use of recentering and energy dissipation, which are supplied by the superelastic SMA bolts.
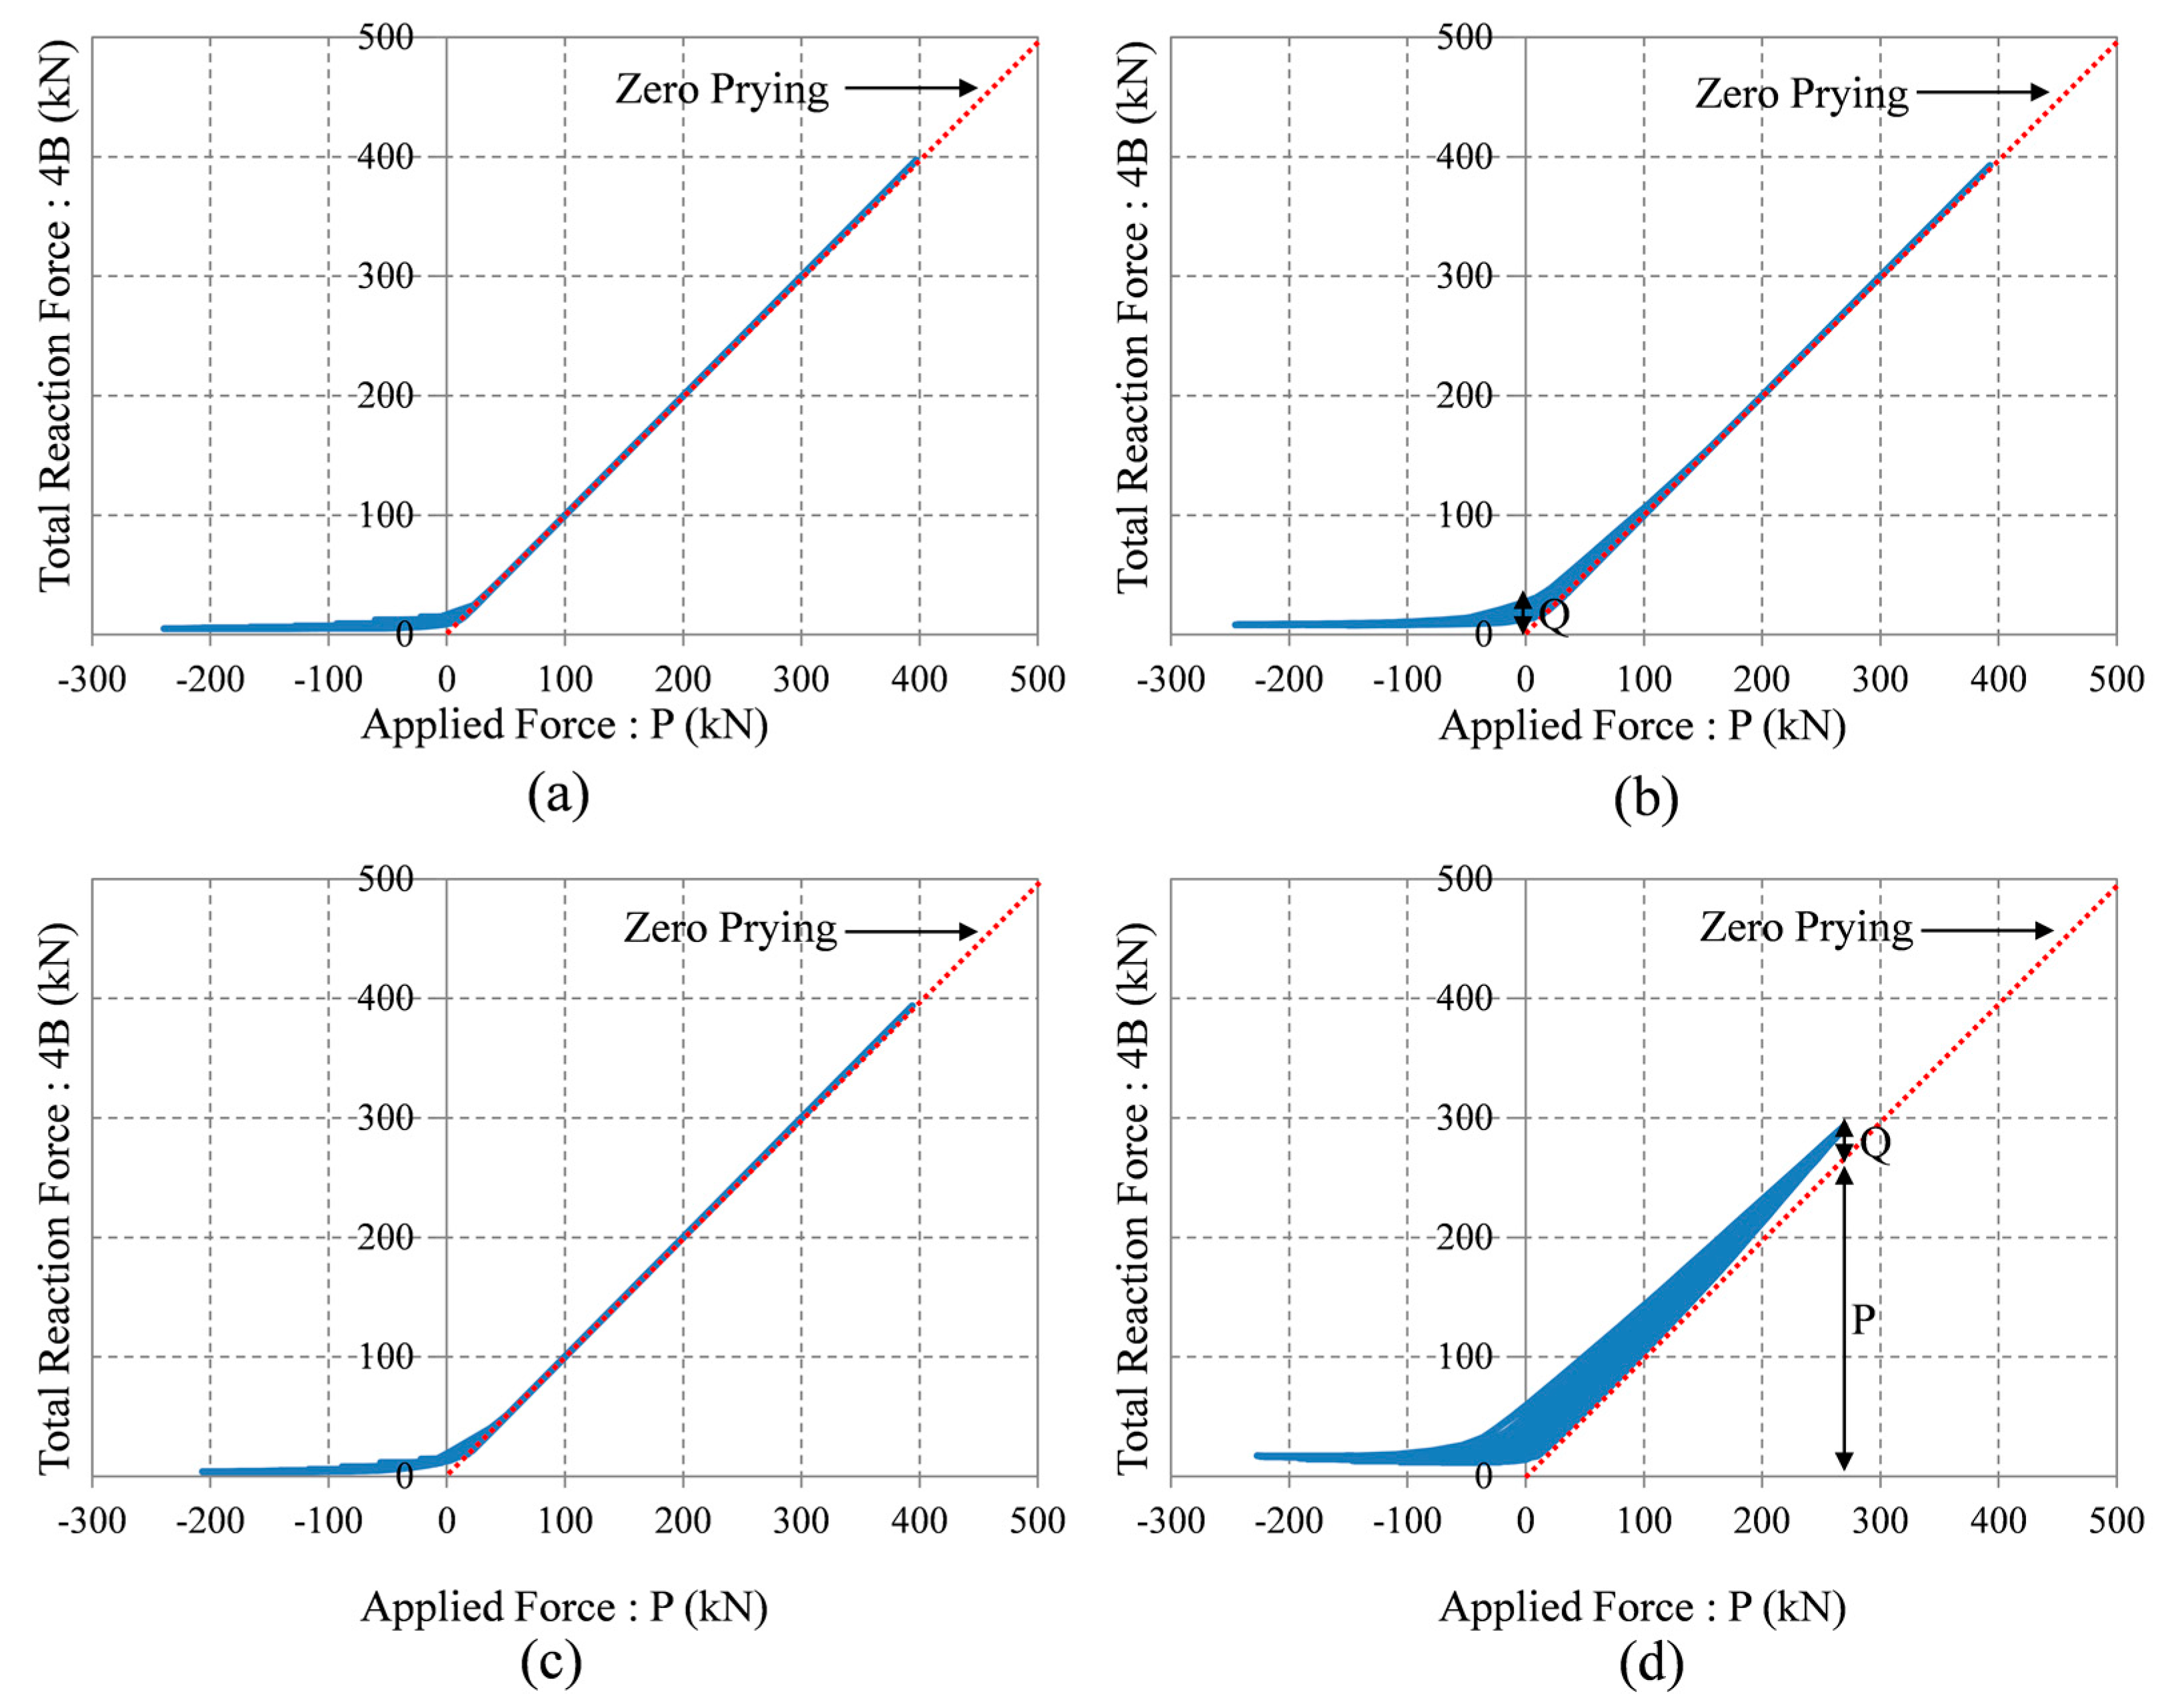
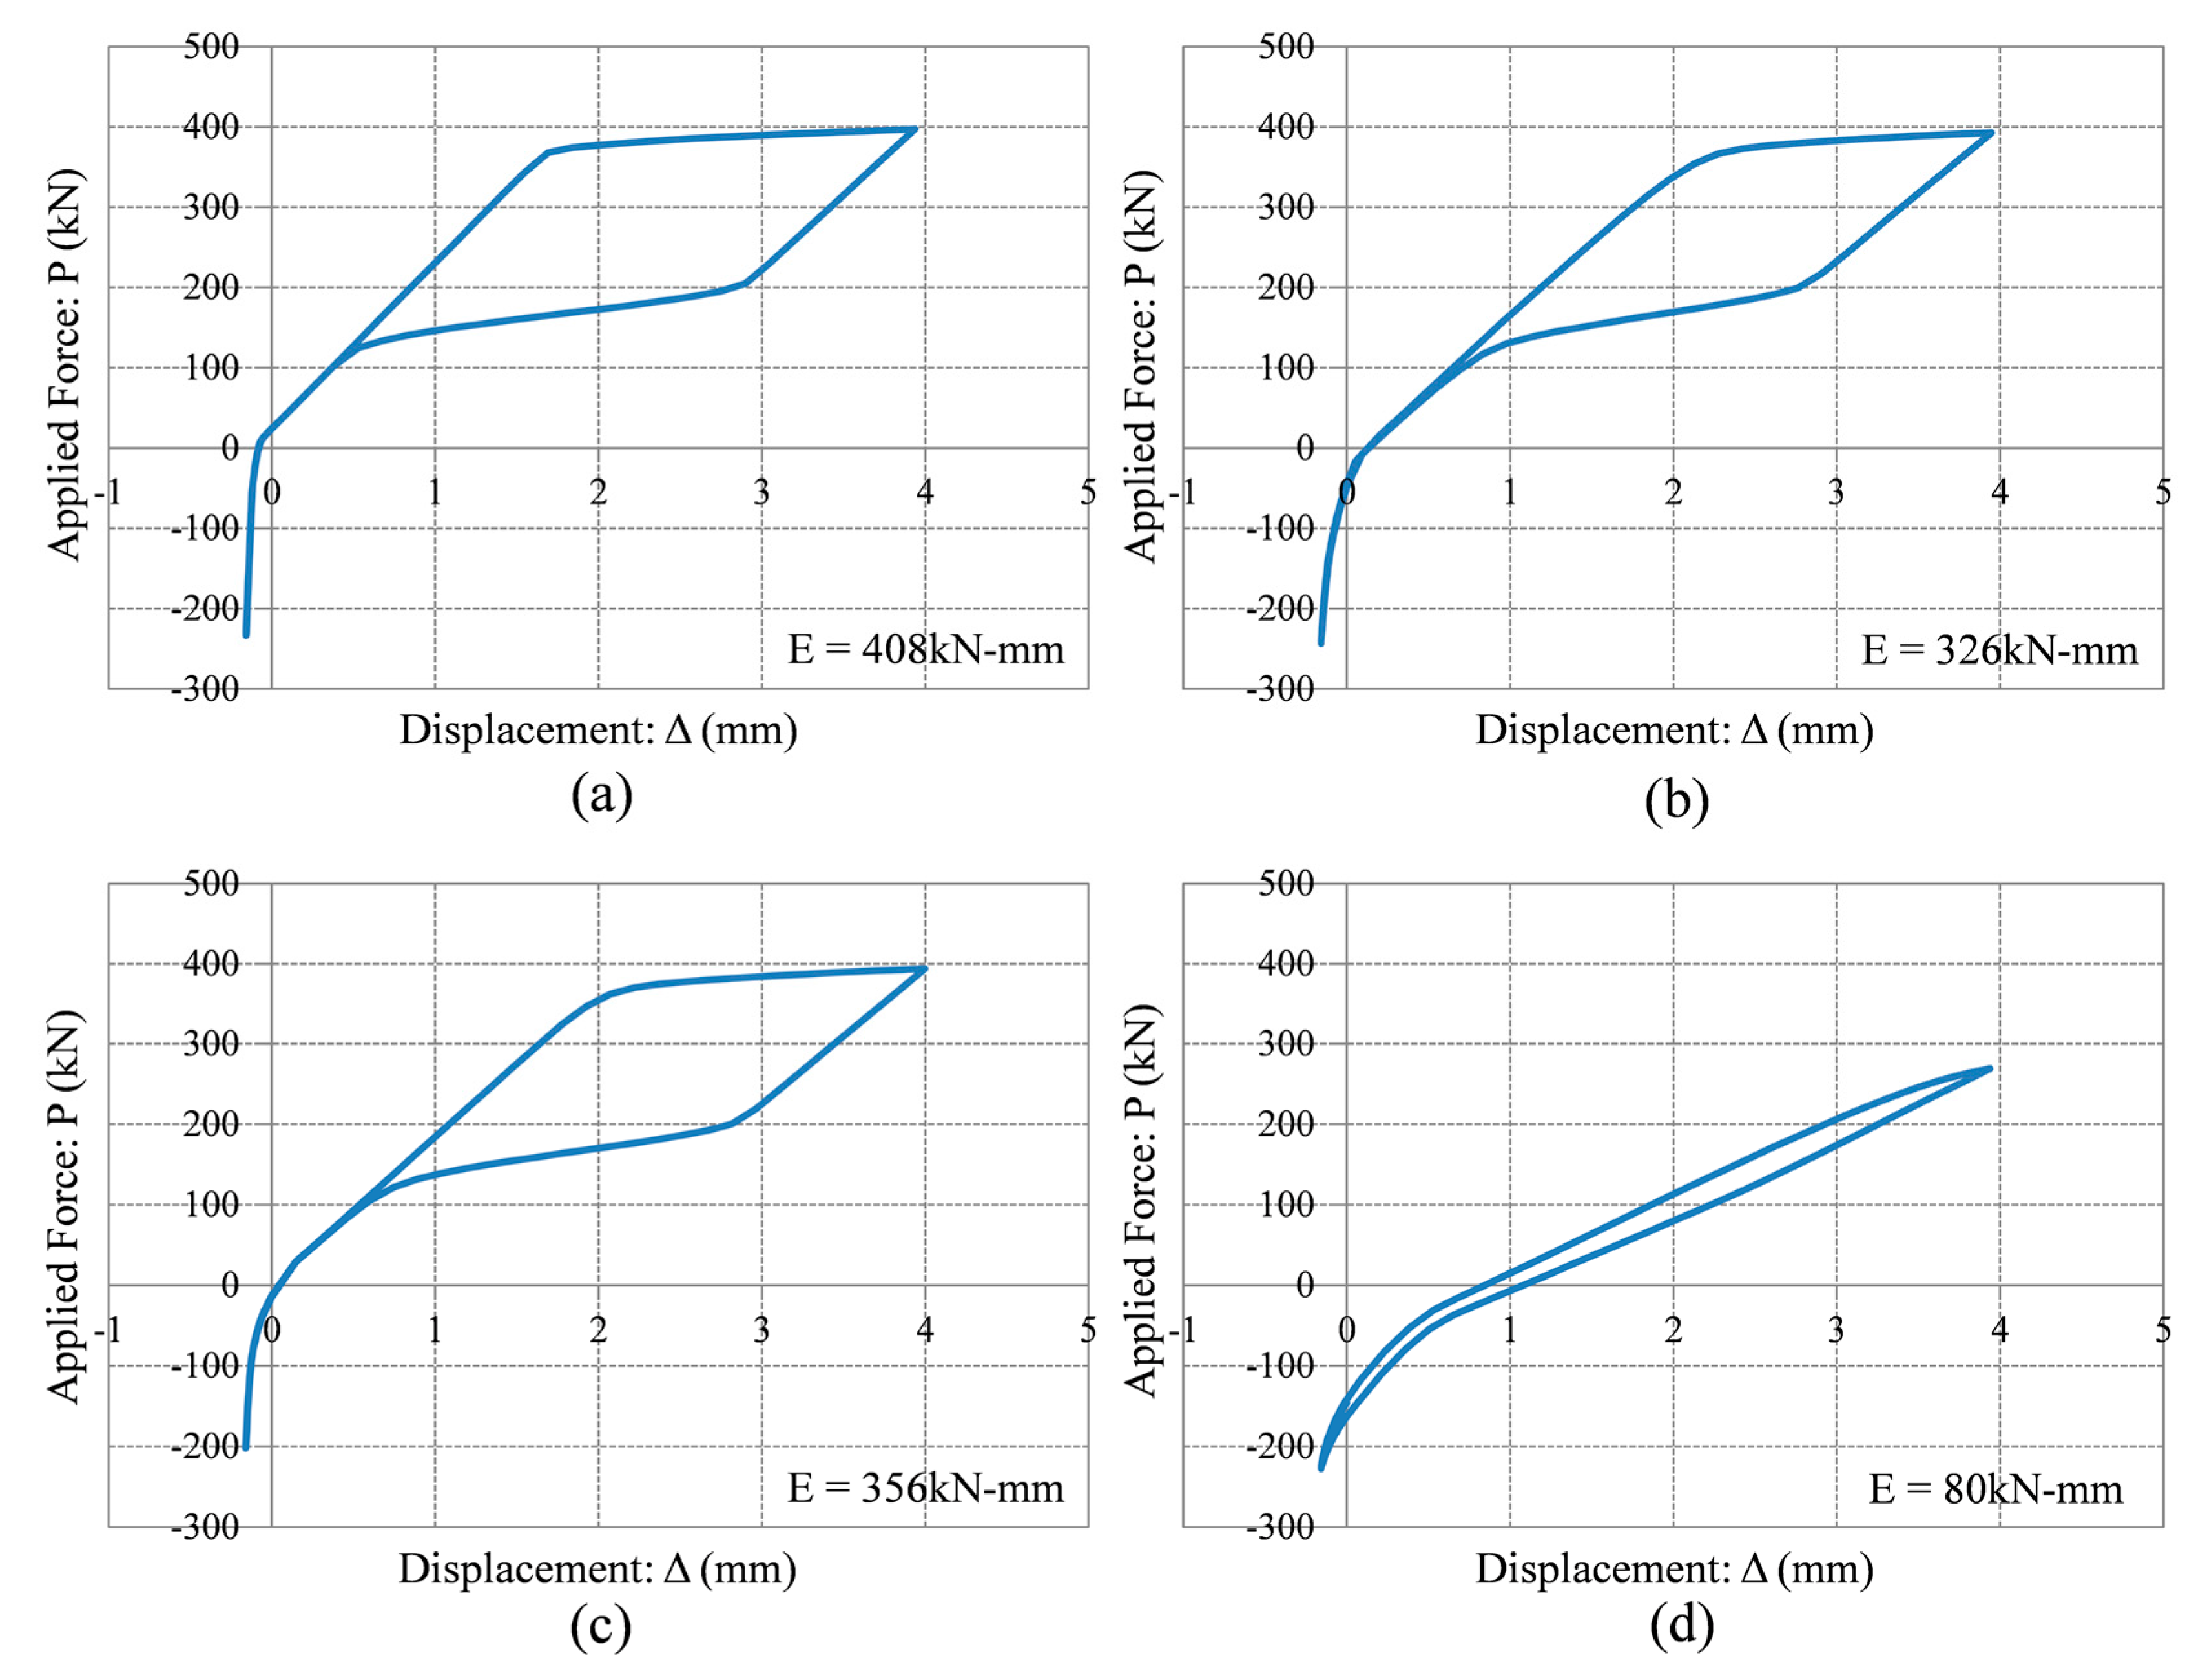
For another performance examination, the total bolt reaction force versus applied force curves are presented in Figure 14. The force versus displacement curves for the T-stub component under the last cycle of the displacement loading history are presented in Figure 15. The energy dissipation capacity of the T-stub component models can be evaluated by computing the area of these curves. The zero prying lines indicating P = ΣB are also plotted as the red dotted lines. The total bolt reaction forces (4B) begin at the non-zero value because of initial bolt pretension, and then gradually increase as the forces applied to the T-stub web ascend. In the beginning of the displacement loading history, prying force (Q) acting on the edge of the T-stub flange increases owing to the initial bolt pretension [22]. However, except for the Case 15 model, the effect of prying force gradually dwindles away to nothing as the displacement loading history goes on. Finally, applied force coincides with total bolt reaction force, thereby meeting the equilibrium state. The Case 15 model can preserve prying force even under the last cycle of the displacement loading history, and thus meets the equilibrium conditions defined in Equation (3). When compression force is imposed on the T-stub component, the T-stub flange is subjected to bearing compression. This bearing compression leads to the applied force increasing very quickly, but has no influence on the bolt reaction force.
4.4. Energy Dissipation Capacity of T-Stub Components
As shown in Figure 15, the Case 3 model possesses the best energy dissipation capacity, while the Case 15 model possesses the least energy dissipation capacity at the hysteresis loop. In particular, the behavior of the Case 3 model is very similar to the behavior of the superelastic SMA bolts combined in parallel, which is characterized by the flag-shaped hysteresis loop. In addition to recentering, the kinetic energy dissipated in the T-stub component mainly results from the response of the superelastic SMA bolts rather than the metallic yielding of the T-stub flange. Accordingly, optimal design methodology that makes the best use of recentering capability and energy dissipation capacity at the smart recentering T-stub component can be achieved by concentrating plastic deformation on the superelastic SMA bolts, and simultaneously other component members shall be designed to maintain the elastic condition.
5. Concluding Remarks
In this study, T-stub components that are subjected to axial couple forces converted from bending moment usually acting on the bolted PR connection are designed, and then new smart recentering T-stub components utilizing superelastic SMA bolts are proposed with an aim to enhance their recentering capability. The T-stub component models are constructed with different design parameters such as flange thickness and bolt gauge length. Instead of conducting the experimental tests, the behavior of such T-stub components is simulated by the FE analyses. Including the capacity of the T-stub component, recentering capability and energy dissipation capacity can be determined by the prying action mechanism regulated by the design parameters used. The T-stub component models designed with thinner flange thickness and longer bolt gauge length have a relatively smaller strength capacity due to the occurrence of flange yielding as the preliminary failure mode, and do not generate adequate deformation of the tension bolts. However, the T-stub models with thick flange thickness and short bolt gauge length lead to ultimate bolt fractures arising due to axial force instead of bolt prying, and thus accommodate enough resistance against external force. These models can effectively reduce the residual displacement by appropriately utilizing recentering and energy dissipation provided by the superelastic SMA bolts, and can behave as a flag-shaped hysteresis loop. Therefore, smart recentering T-sub components equipped with superelastic SMA bolts should be constructed based on the design concept that plastic deformation only concentrates on the tension bolts in order to maximize their performance with respect to recentering and energy dissipation.
Acknowledgments
This research was supported by a grant (17CTAP-C129811-01) from the Land Transport Technology Promotion Research Project Program, funded by the Ministry of Land, Infrastructure, and Transport of the Korean government.
Author Contributions
Jong Wan Hu and Kyoung-Hwan Kim conducted finite element analysis, and checked finite element analysis results. Jong Wan Hu and Junwon Seo wrote the manuscript.
Conflicts of Interest
The authors declare no conflict of interest.
References
- Leon, R.T.; Hajjar, J.F.; Gustafson, M.A. Seismic response of composite moment-resisting connections I: Performance. ASCE J. Struct. Eng. 1998, 124, 868–876. [Google Scholar] [CrossRef]
- Green, T.P.; Leon, R.T.; Rassati, G.A. Bidirectional tests on partially restrained, composite beam-column connections. ASCE J. Struct. Eng. 2004, 130, 320–327. [Google Scholar] [CrossRef]
- Hu, J.W.; Kang, Y.S.; Choi, D.H.; Park, T. Seismic design, performance, and behavior of composite-moment frames with steel beam-to-concrete filled tube column connections. KSSC Int. J. Steel Struct. 2010, 10, 177–191. [Google Scholar] [CrossRef]
- Hu, J.W.; Leon, R.T. Analyses and evaluations for composite-moment frames with SMA PR-CFT connections. Nonlinear Dyn. 2011, 65, 433–455. [Google Scholar] [CrossRef]
- Hu, J.W.; Kim, D.; Choi, E. Numerical investigation on the cyclic behavior of smart recentering clip-angle connections with superelastic shape memory alloy fasteners. Proc. Inst. Mech. Eng. Part C J. Mech. Eng. Sci. 2013, 227, 1315–1327. [Google Scholar] [CrossRef]
- Hu, J.W.; Choi, E.; Leon, R.T. Design, analysis, and application of innovative composite PR connections between steel beams and CFT columns. Smart Mater. Struct. 2011, 20, 025019. [Google Scholar] [CrossRef]
- Swanson, J.A.; Leon, R.T. Bolted steel connections: Tests on T-stub components. ASCE J. Struct. Eng. 2000, 126, 50–56. [Google Scholar] [CrossRef]
- Swanson, J.A.; Leon, R.T. Stiffness modeling of bolted T-stub connection components. ASCE J. Struct. Eng. 2001, 127, 498–505. [Google Scholar] [CrossRef]
- Hu, J.W. Seismic Performance Evaluations and Analyses for Composite Moment Frames with Smart SMA PR-CFT Connections. Ph.D. Thesis, Georgia Institute of Technology, Atlanta, GA, USA, April 2008. [Google Scholar]
- Leon, R.T. Seismic Performance of Bolted and Riveted Connections. Background Reports: Metallurgy, Fracture Mechanics, Welding, Moment Connections, and Frame System Behavior; FEMA Publication No. 288; Federal Emergency Management Association (FEMA): Washington, DC, USA, 1997. [Google Scholar]
- Leon, R.T. Analysis and design problems for PR composite frames subjected to seismic loads. Eng. Struct. 1998, 20, 364–371. [Google Scholar] [CrossRef]
- Hu, J.W. Seismic analysis and parametric study of SDOF lead-rubber bearing (LRB) isolation systems with recentering shape memory alloy (SMA) bending bars. J. Mech. Sci. Technol. 2016, 30, 2987–2999. [Google Scholar] [CrossRef]
- Song, G.; Ma, N.; Li, H. Applications of shape memory alloys in civil structures. Eng. Struct. 2006, 28, 1266–1274. [Google Scholar] [CrossRef]
- DesRoches, R.; McCormick, J.; Delemont, M. Cyclic properties of superelastic shape memory alloy wires and bars. ASCE J. Struct. Eng. 2004, 130, 38–46. [Google Scholar] [CrossRef]
- Amin, M.; Ghassemieh, M. Shape memory alloy-based moment connections with superior self-centering properties. Smart Mater. Struct. 2016, 25, 075028. [Google Scholar]
- Yang, G.; Lee, D.H. Method for increasing the energy dissipation capacity of T-stub connections. Int. J. Steel Struct. 2015, 15, 595–603. [Google Scholar] [CrossRef]
- Abolmaali, A.; Treadway, J.; Aswath, P.; Lu, F.K.; McCarthy, E. Hysteresis behavior of T-stub connections with superelastic shape memory fasteners. J. Construct. Steel Res. 2006, 62, 831–838. [Google Scholar] [CrossRef]
- American Institute of Steel Construction (AISC). Manual of Steel Construction: Load and Resistance Factor Design (LRFD), 3rd ed.; American Institute of Steel Construction (AISC): Chicago, IL, USA, 2001. [Google Scholar]
- Kulak, G.L.; Fisher, J.W.; Struik, J.H.A. Guide to Design Criteria for Bolted and Riveted Joint, 2nd ed.; John Wiley & Sons: Hoboken, NJ, USA, 1987. [Google Scholar]
- Abaqus, version 6.12; Standard User’s Manual; Simulia: Pawtucket, RI, USA, 2012.
- Auricchio, F.; Sacco, E. A one-dimensional model for superelastic shape-memory alloys with different properties between martensite and austenite. Int. J. Non-Linear Mech. 1997, 32, 1101–1114. [Google Scholar] [CrossRef]
- Croccolo, D.; De Agostinis, M.; Fini, S.; Olmi, G. Tribological properties of bolts depending on different screw coatings and lubrications: An experimental study. Tribol. Int. 2017, 107, 199–205. [Google Scholar] [CrossRef]
Figure 1.
Temperature-dependent stress and strain curves for SMA (shape memory alloy) materials.
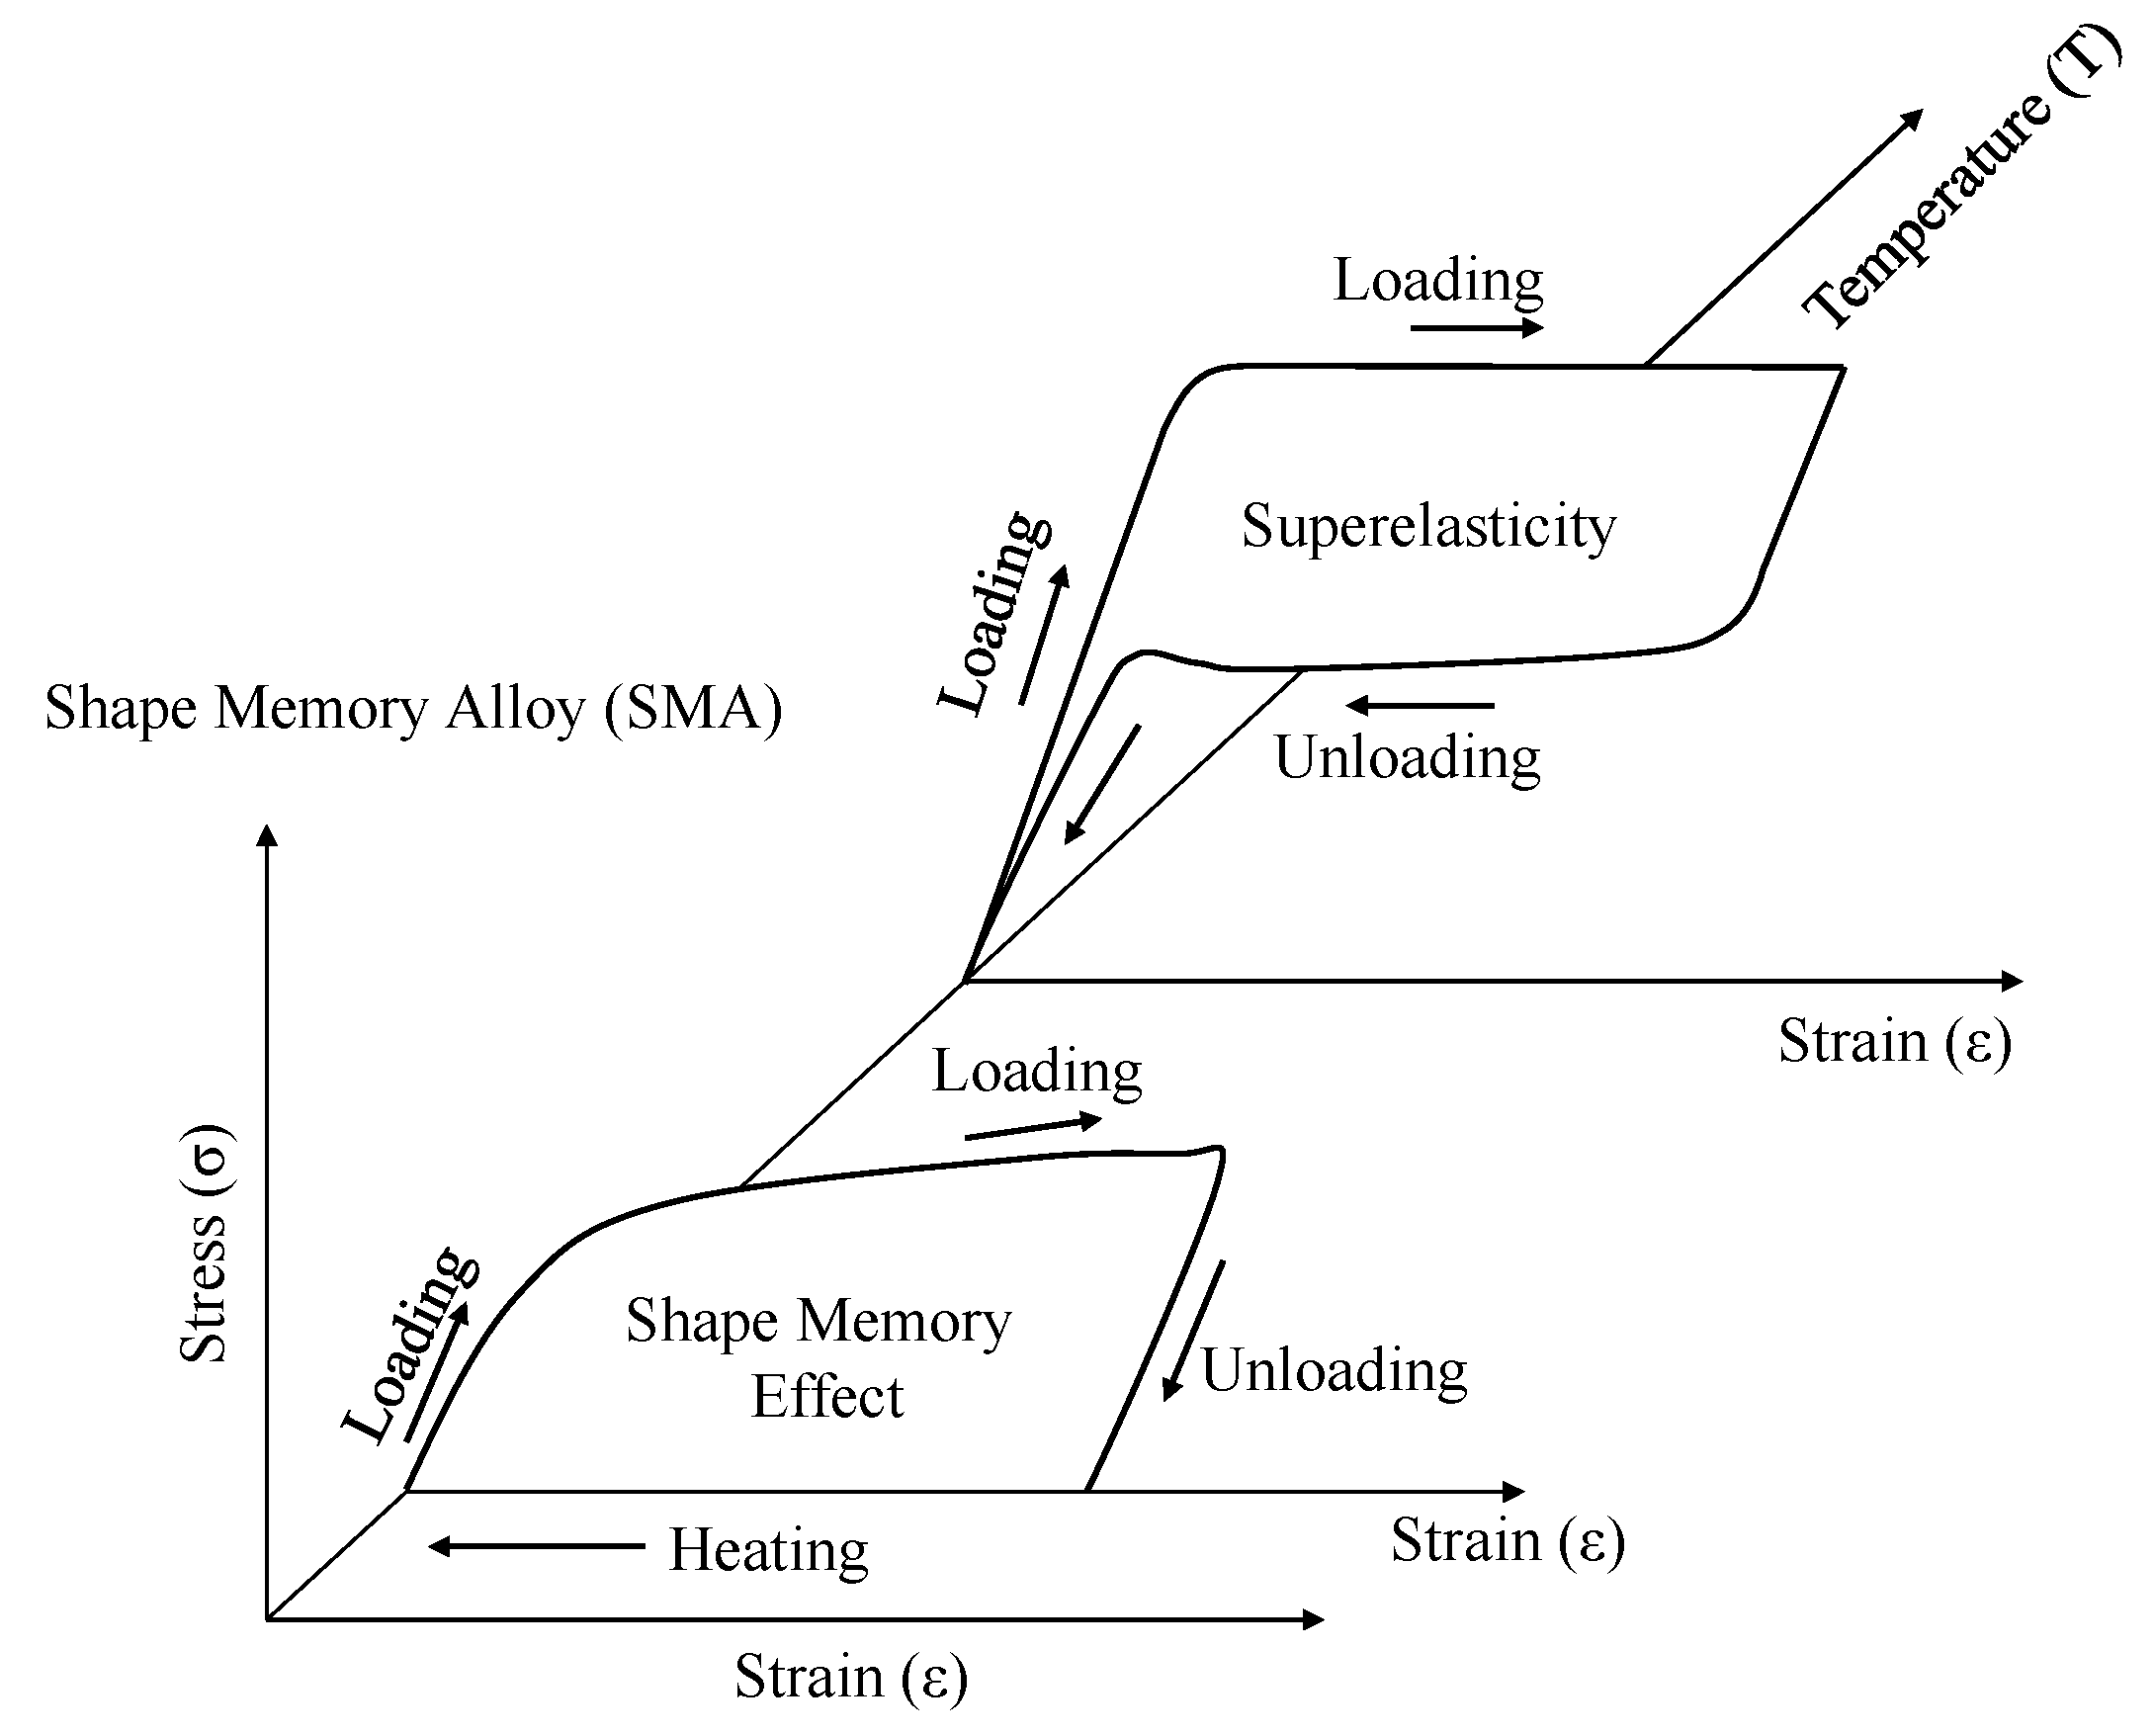
Figure 2.
Schematic of the T-stub component and connection.

Figure 3.
Typical prying action mechanism: (a) Prying action mechanism; (b) geometric definition.

Figure 4.
Three possible failure modes: (a) Mode 1 (α > 1); (b) Mode 2 (0 < α ≤ 1); (c) Mode 3 (α ≤ 0).
Figure 4.
Three possible failure modes: (a) Mode 1 (α > 1); (b) Mode 2 (0 < α ≤ 1); (c) Mode 3 (α ≤ 0).

Figure 5.
General solution for the failure modes according to increasing flange thickness.
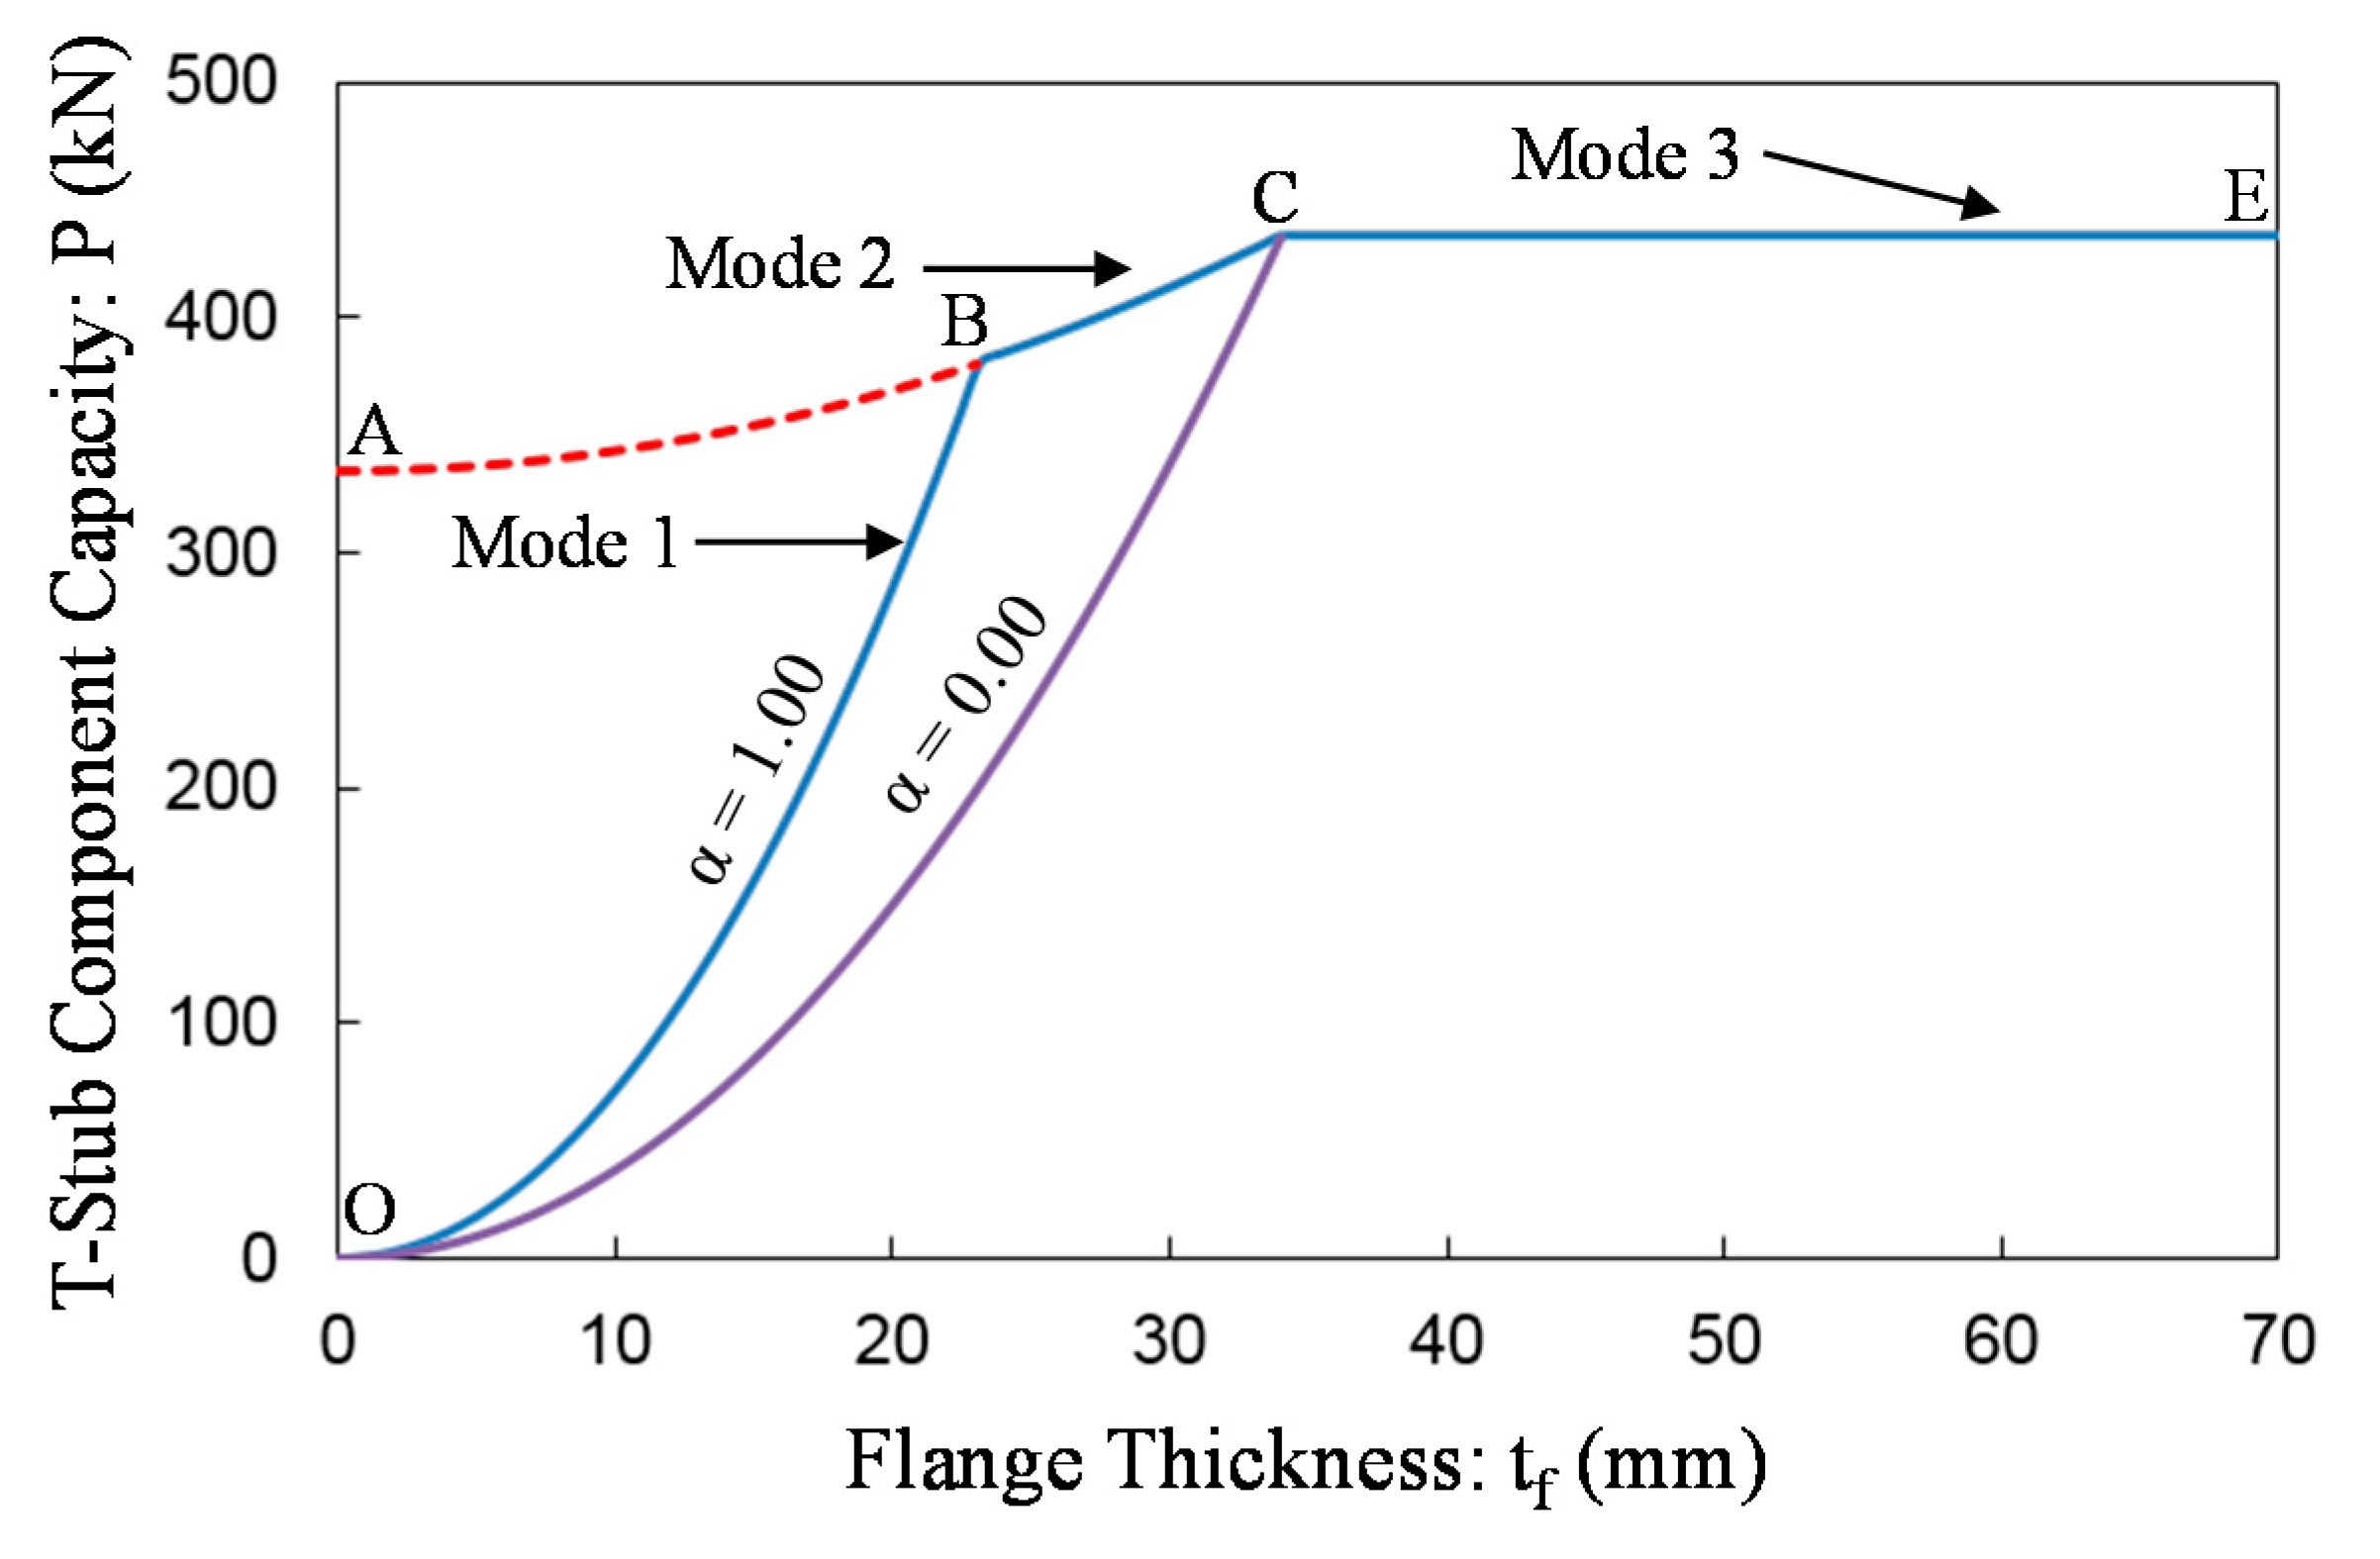
Figure 6.
Component details: (a) Front view; (b) side view; (c) plan view; (d) test setup.

Figure 7.
Design results based on prying action mechanism: (a) Case-3; (b) Case-7; (c) Case-11; (d) Case-15.
Figure 7.
Design results based on prying action mechanism: (a) Case-3; (b) Case-7; (c) Case-11; (d) Case-15.
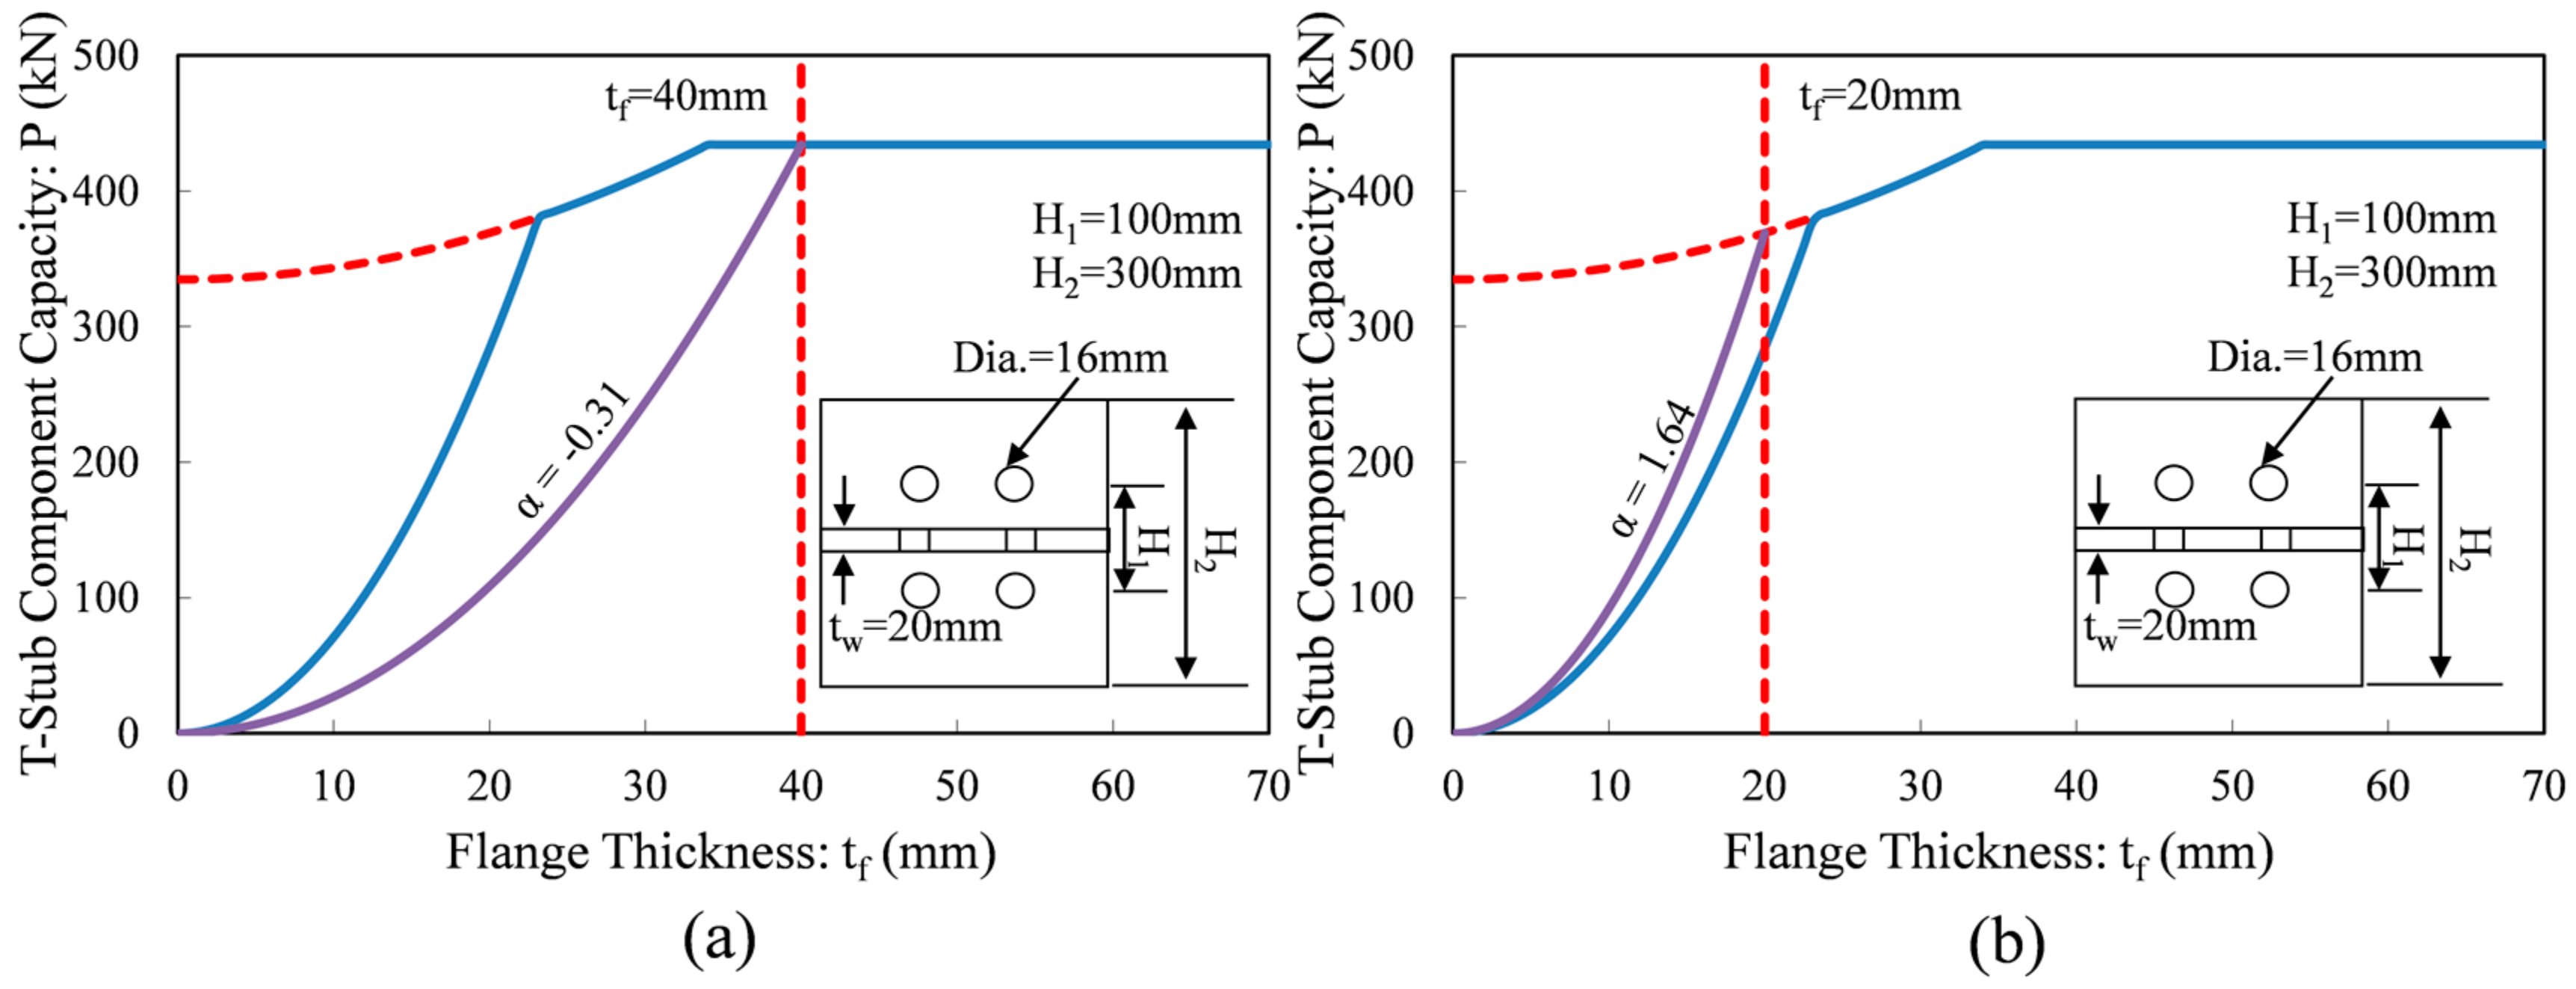

Figure 8.
3D FE (Finite element) models (Case 3 models): (a) Element mesh; (b) loading and BCs (boundary conditions) of front view; (c) loading and BCs (boundary conditions) of side view.
Figure 8.
3D FE (Finite element) models (Case 3 models): (a) Element mesh; (b) loading and BCs (boundary conditions) of front view; (c) loading and BCs (boundary conditions) of side view.

Figure 9.
Displacement loading history.

Figure 10.
Material properties of SMA materials: (a) Experimental curve; (b) simulated curve.
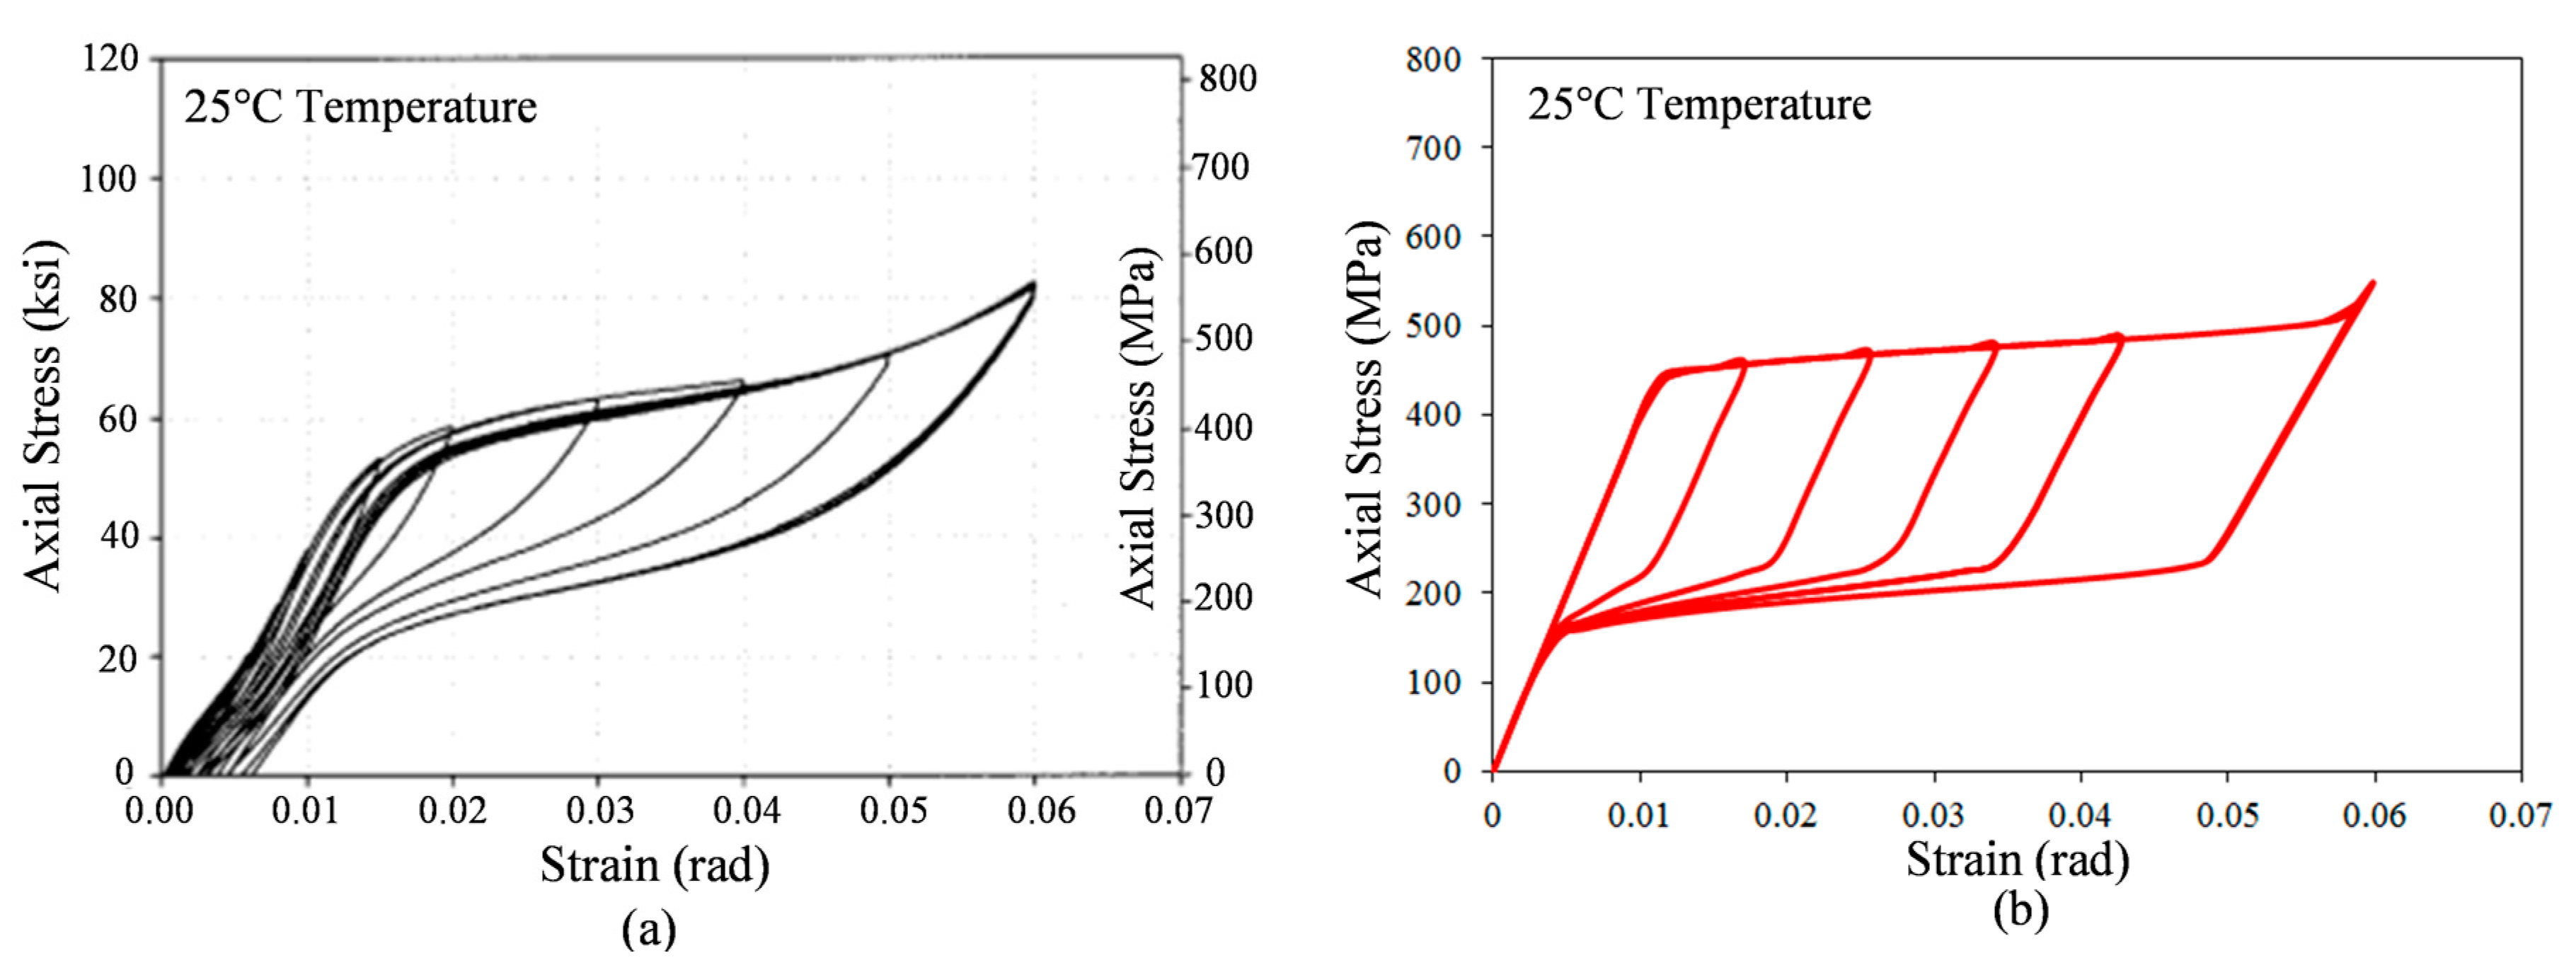
Figure 11.
Total displacement and force curves for the 16 model cases: (a) Case-1 (α = −0.60); (b) Case-2 (α = −0.48); (c) Case-3 (α = −0.31); (d) Case-4 (α = −0.06); (e) Case-5 (α = 0.25); (f) Case-6 (α = 0.74); (g) Case-7 (α = 1.64); (h) Case-8 (α = 3.58); (i) Case-9 (α = 0.09); (j) Case-10 (α = 0.22); (k) Case-11 (α = 0.40); (l) Case-12 (α = 0.66); (m) Case-13 (α = 1.06); (n) Case-14 (α = 1.74); (o) Case-15 (α = 2.98); (p) Case-16 (α = 5.65).


Figure 12.
Von Mises stress contours and deformation configurations (DSF = 5.0; DSF: Deformation scale factor): (a) Case-3; (b) Case-7; (c) Case-11; (d) Case-15.
Figure 12.
Von Mises stress contours and deformation configurations (DSF = 5.0; DSF: Deformation scale factor): (a) Case-3; (b) Case-7; (c) Case-11; (d) Case-15.

Figure 13.
Average bolt reaction force and uplift displacement curves for four model cases: (a) Case-3; (b) Case-7; (c) Case-11; (d) Case-15.
Figure 13.
Average bolt reaction force and uplift displacement curves for four model cases: (a) Case-3; (b) Case-7; (c) Case-11; (d) Case-15.
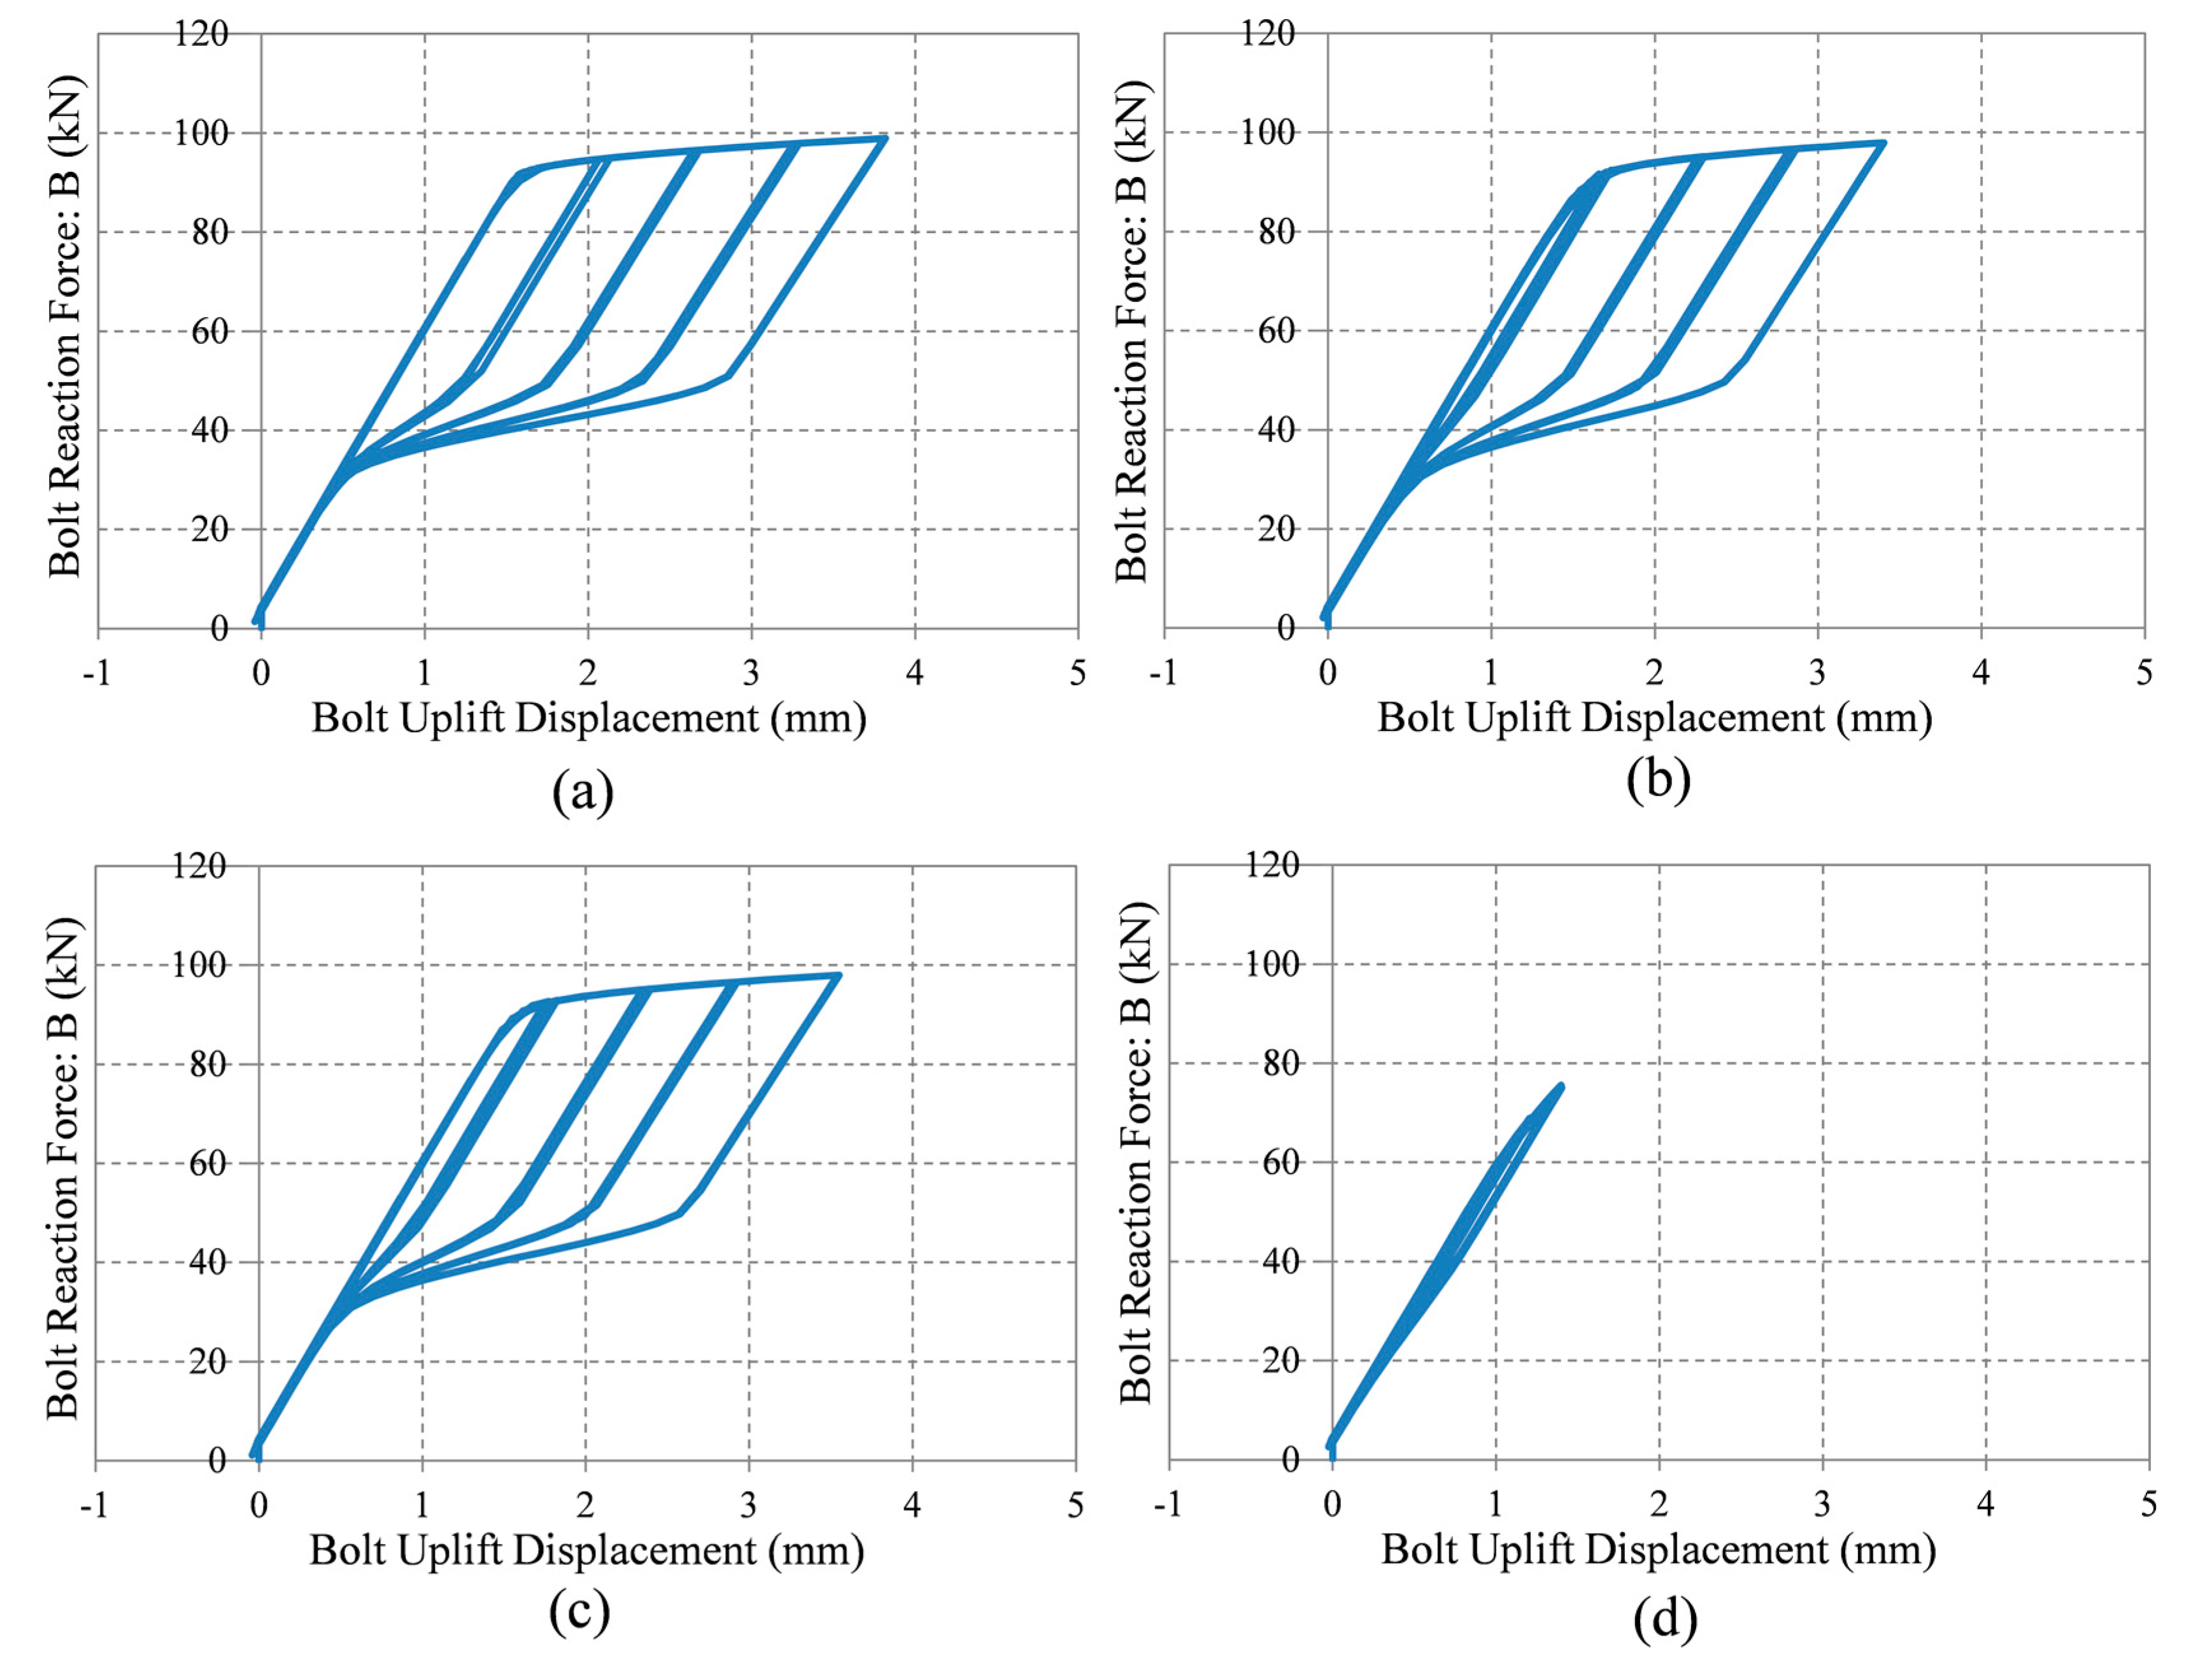
Figure 14.
Prying action results: (a) Case-3; (b) Case-7; (c) Case-11; (d) Case-15.

Figure 15.
Energy dissipation capacity for four model cases during the last loading cycle: (a) Case-3; (b) Case-7; (c) Case-11; (d) Case-15.
Figure 15.
Energy dissipation capacity for four model cases during the last loading cycle: (a) Case-3; (b) Case-7; (c) Case-11; (d) Case-15.


Table 1.
Geometric sizes.
| Model ID | T-Stub Size | Bolt and Column Size | Failure Mode (Capacity) | ||||||||||||||
|---|---|---|---|---|---|---|---|---|---|---|---|---|---|---|---|---|---|
| WT-stub | tf | tw | H1 | H2 | dh | a | a′ | b | b′ | α | Bolt (Diameter × Length) | ΣB | tc | Mode 1 | Mode 2 | Mode 3 | |
| Case-1 | 300 mm | 50 mm | 20 mm | 100 mm | 300 mm | 16 mm | 100 mm | 108 mm | 40 mm | 32 mm | −0.60 | 16 × 140 mm | 430 kN | 90 mm | - | - | 430 kN |
| Case-2 | 300 mm | 45 mm | 20 mm | 100 mm | 300 mm | 16 mm | 100 mm | 108 mm | 40 mm | 32 mm | −0.48 | 16 × 140 mm | 430 kN | 95 mm | - | - | 430 kN |
| Case-3 | 300 mm | 40 mm | 20 mm | 100 mm | 300 mm | 16 mm | 100 mm | 108 mm | 40 mm | 32 mm | −0.31 | 16 × 140 mm | 430 kN | 100 mm | - | - | 430 kN |
| Case-4 | 300 mm | 35 mm | 20 mm | 100 mm | 300 mm | 16 mm | 100 mm | 108 mm | 40 mm | 32 mm | −0.06 | 16 × 140 mm | 430 kN | 105 mm | - | - | 430 kN |
| Case-5 | 300 mm | 30 mm | 20 mm | 100 mm | 300 mm | 16 mm | 100 mm | 108 mm | 40 mm | 32 mm | 0.25 | 16 × 140 mm | 430 kN | 110 mm | - | 412 kN | - |
| Case-6 | 300 mm | 25 mm | 20 mm | 100 mm | 300 mm | 16 mm | 100 mm | 108 mm | 40 mm | 32 mm | 0.74 | 16 × 140 mm | 430 kN | 115 mm | - | 388 kN | - |
| Case-7 | 300 mm | 20 mm | 20 mm | 100 mm | 300 mm | 16 mm | 100 mm | 108 mm | 40 mm | 32 mm | 1.64 | 16 × 140 mm | 430 kN | 120 mm | 284 kN | 369 kN | - |
| Case-8 | 300 mm | 15 mm | 20 mm | 100 mm | 300 mm | 16 mm | 100 mm | 108 mm | 40 mm | 32 mm | 3.58 | 16 × 140 mm | 430 kN | 125 mm | 160 kN | 354 kN | - |
| Case-9 | 300 mm | 50 mm | 20 mm | 200 mm | 300 mm | 16 mm | 50 mm | 58 mm | 90 mm | 82 mm | 0.09 | 16 × 140 mm | 430 kN | 90 mm | - | 394 kN | - |
| Case-10 | 300 mm | 45 mm | 20 mm | 200 mm | 300 mm | 16 mm | 50 mm | 58 mm | 90 mm | 82 mm | 0.22 | 16 × 140 mm | 430 kN | 95 mm | - | 353 kN | - |
| Case-11 | 300 mm | 40 mm | 20 mm | 200 mm | 300 mm | 16 mm | 50 mm | 58 mm | 90 mm | 82 mm | 0.40 | 16 × 140 mm | 430 kN | 100 mm | - | 317 kN | - |
| Case-12 | 300 mm | 35 mm | 20 mm | 200 mm | 300 mm | 16 mm | 50 mm | 58 mm | 90 mm | 82 mm | 0.66 | 16 × 140 mm | 430 kN | 105 mm | - | 285 kN | - |
| Case-13 | 300 mm | 30 mm | 20 mm | 200 mm | 300 mm | 16 mm | 50 mm | 58 mm | 90 mm | 82 mm | 1.06 | 16 × 140 mm | 430 kN | 110 mm | 249 kN | 257 kN | - |
| Case-14 | 300 mm | 25 mm | 20 mm | 200 mm | 300 mm | 16 mm | 50 mm | 58 mm | 90 mm | 82 mm | 1.74 | 16 × 140 mm | 430 kN | 115 mm | 173 kN | 233 kN | - |
| Case-15 | 300 mm | 20 mm | 20 mm | 200 mm | 300 mm | 16 mm | 50 mm | 58 mm | 90 mm | 82 mm | 2.98 | 16 × 140 mm | 430 kN | 120 mm | 111 kN | 215 kN | - |
| Case-16 | 300 mm | 15 mm | 20 mm | 200 mm | 300 mm | 16 mm | 50 mm | 58 mm | 90 mm | 82 mm | 5.65 | 16 × 140 mm | 430 kN | 125 mm | 62 kN | 200 kN | - |
© 2017 by the authors. Licensee MDPI, Basel, Switzerland. This article is an open access article distributed under the terms and conditions of the Creative Commons Attribution (CC BY) license (http://creativecommons.org/licenses/by/4.0/).
Share and Cite
MDPI and ACS Style
Seo, J.; Hu, J.W.; Kim, K.-H. Analytical Investigation of the Cyclic Behavior of Smart Recentering T-Stub Components with Superelastic SMA Bolts. Metals 2017, 7, 386. https://doi.org/10.3390/met7100386
AMA Style
Seo J, Hu JW, Kim K-H. Analytical Investigation of the Cyclic Behavior of Smart Recentering T-Stub Components with Superelastic SMA Bolts. Metals. 2017; 7(10):386. https://doi.org/10.3390/met7100386
Chicago/Turabian StyleSeo, Junwon, Jong Wan Hu, and Kyoung-Hwan Kim. 2017. "Analytical Investigation of the Cyclic Behavior of Smart Recentering T-Stub Components with Superelastic SMA Bolts" Metals 7, no. 10: 386. https://doi.org/10.3390/met7100386
Note that from the first issue of 2016, this journal uses article numbers instead of page numbers. See further details here.