Microstructural Evolution of Intermetallic Compound Formed in Boron Steel Hot-Dipped in Al–7%Ni Alloy

1
Department of Hybrid Materials & Machining Technology, Graduate School of Convergence Science, Pusan National University, Busan 46241, Korea
2
Department of Material Science and Engineering, Pusan National University, Busan 46241, Korea
*
Author to whom correspondence should be addressed.
Metals 2017, 7(10), 393; https://doi.org/10.3390/met7100393
Submission received: 24 August 2017
/
Revised: 14 September 2017
/
Accepted: 19 September 2017
/
Published: 26 September 2017
Abstract
:The microstructural evolution of the intermetallic compound (IMC) layer formed on and in boron steel that was hot dipped in an Al–7Ni (wt %) bath at 690 °C for 30–180 s was investigated, and the growth mechanism of the IMC was identified. Except for the solidification structure of Al, the reaction layer consisted of one layer on the steel surface and two layers in the steel interior. The reaction phase formed on the original surface of the steel was the Al9FeNi (T) phase, which has a monoclinic (space group: P21/c) crystal structure. The reaction phase formed from the T phase was the Fe2Al5 (η) phase, which is orthorhombic (space group: Cmcm). The variation in thickness of the η phase increased linearly with increasing dipping time, which is in accordance with the diffusion growth, a growth mechanism of the η phase in Al-coated pure Fe and low-carbon steels. The Fe3AlC (κ) phase (which had a band shape with a width of 100 nm) and a cubic system were formed along the interface between the Fe2Al5 (η) phase and the steel.
1. Introduction
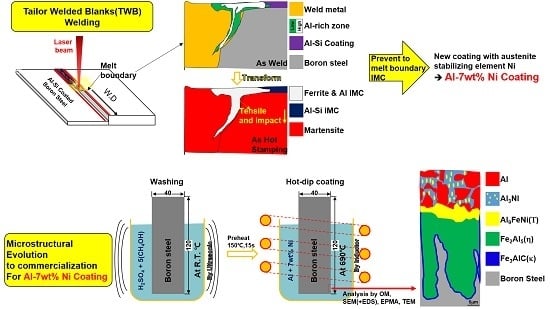
Ultrahigh-strength steels are used in modern automotive structural components to reduce the weight of the vehicle and increase fuel efficiency [1]. As the demand for better safety and impact resistance increases, it has been revealed that high-strength steel sheets are affected by spring back during metal forming [2,3,4]. To solve this problem, boron steel, with excellent quenching ability, is heated to 900 °C. In addition, hot stamping is used to secure both high strength and formability [5,6,7,8,9]. However, since hot stamping is carried out at a high temperature of ≥900 °C, the surface of the steel sheet is oxidized, surface decarburization occurs, and the mechanical properties deteriorate. Therefore, the surface of the boron steel is coated before the hot stamping treatment to prevent oxidation and subsequent deterioration.
Coatings with strong resistance against oxidation at high temperatures include Al coatings [10]. However, it has been reported that intermetallic compounds [Fe2Al5 (η), FeAl3 (θ), etc.] with weak properties are produced after a pure Al coating is deposited on steel [10,11]. In particular, a study by Naoi and Kajihara showed that Fe2Al5 (η) is predominantly formed at the Fe–Al interface [12]. Since the Fe2Al5 (η) layer may be detrimental to the adhesion of the coating, the formation of the h phase must be controlled [13]. Therefore, in order to reduce the formation of the Fe2Al5 (η) phase and excessive generation of other intermetallic compounds (IMCs) in pure Al coatings, a hot-dipped Al coating with Si (Al–Si) is applied to prevent oxidation and the decarburization of the steel sheet surface [9,14,15].
Tailor-welded blanks (TWBs) represent a new technology used to join high-strength boron steels with low-strength steels or thinner boron steels to enhance collision stability and reduce weight in recently manufactured vehicles. In a typical process, TWBs are laser welded before hot stamping [16]: laser welding of TWBs is performed on Al–Si-coated boron steel, after which a tensile test and a drop weight test are performed on the laser-welded part using hot stamping. It has been reported that the tensile and impact properties are degraded owing to fractures in FeAl, an IMC, and ferrite generated by penetration of the coating near the melt boundary [17,18,19,20]. Therefore, even if hot stamping is applied after laser welding while maintaining the oxidation resistance at the hot stamping temperature, it is necessary to have a coating that does not cause problems at the melt boundary.
In order to develop a smart coating based on the material’s weldability, Thermo-Calc™ and JMat Pro™ simulations were carried out. The results indicated that a suitable alloy has the same melting point as that of pure Al and contains Ni as the added austenite stabilizing element. As a result, the Al–7Ni wt % alloy was determined to have a suitable composition of the molten metal for the coating. In addition, the Ni–Al compound layer has better corrosion resistance than the Fe–Al compound layer in the high-temperature oxidizing regime, even in a high-temperature corrosive environment [21].
To modify the Al–Si coating, Takata et al. studied a new coating that added Mg to the Al–Si coating, but this was mainly aimed at controlling the formation of the η and θ phases, and there was no consideration of weldability [22]. In addition, Cheng et al. studied a Al–Ni-based double-layered coating using mild steel with the composition Fe–0.05C–0.24Mn–0.01P–0.01S (wt %). First, pure Ni was electrolytically plated, and the secondary molten aluminum coating was applied at 670 °C [23]. Thus, rather than using a coating of pure Al, research was carried out to reduce the Fe2Al5 (η) phase and the generation of other IMCs while ensuring oxidation resistance at high temperature. However, there was an increase in the process cost because two processes are performed when compared with Al–Ni hot dip-coating in the present method. It is thought that the shape of the generated phase differs greatly from that in this study. Moreover, their work is different from this study because the alloy composition was selected without taking weldability into consideration.
In this study, we analyzed the evolution of the IMC phase by applying Al–7Ni hot dip-coating, which is a newly designed smart coating that considers weldability. The influence of the IMC phase of evolution and kinetics on the coating time was investigated.
2. Materials and Methods
All steels used in this study were 1.2 mm-thick boron steel (SABC1470 grade) with a chemical composition of Fe–0.23C–0.24Si–1.19Mn–0.002B (wt %). This steel was selected after consulting an automobile manufacturer who confirmed it as a material that is used in hot stamping and TWBs. To clean the surface of the boron steel before coating, it was cut into 40 × 120 mm specimens, washed with a solution containing 40 mL of H2SO4 and 200 mL of CH4OH for 300 s, and then washed with ethyl alcohol. To prepare the molten metal for the coating, 651 g of high-purity Al alloy (99.99 wt %) and 49 g of high-purity Ni alloy (99.99 wt %) were mixed to make a total of 700 g of the molten metal with composition of Al–7Ni (wt %). Pre-coated specimens were preheated at 150 °C for 15 s to remove moisture from the surface and to improve the wettability of the coating. The molten metal was sufficiently stirred to dissolve through the inductor to obtain a homogeneous composition in the liquid phase. When the temperature of the molten metal was 690 °C, the boron steel was immersed in it for 30 to 120 s to obtain a coating. Coating was carried out at 690 °C because in preliminary experiments, when the temperature of Al in the steel was 703 °C or lower, the steel was only partially coated, and if a complete coating was formed, it would eventually peel off.
After coating, the specimens were cooled in air. The coated specimens were cut into pieces measuring 10 × 10 mm in the rolling direction, and then the surface was polished using SiC sand paper and a mix of 1 µm diamond with 0.04 µm silica. Specimens for optical and electron microscope observations were etched with a mixture of 1 mL of HF and 49 mL of distilled water according to ASTM Code B487-85; the observations were performed using an Olympus (Tokyo, Japan) BX-51M optical microscope and a Carl Zeiss (Oberkochen, Germany) SUPRA45 field-emission scanning electron microscope. The surface analysis of the chemical composition distribution was performed in a non-etching state using a JEOL (Tokyo, Japan) JXA-8530F field-emission electron-probe micro analyzer (EPMA) at a voltage of 1 kV and current of 100 nA with step sizes of 0.1 to 0.5 µm. The quantitative chemical composition on the coating was measured by energy-dispersive spectroscopy (EDS).
An FEI Scios focused ion beam (FIB) was used to prepare specimens for the analysis of the reactive layer around the coating and the steel interface. The conditions for extracting the specimens were as follows: Pt was coated on the surface, and a specimen was extracted by adjusting the voltage to 2–30 kV and the current to 50 pA–0.3 nA with a gallium source. For the phase analysis of the coating with a large area using a Rigaku (Tokyo, Japan) Ultima IV X-ray diffractometer, analytical conditions of 1°·min−1 were used with a voltage of 40 kV and current of 40 mA current. To analyze the phase near the reaction layer of the coating and the base metal, the FIB specimens were examined through the qualitative and quantitative chemical composition and diffraction patterns obtained by an FEI (Hillsboro, OR, USA) TALOS F200X field-emission transmission electron microscope and EDS at 200 kV, and a camera focal length of 840 mm for the diffraction patterns. Using the FEI (Hillsboro, OR, USA) TIA image analysis program and the ICDD (Delaware County, PA, USA) card, the images were identified using the inter-planar distance (d) and the angle between the diffraction patterns. Additional image analysis (e.g., image length) was conducted using the Image-plus pro image analysis program.
3. Results
3.1. Microstructure of Coated Specimens
The optical microscope image in Figure 1 shows the structure of the specimen that was coated at 690 °C for 30–180 s. For the reasons mentioned above, the temperature for hot dip-coating was set at 690 °C, which is 50 °C higher than the melting point of the Al–7Ni alloy (640 °C) [24]. After a dipping duration of less than 30 s, the coating was either not formed or formed only locally. The white line in the figure indicates the original surface of the base metal. Even when the dipping durations were changed, the microstructures of the coated specimens remained the same. As shown in Figure 1d, three layers (C, R1, and R2) were formed. However, the thickness of each layer changed with the dipping duration.
The SEM image in Figure 2 shows the microstructure of a specimen that was coated at 690 °C for 120 s. Table 1 lists the results of the EDS analysis of each phase based on its shape and composition. The C layer formed on the top layer is considered to be primary αAl, primary Al3Ni, and a eutectic structure (αAl + Al3Ni), which are the solidification structures (referred to as coated layers) of the Al–7Ni alloy.
The R1 layer (black layer in Figure 1), which was formed between the C layer and the microstructure of the steel (S), is believed to be Al–Fe–Ni, an IMC formed by a reaction between the liquid phase and the steel. The R2 layer is considered to be Al–Fe, another IMC. It can be concluded that R1 is a reaction layer formed by the diffusion of Al, which is a coating component, toward the base material.
3.2. Microstructure of the Coating
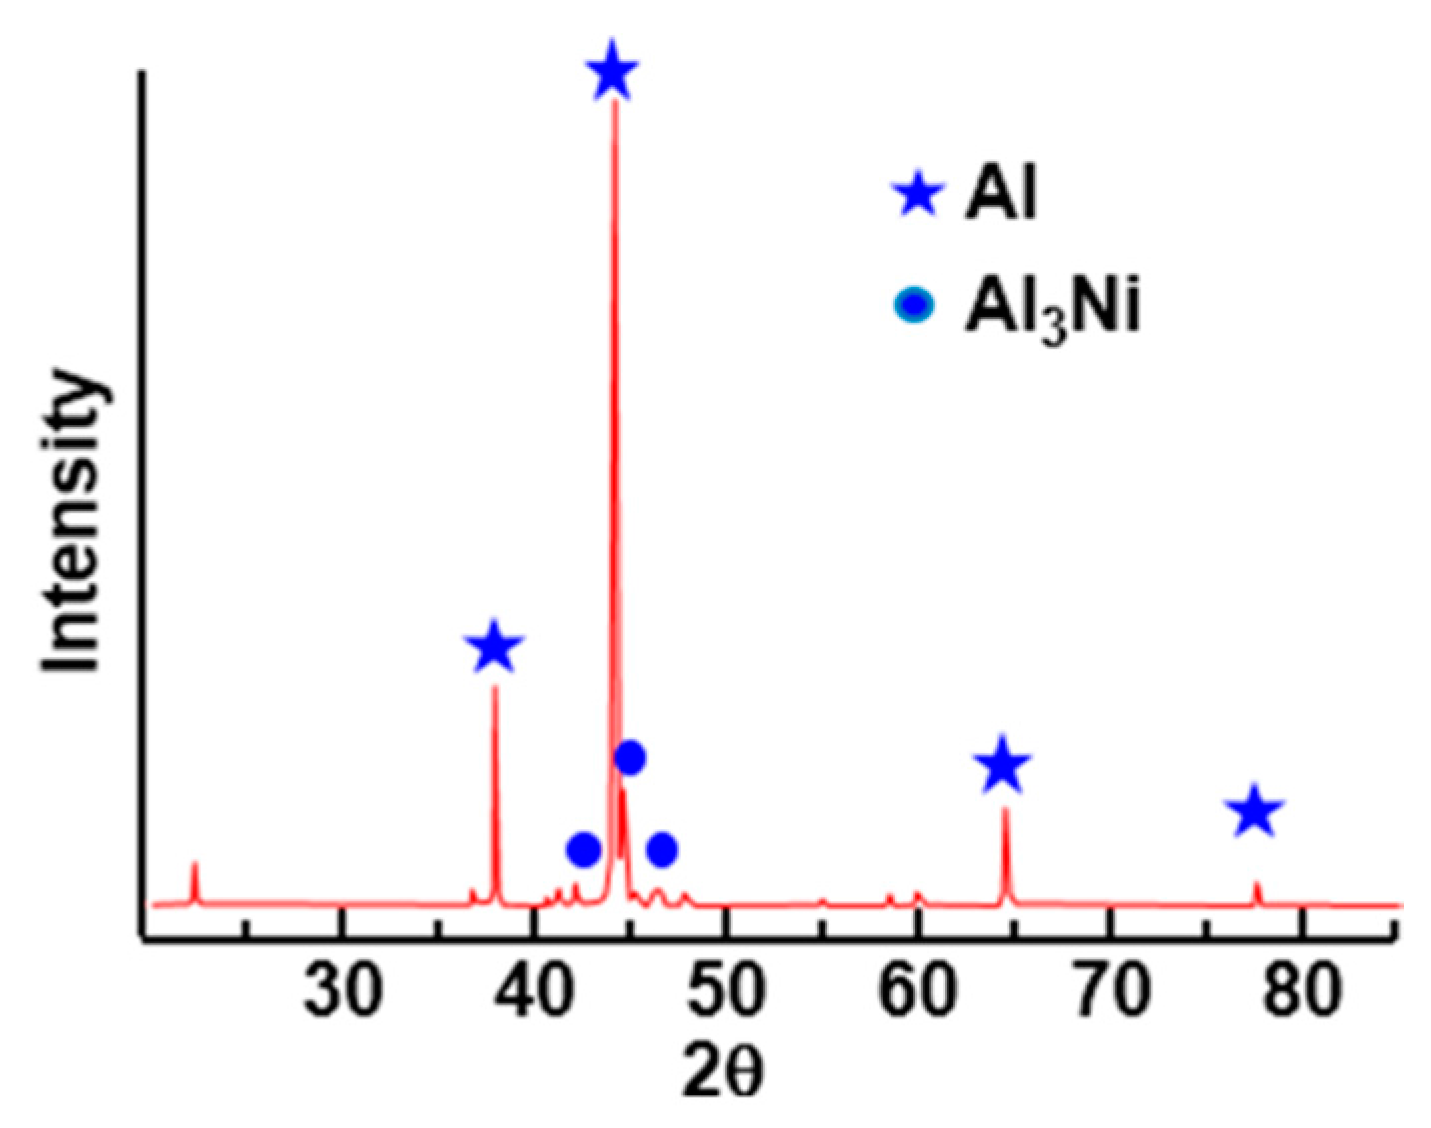
Figure 3 shows the SEM image of the microstructure and EPMA surface analysis results of the coating, which was a solidified microstructure on the top layer (denoted as C in Figure 1). Figure 4 shows the XRD analysis results of the surface of the coated layer, indicating that the coated layer consisted of two phases of Al and Al3Ni. Based on the binary phase diagram of Al–Ni alloys [24], the phases that can be formed in a Al–7Ni alloy are as follows. The eutectic reaction [L = αAl (0.25 wt % Ni solid solution) + Al3Ni] occurs at a composition of 5.7 wt % Ni at 640 °C. The primary Al phase has a solubility of about 0.25 wt % Ni at temperatures between room temperature and 640 °C. At a composition of 5.7 wt % Ni or higher, the primary phase is the intermetallic compound Al3Ni. If the 7 wt % Ni alloy with hypereutectic composition is cooled (air cooling) from a coating temperature of 690 °C, primary Al3Ni is formed at 660 °C, and then a eutectic reaction occurs at 640 °C. Finally, a solidified microstructure is composed of primary Al3Nl and the eutectic phase (αAl + Al3Ni).
However, in the microstructure shown in Figure 3, there are three phases: the primary phase αAl, which had a hypo-eutectic composition; the primary Al3Ni (bar-shaped), which had a hyper-eutectic composition; and the eutectic phase (E). During the coating process, since Al and Ni in the liquid phase adjacent to the steel diffused toward the steel, the elements of steel (Fe, Mn, and C) dissolved into the liquid phase. The content of Ni in the liquid phase adjacent to the steel was lower than 7 wt %, and the liquid phase changed to a hypo-eutectic composition. Therefore, it can be concluded that primary αAl was formed, thus providing evidence that Fe and C, which existed only in the steel, were distributed in the coating (C layer in Figure 3).
3.3. Microstructure of the Reaction Layer
Figure 5a shows a typical back-scattered electron (BSE) image near the reaction layer R1 in Figure 2, while Figure 5b–e shows the concentration distributions of Al, Ni, Fe, and C obtained from the results of EPMA area analysis. When comparing the concentrations of constituent elements in the R1 and R2 regions, it can be seen that the concentration of Al in R1 was higher than that in R2, but the concentration of Fe was low. In addition, R1 contained Ni, but Ni was hardly present in R2. It can thus be concluded that R1 was an Al–Ni–Fe compound and R2 was an Al–Fe compound. In order to identify these phases, a TEM specimen was obtained with a FIB along the depth in the area denoted by X1 in Figure 5a. The microstructures were then analyzed using STEM and EDS.
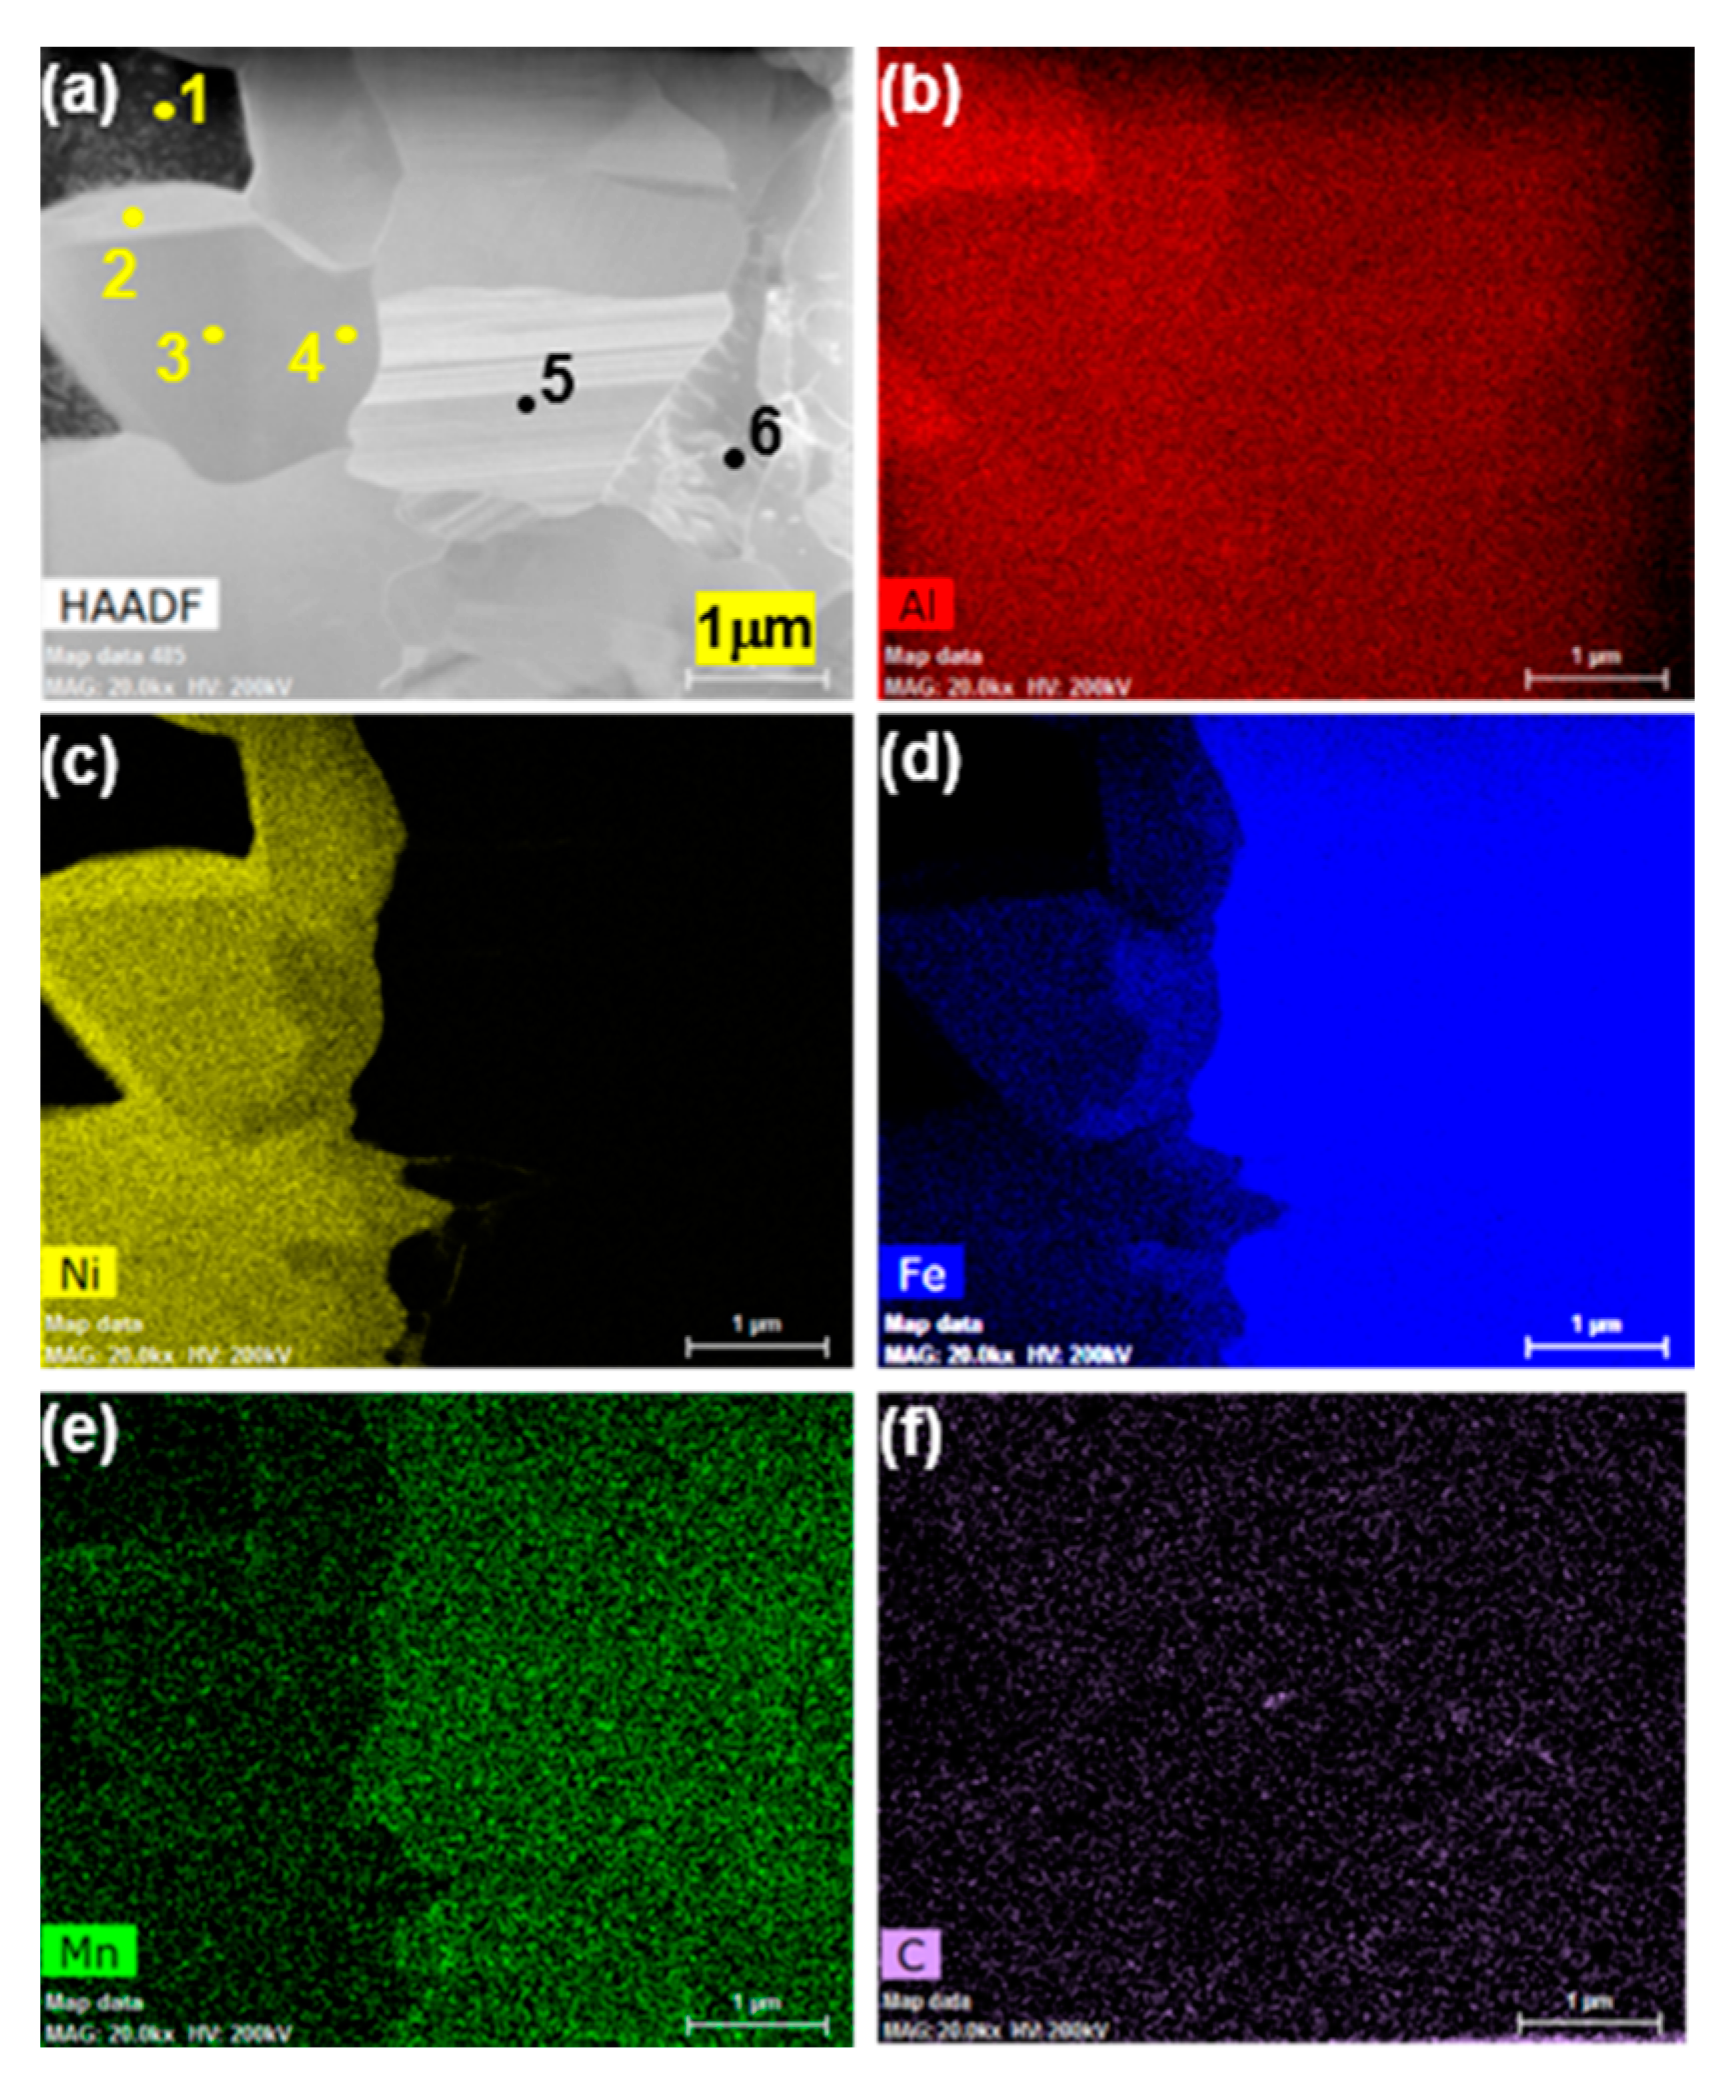
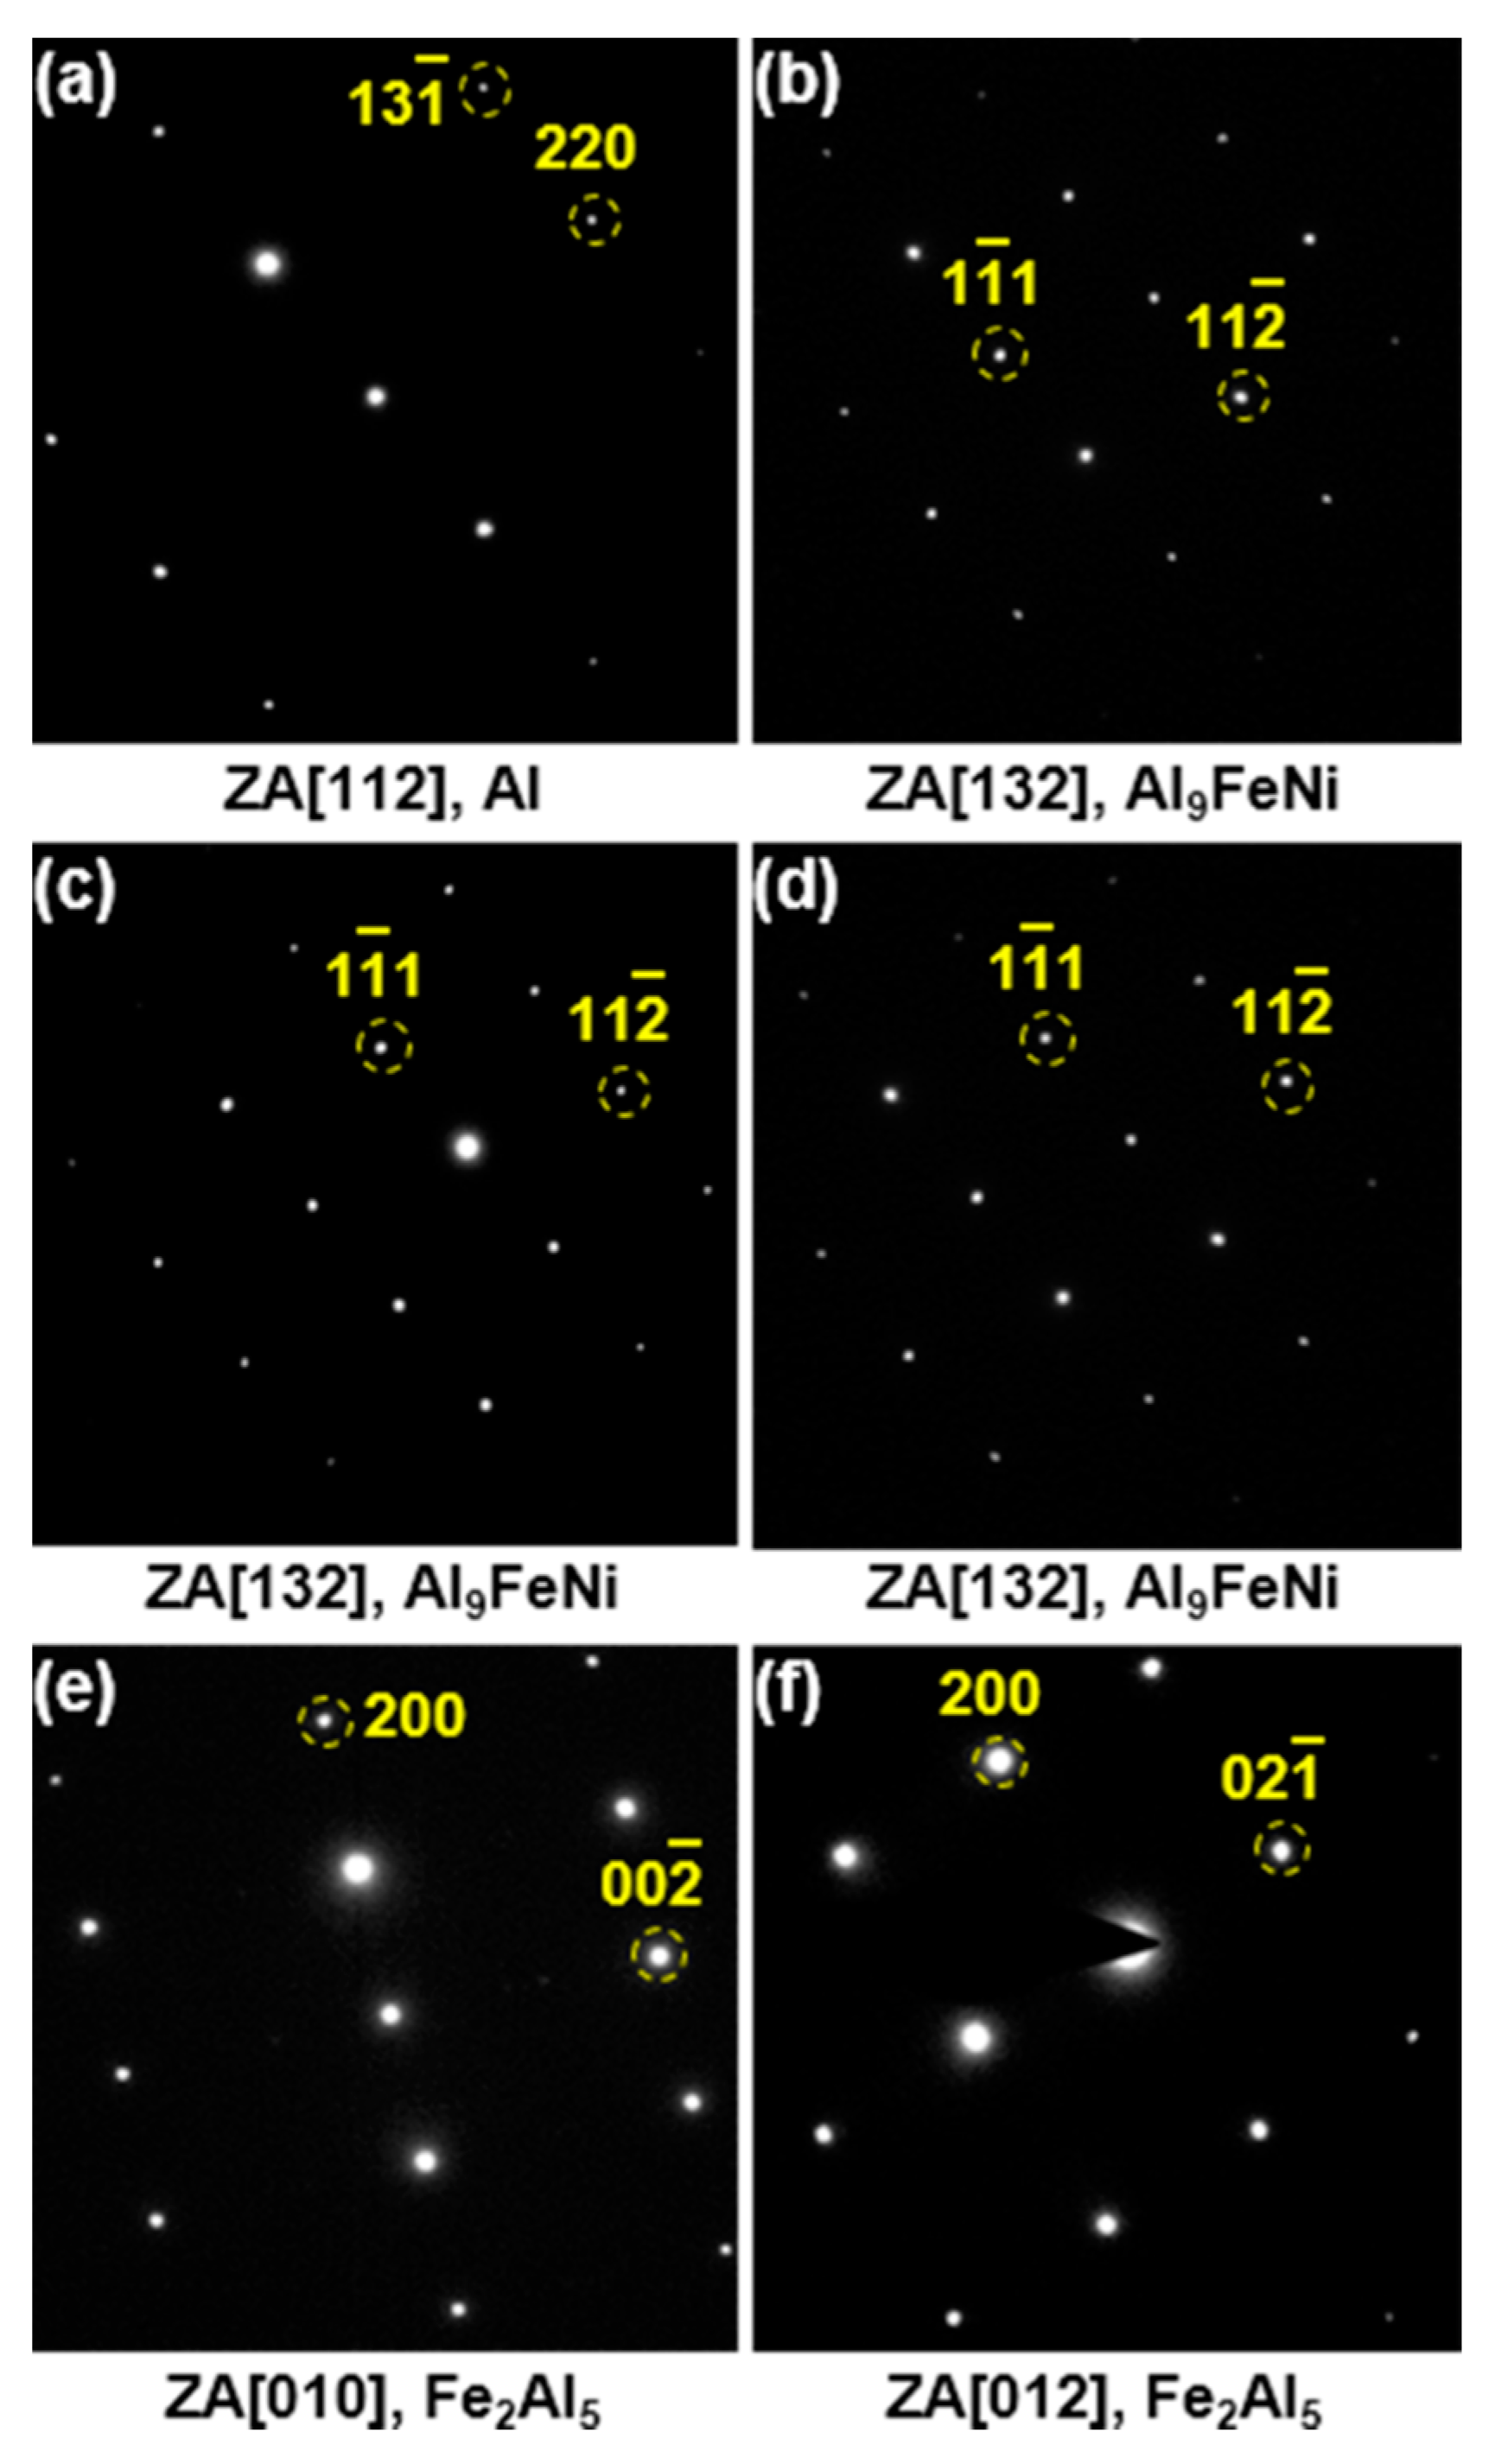
Figure 6a shows the TEM structure (high-angle annular dark-field (HAADF) image), and Figure 6b–f shows the concentration distribution of Al and Ni in the coating alloy and the distribution of Fe, Mn, and C in the steel, obtained by EDS analysis. Figure 7 shows the diffraction pattern and the analytical result of each phase indicated by 1–6 in Figure 6a, where ZA is the zone axis. Table 2 lists the composition of each phase determined by EDS. From the analysis results of the EDS composition and the diffraction pattern, phase 1 was found to consist of only Al. Phases 2, 3, and 4, which contained Al and Ni and a small amount of Fe, were all identified as the Al9FeNi (T) phase with a monoclinic crystal structure (space group: P21/c). As shown in Figure 6a–d, Al9FeNi was characterized by the difference between the concentrations of Ni and Fe present in the crystal grains. On the other hand, from the diffraction pattern and the EDS analysis results shown in (e) and (f), phases 5 and 6, which contained high concentrations of Fe, Al, and Mn, were found to be the Fe2Al5 (η) phase, an IMC with orthorhombic crystal structure (space group: Cmcm).
Figure 8a shows the microstructure (BSE image) obtained by the SEM near the interface between the reaction layer R2 and steel in Figure 2; Figure 8b–e shows the concentration distributions of Al, Ni, Fe, and C obtained from the results of EPMA area analysis. The reaction layer R2 had a very high concentration of Al, while the concentration of Ni was lower than that in steel; the concentration of Fe and C, which are steel components, was also low. From these results, R2 is considered to be a compound of Al and Fe. In addition, close observation of the interface between R2 and steel in Figure 8 reveals that there was a reaction layer measuring several nanometers in thickness (hereinafter referred to as R3) in which the concentration of Al was lower than that in R2, the concentration of Fe was slightly higher, and the amount C was concentrated. Because the R3 was very thin, a TEM specimen was obtained with a FIB in the depth direction in the area denoted as X2 in Figure 8a, and its microstructure was analyzed using STEM.
Figure 9a shows the STEM image of the specimen, and Figure 9(b–f) represent the results of the EDS analysis of Al and Ni, which were coating elements, and Fe, Mn, and C, which are elements of steel. It can be seen that C was concentrated in the R2–steel interface. In addition, Mn and C were concentrated in the spherical phases that were formed inside the steel. Figure 10 shows the diffraction pattern of each phase indicated by 1–4 in Figure 9a and their analysis results. Table 3 lists the chemical composition of each phase analyzed by EDS. The quantitative EDS analysis result for carbon was inaccurate, however, and was used only as a qualitative reference. From the results of the EDS analysis and analysis of the diffraction patterns, it was determined that the R2 reaction layer (phase 1) was the Fe2Al5 (η) phase; R3 (phase 2), which was formed with a thickness of several nanometers at the interface was Fe3AlC with a cubic crystal structure; and the steel (phase 3) was confirmed to be an α-ferrite. It was also confirmed that the spherical phase (phase 4) with size of 200 nm in the steel was (Fe, Mn)3C; this (Fe, Mn)3C phase was a carbide in pearlite that was originally present in the steel, and it was probably refined by the decomposition process.
4. Discussion
Al-7 wt % Ni coating is designed to contain Ni as the austenite stabilizing element as much as possible in the coating in order to prevent ferrite or IMC from being formed even if the coating layer is melted into the molten part during welding, but in order to minimize the deformation of the steel the melting point of the coating was designed not to exceed 703 °C, which is the A1 temperature of the steel. Upon hot dipping for 120 seconds at 690 °C in the molten bath of this coating, the Al9FeNi (T) phase (see Figure 5 and Figure 6) was initially formed on the steel surface through the reaction between liquid Al–7Ni and the steel substrate. During the hot-dipping process, elements such as Fe, Mn, and C contained in the steel dissolved and diffused into the liquid phase, and the Al9FeNi (T) phase is expected to form by reacting with elements dissolved from the steel and Al and Ni in the liquid phase.
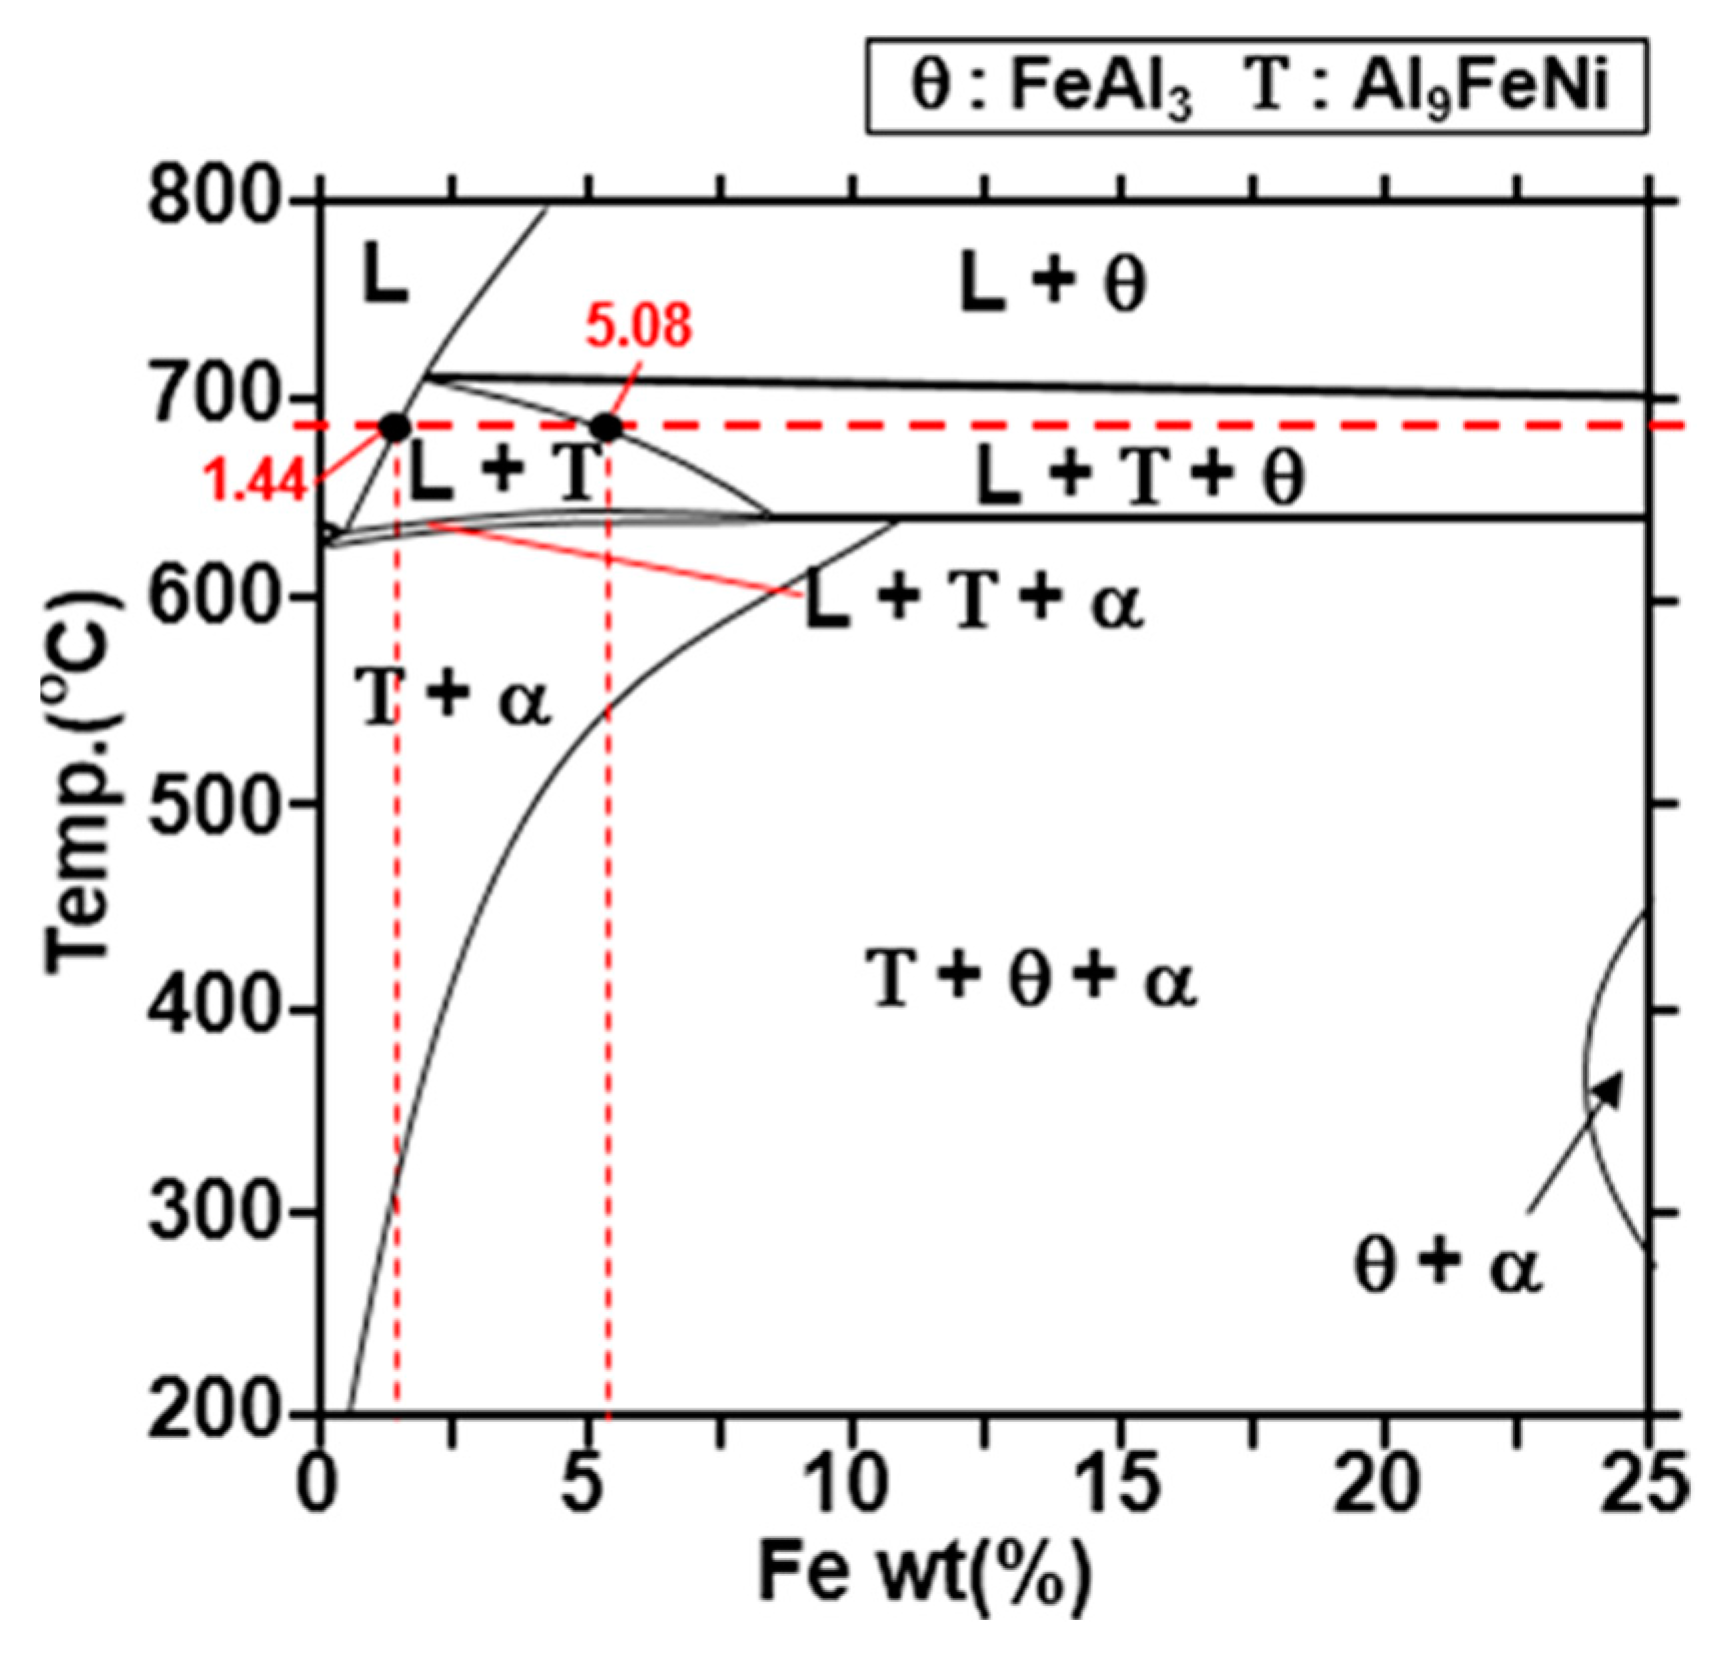
The (Al–7Ni)–Fe phase diagram (Figure 11) was drawn using Thermo-Calc™ to determine whether the T phase can be formed by the reaction of these elements at 690 °C. As can be seen from the phase diagram, when 1.44 wt % or more of Fe dissolves into the liquid phase of Al–7Ni at 690 °C (dipping temperature), a solid T phase is formed. In addition, if 5.08 wt % or more of Fe dissolves into the liquid phase, the FeAl3 (θ) phase is formed. However, since the Al9FeNi (T) phase is preferentially formed at the interface attached to the liquid phase, it can be formed with a smaller amount of Fe than is required for the FeAl3 (θ) phase.
When the Al9FeNi (T) phase was formed on the steel substrate, the steel substrate did not react with the liquid phase; instead, it only reacted with the already formed Al9FeNi (T) phase. In other words, Al and Ni diffused from the T phase to the inside of the steel, and Fe, Mn, and C, which are the elements of steel, diffused toward the Al9FeNi (T) phase to form a reaction phase. This phenomenon is similar to the Wołczyński’s model, in which a reaction phase is generated by solid- diffusion during hot-dipping [25]. Therefore, the phase formed by the reaction through solid diffusion of Al was the Fe2Al5 (η) phase, which is marked as R2 in Figure 5, Figure 6, Figure 7, Figure 8, Figure 9 and Figure 10, and it was not the FeAl3 (θ) phase formed by the reaction with the liquid phase. According to the study by Naoi and Kajihara on the Al-Fe solid-phase diffusion reaction, in which the Fe2Al5 (η) phase was formed at the Fe–Al interface, FeAl, FeAl2, and FeAl3 were thermodynamically stable, but they could grow to a distinctly visible thickness [12]. This result supports our finding. Meanwhile, it can be seen that the Ni concentration in the Fe2Al5 (η) phase (see Figure 8) is lower than that in the steel substrate, which means that Ni had low solubility in the η phase.
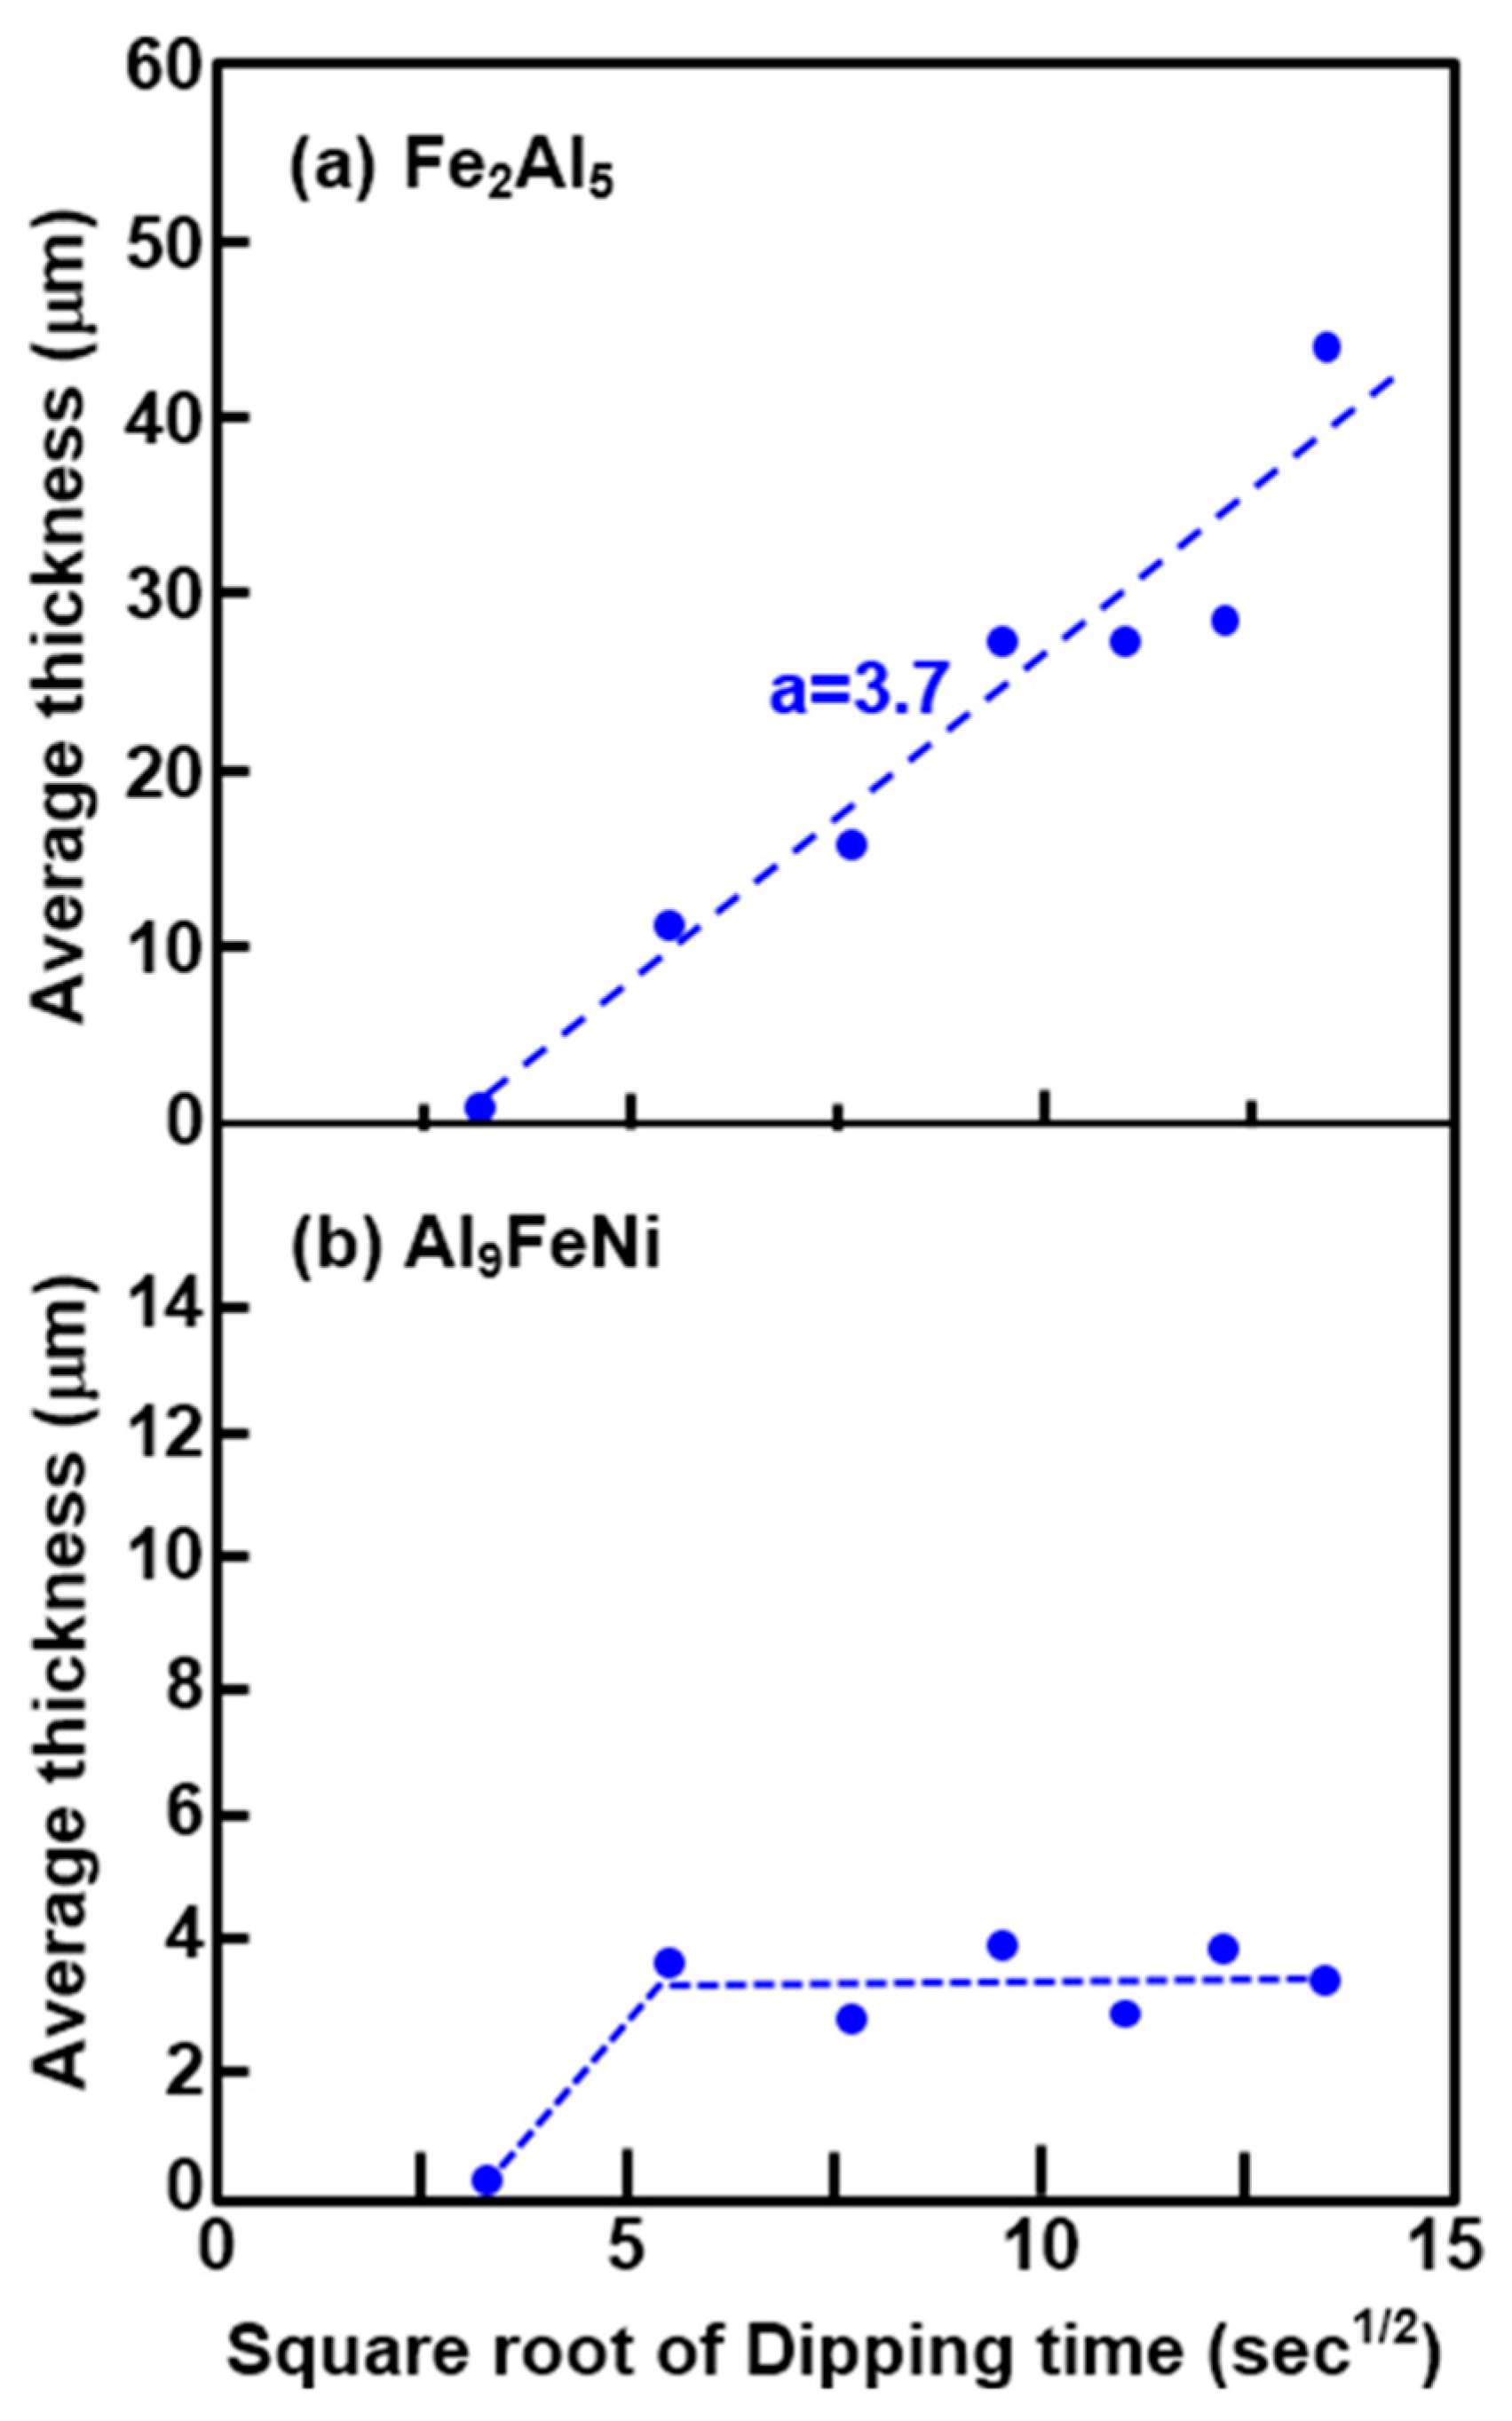
Figure 12a,b shows the changes in thickness of the Fe2Al5 (η) phase and Al9FeNi (T) phase as functions of the square root of the dipping time (s1/2). The thickness of the Fe2Al5 (η) phase increased linearly with the increases in the square root of the dipping time. This means that the growth kinetics of the Fe2Al5 (η) phase exhibited a diffusion-rate growth. These results are in good agreement with the mechanism of growth of the Fe2Al5 (η) phase. Moreover, these results indicate that the growth of the Fe2Al5 (η) layer was controlled by the volume diffusion of the constituent elements in each phase, which is consistent with previous works by Naoi and Kajihara [12], Takata et al. [26], and Springer et al. [27] on hot-dipped Al coating on pure Fe or low-carbon steel sheets.
Meanwhile, the Al9FeNi (T) phase continued to grow steadily until the square root of the dipping time reached 5.5 s1/2 (i.e., dipping time ≈ 30 s). This occurred because the Al9FeNi (T) phase was not generated homogeneously on the surface of the steel before the tipping time was over 30 s, and it was generated sparsely. The T phase was generated over the entire surface of the steel only after 30 s had passed. On the other hand, even when the square root of the dipping time reached 13.4 s1/2 (dipping time ≈ 180 s), the Fe2Al5 (η) phase had a thickness of about 40 µm, but the Al9FeNi (T) phase had a thickness of about 4 µm. This means that the growth of the T phase was very slow after 30 s of dip-coating, resulting in uniform generation of the Al9FeNi (T) phase throughout the steel surface.
The Al9FeNi (T) phase was formed from the reaction between steel and the liquid phase, but it also acted as a supplier of elemental Al for growth of the Fe2Al5 (η) phase. The Al9FeNi (T) phase continued to grow as long as Fe diffusing from steel was continuously supplied to the liquid phase. On the other hand, at the interface between the steel substrate and the Al9FeNi (T) phase, Al diffused toward the steel so that the Al concentration decreased and Fe diffused toward the Al9FeNi (T) phase. This phenomenon can be confirmed by Figure 5 (region 4). Therefore, the growth rate of this phase depended on the amount of inflowing and outflowing Al and Fe, which are the common constituents of the Al9FeNi (T) phase and Fe2Al5 (η) phase at the interface. In conclusion, since the difference between the amounts of Al for growth and the amount of Al released into the Fe2Al5 (η) phase was very small, the growth rate of the Al9FeNi (T) phase was very slow.
The formation of the Fe3AlC (κ) phase (R3 in Figure 8, phase 1 in Figure 9) at the interface between the η phase and steel substrate proceeded as follows. There are few reports of Fe3AlC (κ) phase formation in steel and Al reactions. However, according to Springer et al. [27], the Fe3AlC (κ) phase is formed between the Fe2Al5 (η) phase and steel by inter-diffusion in the solid phase reaction of low carbon steel and pure Al at 600 °C, but there was no mention of its formation mechanism. The Fe3Al phase has the lowest concentration of Al (13–20 wt %) among the IMCs (FeAl, FeAl2, Fe2Al5, FeAl3) in the Fe–Al binary system [28]; it is present at temperatures below 550 °C, and the crystal system is cubic (space group: Pm3m). Therefore, this phase was likely formed first by the diffusion of Al in steel. It has been reported that Fe3Al is adsorbed in the lattice in an atmosphere with high C concentration and is transformed into the Fe3AlC (κ) phase with the same cubic crystal system (space group: Pm3m) [29,30,31]. Carbon decomposed from cementite in steel was not dissolved in the Fe2Al5 (η) phase and was released. It is thus believed that the Fe3AlC (κ) phase was formed by bond-released C and Fe3Al formed in the interface.
5. Conclusions
EPMA analysis and FIB–TEM observation were used to observe the evolution of the reaction layer formed in boron steel that was hot-dipped for 30–180 s in a Al–7Ni bath at 690 °C. The findings are summarized as follows:
- The cross-sectional microstructure formed by hot dipping was classified into a solidification microstructure of Al–7Ni alloy and a reaction layer. The reaction layer consisted of one layer on the surface of the steel and two layers inside the steel.
- The reaction phase formed on the original surface of the steel was the Al9FeNi (T) phase, which is a monoclinic (space group: P21/c) crystal structure. From a portion of the quasi-phase diagram of Al–7Ni–xFe (wt %) drawn using Thermo-Calc™, it was confirmed that this phase was formed if 2–5 wt % of the iron content in the Al–7Ni melt at 690 °C was dissolved.
- The reaction phase formed from the Al9FeNi (T) phase into the steel was the Fe2Al5 (η) phase, which is orthorhombic (space group: Cmcm). The variation in thickness of this phase increased linearly with increasing dipping time. This result is in accordance with diffusion growth, which is a growth mechanism of the Fe2Al5 (η) phase in Al-coated pure Fe and low-carbon steels. It is obvious that the thickness variation increased parabolically with time.
- The Fe3AlC (κ) phase, which had a band shape with a width of 100 nm, was formed at the interface of the Fe2Al5 (η) phase and the steel substrate. This phase had the same cubic crystal structure as Fe3Al. In addition, carbon was not detected in the Fe2Al5 (η) phase. Based on these results, it is considered that the Fe3AlC (κ) phase was formed by the diffusion of Al and C in the Fe2Al5 (η) phase toward the steel.
Acknowledgments
This work was supported by a National Research Foundation of Korea (NRF) grant funded by the Korean government (MSIP) (No. 2012R1A5A1048294).
Author Contributions
Jung-Gil Yun and Chung-Yun Kang conceived and designed the experiments; Jung-Gil Yun, Jae-Hyeong Lee and Sung-Yun Kwak performed the experiments; Jung-Gil Yun and Chung-Yun Kang analyzed the data; Jung-Gil Yun wrote this paper.
Conflicts of Interest
The founding sponsors had no role in the design of the study; in the collection, analyses, or interpretation of data; in the writing of the manuscript, and in the decision to publish the results.
References
- Åkerström, P. Modeling and Simulation of Hot Stamping. Ph.D. Thesis, Luleå University of Technology, Luleå, Sweden, 2006. [Google Scholar]
- Senuma, T. Physical metallurgy of modern high strength steel sheets. ISIJ Int. 2001, 41, 520–532. [Google Scholar] [CrossRef]
- Vaissiere, L.; Laurent, J.P.; Reinhardt, A. Development of pre-coated boron steel for applications on PSA Peugeot Citroen and Renault bodies in white. SAE Int. 2002. [Google Scholar] [CrossRef]
- Tetsuya, M.; Kohei, H.; Hidetaka, K. Ultra high-strength steel sheets for bodies, reinforcement parts, and seat frame parts of automobile—Ultra high-strength steel sheets leading to great improvement in crash-worthiness. JFE Tech. Rep. 2004, 4, 38–43. [Google Scholar]
- Aranda, L.; Garcia; Ravier, P.; Chastel, Y. Hot stamping of quenchable steels: Material data and process simulations. In Proceedings of the IDDRG 2003 Conference, Bled, Slovenia, 11–15 May 2003; pp. 155–164. [Google Scholar]
- Kolleck, R.; Veit, R.; Merklein, M.; Lechler, J.; Geiger, M. Investigation on induction heating for hot stamping of boron alloyed steels. CIRP Ann. Manuf. Technol. 2009, 58, 275–278. [Google Scholar] [CrossRef]
- Liu, H.S.; Xing, Z.W.; Bao, J.; Song, B.Y. Investigation of the hot-stamping process for advanced high-strength steel sheet by numerical simulation. J. Mater. Eng. Perform. 2010, 19, 325–334. [Google Scholar] [CrossRef]
- Manfred, G.; Marion, M.; Cornelia, H. Basic investigations on the hot stamping steel 22MnB5. Adv. Mater. Res. 2005, 6–8, 795–804. [Google Scholar]
- Neugebauera, R.; Altanb, T.; Geigerc, M.; Kleinerd, M.; Sterzinga, A. Sheet metal forming at elevated temperatures. CIRP Ann. Manuf. Technol. 2006, 55, 793–816. [Google Scholar] [CrossRef]
- Bahadur, A.; Mohanty, O.N. Aluminium diffusion coatings on medium carbon steel. Mater. Trans. JIM 1995, 36, 1170–1175. [Google Scholar] [CrossRef]
- Kobayashi, S.; Yakou, T. Control of intermetallic compound layers at interface between steel and aluminum by diffusion-treatment. Mater. Sci. Eng. A 2002, 338, 44–53. [Google Scholar] [CrossRef]
- Naoi, D.; Kajihara, M. Growth behavior of Fe2Al5 during reactive diffusion between Fe and Al at solid-state temperatures. Mater. Sci. Eng. A 2007, 459, 375–382. [Google Scholar] [CrossRef]
- Richards, R.W.; Jones, R.D.; Clements, P.D.; Clarke, H. Metallurgy of continuous hot dip aluminizing. Int. Mater. Rev. 1994, 39, 191–212. [Google Scholar] [CrossRef]
- Borsetto, F.; Ghiotti, A.; Bruschi, S. Investigation of the high strength steel Al-Si coating during hot stamping operations. Key Eng. Mater. 2009, 410–411, 289–296. [Google Scholar] [CrossRef]
- Karbasian, H.; Tekkaya, A.E. A review on hot stamping. J. Mater. Process. Technol. 2010, 210, 2103–2118. [Google Scholar] [CrossRef]
- Saunders, F.I.; Wagoner, R.H. Forming of tailor-welded blanks. Metall. Mater. Trans. A 1996, 27, 2605–2616. [Google Scholar] [CrossRef]
- Cretteur, L.; Vierstraete, R.; Yin, Q.; Ehling, W.; Pic, A. Development of a laser decoating process for fully functional Al Si coated press hardened steel laser welded blank solutions. In Proceedings of the 5th International WLT-Conference: Lasers in Manufacturing, Munich, Germany, 15–18 June 2009; pp. 409–413. [Google Scholar]
- Jung, B.H.; Kong, J.P.; Kang, C.Y. Effect of Hot-stamping Heat Treatment on the Microstructure of Al-Segregated Zone in TWB Laser Joints of Al-Si-coated Boron Steel and Zn-coated DP Steel. Korean J. Met. Mater. 2012, 50, 455–462. [Google Scholar]
- OH, M.-H.; Kong, J.-P.; Kwon, M.-S.; Kang, C.-Y. Effect of Hot-stamping on Microstructures and Tensile Properties of Al-Si Coated Boron Steel Welds with Laser Source. J. Weld. Join. 2013, 31, 96–106. [Google Scholar] [CrossRef]
- Yoon, T.-J.; Oh, M.-H.; Shin, H.-J.; Kang, C.-Y. Comparison of microstructure and phase transformation of laser-welded joints in Al-10wt% Si-coated boron steel before and after hot stamping. Mater. Charact. 2017, 128, 195–202. [Google Scholar] [CrossRef]
- Li, Y.S.; Spiegel, M. Models describing the degradation of FeAl and NiAl alloys induced by ZnCl 2–KCl melt at 400–450 °C. Corros. Sci. 2004, 46, 2009–2023. [Google Scholar] [CrossRef]
- Takata, N.; Nishimoto, M.; Kobayashi, S.; Takeyama, M. Morphology and formation of Fe-Al intermetallic layers on iron hot-dipped in Al-Mg-Si alloy melt. Intermetallics 2014, 54, 136–142. [Google Scholar] [CrossRef]
- Cheng, W.-J.; Liao, Y.-J.; Wang, C.-J. Effect of nickel pre-plating on high-temperature oxidation behavior of hot-dipped aluminide mild steel. Mater. Charact. 2013, 82, 58–65. [Google Scholar] [CrossRef]
- Nash, P. Phase Diagrams of Binary Nickel Alloys; ASM International: Novelty, OH, USA, 1991; pp. 390–394. [Google Scholar]
- Wołczyński, W.; Kucharska, B.; Garzel, G.; Sypien, A.; Pogoda, Z.; Okane, T. Part III. Kinetics of the (Zn)-coating deposition during stable and meta-stable solidifications. Arch. Metall. Mater. 2015, 60, 199–207. [Google Scholar]
- Takata, N.; Nishimoto, M.; Kobayashi, S.; Takeyama, M. Crystallography of Fe2Al5 phase at the interface between solid Fe and liquid Al. Intermetallics 2015, 67, 1–11. [Google Scholar] [CrossRef]
- Springer, H.; Kostka, A.; Payton, E.J.; Raabe, D.; Kaysser-Pyzalla, A.; Eggeler, G. On the formation and growth of intermetallic phases during interdiffusion between low-carbon steel and aluminum alloys. Acta Mater. 2011, 59, 1586–1600. [Google Scholar] [CrossRef]
- Massalski, T.B.; Hiroaki, O. Binary Alloy Phase Diagrams; ASM International: Novelty, OH, USA, 1986. [Google Scholar]
- Schneider, A.; Zhang, J. Metal dusting of ferritic Fe-Al-M-C (M= Ti, V, Nb, Ta) alloys in CO-H2-H2O gas mixtures at 650 °C. Mater. Corros. 2003, 54, 778–784. [Google Scholar] [CrossRef]
- Schneider, A.; Zhang, J. Orientation relationship between a ferritic matrix and κ-phase (Fe3AlCx) precipitates formed during metal dusting of Fe-15Al. Intermetallics 2005, 13, 1332–1336. [Google Scholar] [CrossRef]
- Connétable, D.; Maugis, P. First principle calculations of the κ-Fe3AlC perovskite and iron-aluminium intermetallics. Intermetallics 2008, 16, 345–352. [Google Scholar] [CrossRef]
Figure 1.
Cross-sectional optical micrographs of specimens that were hot dipped at 690 °C for durations, (a) 30 s, (b) 60 s, (c) 120 s, (d) 180 s.
Figure 1.
Cross-sectional optical micrographs of specimens that were hot dipped at 690 °C for durations, (a) 30 s, (b) 60 s, (c) 120 s, (d) 180 s.
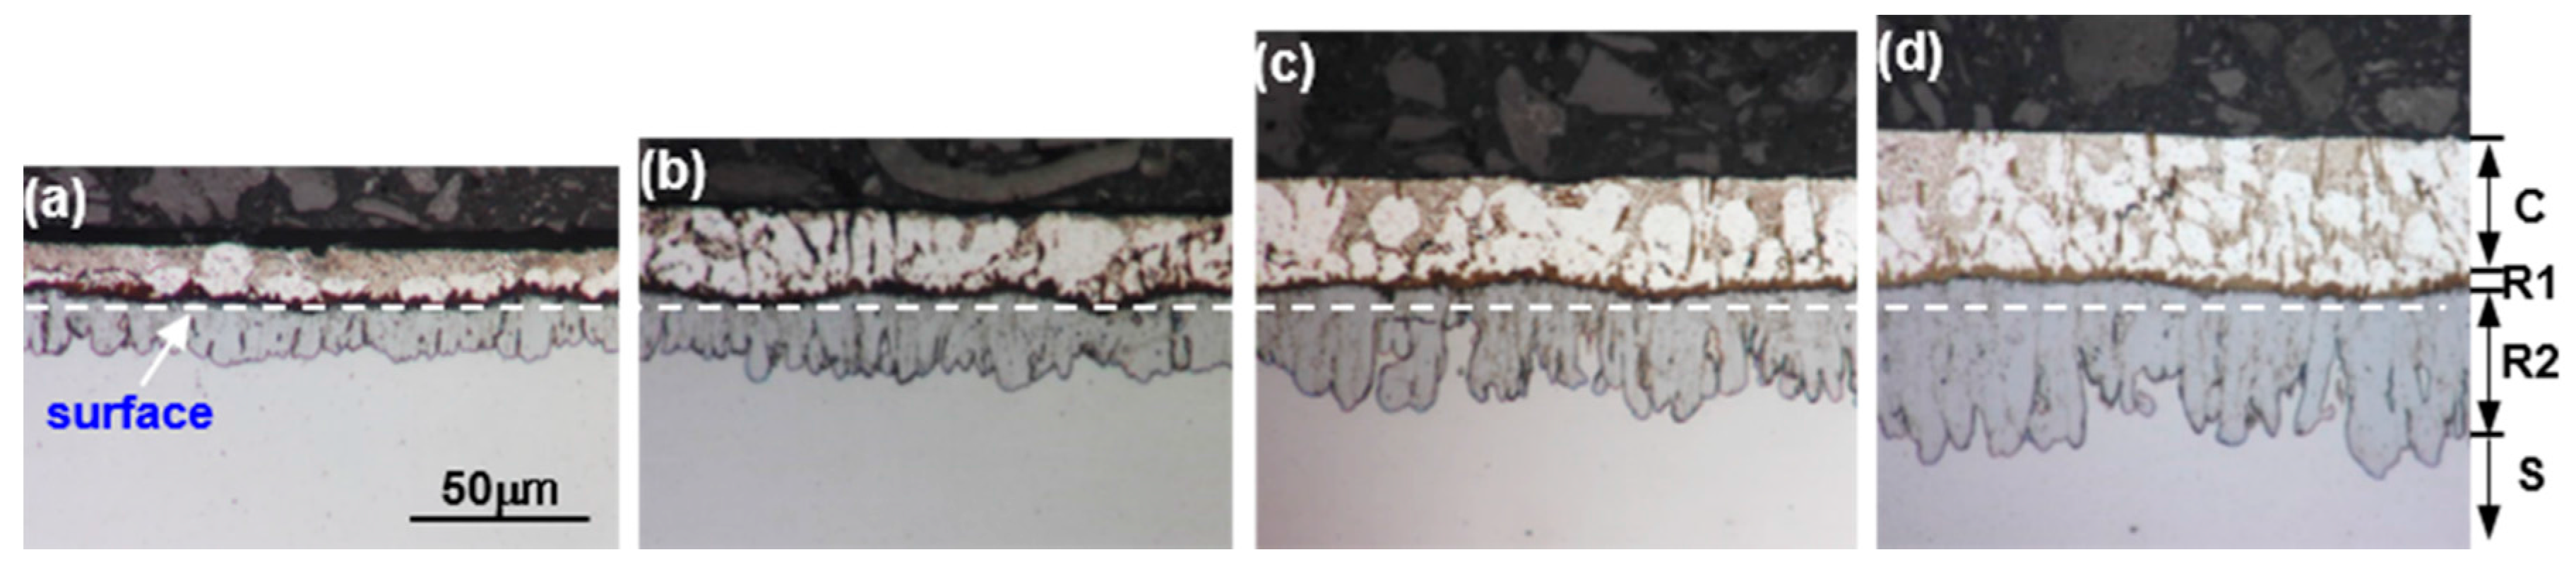
Figure 2.
Scanning electron microscope (SEM) micrographs of specimens that were hot-dipped at 690 °C for 120 s.
Figure 2.
Scanning electron microscope (SEM) micrographs of specimens that were hot-dipped at 690 °C for 120 s.
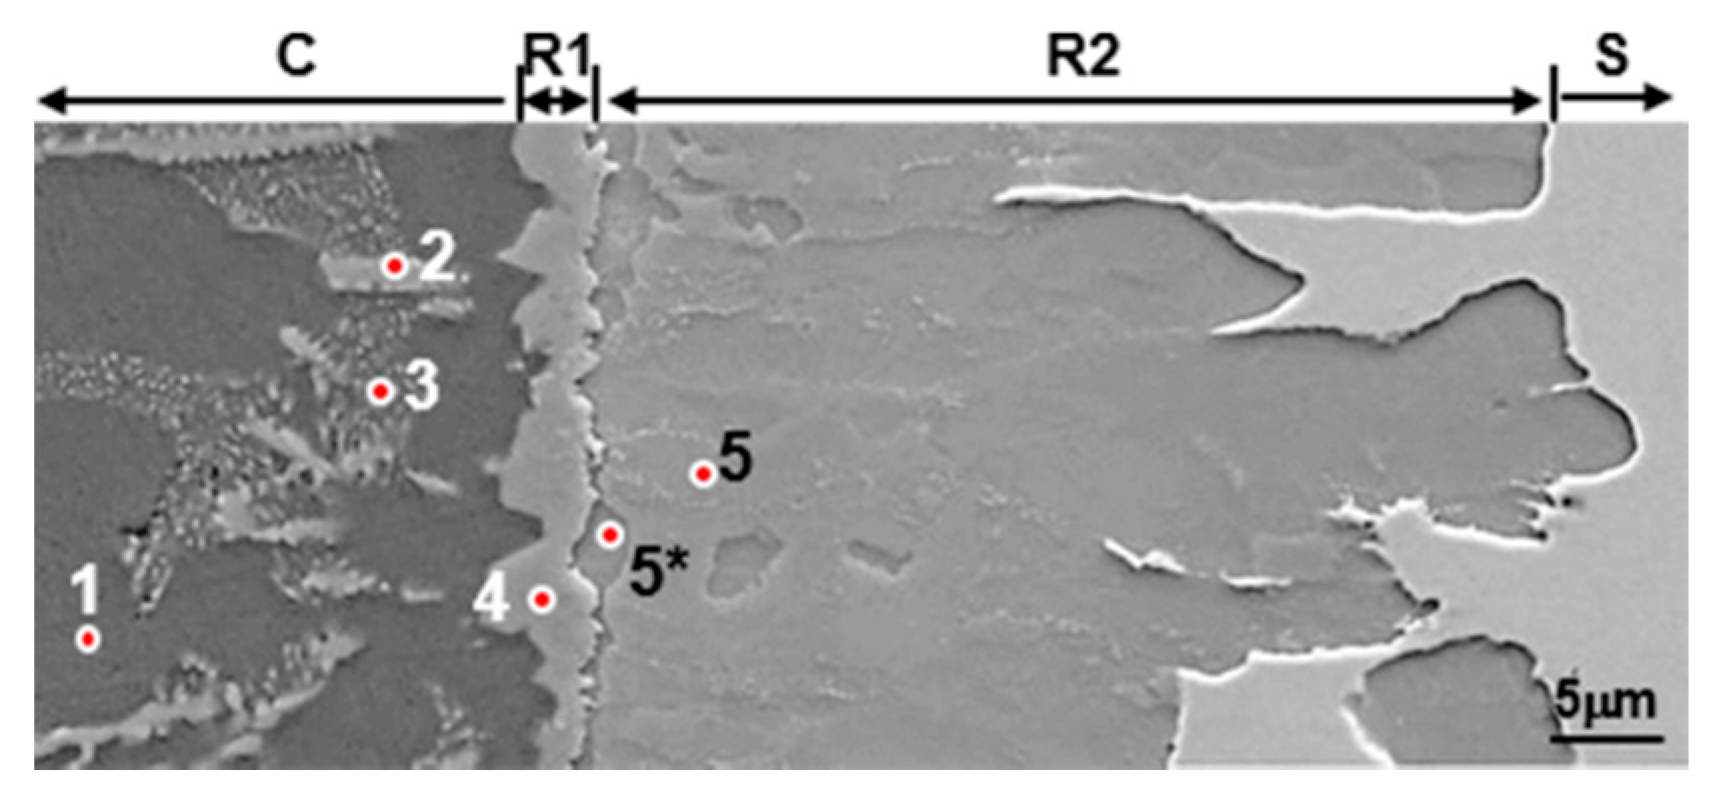
Figure 3.
Electron-probe micro analyzer (EPMA) analysis results of specimen that was hot-dipped at 690 °C for 120 s: (a) back-scattered electron (BSE) Image; (b) Al; (c) Ni; (d) Fe; (e) C.
Figure 3.
Electron-probe micro analyzer (EPMA) analysis results of specimen that was hot-dipped at 690 °C for 120 s: (a) back-scattered electron (BSE) Image; (b) Al; (c) Ni; (d) Fe; (e) C.
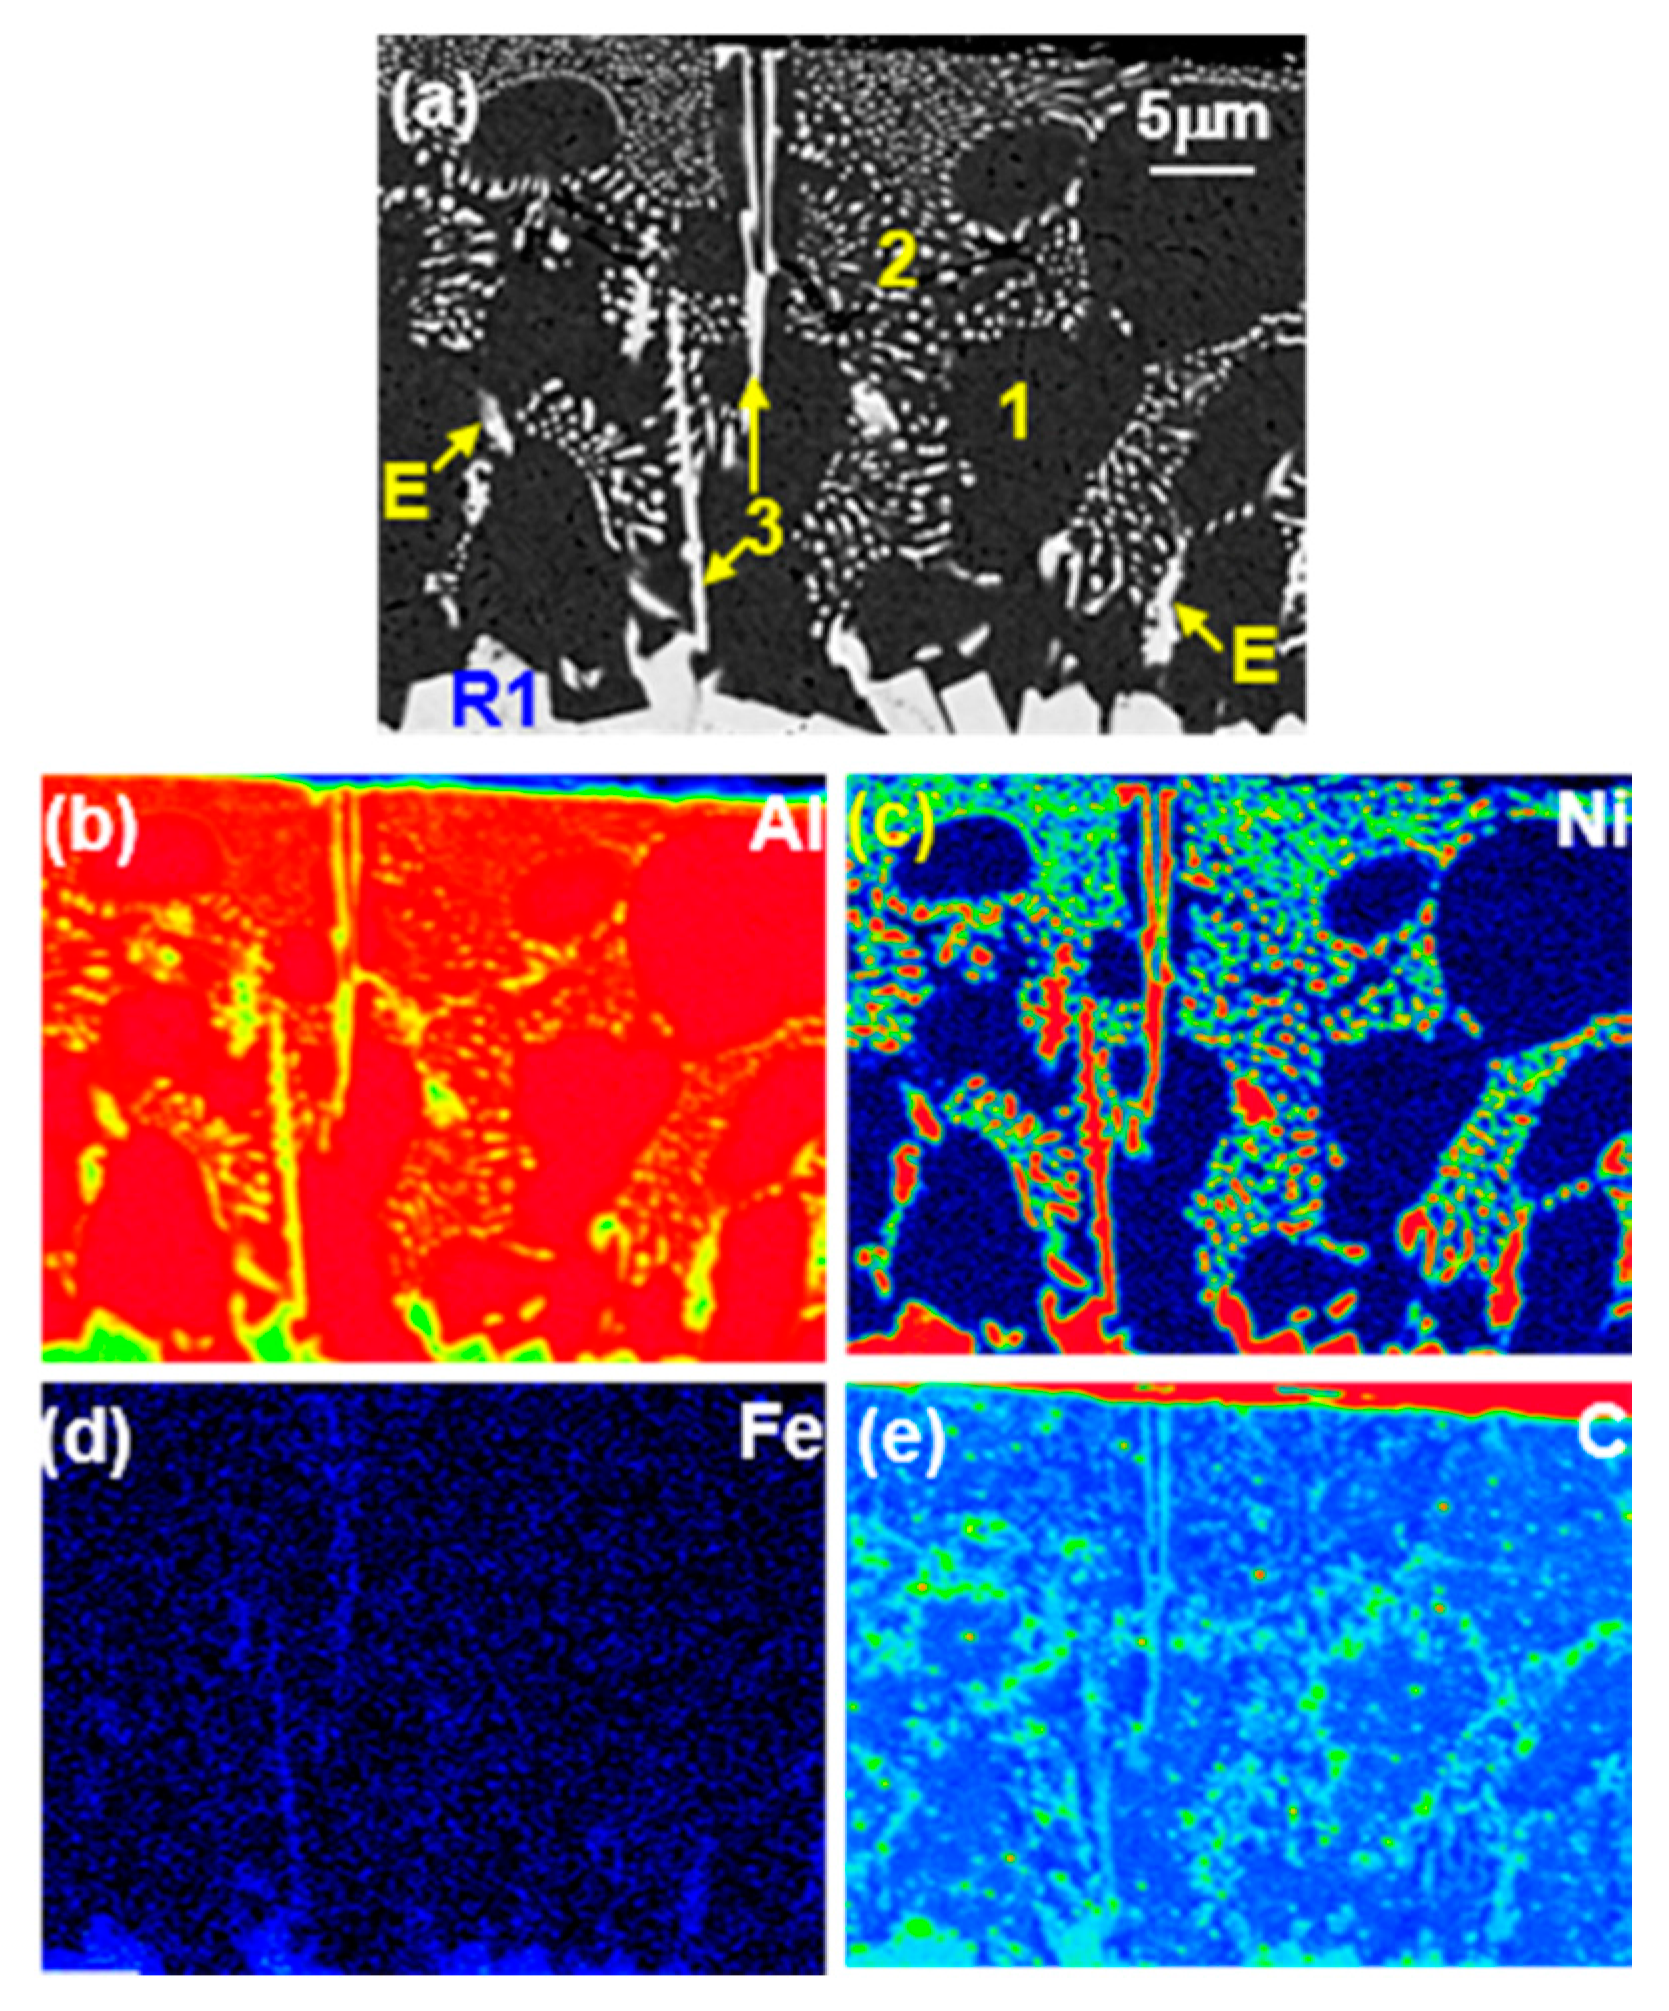
Figure 4.
X-ray diffractometer (XRD) analysis result of coating that was hot-dipped at 690 °C for 120 s.
Figure 4.
X-ray diffractometer (XRD) analysis result of coating that was hot-dipped at 690 °C for 120 s.

Figure 5.
EPMA analysis results of reaction layers near the original steel interface in sample that was hot-dipped at 690 °C for 120 s: (a) BSE Image; (b) Al; (c) Ni; (d) Fe; (e) C.
Figure 5.
EPMA analysis results of reaction layers near the original steel interface in sample that was hot-dipped at 690 °C for 120 s: (a) BSE Image; (b) Al; (c) Ni; (d) Fe; (e) C.
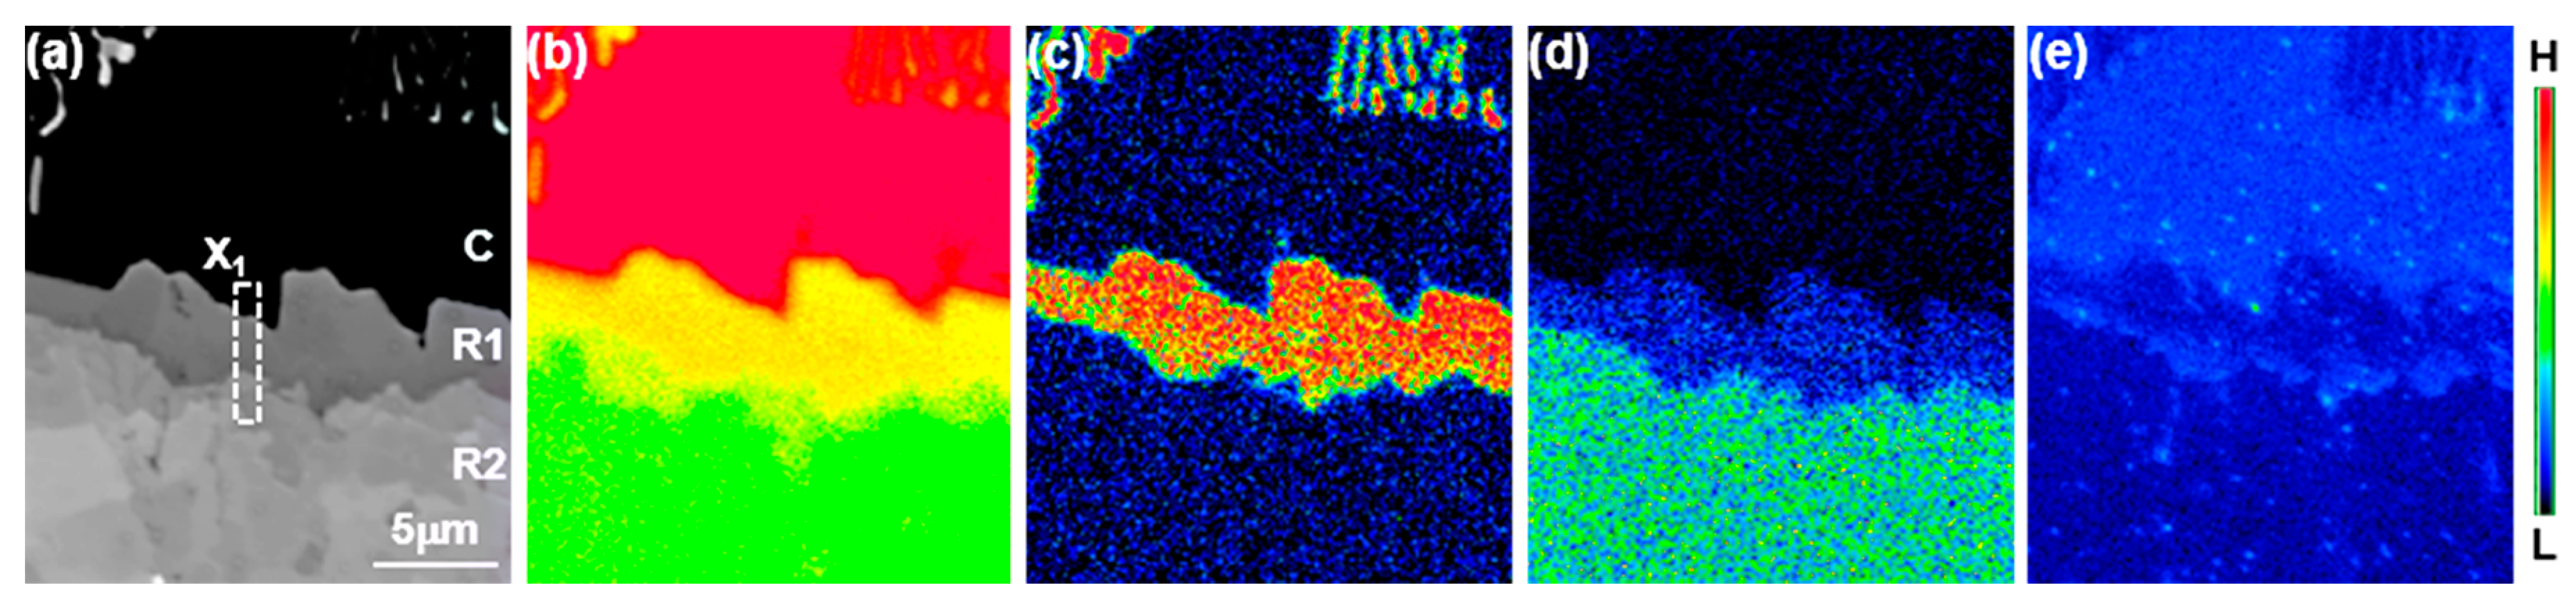
Figure 6.
Scanning transmission electron microscopy (STEM) results showing the of focused ion beam (FIB) specimen extracted from the area denoted by X1 in Figure 5: (a) high-angle annular dark-field (HAADF) Image; (b–f) results of EDS: (b) Al; (c) Ni; (d) Fe; (e) Mn; (f) C.
Figure 6.
Scanning transmission electron microscopy (STEM) results showing the of focused ion beam (FIB) specimen extracted from the area denoted by X1 in Figure 5: (a) high-angle annular dark-field (HAADF) Image; (b–f) results of EDS: (b) Al; (c) Ni; (d) Fe; (e) Mn; (f) C.

Figure 7.
Diffraction patterns obtained from areas denoted by 1–6 in Figure 6: (a): 1; (b) 2; (c) 3; (d) 4; (e) 5; (f) 6.
Figure 7.
Diffraction patterns obtained from areas denoted by 1–6 in Figure 6: (a): 1; (b) 2; (c) 3; (d) 4; (e) 5; (f) 6.

Figure 8.
EPMA analysis results of the reaction layers near the steel–R2 interface that was hot-dipped at 690 °C for 120 s: (a) BSE Image; (b) Al; (c) Ni; (d) Fe; (e) C.
Figure 8.
EPMA analysis results of the reaction layers near the steel–R2 interface that was hot-dipped at 690 °C for 120 s: (a) BSE Image; (b) Al; (c) Ni; (d) Fe; (e) C.
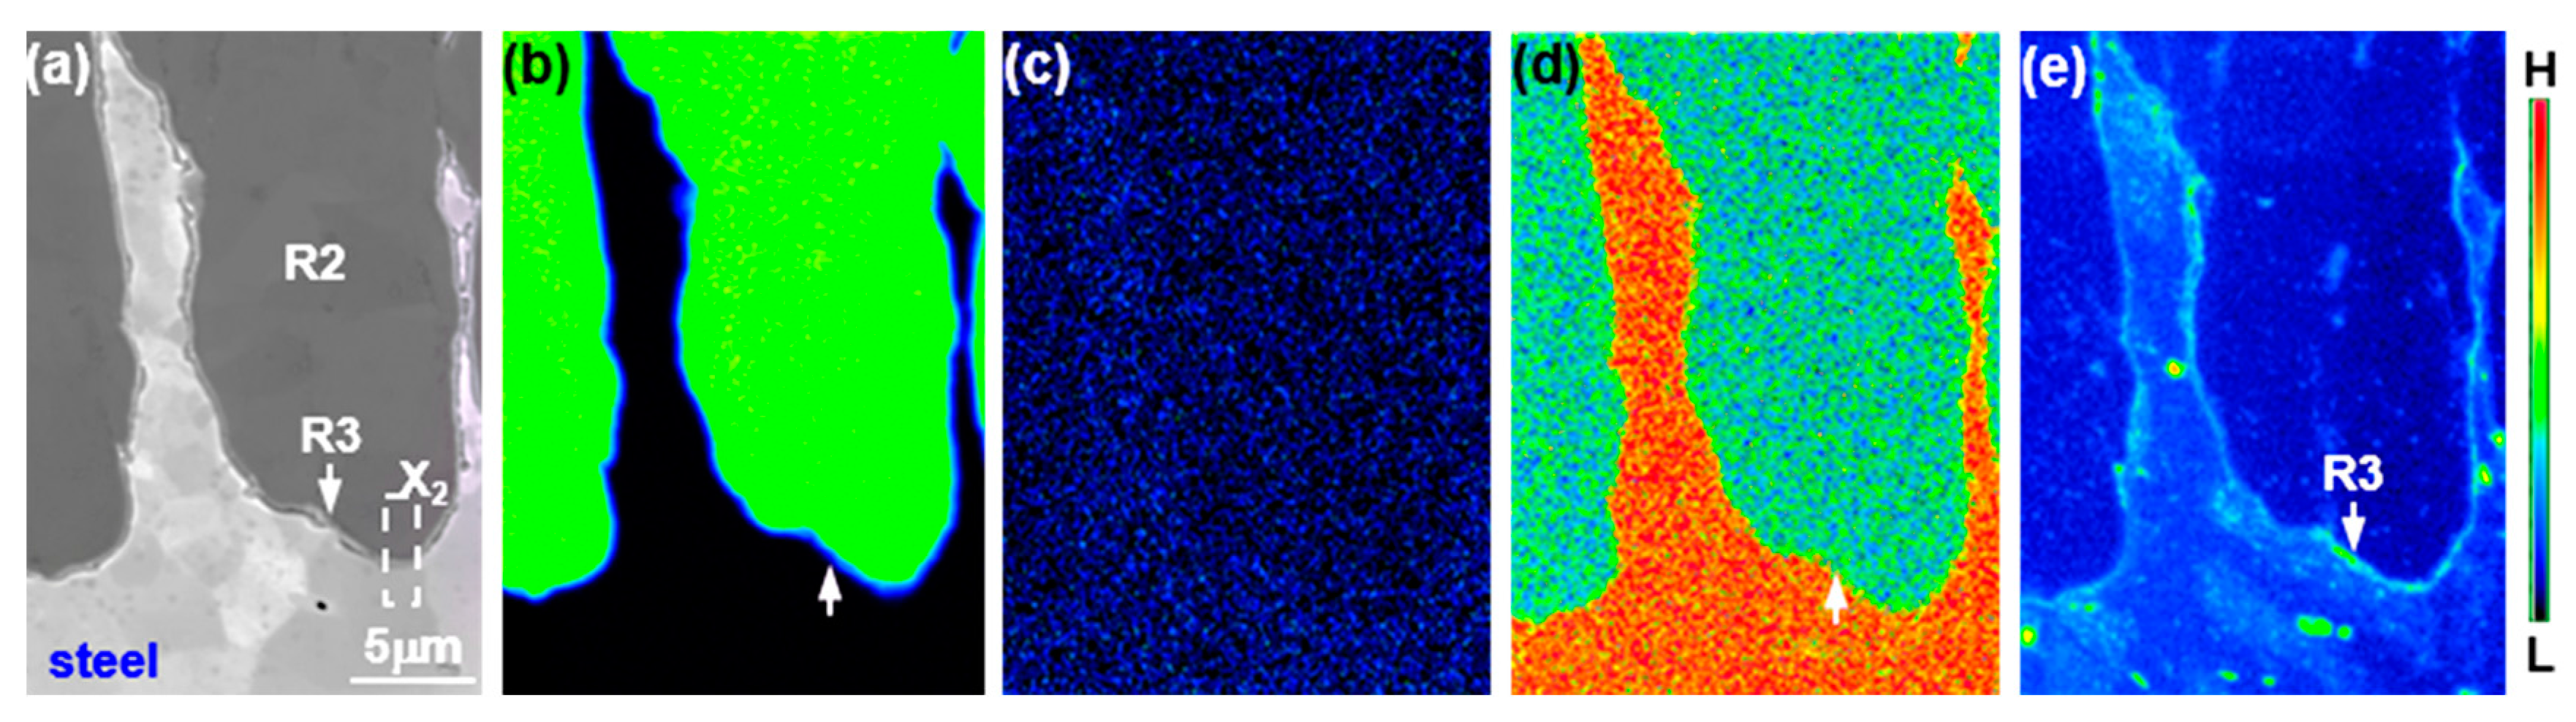
Figure 9.
STEM results showing of FIB specimen extracted from area denoted by X2 in Figure 8: (a) HAADF Image. (b–f) Results of EDS: (b) Al; (c) Ni; (d) Fe; (e) Mn; (f) C.
Figure 9.
STEM results showing of FIB specimen extracted from area denoted by X2 in Figure 8: (a) HAADF Image. (b–f) Results of EDS: (b) Al; (c) Ni; (d) Fe; (e) Mn; (f) C.
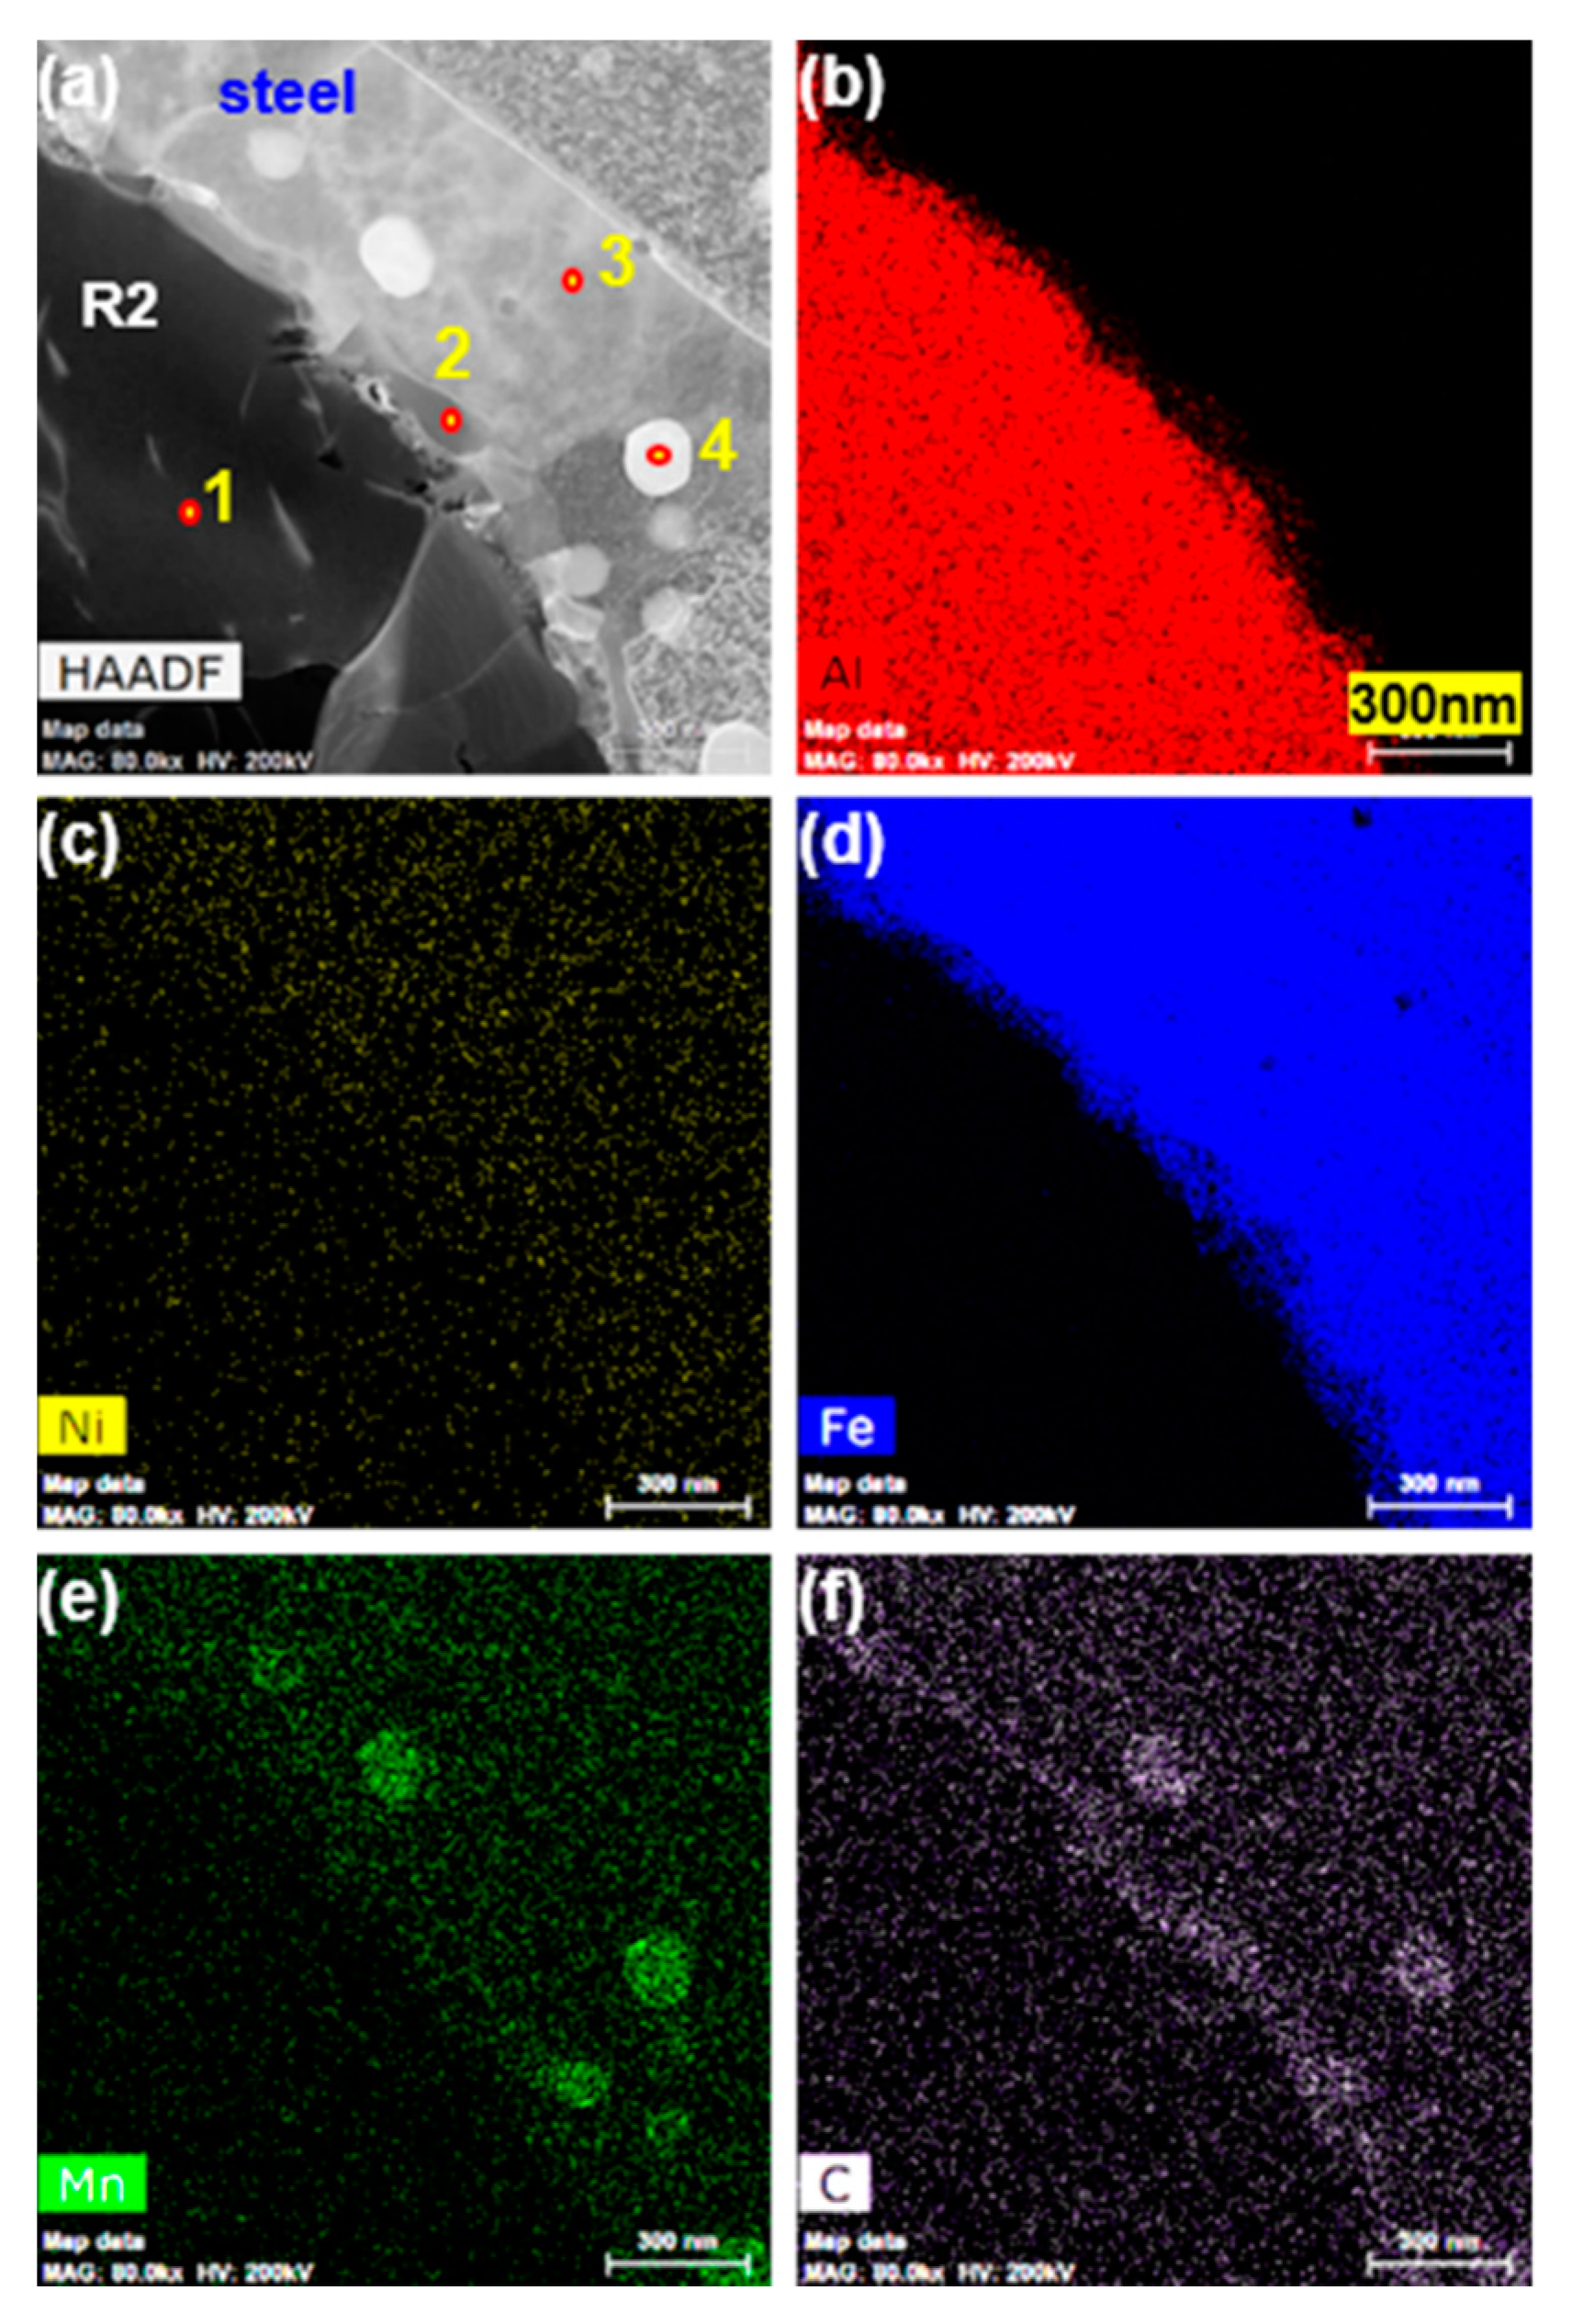
Figure 10.
Diffraction pattern obtained from area indicated by 1–4 in (a) of Figure 7: (a) 1; (b) 2; (c) 3; (d) 4.
Figure 10.
Diffraction pattern obtained from area indicated by 1–4 in (a) of Figure 7: (a) 1; (b) 2; (c) 3; (d) 4.
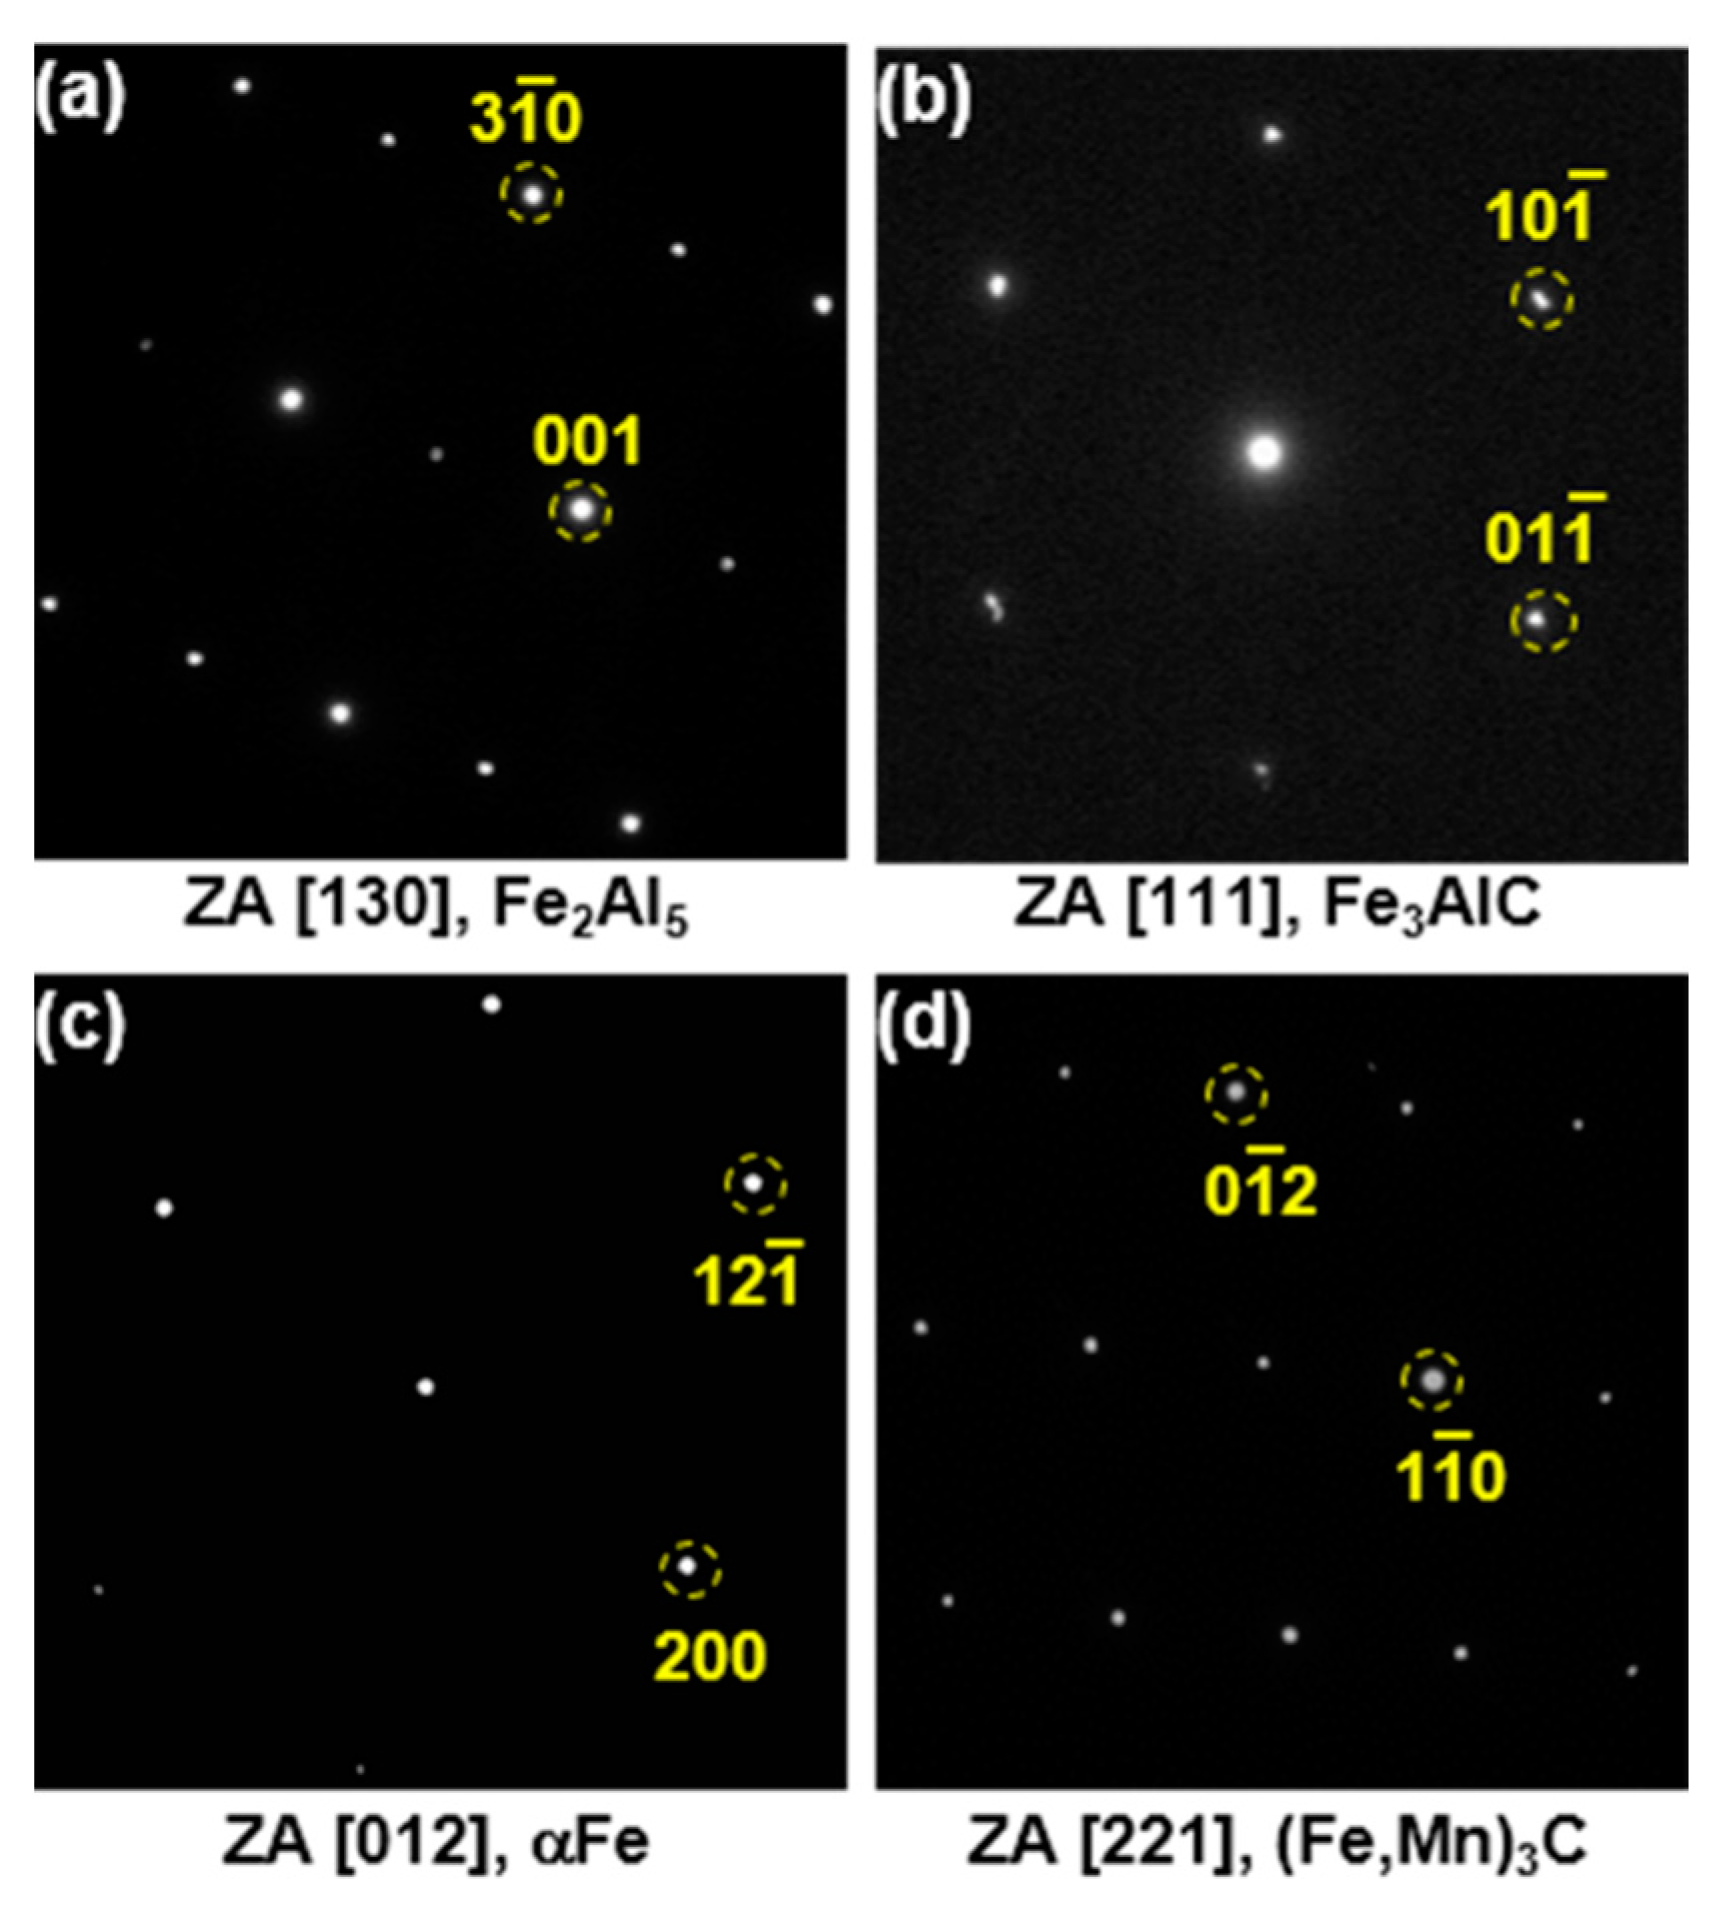
Figure 11.
Part of the (Al–7Ni)–xFe quasi-binary phase diagram calculated using Thermo-Calc™.

Figure 12.
Change in thickness of (a) Fe2Al5 (η) phase and (b) Al9FeNi (T) phase as function of the square root of dipping time (s1/2).
Figure 12.
Change in thickness of (a) Fe2Al5 (η) phase and (b) Al9FeNi (T) phase as function of the square root of dipping time (s1/2).

Table 1.
Energy-dispersive spectroscopy (EDS) analysis results and expected phases in the area indicated by 1–5 in Figure 2.
Table 1.
Energy-dispersive spectroscopy (EDS) analysis results and expected phases in the area indicated by 1–5 in Figure 2.
| No. | Chemical Composition (at. %) | Expected Phases | ||||
|---|---|---|---|---|---|---|
| Al | Ni | Si | Fe | Mn | ||
| 1 | 97.84 | 0.69 | 0.60 | 0.38 | 0.49 | Al |
| 2 | 83.36 | 14.50 | 0.80 | 0.86 | 0.48 | Al3Ni |
| 3 | 86.83 | 11.27 | 0.72 | 0.81 | 0.37 | Al + Al3Ni |
| 4 | 78.33 | 12.18 | 0.78 | 7.96 | 0.76 | Al9FeNi |
| 5* | 75.00 | 1.08 | 0.90 | 22.09 | 0.93 | Fe2Al5 |
| 5 | 71.41 | 0.88 | 1.08 | 25.44 | 1.19 | Fe2Al5 |
Table 2.
EDS analysis results and expected phases in the area indicated by 1–4 in Figure 6a.
Table 2.
EDS analysis results and expected phases in the area indicated by 1–4 in Figure 6a.
| No. | Al (at. %) | Fe (at. %) | Ni (at. %) | Expected Phases |
|---|---|---|---|---|
| 1 | 100 | - | - | Al |
| 2 | 75.74 | 2.08 | 22.18 | Al9FeNi |
| 3 | 76.03 | 8.23 | 15.74 | Al9FeNi |
| 4 | 76.85 | 10.72 | 12.42 | Al9FeNi |
| 5 | 71.67 | 28.33 | - | Fe2Al5 |
| 6 | 67.34 | 32.65 | - | Fe2Al5 |
Table 3.
EDS analysis results and expected phases in the area indicated by 1–4 in Figure 7a.
Table 3.
EDS analysis results and expected phases in the area indicated by 1–4 in Figure 7a.
| No. | Al (at. %) | Fe (at. %) | Mn (at. %) | C (at. %) | Expected Phases |
|---|---|---|---|---|---|
| 1 | 68.53 | 31.46 | - | - | Fe2Al5 |
| 2 | 18.51 | 65.31 | - | 16.17 | Fe3AlC |
| 3 | 0.20 | 97.80 | - | 0.32 | αFe |
| 4 | 76.85 | 78.23 | 4.24 | 17.52 | (Fe,Mn)3C |
© 2017 by the authors. Licensee MDPI, Basel, Switzerland. This article is an open access article distributed under the terms and conditions of the Creative Commons Attribution (CC BY) license (http://creativecommons.org/licenses/by/4.0/).
Share and Cite
MDPI and ACS Style
Yun, J.-G.; Lee, J.-H.; Kwak, S.-Y.; Kang, C.-Y. Microstructural Evolution of Intermetallic Compound Formed in Boron Steel Hot-Dipped in Al–7%Ni Alloy. Metals 2017, 7, 393. https://doi.org/10.3390/met7100393
AMA Style
Yun J-G, Lee J-H, Kwak S-Y, Kang C-Y. Microstructural Evolution of Intermetallic Compound Formed in Boron Steel Hot-Dipped in Al–7%Ni Alloy. Metals. 2017; 7(10):393. https://doi.org/10.3390/met7100393
Chicago/Turabian StyleYun, Jung-Gil, Jae-Hyeong Lee, Sung-Yun Kwak, and Chung-Yun Kang. 2017. "Microstructural Evolution of Intermetallic Compound Formed in Boron Steel Hot-Dipped in Al–7%Ni Alloy" Metals 7, no. 10: 393. https://doi.org/10.3390/met7100393
Note that from the first issue of 2016, this journal uses article numbers instead of page numbers. See further details here.