Effect of Weld Bead Shape on the Fatigue Behavior of GMAW Lap Fillet Joint in GA 590 MPa Steel Sheets
by

Insung Hwang
1, 
Dong-Yoon Kim
1,
Geunho Jeong
1,2,
Munjin Kang
1,
Dongcheol Kim
1 and
Young-Min Kim
1,* 1
Joining R & D Group, Korea Institute of Industrial Technology, 156 Gaetbeol-ro (Songdo-dong), Yeonsu-Gu, Incheon 21999, Korea
2
Department of Mechanical Engineering, Hanyang University, 222 Wangsimni-ro, Seoul 04763, Korea
*
Author to whom correspondence should be addressed.
Metals 2017, 7(10), 399; https://doi.org/10.3390/met7100399
Submission received: 21 August 2017
/
Revised: 23 September 2017
/
Accepted: 24 September 2017
/
Published: 28 September 2017
Abstract
:In this study, the effect of weld bead shape on the fatigue strength of lap fillet joints using the gas metal arc welding (GMAW) process was investigated. The base material used in the experiment was 590 MPa grade galvanealed steel sheet with 2.3 mm and 2.6 mm thickness. In order to make the four types of weld beads with different shapes by factors such as length, angle, and area, the welding process, wire feeding speed, and joint shape were changed. The stress-number of cycles to failure (S–N) curve and fatigue strength were obtained from the fatigue test for four types of weld bead, and the cause of the fatigue strength difference was clarified through the analysis of the geometrical factors, such as length, angle, and area of the weld bead. In addition, the relationship between weld bead shape and fatigue strength was discussed.
1. Introduction
Due to factors such as global warming, depletion of resources, and rising oil prices, the development direction of the global automobile industry is set to increase energy efficiency [1]. For this reason, the application of high-strength steel of 590 MPa grade is increasing in chassis parts with a lightweight trend [2].
Automobile chassis components are parts that support the full load of the vehicle and are subject to repeated fatigue loads during vehicle operation. In addition, chassis components are mostly manufactured by arc welding with a lap fillet joint. Generally, welds are known to act as structural and metallurgical discontinuities that reduce the fatigue strength [3]. Stress concentration is one of the representative factors of structural discontinuity. Metallurgical discontinuities include differences in properties between the base material, the welded part, and the heat-affected zone due to welding heat input. However, it has been reported that the effect of the weld bead on the metallurgical discontinuity is difficult to confirm because the stress concentration effect on the weld bead is dominant in the lap-fillet-joint-shaped arc weld [4]. Therefore, a number of previous studies have been carried out to clarify the relationship between weld bead shape and fatigue strength in lap fillet joint arc welding. Ahiale et al. [5] compared the fatigue strengths of the welds of gas metal arc welding (GMAW) and plasma arc welding (PAW) in lap fillet joints. It is reported that the shape of the PAW weld is wider and gentler than that of the GMAW weld, improving the fatigue characteristics. Kognti et al. [6] presented different welds by varying the welding conditions at the lap fillet joint and compared the fatigue strength of the welds and it was confirmed that the fatigue strength was increased by increasing the weld toe angle. Chung et al. [7] showed welds with different weld toe angles and fatigue strength according to the change of torch and push angle. It was also confirmed that the fatigue life was increased about two times as the toe angle increased by 30°. Feng et al. [8] confirmed the fatigue strength of various combinations of advanced high strength steel (AHSS) in lap fillet joints, and as a result, it was confirmed that the fatigue strength increased with increasing weld toe angle and weld toe radius. In addition, the fatigue strength is predicted through the stress concentration factor Kt of weld toe. Beretta et al. [9] obtained the stress concentration factor of the weld toe and root by the finite element method (FEM) in the lap fillet joint of Al alloy and predicted the fatigue strength through the Kt. Kim et al. [10] developed a process to predict the fatigue life of automotive mufflers in lap fillet joints. In order to predict the fatigue life, the Kt was obtained by FEM after modeling the shape of the welded part. Based on the Kt, the fatigue life predicted by the change of weld toe angle and weld toe radius was estimated. As mentioned above, the previous studies on the arc weld and fatigue characteristics of lap fillet joints show that the improvement of weld toe angle increases the fatigue strength. However, none of the studies investigated the relationship between fatigue strength and other factors except weld toe angle. Kim et al. [11] calculated the stress concentration factor (Kt) by using the radius and the degree of the toe and the height of the welded part in the butt weld, calculated the fatigue notch coefficient (Kf) for the fatigue life prediction and then predicted the fatigue life using the alternative method. The residual stress in welds also affects the fatigue strength of welded joint. Richter-Trummer et al. [12] measured the residual stress distribution in a 6082-T6 Al alloy metal inert gas (MIG) butt welded thin plate using the contour method and compared the fatigue behavior of the plate with and without residual stress. Wang et al. [13] investigated the residual stress and fatigue strength of hybrid laser-metal inert gas welded Al alloy compared with the MIG welded joint and it was confirmed that the fatigue strength was improved by the narrow weld and heat affected zone (HAZ), weak softening behavior, and low residual stress level.
In this study, the shape of weld beads affecting the fatigue strength in the arc welds of lap fillet joints was investigated. For this purpose, four types of welds with different shapes were fabricated. The stress-number of cycles to failure (S–N) curve was derived from the fatigue test to confirm the fatigue strength in order to determine the bead shape of the welded part affecting the fatigue strength, angle, length and area of the weld bead. The relationship between the fatigue strength and the bead shape factor of the weld is discussed.
2. Experimental procedures
2.1. Materials
In this study, two kinds of 590 MPa grade galvannealed ferrite-bainite (FB) steel sheets with 2.3 mm and 2.6 mm thickness were used as the base material (GA 590 FB). The chemical compositions and mechanical properties of the base material are shown in Table 1. The chemical composition and mechanical properties of the base material were obtained from a mill test certificate provided by Hyundai Steel Company (Dangjin, Korea). The coating amount of one side of the base material was 43.8 g/mm2. The welding wire was AWS A5.18 ER70S-3 standard wire with a diameter of 1.2 mm. Table 2 shows the chemical composition and mechanical properties of the welding wire.
2.2. Welding Conditions
The size of the welding specimen used in this study was 150 mm × 300 mm and the weld joint shape was a lap fillet joint. The overlap length was fixed at 25 mm and the weld length was 300 mm. In order to fabricate various shapes of welds during GMAW, the welding process, wire feeding speed, and joint shape were changed. The four different types of welds with different shapes were fabricated by controlling the welding parameters. The details of the welding methods and conditions are shown in Table 3.
In the case of type 1, the base material with 2.3 mm thickness was used for the lap fillet joint of geometry A as shown in Figure 1a. In this case, the welding process used a tandem metal active gas (MAG) welding process. MAG direct current (DC) is applied to the leading torch and a MAG DC pulse is applied to the trailing torch. The wire feeding speed of the leading MAG and trailing MAG was fixed at 3 m/min and 4 m/min, respectively. Type 2 was welded to the same material and type of joint as type 1. Single MAG DC was applied to the welding process, and the wire feeding speed was 7 m/min, which was equal to the wire feeding speed of type 1. In the case of type 3, welding was performed on the joint shape of geometry B, as shown in Figure 1b, using a base material with a thickness of 2.6 mm. The tandem MAG welding process was applied, and the wire feeding speed was fixed at 3 m/min for the leading MAG and 5 m/min for the trailing MAG. Type 4 used the same base material and joint shapes as type 3. The welding process used was a single MAG DC and fixed at a wire speed of 8 m/min. In all types, the welding speed was fixed at 80 cm/min, the working angle was 45°, and the shielding gas was 90% Ar + 10% CO2. As mentioned above, for the tandem MAG process, two gas metal arc welding (GMAW) processes were applied. Under the tandem MAG process, the shape of the welds varies greatly depending on the angle and distance between the wires. In this study, the angle between the wires is 40°, in which the drag angle of the leading MAG is 20°, the push angle of the trailing MAG is 20°, and the distance between the wires is fixed to 5 mm, as shown in Figure 2.
2.3. Fatigue Test
During arc welding of the zinc-coated steel sheet, zinc is vaporized and defects occur inside and outside of the weld as shown in Figure 3. In this study, the fatigue test specimens were obtained in the welds without any weld defects through the visual inspection and radiographic test of welds. Fatigue test specimens were prepared in accordance with ASTM E-466. The fatigue tests were carried out with an INSTRON 8801 (Instron, Norwood, MA, USA) with a 5-ton capacity, as shown in Figure 4. In Figure 4, a schematic diagram of the stress loading during the fatigue test, Smax means the maximum load in the fatigue test, Smin means the minimum load, and the stress range Sr means Smax − Smin. Mean stress is the maximum load (Smax) and the minimum load (Smin) mean value. In this study, the Y axis of the S–N curve is expressed as max load stress (Smax). In the fatigue test, the load stress decreased by 60% to 10% compared to the tensile strength (610 MPa) of the base material, and the maximum stress was decreased by 5% at 20% load stress or less. The fatigue test was repeated three times for the same load stress to ensure reliability. The frequency of the load stress was 20 Hz and the fatigue test was performed under the condition of the stress ratio of the minimum loading to the maximum loading stress (R = Smin/Smax), which was tested to 0.1 in the sine waveform. The fatigue strength was set to the maximum stress-satisfying fatigue cycle, reaching 2 × 10⁶, which was regarded as the permanent fatigue limit value in the general weld fatigue test. When comparing the fatigue strengths of different components subject to a similar loading, it is convenient to express fatigue strength in terms of the stresses corresponding to particular lives, for 105, 106 and 107 cycles on the S–N curve. The choice of reference life is quite arbitrary. Traditionally, 2 × 10⁶ cycles have been used, and indeed some design codes refer to their S–N curves in terms of the corresponding stress range. For these reasons, in the discussion later in this study, the fatigue strengths of the welded joints in steel at 2 × 10⁶ cycles are taken as a basis for comparison [14].
3. Results and Discussion
3.1. Weld Bead Appearance
Figure 5 shows the weld bead shapes and cross-sections of the weld according to the four welding conditions in Table 3. In all types of sample, good weld beads could be obtained. It was difficult to distinguish bead shape differences according to joint geometries A and B. However, weld beads of type 1 and 3 using a tandem MAG process show a more gentle slope than that of type 2 and 4 using a single MAG process, as shown in Figure 5.
3.2. Tensile Shear Strength
The tensile shear strength of the four weld types is shown in Table 4. All of the weld types showed similar tensile shear strengths between 608 MPa and 615 MPa. Type 4 showed the lowest tensile shear strength of about 608 MPa, and type 1 had the highest value of 615 MPa, but the difference was insignificant. From these results, the difference in the shape of the weld bead does not greatly affect the tensile shear strength.
3.3. Fatigue Behavior
As mentioned above, the welds showed similar tensile shear strengths, but dissimilar fatigue strength and life. Figure 6 shows the S–N curve for each weld type. As can be seen in Figure 6, the S–N curve is different depending on the weld type. Fatigue strength was 110 MPa for type 1, 122 MPa for type 3, and 62 MPa for types 2 and 4. The highest fatigue strength values were obtained from type 3. In order to analyze the fatigue behavior of the material, it is also necessary to investigate the correlation between the fatigue strength and the thickness of the material. The thickness of the base material of type 4 is 2.6 mm, which is larger than that of the base material of types 1 and 2. In the case of butt welding, it is known that the fatigue strength increases as the thickness of the base material increases. However, lap fillet joints exhibit different behaviors compared to the butt joint. In the case of type 4, the fatigue strength was 62 MPa which was lower than that in type 1 or the same as type 2, even though the thickness of the base metal was thicker than types 1 and 2. The reason for this is that when the lap fillet joint is welded, the stress concentration effect on the welded part is considered to be more dominant than the effect of the base metal thickness compared to the butt joint. The fatigue strength of the overlap joint with fillet welds presented in the International Institute of Welding (IIW) specification is a double overlap joint, which is different from the case of this study. However, in the case of the overlap joint proposed in the IIW specification, stress is concentrated on the weld toe, and the toe crack is generated. In this case, it is stated that the fatigue class (FAT) 63 should be satisfied. In addition, it has been proposed that if the stress is concentrated on the weld throat and a root crack occurs, it should satisfy FAT 36 [15]. For comparison with this study, FAT 63 and FAT 36 are presented in Figure 6. In the case of tandem MAG welding, the shape of the weld bead tended to be more gentle and wider than that of single MAG. The fatigue strength was improved as the shape of the weld bead became gentler and the fatigue life was increased at the same maximum stress. For this reason, it is considered that the slope of the fatigue line is reduced compared to the single MAG when welding with tandem MAG. Therefore, the slope of the fatigue line varies depending on the welding process.
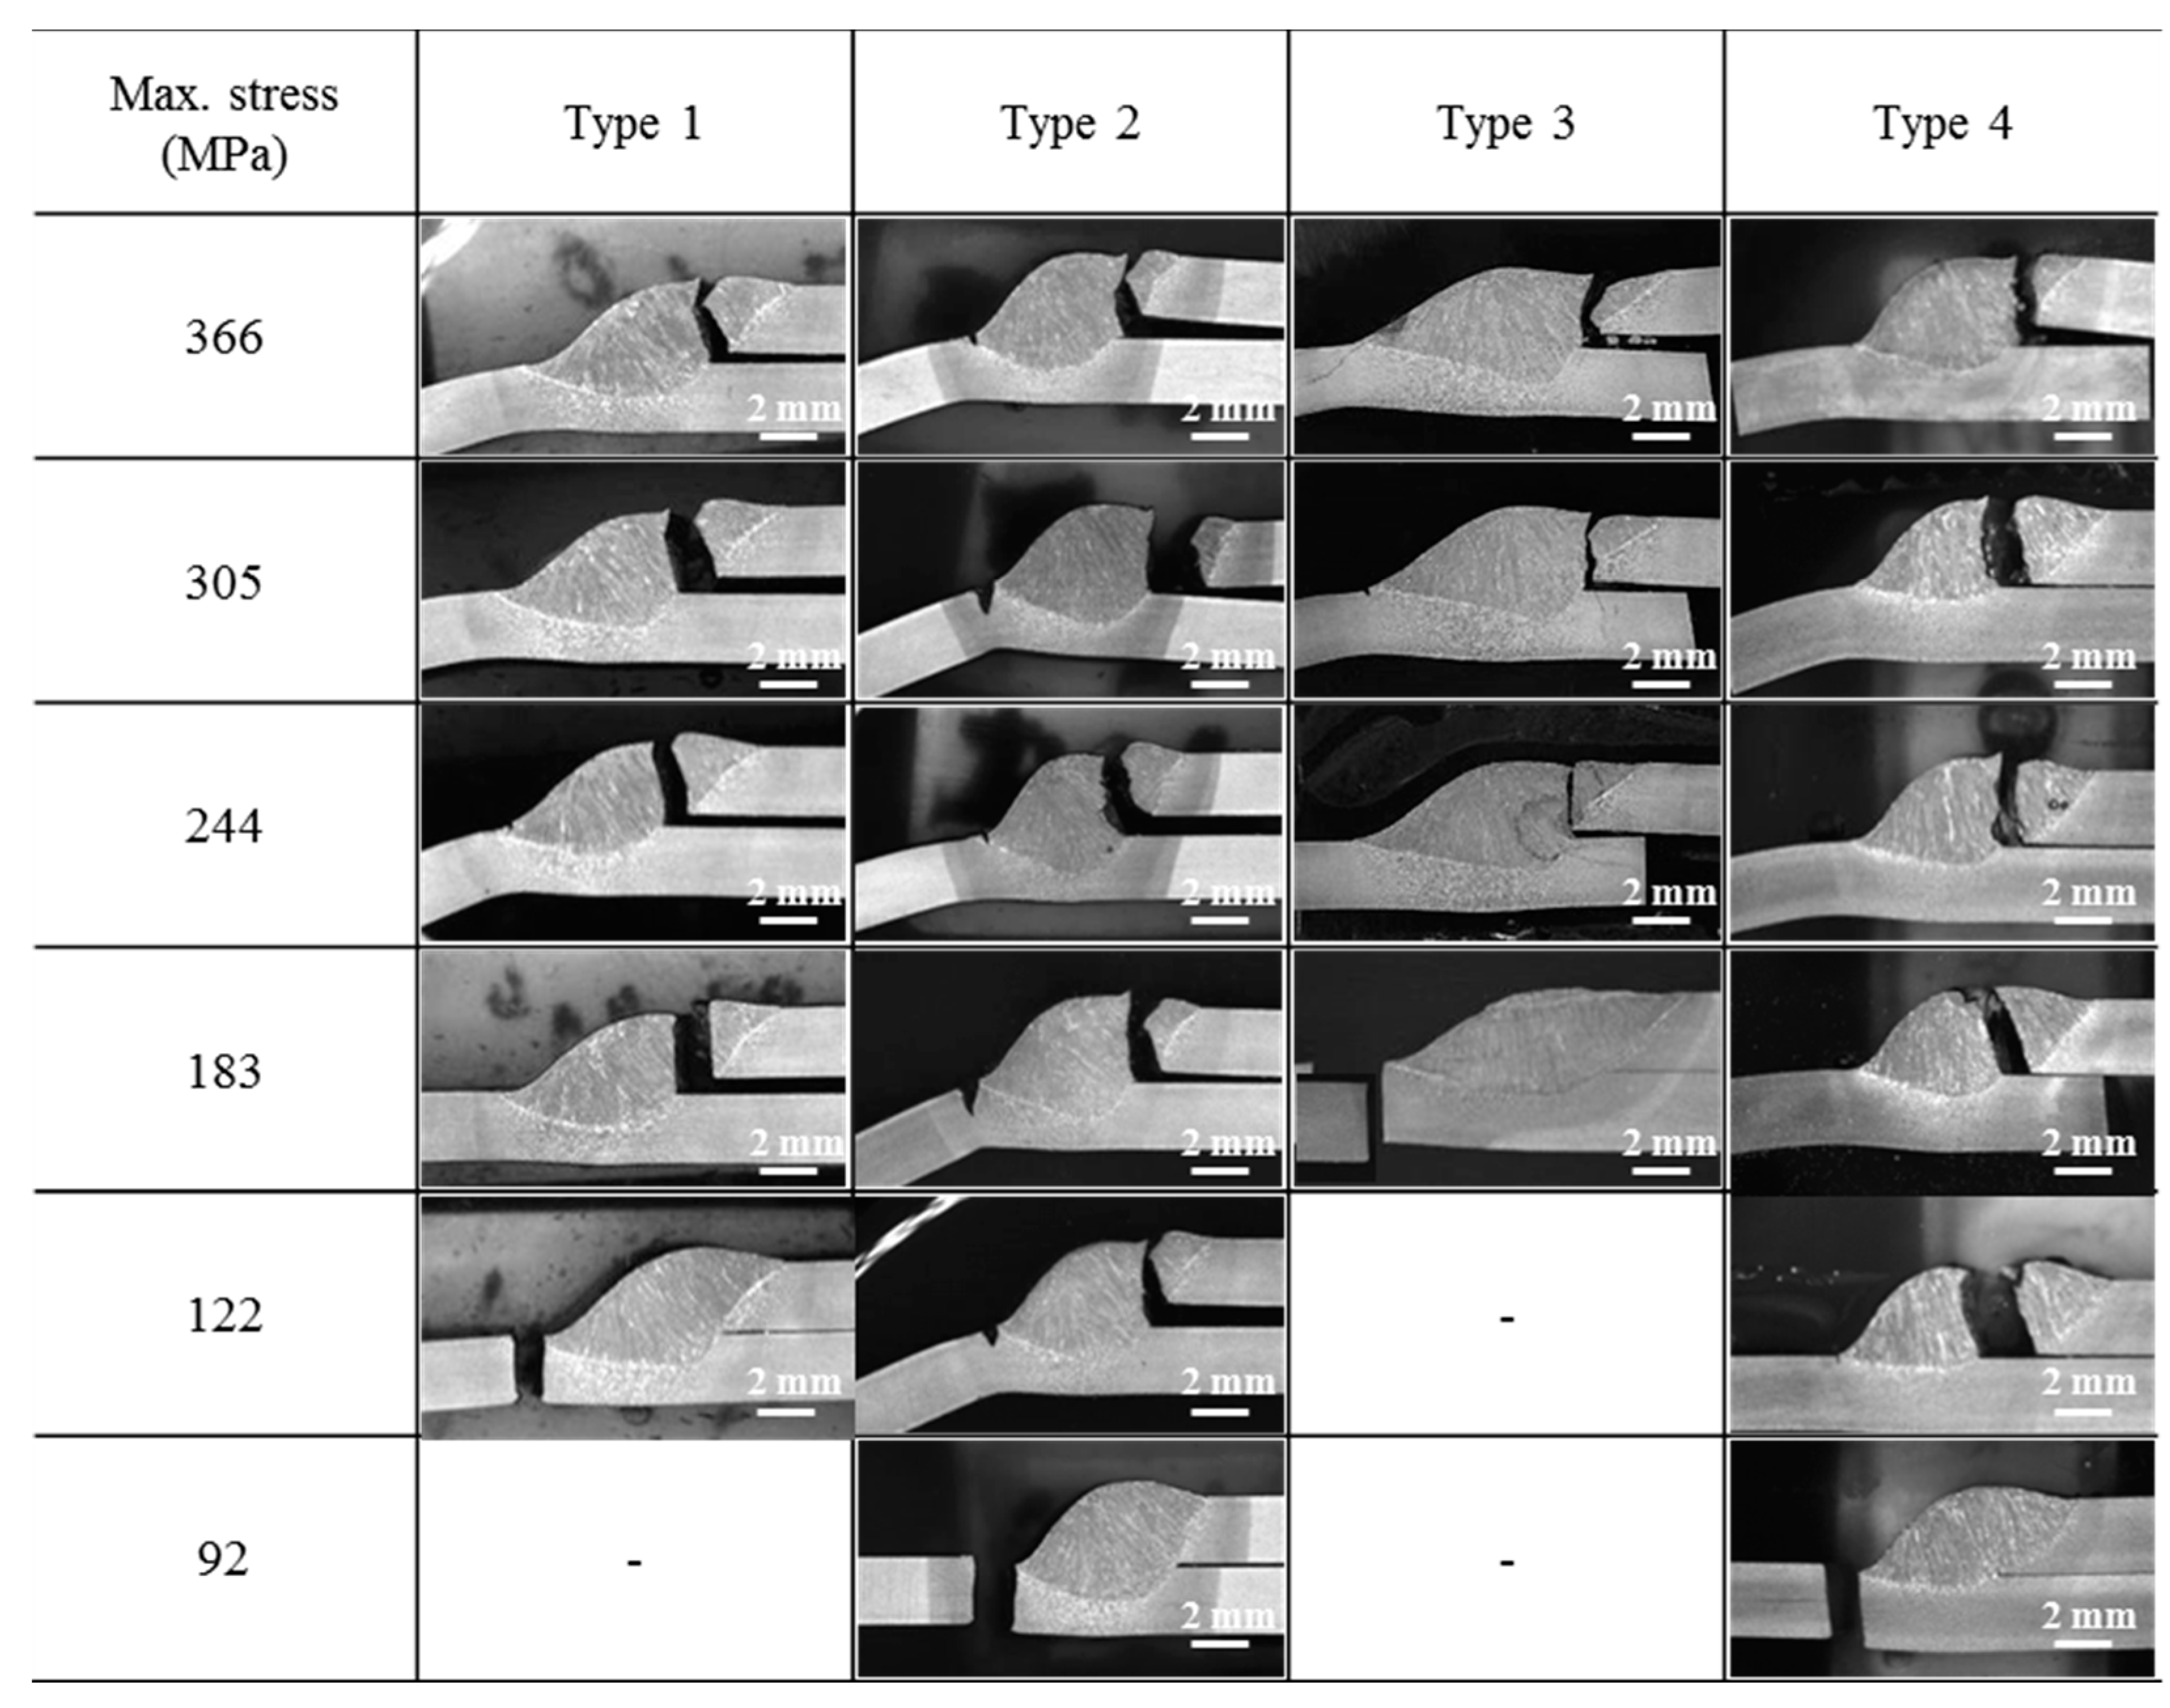
Figure 7 shows the cross-sections of the fatigue fracture of the welds according to each type of load stress. The fatigue fracture occurred in the weld throat at 183 MPa or greater in type 1, 122 MPa or greater in type 2 and 4, and 244 MPa or greater in type 3. Also, the fatigue fracture of the weld toe occurred at 122 MPa for type 1, 92 MPa for type 2 and 4, and 183 MPa for type 3. As shown in Figure 6, the cracks in the weld throat satisfy the line of FAT 36 and the cracks in the weld toe satisfy the line of FAT 63. In fatigue tests of the lap fillet joint, besides tensile stress, a secondary bending moment is also present. In the case of higher loads, the effect of the secondary bending moment at the weld root increases, and at low stress, the influence of the secondary bending moment becomes relatively smaller, and therefore the position of the stress concentration changes from the weld root to weld toe [4]. A high-speed camera was used to confirm the crack initiation point due to load stress during the fatigue test.
Figure 8 shows images taken with a high-speed camera in the type 2 specimen during the fatigue test at load stresses of 92 MPa and 366 MPa. The shooting speed of the high-speed camera was 1000 frames per second. Figure 8a shows the fatigue crack initiation at the weld toe when the load stress was 92 MPa, and Figure 8b shows the fatigue crack initiation at the weld root at the load stress of 366 MPa. As mentioned above, if the load stress is low, the stress is concentrated on the weld toe, and if the load stress is high, the stress is concentrated on the weld root and the crack is initiated and propagated.
3.4. Relationship Between Weld Parameters and Fatigue Strength
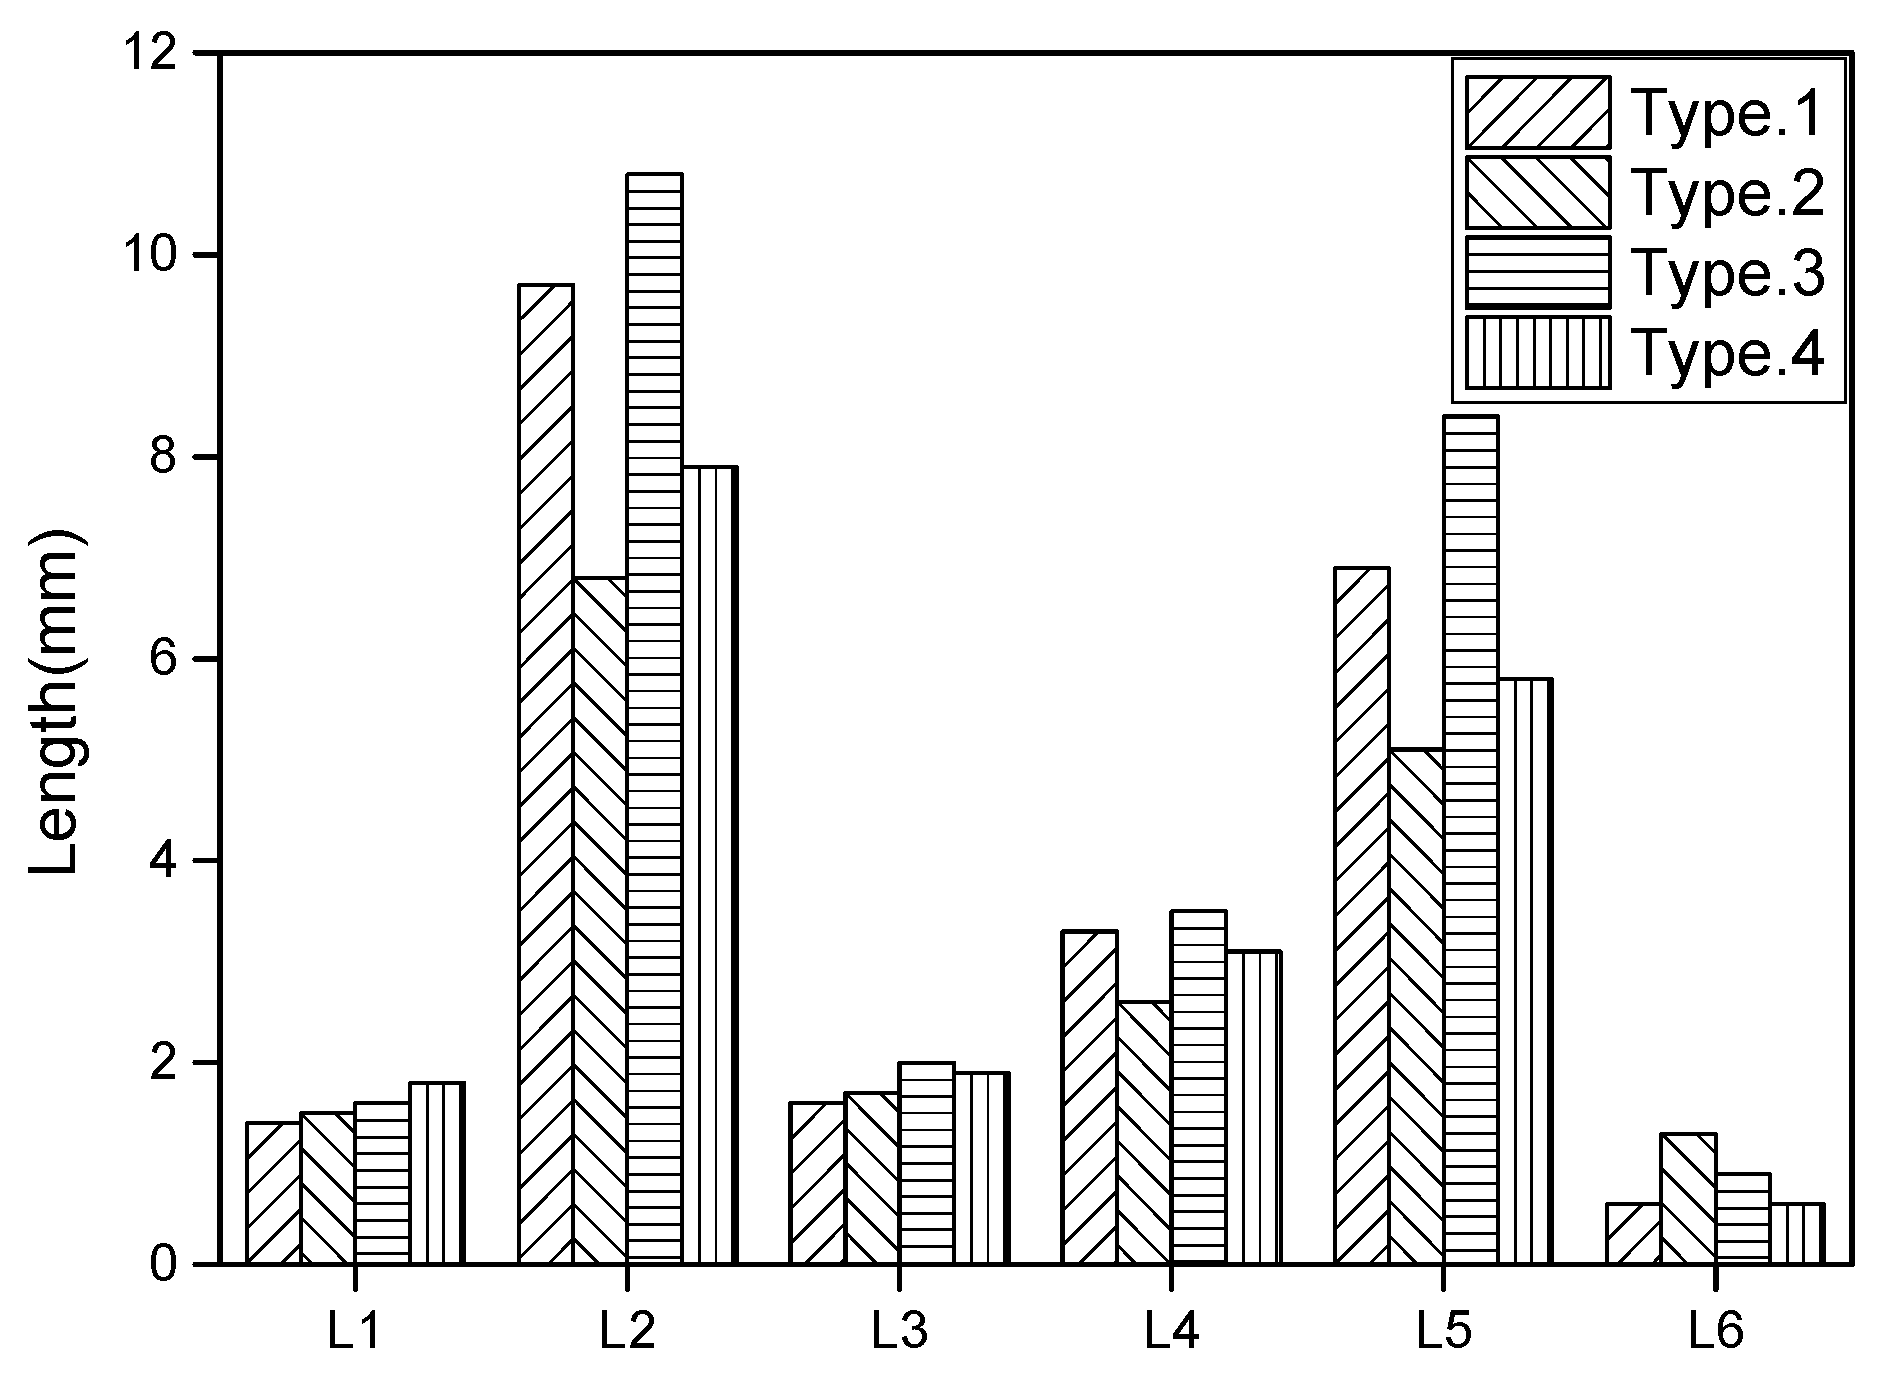
It is generally known that the fatigue strength increases when the welding toe angle is improved. However, there is a lack of detailed analysis on the relationship between the shape of the weld bead and the fatigue strength. Figure 9 shows the method of dividing the shape of the weld bead by factors such as length, angle, and area. Figure 9a shows the measurement results for the lengths of six parts, the bead height (L1), the distance between the lower and upper plate (L2), throat thickness (L3), the distance between the upper plate and the weld root (L4), the leg length (L5), and the penetration depth (L6), related to the shape of the weld bead by type.
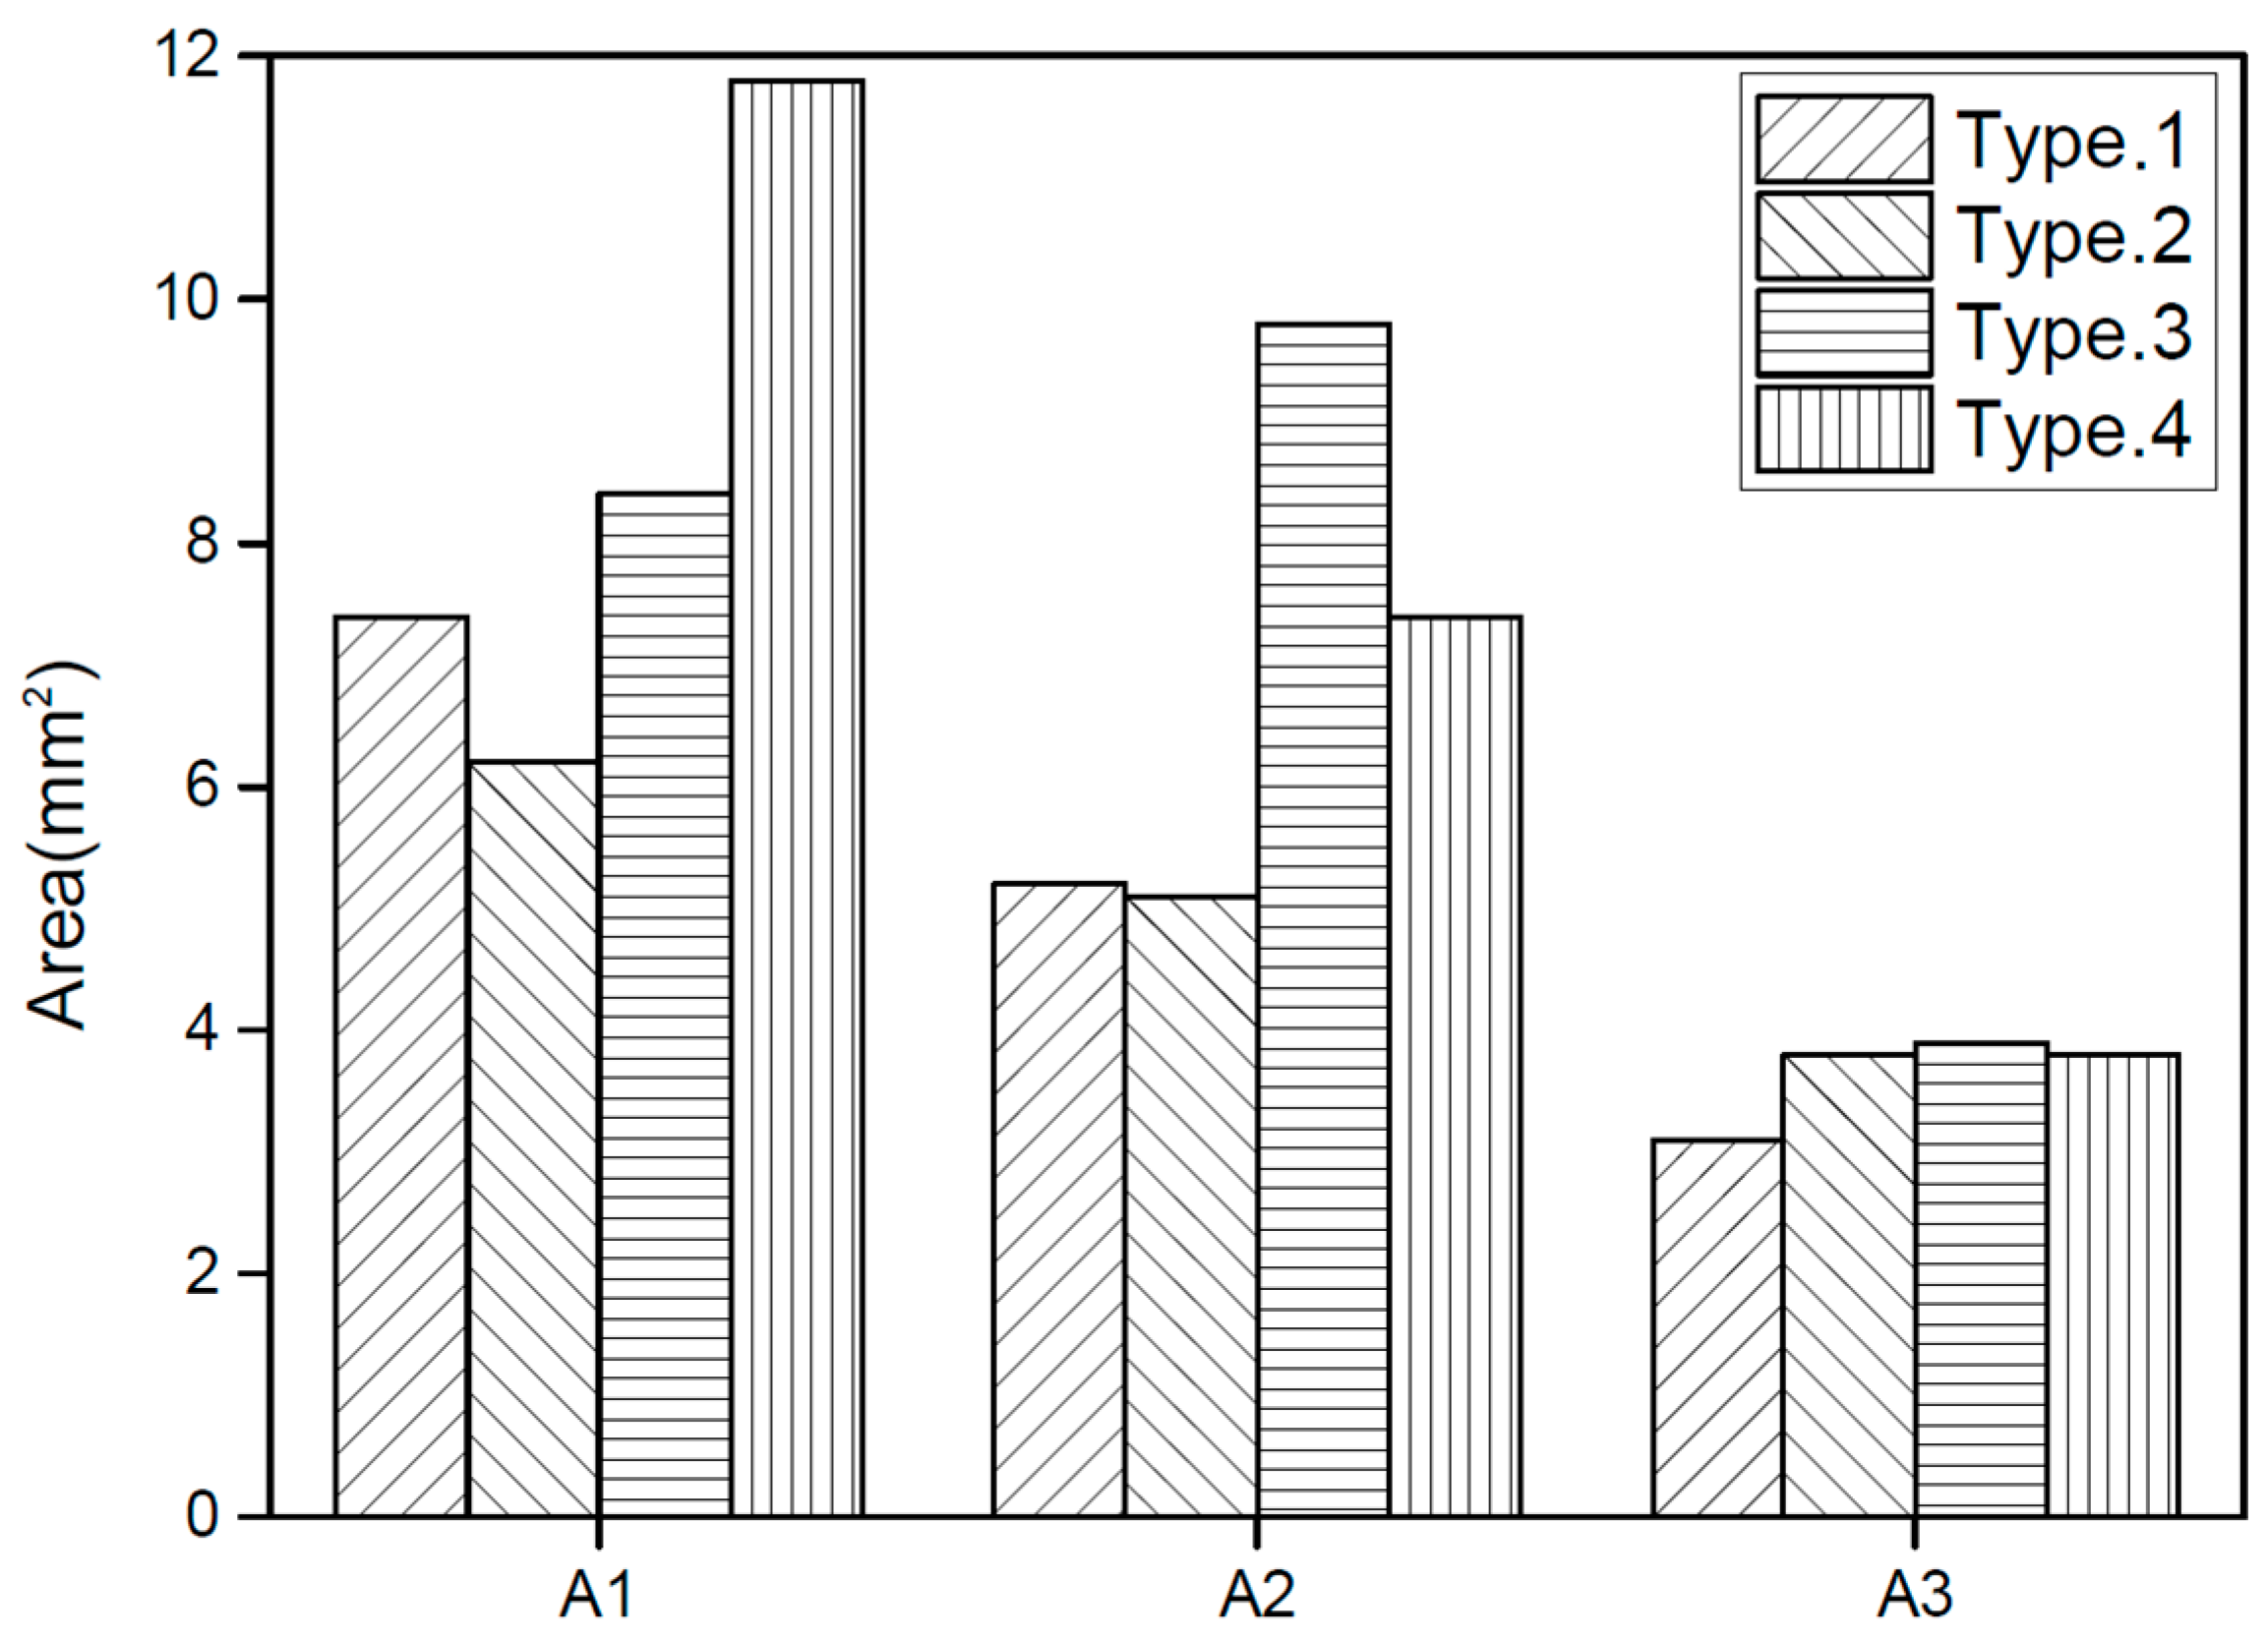
As shown in Figure 9b, the angle of the weld bead was measured at three different angles. The measured angle is the lower plate toe angle (θ1), the angle (θ2) between the lower plate and the upper plate toe part, and the angle (θ3) between the upper plate toe part and the root part. Figure 9c shows the area of weld bead shape divided into three parts. The three areas are divided into A1, which is the height area of the weld metal, A2, which is the area between the weld metal parts of L2 and L5, and finally A3, which is the melting area below L5.
Figure 10 shows the comparison of six lengths measured in four types of bead shapes. In the case of type 3, which had the largest fatigue strength (122 MPa) among the four types, L2 was 10.8 mm; in type 1, with a fatigue strength of 110 MPa, L2 was 9.7 mm. For types 2 and 4, with a fatigue strength of 62 MPa, L2 was 6.8 and 7.9 mm, respectively, which was smaller than types 1 and 3. In the case of leg length L5, type 3—with the highest fatigue strength—was 8.4 mm, and types 2 and 4—with the lowest fatigue strength—were 5.1 mm and 5.8 mm, respectively. This means that as the fatigue strength increased, L5 increased. In addition, depending on the type, L1 was 1.4 to 1.8 mm, L3 was 1.6 to 2.0 mm, L4 was 2.6 to 3.5 mm, and L6 was 0.6 to 1.3 mm. As shown above, L1, L3, L4, and L6 are almost the same as each other and it is difficult to find a correlation with the fatigue strength.
Figure 11 compares the results of measuring the angle of the bead shape according to the type. The angle θ1 of the lower plate was decreased from 154° in Type 3, 144° in Type 1, 132° in Type 2, and 130° in Type 4. As a result of measurement, fatigue strength tended to increase with an increasing toe angle, θ1. In the case of θ2, there was no significant difference between types, but in type 1, it was the lowest at 18°. In the case of θ3, type 3 was measured at 41°, type 1 at 49°, type 4 at 58°, and type 2 at 59°. As the θ3 increases, the fatigue strength tends to decrease.
Figure 12 compares the areas of the bead shapes according to type. A1 was the largest in type 4 (11.8 mm2) and the smallest in type 2 (6.2 mm2). A2 was the largest at 9.8 mm2 in Type 3 and 5.1 mm2 in type 2. The area of A3 was 3.1–3.9 mm2 depending on the type. From these results, it was confirmed that there is no correlation between the fatigue strength and the area of the weld bead. It has been reported that stress distribution due to the shape of the weld bead is varied and affects the static strength [16]. The distribution of the stress concentration according to the shape of the weld is considered to have an effect on the fatigue strength. More details on the stress concentration and the fatigue strength according to the shape of the weld bead will be discussed in a further study.
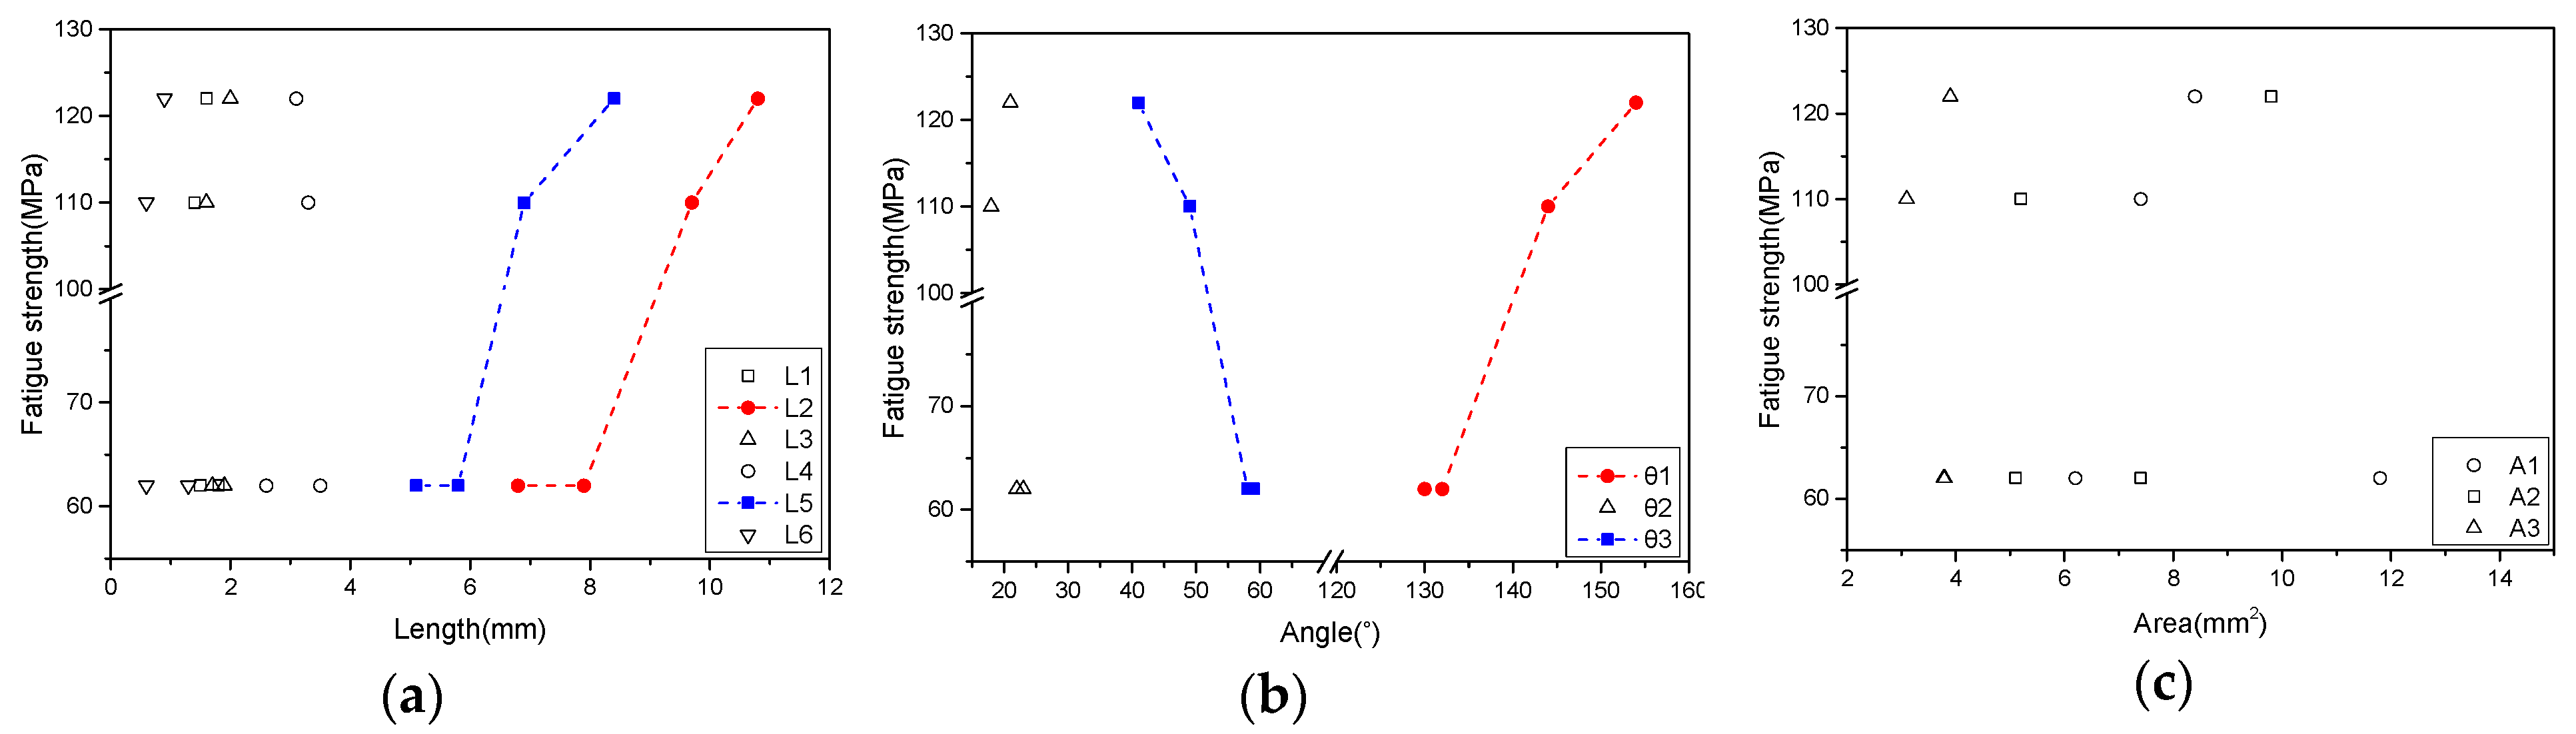
Figure 13 shows the relationship between the weld bead shape and fatigue strength. In Figure 13a, as the lengths of L2 and L5 increase, the fatigue strength tends to increase. The lengths of L1, L3, L4 and L6 were not correlated with the fatigue strength. Figure 13b shows the correlation between the angle of the weld and the fatigue strength. The fatigue strength increased when θ1 increased or θ3 decreased. The correlation between θ2 and the fatigue strength could not be confirmed. As shown in Figure 13c, no significant correlation was found between the area and fatigue strength.
4. Conclusions
In this study, the fatigue characteristics were evaluated for various weld bead shapes of lap fillet joints using 590 MPa grade Zn coated steel sheets.
- (1)
- In all four weld types, tensile shear strength was similar, between 608 MPa and 615 MPa, however, the fatigue strength and life differed. When welding with the tandem MAG welding process, a gentle weld bead was obtained compared with the single MAG welding process. The fatigue strength was 110 MPa for the tandem MAG and 62 MPa for the single MAG welding process when the base material thickness was 2.3 mm and the joint shape was vertical. When the base material thickness was 2.6 mm and the joint shape was horizontal, the fatigue strength was 122 MPa for the tandem MAG and 62 MPa for the single MAG welding process.
- (2)
- In all types of welds, weld metal fracture occurred at the higher load level and fatigue cracks started at the weld root. At the lower load level, fracture occurred in the weld toe part.
- (3)
- The shape of the weld is divided into factors such as length, angle, and area, and the effect of each factor on the fatigue strength was analyzed. The fatigue strength increased with the increase of the length of the legs and the length between the upper plate and the lower plate. In the case of the weld bead angle, the lower plate angle increased, the angle between the lower plate and the upper plate decreased, and the fatigue strength increased as the angle between the upper plate and the weld root decreased. The relationship between weld area and fatigue strength was not confirmed.
Acknowledgments
This work was supported by the Ministry of Trade, Industry and Eergy (MOTIE, Korea).
Author Contributions
Insung Hwang and Geunho Jeong performed the fatigue tests; Dong-Yoon Kim, Dongcheol Kim and Munjin Kang performed the welding experiments; Insung Hwang and Young-Min Kim wrote the paper.
Conflicts of Interest
The authors declare no conflict of interest.
References
- Mallick, P.K. Advanced Steels for Lightweight Automotive Structures. In Design and Manufacturing for Lightweight Vehicles; Mallick, P.K., Ed.; Woodhead Publishing Limited: Cambridge, UK, 2010; pp. 35–61. [Google Scholar]
- Takahashi, M. Development of high strength steels for automobiles. Shinnittetsu Giho 2003, 16, 2–6. [Google Scholar]
- Bannantine, J.A.; Comer, J.J.; Handrock, J.L. Fundamentals of Metal Fatigue Analysis; Prentice Hall: Upper Saddle River, NJ, USA, 1990; pp. 124–177. [Google Scholar]
- Lee, K.B.; Oh, S.T. Development of durability enhancement technology for arc weldings in advanced high strength steel (AHSS) chassis parts. J. Weld. Join. 2015, 33, 50–56. [Google Scholar] [CrossRef]
- Ahiale, G.K.; Oh, Y.J.; Choi, W.D.; Lee, K.B.; Jung, J.G.; Nam, S.W. Microstructure and fatigue resistance of high strength dual phase steel welded with gas metal arc welding and plasma arc welding processes. Met. Mater. Int. 2013, 19, 933–939. [Google Scholar] [CrossRef]
- Koganti, R.; Angotti, S.; Joaquin, A.; Jiang, C.C. Effect of weld geometry and HAZ softening on fatigue performance of DP780 GMAW lap joint. SAE Tech. Pap. 2007. [Google Scholar] [CrossRef]
- Chung, Y.; Kwon, H. A Study on Weld Fatigue Life Improvement of Automotive Chassis Components. In Proceedings of the KSME 2011 Autumn Annual Meeting, Daegu, Korea, 2–4 November 2011; The Korean Society of Mechanical Engineers: Seoul, Korea, 2011; pp. 129–132. [Google Scholar]
- Feng, Z.; Sang, Y.; Jiang, C.; Chiang, J.; Kuo, M. Fatigue performance of advanced high-strength steels (AHSS) GMAW joints. SAE Tech. Pap. 2009. [Google Scholar] [CrossRef]
- Beretta, S.; Sala, G. A model for fatigue strength of welded lap joints. Fatigue Fract. Eng. Mater. Struct. 2005, 28, 257–264. [Google Scholar] [CrossRef]
- Kim, J.Y.; Kang, S.S.; Kim, G.Y.; Park, S.C.; Kim, C.K. Research on fafigue life prediction of muffler with weld-zone shape. J. Korean Soc. Mar. Eng. 2012, 36, 85–93. [Google Scholar] [CrossRef]
- Kim, J.H.; Goo, B.C. A study on the fatigue life estimation using butt weld bead profiles. J. Korean Soc. Rail. 2004, 7, 125–129. [Google Scholar]
- Richter-Trummer, V.; Tavares, S.M.; Moreira, P.M.; de Figueiredo, M.A.; de Castro, P.M. Residual stress measurement using the contour and the sectioning methods in a MIG weld: Effects on the stress intensity factor. Ciênc. Tecnol. Mater. 2008, 20, 114–119. [Google Scholar]
- Wang, Q.; Chen, H.; Qiu, P.; Zhu, Z. Reisudal stress and fatigue strength of hybrid laser-MIG-welded A7N01P-T4. Metall. Mater. Trans. B 2017, 48, 591–601. [Google Scholar] [CrossRef]
- Maddox, S.J. Fatigue Strength of Welded Structures, 2nd ed.; Woodhead Publishing: Abington, UK, 2014; pp. 3–18. [Google Scholar]
- Hobbacher, A. Recommendations for Fatigue Design of Welded Joints and Components; Springer: New York, NY, USA, 2009; pp. 42–76. [Google Scholar]
- Kang, M.; Kim, C.; Lee, J. Weld strength of laser-welded hot-press-forming steel. J. Laser Appl. 2012, 24, 022004. [Google Scholar] [CrossRef]
Figure 1.
Weld joint geometry: (a) Geometry A; (b) geometry B.
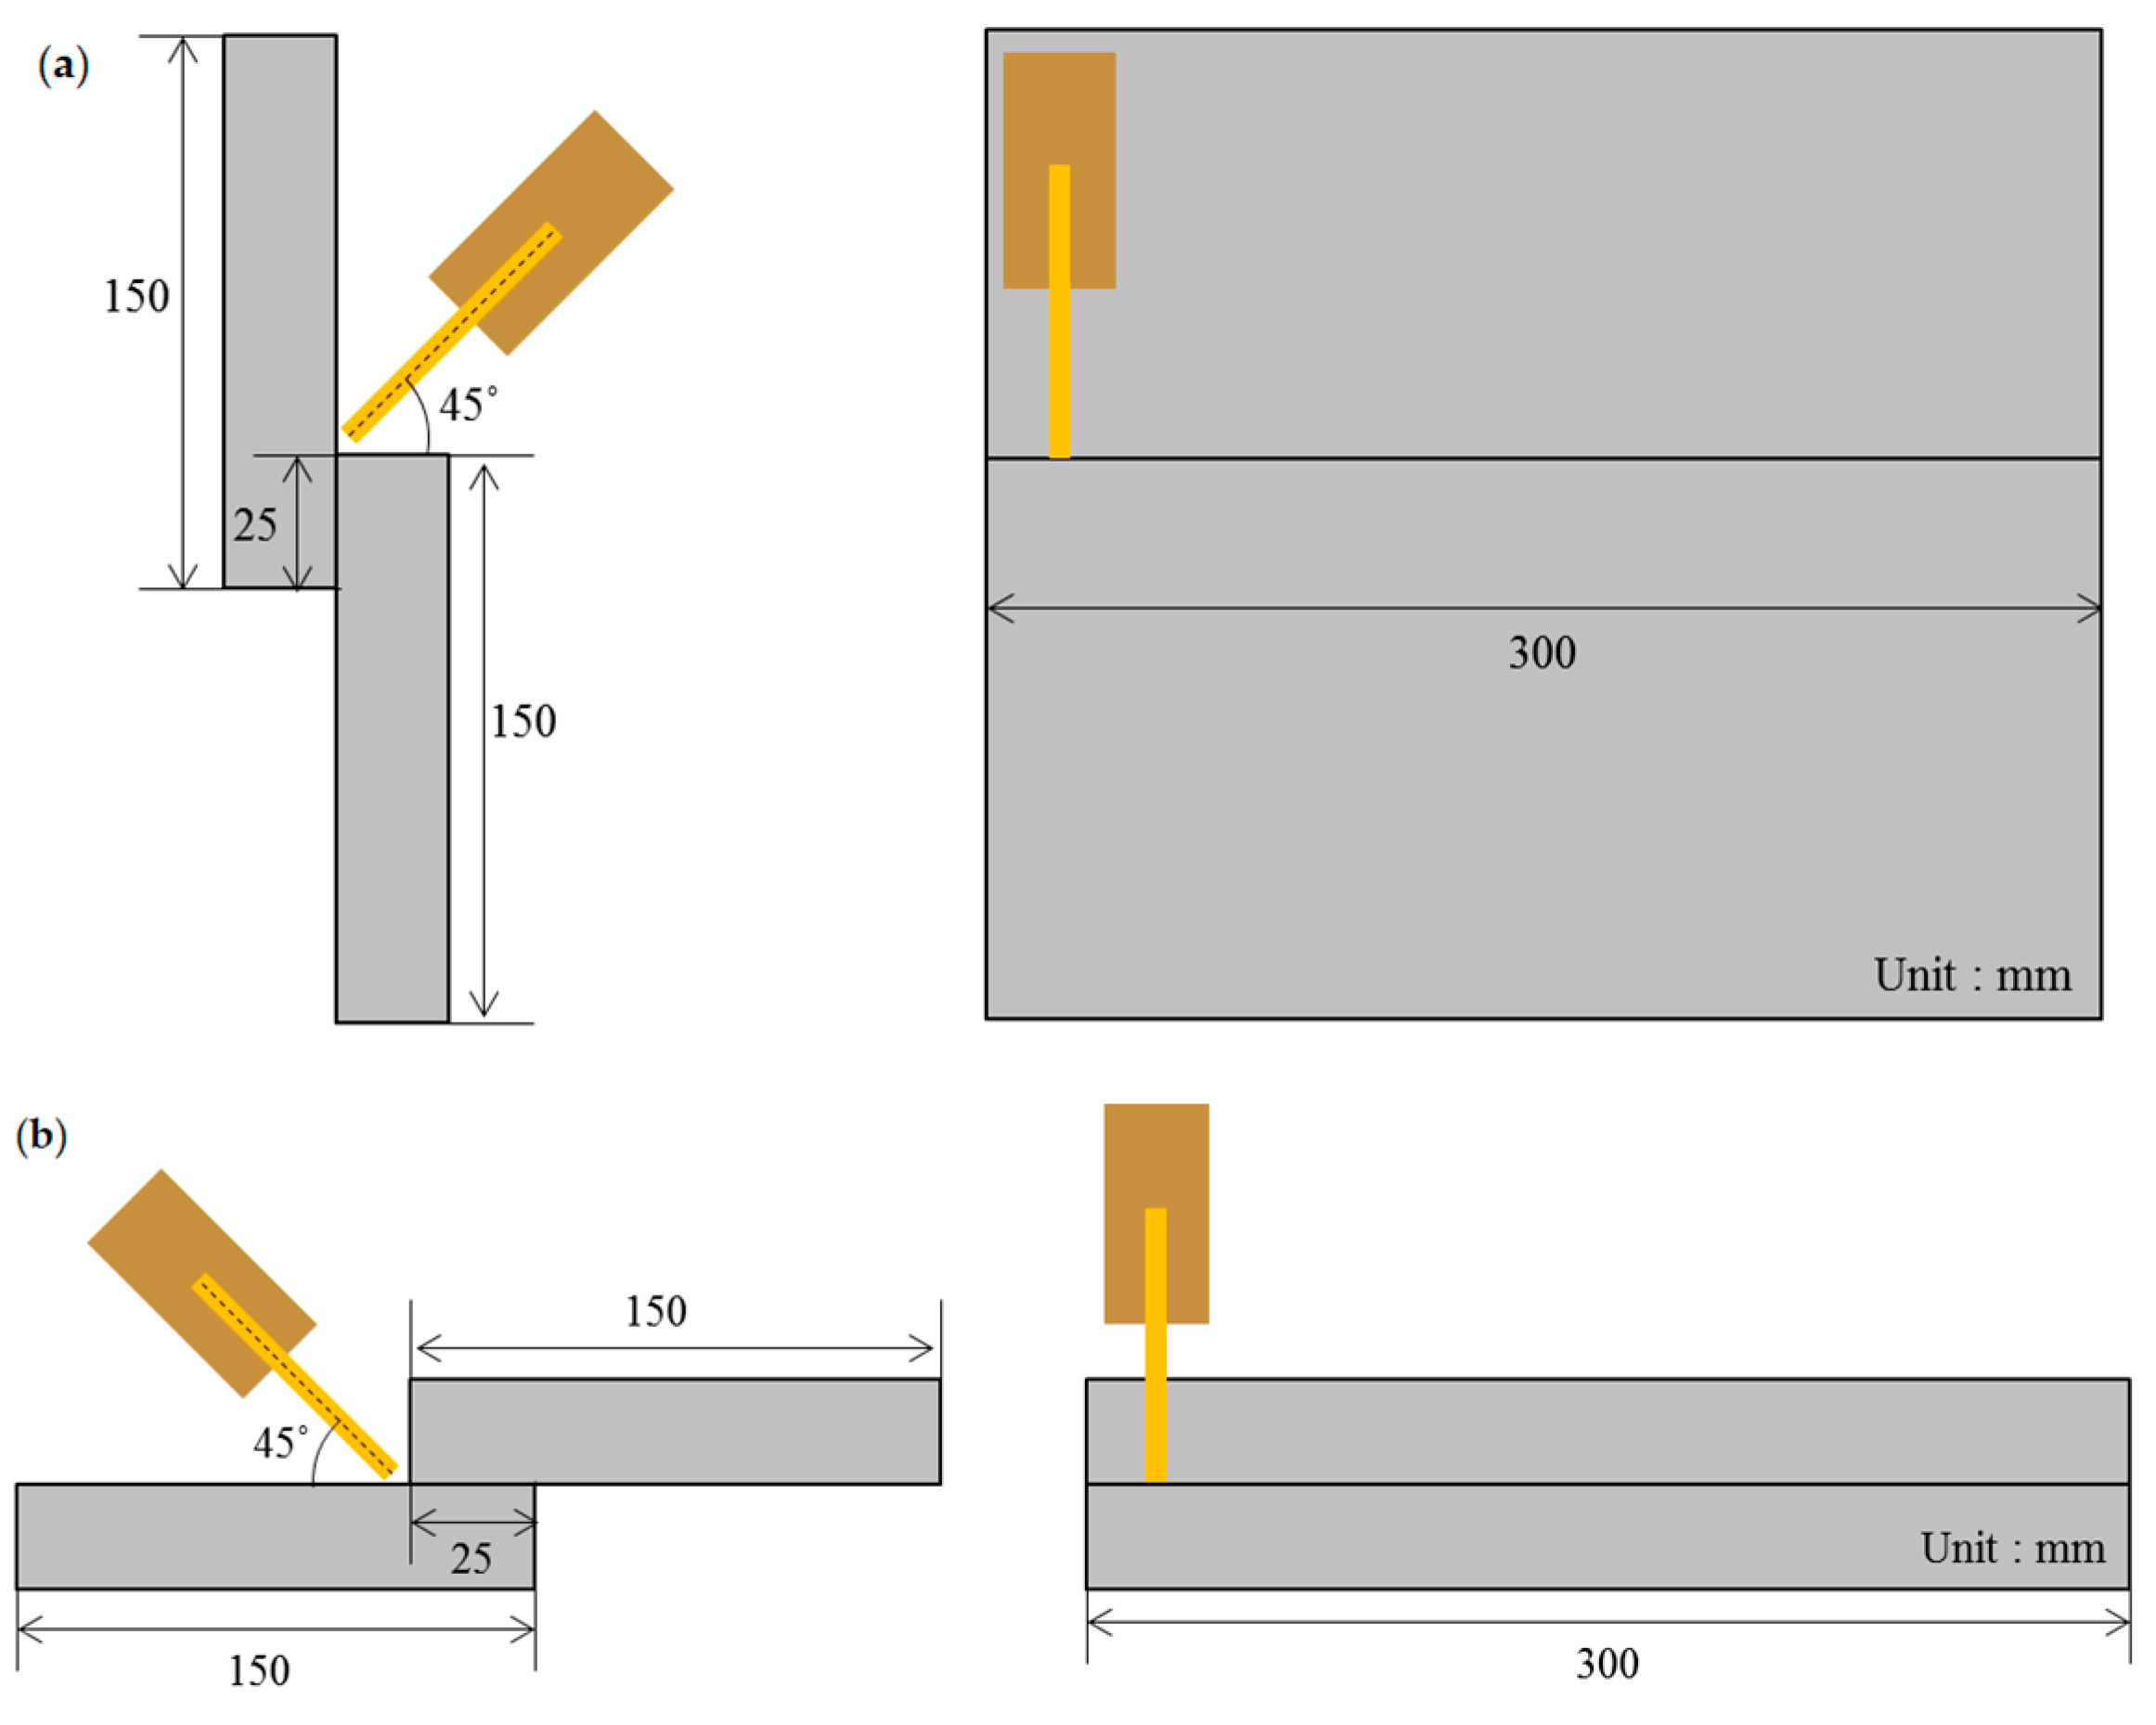
Figure 2.
Wire angle and distance of tandem MAG welding process.
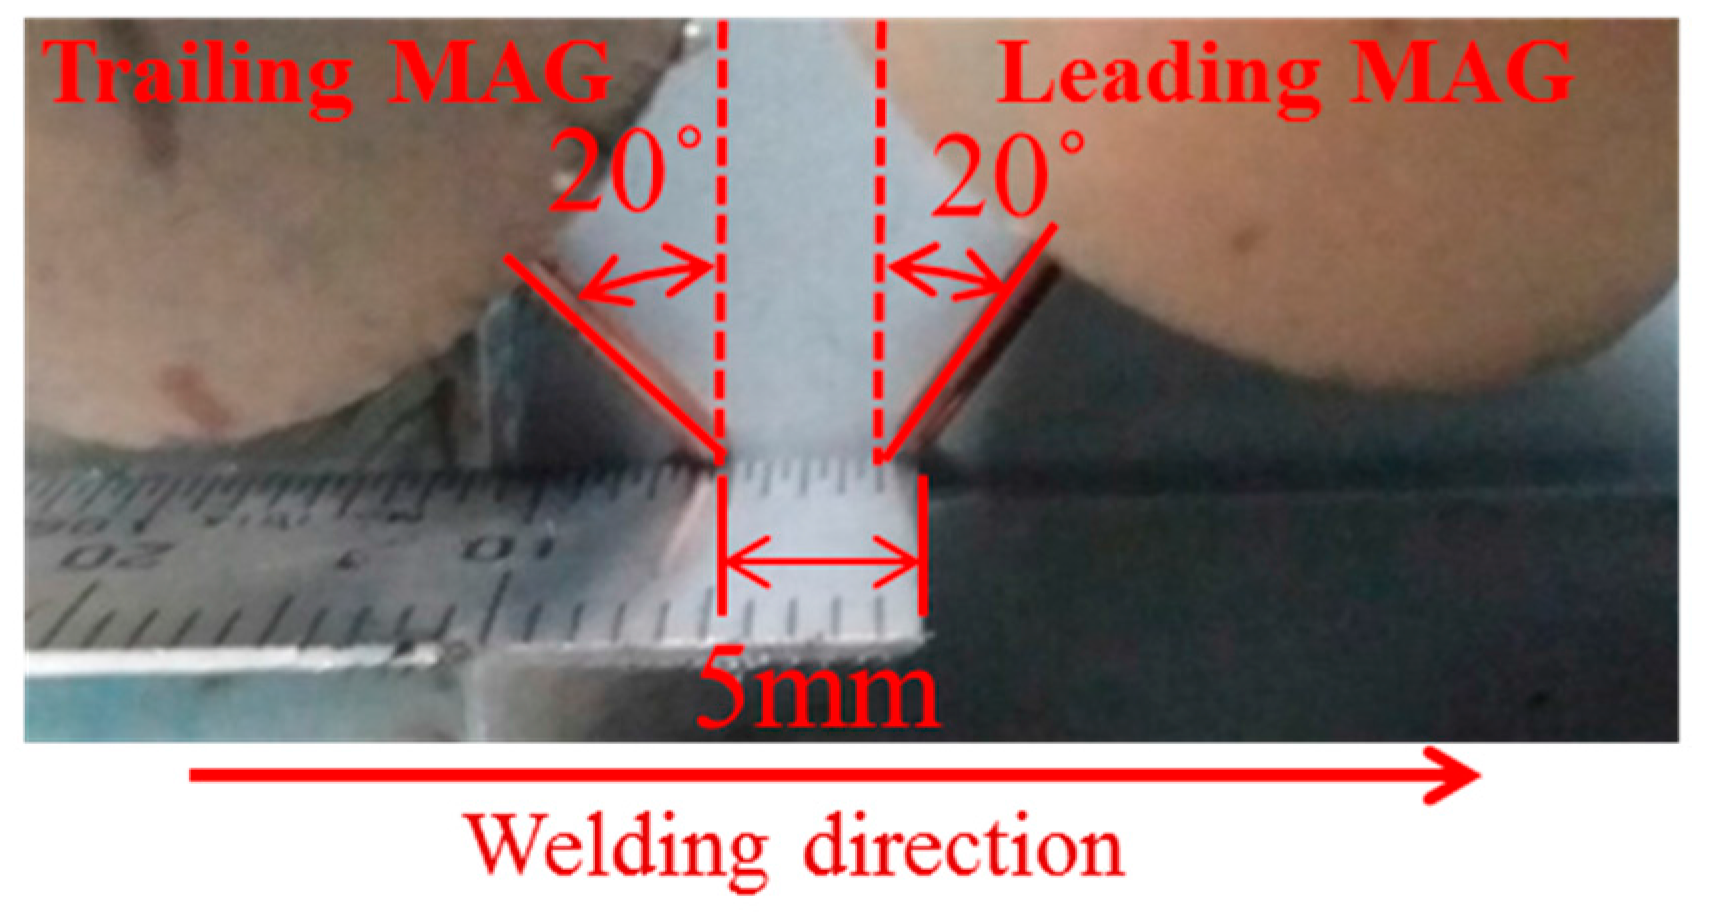
Figure 3.
Weld defects by arc welding of galvannealed steel.
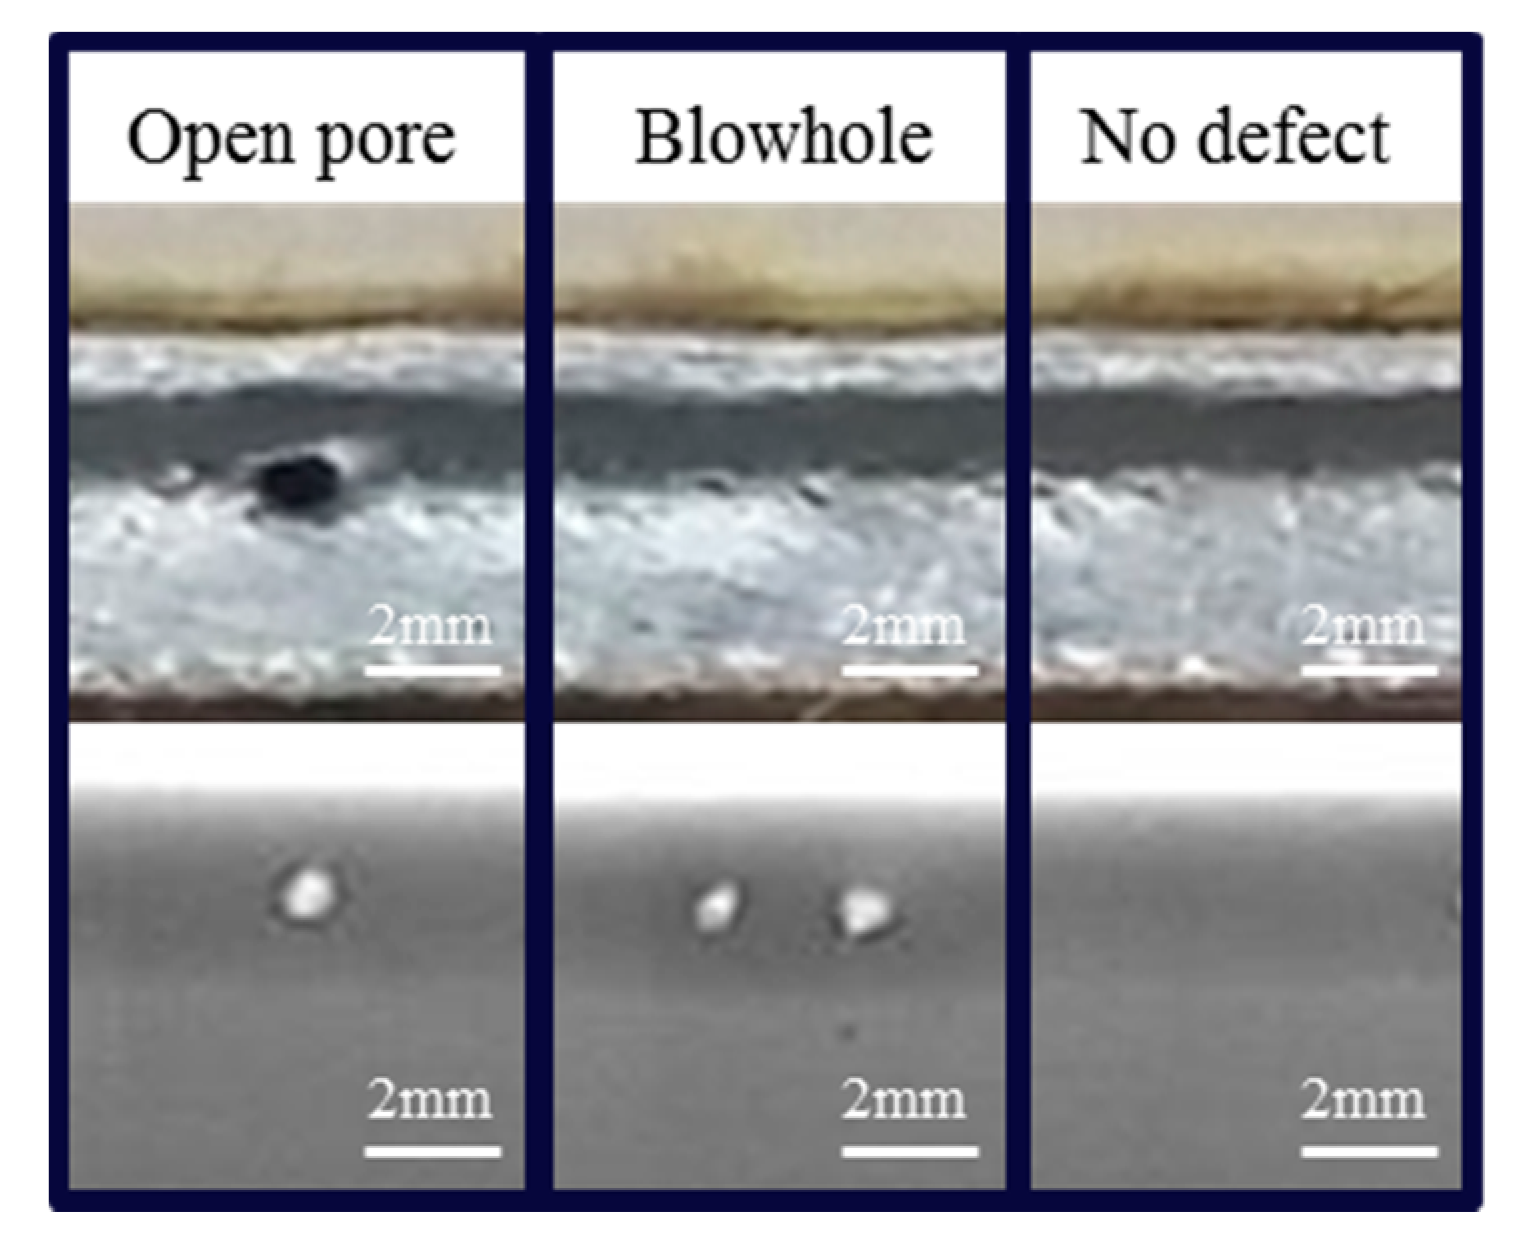
Figure 4.
Appearance of the fatigue machine and schematic diagram of stress loading during the fatigue test.
Figure 4.
Appearance of the fatigue machine and schematic diagram of stress loading during the fatigue test.
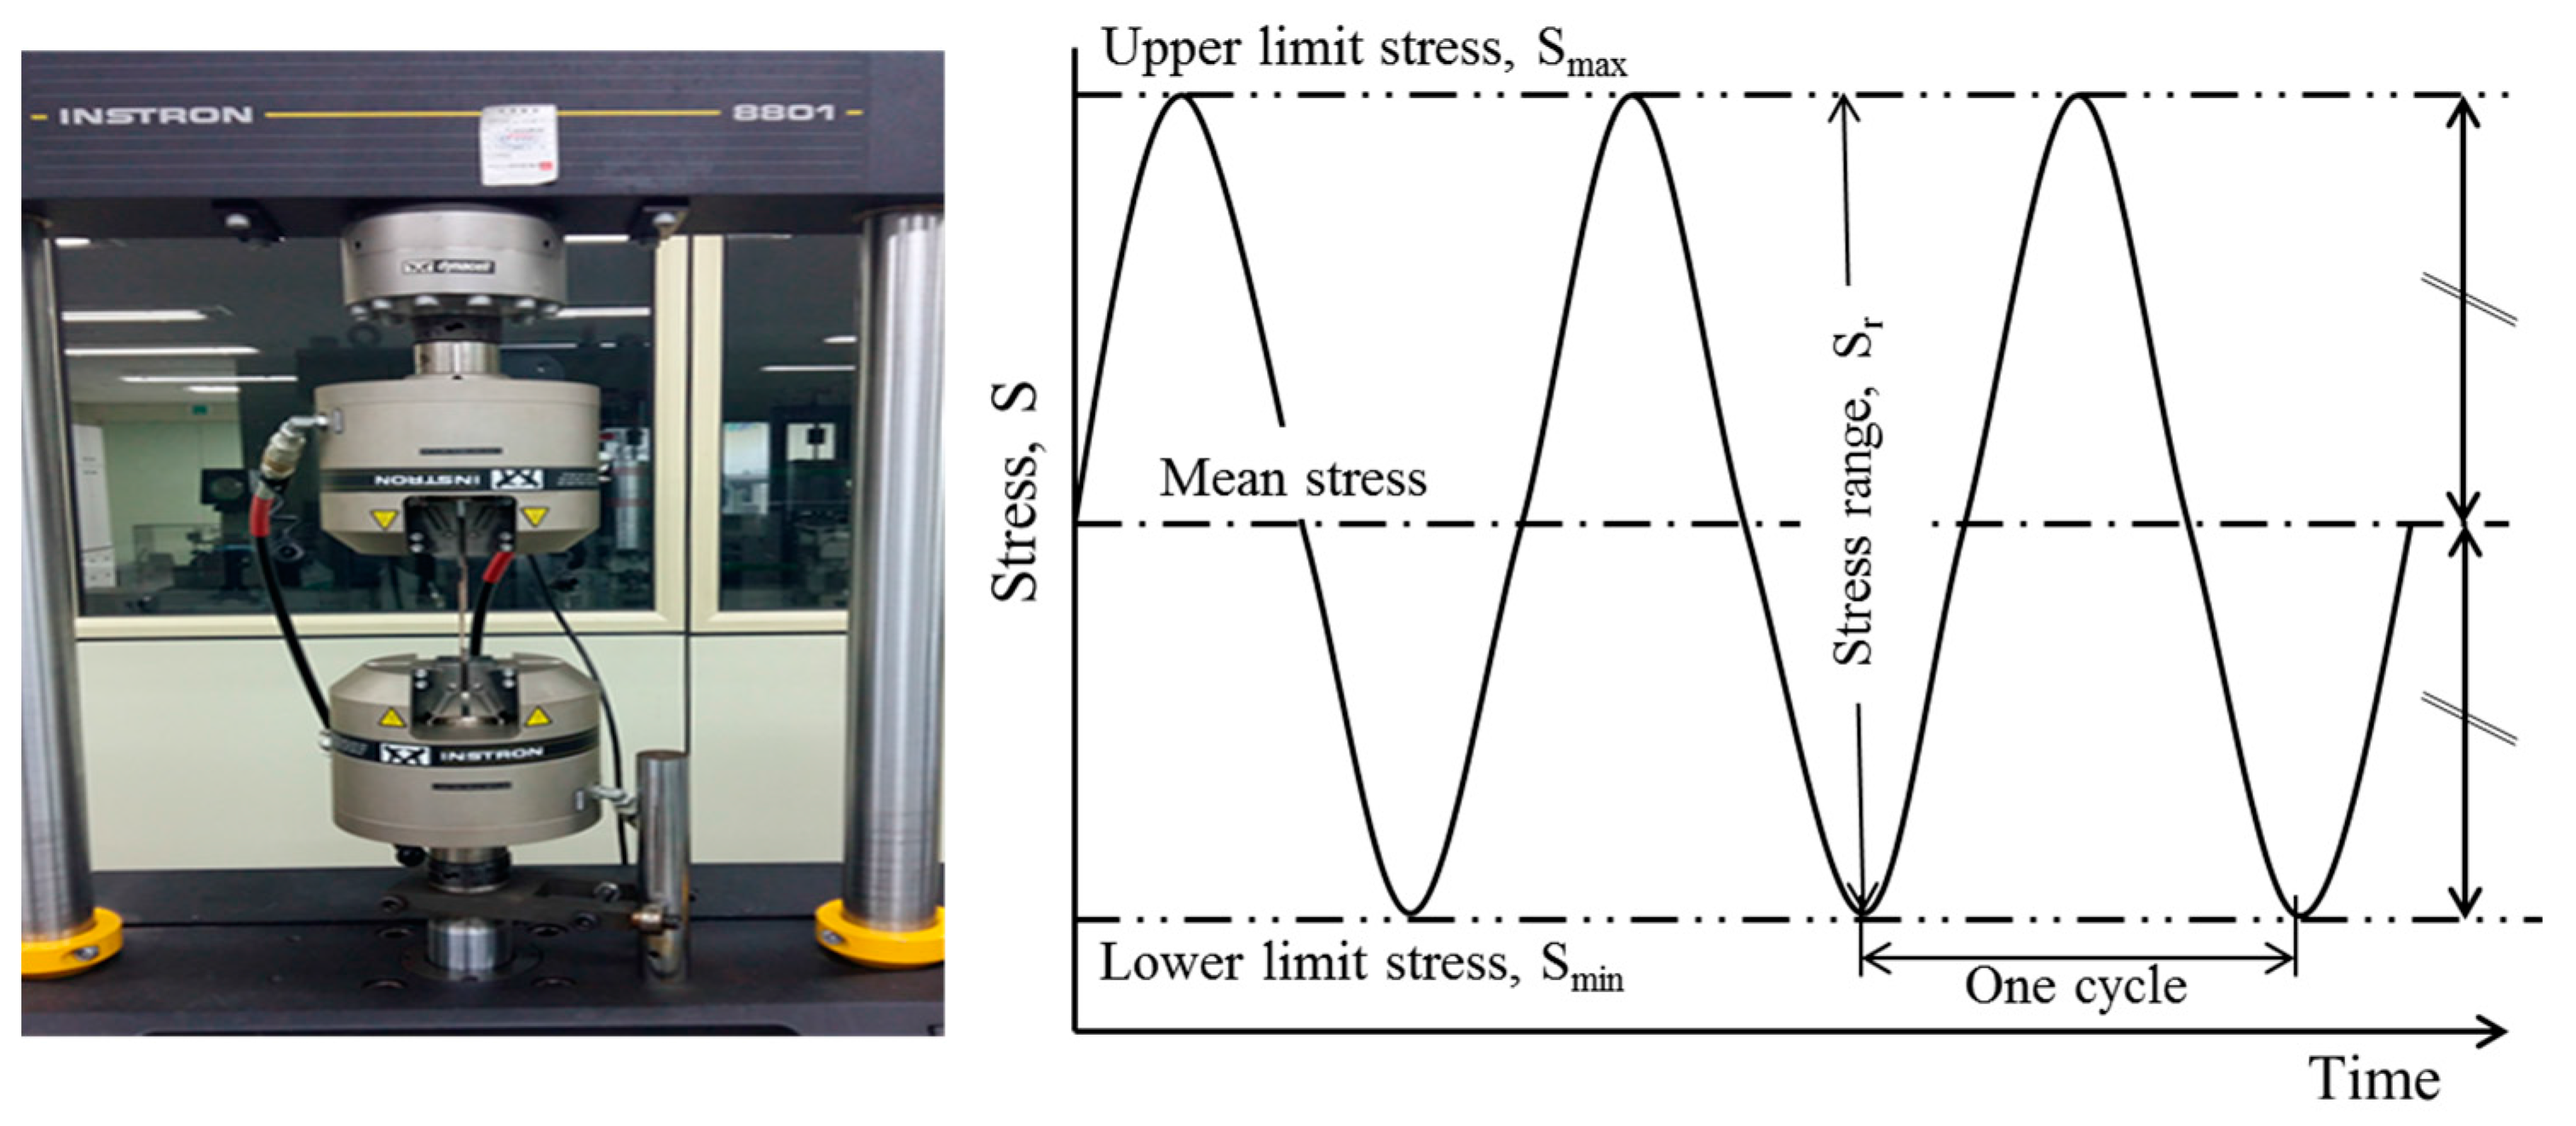
Figure 5.
Weld bead shape and cross section of the weld according to weld type.
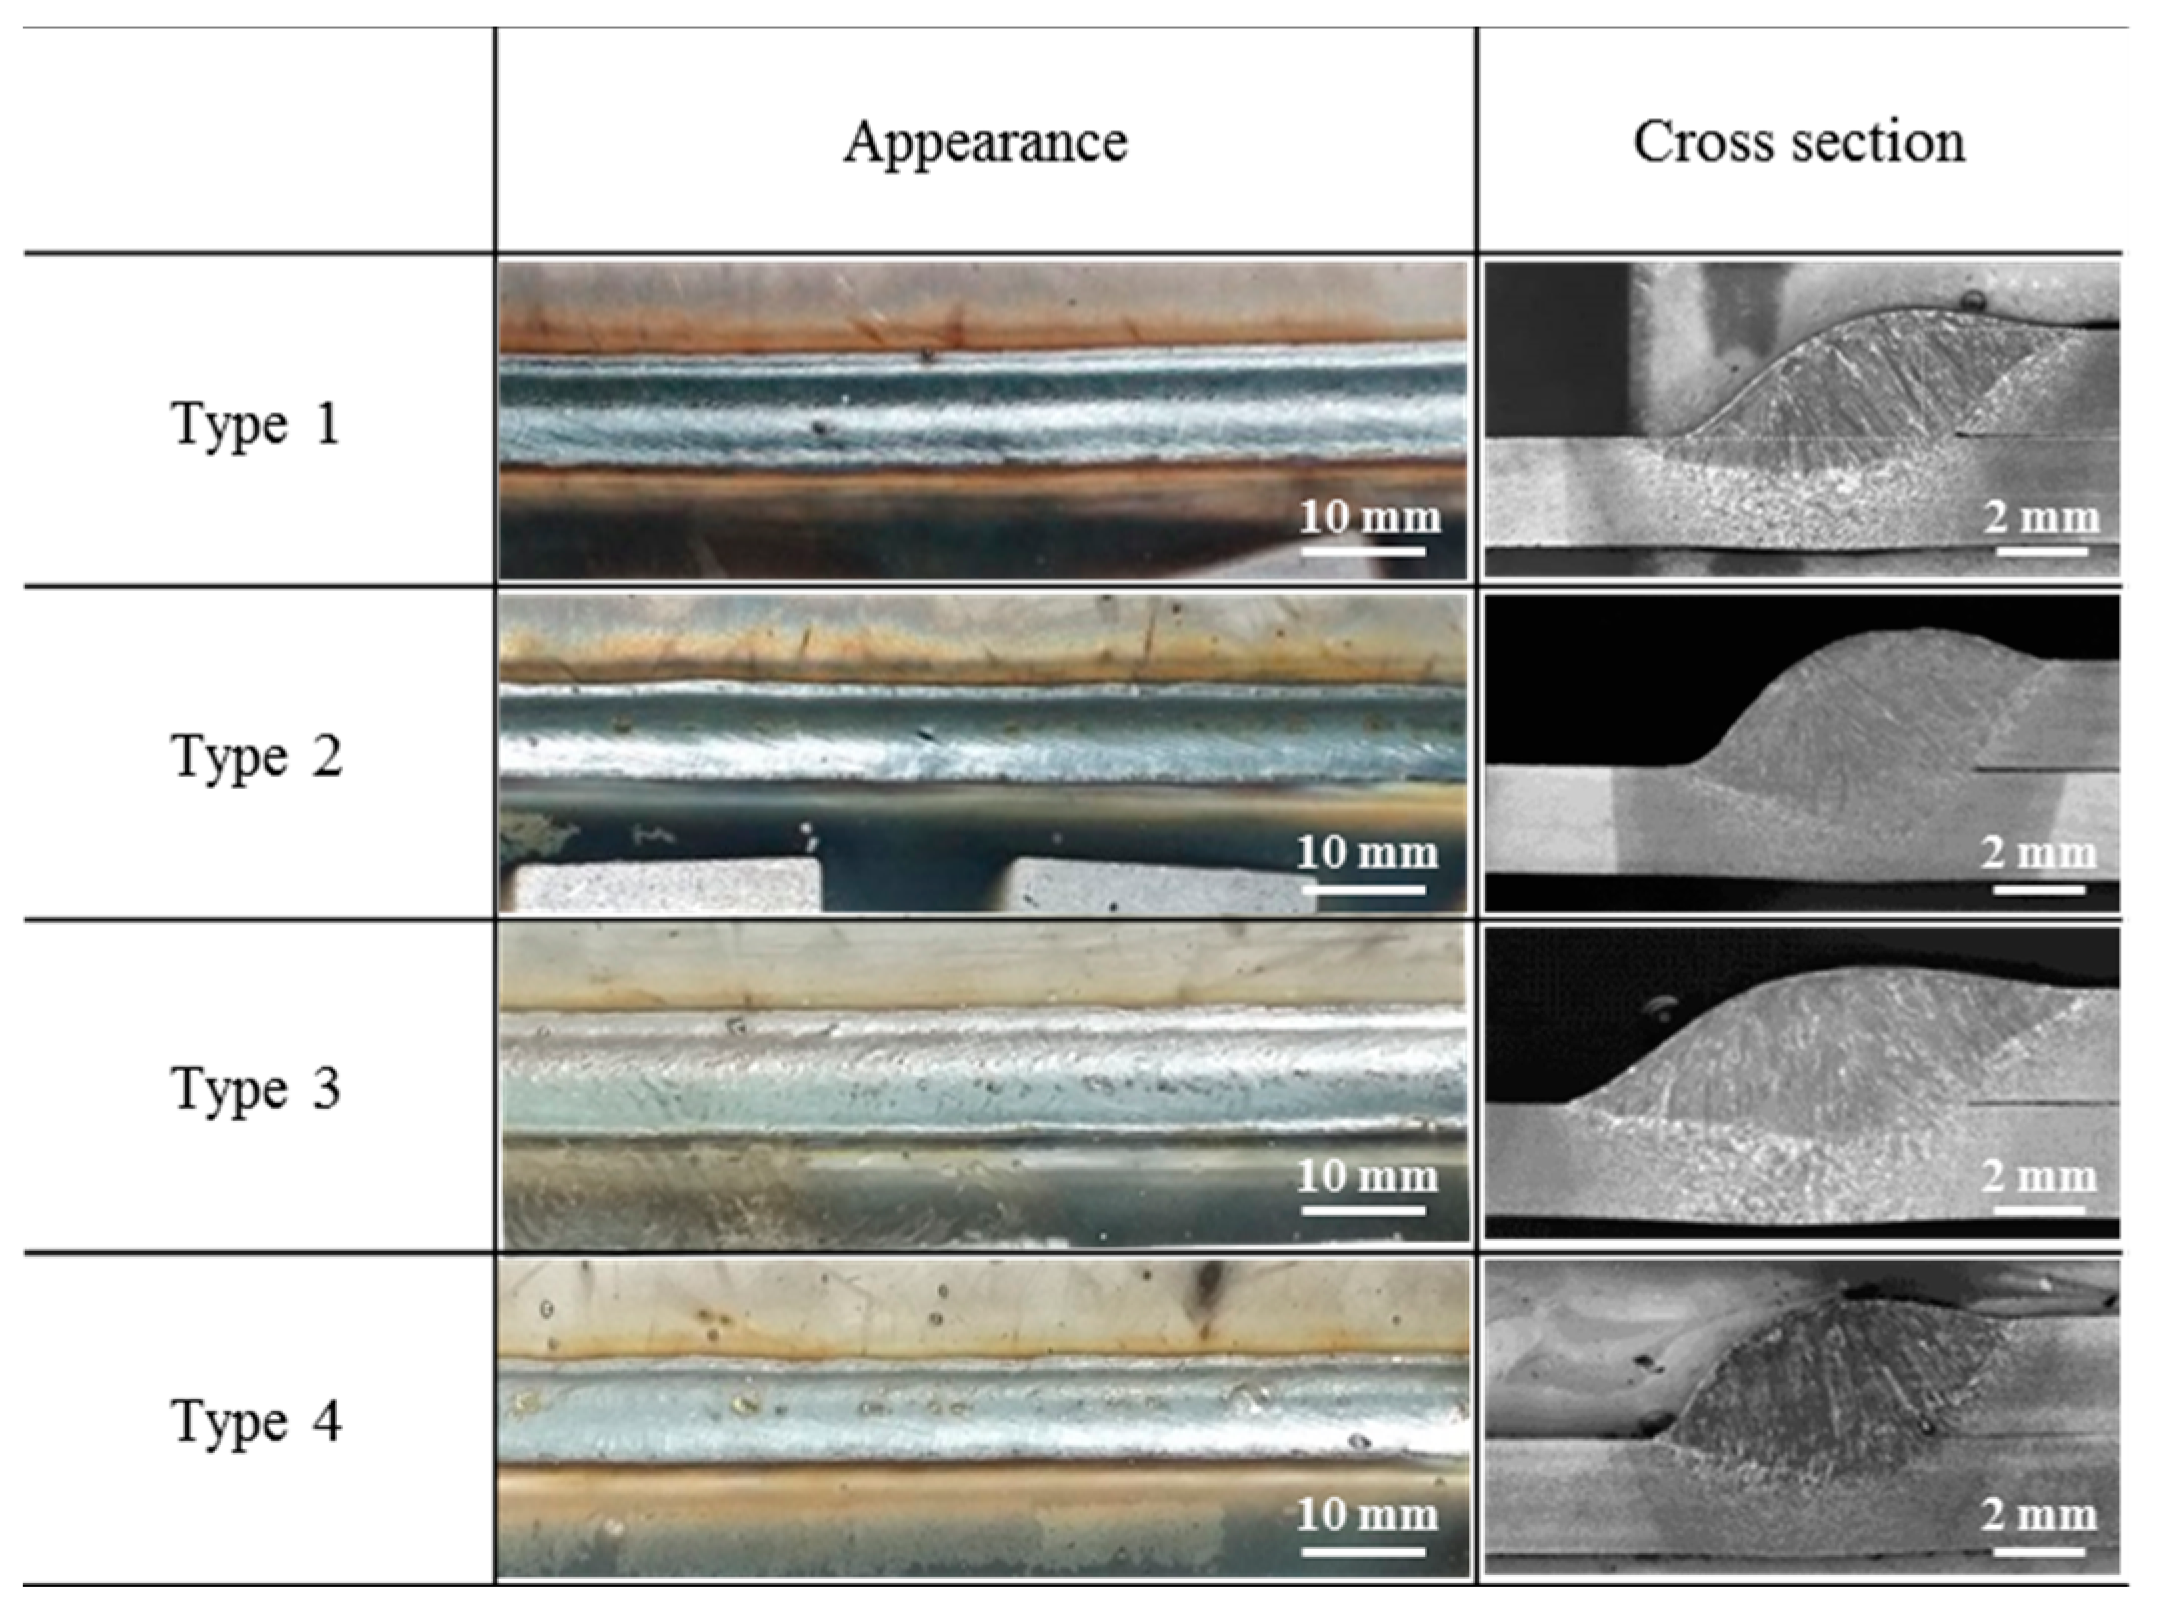
Figure 6.
S–N curve according to weld type (FAT: Fatigue class).
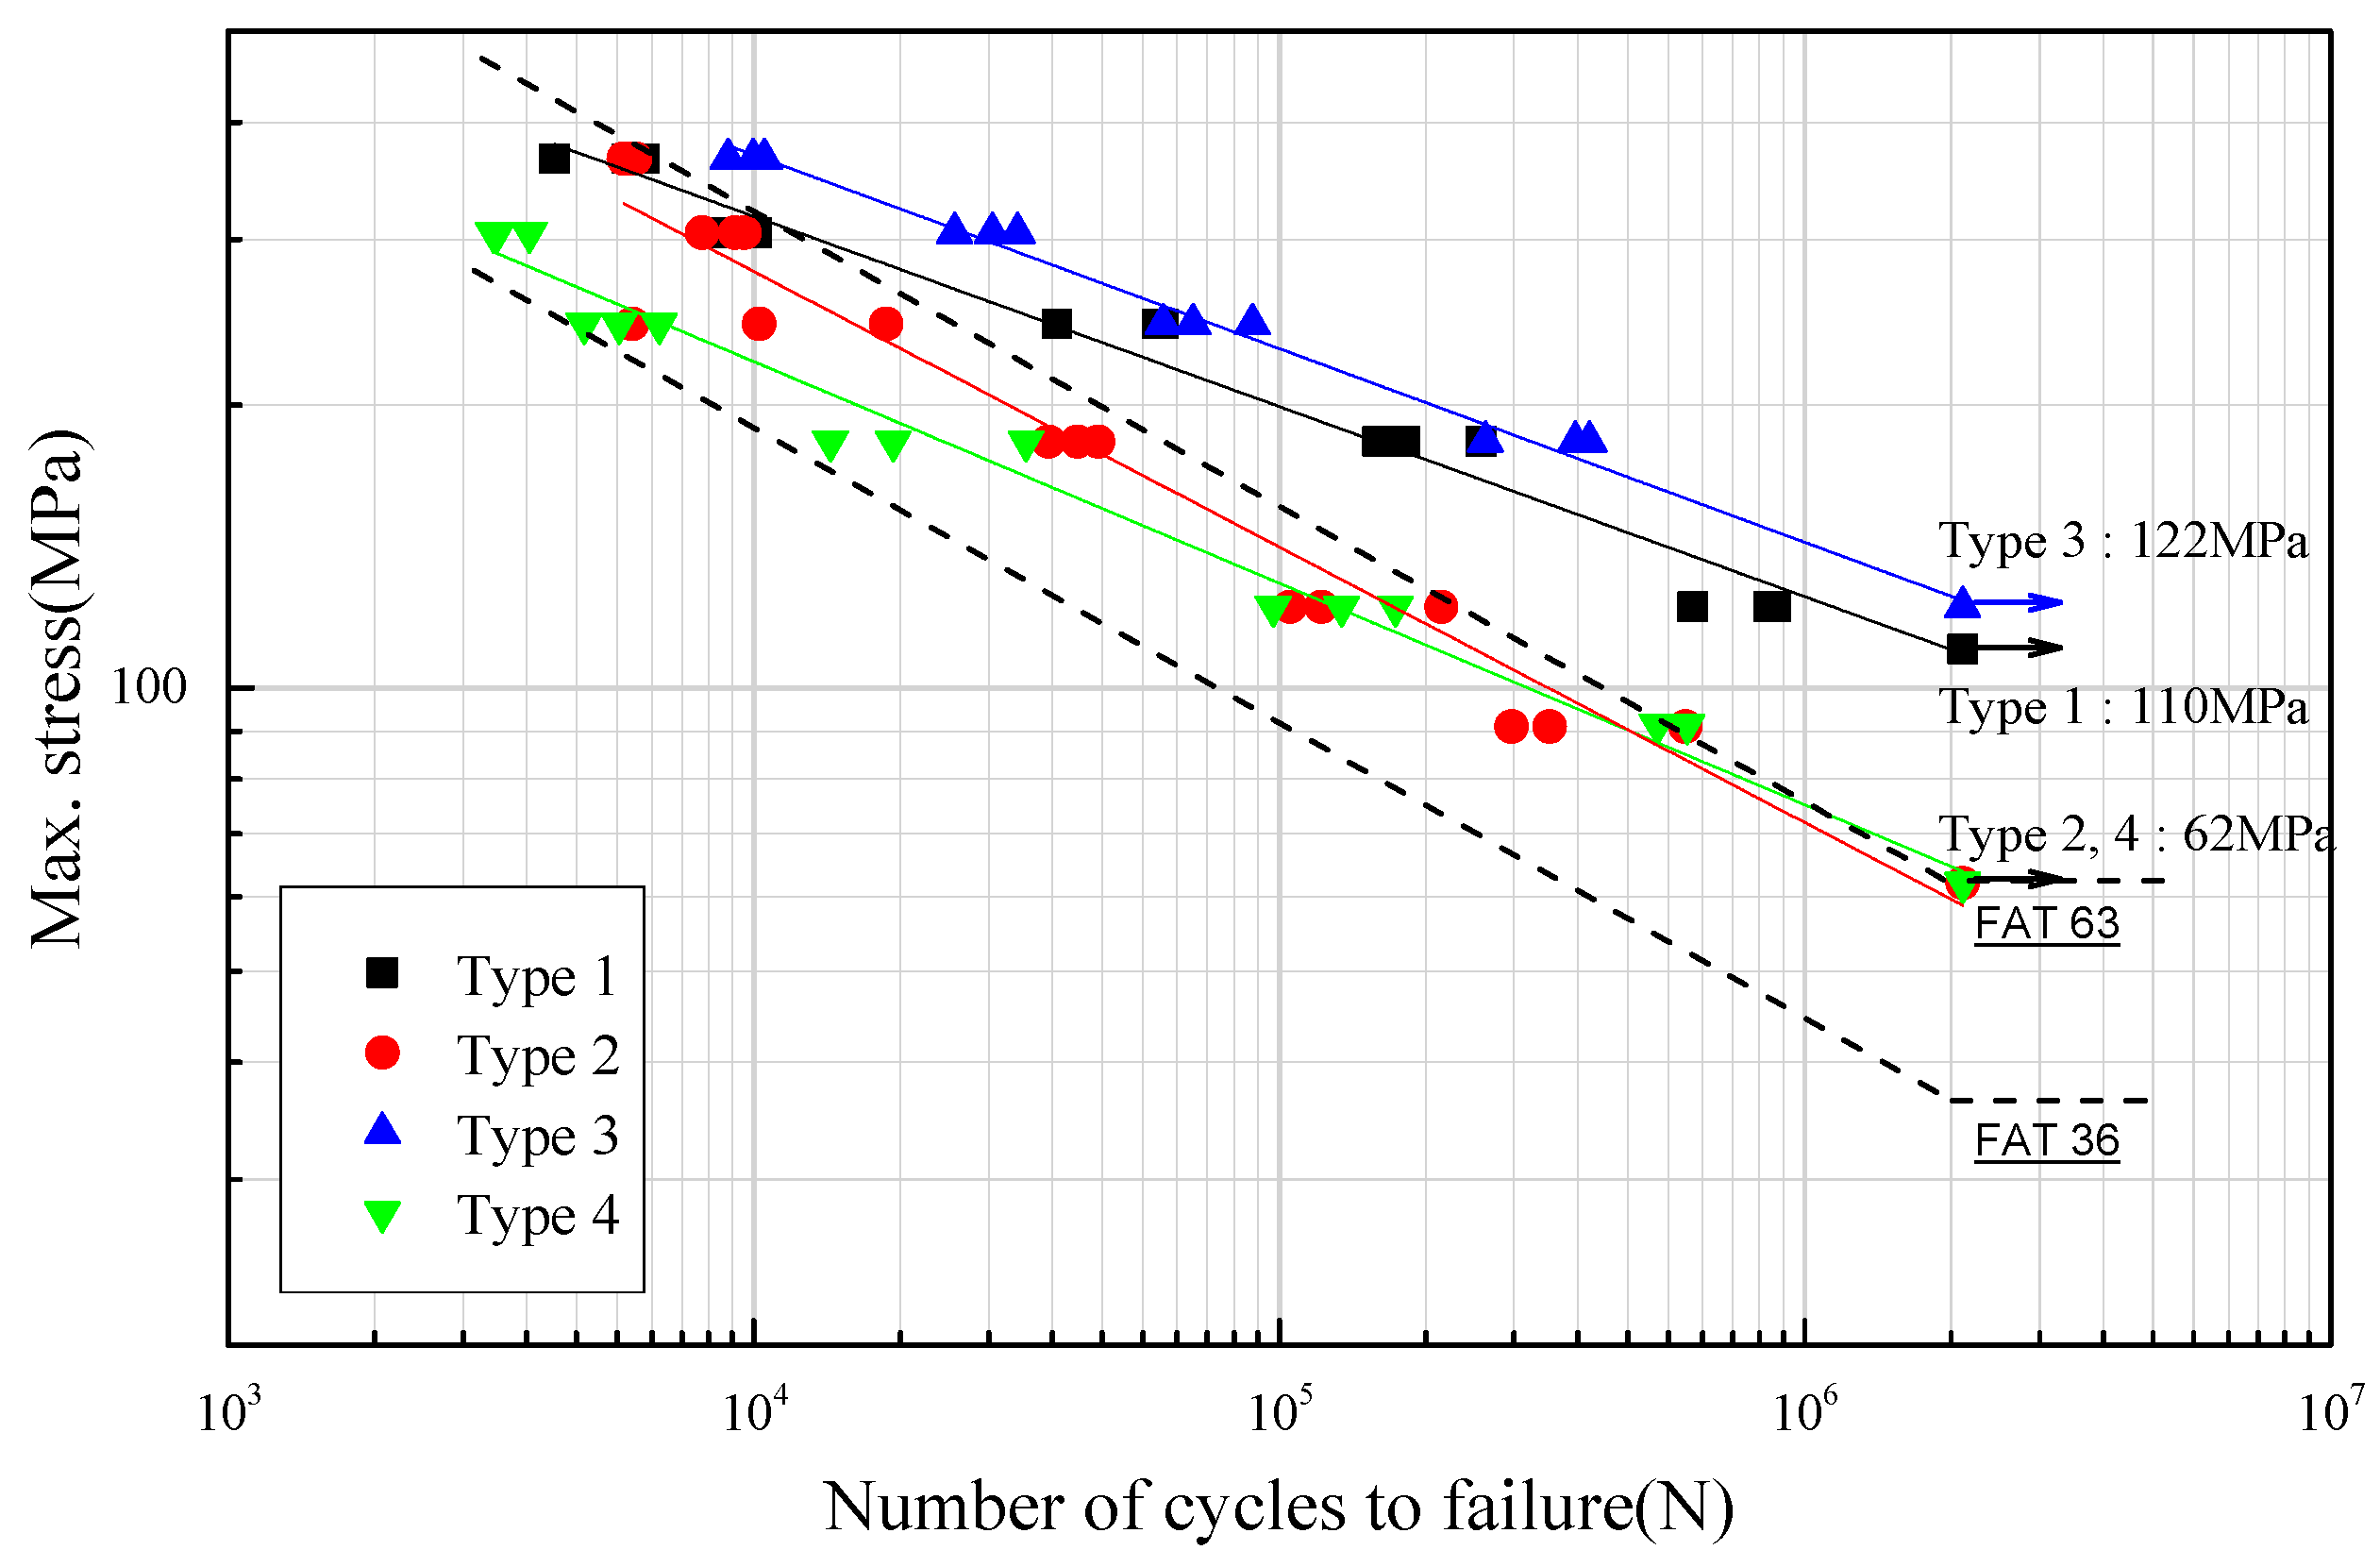
Figure 7.
Fatigue fracture with various max. stresses and weld types.

Figure 8.
The location of fatigue crack initiation of (a) type 2 sample at max. stress of 92 MPa and (b) type 2 sample at max. stress of 366 MPa.
Figure 8.
The location of fatigue crack initiation of (a) type 2 sample at max. stress of 92 MPa and (b) type 2 sample at max. stress of 366 MPa.
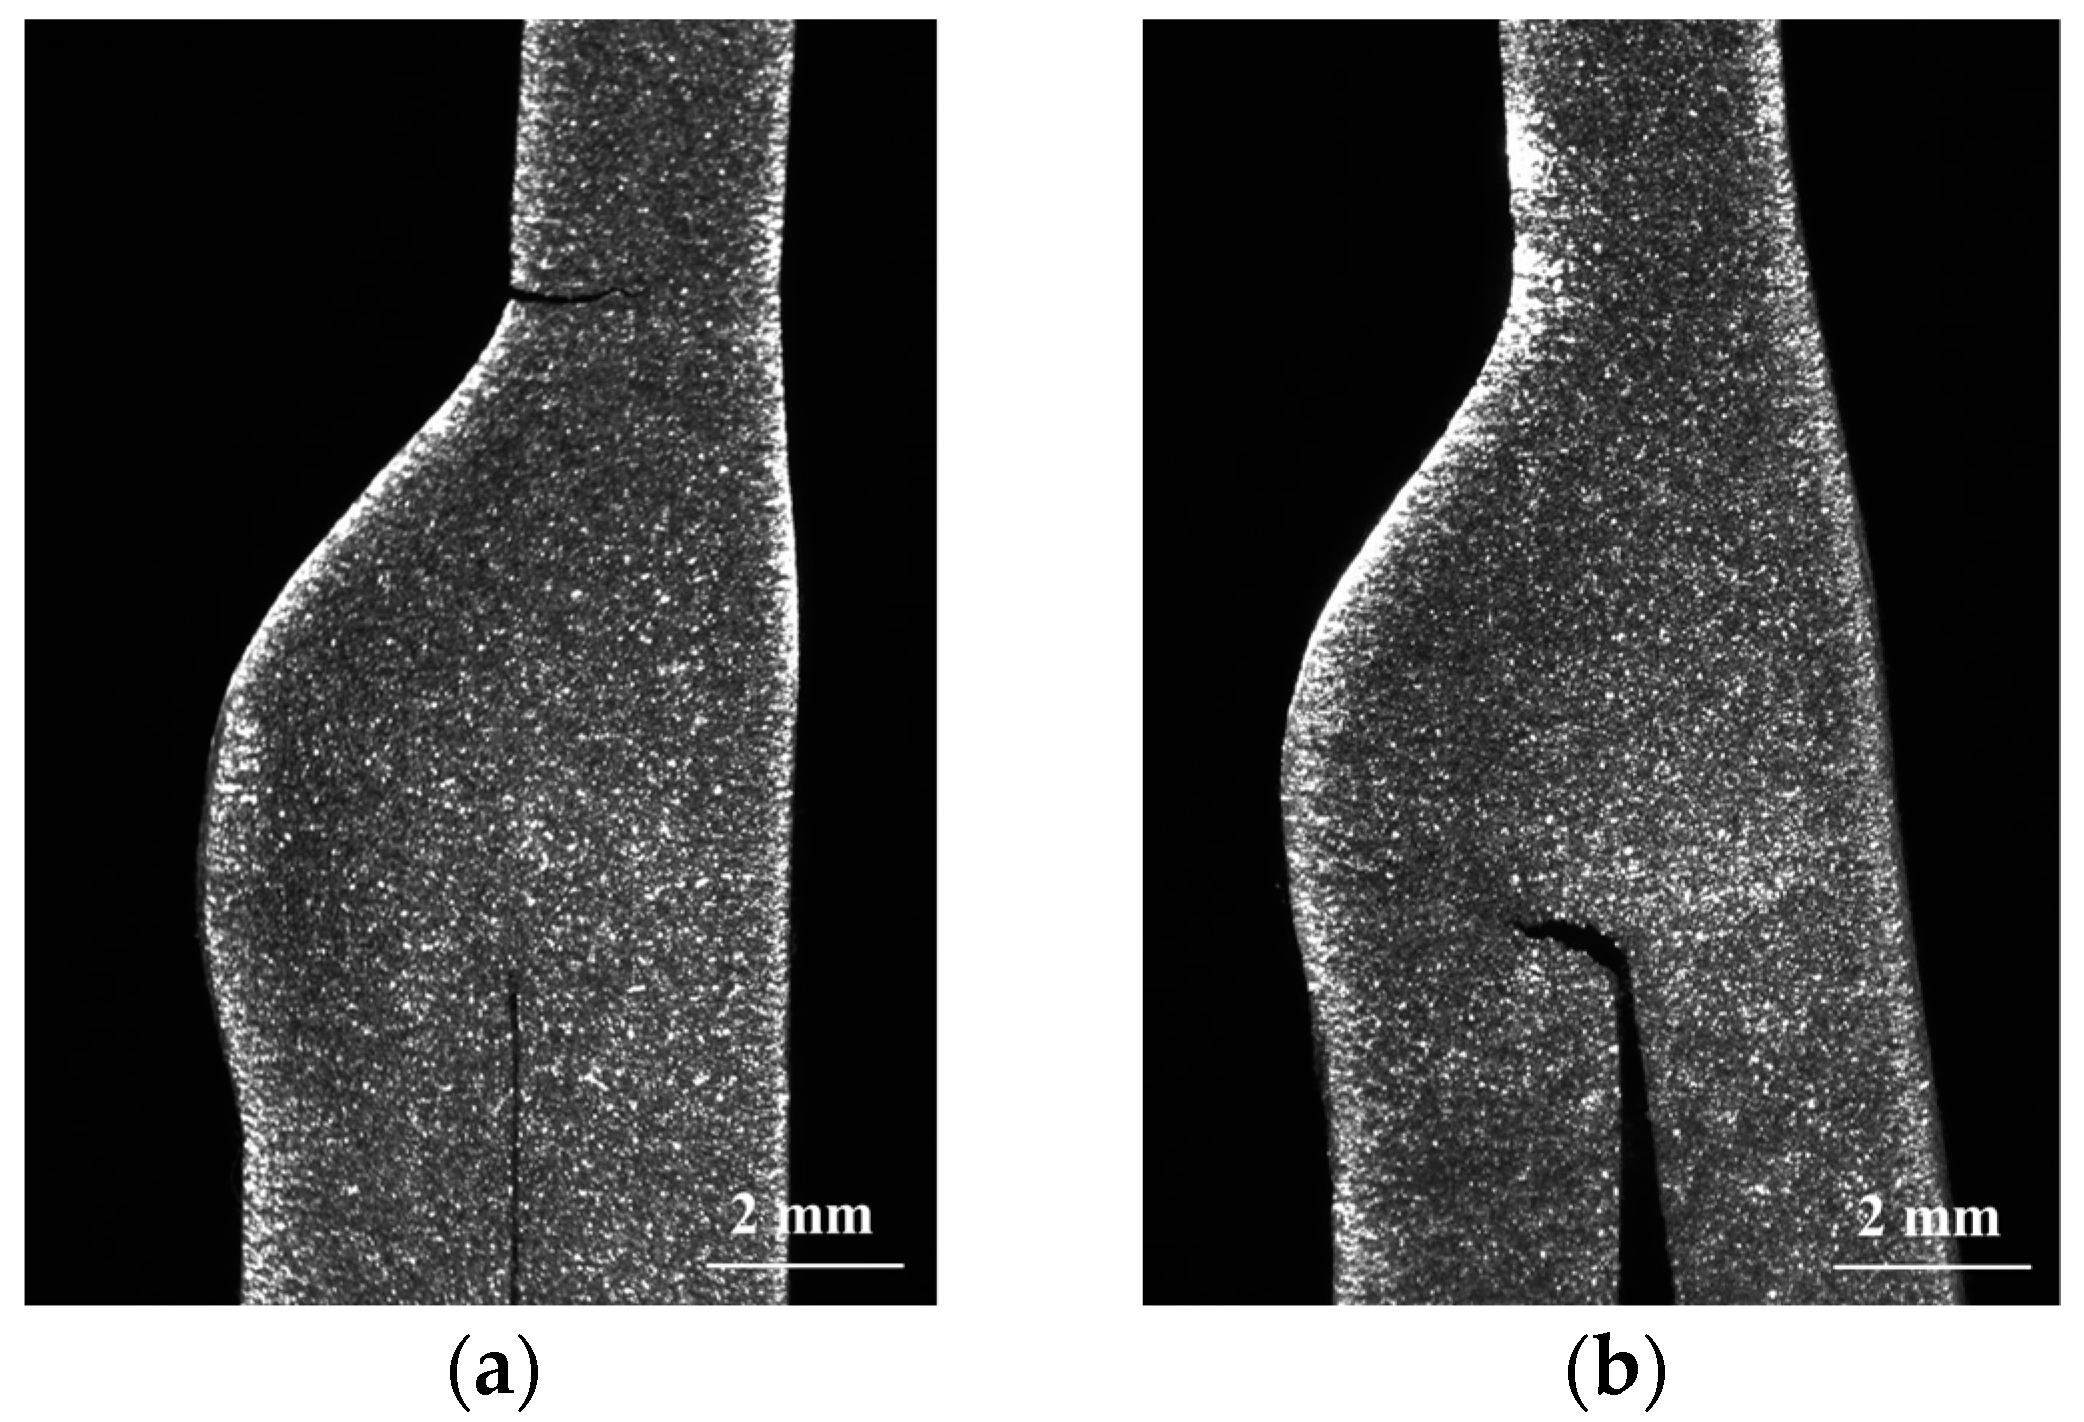
Figure 9.
Configuration of the weld bead by (a) length, (b) angle and (c) area.
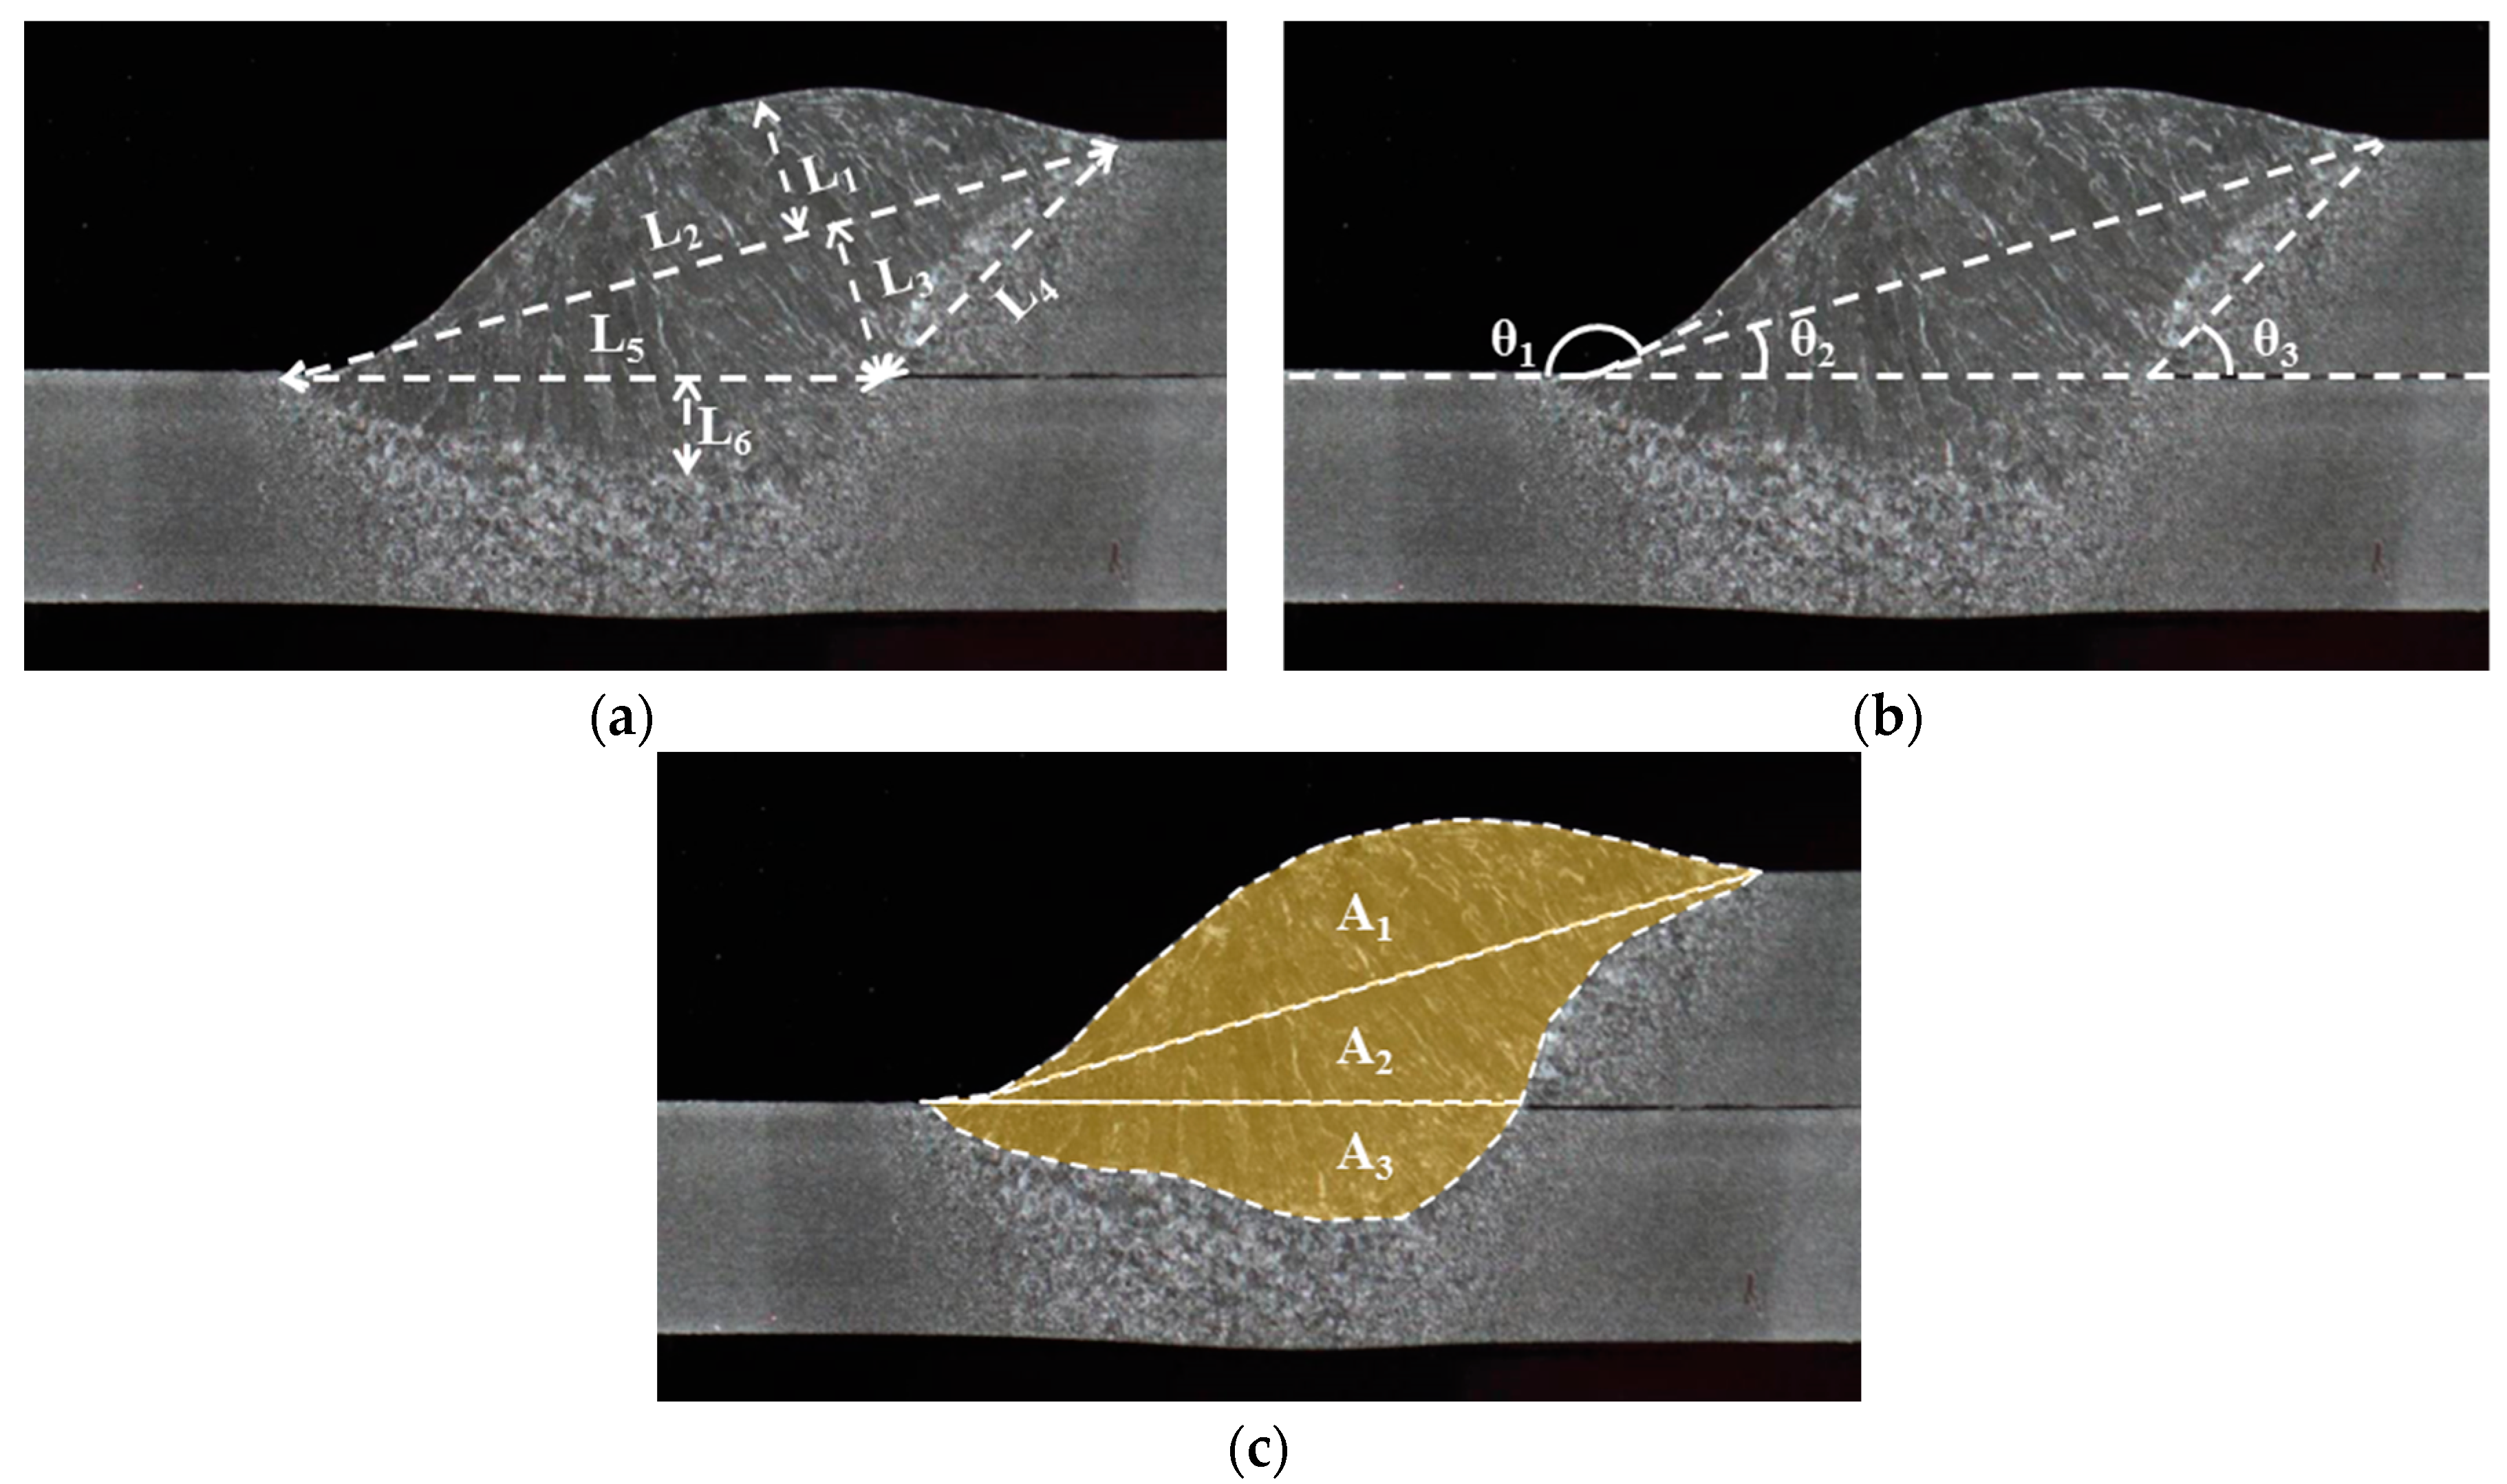
Figure 10.
Measured length of each part on the weld bead.

Figure 11.
Measured angle of each part on the weld bead.
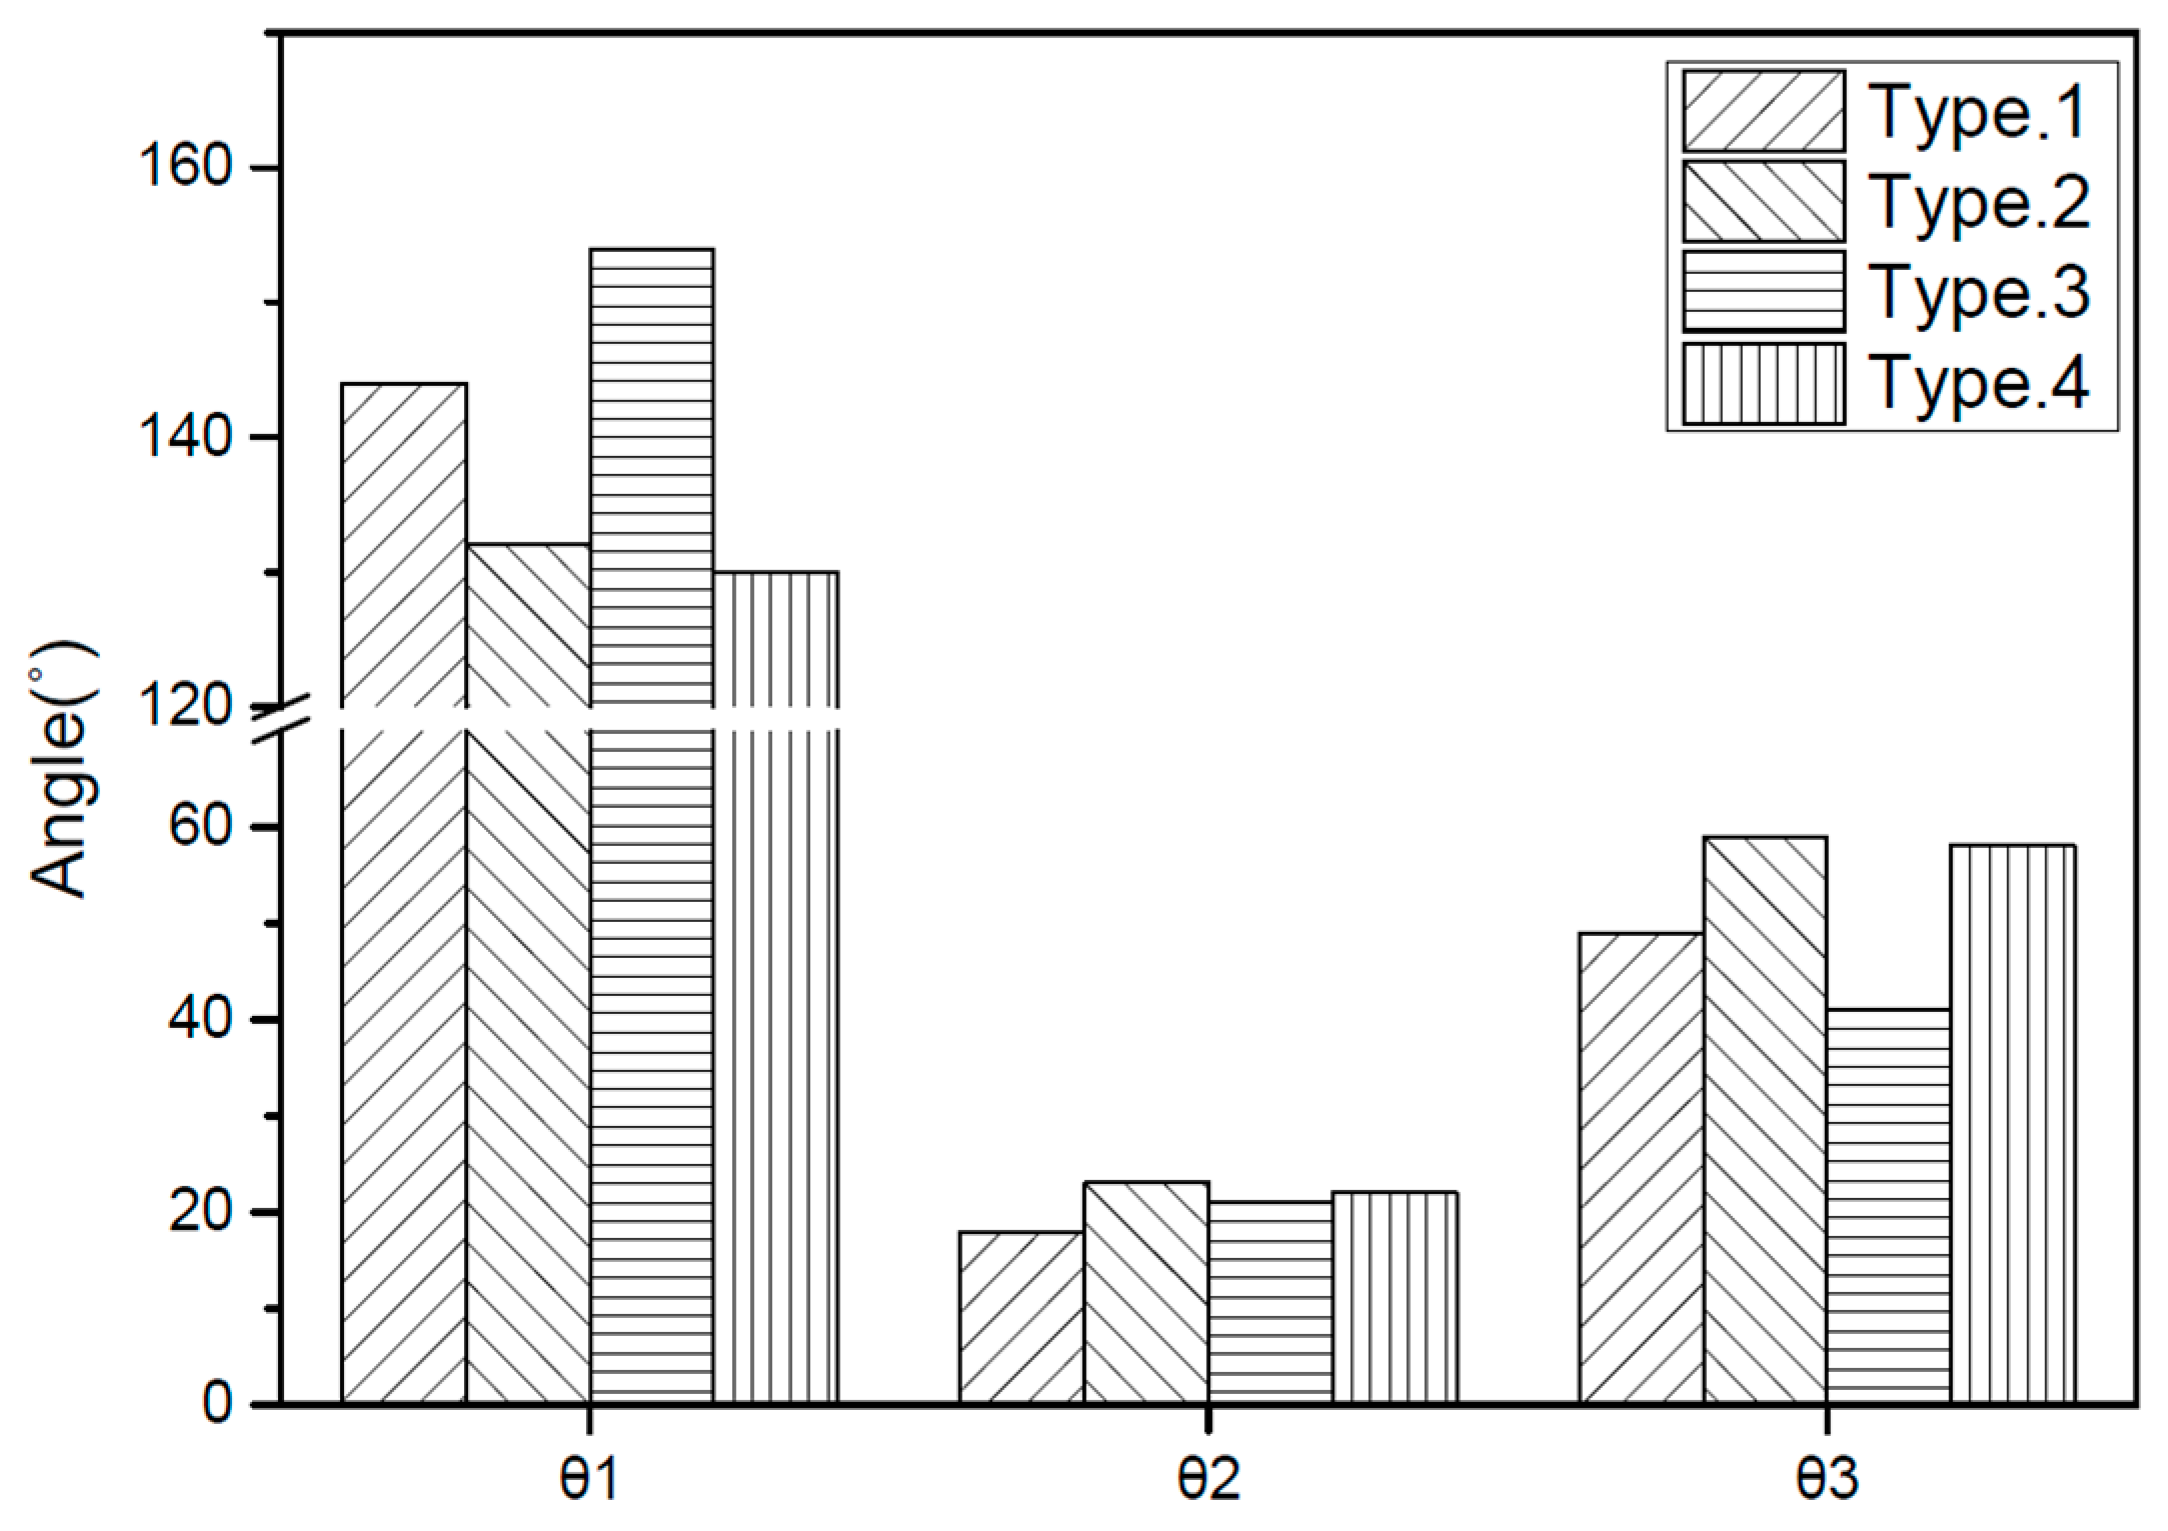
Figure 12.
Measured area of each part on the weld bead.

Figure 13.
Relationship between weld bead shape and fatigue strength (a) length, (b) angle and (c) area.
Figure 13.
Relationship between weld bead shape and fatigue strength (a) length, (b) angle and (c) area.


Table 1.
Chemical composition and mechanical properties of the base material (FB: Ferrite-bainite).
| Materials | Chemical Composition (wt %) | Mechanical Properties | |||||||
|---|---|---|---|---|---|---|---|---|---|
| GA 590 FB | C | Si | Mn | P | S | Fe | Yield strength (MPa) | Tensile strength (MPa) | Elongation (%) |
| 0.07 | 0.14 | 1.440 | 0.013 | 0.002 | Bal. | 583 | 610 | 25 | |
Table 2.
Chemical composition and mechanical properties of the welding wire.
| Welding Wire | Chemical Composition (wt %) | Mechanical Properties of Weld Metal | |||||||
|---|---|---|---|---|---|---|---|---|---|
| ER70S-3 | C | Si | Mn | P | S | Fe | Yield strength (MPa) | Tensile strength (MPa) | Elongation (%) |
| 0.07 | 0.65 | 1.14 | 0.015 | 0.010 | Bal. | 440 | 560 | 28 | |
Table 3.
Welding methods and conditions according to weld type (MAG: Metal active gas; DC: Direct current).
Table 3.
Welding methods and conditions according to weld type (MAG: Metal active gas; DC: Direct current).
| Experiment and Welding Conditions | Type 1 | Type 2 | Type 3 | Type 4 | ||
|---|---|---|---|---|---|---|
| Thickness of base metal (mm) | 2.3 | 2.3 | 2.6 | 2.6 | ||
| Joint geometry | geometry A | geometry A | geometry B | geometry B | ||
| Welding process | tandem MAG (DC + pulse) | single MAG (DC) | tandem MAG (DC + pulse) | single MAG (DC) | ||
| Wire feed speed (m/min) | leading | 3 | 7 | leading | 3 | 8 |
| trailing | 4 | trailing | 5 | |||
| Welding current/voltage (A/V) | leading | 122 A/12.4 V | 237 A/22.2 V | leading | 122 A/12.4 V | 253 A/23.5 V |
| trailing | 123 A/22.7 V | trailing | 153 A/24.5 V | |||
Table 4.
Tensile shear strength of the four weld types.
| Weld Type | Tensile Shear Strength (MPa) |
|---|---|
| Type 1 | 615 |
| Type 2 | 610 |
| Type 3 | 614 |
| Type 4 | 608 |
© 2017 by the authors. Licensee MDPI, Basel, Switzerland. This article is an open access article distributed under the terms and conditions of the Creative Commons Attribution (CC BY) license (http://creativecommons.org/licenses/by/4.0/).
Share and Cite
MDPI and ACS Style
Hwang, I.; Kim, D.-Y.; Jeong, G.; Kang, M.; Kim, D.; Kim, Y.-M. Effect of Weld Bead Shape on the Fatigue Behavior of GMAW Lap Fillet Joint in GA 590 MPa Steel Sheets. Metals 2017, 7, 399. https://doi.org/10.3390/met7100399
AMA Style
Hwang I, Kim D-Y, Jeong G, Kang M, Kim D, Kim Y-M. Effect of Weld Bead Shape on the Fatigue Behavior of GMAW Lap Fillet Joint in GA 590 MPa Steel Sheets. Metals. 2017; 7(10):399. https://doi.org/10.3390/met7100399
Chicago/Turabian StyleHwang, Insung, Dong-Yoon Kim, Geunho Jeong, Munjin Kang, Dongcheol Kim, and Young-Min Kim. 2017. "Effect of Weld Bead Shape on the Fatigue Behavior of GMAW Lap Fillet Joint in GA 590 MPa Steel Sheets" Metals 7, no. 10: 399. https://doi.org/10.3390/met7100399
Note that from the first issue of 2016, this journal uses article numbers instead of page numbers. See further details here.