Article

Kinetic Study of Ag Leaching from Arsenic Sulfosalts in the S2O32-O2-NaOH System

by
Aislinn M. Teja Ruiz
1,
Julio C. Juárez Tapia
1,*,
Iván A. Reyes Domínguez
2,
Leticia E. Hernández Cruz
1,
Martín Reyes Pérez
1,
Francisco Patiño Cardona
3 and
Mizraim U. Flores Guerrero
4
1
Área Académica de Ciencias de la Tierray Materiales, Universidad Autónoma del Estado de Hidalgo (UAEH), Pachuca de Soto 42184, Mexico
2
Catedrático CONACYT-Instituto de Metalurgia, Universidad Autónoma de San Luis Potosí, San Luis Potosí 78210, Mexico
3
Ingeniería en Energía, Universidad Politécnica Metropolitana de Hidalgo, Tolcayuca 43860, Mexico
4
Área de Electromecánica Industrial, Universidad Tecnológica de Tulancingo, Tulancingo 43642, Mexico
*
Author to whom correspondence should be addressed.
Metals 2017, 7(10), 411; https://doi.org/10.3390/met7100411
Submission received: 12 August 2017 / Revised: 27 September 2017 / Accepted: 30 September 2017 / Published: 3 October 2017

Abstract

:
In Zimapan, Mexico abundant mineral species have been identified. However, a significant number of these precious metals appear to be related to complex sulfides, as is the case of silver (Ag) in sulfosalts. In this work, a kinetic study of the formation of Ag complexes in the AgAsS2-S2O32−-O2-NaOH system from a Zn concentrate found in the Zimapan mining district was conducted. The kinetic model application on Ag leaching shows a linear adjustment in the valuation of the particle size effect. The rate of formation of Ag complexes is dependent of temperature, leaching agent concentration and OH concentration. Furthermore, graphical verification of the kinetic models indicates that the kinetics of the formation of Ag complexes correspond to the shrinking core model with chemical controls as the controlling stage. The formation of Ag complexes was confirmed by Fourier transform infrared (FTIR) spectroscopy.

Graphical Abstract

1. Introduction

Mining is facing a variety of problems world-wide, such as an uncertain demand for minerals and a negative trend in their extraction, due to deficits in operating conditions. The mining industry in Mexico has reported a decrease in the extraction of metals sold in high volumes during the last decade, such as Pb, Cd, Au and Ag, although there has been a slight increase in the production of Mo, Cu, Bi, Mn and Zn [1].
Many of the polymetallic concentrates of Zn, Cu, Pb and Fe produced in Mexico contain significant amounts of the elements of interest, as is the case for Ag and W [2,3,4]. These metals are abundantly present in Mexican deposits as metallic sulfides. The treatment of complex sulfides is inefficient when traditional hydrometallurgical processes are used because they require more selective leaching agents [5,6,7]. Although pyrometallurgy seems to offer great advantages over hydrometallurgy, it involves smelting at high temperature and has high energy requirements, while hydrometallurgical processing involves leaching generally at ambient temperatures [8], and the release of toxic waste affecting the atmosphere. Such issues encourage a search for milder alternative processes that work as a pre-treatment in conventional processes or in a series of selective leaching stages [9,10]. As an example, the pyrometallurgical route to copper involves matte smelting in a reverberatory furnace followed by converting and fire refining, with an energy consumption of 115.96 MJ·kg−1 just for the reverberatory furnace, while copper production by the hydrometallurgical route consumes 92.44 MJ·kg−1 and this energy value includes leaching and electrowinning. For both processes the energy consumption calculations were based on a copper content of 0.5% in ore and 25% in concentrate [11].
Some studies on alternative leaching processes examine the optimization and usage of additives in conventional cyanidation [12], such as the addition of lead nitrate (Pb(NO3)2) and potassium ferricyanide (K3Fe(CN)6) to improve the oxidizing conditions of the system [13,14]. Furthermore, studies on the substitution of the leaching agent have included the use of compounds, including thiocyanate (SCN), thiourea (CH4N2S) and thiosulfate (S2O32−) [15,16,17,18]. The latter two have been shown as the most effective processes, as they provide flexibility in stage processes and allow for the application of methods that have a lower environmental impact [19,20].
One of the objectives of these leaching alternatives is to address the century-long and extensive use of the toxic agent cyanide by traditional industries in the recovery of precious metals [21,22,23]. Thiourea (CH4N2S) and thiosulfate (S2O32−) have become alternatives when the traditional processes show deficiencies in the treatment of refractory minerals, including Ag and Au content as well as other metals, such as Cu, Pb and Mn [24,25,26,27].
In order to achieve the effective dissolution of the metals of interest through alternative techniques, a thorough study of the reactions that occur in leaching is necessary, which must consider the complex chemistry of sulfurous minerals [28,29]. Some studies have determined that for the leaching process with thiosulfate using oxidizing agents, the complexing agent shows a level of degradation that could limit the formation of complexes by the metals of interest, since it generates the formation of elemental sulfur, sulfites and sulfates, as shown in Equations (1)–(5) [19].
S 2 O 3 2 + 2 O 2 + H 2 O = 2 SO 4 2 + 2 H +
2 S 2 O 3 2 + 1 2 O 2 + H 2 O = S 4 O 6 2 + 2 OH
3 S 2 O 3 2 + H 2 O = 2 SO 4 2 + 4 S 0 + 2 OH
3 S 2 O 3 2 + 6 OH = 4 SO 3 2 + 2 S 2 + 3 H 2 O
S 2 O 3 2 = SO 3 2 + S 0
Therefore, the use of Pourbaix diagrams and species-distribution diagrams is essential in the thermodynamic study of these aqueous systems in order to determine the experimental conditions under which the formation of the loaded solution and minimal oxidizing of the complexing agent takes place [30,31,32]. As is an element commonly found in the mining district of Zimapan, Mexico and it can be obtained in quantities of up to 14,700 mg·kg−1. As belongs to the sedimentary elements of sulfosalts and other typical mineral phases of less economic interest, which are also present in this district [33]. This paper examines the influence of temperature, additive concentration, particle size and stirring rate on the dissolution kinetics of Ag contained in an Ag–As sulfide (AgAsS2). This complex sulfide is inside a Zn concentrate, which adds extra value due to the precious metal content. In order to understand the control mechanism in the formation of Ag complexes, we recovered Ag through the use of leaching technology with thiosulfates in a NaOH medium, which triggered the formation of the oxidizing medium by injecting O2.

2. Materials and Methods

Before conducting experimental testing, the mineral zinc concentrate was obtained from El Carrizal in the municipality of Zimapan, Hidalgo, Mexico (latitude 20°43′44.2″ N, longitude 99°23′04.5″ W). This concentrate was dried, homogenized and cut up to produce a representative sample of 0.2 kg. The chemical analysis was carried out three times. This involved performing acid digestion of 1 g of Zn concentrate to obtain an average value of the elemental composition of the sample by inductively coupled plasma–optical emission spectroscopy (ICP–OES) using a Perkin Elmer 8300 spectrometer (Perkin Elmer, Waltham, MA, USA). This operates with a plasma flow of 8 psi, an auxiliary argon flow of 0.5 psi and a nitrogen flow of 0.7 psi. The calibration curve used for the chemical analysis of the samples in the solution was made from a multi-element standard. One gram of the sample (74 μm) was digested with aqua-regia (3 parts of HCl per 1 part of HNO3) on a heating plate at 338 K to achieve higher dissolution of solids. Finally, the insoluble remainder was filtered. The powder sample was delimited to <74 µm to carry out the identification of the mineral species in the Zn concentrate by X-ray diffraction (XRD) utilizing an INEL EQUINOX 2000 powder X-ray diffractometer (Thermo Fisher Scientific, Ecublens, Switzerland) Co-Ka1 (1.789010 Å) radiation was used at 30 mA; voltages of 20 KV and 220 V; and a resolution of 0.095 FWHM.
A sample of the concentrate powder was embedded in an epoxy mount, which was smoothed down and polished before conducting surface analysis and observing particle morphology by scanning electron microscopy–energy dispersive X-ray spectroscopy (SEM–EDS) in a JEOL JSM 6701F scanning electron microscope (JEOL, Tokyo, Japan) at 25 kV and a depth of field of 16.5 mm at different magnifications with secondary and backscattered electrons.
A thermodynamic simulation of the AgAsS2-S2O32−-O2 system was performed by the application of Pourbaix diagrams and species-distribution diagrams using the Medusa-Hydra Chemical Equilibrium Software (Vol. 1, Department of Inorganic Chemistry-The Royal Institute of Technology, Stockholm, Sweden, 2000).
For the Ag dissolution experiments, a 500 mL glass reactor vessel was placed on a Thermo Scientific Super Nuova (Thermo Scientiic, Waltham, MA, USA) heating plate equipped with magnetic stirring. Oxygen was injected through a diffuser and regulated with a flow meter. Aliquots of the leached solution were extracted to monitor the progress of the reaction at different time intervals. They were subsequently analyzed by atomic absorption spectroscopy (AAS) using a Perkin Elmer-Analyst 200 spectrophotometer (Perkin Elmer, Waltham, MA, USA). The effects of the temperature, reagent concentration, initial diameter of particle, stirring rate and solid-liquid ratio in the leaching rate were studied by varying one parameter and keeping the other three parameters constant according to Table 1.
The general conditions for the leaching experiments were as follows: V = 0.5 L, Mineral = 40 g·L−1, PO2 = 1 atm, pH = 9.0, tr = 360 min, d = 74 μm, [S2O32−] = 0.5 mol·L−1, [OH] = 0.1 mol·L−1, T = 298 K and RPM = 670 min−1. The pH of the reaction was monitored during 360 min of dissolution using a pH meter equipped with a pH electrode capable of operating at conditions of alkalinity and acidity (pH = 0–14) and temperatures up to 70 °C. The solution used to regulate the basic medium of the experimental tests was NaOH = 0.1 mol·L−1. The Eh of the dissolution reaction was measured by a potentiometer Thermo Scientific model Orion 4-Star and Star Plus. The oxygen was injected through a diffuser at a partial pressure of 1 atm, which was regulated by a flow meter. For the characterization and the experimental tests, deionized water was used, which fulfilled the following characteristics: pH of 5.5–7.0, conductivity of 4.0–10.0 μmho·cm−1 and hardness of <1.0 ppm. The reagents used in the leaching experiments were sodium thiosulfate 5-hydrate and sodium hydroxide, which were of ACS grade. The chemical analysis and monitoring of reactions was performed by using a multi-elemental standard of Cu, Fe, Al, Co, Zn, Ag, Sb, Au, Cd and Pb, with these compounds and standards purchased from J.T. Baker. The O2 (93.0% purity) used was acquired from INFRA. The leaching liquors were tested for the formation of Ag complexes using the Fourier transform infrared spectroscopy (FTIR) technique using a Perkin Elmer spectrometer Spectrum GX with liquid cells with a cesium iodide window.

3. Results

3.1. Characterization

The results obtained from the chemical and mineralogical characterization performed on the powder samples of Zn concentrate are presented as follows.
An As concentration of 1059.70 mg·kg−1 was determined by an Inductively Coupled Plasma Spectroscopy (ICP) conducted on the Zn concentrate sample, as shown in Table 2.

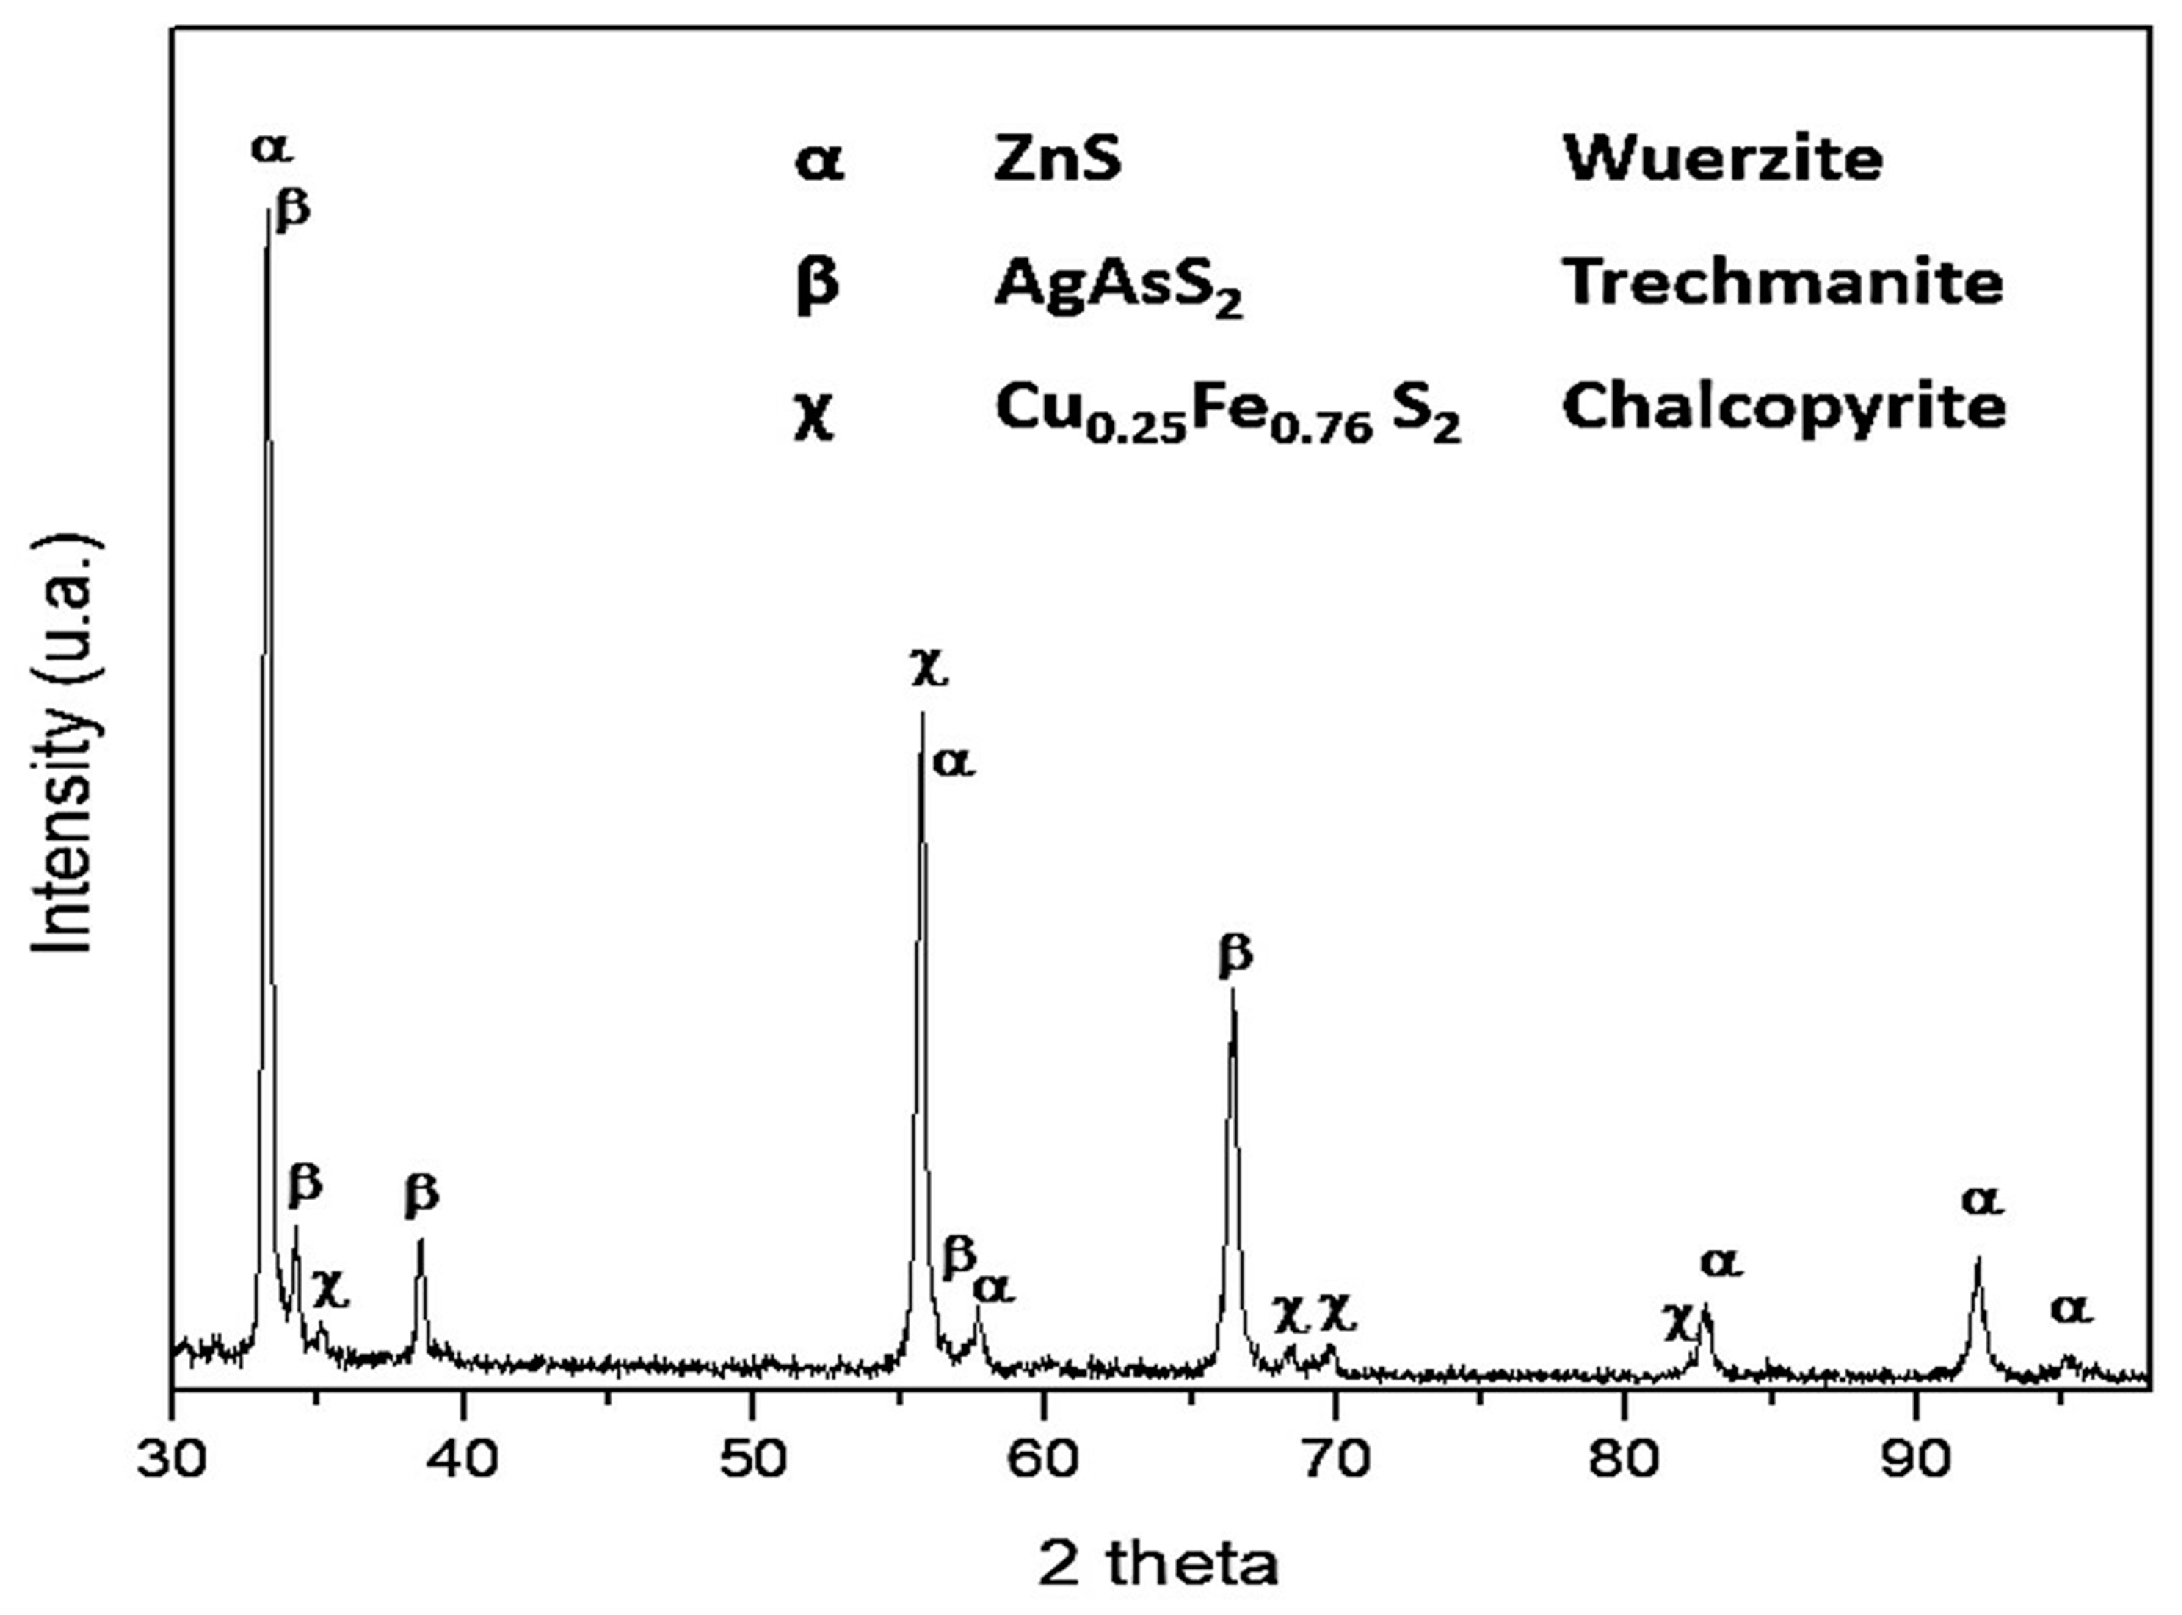
Mineralogical Analysis by X-Ray Diffraction (XRD)

The presence of mineral species corresponding to Ag–As sulfide, identified as Trechmannite (AgAsS2), and a metallic sulfide, identified as chalcopyrite (Cu0.25Fe0.75S2), was determined by X-ray diffraction. Both species are contained in a wurtzite (ZnS) matrix, as shown in Figure 1.
The Zn concentrate exhibits an irregular morphology with smooth angles and semi-spherical particles due to the grinding process. A backscattered electron micrograph and associated X-ray microanalysis obtained by SEM–EDS shows the mineral species that contains Ag (Figure 2).

3.2. Simulation of Speciation of Ag-S2O32−-O2 System

Ag is a noble metal that can be found in the native form, but it usually forms a complex with other metals, such as Au, Hg, Sb, As, Cu, Pb and Pt [34]. For the proposed system in Pourbaix diagrams, two metals (Ag and As) and three non-metals (S, H and O2) were considered. The diagram shown in Figure 3a exhibits two Ag complexes with thiosulfates.
As is an element commonly found in naturally forming sulfides with elements, such as Pb, Fe, Co, Ag and Cu. In its elemental form, it is very stable in water and several aqueous solutions in a wide pH range free of oxidizing agents [35,36]. It can be oxidized into AsO43−, which is a species that dissolves as H3AsO4+ and HAsO42− at low pH conditions. Formation of arsenic sulfides and oxides as well as that of species corresponding to their dissolution has been observed with reduction potentials (Figure 3b). H2SO4 is a species that corresponds to the dissolution of the sulfate ion, which is predominantly found in a pH range of 0–14 and Eh of −0.2–2, as shown in the diagram in Figure 3c.
In the diagram in Figure 4a, the fraction of 0.76 shows the predominance of the species Ag(S2O3)35− over the formation of Ag(S2O3)23− in the pH range of 3.5–10.7, whose fraction corresponds to 0.24. The diagram in Figure 4b exhibits the most abundant species at a pH of 9.0, which corresponds to HAsO42−.

3.3. Kinetic Study of Silver Leaching in Thiosulfate System in NaOH Medium of Zn Concentrate

In heterogeneous reactions where a solid-liquid interface is present, it is important to consider that the process consists of several stages comprised of mass transport and chemical reaction. The variable that allows us to describe the evolution of the reaction is defined as conversion, which represents the amount of reacted mass in relation to the initial mass. In the case of the Ag dissolution, the reaction was monitored by taking into account the fraction of Ag found in complexes (in aqueous solution) by thiosulfate in relation to the amount of Ag present in the concentrate. This is shown in Equation (6):
X Ag = [ Ag ] complexed [ Ag ] initial
Figure 5 shows the dissolution curve of Ag, which demonstrates a short induction period of less than 20 min when the first sample was taken. This period was followed by a progressive conversion period where Ag started to form complexes in the solution and finally at 300 min, a stabilization period can be seen where the highest recoveries of leached precious metal were obtained.
The development of the kinetic study for this type of non-catalytic reaction, where the solid particles are suspended in an active solution, involved the application of two main models: the progressive conversion model and the unreacted shrinking core model [37]. When the chemical stages occur in short periods of time, the fluid reagent in heterogeneous reactions diminishes quickly on the surface of the solid. The flow of the leaching solution diffuses by unit of time in a perpendicular direction on the surface of the solid particle. This applied kinetic model is represented in Equation (7).
t τ = 1 3 ( 1 X Ag ) 2 3 + 2 ( 1 X Ag ) = k exp t
When the chemical reaction occurs in longer periods of time compared to the phenomena of hydrodynamic effects, no significant gradients of concentration in the fluid layer are produced. Therefore, the dissolution mechanism is controlled by the chemical stages, where there is a low dependence on matter transport, and a high sensitivity to increases in temperature. Furthermore, the reaction orders that are different from this mechanism [38,39] can be observed. The kinetic equation that describes this process is shown as follows:
t τ = 1 ( 1 X Ag ) 1 3 = k exp t
In order to choose the kinetic model of the S2O32−-O2-NaOH system, a graphic verification of the control mechanisms for the conversion of Ag was conducted where the chemical control model was verified against the model by transport (Figure 6). A larger linear regression was observed after applying the chemical control model, with a value of R2 = 0.986 being obtained. This indicates that the Ag dissolution is preferably described by the shrinking core model with the chemical reaction as the controlling step. This is dissimilar to the model by transport with a linear regression of 0.952. In both regressions, the slope represents the experimental rate constant (kexp).

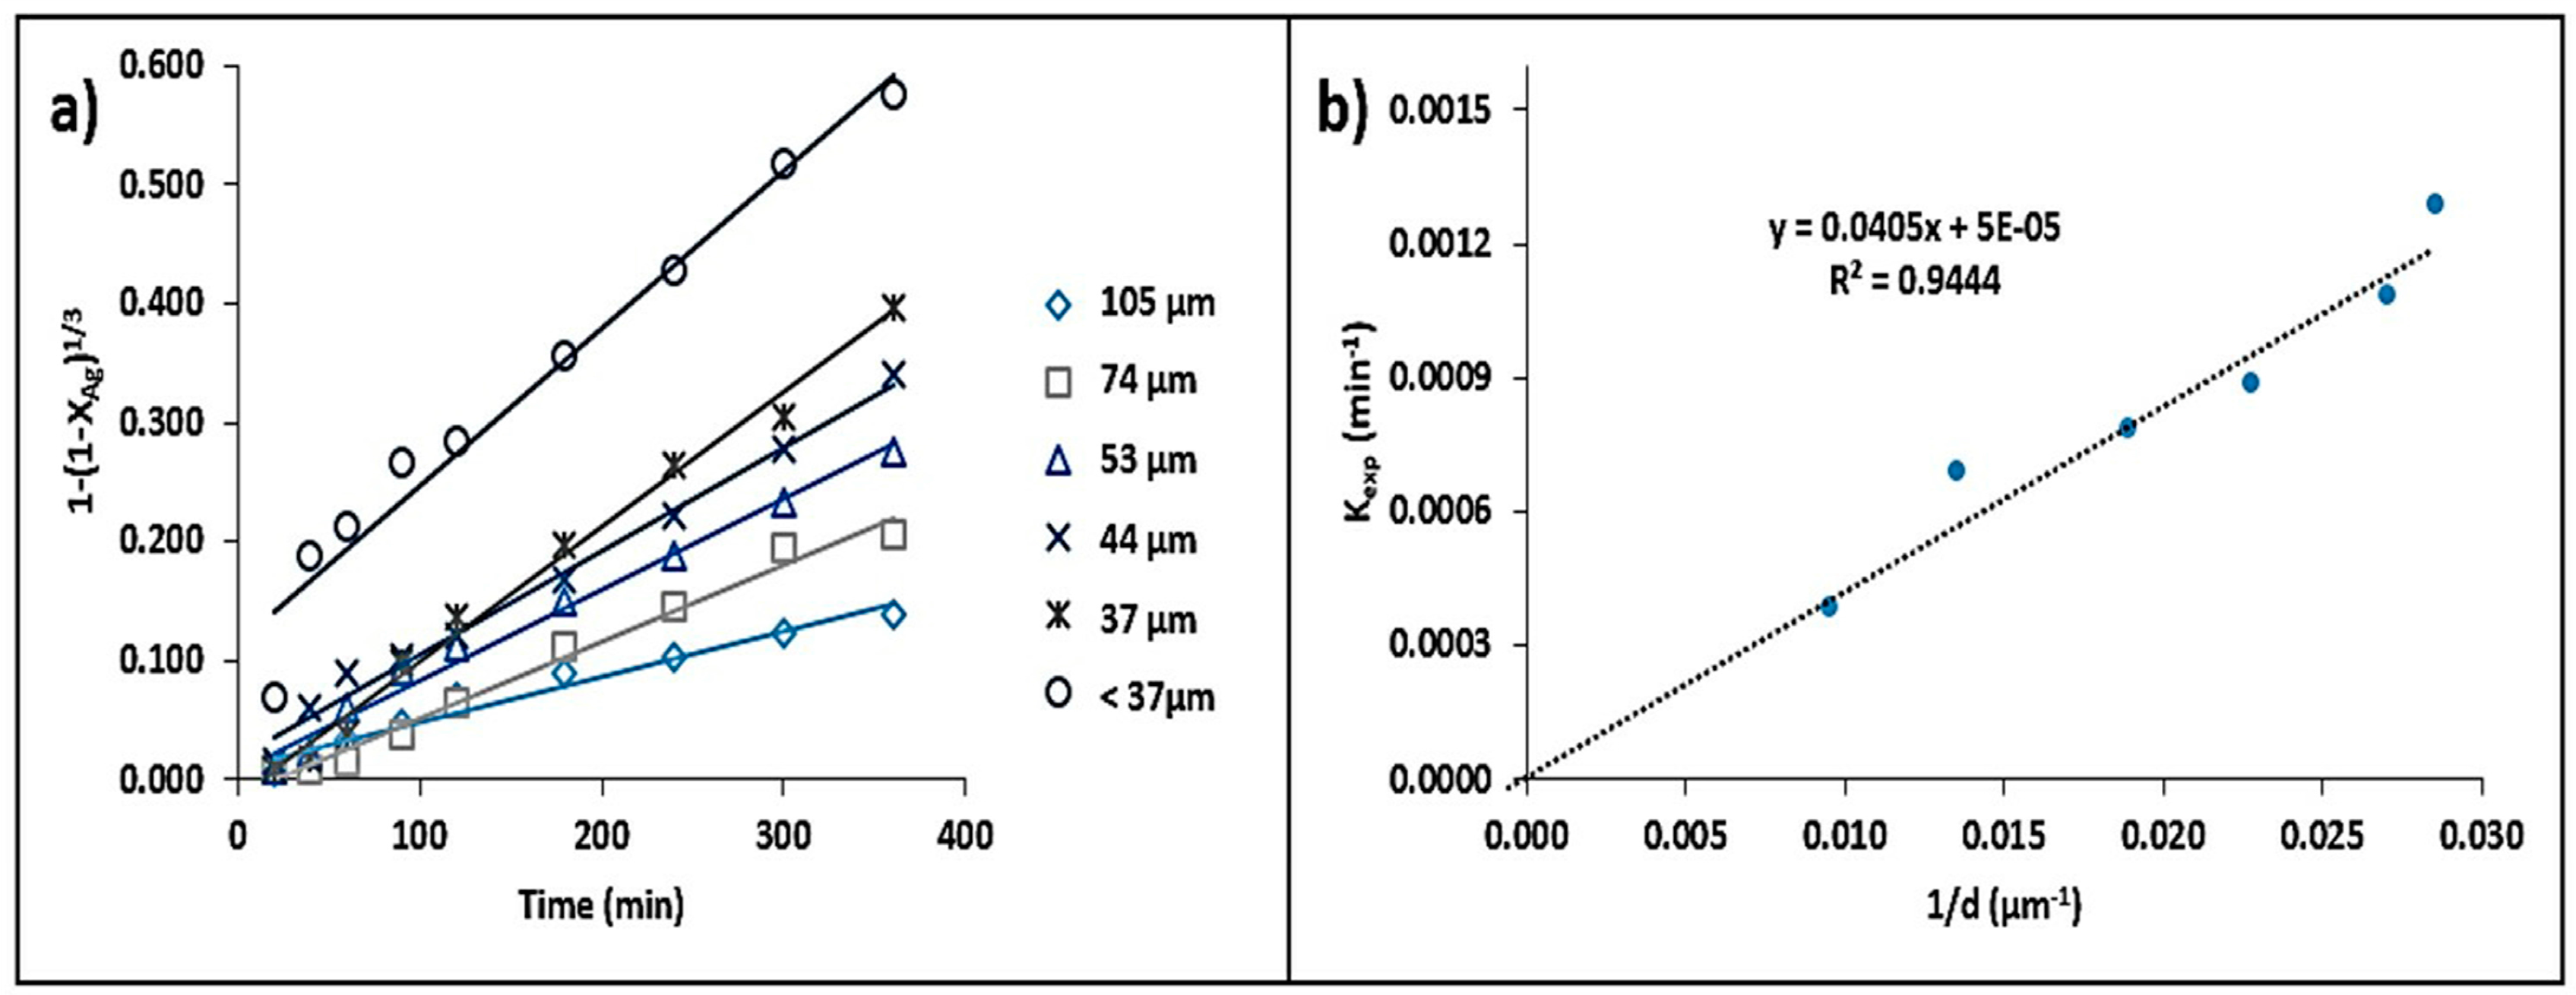
3.3.1. Particle Size Effect

The evaluation of the particle size effect on the equation of the shrinking core model with chemical control is shown in Figure 7a. There is an increase in the dissolution rate of Ag with a decrease in the size of particles, which is indicative of a larger surface area being in contact with the leaching solution and thus, accelerating the reaction [19]. Figure 7b shows that kexp is inversely proportional to the particle diameter (kexp vs. 1/d0). Therefore, the leaching reaction of Ag is consistent with the shrinking core model with chemical control.

3.3.2. Concentration Effect

The values obtained from the extraction of Ag based on the application of the chemical control model as a function of time are presented in Figure 8a for all the thiosulfate concentrations used. Figure 8b shows the pseudo reaction order with respect to [S2O32−](α), which was obtained by linear regression. We plotted log [S2O32−] against log kexp to obtain the straight line where the slope represents the pseudo order of reaction (n).
The resulting slopes from the effect of the concentration of sodium hydroxide are plotted in Figure 9a. They show a rise in reaction rate with an increase in hydroxide concentration. The pseudo order of the reaction (β) was determined by linear regression of the experimental constants obtained for the whole range of concentrations, which was plotted against the logarithm of the NaOH concentration (Figure 9b).

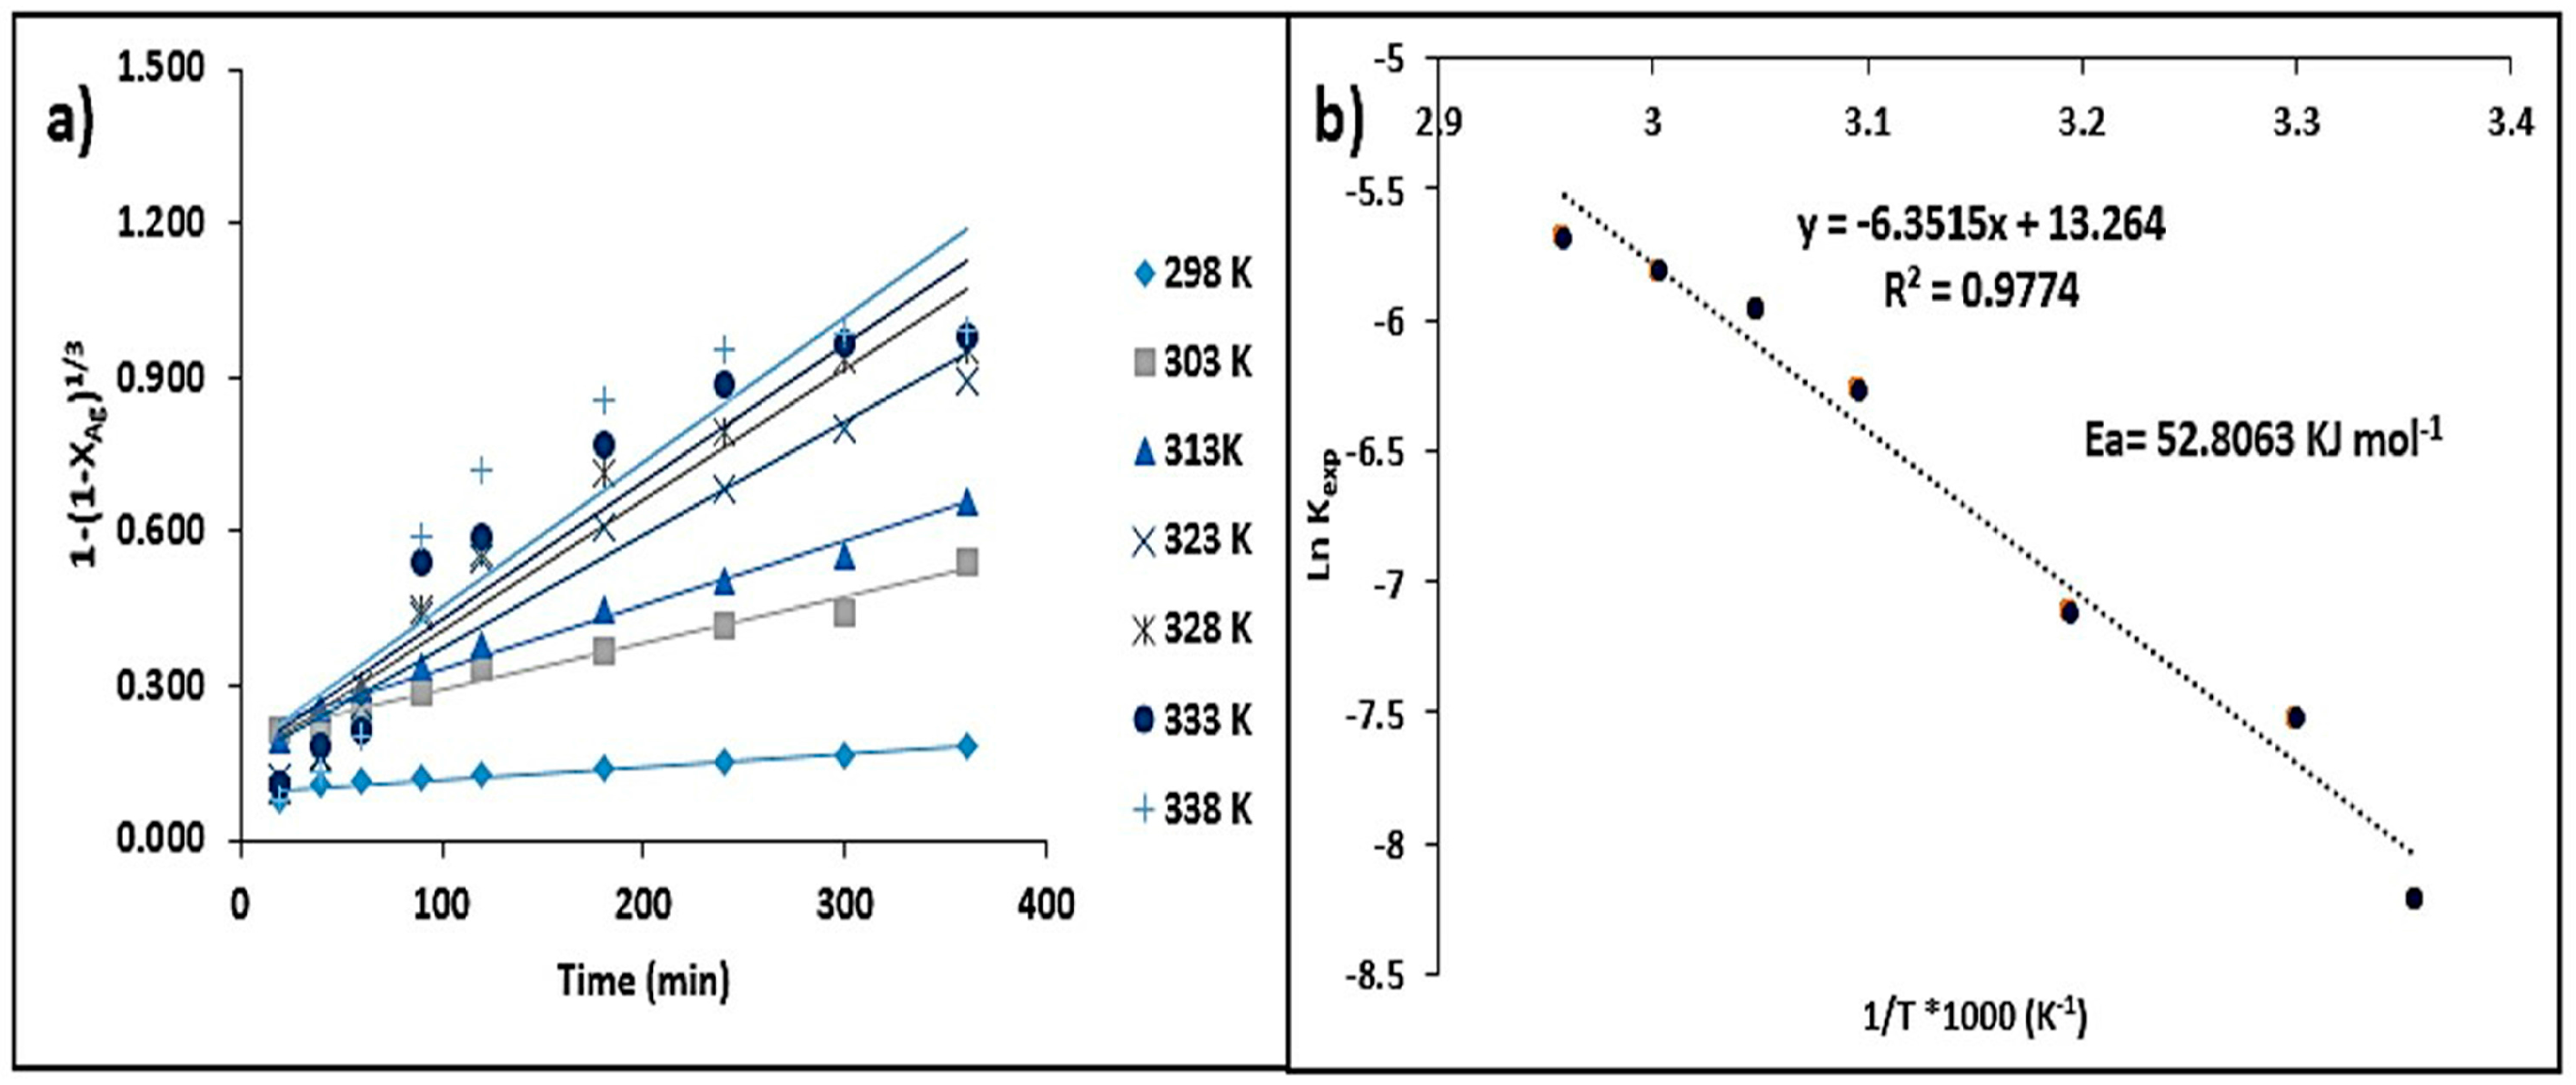
3.3.3. Temperature Effect

To study this factor, NaOH concentration, particle size and thiosulfate concentration were maintained at constant values with only variations in the temperature range. Figure 10a exhibits the application of the chemical control model as a function of time. This confirms the strong influence of temperature on the Ag dissolution rate.
The activation energy (Ea) was determined through the Arrhenius equation. In order to calculate the activation energy of the system, the values of the rate constants (kexp) obtained for each of the experiments performed at different temperatures were plotted. The values of the experimental constants (kexp) were obtained through Equation (9), where the value of the rate constant (kvel) is expressed for each temperature in relation to the hydroxide ion concentration raised to the reaction order calculated for that variable.
k exp = K vel [ OH ] n
By representing the natural logarithm of kexp against 1/T, a slope is obtained where m = −Ea/R. Thus, this allowed us to determine the activation energy of the Ag-S2O32−-O2 system (Figure 10b).

3.3.4. Stirring Rate Effect

The Ag conversion data obtained from experiments conducted at different stirring rates are shown in Figure 11a. The experimental rate constants (kexp) were calculated in the same manner as the previously mentioned effects. The representation of kexp against stirring rate is a line with a slope of 0 as observed in Figure 11b.

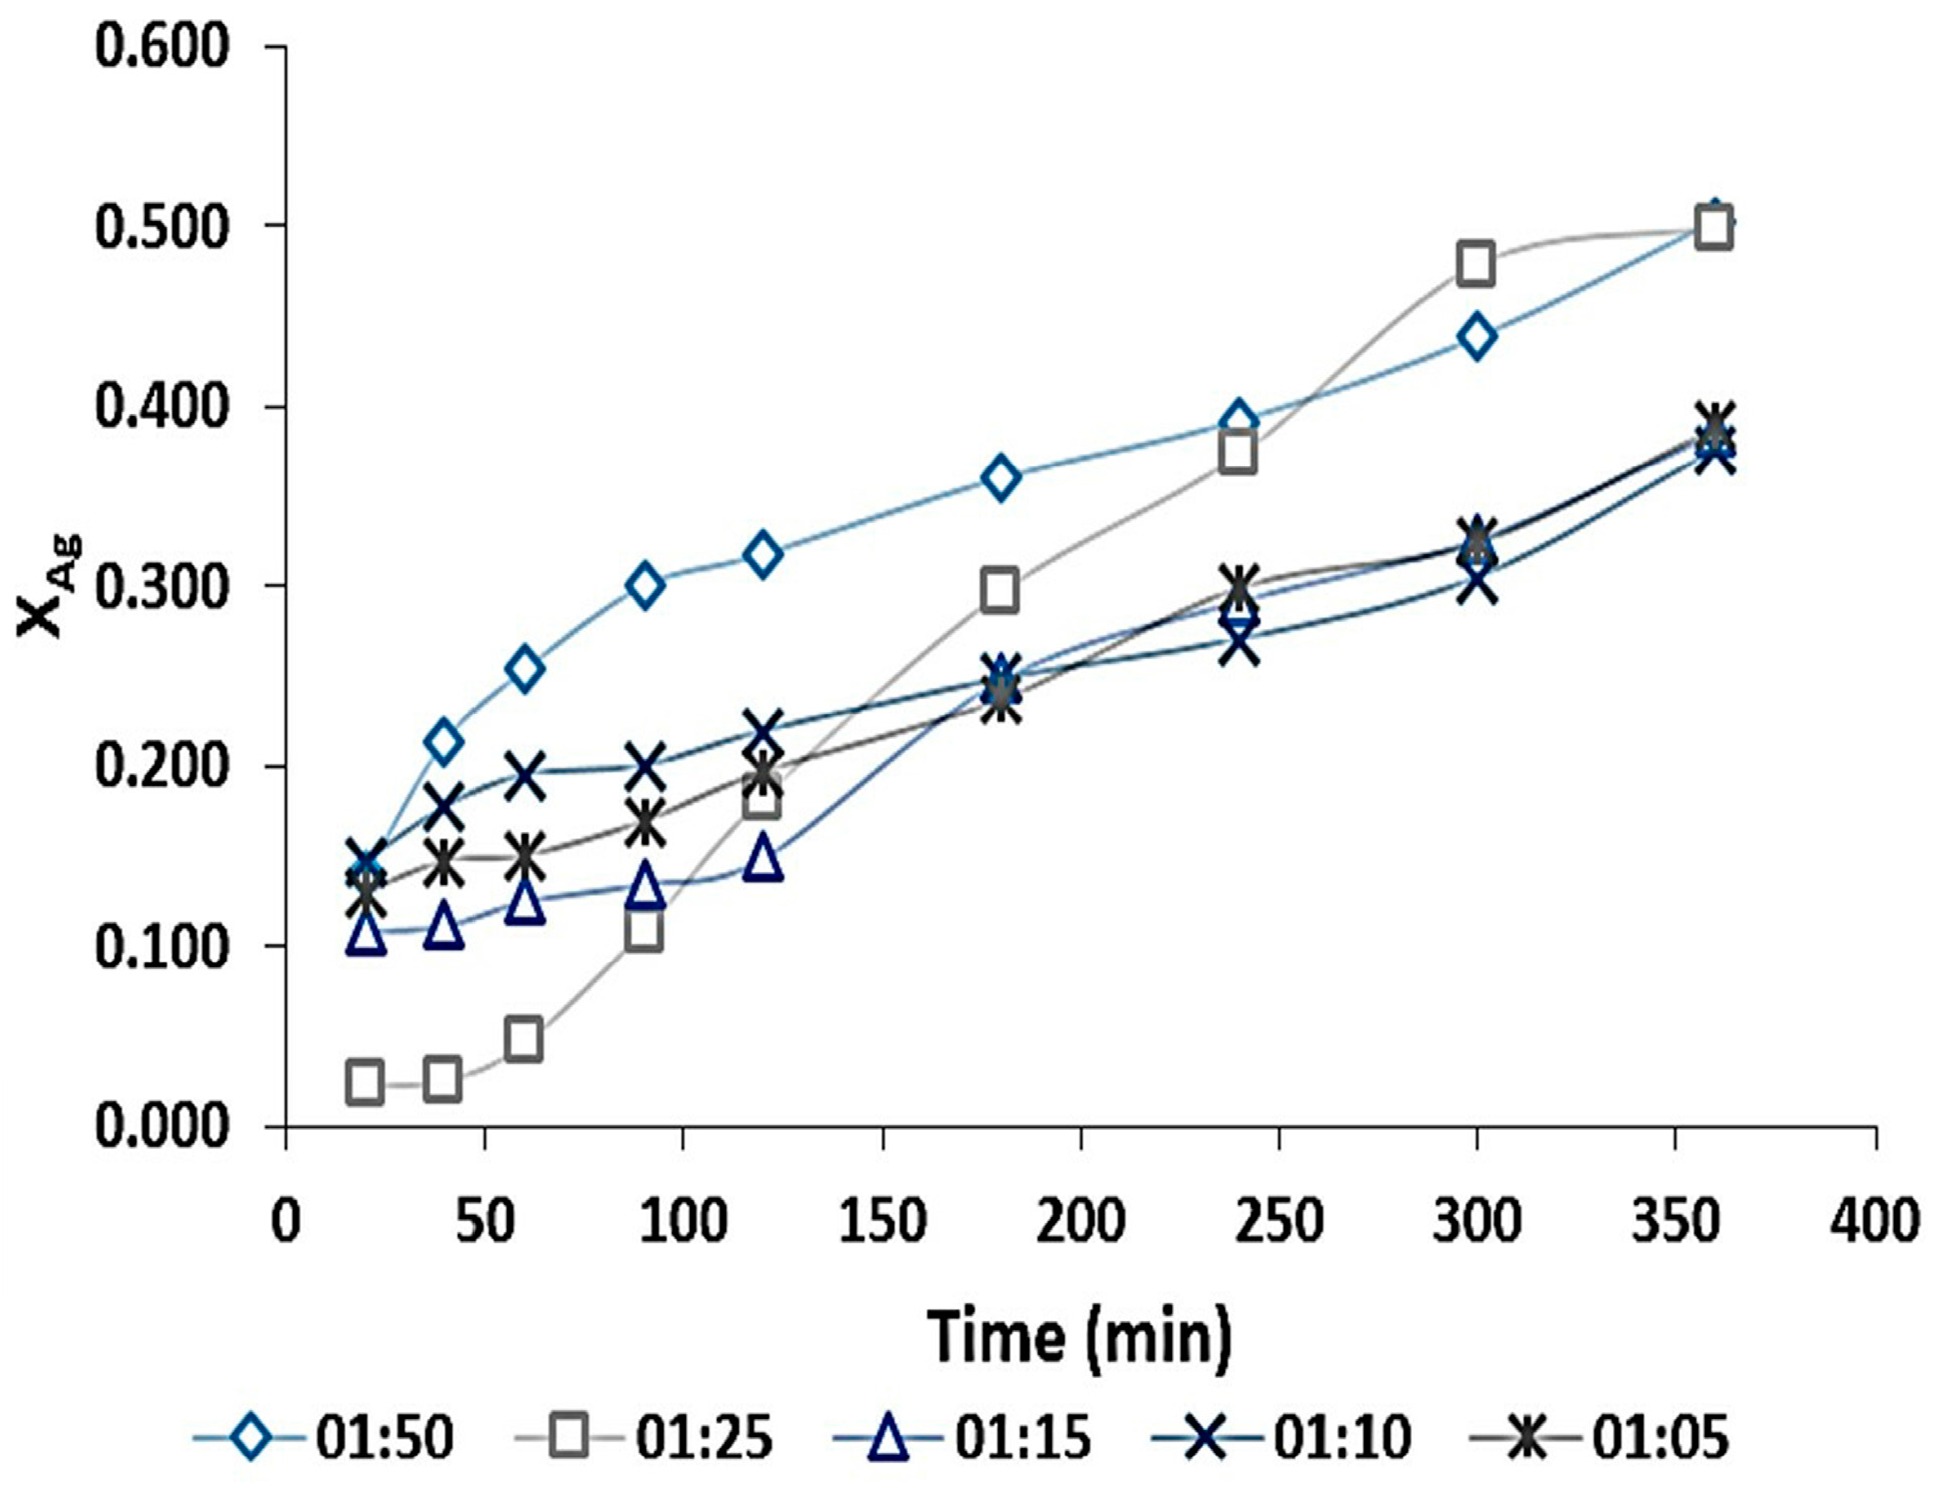
3.3.5. Solid-Liquid Ratio Effect

The data for the Ag dissolution as a function of time is shown in Figure 12. It can be seen that for the solid-liquid ratios corresponding to 1:25 and 1:50, the dissolution rate is higher starting from 90 min compared to the other proposed ratios. However, for the ratios of 1:05, 1:10 and 1:15, the fraction of Ag leached is very similar, although this resulted in lower percentages.
The presence of the Ag complex with thiosulfate in leach liquid obtained from a single experiment at different dissolution times was identified by Fourier transform infrared spectroscopy (FTIR). The experiment was conducted under the following analysis conditions: T = 298 K, d = 74 µm, Mineral = 40 g·L−1, V = 0.5 L, pH = 9.0, PO2 = 1 atm, [S2O32−] = 0.5 mol·L−1, [OH] = 0.1 mol·L−1 and tr = 720 min (Figure 13).

4. Discussion

The formation of Ag-sulfo-antimonides and sulfo-arsenides occurs in contact with mineral bodies of the base metal, such as Fe, Cu and Zn [38], which were identified as the most abundant elements in the concentrate. The high concentration of sulfur obtained by the ICP technique suggests the presence of Fe-, Cu- and Zn- sulfides (Table 2, Figure 1 shows the elemental composition of mineral species in the concentrate. The identification of AgAsS2 allowed us to relate the concentration of As to the Ag content, which corresponded to 0.03% Ag (258.40 g·ton−1).
The most profitable mineral deposits in Mexico are characterized by a vertical zonation made up of mineral associations. These include large amounts of sulfosalts and Ag-Au-tellurides in contact with gangue mineral zones, such as fluorite, calcite, and quartz, in addition to mineral assemblages of Zn-Pb-sulfides and Fe-Cu-sulfides [39]. The metallic particles of different densities corresponding to the mineral species containing Ag were identified through gray scale contrast (Figure 2). Such mineral species usually appear as a stable solid solution, which is paragenetically related to the formation of galena (PbS) [40]. The presence of Au-Pd is due to the necessary coating for sample observation, while C and O are related to the epoxy resin in which the sample was embedded.
This confirms that despite the presence of As in the solution and the diluted concentration of Ag, the pH range of dissolution is wide compared to the potential range. At oxidizing potentials, Ag precipitates as Ag2O3, while at reduction potentials, one can observe the predominance of Ag2S and metallic Ag. At a pH of 9 and oxidizing potentials, which are the conditions used for the experiments, we identified the species of HAsO42−; as being predominant in a pH range of 7.8–10.8 and Eh of 0.2–2. In the reduction potential range, the elemental S, Ag and As sulfides can be obtained as well as the species corresponding to the dissolution of sulfur (Figure 3b). HSO4 and SO42− are the most thermodynamically stable species present in the S-H2O system, compared to ions, such as tetrathionate (S4O62−) and sulfite (SO32). These are species of a metastable nature related to the inherent decomposition of thiosulfate (Figure 3c) [41,42]. At a pH higher than 10.7, the precipitation of Ag in the form of oxide was identified (Figure 4a). Moreover, the abundant formation of Ag(S2O3)23− was observed only in the pH range of 0–3.5 with the highest fraction of 0.98. HAsO42− is predominantly found in the pH range of 6.8–11.0, with a fraction of 0.99 over the minimal formation of H2AsO4 and AsO43−. At a pH lower than 2.3, there is a predominant formation of H3AsO4 with a fraction of 0.99. The formation of arsenic oxide was observed at a pH higher than 11 (Figure 4b).
Due to the varied mineralization of the zinc concentrate, determining the stoichiometry of the present system is a very complex task. For this reason, it was conducted only on the two species of complexed Ag identified in the Pourbaix diagrams. This considered the other species observed in the Ag+-S2O32−-H2O aqueous system under the previously mentioned experimental conditions, as observed in Equations (10) and (11):
4 AgAsS 2 + 12 Na 2 S 2 O 3 + 14 H 2 O + 29 O 2 = 4 Ag ( S 2 O 3 ) 3 5 + 4 HAsO 4 2 + 24 NaOH + 8 SO 4 2
4 AgAsS 2 + 6 Na 2 S 2 O 3 + 8 H 2 O + 21 O 2 = 4 Ag ( S 2 O 3 ) 2 3 + 4 HAsO 4 2 + 12 NaOH + 4 SO 4 2
The resulting slopes of the particle size effect study allowed us to calculate the respective experimental rate constants (kexp) for each diameter at which the Zn concentrate particles were delineated (Figure 7a). Up to 92% of the precious metal was reached in the leach liquors at a particle diameter of <37 µm.
In order to use a model that would describe the leaching process of Ag in relation to the different variables, the particle size was limited to 74 µm for the subsequent experimental tests. This is the diameter at which the highest distribution of silver was obtained from the Zn concentrate. It can be observed that the highest recoveries were reached with a concentration of 1.5 mol·L−1, which corresponds to 59% of Ag in the solution at room temperature. At lower thiosulfate concentrations, recovery of Ag is similar, without reaching more than 50% dissolution (Figure 8a). This behavior is attributed to the fact that diluted solutions of thiosulfate (<0.01 mol·L−1) decompose faster than concentrated solutions (>0.1 mol·L−1) [43,44]. In order to determine the pseudo order of the reaction (α) and plot it against the concentration of the complexing agent, the dependence of kexp was represented as a function of [S2O32−]. When [S2O32−] was in the range of 0.05–0.75 mol·L−1, the calculated pseudo order of reaction (α) was 0.089, which indicates a slight dependence of the reaction rate on an increase of the leaching reagent. However, there was no influence of thiosulfate above this range, which could be possibly due to a possible saturation of the reaction (Figure 8b).
The obtained values for each [OH] concentration as a function of the chemical control model were plotted against reaction time. The dissolution of the leached Ag increased by 17% as [OH] increased from 0.01 mol·L1 to 0.6 mol·L1 (Figure 9a). For the range of studied [OH] concentrations, the pseudo order of the reaction (β) was found to have a value of 0.13, which indicates that the dissolution rate is slightly dependent on an increase in NaOH concentration. The kexp values obtained for each [OH] concentration remain at the same pseudo order of magnitude, which suggests that an increase in [OH] concentration has very little effect on the reaction rate (Figure 9b).
In the temperature effect study, the dissolution increases along with temperature until the maximum value of 98% is reached at 333 K. In the case of Ag dissolutions conducted at 333 and 338 K, the reaction rate is faster in the first 90 min, recovering 58.7% of Ag (Figure 10a). The recovery rate and recovery percentages subsequently increase in smaller increments compared to the dissolutions obtained at lower temperatures. This irregular behavior is attributed to the fact that 338 K exceeds the stability range of the thiosulfate ion and reduces the formation of Ag complexes as the dissolution progresses [45,46].
The obtained value of Ea was 52.80 kJ·mol −1. This is higher than the established limit of 40 kJ·mol−1 for reactions where the controlling stage is the chemical reaction (Figure 10b) [47]. Figure 11a shows that the progress of the dissolution is similar in all the experiments, with 55% Ag recovered in the leach liquors. Therefore, we can conclude that the stirring rate does not affect the reaction mechanism in the studied range (Figure 11b).
Previous studies have reported the use of larger amounts of mineral in relation to smaller volumes of solution. Nonetheless, the complexing agent concentration was less than 3 mol·L−1 [9,30]. In the case of solid-liquid ratios above 1:20, the amount of free thiosulfate ions is higher, thus allowing for greater proportion of Ag complexes forming (Figure 12) [13,48].
The energetic dependence and the linear dependence of the particle size as well as the graphical verification of the conversion of Ag as a function of the chemical control model was plotted against the model of mass transport. These results confirm that the shrinking core model is consistent with the leaching process of the Ag-S2O32−-NaOH system as it shows a higher linear regression coefficient when the mechanism by chemical control is applied (R2 = 0.986).
The general equation of the global reaction rate involves all the assessed parameters, which had an apparent influence on the reaction rate (Equation (12)).
V d = [ 1 ( 1 X Ag ) 1 3 = V m K 0 r 0 e Ea RT   [ S 2 O 3 2 ] α [ OH ] β   t
Substitution of the obtained parameters in the kinetic study in Equation (12) allowed us to establish the kinetic expression of the global rate, which corresponds to the alkaline leaching of Ag with the use of thiosulfates. This is as follows:
1 ( 1 X Ag ) 1 3 = 5.7607 x 10 5 e 52.8 RT   [ S 2 O 3 2 ] 0.089 [ OH ] 0.133   t
This expression shows the effect that time, S2O32− concentration and OH concentration have on the fraction of Ag that is transformed into the final product. These results are valid in the temperature range of 298–338 K and in the concentration ranges of 0.05–0.75 mol·L−1 S2O32− and 0.3–0.6 mol·L−1 of OH.
Figure 13 shows that the vibrations of the species Ag(S2O3)35− maintained their intensity as the leaching time elapsed. This also occurred with the vibrations that correspond to the OH and SO42− ions in the range of 20–720 min at room temperature [49,50], which was identified by FTIR.

5. Conclusions

(1)
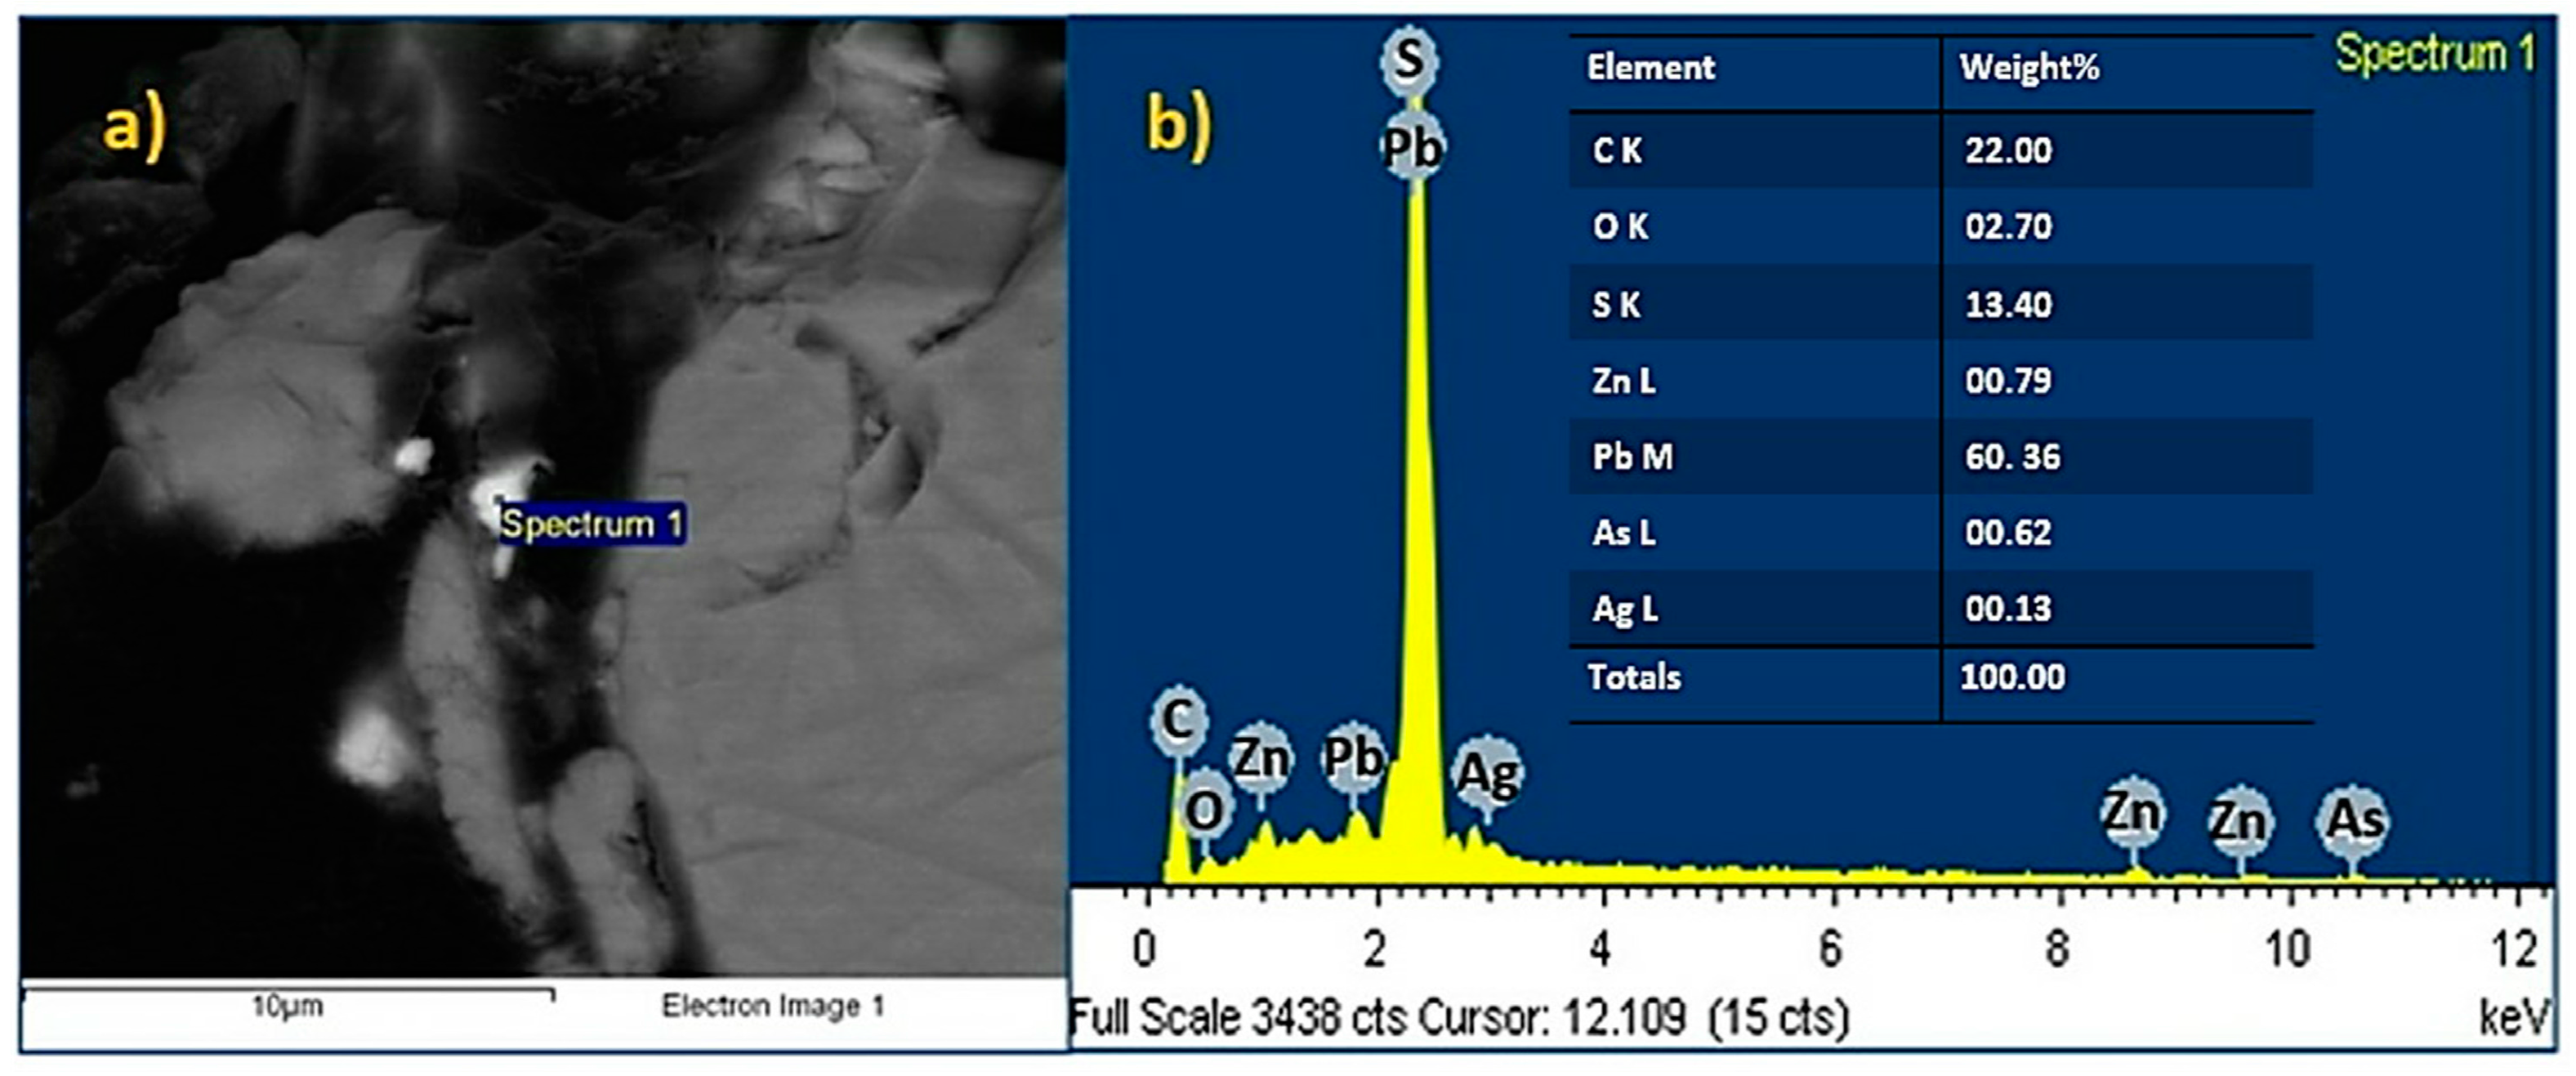
The presence of sulfides of the base metal, such as chalcopyrite (Cu0.25Fe0.75S2) and wurtzite (ZnS), was identified through chemical and mineralogical characterization of the powder samples of the Zn concentrate. These species, which are typical of the mining district of Zimapan, Mexico, correspond to the mineral matrix of the concentrate. Chemical analysis yielded 258.40 mg·Ag·kg−1. The presence of Ag is related to the formation of As sulfosalts, such as trechmannite (AgAsS2), which was identified in the XDR and SEM–EDS results.
(2)
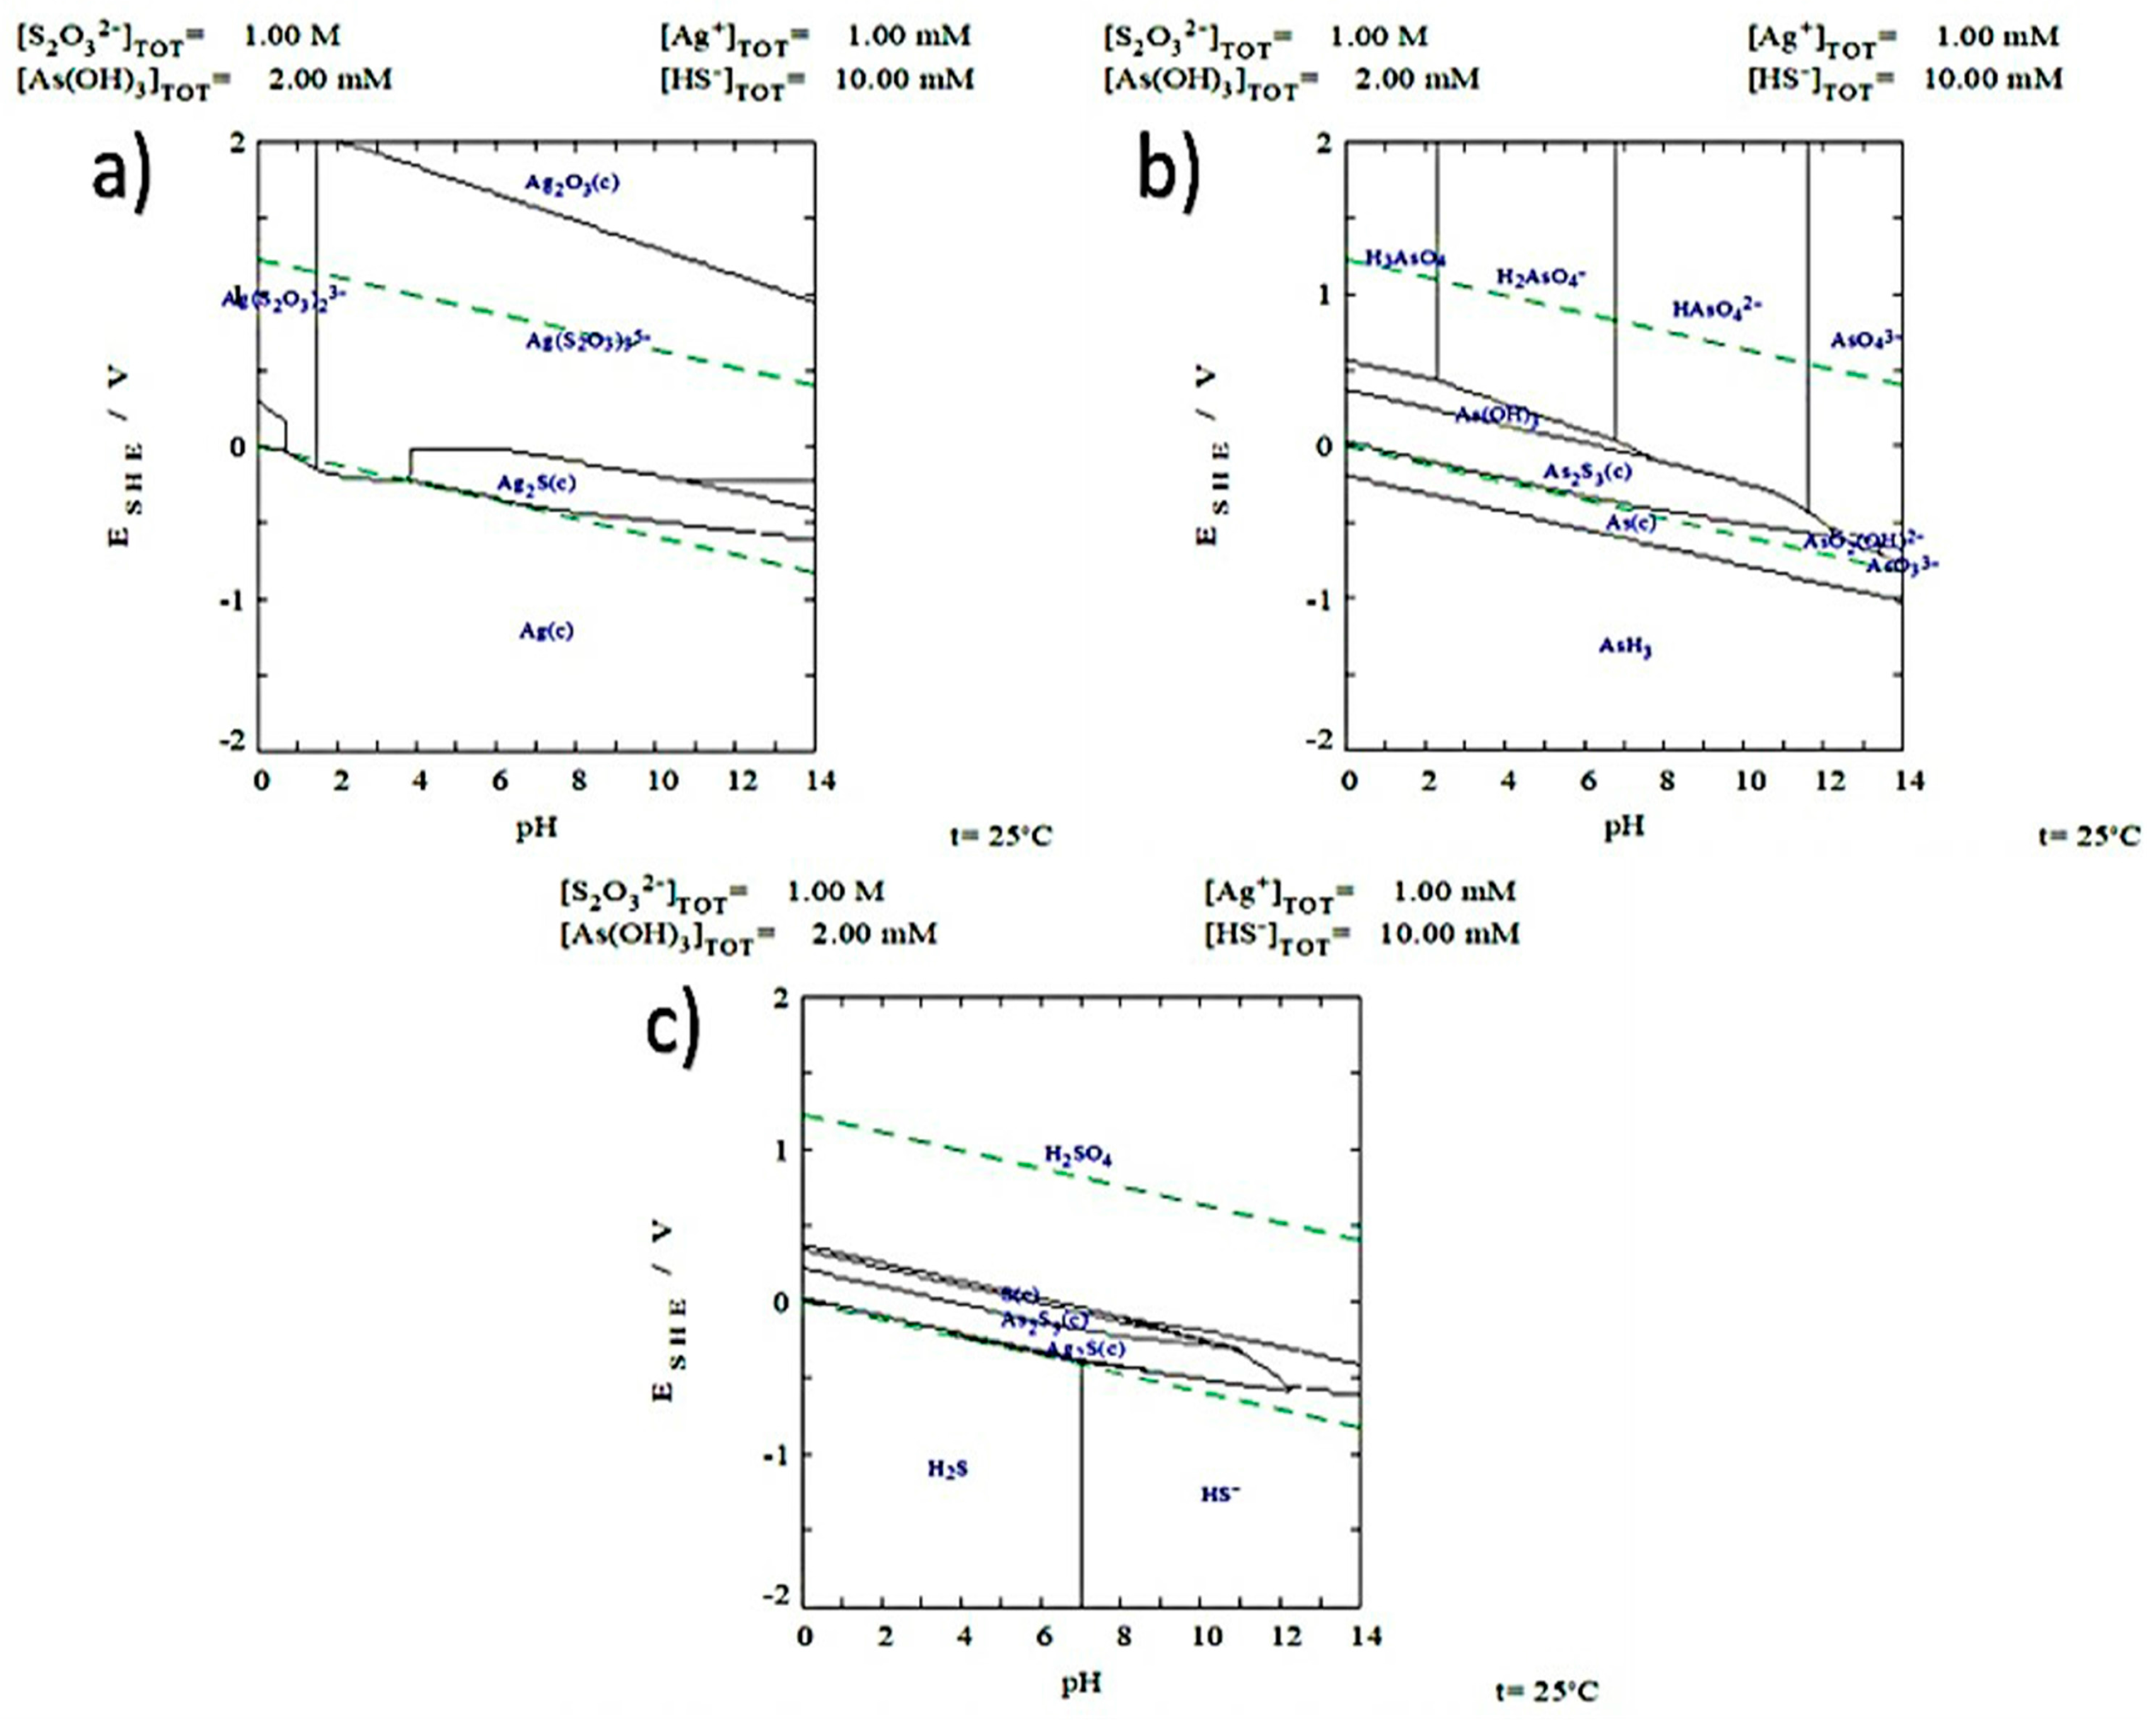
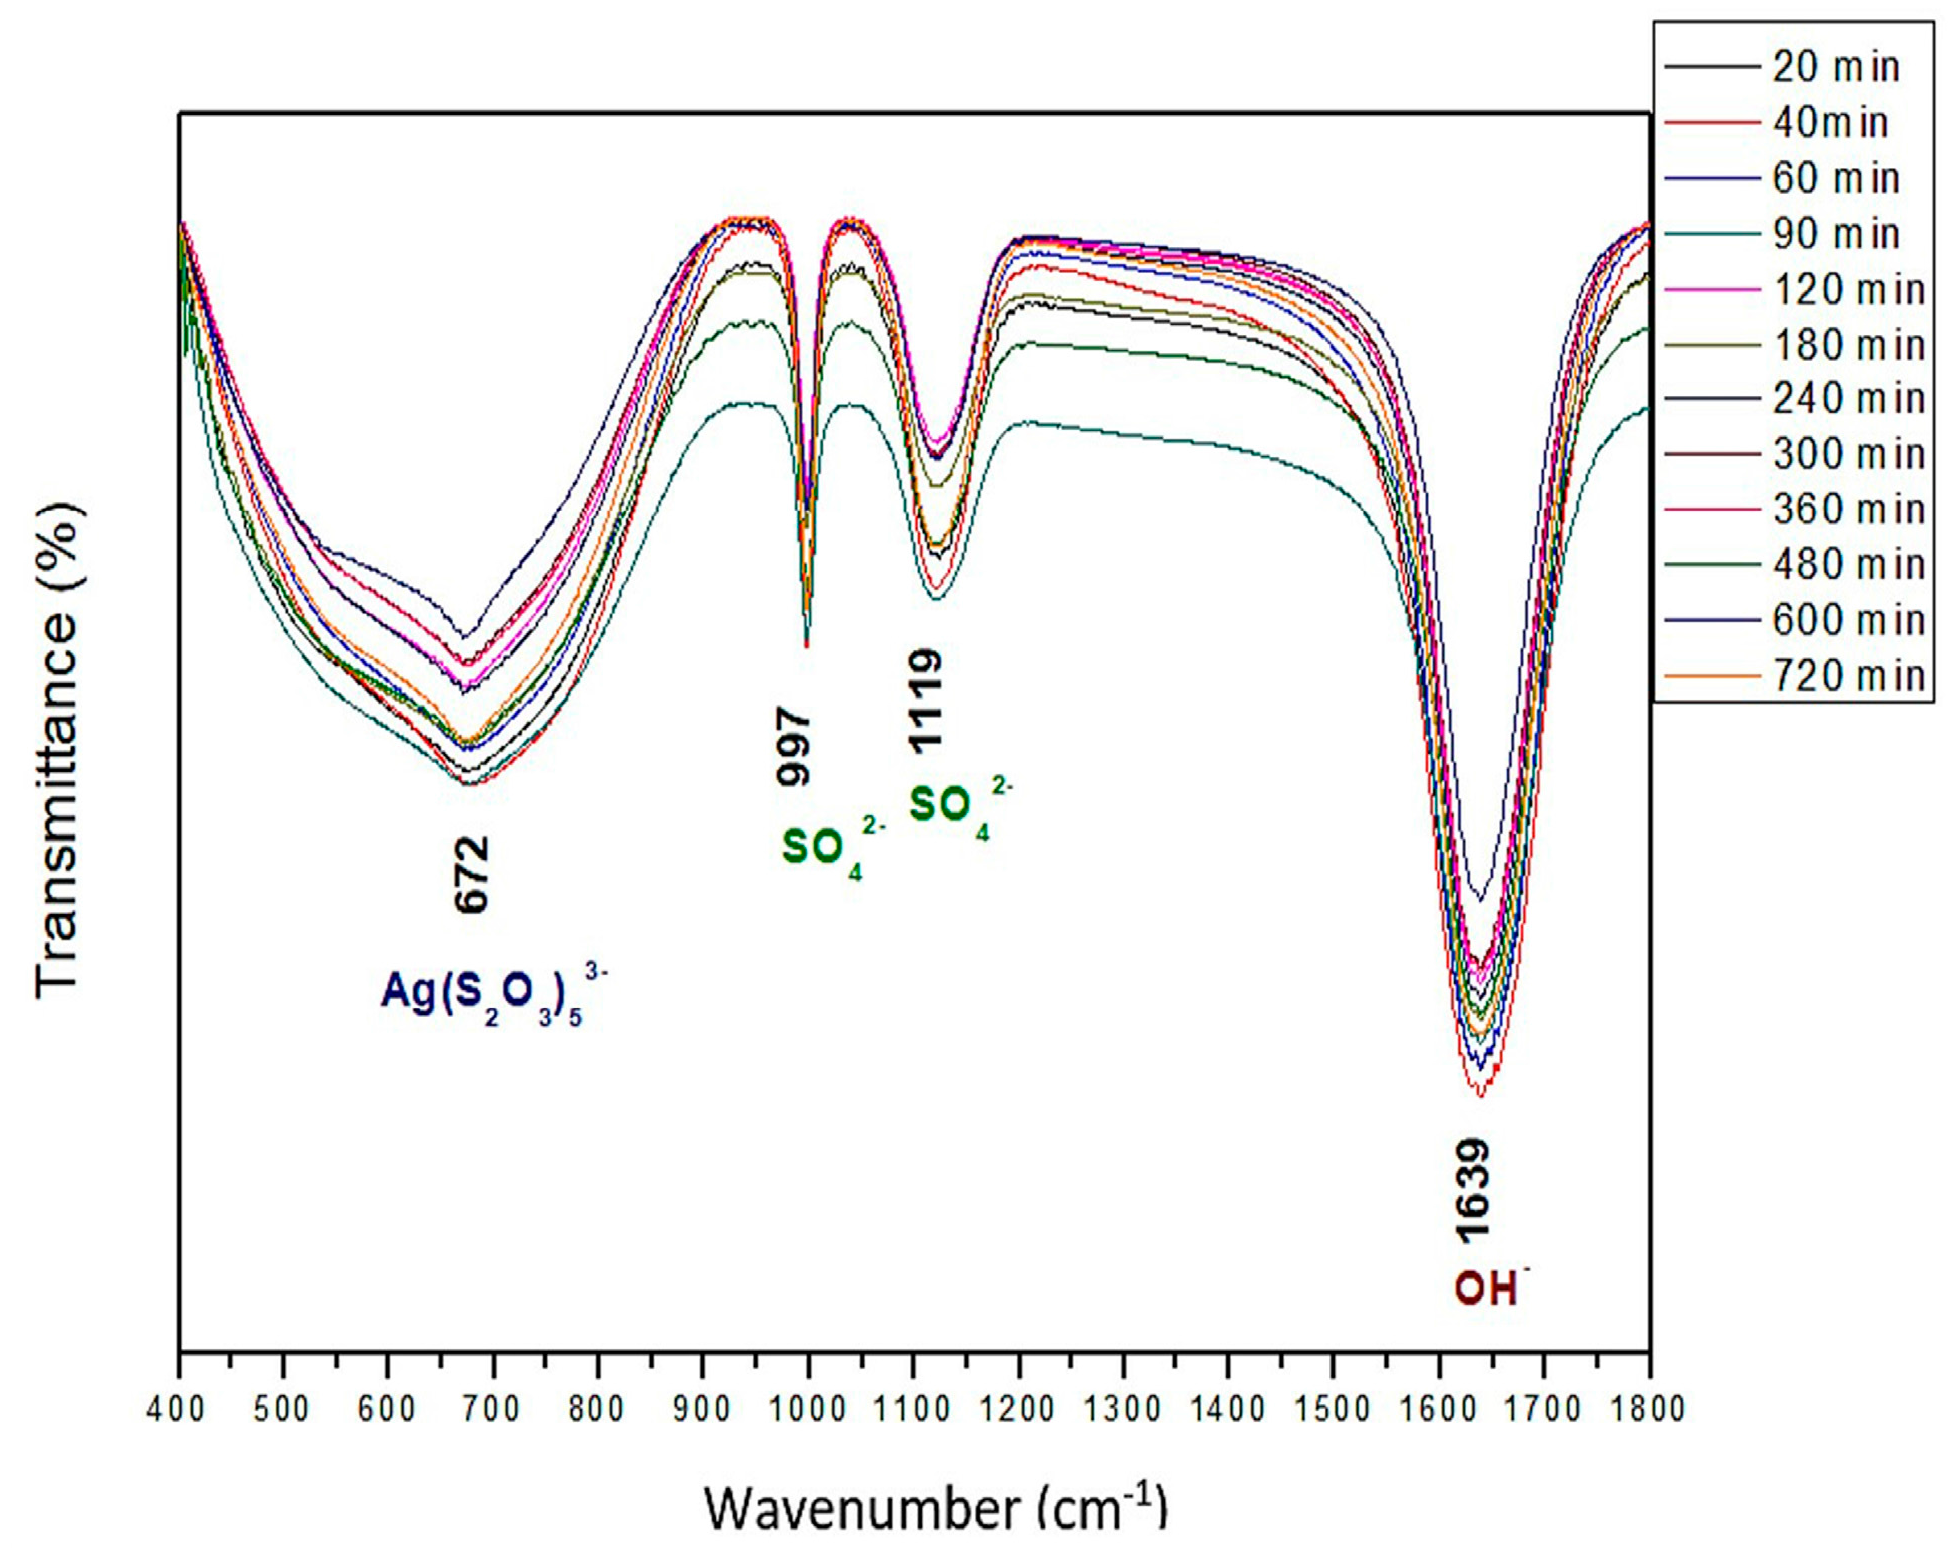
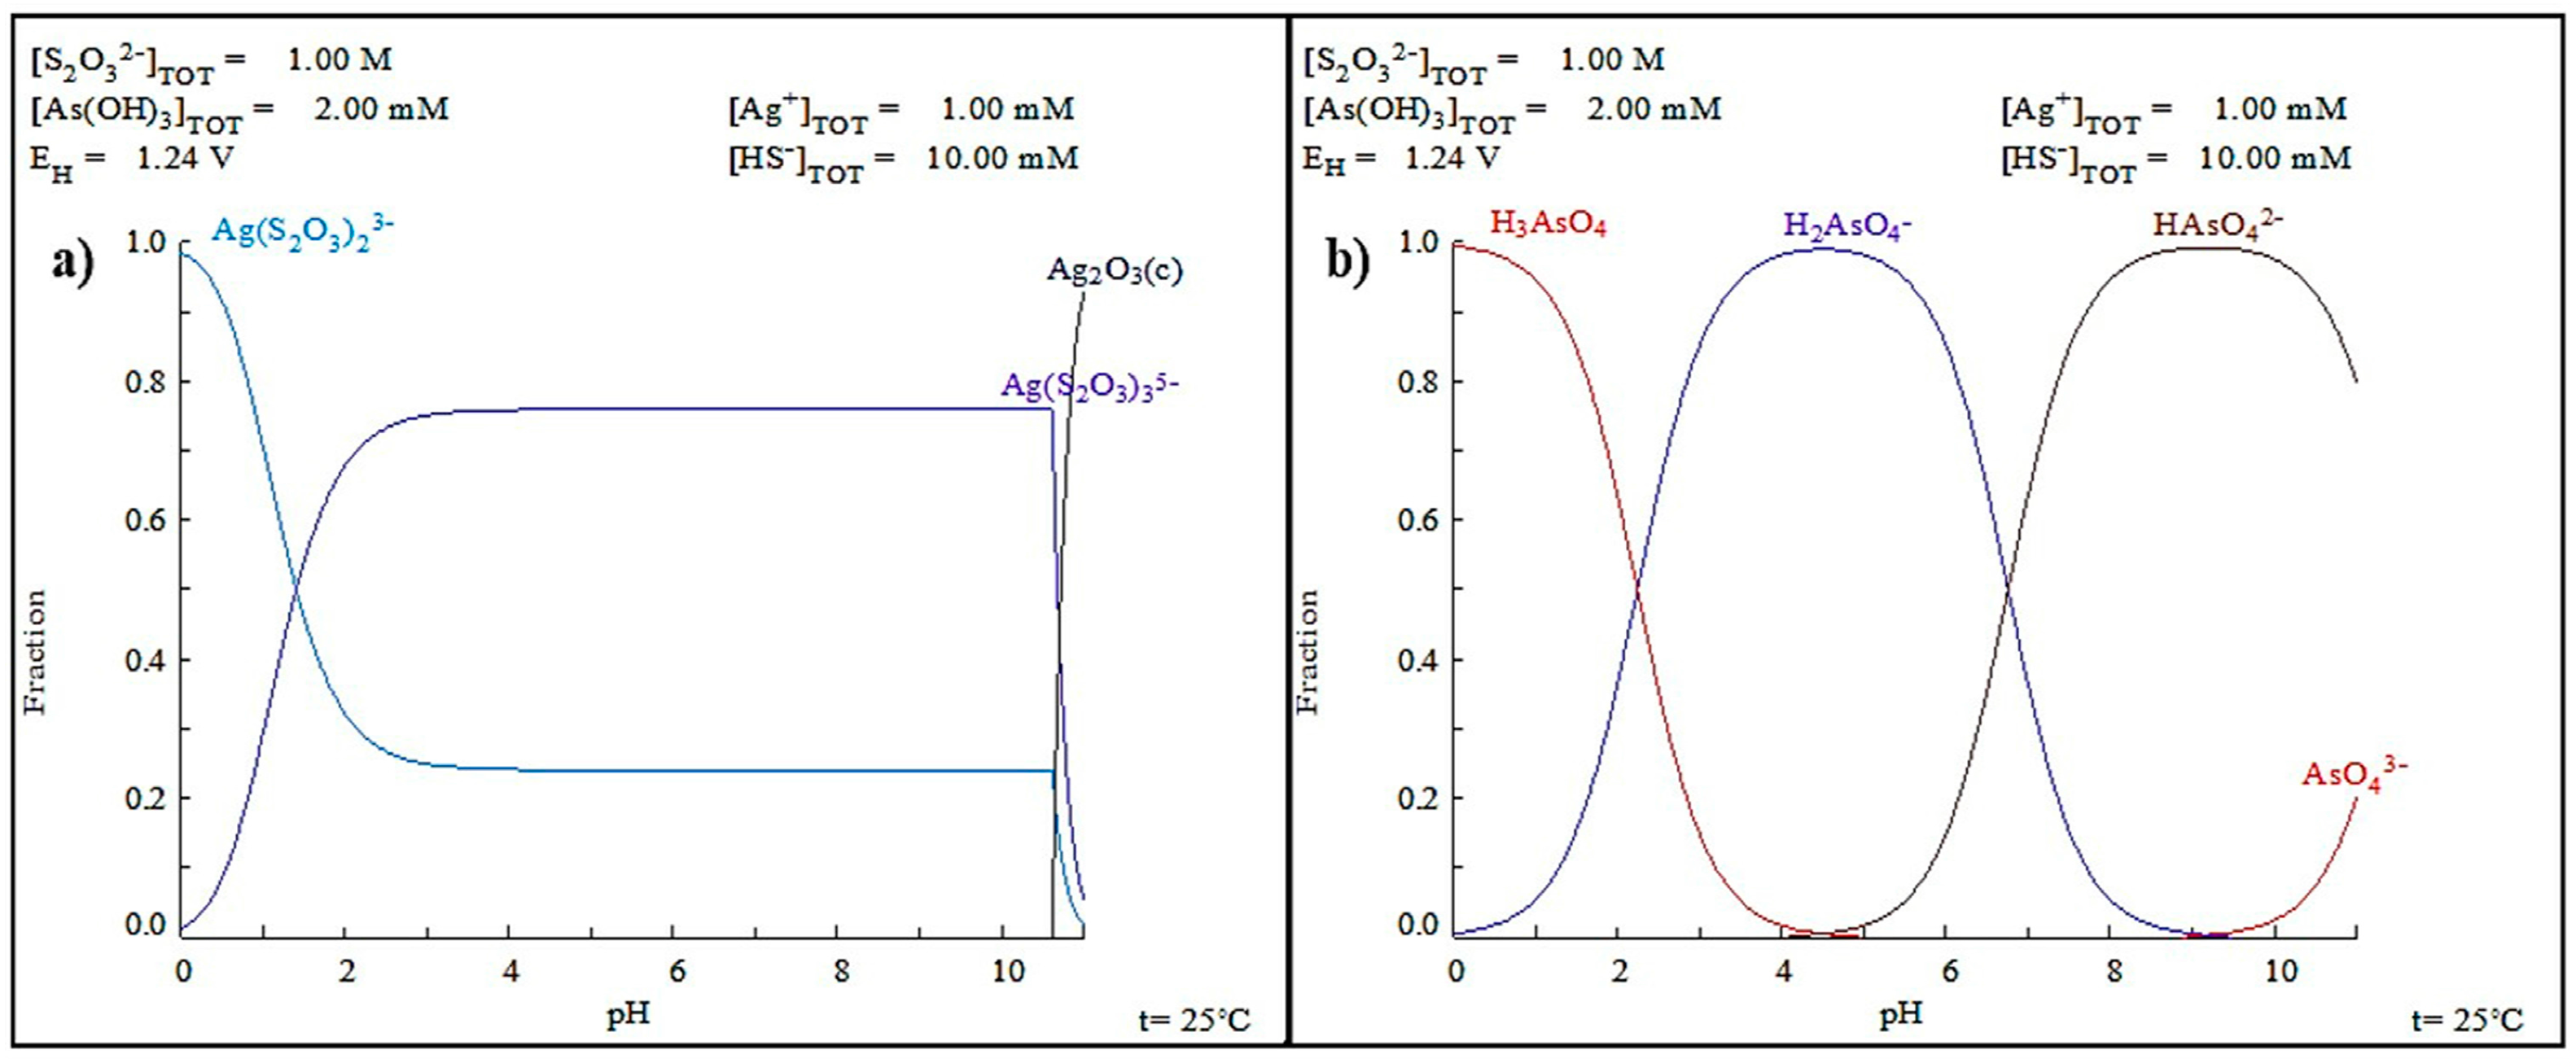
Thermodynamically speaking, silver-thiosulfate complexes Ag(S2O3)35− and Ag(S2O3)23− form under the same pH conditions and oxidizing potentials. However, the latter is more abundant. Under the conditions used for the experiments, the formation of AsO42− and of SO42− ions was identified in the Pourbaix diagrams. The presence of the latter was confirmed through vibrations obtained by FTIR.
(3)
A reduction in particle size has a significant effect on the dissolution rate of Ag, since a larger surface area is in contact with the leaching solution, which facilitates the formation of Ag complexes.
(4)
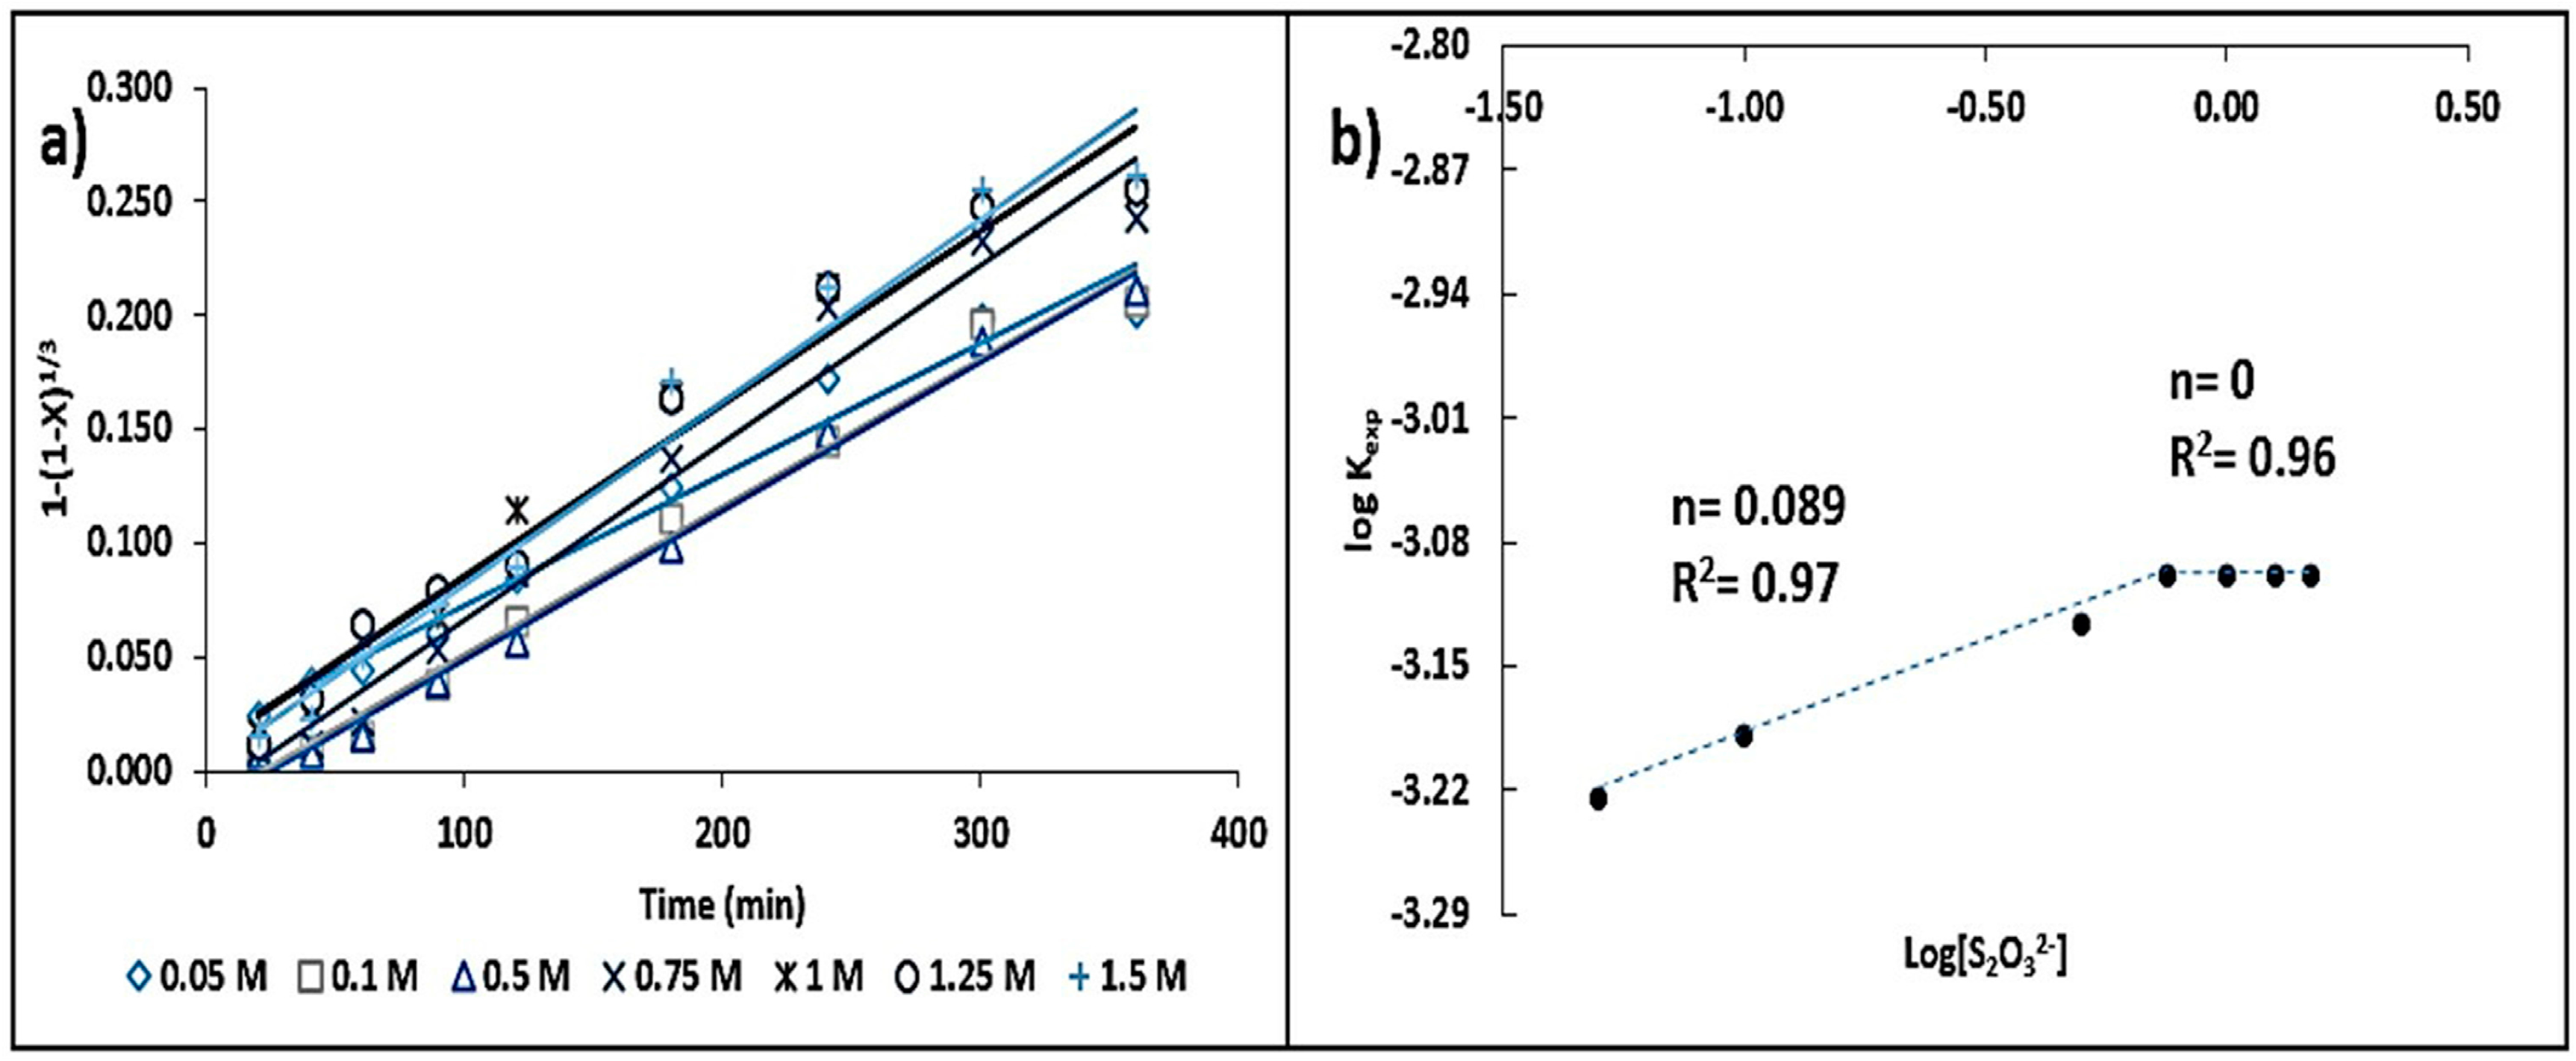
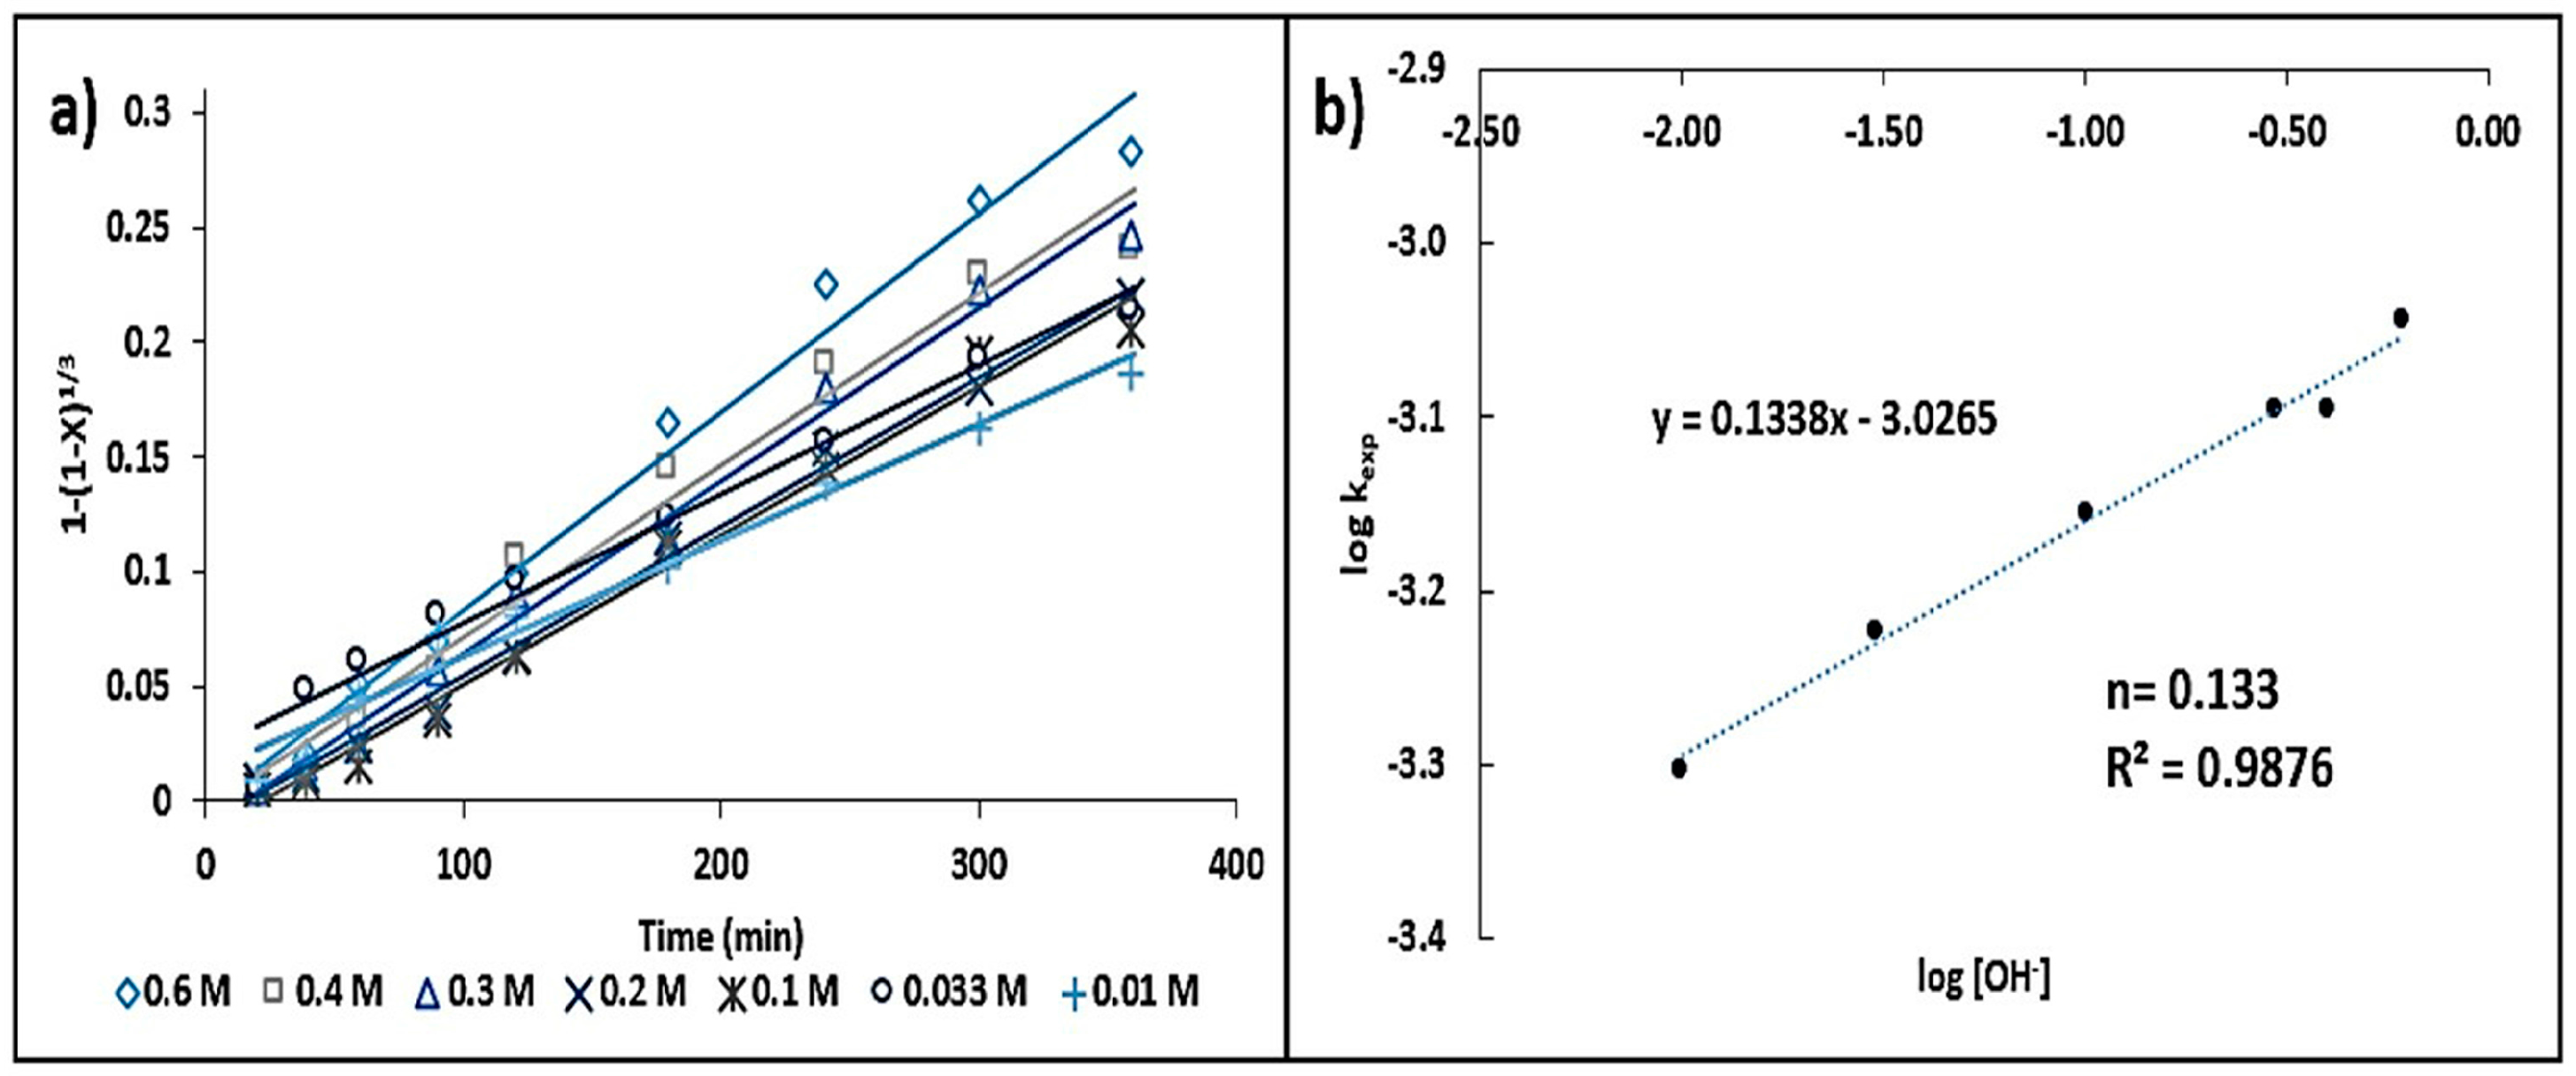
A [S2O32−] ≥ 0.75 mol·L−1 is suggested in order to secure a sufficient number of ions to allow for the formation of silver–thiosulfate complexes. The influence of the leaching agent, where there are two reaction orders (n = 0.08 and n = 0), can be attributed to the fact that dilute thiosulfate solutions (<0.01 mol·L−1) decompose more rapidly than concentrated solutions (>0.1 mol·L−1). The reaction order corresponding to [OH] (n = 0.13) has a greater influence than that of the complexing agent on the reaction rate.
(5)
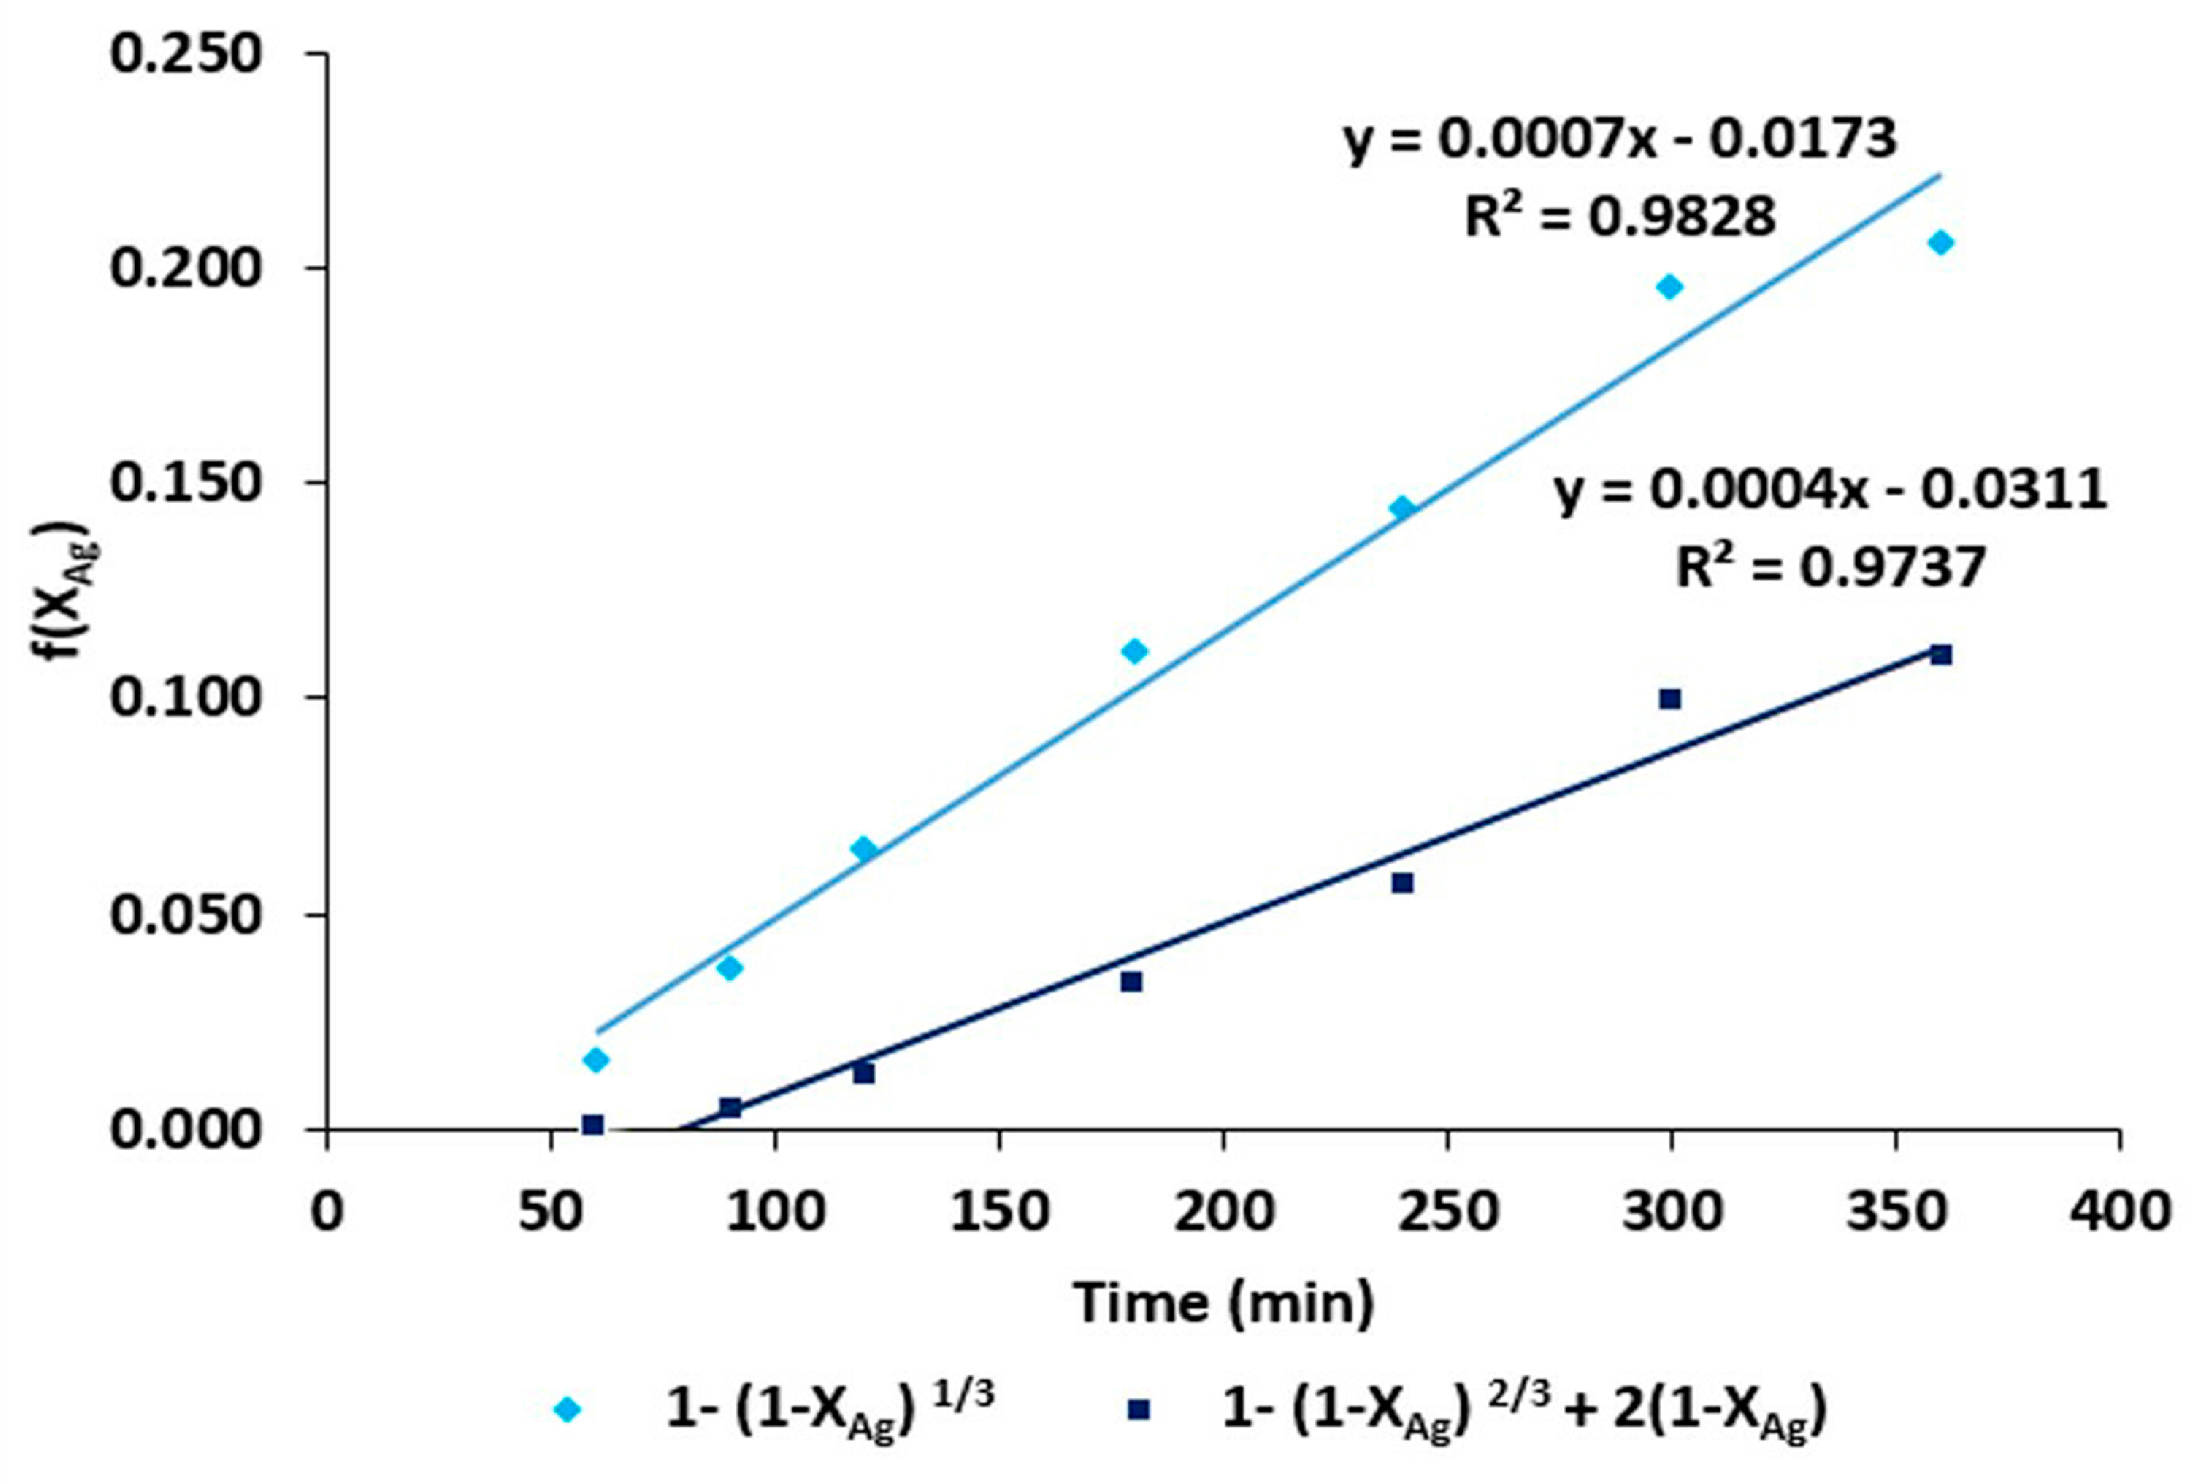
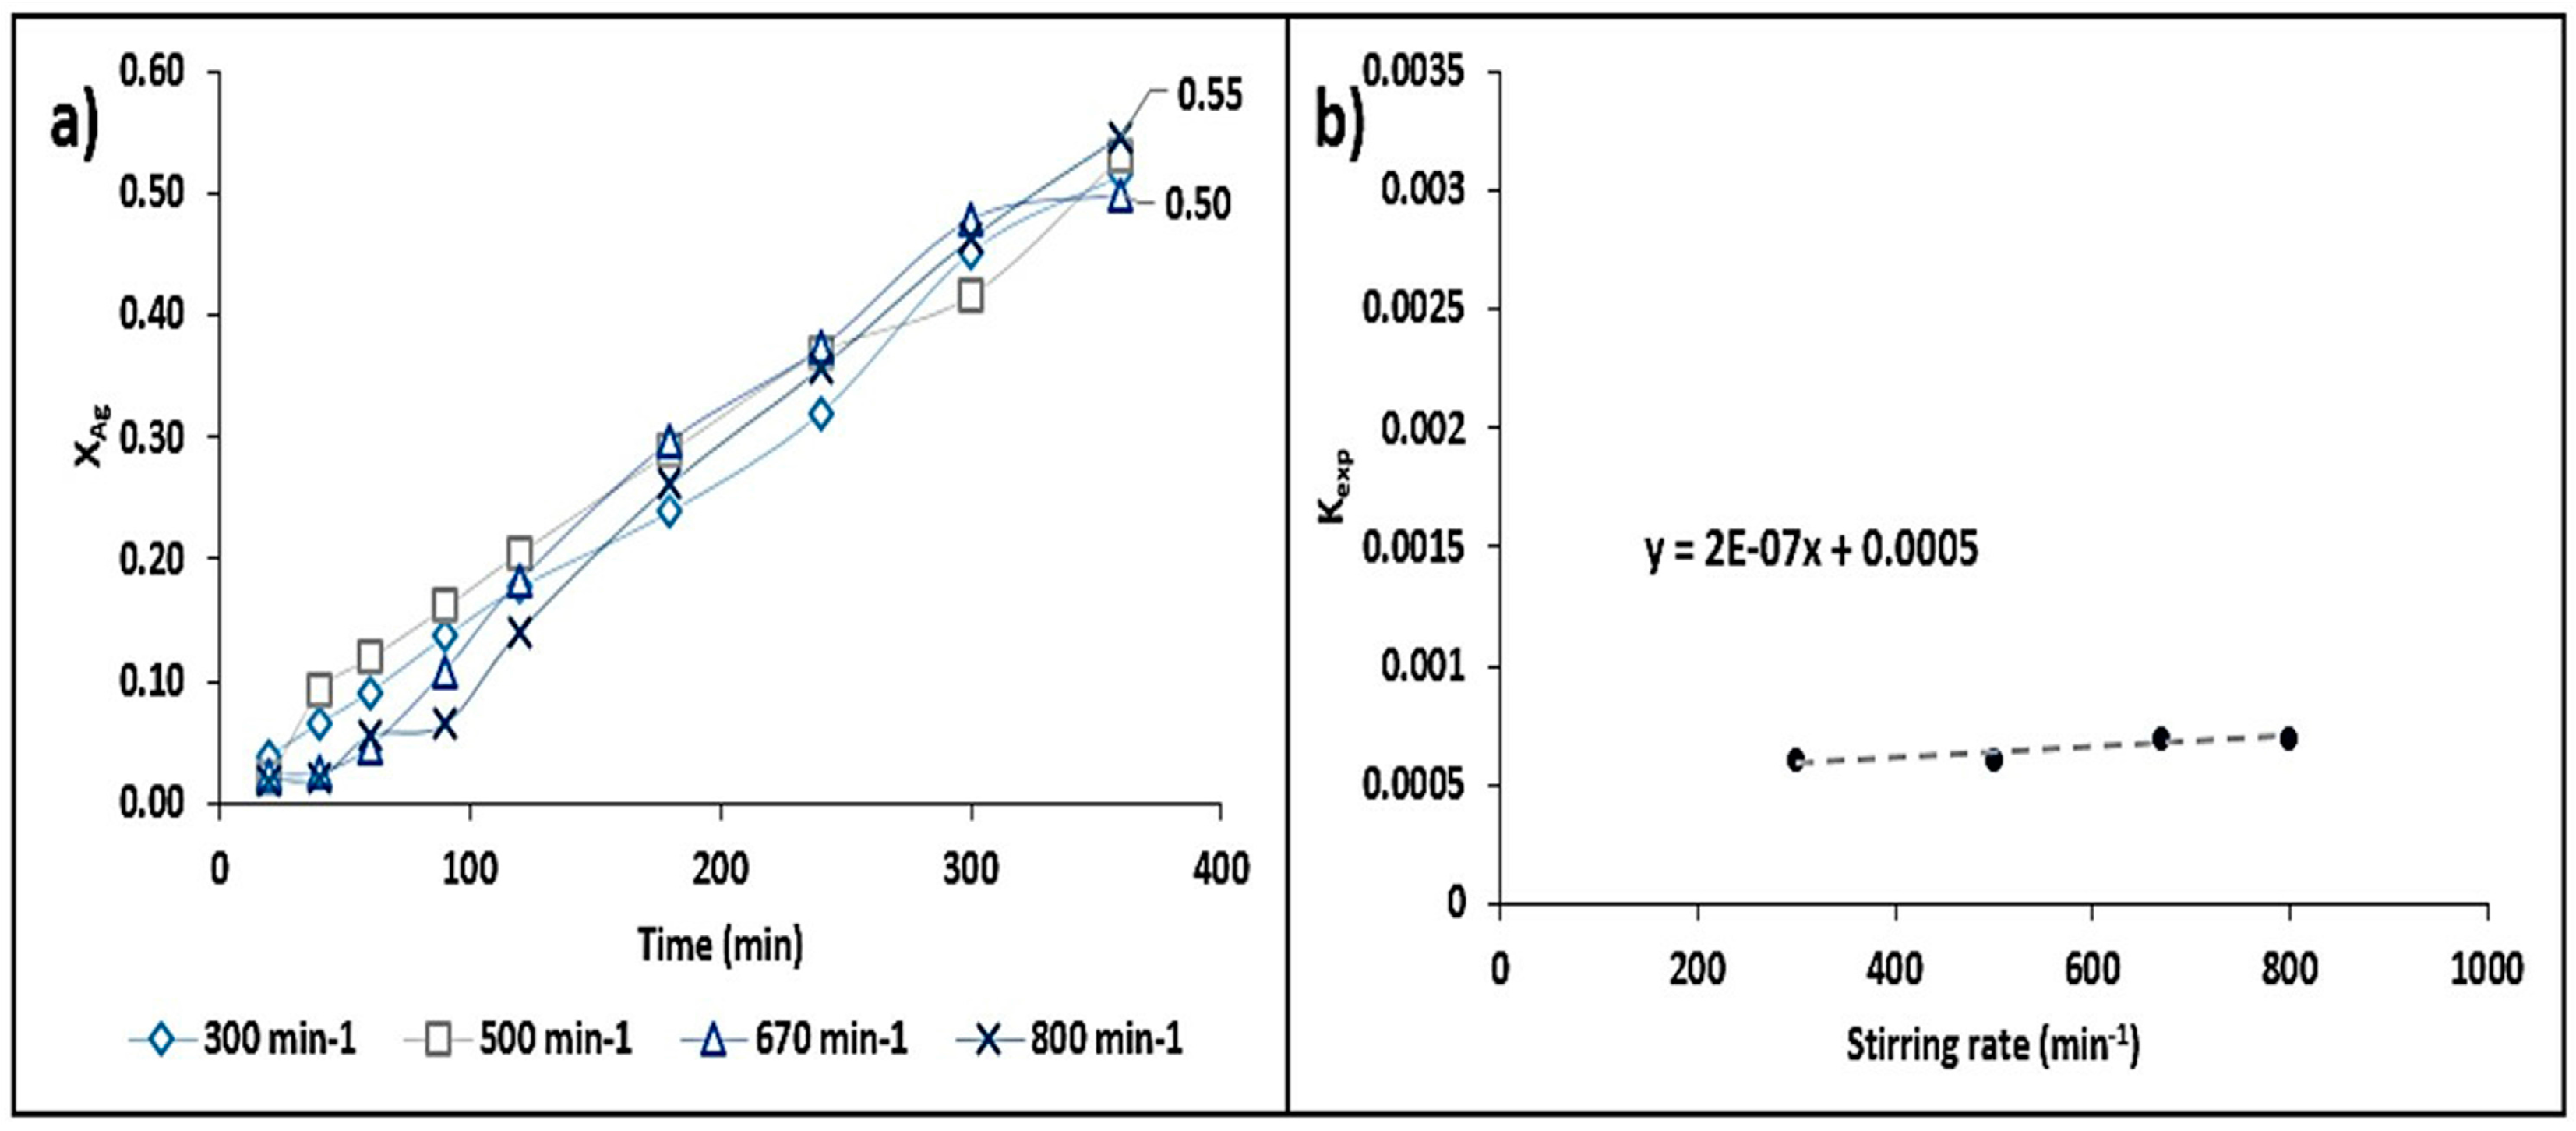
The activation energy value obtained in the system was 47.16 kJ·mol−1, which indicates that the chemical stages of the process occur in time intervals longer than the matter transport stages. This was confirmed by the adjustment conducted for the shrinking core model (kexpt = 1 − (1 − X)1/3). On the other hand, the stirring rate did not have a considerable effect on the leaching rate of Ag.
(6)
We obtained the kinetic equation of the dissolution of Ag contained in the Zn concentrate from Zimapan, Mexico, which corresponds to the chemical control mechanism. The equation is valid in the temperature range of 298–338 K and in the concentration range of 0.05–0.75 mol·L−1 S2O32− and 0.3–0.6 mol·L−1 OH.
(7)
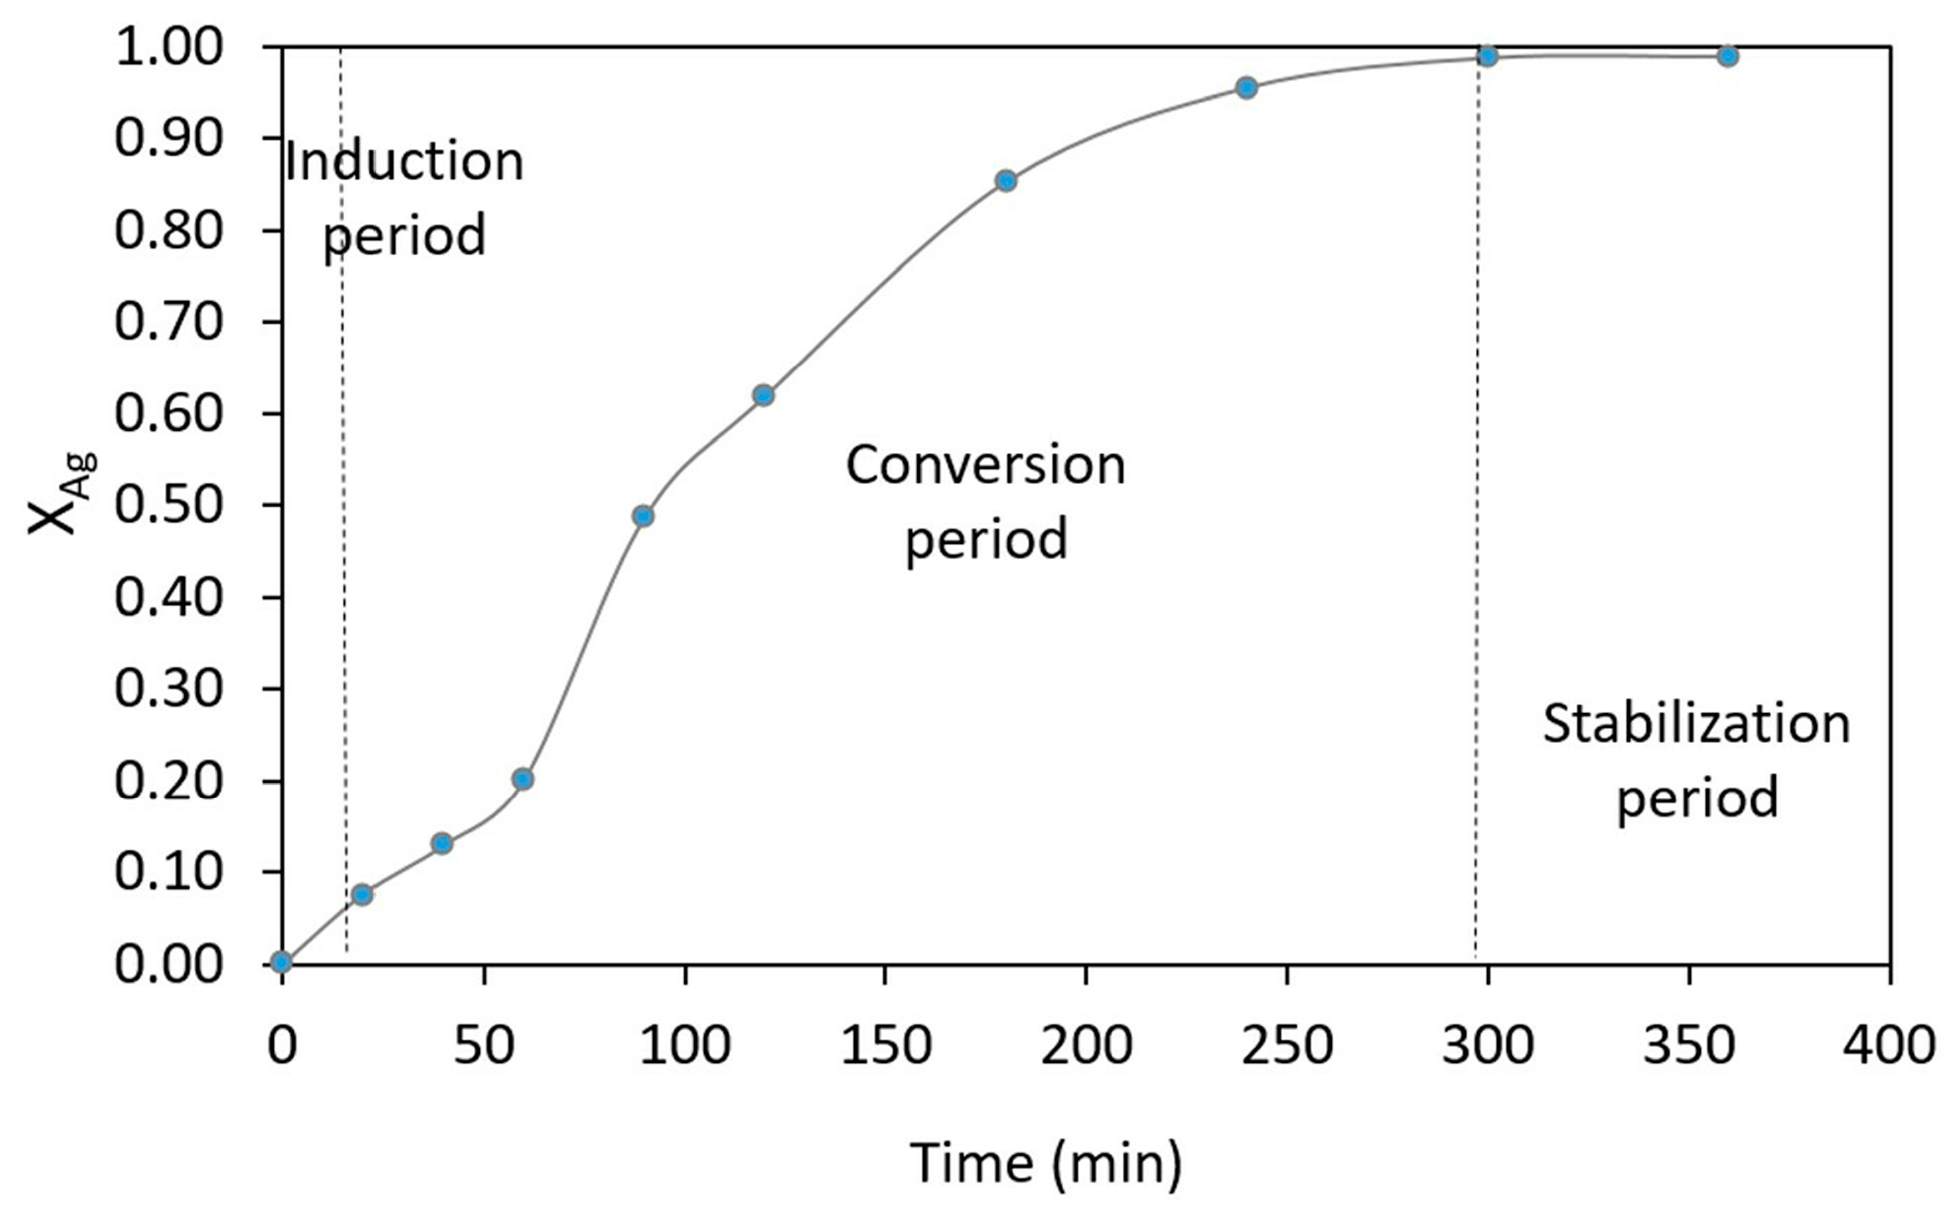
The experimental conditions at which the best recovery (98.9%) was achieved are as follows: [OH] = 0.1 mol·L−1, [S2O32−] = 0.5 mol·L−1, d = 74 µm, 338 K, pH = 9.0, RPM = 670 min−1, PO2 = 1 atm, and tr = 360 min.

Author Contributions

Aislinn M. Teja Ruiz designed and performed the experiments; Julio C. Juárez Tapia conducted the discussion of results and wrote the paper; Ivan A. Reyes Dominguez contributed to discussion of results and wrote the paper; Martín Reyes Pérez performed the characterization by FTIR and SEM-EDS; Leticia E. Hernández Cruz realized the thermodynamic simulation of Ag dissolution; Francisco Patiño Cardona performed the chemical analysis; Mizraim U. Flores Guerrero realized the indexing of spectrum obtained by DRX.

Conflicts of Interest

The authors declare no conflict of interest.

References

  1. López-Méndez, T.A.; Rivas-Ríos, V.C. Anuario Estadístico de la Minería Mexicana, 2014. Servicio Geológico Mexicano (SGM), 2015. Available online: www.sgm.gob.mx/productos/pdf/Anuario_2015_Edicion_2016.pdf (accessed on 24 June 2016).
  2. González-Partida, E.; Carrillo-Chávez, A.; Levresse, G.; Tritlla, J.; Camprub, A. Genetic implications of fluid inclusions in skarn chimney ore, Las Animas Zn-Pb-Ag- (F) deposit, Zimapán, Mexico. Ore Geol. Rev. 2003, 23, 91–96. [Google Scholar] [CrossRef]
  3. Frontino-Paulino, J.; Afonso, J.C.; Mantovano, J.L.; Vianna, C.A.; Silva-Dias da Cunha, J.W. Recovery of tungsten by liquid-liquid extraction from a wolframite concentrate after fusion with sodium hydroxide. Hydrometallurgy 2012, 127–128, 121–124. [Google Scholar] [CrossRef]
  4. Martins, J.I.; Lima, J.L.; Moreira, A.; Costa, S.C. Tungsten recovery from alkaline leach solutions as synthetic scheelite. Hydrometallurgy 2007, 85, 110–115. [Google Scholar] [CrossRef]
  5. Luna, R.M.; Lapidus, G.T. Cyanidation Kinetics of Silver Sulfide. Hidrometallurgy 2000, 56, 171–188. [Google Scholar] [CrossRef]
  6. Zhongwei, Z.; Jiangtao, L.; Shibo, W.; Honggui, L.; Maosheng, L.; Peimei, S.; Yunjiao, L. Extracting tungsten from scheelite concentrate with caustic soda by autoclaving process. Hydrometallurgy 2011, 108, 152–156. [Google Scholar] [CrossRef]
  7. Alp, I.; Celep, O.; Paktunç, D.; Thibault, Y. Influence of potassium hydroxide pretreatment on the extraction of gold and silver from a refractory ore. Hydrometallurgy 2014, 146, 64–71. [Google Scholar] [CrossRef]
  8. Nogarte, H.; Haque, N. Energy and greenhouse gas impacts of mining and mineral processing operations. J. Clean. Prod. 2010, 18, 266–274. [Google Scholar] [CrossRef]
  9. Senanayake, G. A surface adsorption/reaction mechanism for gold oxidation by copper(II) in ammoniacal thiosulfate solutions. J. Colloid Interface Sci. 2005, 286, 253–257. [Google Scholar] [CrossRef] [PubMed]
  10. Kholmogorov, A.; Kononova, O.; Danilenko, N.; Goryaeva, N.; Shatnykh, K.; Kachin, S. Recovery of silver from thiosulfate and thiocyanate leach solutions by adsorption on anion exchange resins and activated carbon. Hydrometallurgy 2007, 88, 189–195. [Google Scholar] [CrossRef]
  11. Hancock, G.F. Energy requirements for manufacture of some non-ferrous metals. Met. Technol. 1984, 11, 290–299. [Google Scholar] [CrossRef]
  12. Hernández, J.; Patino, F.; Rivera, I.; Reyes, I.A.; Flores, M.U.; Juárez, J.C.; Reyes, M. Leaching kinetics in cyanide media of Ag contained in the industrial mining-metallurgical wastes in the state of Hidalgo, Mexico. Int. J. Min. Sci. Technol. 2014, 24, 689–694. [Google Scholar] [CrossRef]
  13. Deschenes, G.; Rousseau, M.; Tardif, J. Effect of the composition of some sulphide minerals on cyanidation and use of lead nitrate and oxygen to alleviate their impact. Hidrometallurgy 1998, 11, 123–142. [Google Scholar] [CrossRef]
  14. Xie, F.; Dreisinger, D.B. Use of ferricyanide for gold and silver cyanidation. Trans. Nonferr. Met. Soc. China 2009, 19, 176–189. [Google Scholar] [CrossRef]
  15. Briones, R.; Lapidus, G.T. The leaching of silver sulfide with the thiosulfate-ammonia-cupric ion system. Hydrometallurgy 1998, 50, 243–260. [Google Scholar] [CrossRef]
  16. Alvarado-Macías, G.; Fuentes-Aceituno, J.C.; Nava-Alonso, F. Study of silver leaching with the thiosulfate-nitrite-copper alternative system: Effect of thiosulfate concentration and leaching temperature. Miner. Eng. 2016, 86, 140–148. [Google Scholar] [CrossRef]
  17. Alonso, A.R.; Lapidus, G.T.; González, I. Selective silver electroseparation from ammoniacal thiosulfate leaching solutions using a rotating cylinder electrode reactor (RCE). Hydrometallurgy 2008, 92, 115–123. [Google Scholar] [CrossRef]
  18. Alonso, A.R.; Lapidus, G.T.; González, I. A strategy to determine the potential interval for selective silver electrodeposition from ammoniacal thiosulfate solutions. Hydrometallurgy 2007, 85, 144–153. [Google Scholar] [CrossRef]
  19. Rivera, I.; Patiño, F.; Roca, A.; Cruells, M. Kinetics of metallic silver leaching in the O2-thiosulfate system. Hydrometallurgy 2015, 156, 63–70. [Google Scholar] [CrossRef]
  20. Lapidus, G.T. Mathematical modelling of metal leaching in nonporous minerals. Chem. Eng. Sci. 1992, 47, 1933–1941. [Google Scholar] [CrossRef]
  21. Grosse, A.C.; Dicinoski, G.W.; Shaw, M.J.; Haddad, P.R. Leaching and recovery of gold using ammoniacal thiosulfate leach liquors (a review). Hydrometallurgy 2003, 69, 1–21. [Google Scholar] [CrossRef]
  22. Jeffrey, M.I. Kinetic aspects of gold and silver leaching in ammonia-thiosulfate solutions. Hydrometallurgy 2001, 60, 7–16. [Google Scholar] [CrossRef]
  23. Muir, D.M.; Aylmore, M.G. Thiosulfate as an alternative to cyanide for gold processing-Issues and impediments. Miner. Process. Extr. Metall. 2005, 15, 113–116. [Google Scholar] [CrossRef]
  24. Alonso-Gómez, A.R.; Lapidus, G.T. Inhibition of lead solubilization during the leaching of gold and silver in ammoniacal thiosulfate solutions (effect of phosphate addition). Hydrometallurgy 2009, 99, 89–96. [Google Scholar] [CrossRef]
  25. Feng, D.; Van Deventer, J.S.J. Ammoniacal thiosulphate leaching of gold in the presence of pyrite. Hydrometallurgy 2006, 82, 126–132. [Google Scholar] [CrossRef]
  26. Solís-Marcial, O.J.; Lapidus, G.T. Study of the dissolution of chalcopyrite in sulfuric acid solutions containing alcohols and organic acid. Electrochim. Acta 2014, 140, 434–437. [Google Scholar] [CrossRef]
  27. Aguirre, C.L.; Toro, N.; Carvajal, N.; Watling, H.; Aguirre, C. Leaching of chalcopyrite (CuFeS2) with an imidazolium-based ionic liquid in the presence of chloride. Miner. Eng. 2016, 99, 60–66. [Google Scholar] [CrossRef]
  28. Mohammadi, E.; Pourabdoli, M.; Ghobeiti-Hasab, M.; Heidarpour, A. Ammoniacal thiosulfate leaching of refractory oxide gold ore. Int. J. Miner. Process. 2017, 164, 6–10. [Google Scholar] [CrossRef]
  29. Heath, F.A.; Jeffrey, M.I.; Zhang, H.G.; Rumball, J.A. Anaerobic thiosulfate leaching: Development of in situ gold leaching systems. Miner. Eng. 2008, 21, 424–433. [Google Scholar] [CrossRef]
  30. Zhang, S. Oxidation of Refractory Gold Concentrates and Simultaneous Dissolution of Gold in Aerated Alkaline Solutions. Ph.D. Thesis, Murdoch University Western Australia, Murdoch, Australia, March 2004. Available online: http://researchrepository.murdoch.edu.au/id/eprint/422/1/01Front.pdf (accessed on 9 October 2015).
  31. Aylmore, M.G.; Muir, D.M. Thiosulfate leaching of gold. A review. Miner. Eng. 2001, 14, 135–174. [Google Scholar] [CrossRef]
  32. Zipperian, D.; Raghavan, S.; Wilson, J.P. Gold and silver extraction by amoniacal thiosulfate leaching from a rhyolite ore. Hydrometallurgy 1988, 19, 361–375. [Google Scholar] [CrossRef]
  33. Villaseñor, C.G.; Peterson, E.; Avedaño, S.; Gómez-Caballero, A.; Sousa, J.; Reyes-Salas, M. Minerales del grupo de la tetrahedrita en las minas lomo de toro y las ánimas, Zimapán Hidalgo. Actas INAGEQ 1996, 2, 124–129. Available online: http://biblat.unam.mx/es/revista/actas-inageq/articulo/minerales-del-grupo-de-la-tetrahedrita-en-las-minas-lomo-del-toro-y-las-animas-zimapan-hidalgo (accessed on 14 September 2016).
  34. Rodríguez-Rodríguez, C. Estudio de la Oxidación de Sulfuros Con Ozono Para la Recuperación de Metales Preciosos Contenidos en Minerales Refractarios. Ph.D. Thesis, Centro de Investigación y Estudios Avanzados del Instituto Politécnico Nacional, Coahuila, México, 2014; pp. 21–26. [Google Scholar]
  35. Parga, J.R.; Carrillo, F.R. Avances en los métodos de recuperación de oro y plata de minerales refractarios. Rev. Met. Madr. 1996, 32, 4. Available online: http://revistademetalurgia.revistas.csic.es/index.php/revistademetalurgia/article/viewFile/907/920 (accessed on 12 July 2016). [CrossRef]
  36. Bundschuh, J.; Bhattacharya, P.; Nath, B.; Naidu, R.; Ng, J.; Guilherme, L.R.G.; Ma, L.Q.; Kim, K.W.; Jean, J.S. Arsenic ecotoxicology: The interface between geosphere, hydrosphere andbiosphere. J. Hazard. Mater. 2013, 262, 883–886. [Google Scholar] [CrossRef] [PubMed]
  37. Levenspiel, O. Ingeniería de las Reacciones Químicas, 2nd ed.; Reverté: Barcelona, España, 2002; pp. 397–441. [Google Scholar]
  38. Ongley, L.K.; Sherman, L.; Armienta, A.; Concilio, A.; Salinas, C.F. Arsenic in the soils of Zimapán, México. Environ. Pollut. 2007, 145, 793–799. [Google Scholar] [CrossRef] [PubMed]
  39. Moreno-Tovar, R.; Téllez-Hernández, J.; Monroy-Fernández, M.G. Influence of minerals from the tailings in the bioaccessibility of arsenic, lead, zinc and cadmium, in the mining district Zimapán, México. Rev. Int. Contam. Ambient. 2012, 28, 3, ISSN 0188-4999. [Google Scholar]
  40. Martínez-Frías, J.; Marín-Ramos, J.D. Sulfuros y Sulfonales de Metales Nobles, 1st ed.; Textos Universitarios: Madrid, España, 1995; pp. 44–48. [Google Scholar]
  41. Kametani, H.; Aoki, A. Potential-pH diagrams of the SO2-H2O and S2O3-H2O Systems at 90 degrees. Trans. Natl. Inst. Met. 1976, 18, 20–30. [Google Scholar]
  42. Osseo-Asare, K. A numerical method for computing hydrometallurgical activity-activity diagrams. Hydrometallurgy 1979, 4, 217–232. [Google Scholar] [CrossRef]
  43. Dhawale, S.W. Thiosulfate. J. Chem. Educ. 1993, 70, 12–14, ISSN 0021-9584. [Google Scholar] [CrossRef]
  44. Aylmore, M.G. Treatment of a refractory gold-copper sulfide concentrate by copper ammoniacal thiosulfate leaching. Miner. Eng. 2001, 14, 615–637. [Google Scholar] [CrossRef]
  45. Qian, G.; Jiexue, H.; Cao, C. Kinetics of gold leaching from sulfide gold concentrates with thiosulfate solution. Trans. Nonferr. Met. Soc. China 1993, 3, 30–36. Available online: http://www.ysxbcn.com/down/upfile/soft/2010626/1993-4-5.pdf (accessed on 3 April 2016).
  46. Abbruzzese, C.; Fornyari, P.; Massidda, R.; Veglio, F.; Ubaldini, S. Thiosulfate leaching for gold hydrometallurgy. Hydrometallurgy 1995, 39, 265–276. [Google Scholar] [CrossRef]
  47. Ballester, A.; Verdeja, L.; Sancho, J. Metalurgia Extractiva Vol. II Procesos de Obtención, 2nd ed.; Síntesis: Madrid, España, 2013; pp. 42–49. [Google Scholar]
  48. Aazami, M.; Lapidus, G.T.; Azadeh, A. The effect of solution parameters on the thiosulfate leaching of Zarshouran refractory gold ore. Int. J. Miner. Process. 2014, 131, 43–50. [Google Scholar] [CrossRef]
  49. Habashi, F. Texbook of Hydrometallurgy, 2nd ed.; Metallurgie Extractive: Québec City, QC, Canada, 1999; pp. 287–306. [Google Scholar]
  50. Teja-Ruiz, A.M.; Juárez-Tapia, J.C.; Hernández-Cruz, L.E.; Reyes-Pérez, M.; Patiño-Cardona, F.; Reyes-Dominguez, I.A.; Flores-Guerrero, M.U.; Palacios-Beas, E.G. Influence of Temperature on the Formation of Ag Complexed in a S2O32-O2 System. Minerals 2017, 7, 16. [Google Scholar] [CrossRef]
Figure 1. X-ray diffractogram of the powder of pull size concentrate of Zn.
Metals 07 00411 g001
Figure 2. (a) Backscattered electron micrograph performed on a particle less dense than the Zn concentrate matrix. (b) Energy Dispersive X-ray Spectrum performed on a particle less dense than the Zn concentrate matrix.
Metals 07 00411 g002
Figure 3. (a) Eh-pH diagram for the Ag-S2O32−-H2O system at 25 °C; (b) Eh-pH diagram for the As-S2O32−-H2O system at 25 °C; (c) Eh-pH diagram for the S-S2O32−-H2O system at 25 °C.
Metals 07 00411 g003
Figure 4. Species distribution diagram (a) Ag fraction in relation to pH range. (b) As fraction in relation to pH range. [S2O32−] = 1 mol·L−1, [As(OH)3] = 2 mmol·L−1, [Ag+] = 1 mmol·L−1, [HS] = 10 mmol·L−1, pH = 0 to 14, Eh = −2 to 2 V.
Metals 07 00411 g004
Figure 5. Dissolution curve of Ag in the S2O32−-O2-NaOH system. V = 0.5 L, Mineral = 40 g·L −1, PO2 = 1 atm, pH = 9, tr = 360 min, d =74 μm, [S2O32−] = 0.5 mol·L−1, [OH] = 0.1 mol·L−1, T = 338 K, RPM = 670 min−1.
Metals 07 00411 g005
Figure 6. Comparison of the chemical control model vs. the model by transport of matter in silver leaching using the Ag-S2O32−-O2-NaOH system.
Metals 07 00411 g006
Figure 7. (a) Evaluation of the chemical control model on the Ag conversion values as a function of time in order to study the particle size effect. V = 0.5 L, Mineral = 40 g·L −1, PO2 = 1 atm, pH = 9, tr = 360 min, [S2O32−] = 0.5 mol·L−1, [OH] = 0.1 mol·L−1, 298 K, RPM = 670 min−1. (b) Dependence of kexp as a function of the inverse of the particle diameter.
Metals 07 00411 g007
Figure 8. (a) Application of the chemical control model on the Ag conversion values as a function of time in order to study the [S2O32−] concentration effect. V = 0.5 L, Mineral = 40 g·L −1, PO2 = 1 atm, pH = 9.0, tr = 360 min, d = 74 μm, [OH] = 0.1 mol·L−1, T = 298 K, RPM = 670 min−1. (b) Dependence of log kexp as a function of log [S2O32−].
Metals 07 00411 g008
Figure 9. (a) Evaluation of the chemical control model in the Ag conversion values as function of time in order to the [OH] concentration effect. V = 0.5 L, Mineral = 40 g·L −1, PO2 = 1 atm, pH = 9.0, tr = 360 min, d = 74 μm, [S2O32−] = 0.5 mol·L−1, T = 298 K, RPM = 670 min−1. (b) Dependence of log kexp as a function of log [OH].
Metals 07 00411 g009
Figure 10. (a) Evaluation of the chemical control model on the Ag conversion values as a function of time in order to study the temperature effect. V = 0.5 L, Mineral = 40 g·L −1, PO2 = 1 atm, pH = 9, tr = 360 min, d = 74 μm, [S2O32−] = 0.5 mol·L−1, [OH] = 0.1 mol·L−1, RPM = 670 min−1. (b) Dependence of kexp as a function of temperature. Activation energy, Ea = 52.8 kJ·mol−1.
Metals 07 00411 g010
Figure 11. (a) Graphical representation of the stirring rate evaluation, RPM = 300, 500, 670 and 800 min−1, V = 0.5 L, Mineral = 40 g·L−1, PO2 = 1 atm, pH = 9.0, tr = 360 min, d = 74 μm, [S2O32−] = 0.5 mol·L−1, [OH] = 0.1 mol·L−1, 298 K. (b) Dependence of kexp in function of the stirring rate.
Metals 07 00411 g011
Figure 12. Graphical representation of the effect of the solid-liquid ratio = 1:50, 1:25, 1:15, 1:10 and 1:05. V = 0.5 L, Mineral = 40 g·L−1, PO2 = 1 atm, pH = 9, tr = 360 min, d = 74 μm, [S2O32−] = 0.5 mol·L−1, [OH] = 0.1 mol·L−1, 298 K, RPM = 670 min−1.
Metals 07 00411 g012
Figure 13. Spectrums of the complexed silver species obtained at several times by Fourier Transform Infrared Spectroscopy. The main vibration bands have been also indicated for purposes of identification.
Metals 07 00411 g013
Table 1. Experimental conditions for the evaluated effects in the Ag leaching in the S2O32−-O2-NaOH system. All the experiments were carried out with: V = 0.5 L, PO2 = 1 atm and tr = 360 min.
ParameterExperimental Conditions of Ag Leaching
Particle Size Effect[S2O32−] Effect[OH] EffectTemperature EffectStirring Rate EffectEffect of Solid/Liquid Ratio
Temperature (K)298298298298, 303, 313, 323, 328, 333 and 338298298
Particle diameter (μm)105, 74, 53, 44, 37 and <377474747474
Stirring rate (min−1)670670670670300, 500, 670 and 800670
[S2O32−] (mol·L−1)0.51.5, 1.25, 1, 0.75, 0.5, 0.1 and 0.050.50.50.50.5
[OH] (mol·L−1)0.10.10.6, 0.4, 0.3, 0.2, 0.1, 0.033 and 0.010.10.10.1
Solid/liquid ratio1:251:251:251:251:251:50, 1:25, 1:15, 1:10 and 1:5.
Table 2. Results of the Inductively Coupled Plasma Spectroscopy on the Zn concentrate sample.
ElementAsCdCoCuFeMgPbAgZnSbSnS
Weight (%)0.110.330.012.945.740.030.210.0346.820.070.0236.44

