Temperature Dependences of the Electrical Resistivity on the Heusler Alloy System Ni2MnGa1−xFex

Abstract
:1. Introduction
2. Experimental Procedures
3. Results and Discussion
4. Conclusions
Acknowledgments
Author Contributions
Conflicts of Interest
References
- Brown, P.J.; Kanomata, T.; Matsumoto, M.; Neumann, K.-U.; Ziebeck, K.R.A. Magnetism and Structure in Functional Materials; Planes, A., Mañosa, L., Saxena, A., Eds.; Springer: Berlin/Heiderberg, Germany, 2005; pp. 113–140. [Google Scholar]
- Kainuma, R.; Imano, Y.; Ito, W.; Sutou, Y.; Morito, H.; Okamoto, S.; Kitakami, O.; Oikawa, K.; Fujita, A.; Kanomata, T.; et al. Magnetic-field-induced shape recovery by reverse phase transformation. Nature 2006, 439, 957–960. [Google Scholar] [CrossRef] [PubMed]
- Planes, A.; Mañosa, L.; Acet, M. Magnetocaloric effect and its relation to shape-memory properties in ferromagnetic Heusler alloys. J. Phys. Condens. Matter 2009, 21, 233201. [Google Scholar] [CrossRef] [PubMed]
- Chernenko, V.A. (Ed.) Advances in Magnetic Shape Memory Materials; Trans. Tech. Publications Ltd.: Zurich, Switzerland, 2011. [Google Scholar]
- Acet, M.; Mañosa, L.I.; Planes, A. Magnetic-Field-Induced Effects in Martensitic Heusler-Based Magnetic Shape Memory Alloys. In Handbook of Magnetic Materials; Elsevier Science: Amsterdam, The Netherlands, 2011. [Google Scholar]
- Yu, G.H.; Xu, Y.L.; Liu, Z.H.; Qiu, H.M.; Zhu, Z.Y.; Huang, X.P.; Pan, L.Q. Recent progress in Heusler-type magnetic shape memory alloys. Rare Met. 2015, 34, 527–539. [Google Scholar] [CrossRef]
- Brown, P.J.; Crangle, J.; Kanomata, T.; Matsumoto, M.; Neumann, K.U.; Ouladdiaf, B.; Ziebeck, K.R.A. The crystal structure and phase transitions of the magnetic shape memory compound Ni2MnGa. J. Phys. Condens. Matter 2002, 14, 10159–10171. [Google Scholar] [CrossRef]
- Singh, S.; Bednarcik, J.; Barman, S.R.; Felser, C.; Pandey, D. Premartensite to martensite transition and its implications for the origin of modulation in Ni2MnGa ferromagnetic shape-memory alloy. Phys. Rev. B 2015, 92, 054112. [Google Scholar] [CrossRef]
- Singh, S.; Petricek, V.; Rajput, P.; Hill, A.H.; Suard, E.; Barman, S.R.; Pandey, D. High-resolution synchrotron X-ray powder diffraction study of the incommensurate modulation in the martensite phase of Ni2MnGa: Evidence for nearly 7M modulation and phason broadening. Phys. Rev. B 2014, 90, 014109. [Google Scholar] [CrossRef]
- Kataoka, M.; Endo, K.; Kudo, N.; Kanomata, T.; Nishihara, H.; Shishido, T.; Umetsu, R.Y.; Nagasako, M.; Kainuma, R. Martensitic transition, ferromagnetic transition, and their interplay in the shape memory alloys Ni2Mn1−xCuxGa. Phys. Rev. B 2010, 82, 214423. [Google Scholar] [CrossRef]
- Vasil’ev, A.N.; Bozhko, A.D.; Khovailo, V.V.; Dikshtein, I.E.; Shavrov, V.G.; Buchelnikov, V.D.; Matsumoto, M.; Suzuki, S.; Takagi, T.; Tani, J. Structural and magnetic phase transitions in shape-memory alloys Ni2+xMn1−xGa. Phys. Rev. B 1999, 59, 1113–1120. [Google Scholar] [CrossRef]
- Khovaylo, V.V.; Buchelnikov, V.D.; Kainuma, R.; Koledov, V.V.; Ohtsuka, M.; Shavrov, V.G.; Takagi, T.; Taskaev, S.V.; Vasiliev, A.N. Phase transitions in Ni2+xMn1−xGa with a high Ni excess. Phys. Rev. B 2005, 72, 224408. [Google Scholar] [CrossRef]
- Soto, D.; Hernández, V.A.; Flores-Zúñiga, H.; Moya, X.; Mañosa, L.; Planes, A.; Aksoy, S.; Acet, M.; Krenke, T. Phase diagram of Fe-doped Ni-Mn-Ga ferromagnetic shape-memory alloys. Phys. Rev. B 2008, 77, 184103. [Google Scholar] [CrossRef]
- Soto-Parra, D.E.; Moya, X.; Mañosa, L.; Planes, A.; Flores-Zúñiga, H.; Alvarado-Hernández, F.; Ochoa-Gamboa, R.A.; Matutes-Aquino, J.A.; Ríos-Jara, D. Fe and Co selective substitution in Ni2MnGa: Effect of magnetism on relative phase stability. Philos. Mag. 2010, 90, 2771–2792. [Google Scholar] [CrossRef]
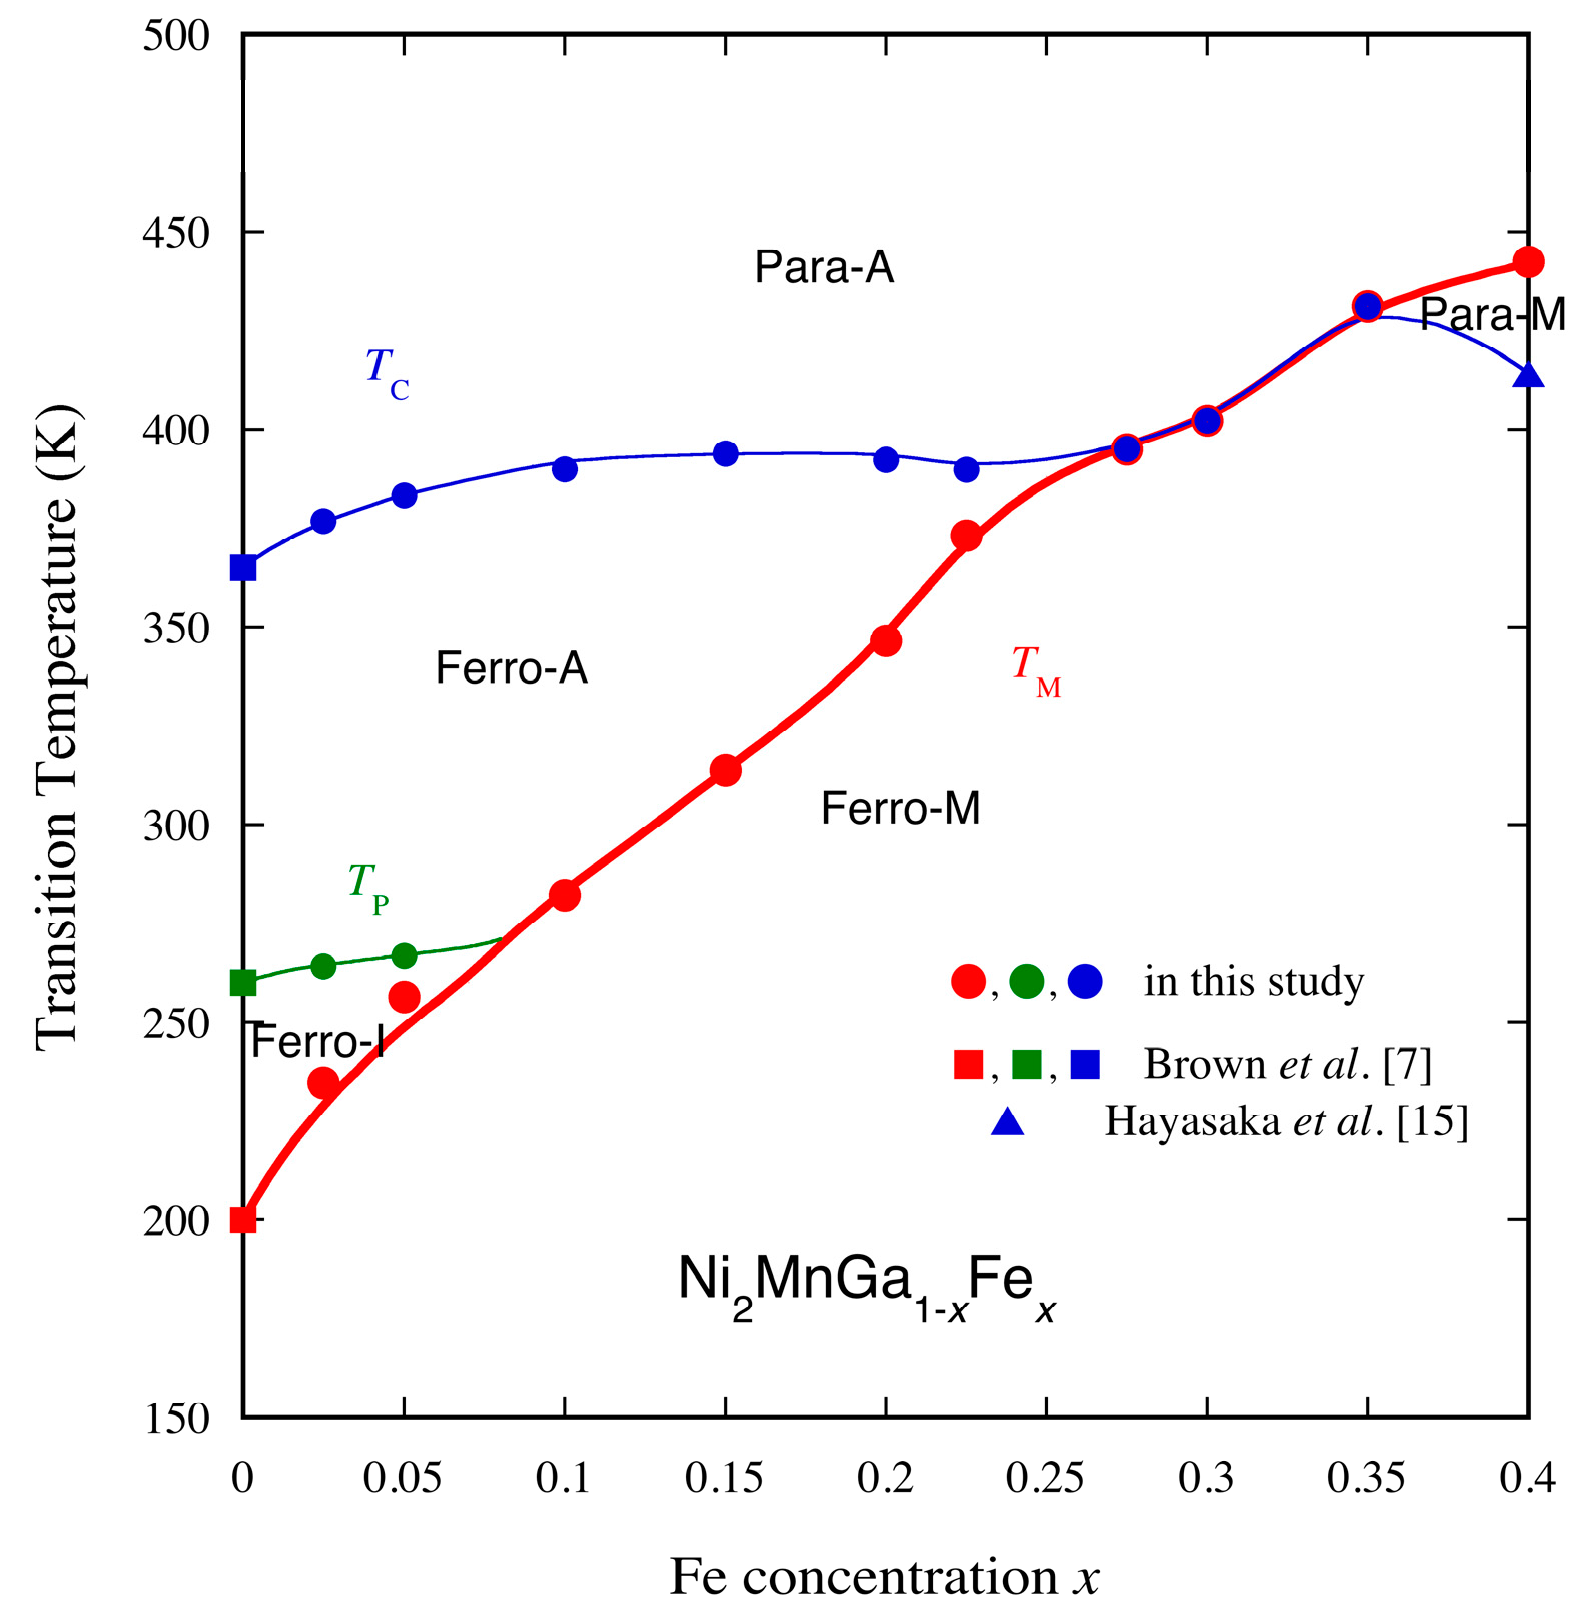
- Hayasaka, Y.; Aoto, S.; Date, H.; Kanomata, T.; Xu, X.; Umetsu, R.Y.; Nagasako, M.; Omori, T.; Kainuma, R.; Sakon, T.; et al. Magnetic phase diagram of ferromagnetic shape memory alloys Ni2MnGa1−xFex. J. Alloys Compd. 2014, 591, 280–285. [Google Scholar] [CrossRef]
- Endo, K.; Kanomata, T.; Kimura, A.; Kataoka, M.; Nishihara, H.; Umetsu, R.Y.; Obara, K.; Shishido, T.; Nagasako, M.; Kainuma, R.; et al. Magnetic phase diagram of the ferromagnetic shape memory alloys Ni2MnGa1−xCux. Mater. Sci. Forum 2011, 684, 165–176. [Google Scholar] [CrossRef]
- Kunzler, J.V.; Grandi, T.A.; Schreiner, W.H.; Pureur, P.; Brandão, D.E. Electrical resistivity measurements on the Cu2MnAl heusler alloy. J. Phys. Chem. Solids 1979, 40, 427–429. [Google Scholar] [CrossRef]
- Kunzler, J.V.; Grandi, T.A.; Schreiner, W.H.; Pureur, P.; Brandão, D.E. Spin-disorder resistivity in the Cu2Mn(Al1−xSnx) Heusler alloys. J. Phys. Chem. Solids 1980, 41, 1023–1026. [Google Scholar] [CrossRef]
- Schreiner, W.H.; Brandão, D.E.; Ogiba, F.; Kunzler, J.V. Electrical resistivity of Heusler alloys. J. Phys. Chem. Solids 1982, 43, 777–780. [Google Scholar] [CrossRef]
- Zhang, M.; Liu, G.; Cui, Y.; Hu, H.; Liu, Z.; Chen, J.; Wu, G.; Sui, Y.; Qian, Z.; Zhang, X. Magnetism and transport properties of melt-spun ribbon Cu2MnAl Heusler alloy. J. Magn. Magn. Mater. 2004, 278, 328–333. [Google Scholar] [CrossRef]
- Marchenkova, E.B.; Kourov, N.I.; Marchenkov, V.V.; Pushin, V.G.; Korolev, A.V.; Weber, H.W. Low temperature kinetic properties and structure of Ni50+xMn25−x+yGa25−y alloys with shape memory. J. Phys. Conf. Ser. 2009, 150, 022054. [Google Scholar] [CrossRef]
- Ingale, B.; Gopalan, R.; Chandrasekaran, V.; Ram, S. Structural, magnetic, and magnetotransport studies in bulk Ni55.2Mn18.1Ga26.7 alloy. J. Appl. Phys. 2009, 105, 023903. [Google Scholar] [CrossRef]
- Kourov, N.I.; Marchenkov, V.V.; Pushin, V.G.; Belozerova, K.A. Electrical properties of ferromagnetic Ni2MnGa and Co2CrGa Heusler alloys. J. Exp. Theor. Phys. 2013, 117, 121–125. [Google Scholar] [CrossRef]
- Fluitman, J.H.J.; Boom, R.; De Chatel, P.F.; Schinkel, C.J.; Tilanus, J.L.L.; De Vries, B.R. Possible explanations for the low temperature resistivities of Ni3Al and Ni3Ga alloys in terms of spin density fluctuation theories. J. Phys. F Met. Phys. 1973, 3, 109–117. [Google Scholar] [CrossRef]
- Yoshizawa, M.; Seki, H.; Ikeda, K.; Okuno, K.; Saito, M.; Shigematsu, K. Magnetic field effects on electrical resistivity and ferromagnetism in Ni3Al alloys. J. Phys. Soc. Jpn. 1992, 61, 3313–3321. [Google Scholar] [CrossRef]
- Ogawa, S. Electrical resistivity of weak itinerant ferromagnet ZrZn2. J. Phys. Soc. Jpn. 1976, 40, 1007–1009. [Google Scholar] [CrossRef]
- Ikeda, K.; Gschneider, K.A., Jr.; Kobayashi, N.; Noto, K. Magnetoresistance of Sc3In. J. Magn. Magn. Mater. 1984, 42, 1–11. [Google Scholar] [CrossRef]
- Ueda, K.; Moriya, T. Contribution of spin fluctuations to the electrical thermal resistivities of weakly and nearly ferromagnetic metals. J. Phys. Soc. Jpn. 1975, 39, 605–615. [Google Scholar] [CrossRef]


| Alloys | ρ0 | a × 10−2 | b × 10−4 | Range (K) | TM (K) | TC (K) |
|---|---|---|---|---|---|---|
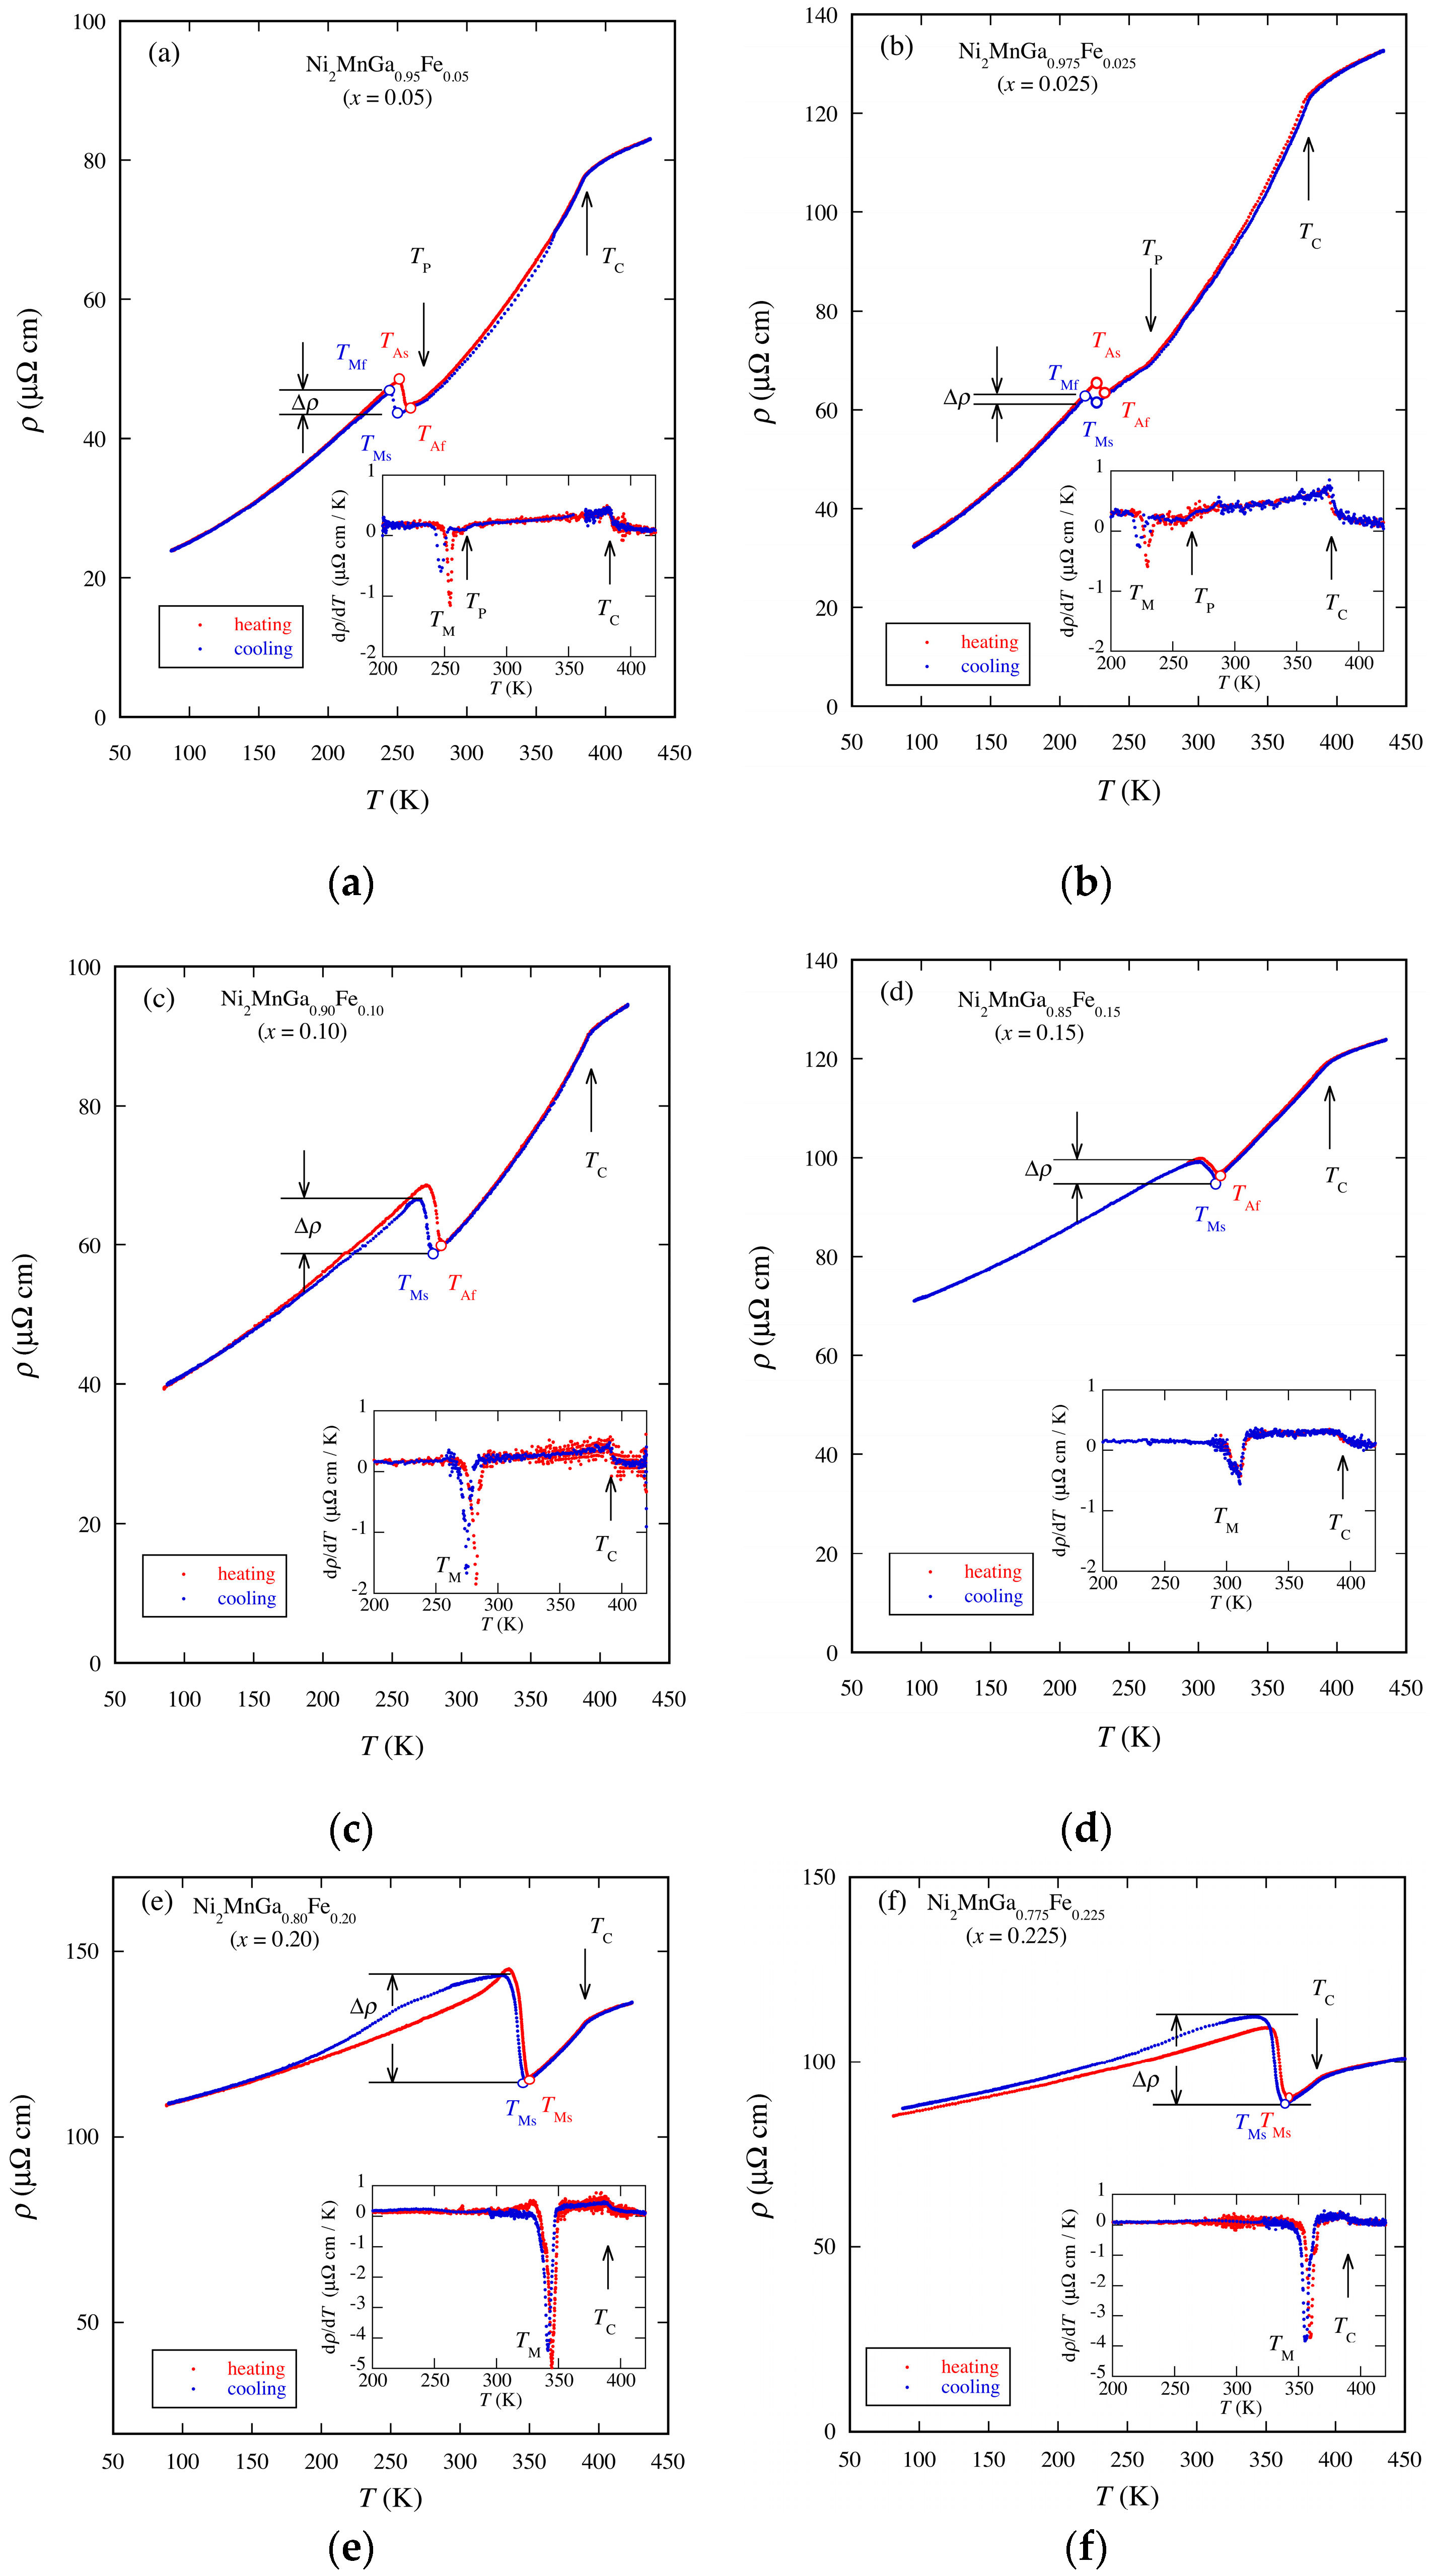
| Ni2MnGa0.975Fe0.025 (x = 0.025) | 22.2 | 4.73 | 6.37 | 100~220 | 235 | 383 |
| Ni2MnGa0.95Fe0.05 (x = 0.05) | 18.2 | 3.34 | 3.54 | 100~230 | 257 | 377 |
| Ni2MnGa0.90Fe0.10 (x = 0.10) | 31.1 | 8.61 | 1.84 | 100~260 | 282 | 390 |
| Ni2MnGa0.85Fe0.15 (x = 0.15) | 60.8 | 9.18 | 1.41 | 100~270 | 314 | 393 |
| Ni2MnGa0.80Fe0.20 (x = 0.20) | 101.6 | 6.47 | 1.67 | 100~270 | 347 | 392 |
| Ni2MnGa0.775Fe0.225 (x = 0.225) | 80.8 | 5.25 | 0.84 | 100~320 | 356 | 390 |
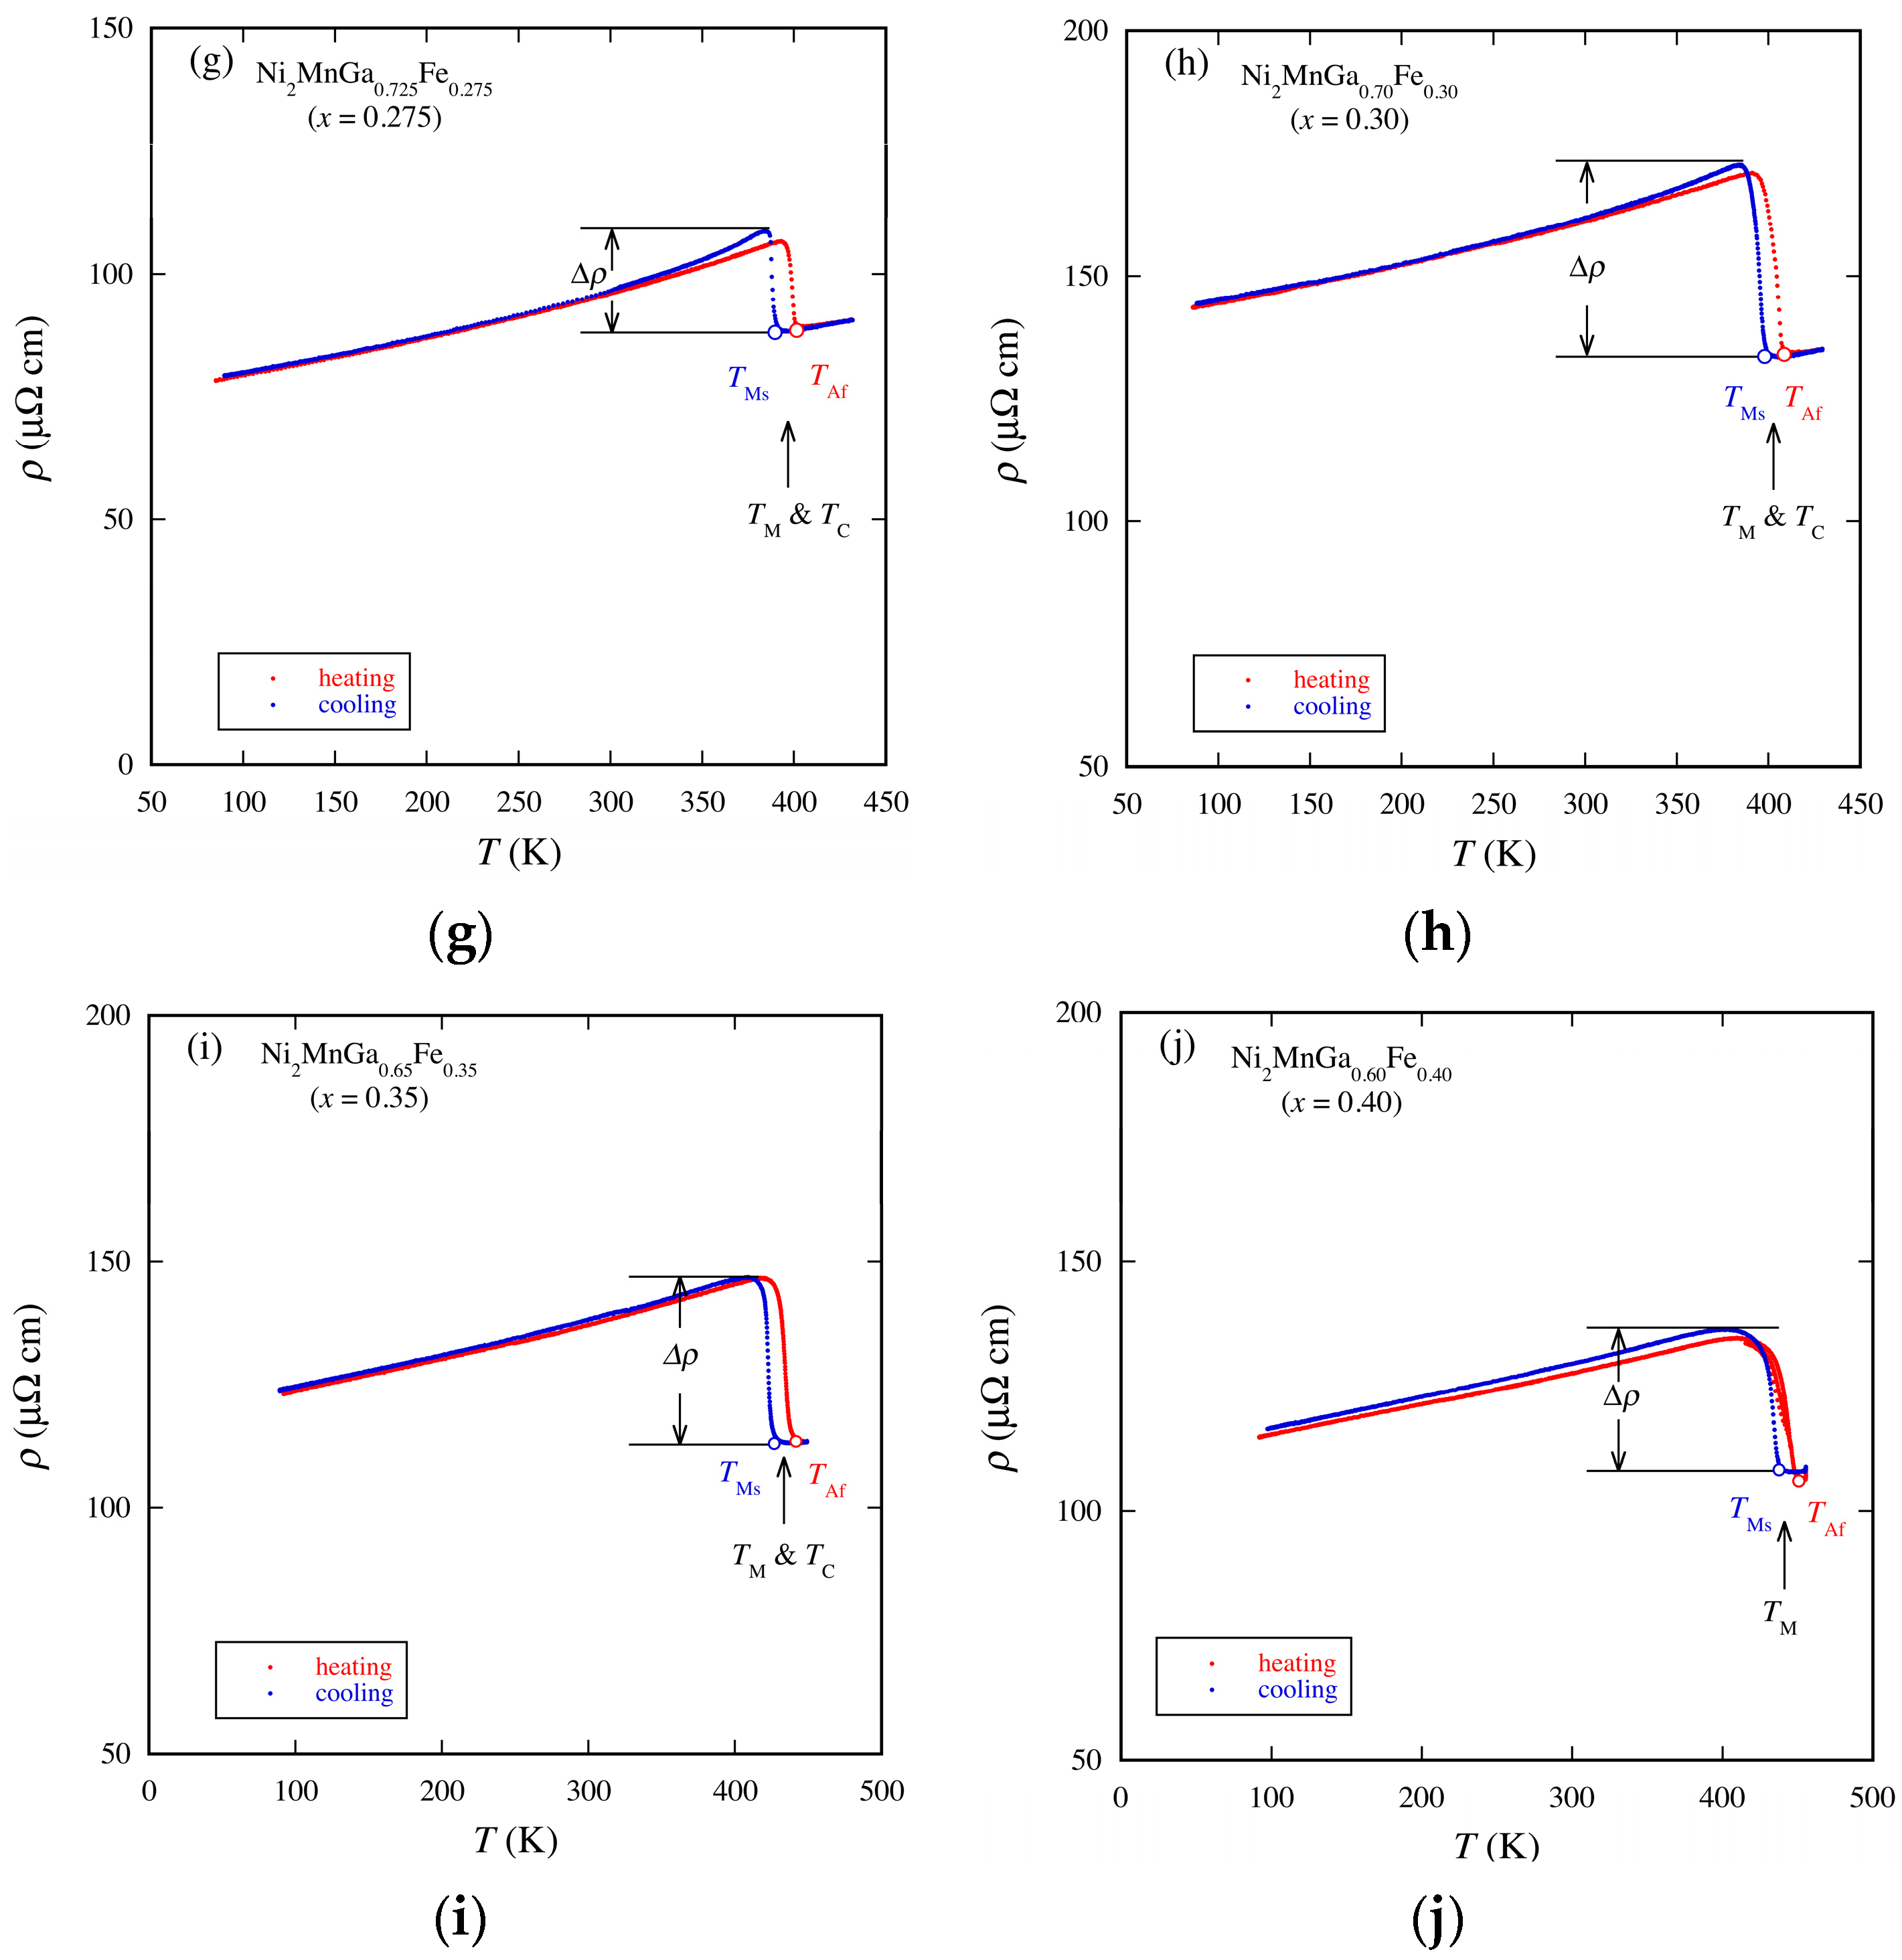
| Ni2MnGa0.725Fe0.275 (x = 0.275) | 75.0 | 4.91 | 0.86 | 100~350 | 395 | 395 |
| Ni2MnGa0.70Fe0.30 (x = 0.30) | 139 | 4.42 | 1.04 | 100~370 | 402 | 402 |
| Ni2MnGa0.65Fe0.35 (x = 0.35) | 118 | 5.06 | 0.43 | 100~390 | 431 | 431 |
| Ni2MnGa0.60Fe0.40 (x = 0.40) | 110 | 5.27 | 0.26 | 100~390 | 442 | 414 1 |
© 2017 by the authors. Licensee MDPI, Basel, Switzerland. This article is an open access article distributed under the terms and conditions of the Creative Commons Attribution (CC BY) license (http://creativecommons.org/licenses/by/4.0/).
Share and Cite
Adachi, Y.; Ogi, Y.; Kobayashi, N.; Hayasaka, Y.; Kanomata, T.; Umetsu, R.Y.; Xu, X.; Kainuma, R. Temperature Dependences of the Electrical Resistivity on the Heusler Alloy System Ni2MnGa1−xFex. Metals 2017, 7, 413. https://doi.org/10.3390/met7100413
Adachi Y, Ogi Y, Kobayashi N, Hayasaka Y, Kanomata T, Umetsu RY, Xu X, Kainuma R. Temperature Dependences of the Electrical Resistivity on the Heusler Alloy System Ni2MnGa1−xFex. Metals. 2017; 7(10):413. https://doi.org/10.3390/met7100413
Chicago/Turabian StyleAdachi, Yoshiya, Yuki Ogi, Noriaki Kobayashi, Yuki Hayasaka, Takeshi Kanomata, Rie Y Umetsu, Xiao Xu, and Ryosuke Kainuma. 2017. "Temperature Dependences of the Electrical Resistivity on the Heusler Alloy System Ni2MnGa1−xFex" Metals 7, no. 10: 413. https://doi.org/10.3390/met7100413