3D Modelling of Flash Formation in Linear Friction Welded 30CrNiMo8 Steel Chain


1
Institute of Materials Science, Joining and Forming, Graz University of Technology, Kopernikusgasse 24/I, 8010 Graz, Austria
2
Pewag Austria GmbH, Mariazeller Straβe 143, 8605 Kapfenberg, Austria
*
Author to whom correspondence should be addressed.
Metals 2017, 7(10), 449; https://doi.org/10.3390/met7100449
Submission received: 20 September 2017
/
Revised: 17 October 2017
/
Accepted: 18 October 2017
/
Published: 21 October 2017
(This article belongs to the Special Issue Recent Achievements in Rotary, Linear and Friction Stir Welding of Metals Alloys)
Abstract
:Linear friction welding (LFW) is a solid-state welding process that has been thoroughly investigated for chain welding in recent years in order to replace the currently in use Flash Butt Welding (FBW) process. Modelling has proven to be an indispensable tool in LFW, thus providing necessary insight to the process, regardless of its final application. This article describes a 3D model developed in the commercial software DEFORM to study the LFW process of 30CrNiMo8 high strength steel in the Hero chain. Hence, a weakly coupled thermal and mechanical model were used, by means of the process experimental input such as displacement histories. The flash morphology and intervening mechanisms were analyzed. A thermal evaluation of different regions in the studied geometry was considered, and a correlation of the modeled and experimental width of the extrusion zone was established.
1. Introduction
Linear friction welding (LFW) is a solid state joining process consisting of two parts, wherein one them is stationary and forced against another that is reciprocating in a linear motion in order to generate frictional heat [1,2,3,4]. The heat, combined with force perpendicular to the weld interface, causes the material to deform and plasticize. The plasticized material is removed from the weld interface as a flash due to the combined action of reciprocating motion and force. In the flash, the initial surface-oxides, along with other impurities, are extruded, allowing a clean metal-to-metal contact between the parts and subsequently forming a joint [5,6].
The LFW process is predominant in the aerospace industry, concerning the joining of titanium alloy blades also known as ‘blisks’ [2,6]. However, in recent years, the process has been spreading to other industrial applications such as near-net-shapes and chain manufacturing. Despite the fact that Flash Butt Welding (FBW) is still the main chain joining process, LFW has been introduced as a viable process in chain welding due to the ability of producing clean and reproducible welds, with exceptional mechanical properties [7]. Contrarily to FBW, which is a fusion joining process, welding defects such as slag residues, porosity, segregation, or hot cracking are not prone to happen [8,9]. Another contrasting characteristic is the relatively low production of FBW compared to LFW due to additional steps during manufacturing such as post-weld heat treatment (PWHT) as a consequence of the significantly wide heat affected zone (HAZ). Figure 1 shows a Hero chain being produced by LFW. ‘Hero’ is the designation given to the chains joined with this process.
Due to the rapid nature of the process, modelling is often used to describe the weld phenomena in terms of flash formation, surface self-cleaning ability, and thermal histories in order to provide as much insight as possible, which would not be possible with experimental work alone [10,11,12]. Despite this, 2D modelling has been of preference for the majority of published work, regarding the fact that it provides considerable information on the LFW process, without the significant computational effort drawback experienced in 3D modelling. However, 2D models are unable to replicate the flash formation in the direction perpendicular to the oscillation direction [10]. As a result, significant effort has been done in recent years to develop 3D LFW models. Fratini et al. [13] used a 3D model to study the influence of LFW process parameters on the weld integrity and concluded that proper conditions of temperature and pressure need to be reached, which, in turn, is related to the oscillation frequency. Again, the effect of process parameters was investigated by Li et al. [14] using a weakly coupled 3D model. The interface temperature and axial shortening rate are constant in the equilibrium phase, regardless of the process parameters. Buffa et al. [15] used a 3D model coupled with a neural network to predict the weld quality of AA6082-T6. Bühr et al. [16] used a 3D model to account residual stresses in a linear friction welded Ti-6Al-4V and concluded that higher pressures and lower rubbing velocities will lead to lower peak stresses. More recently, McAndrew et al. [17] developed a novel 3D model for Ti-6Al-4V using experimental displacement histories as modelling inputs. Consequently, the approach resulted in decreased computational time and memory storage requirements. Good agreement between model and weld phenomena was captured for the studied conditions.
Previous studies focus on the rectangular shape interface geometries, while the present work deals with the actual chain geometry. Some simplifications were made to deal with the geometrical impositions. The evolution of the flash formation was studied for different time steps, and the influence of the geometry on the formation mechanisms was assessed. A temperature evolution analysis in various regions of the modelled workpiece was studied, as well as the flash extrusion zones. A prediction analysis regarding the stress state at the end of the process was carried out.
2. Methodology
2.1. Experimental Procedure
The material used is 30CrNiMo8 high strength steel, with a yield strength and tensile strength of 1050 and 1550 MPa, respectively, and a total fracture elongation of 9%. The mechanical properties are given at room temperature. The half chain links are dropforged, with a cross-sectional width and height of 22 and 24 mm (oscillation direction), respectively. A technical drawing of the used chain parts is presented in Figure 2.
The welds were carried out in a prototype machine, which is fully instrumented and allows the measurement of both normal and in-plane forces, as well as displacements, during the process. For the present work, the combination of parameters that yields the best mechanical properties is already known; thus only one combination of amplitude, frequency, applied friction, and forge force was studied. Due to confidentiality reasons, the welding parameters are not presented.
2.2. Energy Input
Provided that the machine is fully instrumented, the energy given to the weld interface can be determined as recurring in plane load and displacement recordings, similar to the approach described in [18].
To determine the energy put into the weld, the load on the interface has to be known. However, the apparatus does not allow the in-plane load to be directly measured since the load cell is measuring between the clamping system and actuator. The LFW machine was therefore subjected to a ‘dry run’ to account for the load contribution due to the inertial movement of the oscillating clamping system . Subsequently, the load registered was subtracted from the load obtained when the machine was operating under normal welding conditions; . Although force and velocity are vectors, only their absolute values in the same plane (in plane) are of importance for the energy input. The instantaneous power going into the weld is:
The total energy put into the weld interface during a certain time span can be obtained by integrating Equation (1) into the duration of one phase tph:
Since the position at discrete values in time is known, the central finite difference is used for the first order derivative to estimate the velocity [19],
where v1 is the velocity at the present time step; and are the position at previous and future time levels, respectively; and denotes the time step size.
2.3. Numerical Simulation
Numerical modelling of linear friction welded chains was conducted using finite element analysis (FEA) DEFORM-2D/3D 11.1 SP1 commercial software. Similar to what is reported in Effertz et al. [20], the ‘single-body’ approach is used. The first stage is modelled as a purely thermal model to represent the heating by friction in the initial phase; the second stage was used to account for plastic deformation in the transition and equilibrium phase by means of a thermo-mechanically coupled model.
Unlike other studies, the initial phase during chain welding has considerable plastic deformation and is traduced in approximately 2 mm of burn-off, as reported in [20]. This has to do with the fact that the interfaces of the chains are not flat. However, deformation from the initial phase was not considered in this modelling approach. This assumption proved to be reliable nevertheless. The models were run until a burn-off of 4 mm was reached, which represents the upset.
2.3.1. Mesh Characteristics
Both workpieces used for the thermal and thermo-mechanical model were discretized using 4-node tetrahedral elements, which, in addition to better fitting the geometry, are more stable for problems dealing with high deformations. The mesh was refined in areas of interest such as in the vicinity of the welding interface. For the thermal model, a width band of 3 mm close to the interface was considered, using elements with an average size of 0.5 mm. Similar element sizes were used by Gao et al [21] and Pashazadesh et al. [22] when modelling the friction stir spot and friction stir welding, respectively. Further regions were discretized using an average element size of 2 mm.
As for the thermo-mechanical model, the same approach described previously was considered. Since a rippling effect is not expected based on the results obtained in [20], the aforementioned interface element size seems adequate. Thus 0.5 mm elements were also used in the region of interest. A similar element size to the thermal model was used in regions further away from the welding interface. The 6 mm finely meshed region therefore represents the joint between to half links. Figure 3 shows an illustration of the meshing and width bands used to illustrate the thermo-mechanical model. Notice that the overall height of the modelled workpiece is 16 mm, which represents the chain outside the clamping system.
2.3.2. Material Model
The tabular format was used in DEFORM due to its versatility and its ability to represent any material for which flow stress can be given as a function of strain, strain rate, and temperature.
Material flow stresses were obtained from stress and strain curves for temperatures, strains, and strain rates up to 1400 °C, 4, and 1000 s−1, respectively, by means of isothermal compression tests [23]. Figure 4 shows the material flow stress curve at 500 °C.
The temperature dependent thermal conductivity and heat capacity used are also based on experimental data and are depicted in Figure 5.
2.3.3. Thermal Model
The thermal model developed is analogous to the work presented in [20]. As far as the thermal problem is regarded, heat generation and transfer can be expressed by the following energy balance.
where denotes thermal conductivity, the heat generation rate, the temperature, the specific density, and the specific heat. The first term represents the heat transfer rate and the third term, , the internal energy rate. The energy balance can be rewritten in the variational form as:
The term is the related to the fraction of mechanical work that is converted into heat, which, in the case of the thermal model, is not considered. It is, however, taken into account in the (weakly coupled) thermo-mechanical model and assumed to be 0.9. The fraction of the remainder of the plastic deformation energy is associated with causing changes in dislocation density, (sub-)grain boundary generation and migration, and phase transformation and evolution [22]. and are the stress and strain components, respectively. The heat flux normal to the boundary surface is given by , which includes convection and radiation heat losses.
The emissivity value was kept at the DEFORM default setting, hence 0.7. The convective heat transfer between the workpiece and its surroundings was set to 20 W/(m2K) [21], consistent with free convection in air. Both the surrounding and initial workpiece temperatures were set to 20 °C. The solving strategy used in the thermal model is the ‘Sparse’ method.
The heat flux () used is based on Equation (1), presented in Section 2.2, and is shown in Figure 6a. The heat flux was uniformly applied across most of the interface. Unlike the work reported in [6], the heat flux was not linearly reduced away from the edges, corresponding to the amplitude (a). Instead, a single step approach was used, wherein 50% of the value of was used for half the amplitude near the edges. In order to maintain the mean energy due to the contact/no-contact condition, 100% of was considered for the remaining half of the amplitude value. Thus, the heat flux was applied as illustrated in Figure 6b.
Another simplification to the thermal model was considered by not assuming the influence of the rounded edges on the overall interfacial contact throughout the process; hence the same heat flux profile was used at every point in the direction perpendicular to oscillating movement. The model was run until 1.5 s, which corresponds to the end of the initial phase and the point at which all interface elements reached 1000 °C, as depicted in Figure 6c.
2.3.4. Thermo-Mechanical Model
The 3D single-body thermo-mechanical model was set up using a plastic workpiece and two rigid tools, as shown in Figure 7. The dimensions of the plastic workpiece were previously presented in Figure 3. Notice that only one small portion of the chain link was considered, with a special focus on the weld region, in order to reduce the number of elements employed and consequently the computational time.
The model solves the weakly coupled thermal and mechanical problem, which can be described by the following matrix equation [24]:
where is the mass matrix; the is damping matrix; is the thermal specific heat matrix; is the stiffness matrix; is thermal conductivity matrix; is the load vector; is the heat flow vector; is the displacement vector; and is the temperature vector. and are the first and second time derivatives, respectively.
A ‘retrospective analysis’ similar to that in [16] was used; hence the experimental data for amplitude and burn-off were used as process inputs for the model in order to exploit the advantage of using Conjugate Gradient Solver. This solver is, according to the DEFORM users’ manual, computationally more advantageous in terms of the reduction of simulation time and storage memory. The oscillating and burn-off movements were assigned to the upper and lower dies, respectively.
3. Results and Discussion
3.1. Temperature Evolution
The thermal evolution was studied in three different locations in order to assess if there is any influence of the cross-sections’ geometry. Twenty measurement points spaced at 0.5 mm were considered in a total length of 10 mm; 5 mm on either side of the interface. Figure 8 shows the thermal evolution for the considered positions. The obtained profiles are on par with the literature, showing very similar trends throughout the process [25].
Overall, no significant asymmetries were observed for both the stationary and moving parts until t = 0.5 s in the observed regions. Figure 8a shows a discrepancy in the profile for t = 0.75 s, which is easily related to the hot flash contacting the cooler regions of the moving part of the workpiece in previous steps. This will naturally have an influence on the evolution of the temperature profiles for the following steps. Hence, the profiles of the stationary and moving parts at t = 1 s and t = 1.25 s are compared, where the moving profiles exhibit a lower temperature gradient.
The boundary temperature at which there is material flow is approximately 810 °C. By intersecting this temperature with the profile at t = 1.25 s, the extent of the extrusion zone can be estimated and is given by the solid and dashed lines for the moving and stationary sides, respectively. Thus, according to the model, the width of the extrusion zone is 4.5 mm. This observation is also supported by the experiments, in which the extrusion zone measured is 4.6 mm. Notice that the solid line is shifted to the right, which is due to the occasional contact of the flash with the workpiece, caused by preferential material flow toward the moving part, as discussed in the following section. In the present case, the moving part is exposed to higher temperatures than the stationary region. Naturally, the opposite phenomena happen in the opposing surface, according to Figure 8c.
The temperature profiles on the side of the workpiece, presented in Figure 8b, depict a shift of the highest temperature towards the moving part of the workpiece. This tendency can be observed from t = 0.75 s onwards. This will imply that material from the moving part of the workpiece will flow with more ease, which, coupled with the applied pressure, might explain the tendency of flash to bend downwards, which is mentioned in Section 3.2. Also, the size of the extrusion zone in the model was overestimated in comparison with the experiment; 3.8 and 2.5 mm, respectively. This difference might be due to model related assumptions such as meshing characteristics, heat input data, and related material like flow stress and heat conductivity data.
Figure 8c shows the temperature history of the remaining position, and comparable extrusion zones were obtained for the model and the experiment as 4.4 and 4.7 mm, respectively.
3.2. Flash Formation
Similar to the results obtained in [19], the extruded material remains in constant contact with the upper and lower parts of the workpiece during the oscillation movement, which characterizes welds with low amplitude, which are hence unable to promote shearing. Figure 9 shows the morphology of the flash at different time steps. Figure 9a shows the flash appearance in the early stages of the process. In further stages, t = 0.25 s to t = 0.3 s, the flash distorts severely upwards and downwards with the oscillating movement; hence self-contact occurs since the flash contacts the workpiece, depicted in Figure 9b. As a result, conduction heat transfer occurs in the contact points, causing the flash to cool even faster. From Figure 9c, one can intuitively acknowledge that the flash further away from the extrusion zone is cooling due to convection and the influence of conduction from earlier stages.
The flash formed in the negative y direction has shown a tendency to divert upward in the very early stages of the process, whereas the flash formed in the positive y direction has shown a gradual downward movement. These tendencies are probably due to the constant constraints imposed on the flash by self-contact and tooling contact, promoting local shearing on the base of the flash. Also, the flash expelled in the positive y direction appears to have a smaller width compared to the opposite surface, although longer. This can be explained by the fact that this surface is composed of rounded edges with higher radii; thus the material in the vicinity of these edges will flow with much ease to the sides. Consequently, less material is dragged in the y direction. This phenomena can also be observed in the experimental flash.
The flash formed on the side is expelled in line with the z-axis until approximately t = 0.6 s, when it starts to bend toward the stationary part of the workpiece, as shown in Figure 9d.
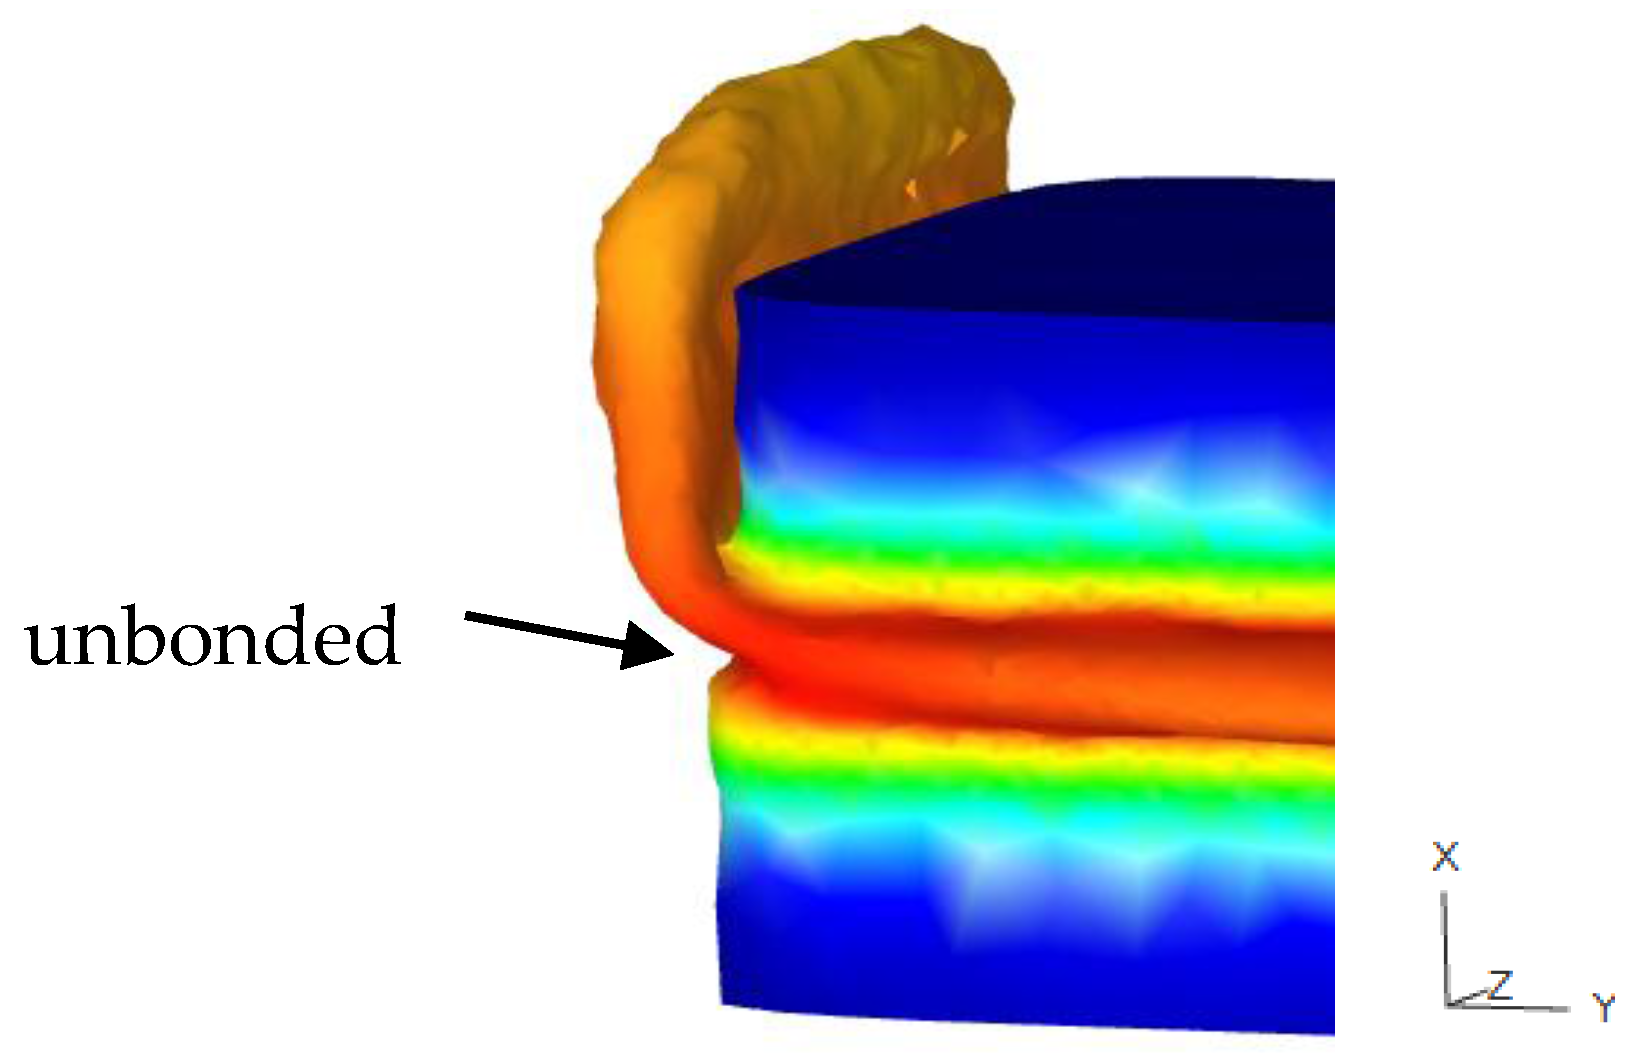
Partial Unbonding
The partial unbonding phenomena shown in Figure 10, also reported in previous works of McAndrew [17] and Addison [26], were observed in the developed 3D model and are prominent for low burn-off values. It is proven that insufficient bonding compromises the mechanical properties [27], ultimately leaving a notch, which acts as a crack propagation site. The phenomena occurred in the corners of the cross-section with lower radii, whereas no unbonding occurred in the corners with higher corner radii. This might suggest that there is a critical radius at which partial unbonding is not prone to occur. Nonetheless, as the model progressed to higher burn-off values, the material in the corner merged with the rest of the interface. This is due to heat being provided to this region by the flash and to the interface by conduction, causing the corners to soften and plastically deform.
4. Conclusions
This work describes a three dimensional numerical modelling approach to a linear friction welded 30CrNiMo8 high strength steel chain. Thus, the main conclusions arising from the work are the following:
1. A 3D finite element modelling approach for the LFW of 30CrNiMo8 high strength steel chains was performed in order to predict the thermal evolution and flash formation of the process by means of purely thermal and thermo-mechanical models. Fairly accurate results were obtained regarding flash extrusion widths, and the multi-directional material flow behavior of the process was characterized.
2. The comparative analysis of the moving and stationary parts showed no significant thermal asymmetries up to t = 0.5 s for the evaluated regions. Nevertheless, the profiles showed some asymmetries from t = 0.75 s onwards due to the preferential material flow path, which consequently promotes contact of the flash with the workpiece in the oscillation direction. This asymmetrical trend was also observed in the location perpendicular to the reciprocating movement. Hotter material and consequently preferential flow was observed toward the moving part.
3. The upward/downward flipping effect of the flash reported in other investigations is also present in this work. Nevertheless, at a certain point, the flash formed on the surface with a negative normal in the y-axis has shown a tendency to divert upward in the very early stages of the process, while the surface with a positive normal in the y direction has shown a gradual downward movement. Local shearing on the base of the flash due to constraints imposed by self-contact and tooling contact might explain the observed trends in material flow. The flash perpendicular to the oscillating direction exhibited bending toward the stationary part, which can be justified by preferential flow on the moving part coupled with the axial loading.
4. The width of the flash extrusion zone was evaluated in different locations of the chains’ cross-section. Good prediction was achieved in the locations where the material flow is parallel to the oscillating directions. On the other hand, the extrusion was overestimated perpendicularly to the oscillating movement, which might be related to pre-processing modelling assumptions.
5. Partial unbonding was observed for low burn-off values in the cross-section corners of lower radii. The model showed that sufficient heat was provided to soften and plastically deform the regions.
Since 30CrNiMo8 is medium Carbon steel, the effect of phase transformation will be considered in future work modelling residual stresses in the friction welding of chains.
Acknowledgments
The authors gratefully acknowledge the financial support of this work by the project JOIN. The K-Project Network of Excellence for Joining Technologies JOIN is fostered in the frame of COMET – Competence Centers for Excellent Technologies by Bundesministerium für Verkehr, Innovation und Technologie (BMVIT), Bundesministerium für Wissenschaft, Forschung und Wirtschaft (BMWFW), Österrichische Forschungsförderunggesellschaft (FFG), Land Oberöstereich, Land Steiermark, Steirische Wirtschaftsförderung (SFG) and Technologieagentur der Stadt Wien (ZIT). The program COMET is handled by FFG.
Author Contributions
Pedro Effertz was the principle investigator of the research and carried out all numerical outputs. Franz Fuchs dealt with the welding tests to validate the present model. Norbert Enzinger is the scientist responsible for this research and thus corrected the scientific output of the present article.
Conflicts of Interest
The authors declare no conflicts of interest.
References
- Song, X.; Xie, M.; Hofmann, F.; Jun, T.S.; Connolley, T.; Reinhard, C.; Atwood, R.C.; Connor, L.; Drakopoulos, M.; Harding, S.; et al. Residual stresses in Linear Friction Welding of aluminium alloys. Mater. Des. 2013, 50, 360–369. [Google Scholar] [CrossRef]
- Bhamji, I.; Preuss, M.; Threadgill, P.L.L.; Addison, A.C.C. Solid state joining of metals by linear friction welding: a literature review. Mater. Sci. Technol. 2011, 27, 2–12. [Google Scholar] [CrossRef]
- Buffa, G.; Cammalleri, M.; Campanella, D.; Fratini, L. Shear coefficient determination in linear friction welding of aluminum alloys. Mater. Des. 2015, 82, 238–246. [Google Scholar] [CrossRef]
- Shtrikman, M.M. Linear friction welding. Weld. Int. 2010, 24, 563–569. [Google Scholar] [CrossRef]
- Nicholas, E.D. Friction Processing Technologies. Weld. World. 2003, 47, 2–9. [Google Scholar] [CrossRef]
- Bhamji, I.; Addison, A.C.; Threadgill, P.L.; Preuss, M. Welding in Aerospace Engineering; Woodhead Publishing Limited: Cambridge, UK, 2012. [Google Scholar]
- Mucic, K.; Fuchs, F.; Enzinger, N. Process optimization for linear friction welding of high strength chain. In Proceedings of the EUROJOIN Conference, Pula, Croatia, 24–26 May 2012. [Google Scholar]
- Çetinkaya, C.; Arabaci, U. Flash butt welding application on 16MnCr5 chain steel and investigations of mechanical properties. Mater. Des. 2006, 27, 1187–1195. [Google Scholar] [CrossRef]
- Mucic, K.; Enzinger, N.; Fuchs, F. Linear Friction Welding of High Strength Chains. In Proceedings of the 9th International Conference, Chicago, IL, USA, 4–8 June 2012. [Google Scholar]
- McAndrew, A.R.; Colegrove, P.A.; Addison, A.C.; Flipo, B.C.D.; Russell, M.J. Modelling the influence of the process inputs on the removal of surface contaminants from Ti-6Al-4V linear friction welds. Mater. Des. 2015, 66, 183–195. [Google Scholar] [CrossRef] [Green Version]
- McAndrew, A.R.; Colegrove, P.A.; Addison, A.C.; Flipo, B.C.D.; Russell, M.J. Energy and Force Analysis of Ti-6Al-4V Linear Friction Welds for Computational Modeling Input and Validation Data. Metall. Mater. Trans. A. 2014, 13, 6118–6128. [Google Scholar] [CrossRef] [Green Version]
- Turner, R.; Gebelin, J.C.; Ward, R.M.; Reed, R.C. Linear friction welding of Ti-6Al-4V: Modelling and validation. Acta Mater. 2011, 59, 3792–3803. [Google Scholar] [CrossRef]
- Fratini, L.; Buffa, G.; Campanella, D.; Spisa, D.L. Investigations on the linear friction welding process through numerical simulations and experiments. Mater. Des. 2012, 40, 285–291. [Google Scholar] [CrossRef]
- Li, W.; Wang, F.; Shi, S.; Ma, T.; Li, J.; Vairis, A. 3D Finite Element Analysis of the Effect of Process Parameters on Linear Friction Welding of Mild Steel. J. Mater. Eng. Perform. 2014, 23, 4010–4018. [Google Scholar] [CrossRef]
- Buffa, G.; Campanella, D.; Pellegrino, S.; Fratini, L. Weld quality prediction in linear friction welding of AA6082-T6 through an integrated numerical tool. J. Mater. Process. Technol. 2016, 231, 389–396. [Google Scholar] [CrossRef]
- Bühr, C.; Colegrove, P.A.; McAndrew, A.R. An Efficient Numerical Modelling Approach to Predict Residual Stresses in Ti-6Al-4V Linear Friction Welds. In Proceedings of the 10th International Conference on Trend in Welding Research & 10th International Welding Symposium of Japan Welding Society (9WS), Tokyo, Japan, 11–14 October 2016. [Google Scholar]
- McAndrew, A.R.; Colegrove, P.A.; Flipo, B.C.D.; Bühr, C. 3D modelling of Ti–6Al–4V linear friction welds. Sci. Technol. Weld. Join. 2017, 22, 496–504. [Google Scholar] [CrossRef]
- Ofem, U.U.; Colegrove, P.A.; Addison, A.; Russell, M.J. Energy and force analysis of linear friction welds in medium carbon steel. Sci. Technol. Weld. Join. 2010, 15, 479–485. [Google Scholar] [CrossRef] [Green Version]
- Kreyszig, E. Advanced Engineering Mathematics: Maple Computer Guide; Wiley, John & Sons, Incorporated: New York, NY, USA, 2000. [Google Scholar]
- Effertz, P.S.; Fuchs, F.; Enzinger, N. Modelling the flash formation of linear friction welded 30CrNiMo8 high strength steel chains. Int. J. Adv. Manuf. Technol. 2017, 92, 2479–2486. [Google Scholar] [CrossRef]
- Gao, Z.; Niu, J.T.; Krumphals, F.; Enzinger, N.; Mitsche, S.; Sommitsch, C. FE modelling of microstructure evolution during friction stir spot welding in AA6082-T6. Weld. World. 2013, 57, 895–902. [Google Scholar] [CrossRef]
- Pashazadeh, H.; Teimournezhad, J.; Masoumi, A. Numerical investigation on the mechanical, thermal, metallurgical and material flow characteristics in friction stir welding of copper sheets with experimental verification. Mater. Des. 2014, 55, 619–632. [Google Scholar] [CrossRef]
- Stummer, M. Eigenschaften von 30CrNiMo8 Für Die Simulation; TU Graz: Graz, Austria, 2014. [Google Scholar]
- Sorina-Müller, J.; Rettenmayr, M.; Schneefeld, D.; Roder, O.; Fried, W. FEM simulation of the linear friction welding of titanium alloys. Comput. Mater. Sci. 2010, 48, 749–758. [Google Scholar] [CrossRef]
- McAndrew, A.R. 2D linear friction weld modelling of a Ti–6Al–4V T–joint. J. Eng. Sci. Tech. Rev. 2015, 6, 44–48. [Google Scholar]
- Addison, A.C. Linear friction welding information for production engineering. In TWI Industrial Member Report Summary; TWI: Granta Park, UK, September 2010. [Google Scholar]
- Bhamji, I.; Preuss, M.; Threadgill, P.L.; Moat, R.J.; Addison, A.C.; Peel, M.J. Linear friction welding of AISI 316L stainless steel. Mater. Sci. Eng. A 2010, 528, 680–690. [Google Scholar] [CrossRef]
Figure 1.
A Hero chain being joined by linear friction welding (LFW).
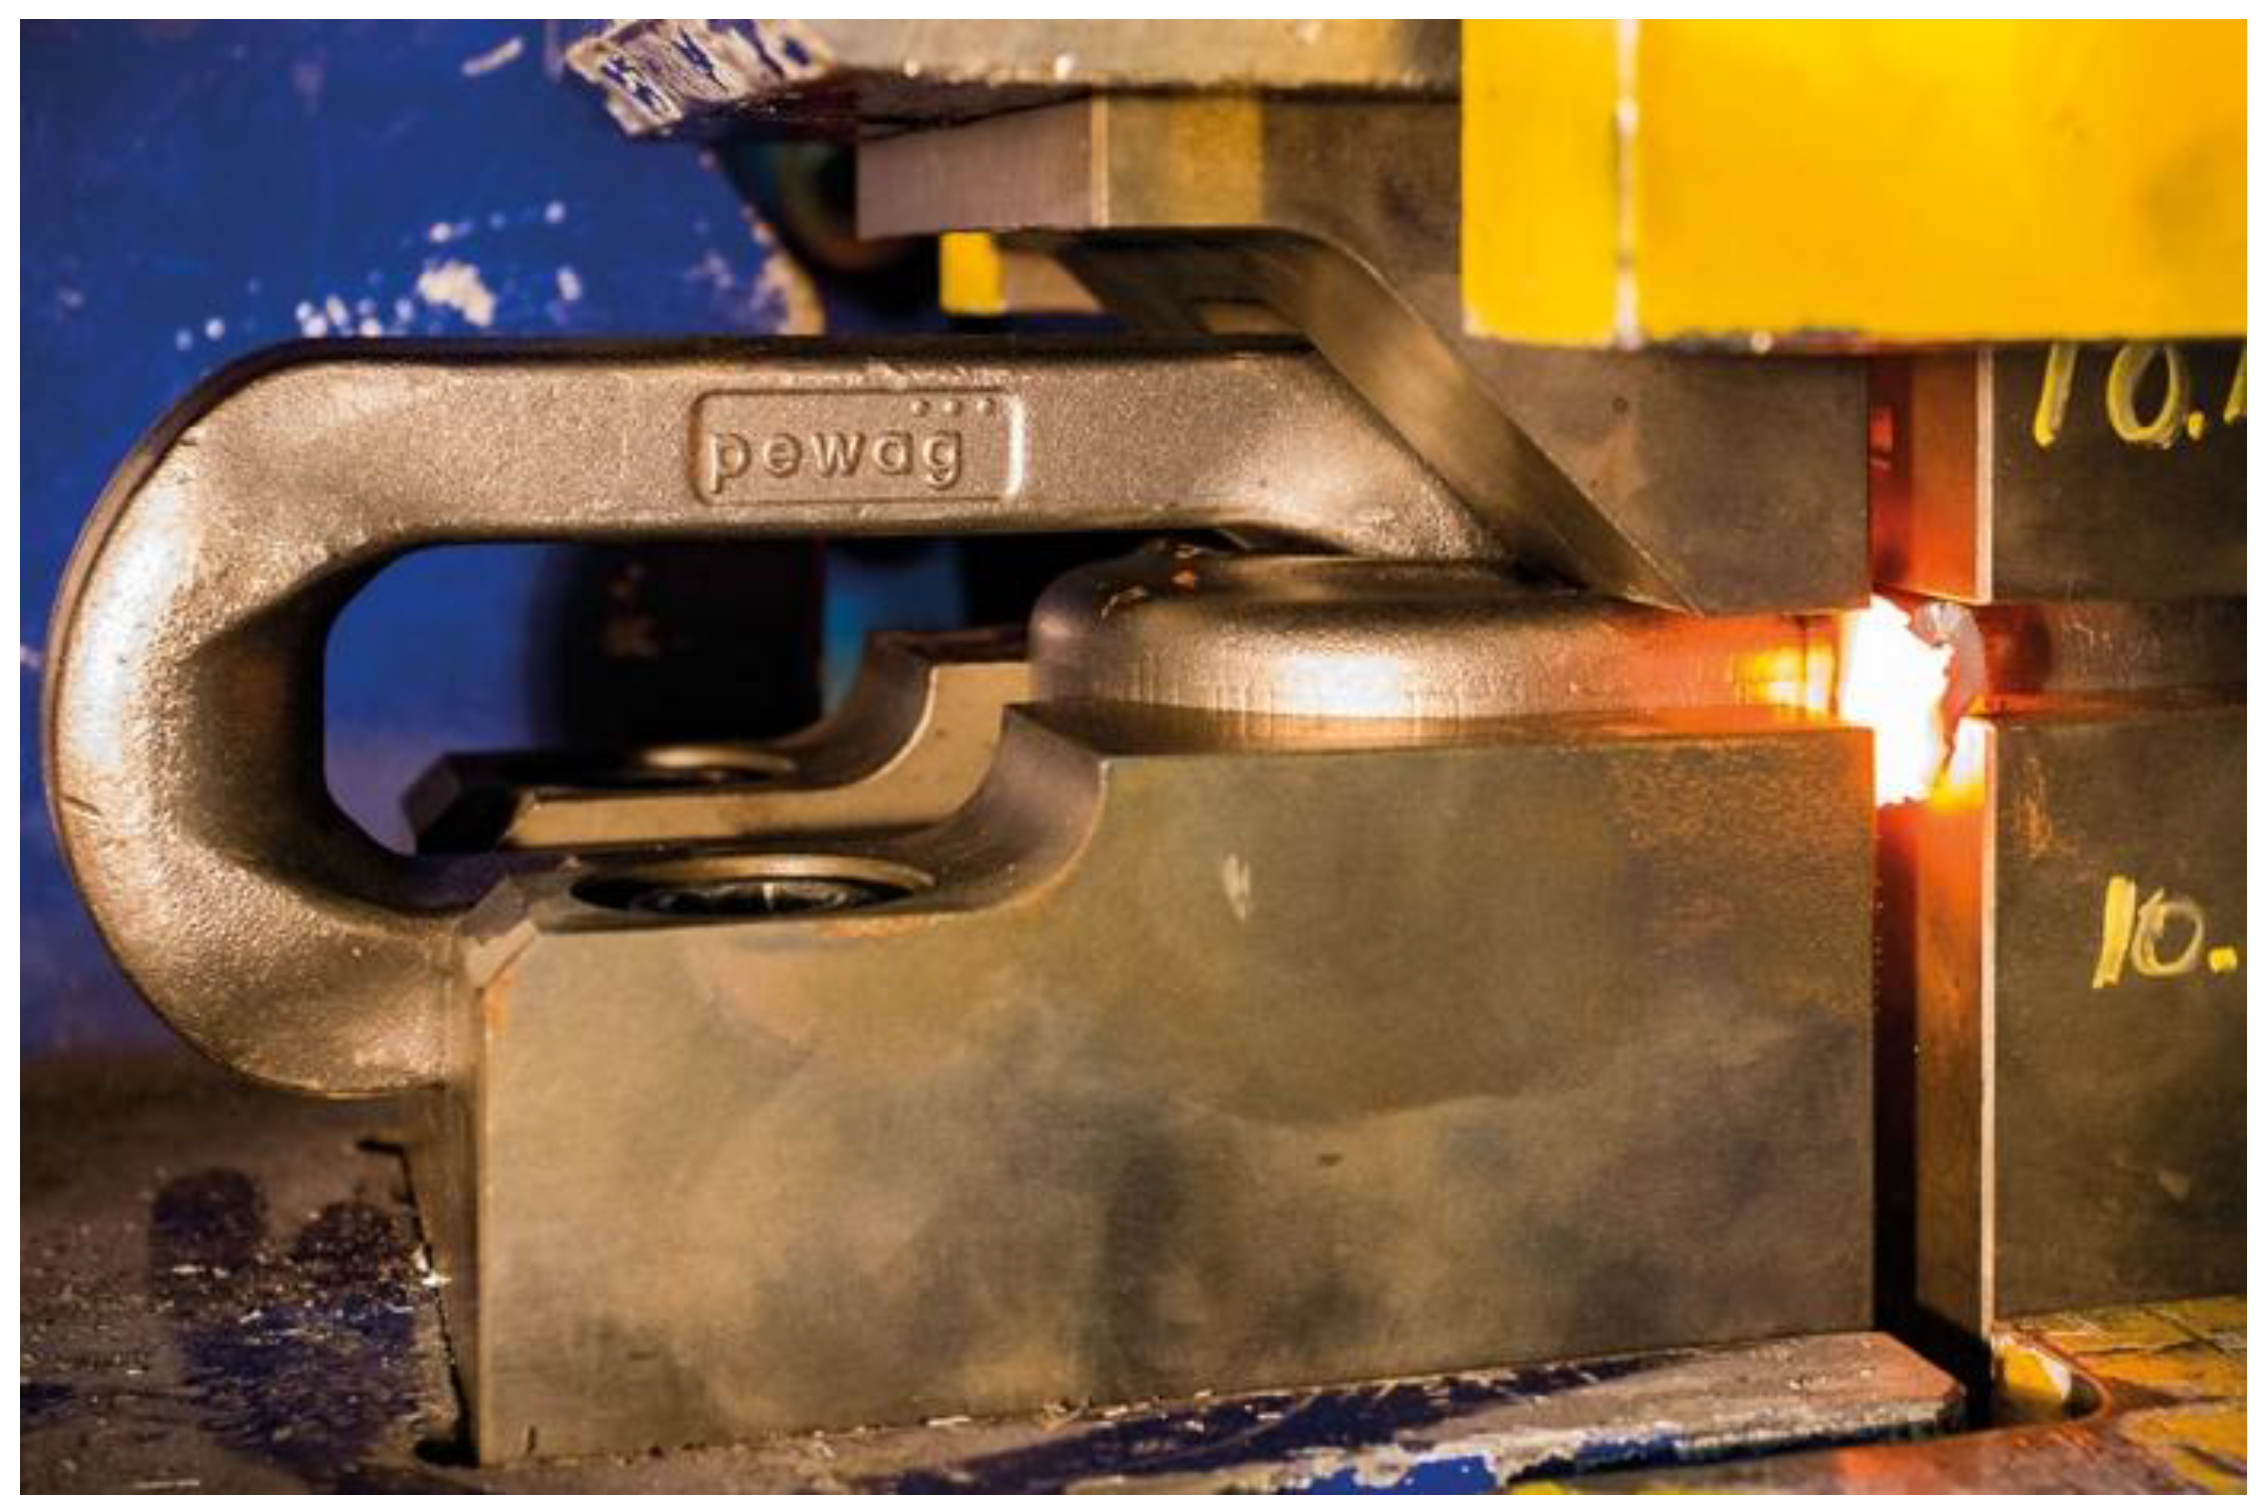
Figure 2.
Technical drawing of the used chain link (unit: mm).
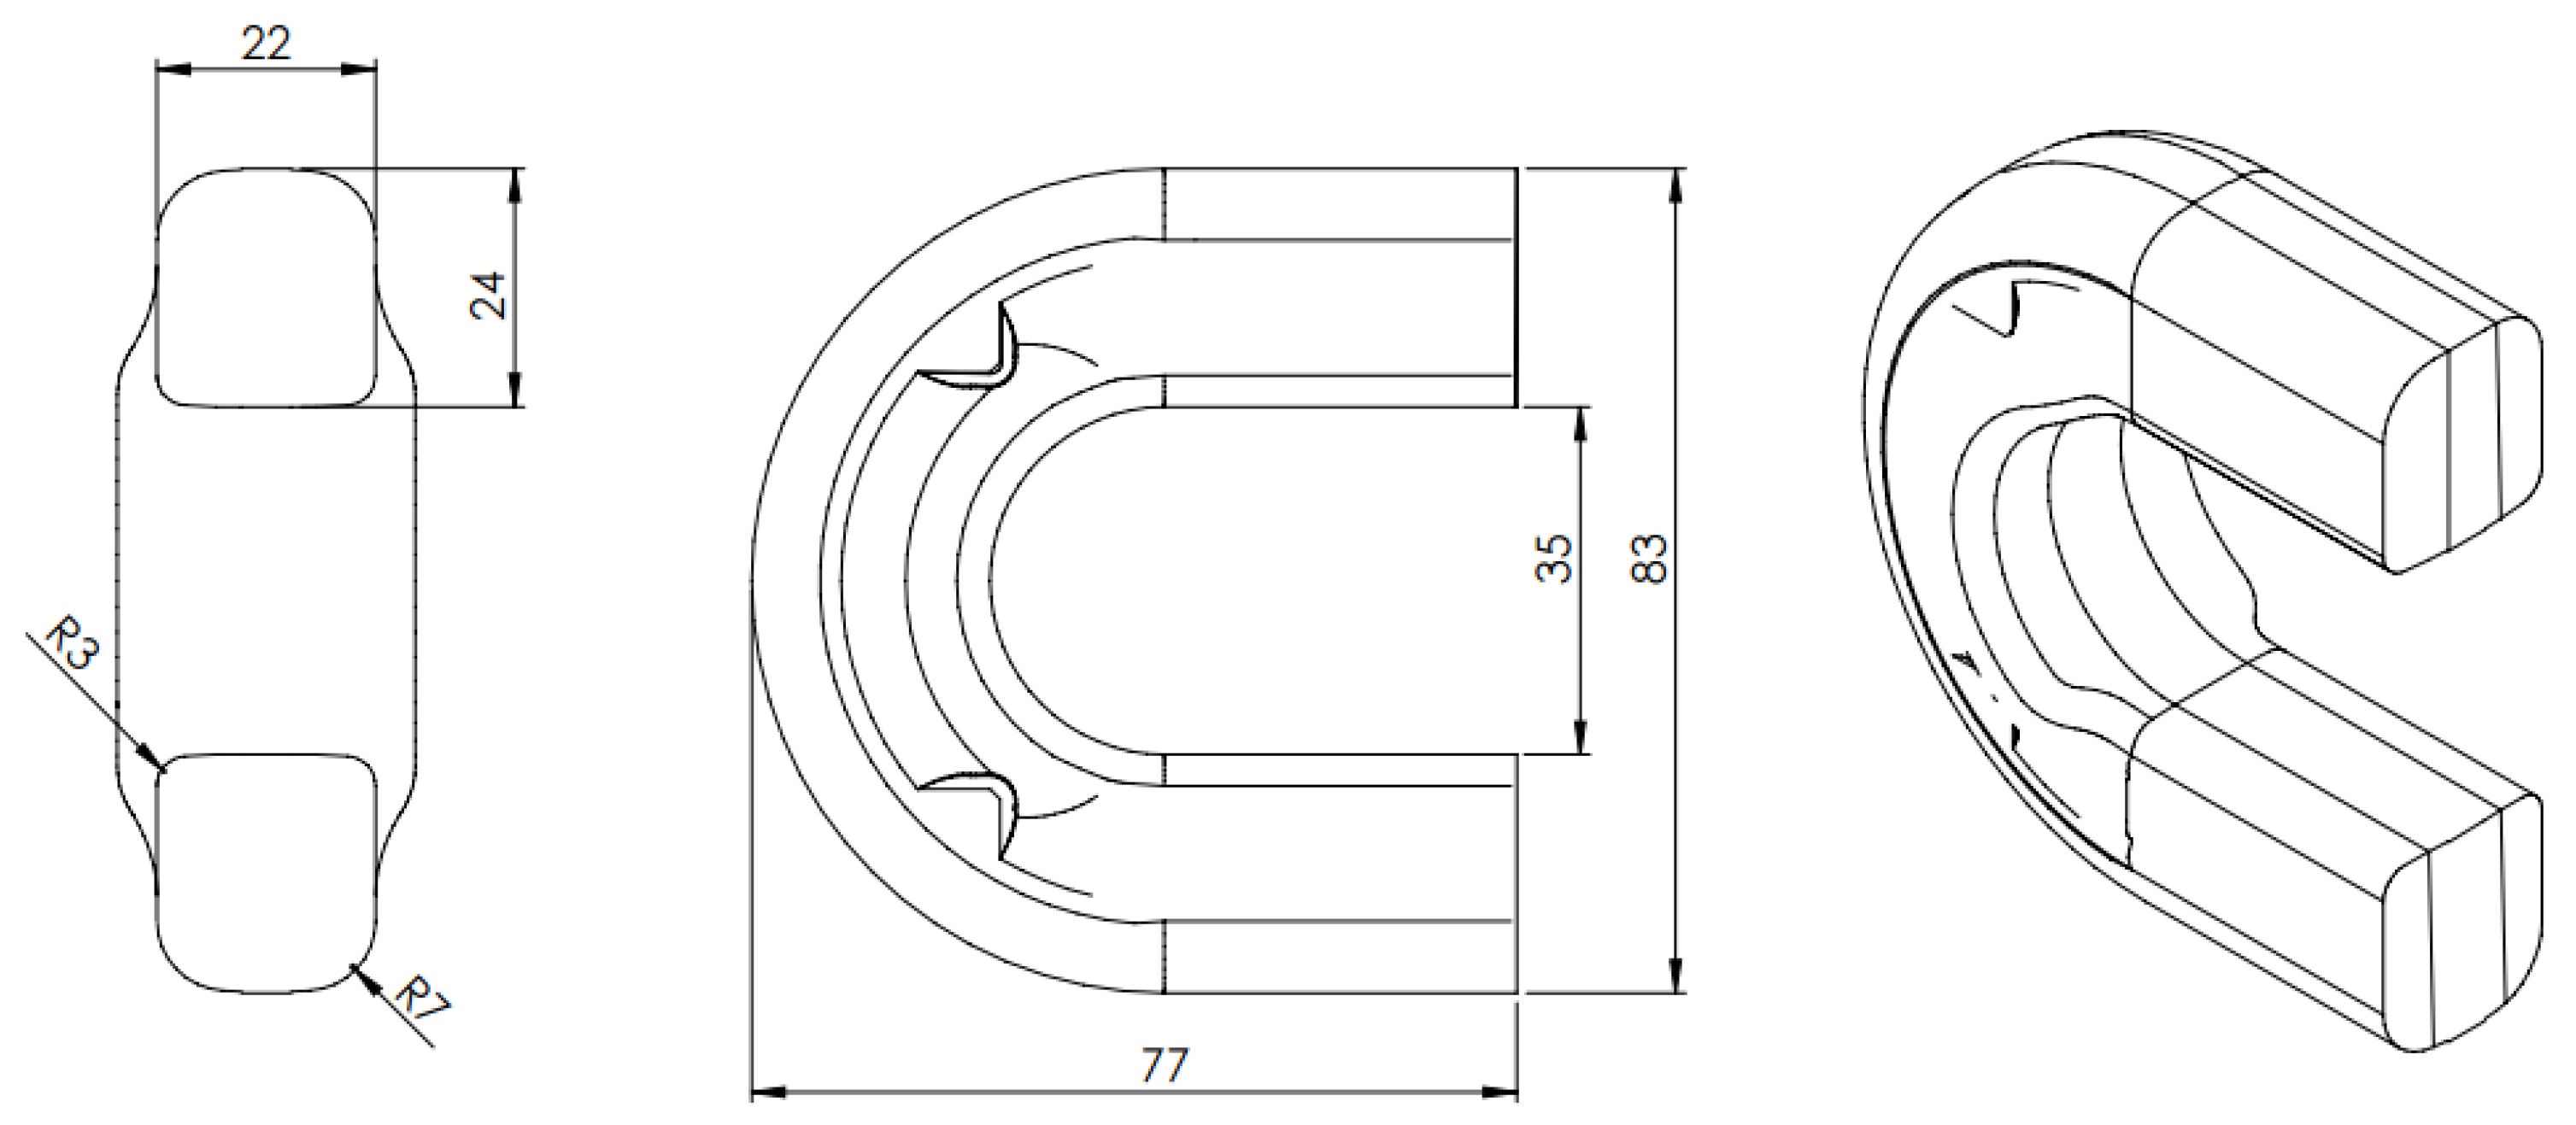
Figure 3.
Illustration of the meshing width bands used for the thermo-mechanical model.
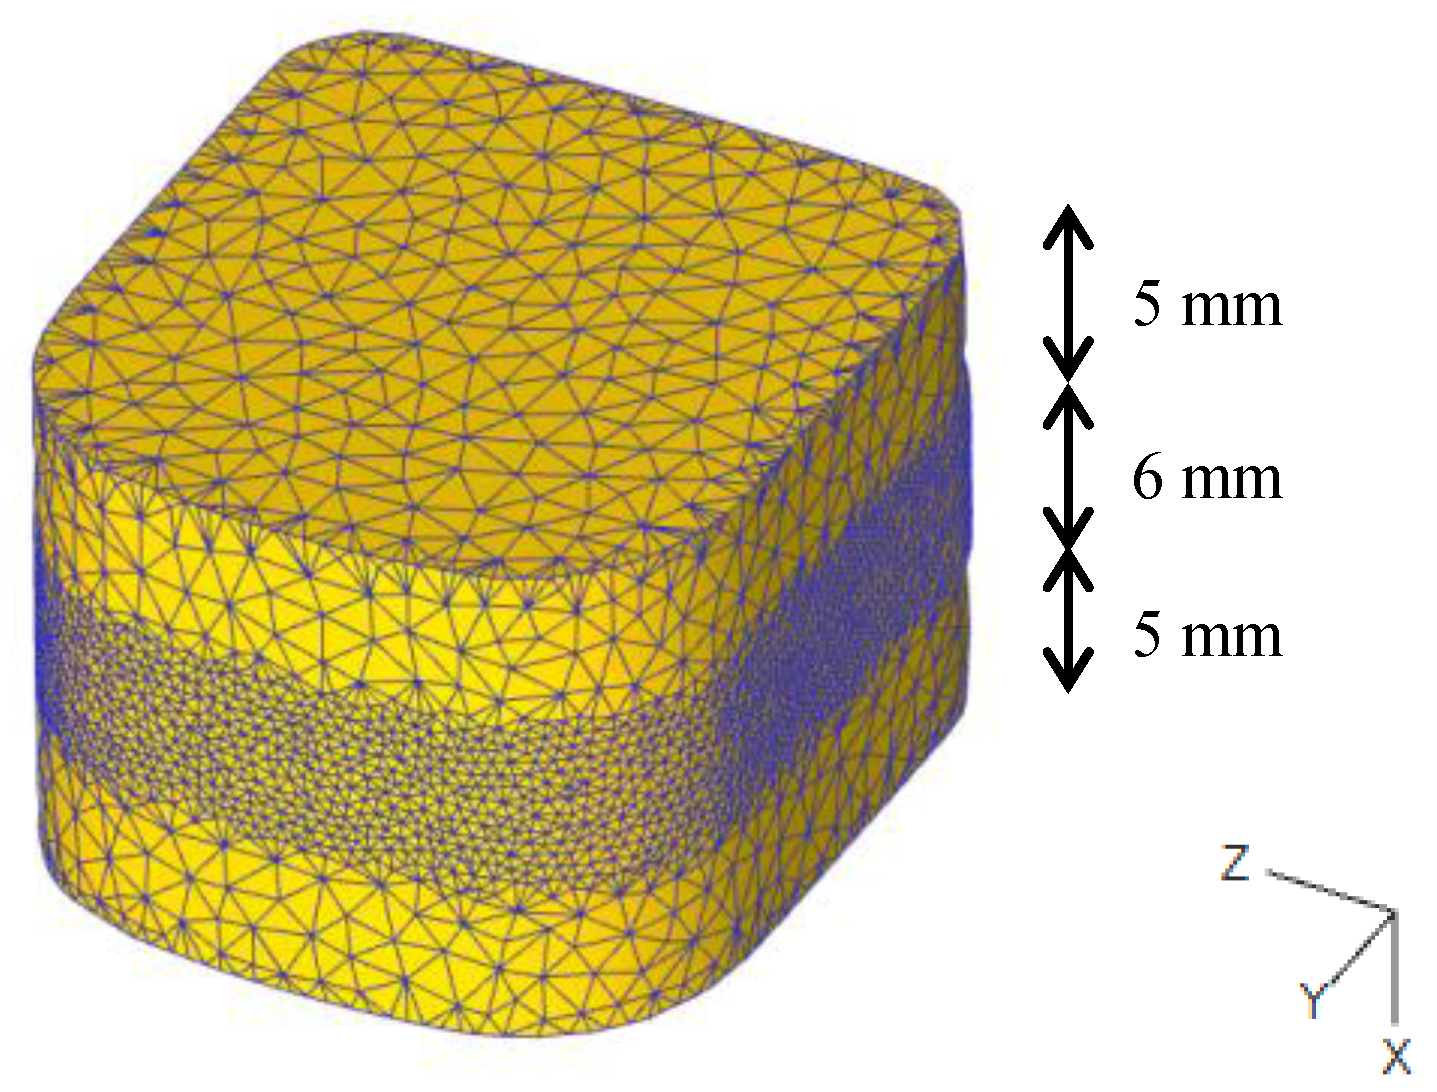
Figure 4.
Flow stress-strain curves for 30CrNiMo8 at 500 °C.

Figure 5.
Thermal conductivity and heat capacity (including transformation enthalpy) as a function of temperature.
Figure 5.
Thermal conductivity and heat capacity (including transformation enthalpy) as a function of temperature.

Figure 6.
Developed 3D thermal model showing: (a) transient heat flux for the initial phase; (b) the heat flux profile; and (c) the thermal profile generated at the end of the initial phase.
Figure 6.
Developed 3D thermal model showing: (a) transient heat flux for the initial phase; (b) the heat flux profile; and (c) the thermal profile generated at the end of the initial phase.
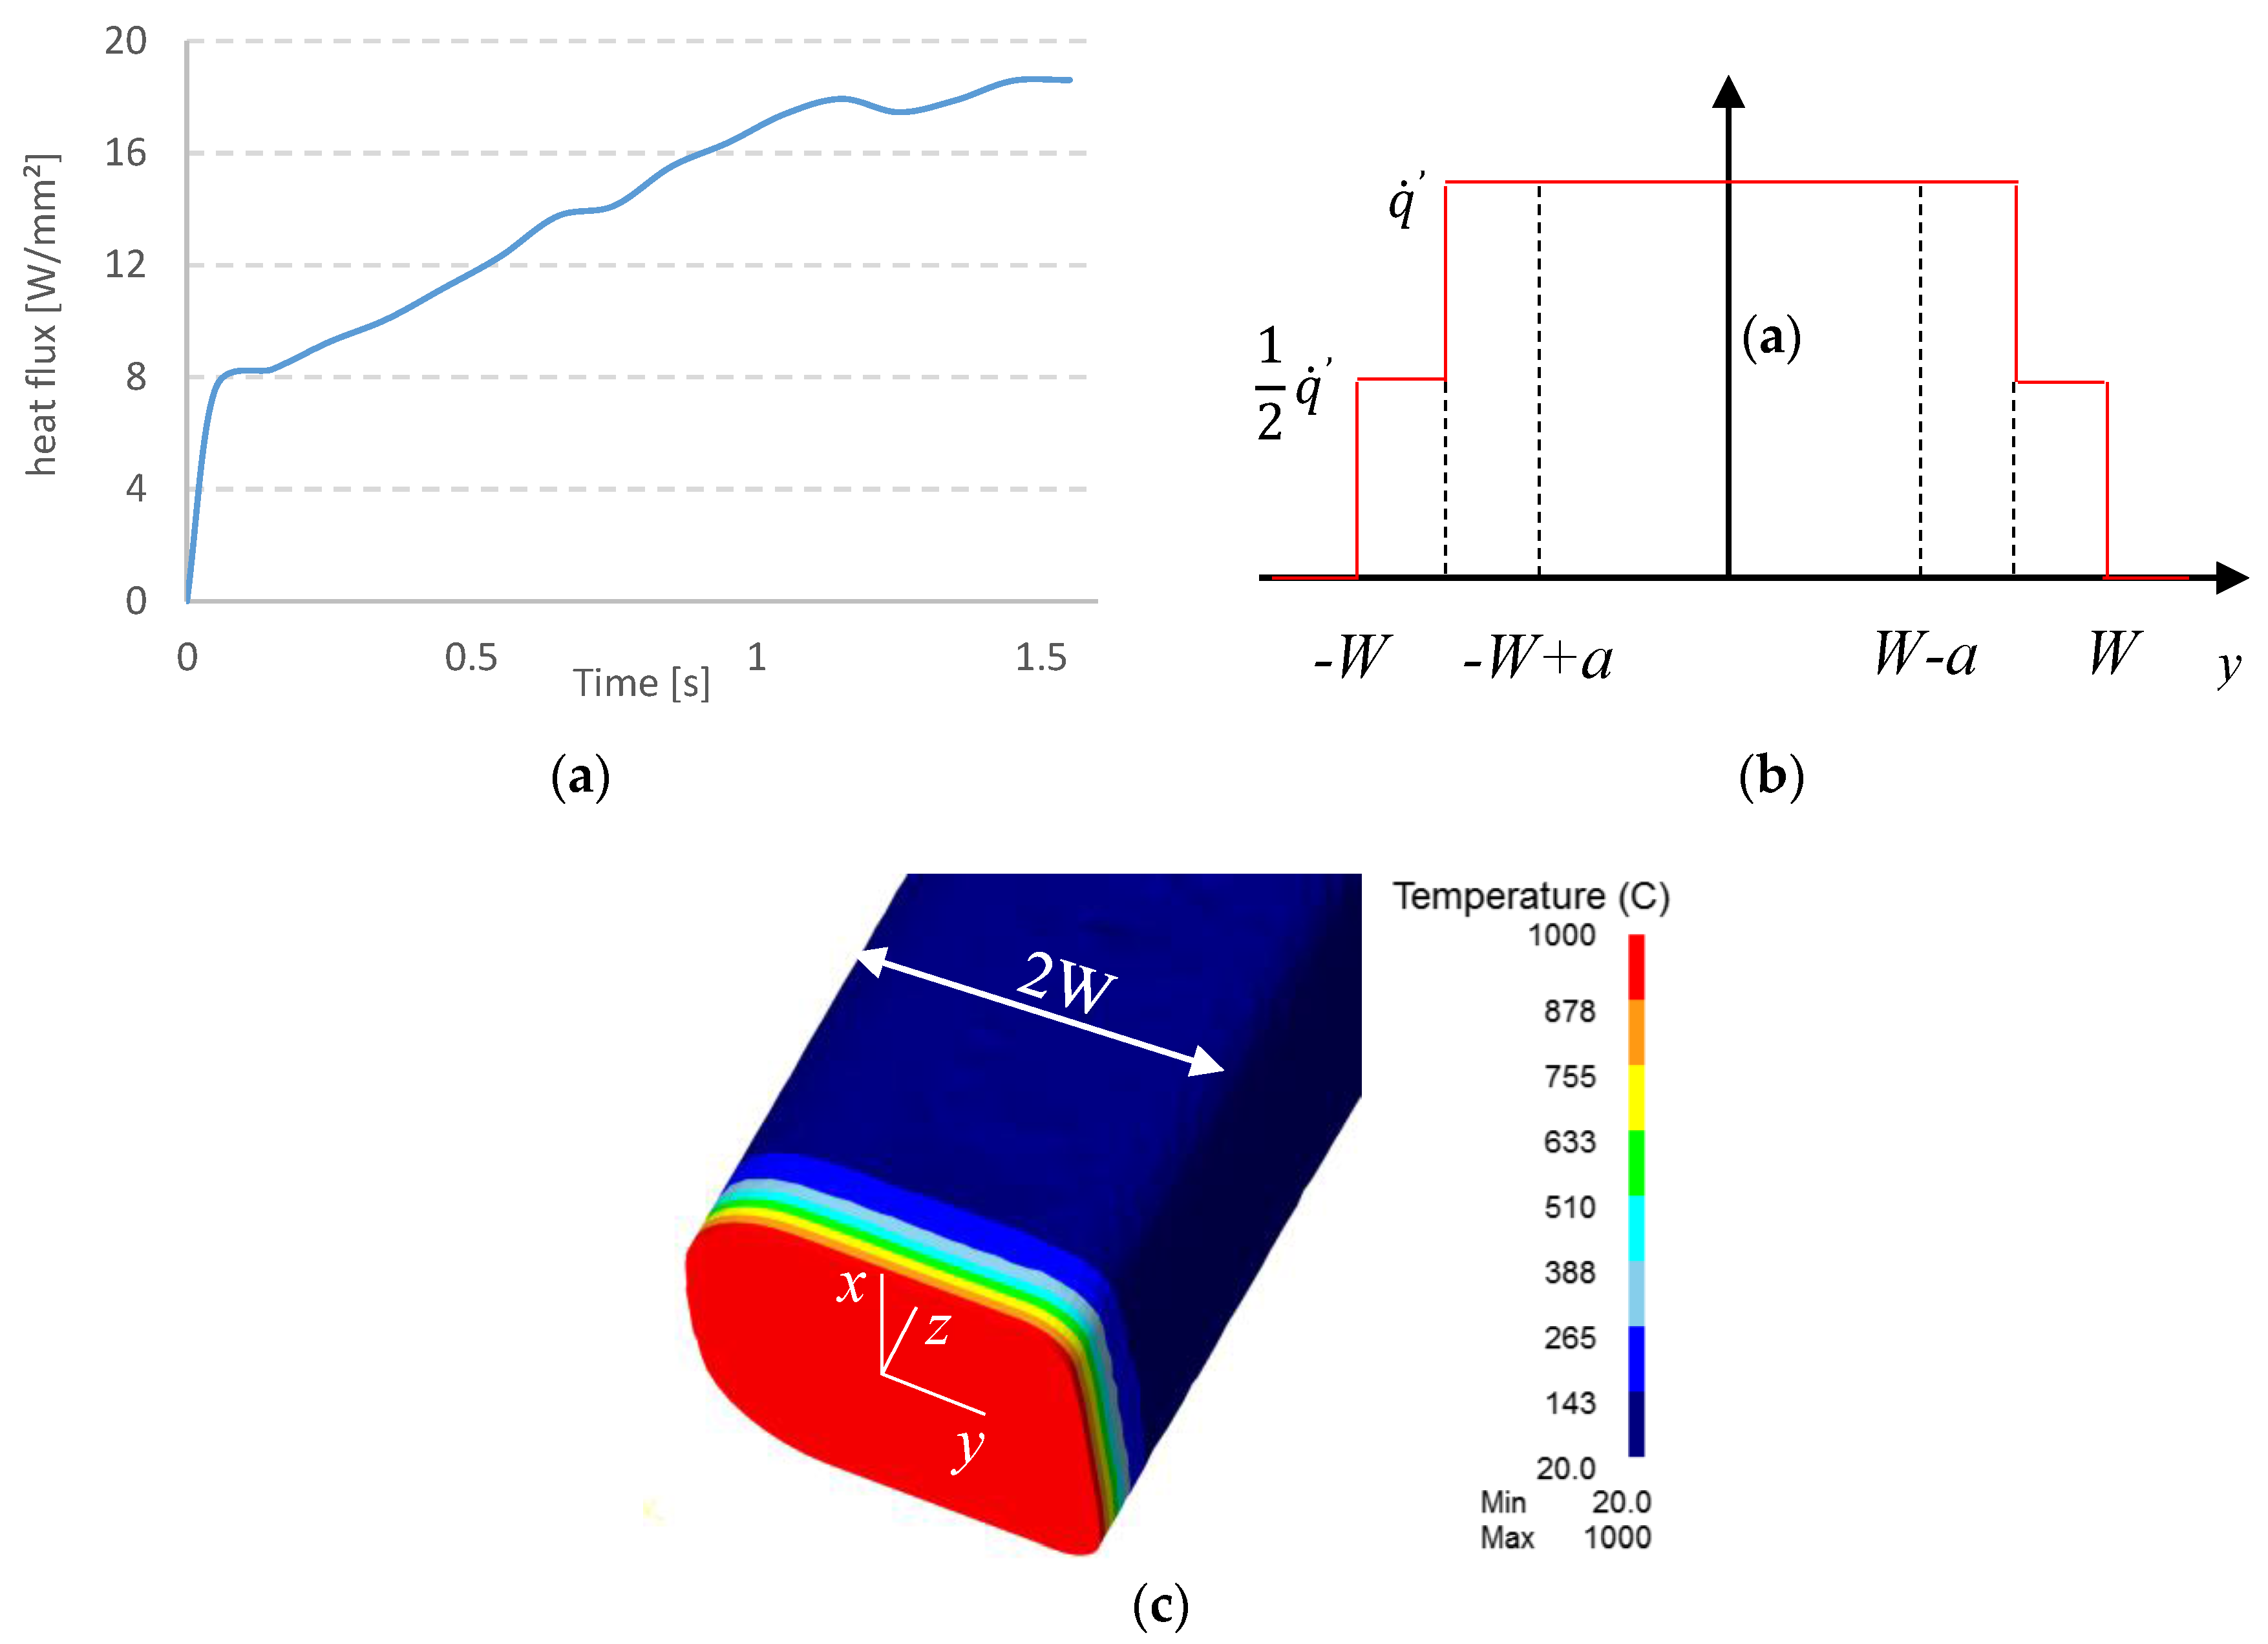
Figure 7.
Plastic flow model showing the plastic workpiece with a mapped thermal profile and rigid displacement tools, with the oscillating and burn-off movements prescribed to the upper and lower dies, respectively.
Figure 7.
Plastic flow model showing the plastic workpiece with a mapped thermal profile and rigid displacement tools, with the oscillating and burn-off movements prescribed to the upper and lower dies, respectively.
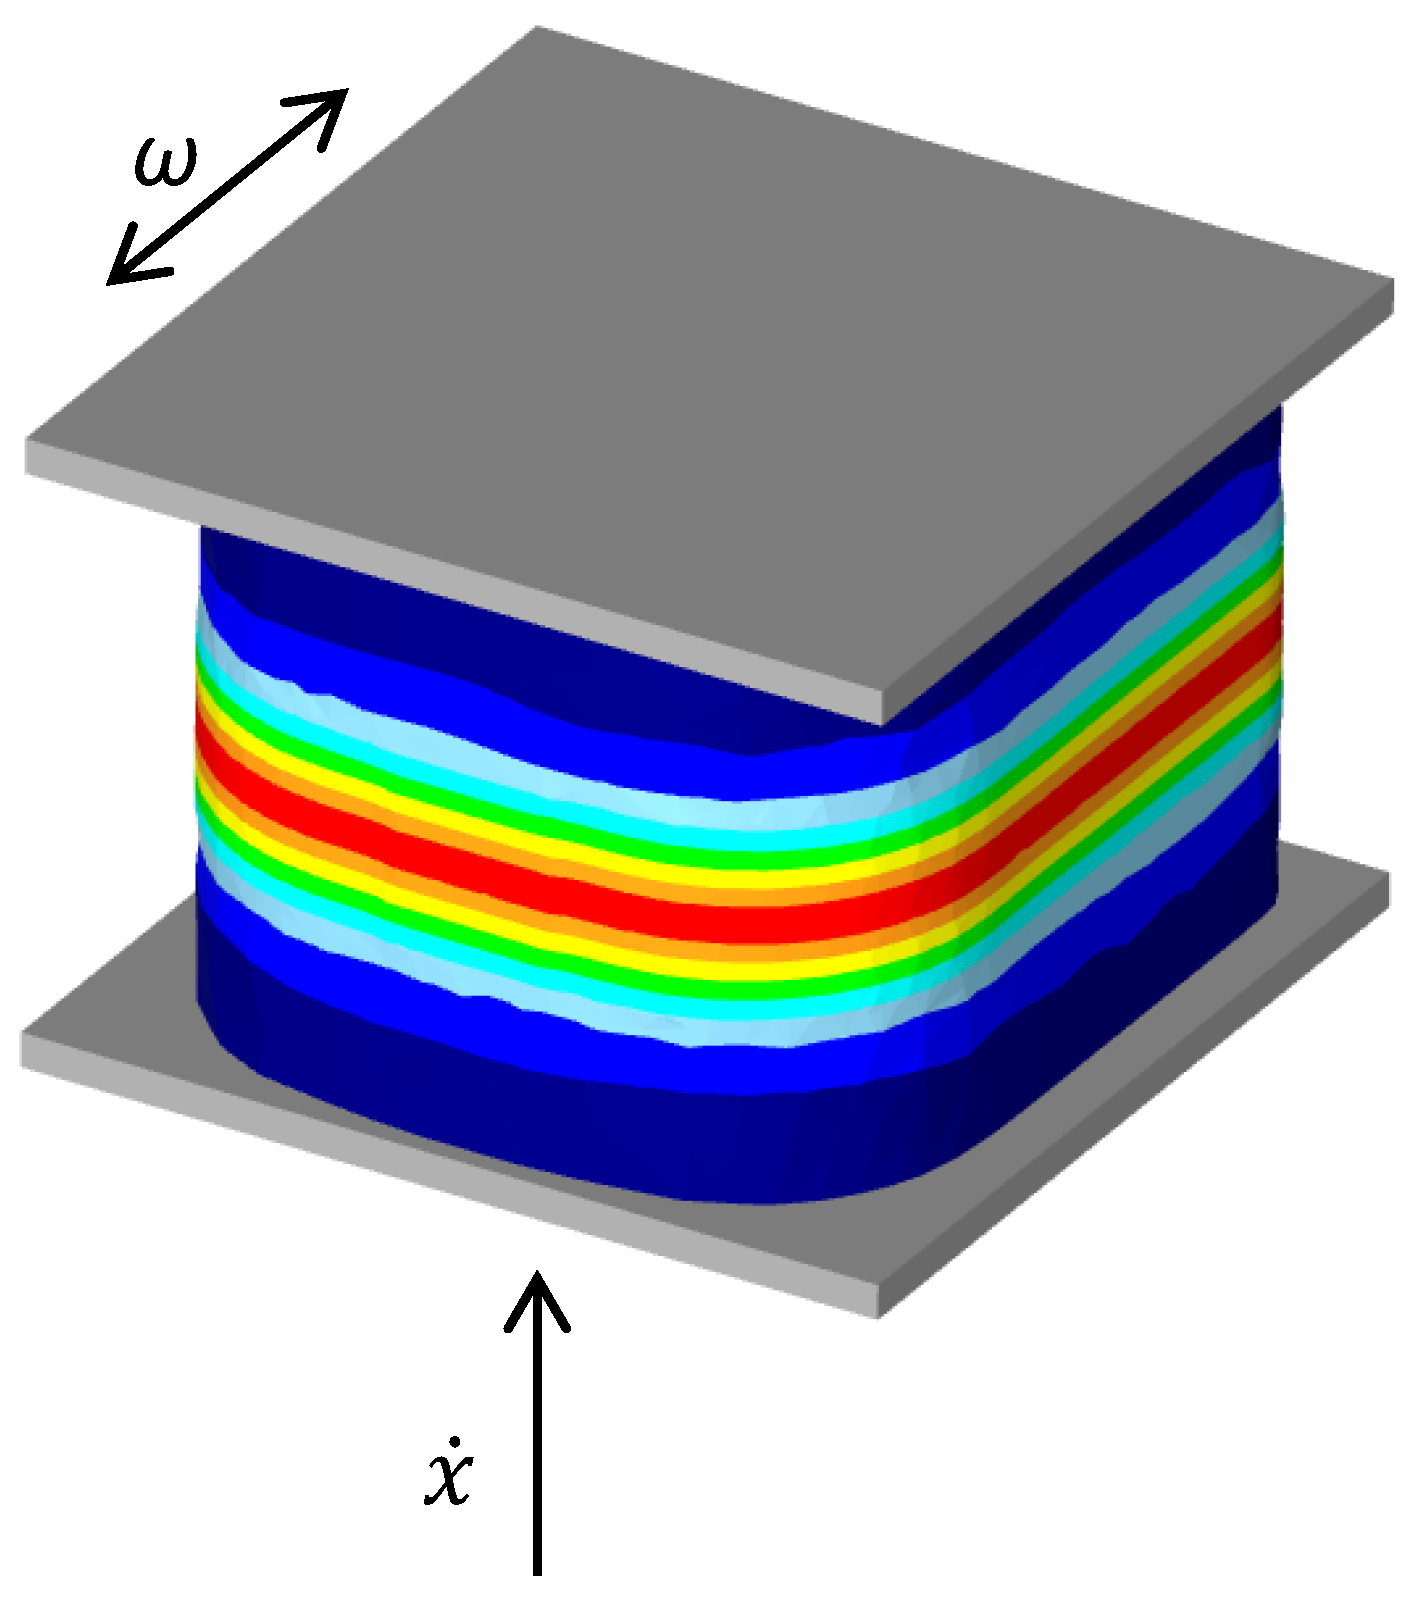
Figure 8.
Thermal histories for three evaluated locations at t = 0 s, t = 0.25 s, t = 0.5 s, t = 0.75 s, t = 1 s, and t = 1.25 s, where the solid line and dashed line express the results for the moving and stationary parts, respectively; and experimental flash of the evaluated regions: (a) negative y-direction; (b) z-direction; and (c) positive y-direction.

Figure 9.
Appearance of the formed flash through different time steps: (a) t = 0.15 s; (b) t = 0.35 s; (c) t = 0.5 s; and (d) t = 0.75 s. ‘S’ and ‘M’ denote the stationary and moving components, respectively.
Figure 9.
Appearance of the formed flash through different time steps: (a) t = 0.15 s; (b) t = 0.35 s; (c) t = 0.5 s; and (d) t = 0.75 s. ‘S’ and ‘M’ denote the stationary and moving components, respectively.

Figure 10.
Finite element analysis (FEA) appearance of the partial unbonding at the interface.

© 2017 by the authors. Licensee MDPI, Basel, Switzerland. This article is an open access article distributed under the terms and conditions of the Creative Commons Attribution (CC BY) license (http://creativecommons.org/licenses/by/4.0/).
Share and Cite
MDPI and ACS Style
Effertz, P.; Fuchs, F.; Enzinger, N. 3D Modelling of Flash Formation in Linear Friction Welded 30CrNiMo8 Steel Chain. Metals 2017, 7, 449. https://doi.org/10.3390/met7100449
AMA Style
Effertz P, Fuchs F, Enzinger N. 3D Modelling of Flash Formation in Linear Friction Welded 30CrNiMo8 Steel Chain. Metals. 2017; 7(10):449. https://doi.org/10.3390/met7100449
Chicago/Turabian StyleEffertz, Pedro, Franz Fuchs, and Norbert Enzinger. 2017. "3D Modelling of Flash Formation in Linear Friction Welded 30CrNiMo8 Steel Chain" Metals 7, no. 10: 449. https://doi.org/10.3390/met7100449
Note that from the first issue of 2016, this journal uses article numbers instead of page numbers. See further details here.