Article

Characterization of Powder Metallurgy Processed Pure Magnesium Materials for Biomedical Applications

1
Materials Research Centre, Faculty of Chemistry, Brno University of Technology, Purkyňova 464/118, 61200 Brno, Czech Republic
2
Institute of Materials Science and Engineering, Faculty of Mechanical Engineering, Brno University of Technology, Technická 2896/2, 61669 Brno, Czech Republic
3
Institute of Physics of Materials, Academy of Sciences of the Czech Republic, Žižkova 22, 61662 Brno, Czech Republic
*
Author to whom correspondence should be addressed.
Metals 2017, 7(11), 461; https://doi.org/10.3390/met7110461
Submission received: 14 September 2017 / Revised: 23 October 2017 / Accepted: 24 October 2017 / Published: 31 October 2017
(This article belongs to the Special Issue Biodegradable Metals)

Abstract

:
Magnesium with its mechanical properties and nontoxicity is predetermined as a material for biomedical applications; however, its high reactivity is a limiting factor for its usage. Powder metallurgy is one of the promising methods for the enhancement of material mechanical properties and, due to the introduced plastic deformation, can also have a positive influence on corrosion resistance. Pure magnesium samples were prepared via powder metallurgy. Compacting pressures from 100 MPa to 500 MPa were used for samples’ preparation at room temperature and elevated temperatures. The microstructure of the obtained compacts was analyzed in terms of microscopy. The three-point bendisng test and microhardness testing were adopted to define the compacts’ mechanical properties, discussing the results with respect to fractographic analysis. Electrochemical corrosion properties analyzed with electrochemical impedance spectroscopy carried out in HBSS (Hank’s Balanced Salt Solution) and enriched HBSS were correlated with the metallographic analysis of the corrosion process. Cold compacted materials were very brittle with low strength (up to 50 MPa) and microhardness (up to 50 HV (load: 0.025 kg)) and degraded rapidly in both solutions. Hot pressed materials yielded much higher strength (up to 250 MPa) and microhardness (up to 65 HV (load: 0.025 kg)), and the electrochemical characteristics were significantly better when compared to the cold compacted samples. Temperatures of 300 °C and 400 °C and high compacting pressures from 300 MPa to 500 MPa had a positive influence on material bonding, mechanical and electrochemical properties. A compacting temperature of 500 °C had a detrimental effect on material compaction when using pressure above 200 MPa.

1. Introduction

Magnesium and its alloys are modern lightweight materials applicable in a wide range of industrial fields from aerospace and automotive to biomedical applications. Its main advantages are a good strength to weight ratio and biocompatibility in combination with biodegradability. However, due to the high reactivity of pure Mg and the mechanical properties, not really sufficient for engineering applications, mainly magnesium alloys are used [1,2,3,4].
Good mechanical properties of magnesium and its alloys can be furthermore significantly upgraded by decreasing the grain size, nowadays performed mainly via severe plastic deformation (SPD) techniques [3,5], powder metallurgy (PM) processing [1,2,6,7] or by a combination of both methods. Decreasing the metallic grain size within the material volume, either by alloying elements, SPD methods, such as extrusion, equal channel angular pressing (ECAP) and high-pressure torsion (HPT) or PM, leads to increase of hardness, tensile and yield strength, but the plasticity of the material was shown to be decreased [6,7,8,9,10].
PM processing of magnesium is influenced by its high affinity to oxygen, which results in the formation of a thermodynamically-stable layer of corrosion products on the magnesium powder particles’ surface. The created layer dramatically inhibits the diffusion processes required for material densification during PM processing [4]. Because of the high affinity of magnesium to oxygen, a protective atmosphere (usually argon or nitrogen) has to be used for handling of magnesium powders and specimens, as well as for subsequent sintering [4].
Applying high pressures at elevated temperatures (hot pressing) to process magnesium results in high plastic deformation of powder particles. Powder particles’ deformation leads to cracking of the layer of corrosion products normally present on the powder particles’ surface [11,12,13]. The applied plastic deformation results in an increase of the contact area of powder particles and, in combination with the applied temperature, enhances the diffusion processes. Increasing compacting pressures usually also lead to a decrease in the porosity of the processed bulk material [11,12,13]. The porosity of the processed bulk material is usually considered as a disadvantage of the PM processing techniques. However, the porous biocompatible material can be incorporated well into the tissue and can degrade at a specific rate, which provides a tool for the tailoring properties of PM processed materials for biomedical applications [14,15]. The functional porosity of a PM processed magnesium-based implant would support the primary fixation and the degradation of the implant by enabling the ingrowth of bone cells (osteointegration) into the degrading implant. Furthermore, the corrosion products of magnesium, created during implant biodegradation, support osteoconductivity of the bone [4].
Changes in porosity also have a significant effect on corrosion resistance and corrosion attack progression within the material volume. Highly porous materials corrode very rapidly, as a larger area of the material surface is exposed to the corrosion environment. Corrosion resistance of either pure magnesium or magnesium alloys is seldom suitable for technical applications or even biomedical applications [3,9,16,17,18,19,20]. Magnesium corrosion resistance can be improved by alloying the metal with aluminum, zinc or rare earth metal elements; however, for significantly better corrosion resistance, another way of reducing the degradation rate must be considered. Conversion coatings are widely studied as corrosion protection for magnesium and its alloys. Fluoride and calcium phosphate-based conversion coatings have a great potential of reducing the corrosion rate of biomedical magnesium implants [1,2,3,4,12,13,14,15,16,17,18,19,20,21,22,23,24].
Electrochemical characterization of PM magnesium materials is commonly carried out either in NaCl solution or in Hank's Balanced Salt Solution (HBSS) or enriched HBSS [21,25,26,27,28,29]. Electrochemical impedance spectroscopy (EIS) measurements provide complex information of the material degradation characteristics during exposure in corrosion medium in time. From the chemical point of view, several specific reactions can occur in HBSS and enriched HBSS medium due to the additional content of several ions when compared to NaCl solution [30].
The properties of pure magnesium materials prepared via PM methods are seldom studied [15,27,31,32,33] or the studies refer to wrought pure magnesium materials [5]. Most of the available studies characterize the PM processed pure magnesium and magnesium-based materials in terms of mechanical and corrosion properties; however, the analyses are focused on the influence of the material porosity due to its possible use for biomedical applications in the form of the porous implants.
Porous magnesium samples with different porosity (due to the addition of an ammonium bicarbonate powder) structures and mechanical properties were analyzed in [31]. Magnesium powder samples with different porosities, due to the spacer addition, were prepared by uniaxial cold pressing (265 MPa) with additional heat treatment (for removal of hexane and sintering at 550 °C for 6 h). In the case of pure magnesium compacts, the porosity of 12 vol % corresponded to a flexural strength of 38 MPa. The increase of the compacts’ porosity was observed to be accompanied by the mechanical properties’ decrease (the porosity of 38 vol % corresponded to the flexural strength of 4.4 MPa). The negative influence of the porosity was observed also in the case of material immersion into 9 g/L NaCl solution.
The same authors studied also the influence of the purity of the argon atmosphere on final PM processed magnesium-based material properties in [32], varying the sintering times as 0 h, 3 h, 6 h, 12 h and 24 h. While the samples prepared using technical Ar reached similar porosities in the sintering time range, the porosity of the samples prepared using gettered Ar was observed to decrease with increasing sintering time. Under a gettered Ar atmosphere, a prolonged sintering time enhanced diffusion connections between magnesium particles and improved the mechanical properties of the samples (flexural strength of 9 MPa for 3 h and 115.4 MPa for 24 h), whereas under a technical Ar atmosphere (flexural strength of 5 MPa for 3 h and 3.4 MPa for 24 h), oxidation at the particle surfaces caused deterioration in the mechanical properties of the samples.
Mechanical properties and corrosion resistance of cold pressed magnesium (310 MPa) and extruded at 420 °C employing an extrusion ratio of 16:1 were studied in [24]. Processed material reached the ultimate tensile strength of 320 MPa, a yield stress of 280 MPa and 2% ductility. The reached values were higher when compared to a coarse-grained cast AZ31 magnesium alloy, except material ductility. PM processed pure magnesium mechanical properties were superior to those of cast pure magnesium as provided by the authors. Silane film and anticorrosive paint were shown to enhance the corrosion behavior of PM magnesium during the first hours of immersion, but their protection effectiveness completely disappears after two days. For longer immersion times, the fluoride conversion coating prepared in HF solution was shown to be an effective barrier to protect PM magnesium from degradation.
Pre-rolling of magnesium powder prior to spark plasma sintering and hot extrusion was used for material grain refinement in [6]. The grain size obtained for the material extruded from the powders after 5 and 10 rolling pre-treatments decreased from 9.2 µm (only extruded Mg) to 2.9 µm and 2.1 µm, respectively. The grain refinement resulted in an ultimate tensile strength increase from 242 MPa for extruded pure magnesium to a value of 270.6 MPa for material extruded after sintering of 10 times pre-rolled powder. Yield stress was improved from 170 MPa to 206.4 MPa by the pre-rolling of powder.
The aim of this study is to evaluate the microstructural, mechanical and electrochemical properties of pure magnesium-based PM processed materials when varying the processing parameters. Materials were prepared via hot pressing at temperatures of 300 °C, 400 °C and 500 °C applying pressures of 100 MPa, 200 MPa, 300 MPa, 400 MPa and 500 MPa. For comparison, cold compacted materials prepared under the same compaction pressures were analyzed in the same manner. The mechanical properties of compacts were analyzed in terms of the three-point bending test containing fractographic analysis and with microhardness testing. Electrochemical corrosion characteristics of the processed materials in HBSS and enriched HBSS were analyzed using electrochemical impedance spectroscopy, and the data were extended by metallographic analysis of the corrosion attack within the material volume.

2. Materials and Methods

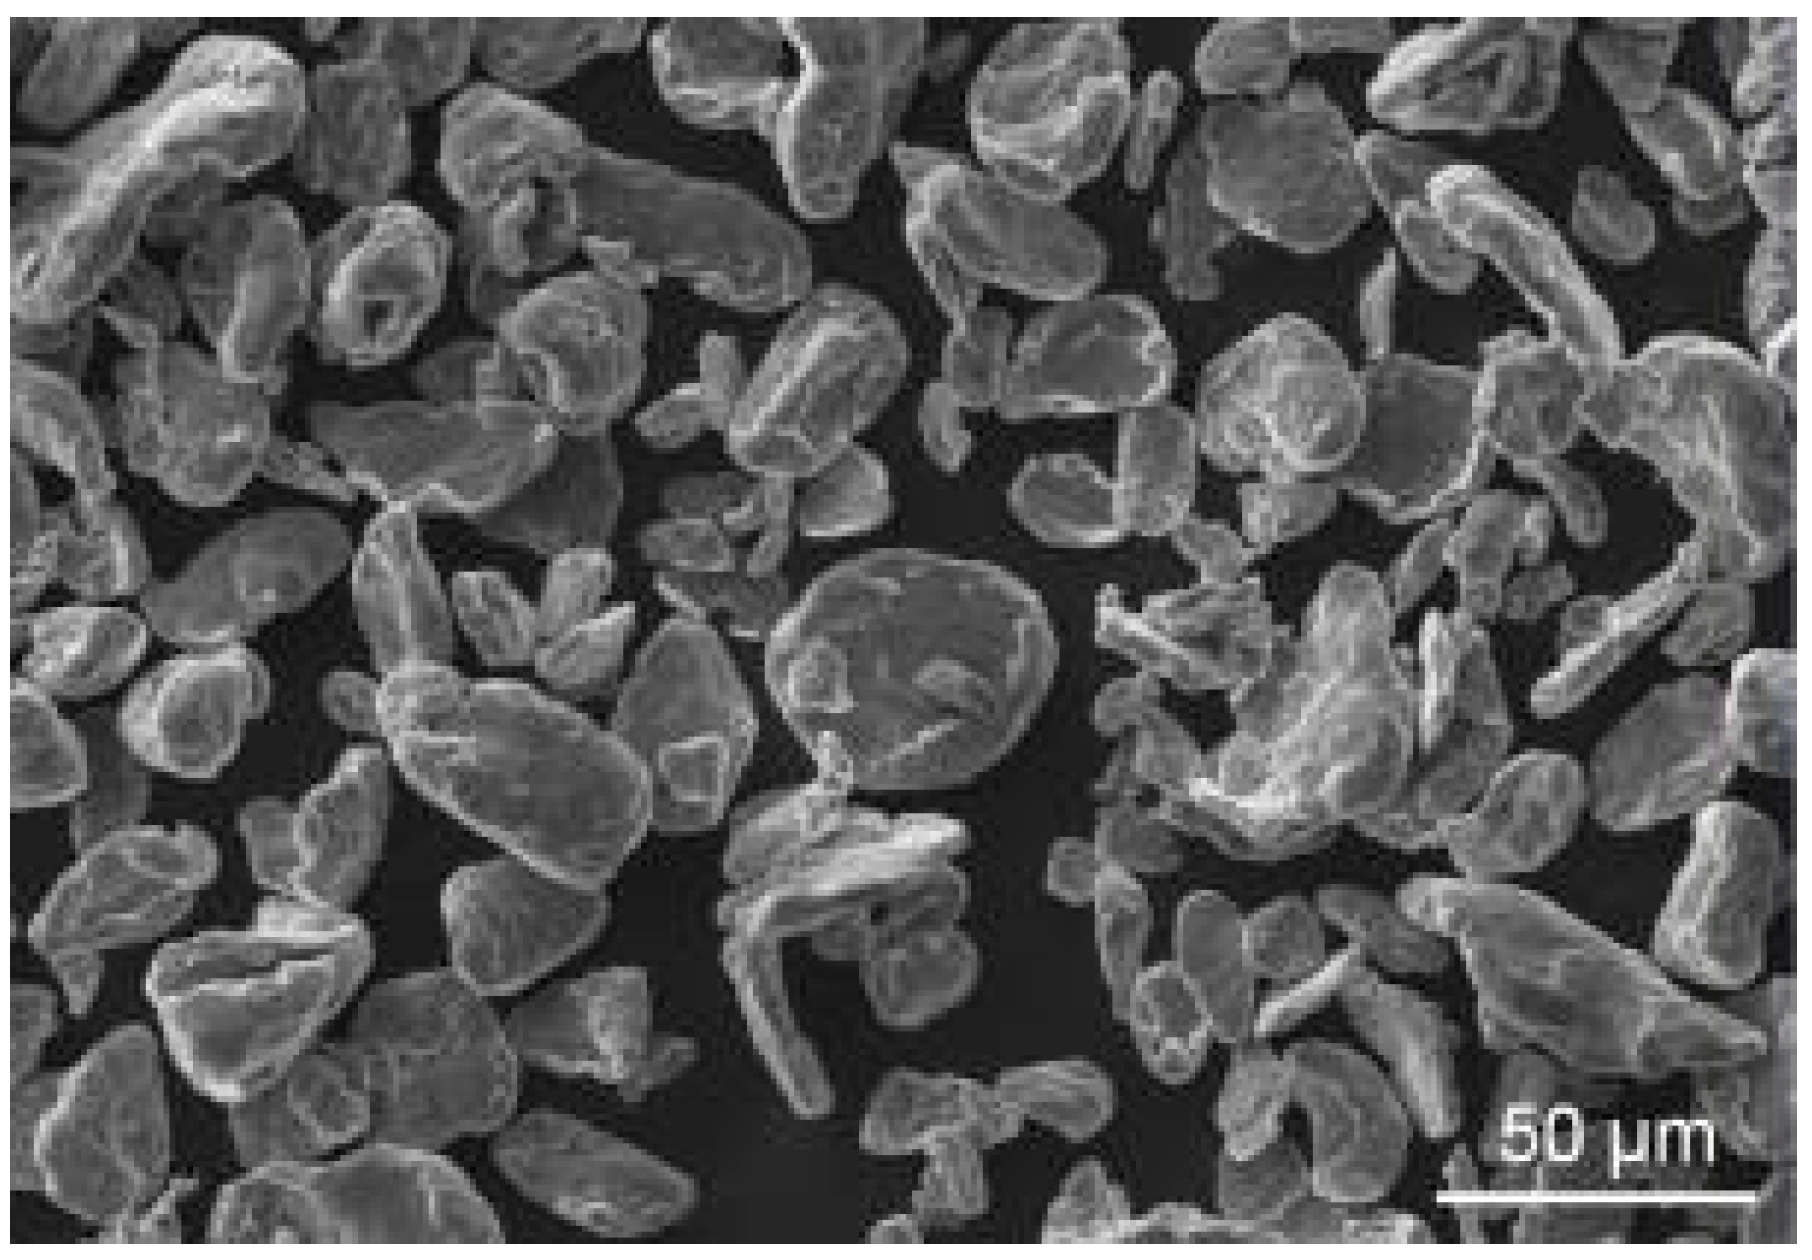
Magnesium powder used in this study (Figure 1) was irregularly shaped with an average particle size of approximately 30 µm. The purity of the base material was 99.8% as declared by supplier Goodfellow (Huntingdon, UK); however, an oxide layer was found on the surface of powder particles using the scanning electron microscope (SEM, ZEISS EVO LS 10, Carl Zeiss Ltd., Cambridge, UK) using energy dispersive spectroscopy (EDS, Oxford Instruments plc, Abingdon, UK). This layer is to be expected on the surface of magnesium, and it was probably presented on the particles from the powder preparation.
For metallographic and electrochemical analysis, cylindrical compacts of 5 mm in height and 20 mm in diameter were prepared using a steel die. The preparation of the magnesium powder into the steel die for compaction was carried out under a nitrogen atmosphere to avoid further oxygen contamination. Magnesium powder (2.7 g) inserted into the steel die was compacted into compacts applying different uniaxial pressures; 100 MPa, 200 MPa, 300 MPa, 400 MPa and 500 MPa. Compaction was carried out using the Zwick Z250 Allround-Line machine (Zwick GmbH&Co. KG in Germany, Ulm, Germany) at room temperature and at elevated temperatures of 300 °C, 400 °C and 500 °C for one hour.
The microstructure of prepared samples was studied on cross-sectional cuts using SEM (ZEISS EVO LS 10) and a light optical microscope (LM, Zeiss Axio Observer Z1m, Carl Zeiss AG, Oberkochen, Germany). The internal structure of the compacts and the created grain size were analyzed with the electron backscattered diffraction (EBSD) technique (SEM, Tescan LYRA 3 XMU FEG/SEMxFIB, TESCAN Brno, s.r.o., Brno, Czech Republic). The step size of the method was 0.3 µm. Samples’ cross-sections intended for metallographic analysis were mold into a polymeric resin at room temperature, ground and polished according to the standard procedures of metallographic samples’ preparation. To reveal the microstructure, a 5% Nital etchant (5% nitric acid in ethanol) was used for several seconds. Compacts’ porosity was estimated from calculated density (calculated from sample dimensions and weight) considering a density of cast pure magnesium as the 0 porosity standard.
Microhardness testing was conducted on cross-sections of prepared compacts using the LECO AMH LM 248 microhardness tester (LECO Corporation, Saint Joseph, MI, USA) according to the ISO 6507-1 standard. For all the measurement, 25 g of load and a 10-s dwell time were used. The three-point bending test was carried out on samples with dimensions of 4 mm in height, 4 mm in width and 18 mm in length cut from the compacts, according to the ISO 7438 standard. The test machine used for the three-point bending test was the Zwick Z020 (Zwick GmbH&Co. KG in Germany, Ulm, Germany); the radius of the supports and the point was 2.5 mm; the distance between supports was 16 mm; and the velocity of applied loading was 1 mm/min. The three-point bending test was performed on one sample for each material preparation method.
Potentiostatic electrochemical impedance spectroscopy (EIS) was used as a method for the characterization of the prepared magnesium samples’ electrochemical corrosion characteristics. The three electrode cell system was used for the measurement with the Pt electrode as the counter electrode and the calomel electrode as the reference electrode, and the sample (1 cm2 exposed area) served as the working electrode. With the aim to remove a layer of corrosion products created on the compacts’ surface, each sample was ground using 4000 SiC paper and rinsed with isopropanol just before the measurement. Measurements were carried out in HBSS and enriched HBSS (containing Mg2+ and Ca2+ ions). The composition of the used solutions is given in Table 1. The frequency used for the measurements was in the range from 100 kHz to 10 MHz, with the signal amplitude of 10 mV. All the measurements were carried out at laboratory temperature. EIS data were obtained after 5 min, 1 h, 2 h, 4 h, 8 h, 12 h, 24 h, 48 h, 72 h and 96 h of immersion. Each measurement time was 25.8 min. Due to the open porosity of the cold pressed samples, only cold pressed samples prepared under 500 MPa compacting pressure were used for the electrochemical corrosion characterization. In the case of hot pressing, samples prepared under 100 MPa and 500 MPa prepared at 400 °C were used for EIS measurements with the aim to reveal differences in material electrochemical corrosion behavior according to the processing conditions. Each material type was characterized by measurements performed on three samples.

3. Results

3.1. Microstructure Characterization

The microstructure of the selected samples of pure magnesium compacts and details showing characteristic features of the material are presented in Figure 2. Microstructural analysis revealed that with increasing compaction pressure, the deformation of the powder particle increased and the porosity decreased. This trend was apparent in all the prepared samples compacted at elevated and room temperature.
A significant change in porosity is visible when cold pressed (Figure 2a,b) and hot pressed materials (Figure 2c,d) prepared under compacting pressure of 100 MPa are compared. In cold compacted material, the porosity is open, and metallographic resin used for the sample molding is present in the microstructure (arrows in Figure 2a,b). The hot pressed sample contained also some pores in the microstructure (Figure 2e); however, they were much smaller when compared to the cold pressed sample (Figure 2a). Only the oxide layer present on the powder particles’ surface can be seen in Figure 2f; no metallographic resin is observed in the pores. Hot pressing under 500 MPa at 400 °C led to a further decrease in porosity (Figure 2g,h).
Applying higher pressures during sample preparation led to a significant decrease of porosity in the cold compacted samples, as well as in the hot pressed samples. The level of deformation of the powder particles increased with increasing the compacting pressure. However, the change was observed to be increasing from 100 MPa up to 300 MPa compacting pressures, while the shape and the level of deformation of the powder particles in the case of cold and hot pressed samples did not change for compacting pressures from 300 MPa to 500 MPa. The size of metallic grains within the powder particles was impossible to calculate using light microscopy (Figure 2). Electron backscattered diffraction was therefore applied to reveal the basic metallic structure of the samples (Figure 3).
The main difference in the microstructure between cold and hot pressed samples applying higher pressures than 300 MPa was revealed by EBSD. In Figure 3, EBSD maps of cold compacted and hot pressed (400 °C, 1 h) samples prepared under 400 MPa are shown. In the case of the cold compacted sample, very fine grains were created in the powder particle during the material compaction (Figure 3a,b). However, the material on the powder particles’ interface was not identified by EBSD, which indicates that the powder particles are not diffusion bonded. Larger grains were created in the magnesium powder particles compacted at 400 °C (Figure 3c,d). The observed metallic grains are connected to the metallic grains created in the neighboring powder particles, which indicates the good connection of the material structure and promotes powder particles’ bonding.

3.2. Mechanical Characterization

3.2.1. Three-Point Bending Test and Microhardness Test Results

Three-point bending test revealed an increasing trend of flexural strength of prepared materials corresponding to the increasing samples’ compacting pressure (Figure 4a). The highest flexural strength was obtained for hot pressed samples compacted at 400 °C. Samples prepared at 300 °C followed the same trend as the samples prepared at 400 °C; however, the flexural strength was lower (Figure 4a). Hot pressing magnesium powder at 500 °C resulted in lower values of flexural strength compared to lower compaction temperatures (except RT (room temperature)). Furthermore, during the preparation of the samples pressed under 400 MPa at 500 °C, deformation of the steel mold (used for sample preparation) occurred; therefore, the samples’ preparation was not possible. The cold pressed samples’ test results show significantly lower values of flexural strength compared to the hot pressed samples. Except the flexural strength measured on hot pressed samples prepared under 500 MPa, the value of flexural strength was observed to increase with increasing compaction pressure.
Microhardness test results revealed a significant difference between cold and hot pressed samples (Figure 4b). The increase of the microhardness corresponding to the increasing compaction pressure was observed for cold compacted and hot pressed samples prepared at 300 °C and 400 °C (Figure 4b), while the identical trend of microhardness evolution was observed for both hot pressed materials. The influence of compaction pressure on the microhardness was more pronounced for cold compacted samples, however, higher values of microhardness were characteristic for hot pressed samples. A specific situation was observed in the case of hot pressed samples prepared at 500 °C, where the primary microhardness increase observed when increasing compaction pressure from 100 MPa to 200 MPa was followed by a decrease of the microhardness for samples prepared under 300 MPa (Figure 4b).

3.2.2. Fractographic Analysis

Fracture surfaces of samples broken during the three-point bending test were analyzed in the region where tensile loading was applied. The fractographic analysis revealed differences between cold compacted and hot pressed materials (Figure 5).
Cold compacted materials’ fracture surfaces exhibited only trans-granular failure regardless of the applied compaction pressure. Different applied compacting pressure resulted only in differences of deformation of the powder particles present on the fracture surface (Figure 5a,b). Samples compacted under 100 MPa revealed only minimal plastic deformation of the powder particles, and the fracture surface exhibited a quite large amount of secondary cracks following magnesium powder particles’ boundaries (Figure 5a). Samples compacted under higher pressures (300 MPa and higher) exhibited significant plastic deformation of powder particles and a smaller amount of secondary cracks compared to the low pressure compacted samples, as was observed on the samples’ fracture surfaces (Figure 5b).
Hot pressed samples contained significantly deformed powder particles, and only trans-granular failure was observed for samples compacted under lower pressures (100 MPa and 200 MPa) (Figure 5c). With the increase of the compaction pressure in the case of hot pressed samples, also the inter-granular failure of the powder particles was observed on the samples’ fracture surfaces (Figure 5d, marked with an arrow).

3.3. Electrochemical Characterization

The corrosion resistance of the studied materials was evaluated by EIS. As the corrosion medium, HBSS and enriched HBSS (containing Mg2+ and Ca2+ ions) were used (the composition is given in Table 1). Based on the obtained data represented by Nyquist plots, three equivalent circuits (EC) shown in Figure 6 were used for the data analysis and determination of materials’ electrochemical corrosion characteristics.
The EC given in Figure 6a was used for the description of the behavior of materials exhibiting two capacitive loops on the Nyquist plot. One capacitance loop was obtained for high frequencies and the second capacitance loop for low frequencies. Two capacitance loops characterize the response of the material by the creation of a layer of corrosion products on its surface. The EC in the Figure 6a can be from the electrochemical point of view explained as the simple electrical response of the damaged (porous and cracked) layer of corrosion products created on the metal surface to the corrosion environment (partially blocked electrode [33]). Damage of the layer can be understood for example as cracks in the layer created due to its porous nature and thickness increasing due to the material response to the corrosion environment, while some parts of the damaged layer can be removed from the material surface, and the metallic surface can be revealed to the corrosion environment again. EC presented in Figure 6a consists of elements representing solution resistance R1; Q2 is a constant phase element (CPE), which is a component modeling the behavior of the present corrosion products (taking into account its porous origin and its damage); R2 represents the resistance of the corrosion products’ layer against the solution including the resistance of the corrosion products and resistance of the material against the solution penetrating through the corrosion products’ layer damaged areas and pores; Q3 is a constant phase element (CPE), which is a component modeling the behavior of the interface between the solution and metal surface including the influence of the damaged layer of corrosion products, and R3 is the resistance of the material against the solution (charge transfer in the double layer).
The resulting polarization resistance Rp of this model can be calculated according to the Equation (1):
R p = R 2 + R 3
EC including an inductive element is shown in Figure 6b. The model was used for the evaluation of the Nyquist plots containing one high-frequency capacitance loop and one low-frequency inductive loop. The element R1 represents solution resistance; Q2 represents double layer capacitance expressed by the CPE element; R2 is the resistance against the charge transfer of the solution and the created layer of corrosion products; L3 is inductance connected with the negative difference effect (NDE) caused in the case of magnesium by adsorption of H+, Mg+ [30]; and R3 is the resistance of this inductive element and also the resistance of charge transfer on the sample surface. The resulting polarization resistance Rp value of this model is given by Equation (2):
1 R p = 1 R 2 + 1 R 3
In the case of Nyquist plots consisting of the high-frequency capacitance loop, medium frequency capacitance loop and low-frequency inductive loop, an EC shown in the Figure 6c was used for the data analysis. In this case, the creation of the layer of corrosion products (porous in its nature) on the material surface accompanied with additional creation of the secondary layer (outer) of corrosion products on its surface closing the pores in the primary (inner) layer is assumed. The element R1 represents the solution resistance; Q2 can be connected with the outer layer of corrosion products; R2 is the resistance against charge transfer of the outer layer; Q3 represents the capacitance between the outer and inner porous layer of corrosion products; R3 is the resistance against charge transfer between the outer and inner porous layers of corrosion products; L4 is inductance equivalent to the response of the adsorbate species on the sample surface due to the NDE; and R4 is resistance against the charge transfer of interfacial reaction on the sample surface (resistance caused by adsorbed species on the metal surface). The final Rp in the model is given by Equation (3):
R p = R 2 + R 3 · R 4 R 3 + R 4

3.3.1. EIS Measured in HBSS

The EIS spectra for cold compacted samples measured in HBSS medium in the form of Nyquist plots are shown in Figure 7a, and data obtained by fitting the plots are given in Table 2. The plots contain three loops including an inductive one. Based on the obtained plots’ character assuming the same material response to HBSS in time, the EC model shown in Figure 6c was used for the electrochemical corrosion characteristics’ determination. Measurement of the cold compacted sample was stopped after 12 h due to the fatal corrosion damage of the samples. The very low capacitance response between the layer of corrosion products and compacts was observed at the beginning of the exposure of the samples to the corrosion environment. This could be explained by difficulties in the creation of a coherent layer of corrosion products on the sample’s surface due to the high porosity of the cold compacted material. The values of Rp were only slowly increasing up to the end of the EIS measurements. The initial Rp value was determined as 109 Ω·cm2. An increase of Rp was observed with increasing the immersion time to 2 h; however, this increase was followed by a drop of Rp to a value comparable with the initial polarization resistance. This drop was followed by a slow increase of the polarization resistance of cold compacted samples up to 252 Ω·cm2 obtained after 12 h. Changing values of n2 and n3, characterizing the stability of the created outer and inner layer of corrosion products on the sample surface indicate the non-uniformity of the layer. At the beginning of the measurement, the inner layer of corrosion products exhibited higher stability, and its higher contribution to the protectivity of the samples was changed in immersion times of 2 h and 4 h when the outer layer with higher stability could protect the material against the following corrosion attack. However, exceeding 4 h of exposure of the material to HBSS, the created layers exhibited only very low stability (expressed by coefficients n2 and n3) (Table 2).
The characteristic Nyquist plots for the hot pressed sample prepared under 100 MPa obtained with EIS in HBSS are shown in Figure 7b, and the data obtained after fitting of these curves applying adequate EC are shown in the Table 3. The initial and the last measured electrochemical response of the sample tested in HBSS (measurements at 0 and 12 h) correspond to behavior that can be described by the EC model given in Figure 6a. In other cases, three loops were characteristic for Nyquist plots, and the compacts’ behavior can be described with EC in Figure 6c. This type of electrical response includes also an inductive loop. The hot pressed 100 MPa powder compacts were measurable only within 12 h due to the high degradation of the material in HBSS. The Rp values rose from the beginning of the experiment (305 Ω·cm2) to the maximum value (627 Ω·cm2) obtained after 1 h of exposure of the material to HBSS. After 1 h of exposure, the Rp continuously decreased until the end of the experiment (251 Ω·cm2). The value of n2 characterizing the stability of the outer layer of corrosion products decreased with increasing the time of exposure of the compacts to the corrosion environment. Nevertheless, the value of n3 characterizing the inner porous layer of corrosion products (created in the areas of contact of the corrosion solution with the damaged primary created layer of corrosion products) was changing in the whole experiment time, indicating its reaction with the compacted material. However, the primary created layer exhibited good stability and could exhibit the protection of the material in the corrosion in times of 0 h, 4 h and 12 h of exposure (Table 3). However, the decreasing n3 values indicate the primary layer damage. Changing values of n2 and n3 characterize the stability of layers of corrosion products created on the material surface.
The Nyquist curves for hot pressed samples prepared under 500 MPa are shown in Figure 7c, and the data obtained after fitting of the curves are shown in Table 4. Only one type of electrochemical response was identified for all the measurements of the samples. The suitable EC model for material behavior analysis is shown in Figure 6b. The EC in Figure 6b is composed of two time-independent loops and contains one inductive loop. The inductive electrical response of the material to the HBSS was clear for the whole experiment time. The material polarization resistance Rp increased from the initial (396 Ω·cm2) measurement and reached the maximum value (892 Ω·cm2) at the measurement at 4 h of exposure. This initial increase of Rp was followed by a gradual decrease until 72 h of exposure (246 Ω·cm2). The last Rp value after 96 h of exposure was 261 Ω·cm2. The value of n2, in Table 4, indicates similar stability of the created layer of corrosion products on the material surface in the whole exposure time.
The comparison of the evolution of Rp of the studied samples in HBSS in time is shown in Figure 7d. In all the cases, an initial increase of Rp was observed; however, in the case of cold compacted and hot pressed material prepared under 100 MPa, this increase was observed only until 1 h of exposure. Cold pressed samples reached lower values of polarization resistance when compared to the hot pressed samples. The primary increase of Rp was followed by a decrease for 2 h of exposure, and the following increase was observed for cold compacted samples. The value of polarization resistance for hot pressed samples prepared under 100 MPa was after the maximum reached after 1 h of exposure only decreasing. A similar trend was characteristic also for the hot pressed samples prepared under 500 MPa; however, in this case, the maximal value of Rp was reached after 4 h of exposure. All the samples reached similar values of polarization resistance (before samples’ fatal degradation) at the maximal time of exposure.

3.3.2. EIS Measured in Enriched HBSS

The electrochemical corrosion tests were also performed on the prepared samples in the enriched HBSS with Mg2+ and Ca2+.
The EC in Figure 6b with three loops was selected for analysis of the Nyquist plots obtained for cold pressed samples prepared under 500 MPa up to 12 h of exposure to enriched HBSS. The Nyquist plot characterizing material behavior in 24 h of exposure to the corrosion environment had a different character, and the EC for the partially blocked electrode shown in Figure 6a was used for the data determination. After 24 h of exposure of the samples to the corrosion environment, substantial corrosion damage occurred. The determined data are shown in the Table 5, and the obtained Nyquist plots are shown in Figure 8a. The Rp obtained at the beginning of the measurement (473 Ω·cm2) was followed by its decrease to a value of 104 Ω·cm2 obtained after 8 h of exposure. The value of polarization resistance started to increase again, and the value of 530 Ω·cm2 was determined at the end of the experiment (24 h). The stability of the layer of corrosion products created on the samples’ surface is characterized by the values of n2 and n3. Based on the Nyquist plots’ character (EC in Figure 6b and EC in Figure 6a), the stability of both layers is changing in time, which indicates their changing reactivity and degradation in enriched HBSS in time.
The Nyquist plots characterizing the behavior of hot pressed samples prepared under 100 MPa at 400 °C are presented in Figure 8b. Based on the character of the obtained plots, the EC given in Figure 6b (up to 4 h of exposure) and Figure 6a (8 to 24 h of exposure) were used for the data determination. The measurement was performed for 24 h because of the high level of sample corrosion degradation after this time. The initial Rp value was determined as 83 Ω·cm2 by fitting analysis. The initial state was followed by a slight increase and decrease of Rp values until the end of the measurement when the maximal value of Rp was determined as 319 Ω·cm2. The stability of the layer of corrosion products (expressed with the n2 value given in Table 6) created on the sample’s surface was decreasing with increasing exposure time; however, after 8 h of exposure, the layer became porous, and some reactions took place also in the pores where the corrosion environment reached the surface of the samples.
The EC given in Figure 6a was used for the fitting of the Nyquist plots characterizing the behavior of hot pressed samples prepared under 500 MPa at 400 °C at the beginning of the exposure (0 h) (Figure 8c). Increasing the exposure time, the character of the Nyquist plots changed, and the EC shown in Figure 6b was used for the plots’ fitting. Except the first measurement, there is a clear inductive response in all the Nyquist plots. The obtained electrochemical corrosion characteristics are given in Table 7. The Rp increases from the initial (436 Ω·cm2) measurement and reached the maximum value (647 Ω·cm2) at 12 h of measurement. This increase of Rp was followed by a continual decrease until the end of the experiment at 96 h of exposure (321 Ω·cm2). The stability of the layer of corrosion products created on the samples’ surface characterized with the n2 value slightly decreased after 2 h of exposure to the enriched HBSS, however, remained stable, and its stability started to slightly increase after 48 h of exposure (Table 7).
Rp evolution in enriched HBSS in time determined for magnesium PM processed samples is shown in Figure 8d. The value of Rp determined for the cold compacts at the beginning of the exposure decreased with time of exposure up to 8 h, while the following exposure resulted in the Rp increase to a value slightly higher than the primary value. In the case of hot pressed samples prepared under 100 MPa at 400 °C, a slight increase of the Rp from the beginning of the exposure up to 12 h was observed, while additional exposure to the enriched HBSS was connected with the following increase of Rp. In the case of hot pressed samples prepared under 500 MPa at 400 °C, an increase of Rp up to 12 h of exposure was observed, while additional exposure resulted in a polarization resistance decrease to values below the Rp measured at the beginning of the exposure. However, the values of Rp determined for hot pressed samples prepared under 500 MPa were higher compared to other material states.

3.4. Corrosion Mechanism Analysis

The surface of the compacts tested by the EIS method was documented with the aim to compare the mechanism of corrosion attack and its dependence on material structure and the corrosion environment used (Figure 9 and Figure 10). Metallographic cross-sections of the tested compacts were prepared with the aim to identify the mechanism of the corrosion process within the material volume. Samples’ cross-sections were molded into the resin and prepared by the standard metallographic procedures. Due to the molding into the resin and the porosity and incompactness of the corroded compacts and corrosion products on their surface, gas bubbles were present on the mold specimens (above the surface of the sample).
In all cases, the area exposed to the corrosion environment during the EIS measurement was covered with a layer of corrosion products. The created layer was not compact and contained a large number of cracks, which were observed also in the layer of corrosion products.
The surface of the area of the compacts exposed to the HBSS and enriched HBSS was fully covered with grey-/white-colored corrosion products during the EIS measurement (outlined areas). Based on the surface observation, the corrosion mechanism can be considered as the same in the HBSS and enriched HBSS, as the corrosion products’ structure is similar and no specific material behavior was observed. The corrosion mechanism, however, was dependent on the sample preparation.
In the case of cold pressed samples, the created corrosion products covered the whole area exposed to the corrosion environments (Figure 9a,b). On the details of the metallographic cross-section given in Figure 9a,b, quite pronounced corrosion attack of the material can be seen. The layer of corrosion products grows to a depth of approximately 4000 µm during the exposure to both corrosion environments. Due to the large thickness of the created layer of corrosion products, its cracking and decohesion with the cold compacted materials can be seen on samples’ cross-sections in Figure 9a,b. In the details of Figure 10a,b, layer-like corrosion progression into the material volume can be recognized. The material behavior was the same for HBSS and enriched HBSS. However, from the comparison of Figure 10a,b, eventual removal of the layer of corrosion products from the surface of the compact tested in enriched HBSS can be observed as the time of exposure increased. Therefore, the more degradable influence of enriched HBSS on compacts compared to HBSS can be concluded for cold compacted pure magnesium.
The hot pressed samples (Figure 9c–f) corroded uniformly throughout the whole tested area. Samples prepared under 100 MPa compacting pressure at 400 °C exhibited a uniform layer of corrosion product after exposure in HBSS, with a slightly layer-like structure, which is more apparent from the detail in Figure 10c. As the corrosion products’ layer grew into the material volume, the uniform layer cracked, which in long-term exposure leads to very severe corrosion attack. Enriched HBSS seems to have a similar influence on the hot pressed sample. The corrosion products’ layer observable on the sample cross-section shown in Figure 9d was comparable to the one created in HBSS (Figure 9c). Both layers had a comparable thickness (less than 1500 µm), and both of them exhibited cracks. Furthermore, the mechanism of the corrosion attack progress through the material shown in Figure 10c,d was similar. The corrosion seems to progress to the material volume layer by layer, following layers of compacted powders (layer-like corrosion progression). The corrosion attack was less pronounced when compared to the cold compacted materials.
The hot pressed samples prepared under 500 MPa at 400 °C exhibit different behaviors in terms of corrosion attack in HBSS and enriched HBSS compared to the cold pressed and hot pressed samples prepared under 100 MPa. The surface of the hot pressed samples prepared under 500 MPa was completely covered with corrosion products; however, the depth to which the samples degraded is much smaller compared to the samples prepared under 100 MPa at 400 °C and cold pressed samples (Figure 9e,f). This shows much better coherence of the powder particles forming the samples. The depth of corrosion attack is small (approximately 500 µm) comparing to the other material states. However, in this case, different responses of compacts on HBSS and enriched HBSS were observed. Even from the cross-sections in Figure 10e,f, the layer-like corrosion progression is visible only for the sample exposed to HBSS. In the case of the exposure of the compacts to the enriched HBSS, the layer of corrosion products was removed from the material surface during the measurement (Figure 10f), which indicates low layer cohesion to the material and/or high volume expansion of the created corrosion products.

4. Discussion

Microstructural, mechanical and electrochemical corrosion characteristics of pure magnesium materials prepared by powder metallurgy were analyzed with the aim to identify the influence of processing parameters. Sets of cold compacted and hot pressed materials (300 °C, 400 °C and 500 °C) were prepared from magnesium powder under 100 MPa, 200 MPa, 300 MPa, 400 MPa and 500 MPa compacting pressures. While the material has potential in biomedical applications, the electrochemical corrosion characteristics of the processed materials were analyzed in HBSS and enriched HBSS using electrochemical impedance spectroscopy, and the data were extended with the analysis of the corrosion attack within the material volume.
Low compacting pressures led only to minimal plastic deformation of magnesium powder particles during cold compaction or hot pressing (Figure 2). Increasing the compaction pressure (above 300 MPa) at RT had an influence on the deformation of the powder particles while increased deformability of particles corresponded with increasing compaction pressure. The influence was also sufficient for changing the character of the porosity from open porosity to closed porosity and decreased the number of pores on the samples’ cross-sections, which is in agreement with [11,12,13]. Hot pressing led to a significant decrease of the porosity of the compacts and also to a change in the character of the porosity (Figure 2) [4,32]. The open porosity characteristic for cold pressed samples was replaced with closed localized pores observed in hot pressed samples’ microstructure. This change can be attributed to better plastic deformation of magnesium at a higher temperature, resulting in higher plastic deformation of powder particles and closing the open porosity present on particles’ boundaries due to the shape factor (spherical particles cannot fill the space 100%). The change of the magnesium deformability results from the hexagonal close-packed (HCP) crystallographic lattice structure of the material. While only one slip system is active at RT, the increase in temperature led to activation of more slip systems. Furthermore, the twinning mechanism is dominant for HCP lattice structures instead of the slip mechanism below 200 °C [34,35].
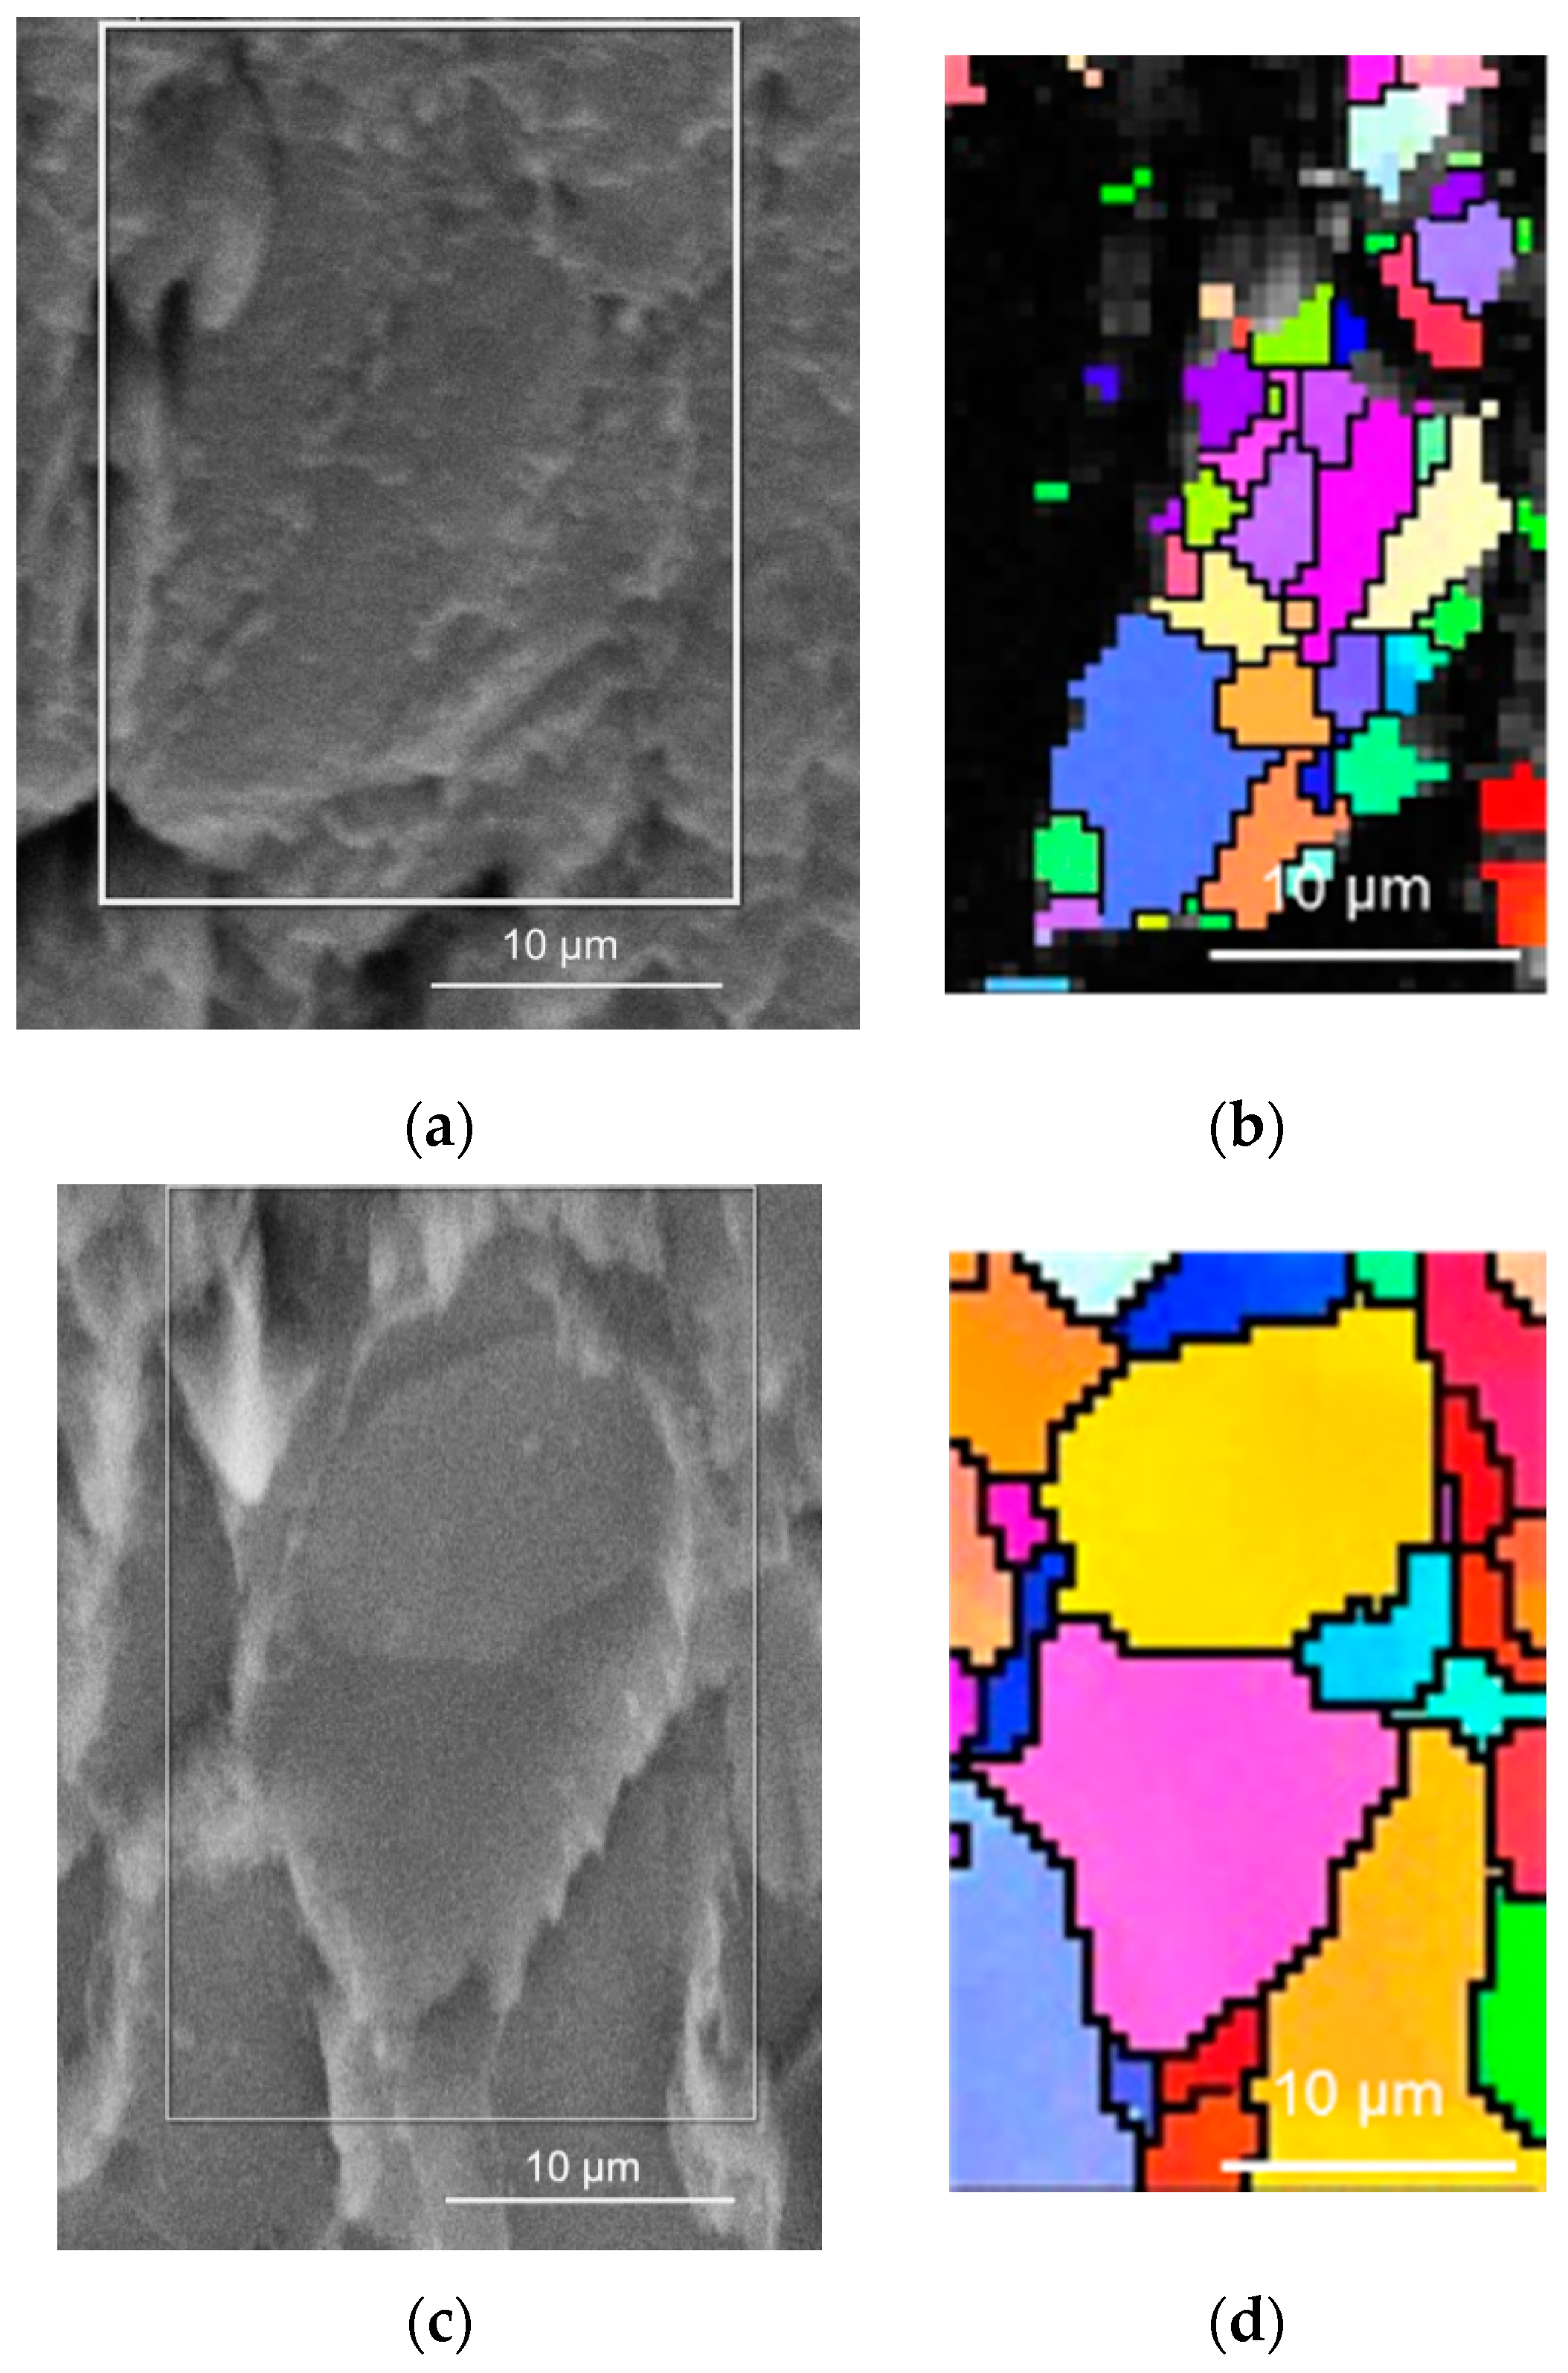
Besides the improvement of magnesium deformability, the elevated temperature also influenced the evolution of grains in the compacted powder particles, which was revealed with EBSD analysis shown in Figure 3. The cold compacted sample revealed a very fine microstructure within the powder particle, but wide gaps between powder particles were observed. EBSD analysis of the hot pressed sample revealed coarser metallic grains in powder particles; however, the gaps between powder particles were not visible as diffusion bonding at higher temperatures took place between powder particles.
A coarser metallic microstructure generally leads to a decrease in hardness and tensile strength compared to the fine-grained material [4,5]. However, the observed fine microstructure corresponds only to the powder particles, while the particles’ bonding was observed to be weak (also, an open porosity was observed). Therefore, this fine microstructure obtained by cold compacting of magnesium did not affect the mechanical properties of the samples in a positive way due to the low compactness of particle boundaries.
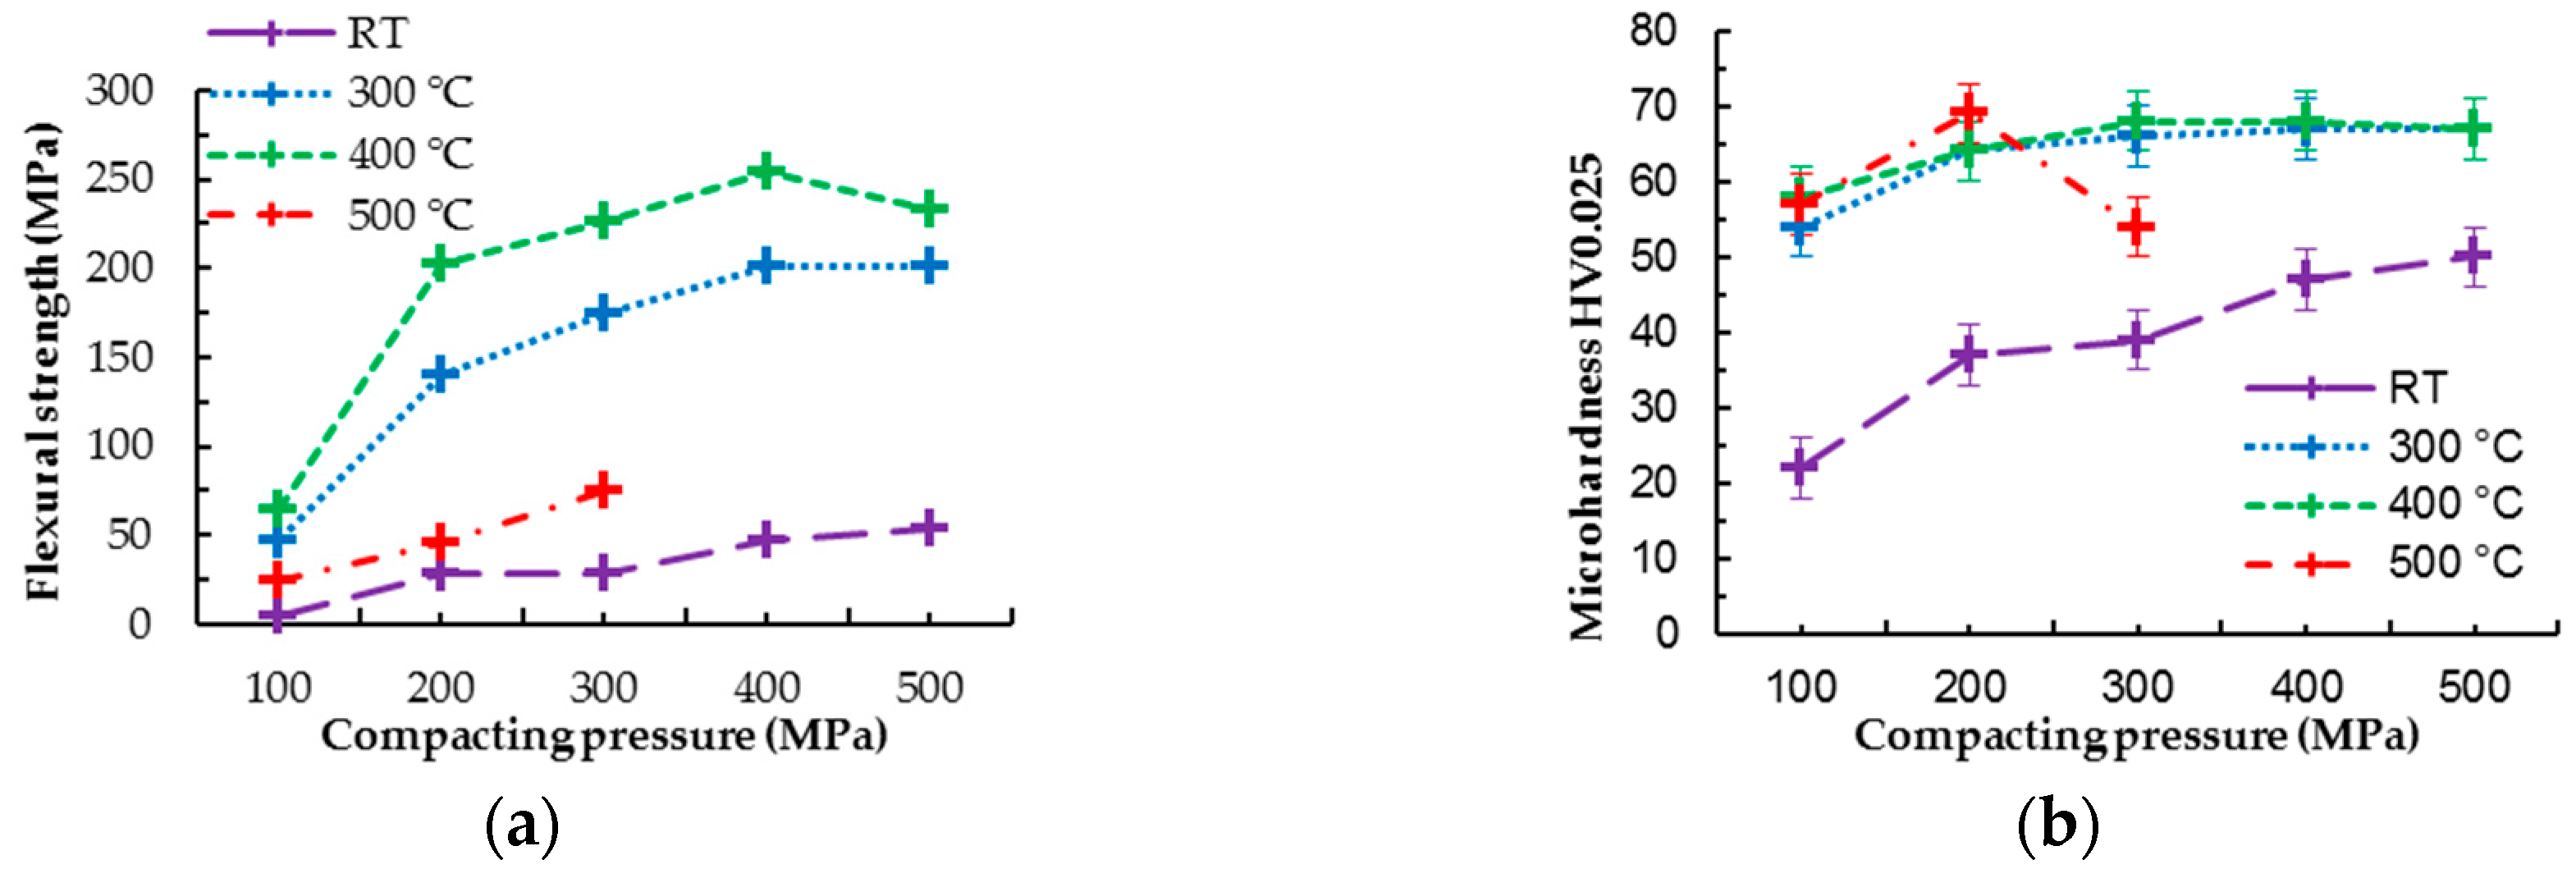
Improvement of mechanical properties by hot pressing of pure magnesium is visible in Figure 3 and Figure 4. Hot pressed samples prepared at 300 °C revealed the same trend in increasing flexural strength with increasing compaction pressure as samples prepared at 400 °C; however, the values of flexural strength are slightly higher for the series of samples prepared at 400 °C. This fact can be attributed to a higher diffusion rate of magnesium at 400 °C, which leads to better diffusion bonding between powder particles and possibly more pronounced grain coarsening at higher temperature [11]. Samples prepared at 500 °C reached much lower values of flexural strength compared to other hot pressed samples (comparing samples prepared under the same pressures) and only slightly higher than cold compacted samples (Figure 4a). At the temperature of 500 °C, the diffusion of magnesium is even higher than at 400 °C, which should lead to better powder particle diffusion bonding; however, the higher temperature (500 °C) can lead to intensive coarsening of metallic grains created in the powder particles. As a result, the grain coarsening could be a reason for the flexural strength decrease (Figure 4a), considering good material compaction based on EBSD analysis.
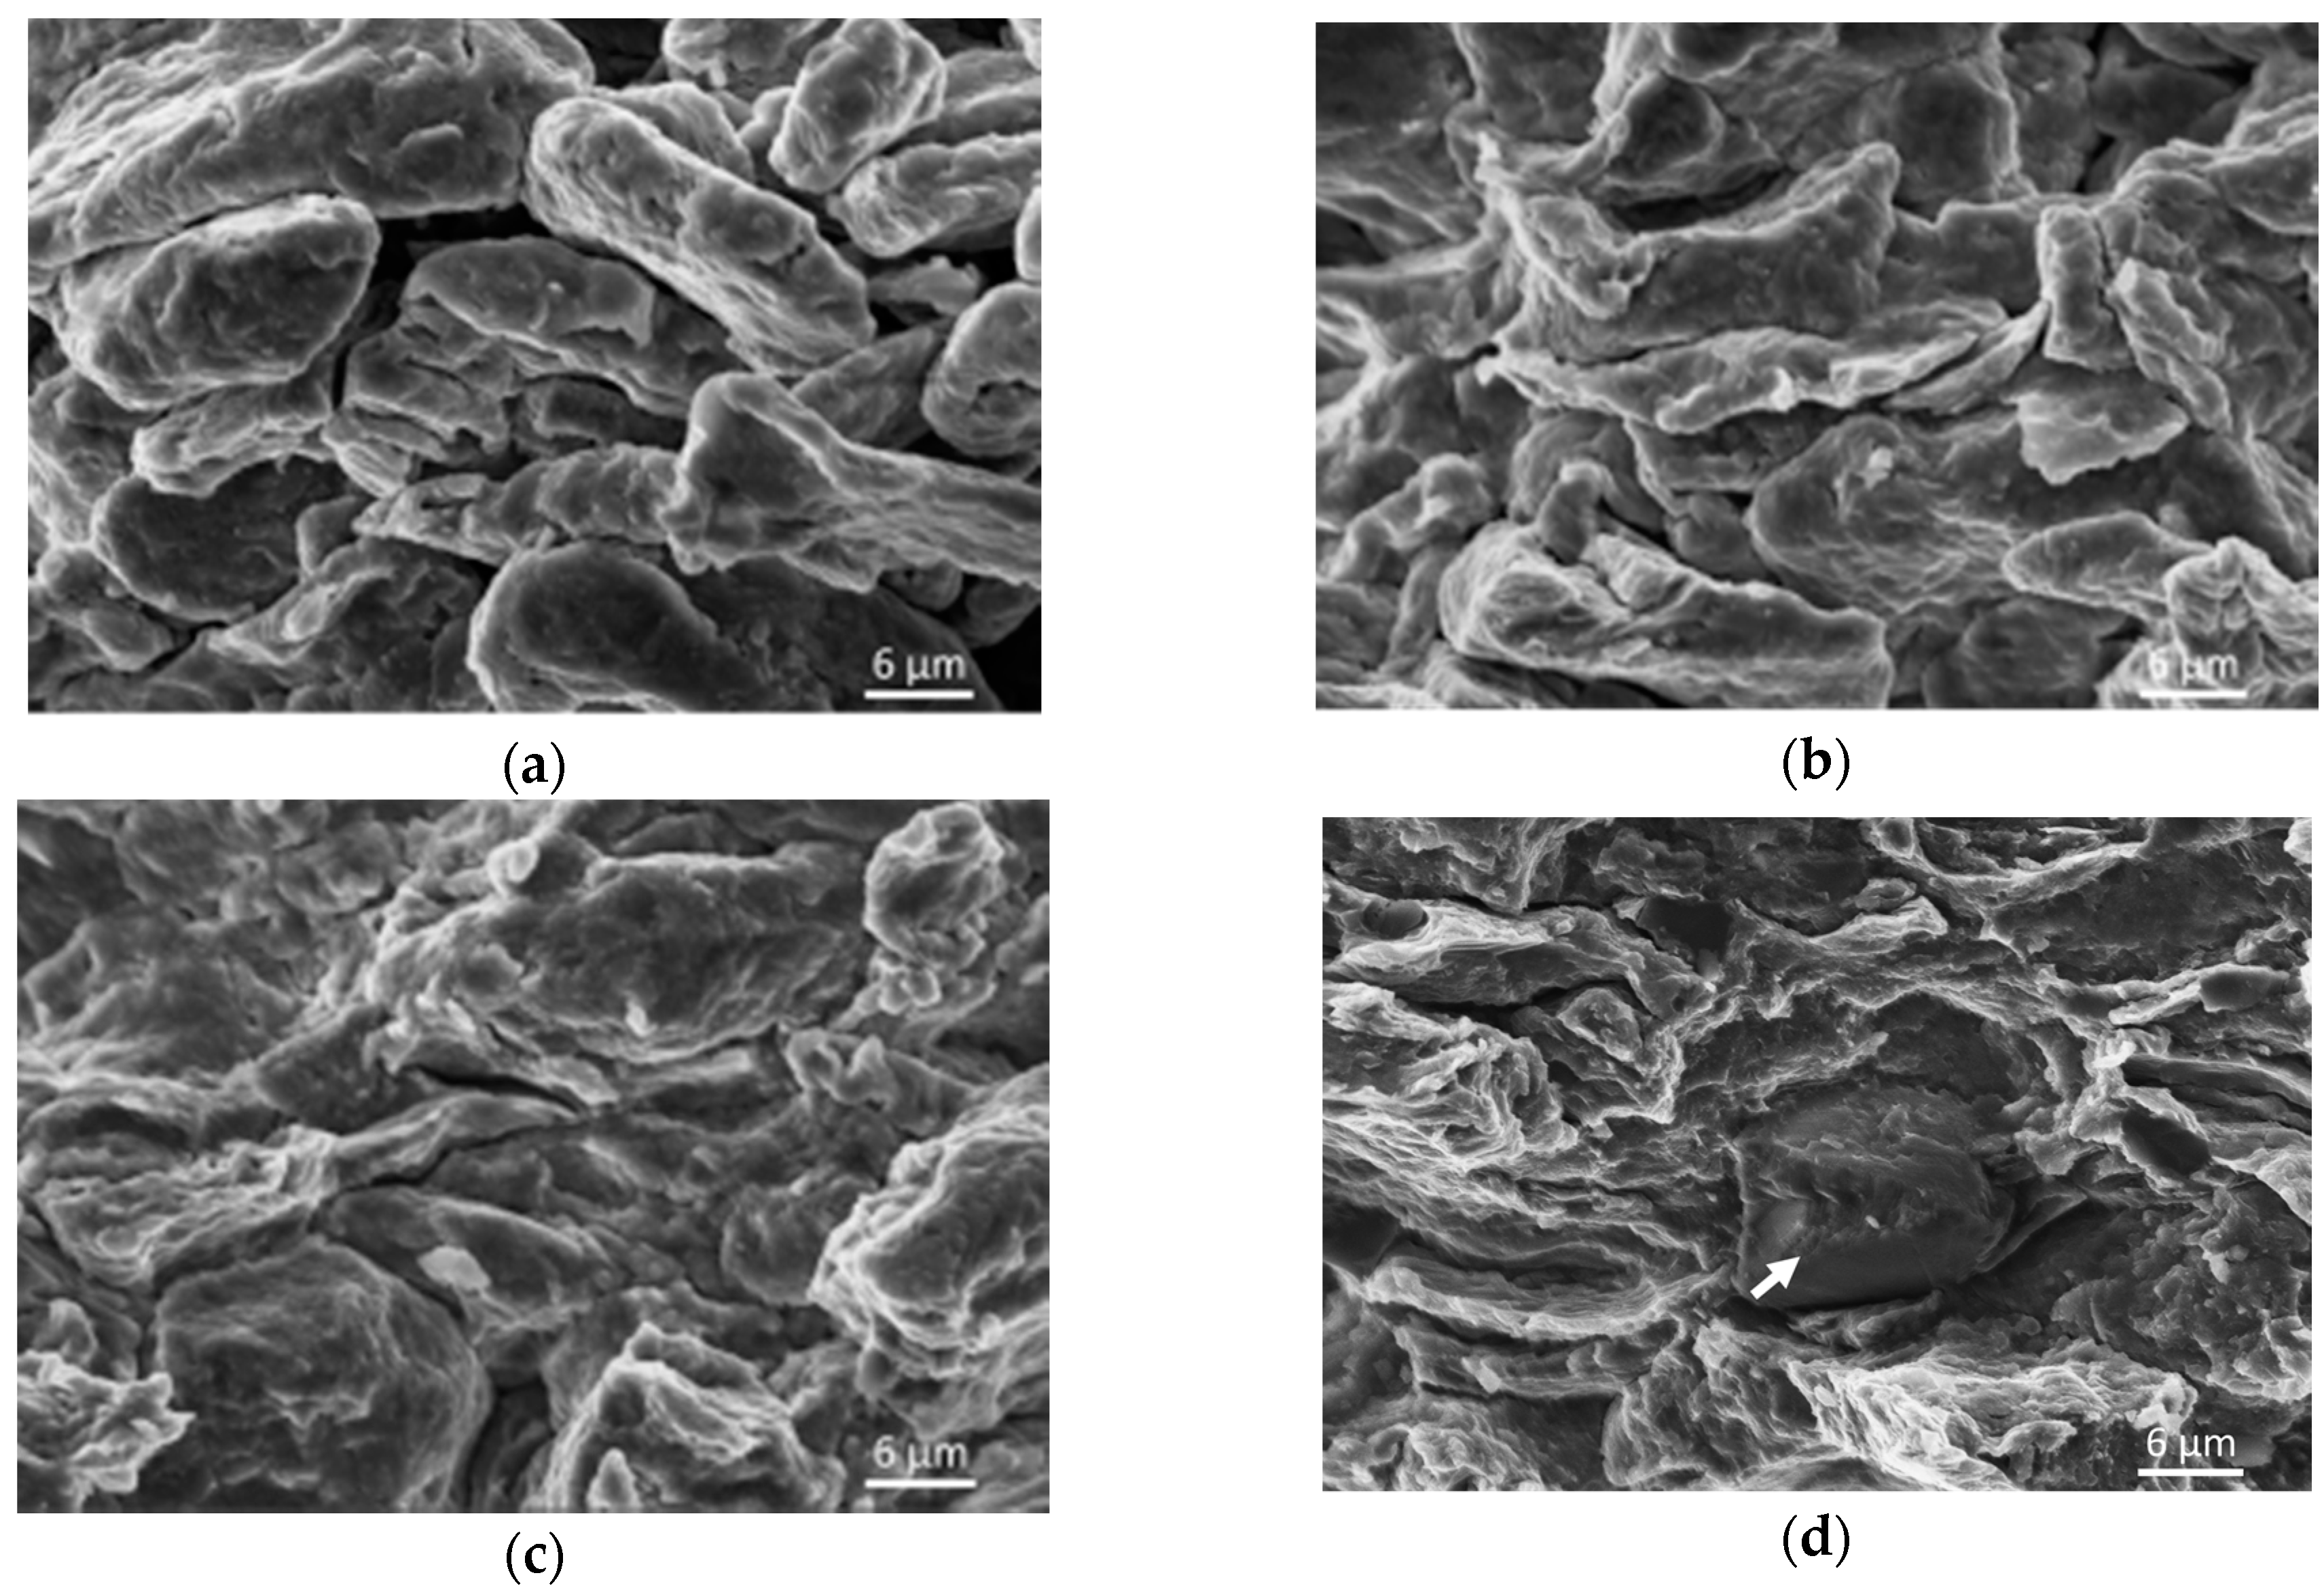
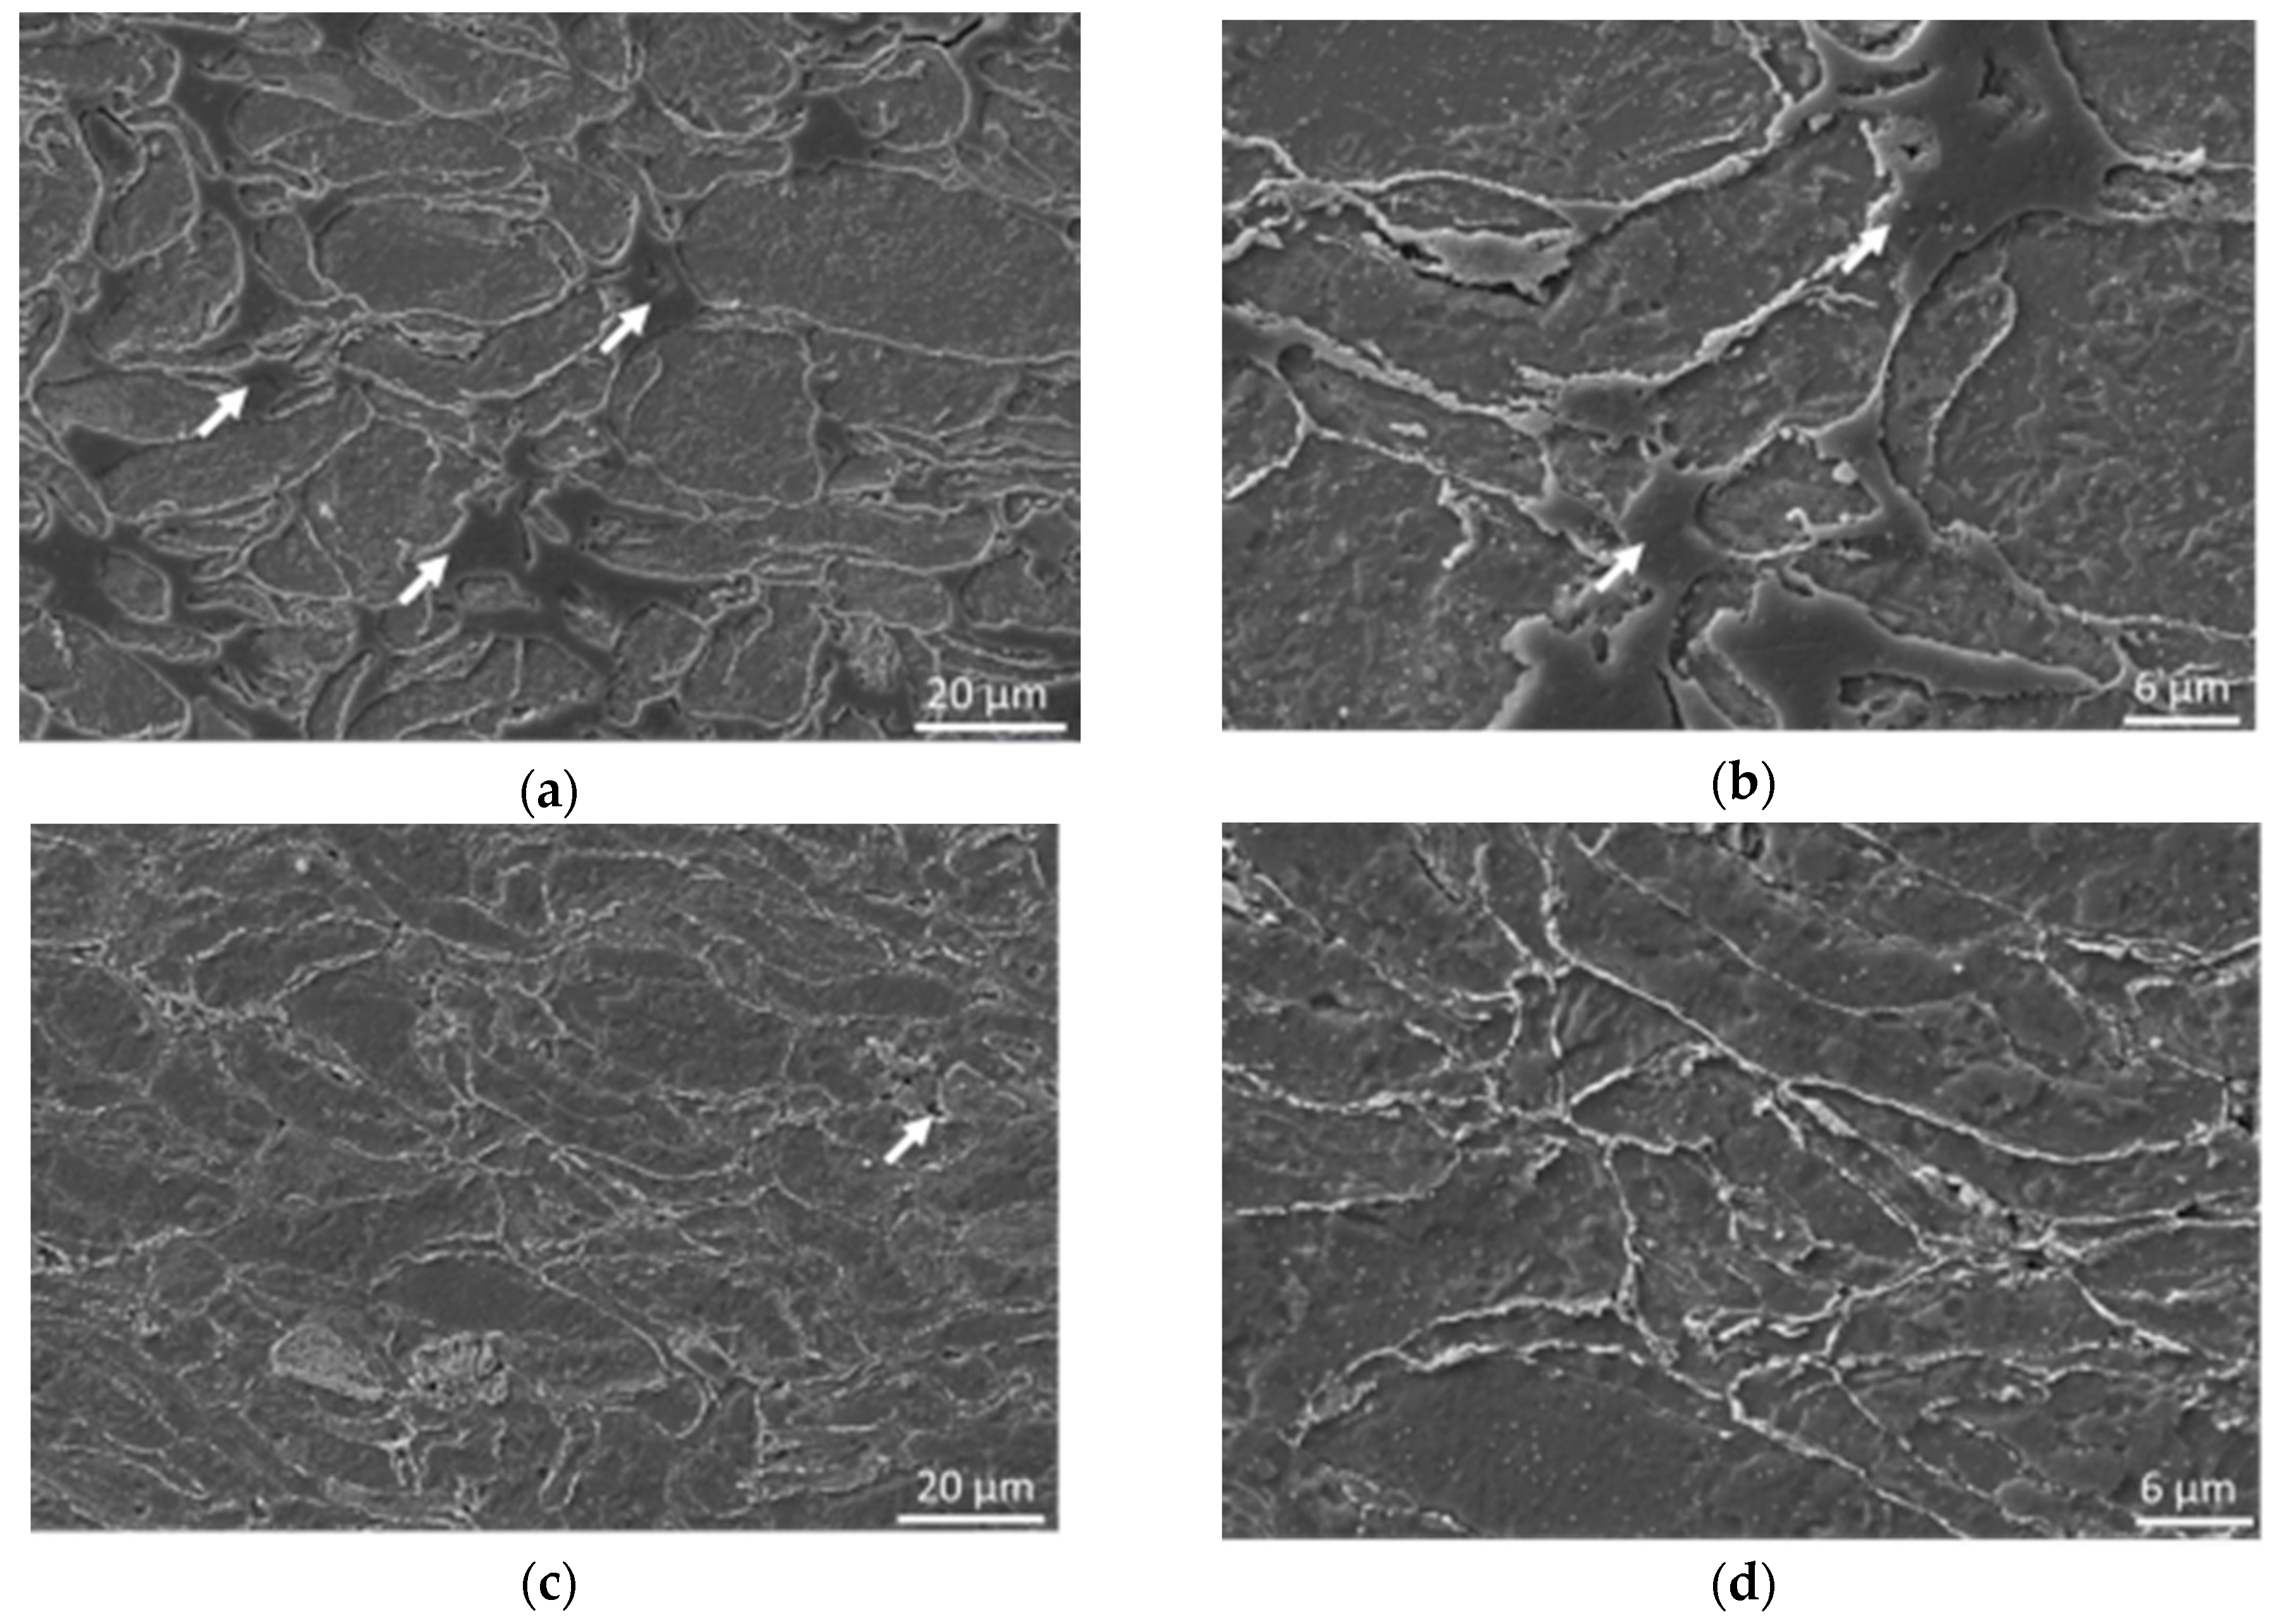
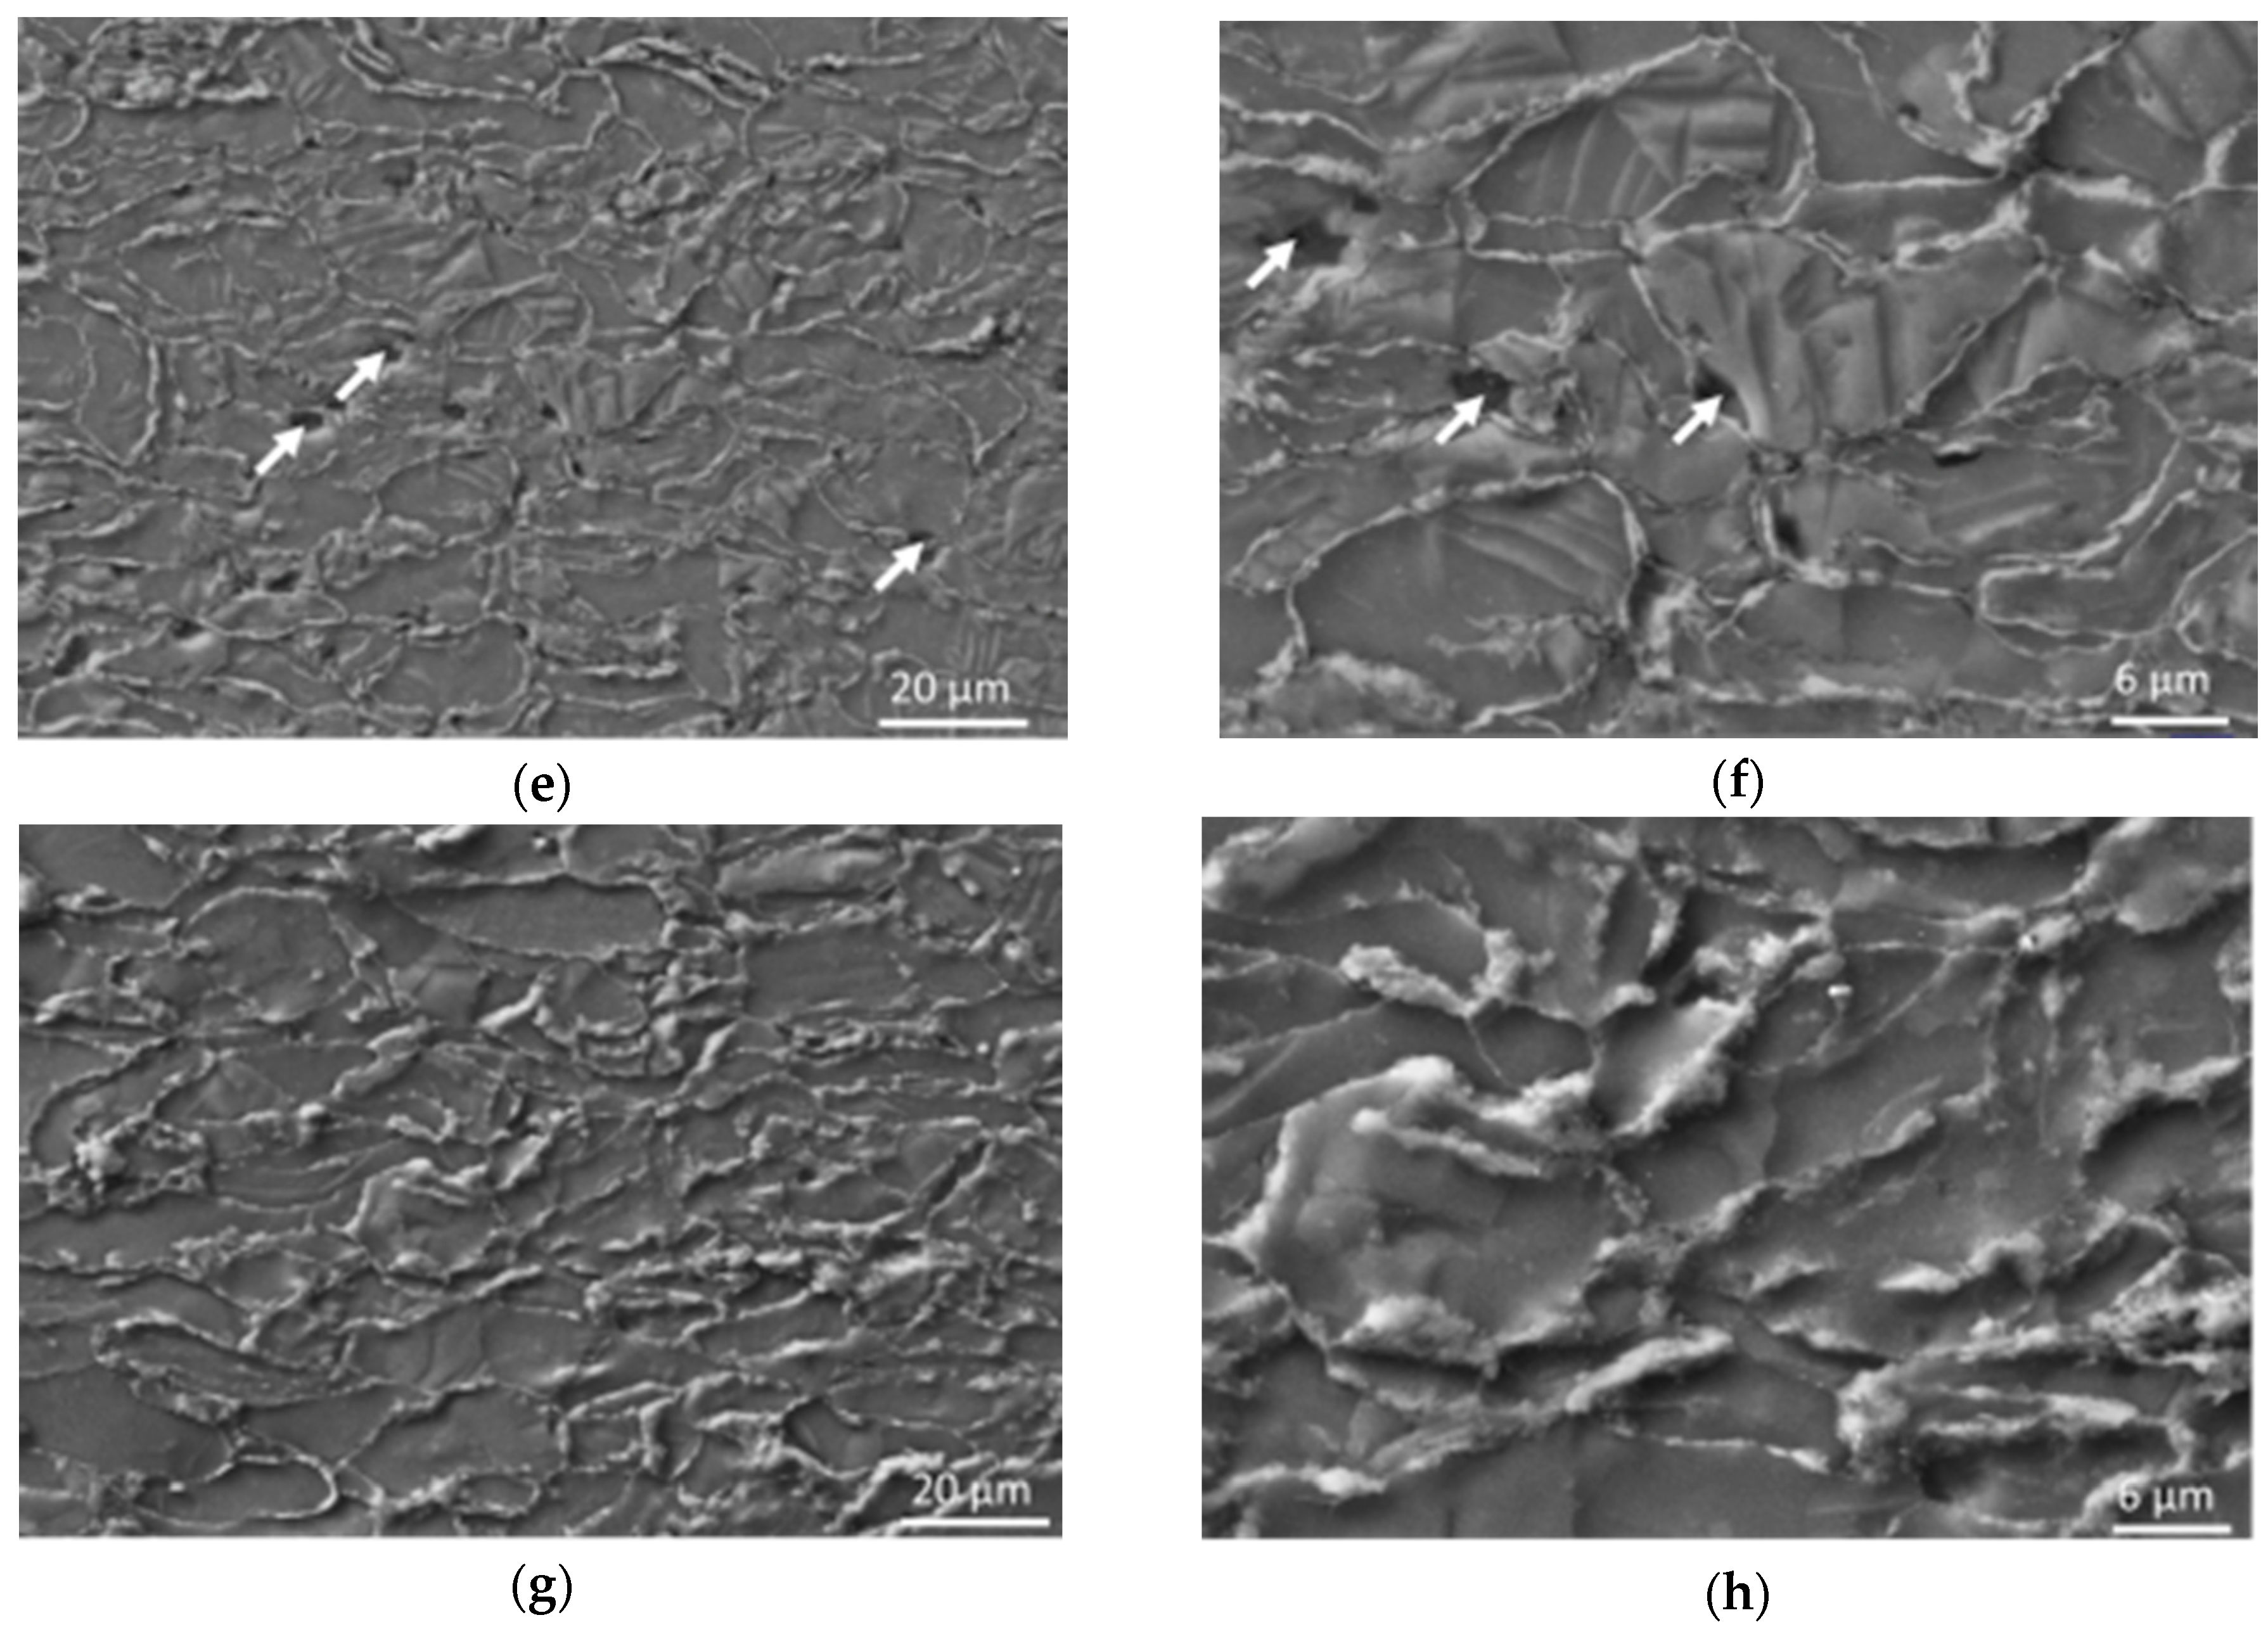
Bonding of powder particles into the coherent sample is also apparent from the microhardness test results. Cold compacted samples follow the same trend of increasing microhardness with increasing compaction pressure as samples prepared via hot pressing; however, the obtained values are significantly lower. This can be attributed to the good cohesion of samples prepared via hot pressing. Cold compacted samples hold together only due to the powder particles’ interlocking as a result of plastic deformation, while the hot pressed samples are interlocked and diffusion bonded. The good cohesion of powder particles in the case of hot pressed samples is also visible from the fractographic analysis provided in Figure 5, as inter-granular failure was visible only on fracture surfaces of samples prepared by hot pressing. Fractographic analysis from cold compacted samples revealed only the trans-granular failure of samples, and no inter-granular failure was observed. While the character of fracture surfaces differs, only brittle fracture was reported in all the measured samples. The character of fracture surfaces furthermore confirms the assumption that the samples prepared by cold pressing are not diffusion bonded.
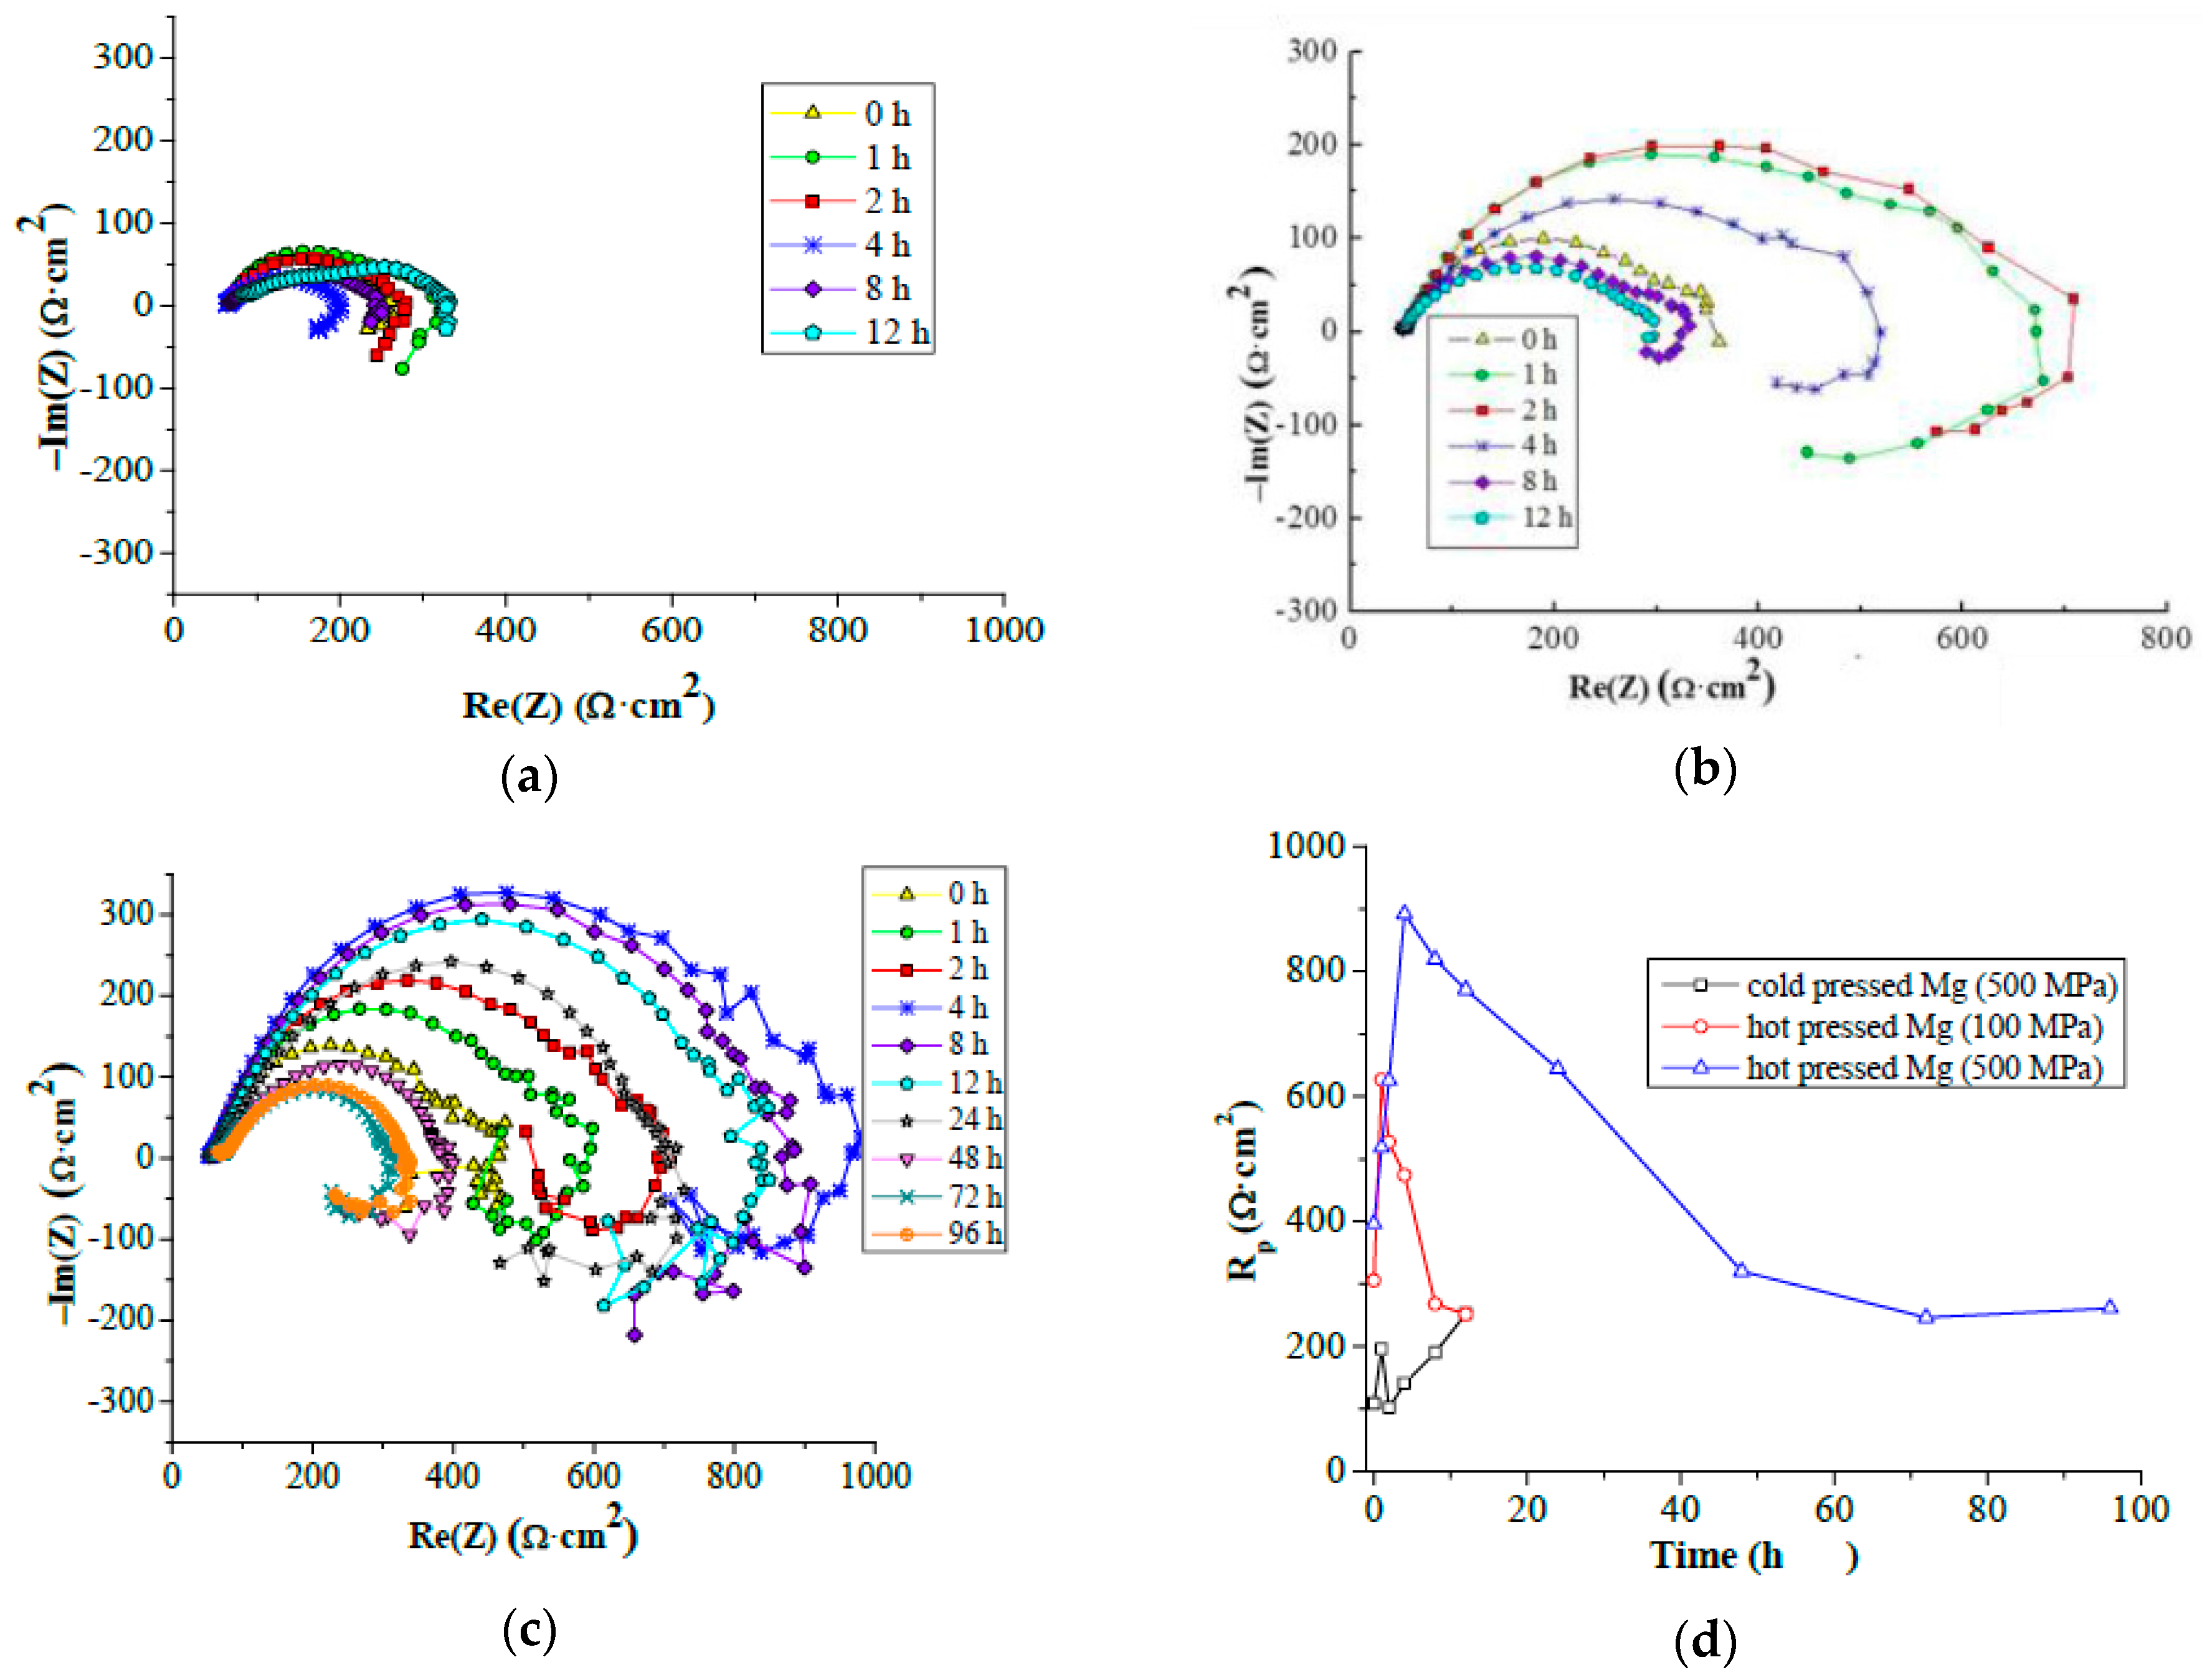
Differences between cold compacted and hot pressed samples were also observed during EIS measurement. Low compactness of cold compacted samples compared to the hot pressed samples resulted in lower corrosion resistance of cold compacted samples. This was proven by the corrosion rate and the depth to which corrosion progressed. It is clearly evident that by dissolving of magnesium under H2 evolution, the corrosion environment is alkalized (increase pH value), and the corrosion rate of magnesium slows down [30]. Corrosion products created on magnesium are usually based on MgO and Mg(OH)2. The layer of corrosion products, especially the Mg(OH)2 compound, is easily disturbed and dissolved in environments containing Cl. The layer offers only very low protection to magnesium against corrosion especially in environments containing aggressive ions [36]. HBSS is a more complex environment containing phosphates and hydrogen phosphates. More compounds in the corrosion environment enable more chemical reactions between the metallic surface, corrosion environment and corrosion products [30]. Products of these reactions can create a layer of corrosion products (outer layer) over the created MgO and Mg(OH)2 inner primary layer created on the sample surface. Both layers develop during the corrosion process and are porous by their nature or the damage of the compact areas can occur. All the types of corrosion products are created during the material exposure to the environment and grow on the material surface at the same time. These layers cannot be exactly distinguished.
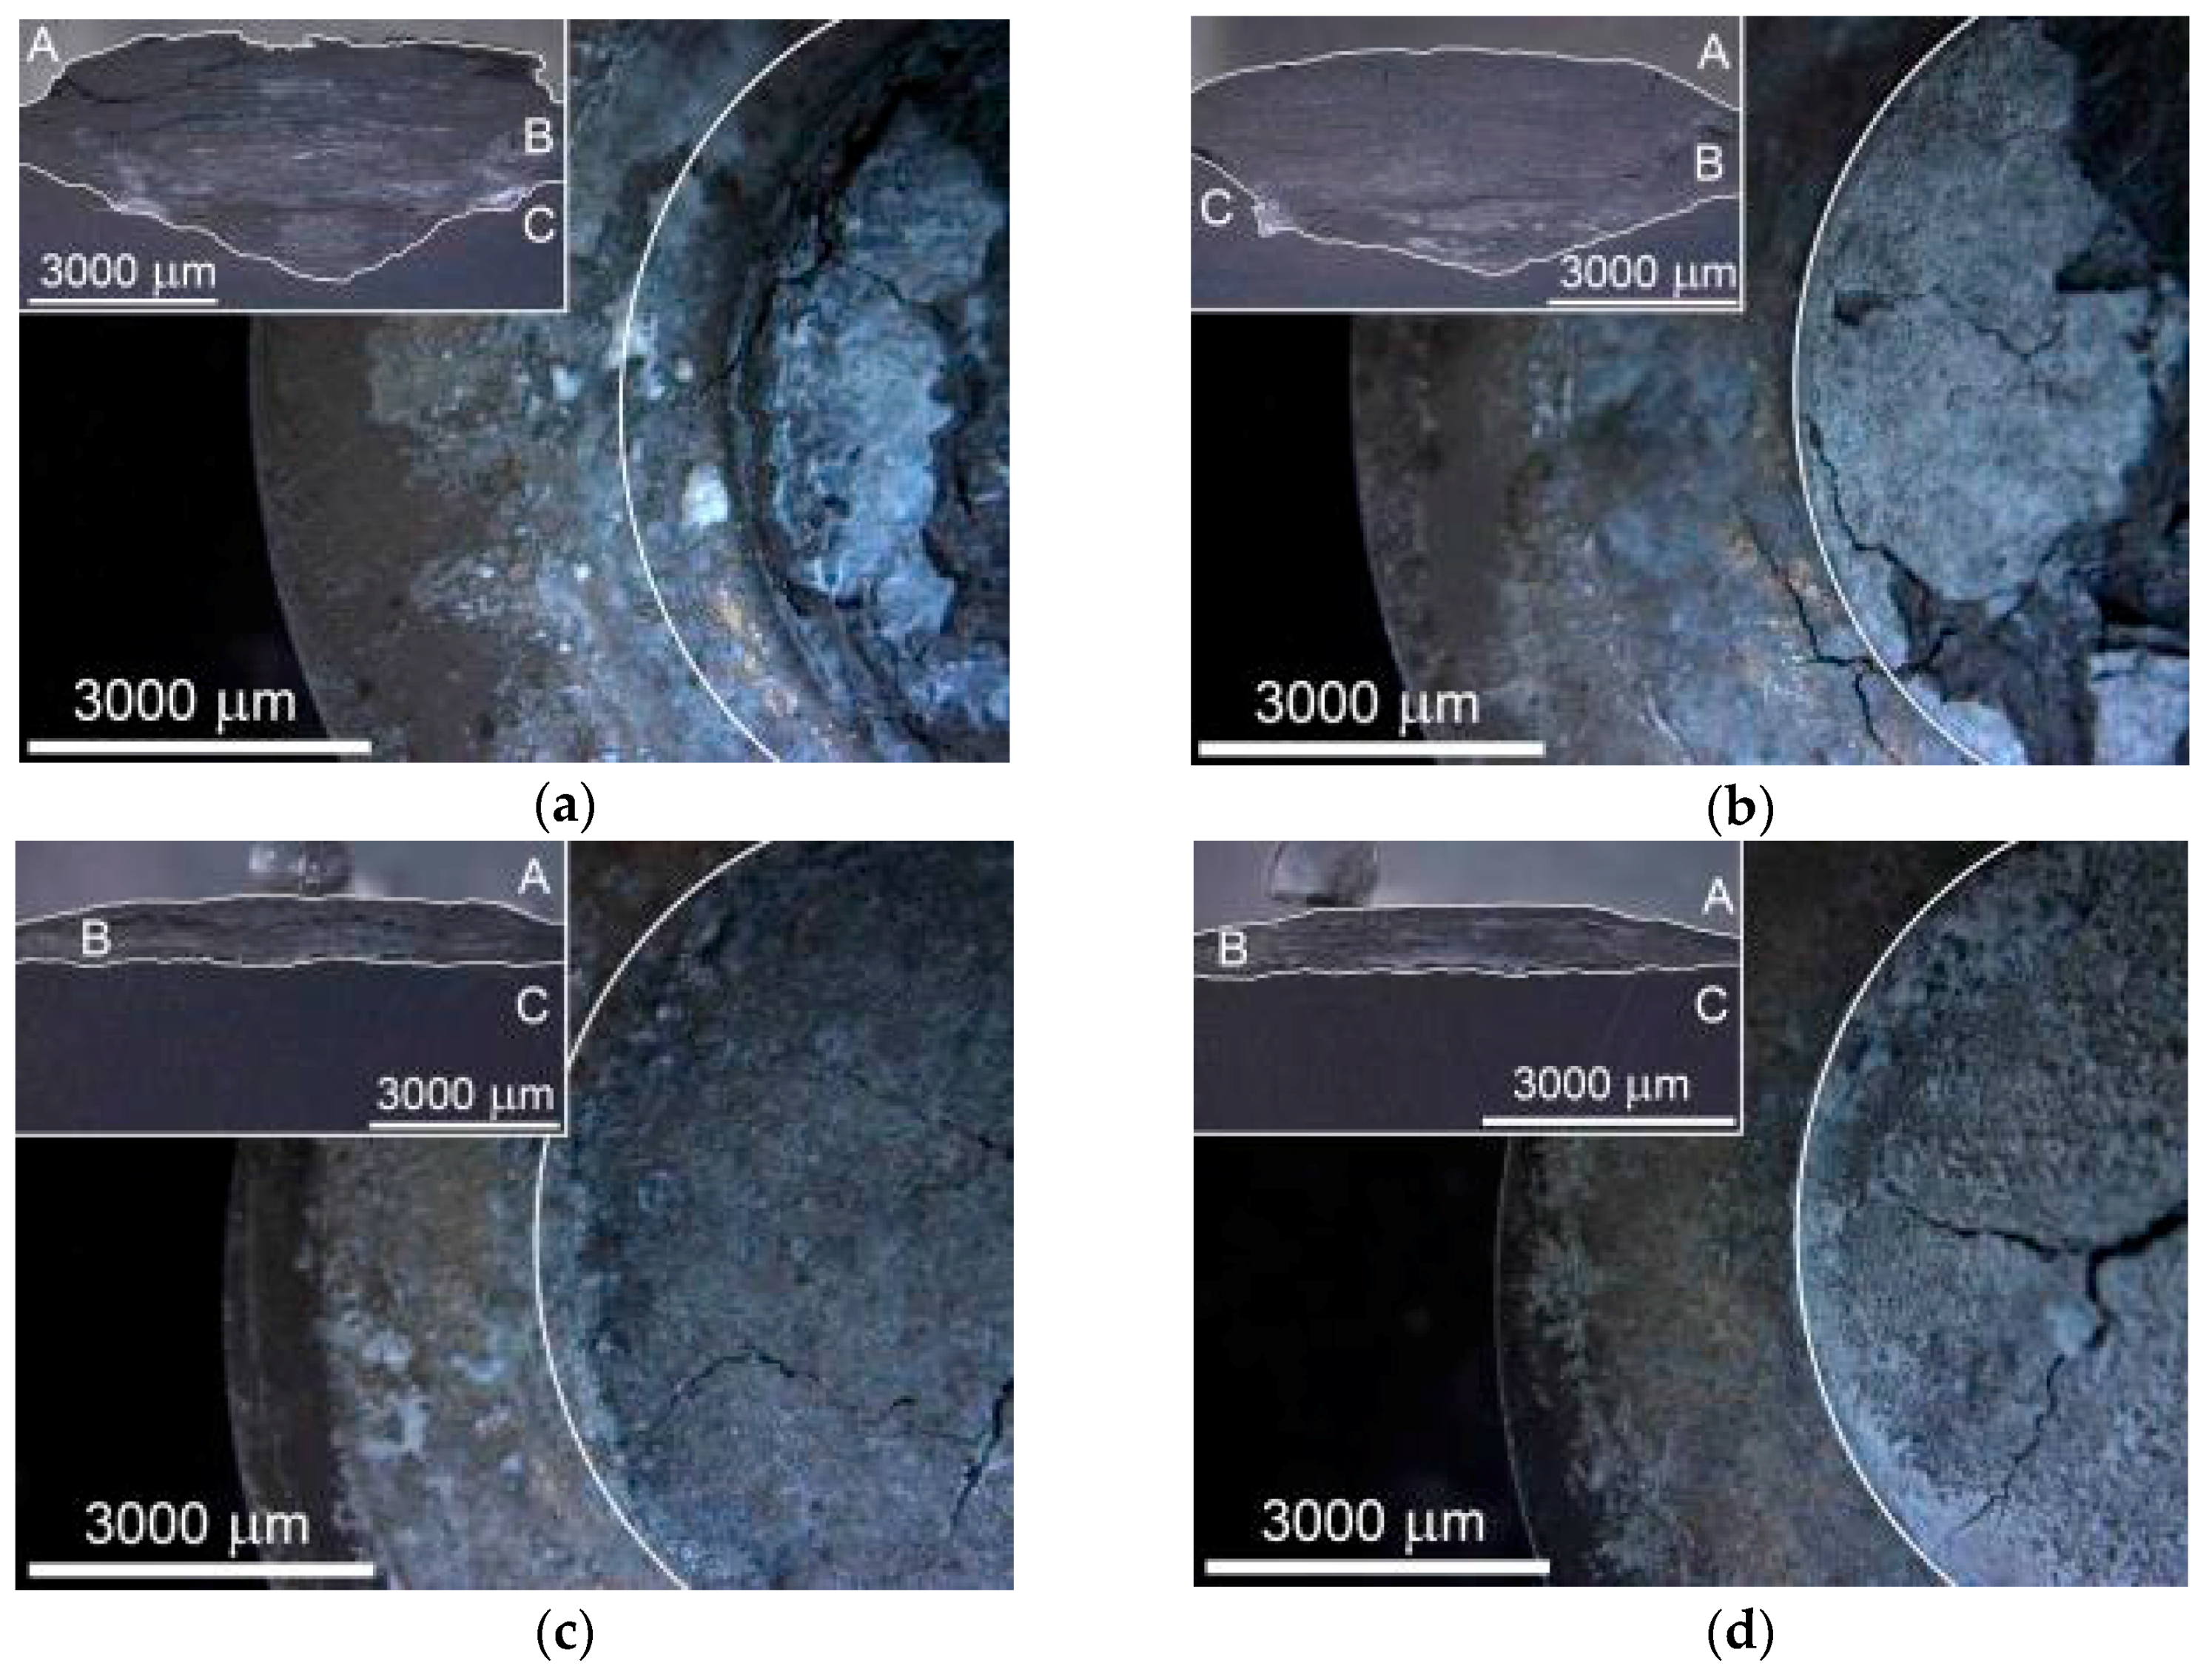
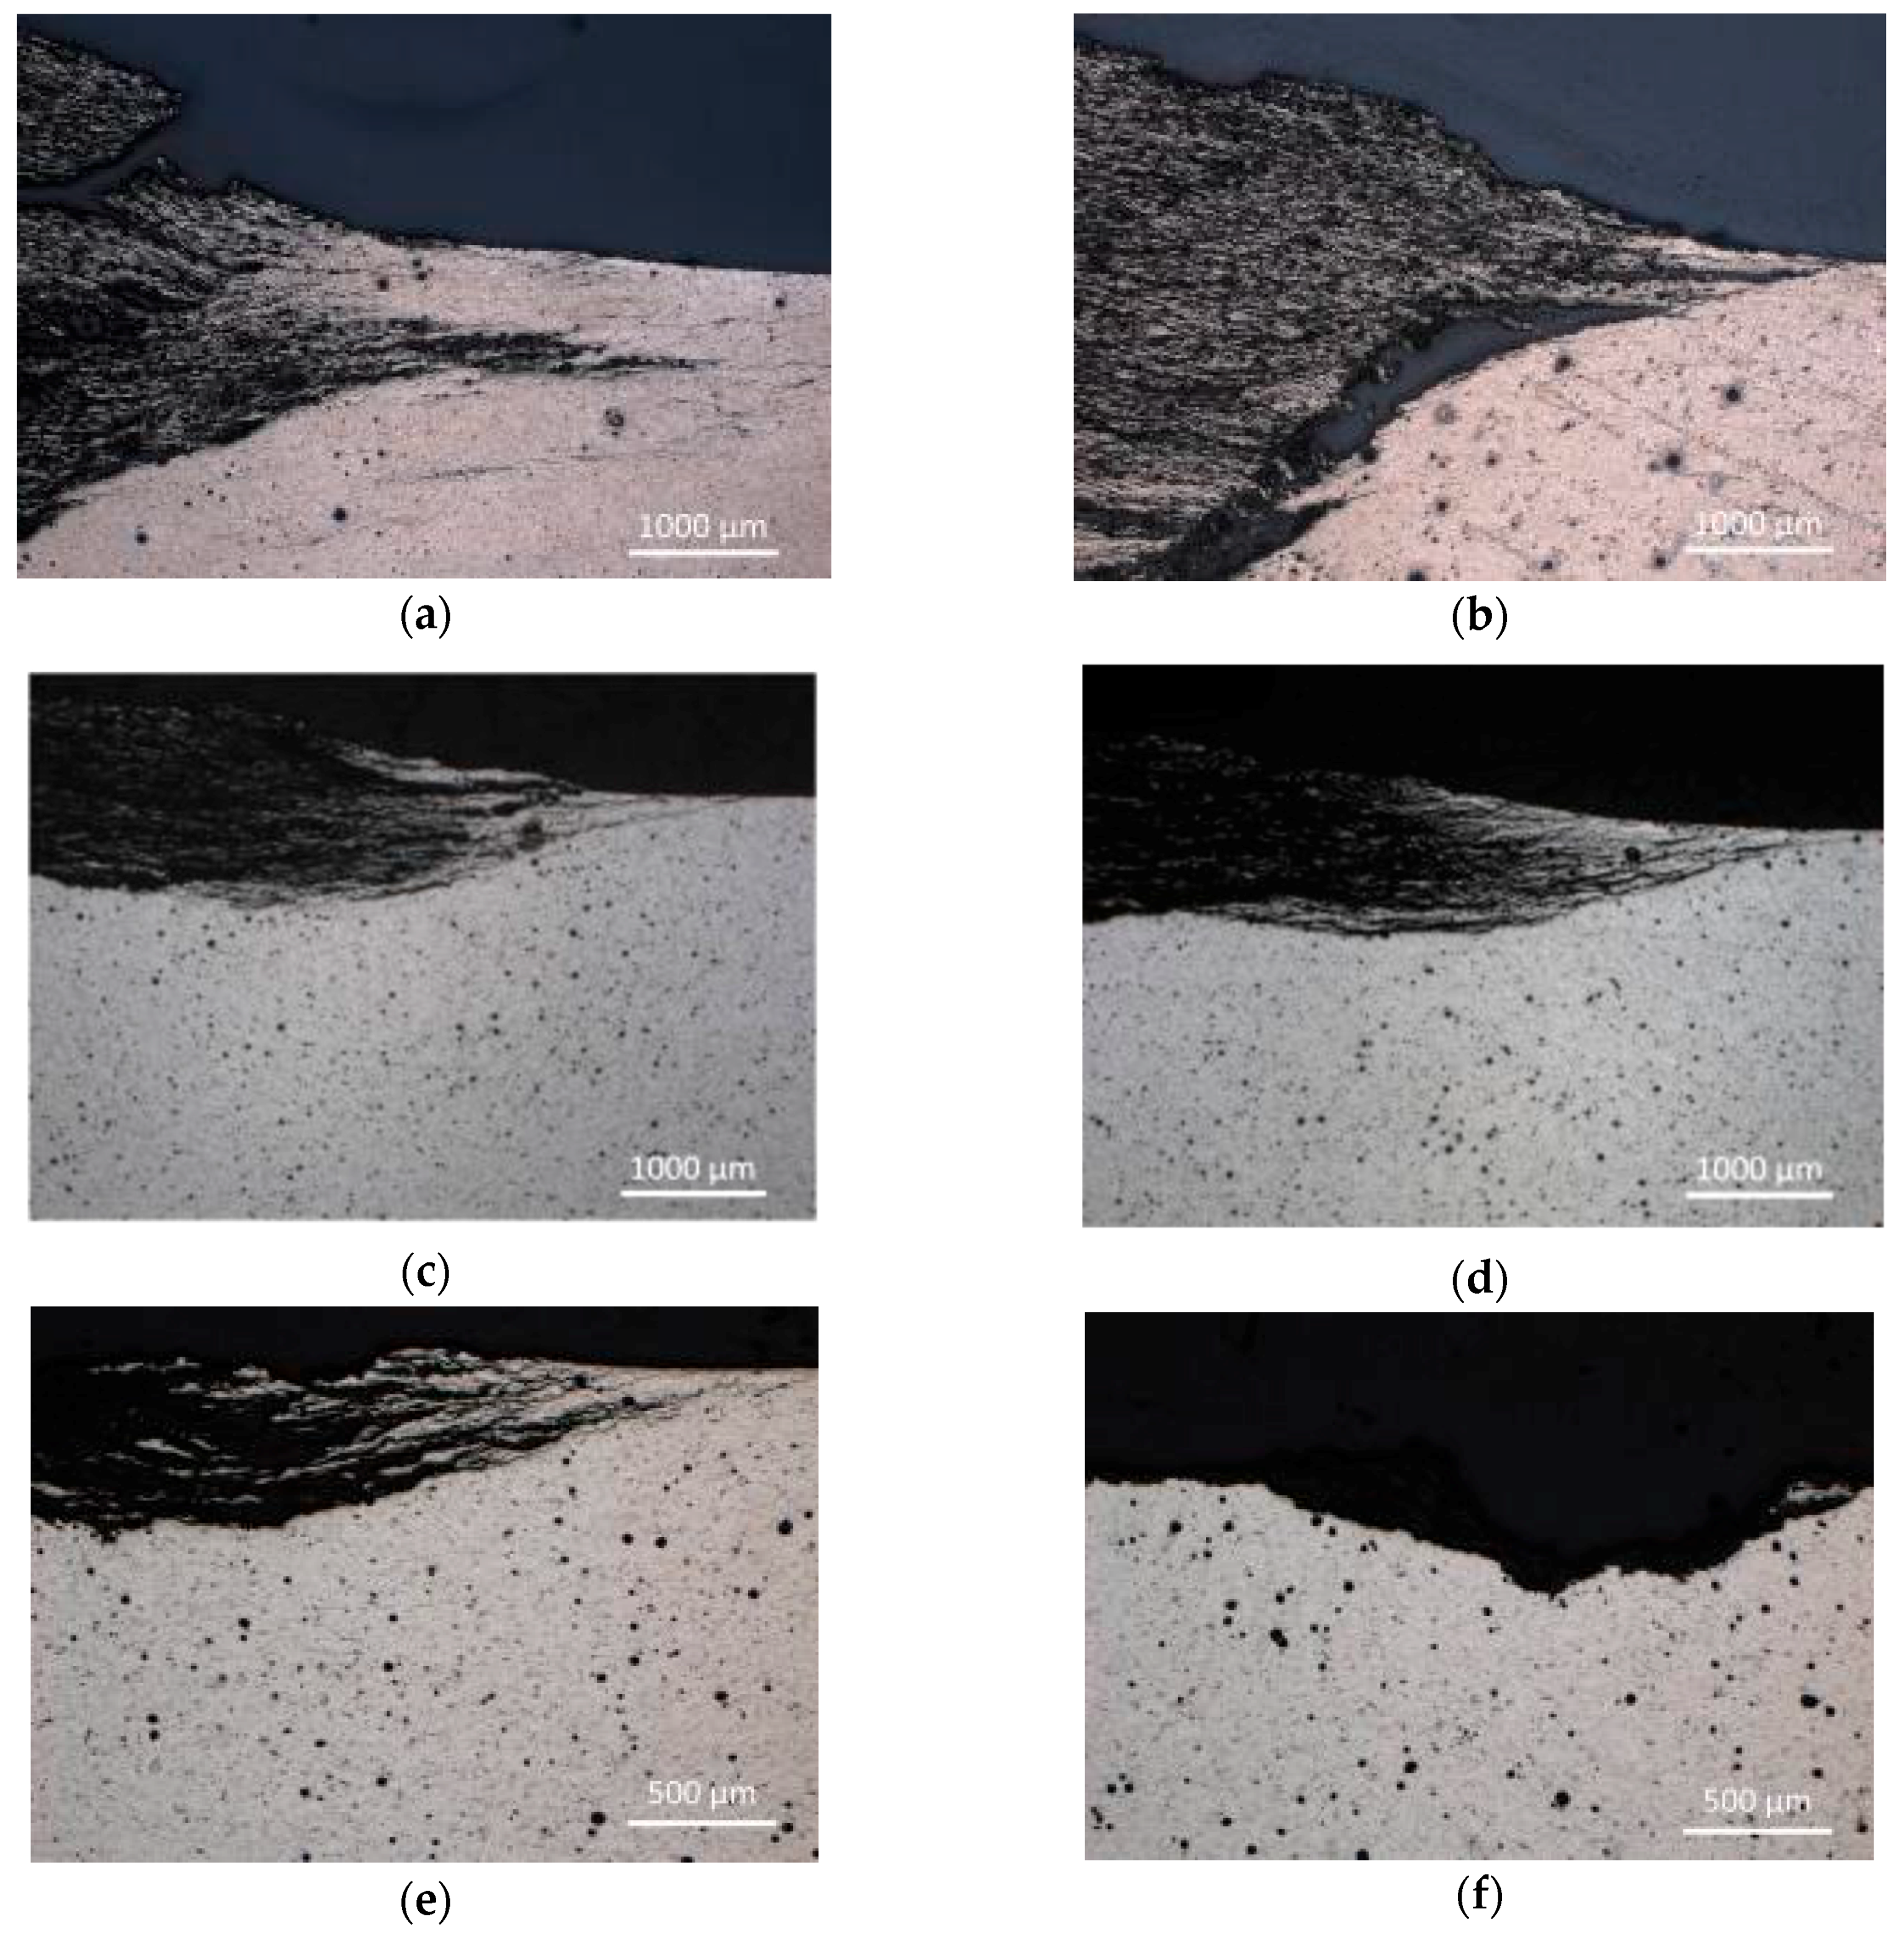
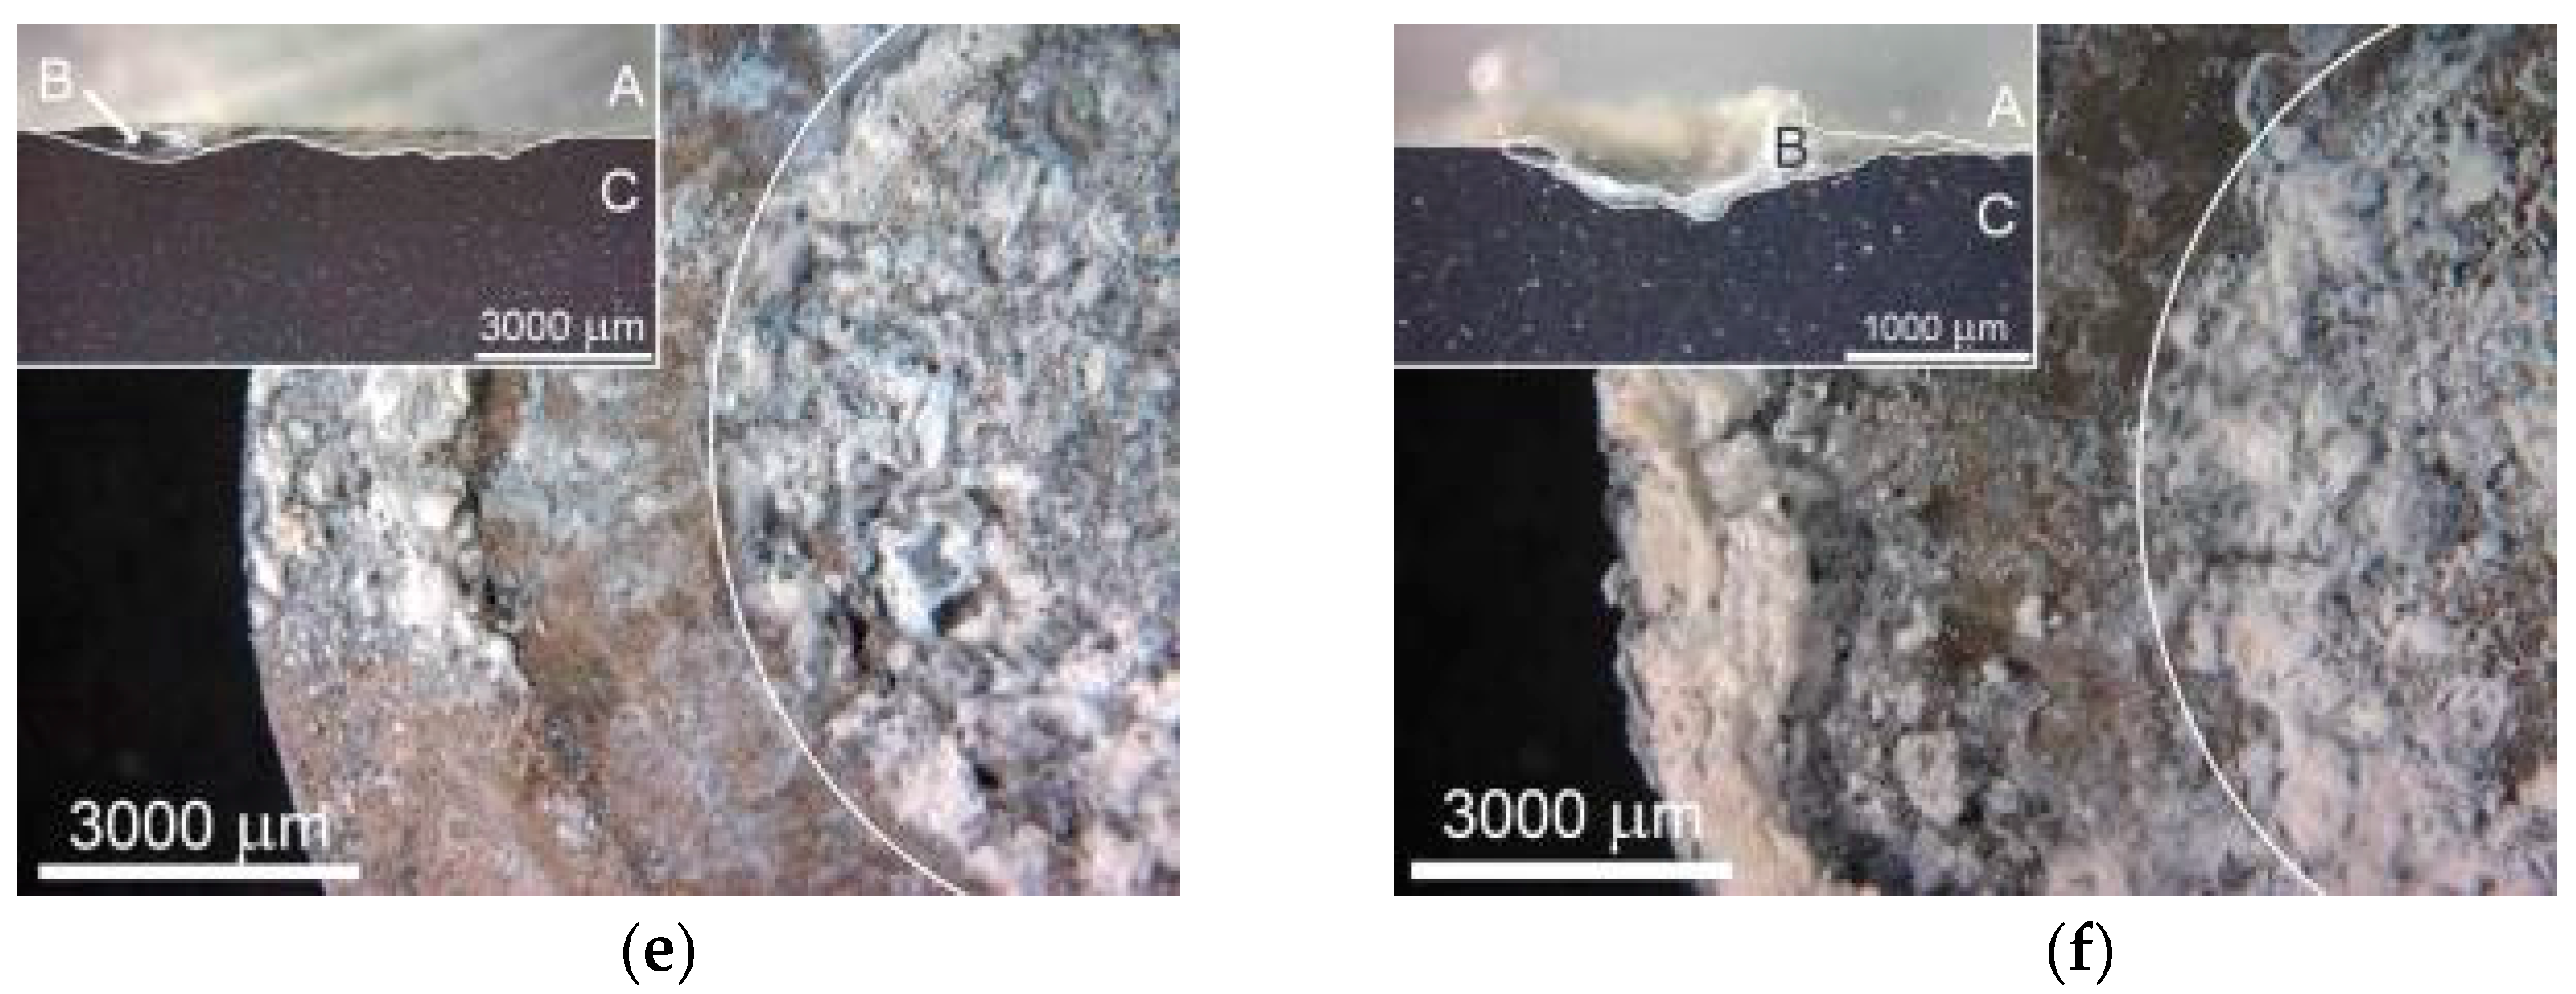
According to the Le Chatelier theory, HBSS should be more aggressive for magnesium than enriched HBSS. Comparing the corrosion process character of examined magnesium materials (Figure 9 and Figure 10), this theory was not clearly proven. The similar thickness of the layers of corrosion products (Figure 9), even the progress of corrosion attack within the material volume (Figure 10), was observed considering the same processing parameters. Corrosion attack progress was the only observed difference between the cold compacted and hot pressed samples; whereas the cold compacted samples that were only mechanically-bonded exhibited a more pronounced degradation process when compared to hot pressed samples. The higher compacting pressure used (500 MPa), resulting in even better material compaction, had a positive influence also on material corrosion resistance.
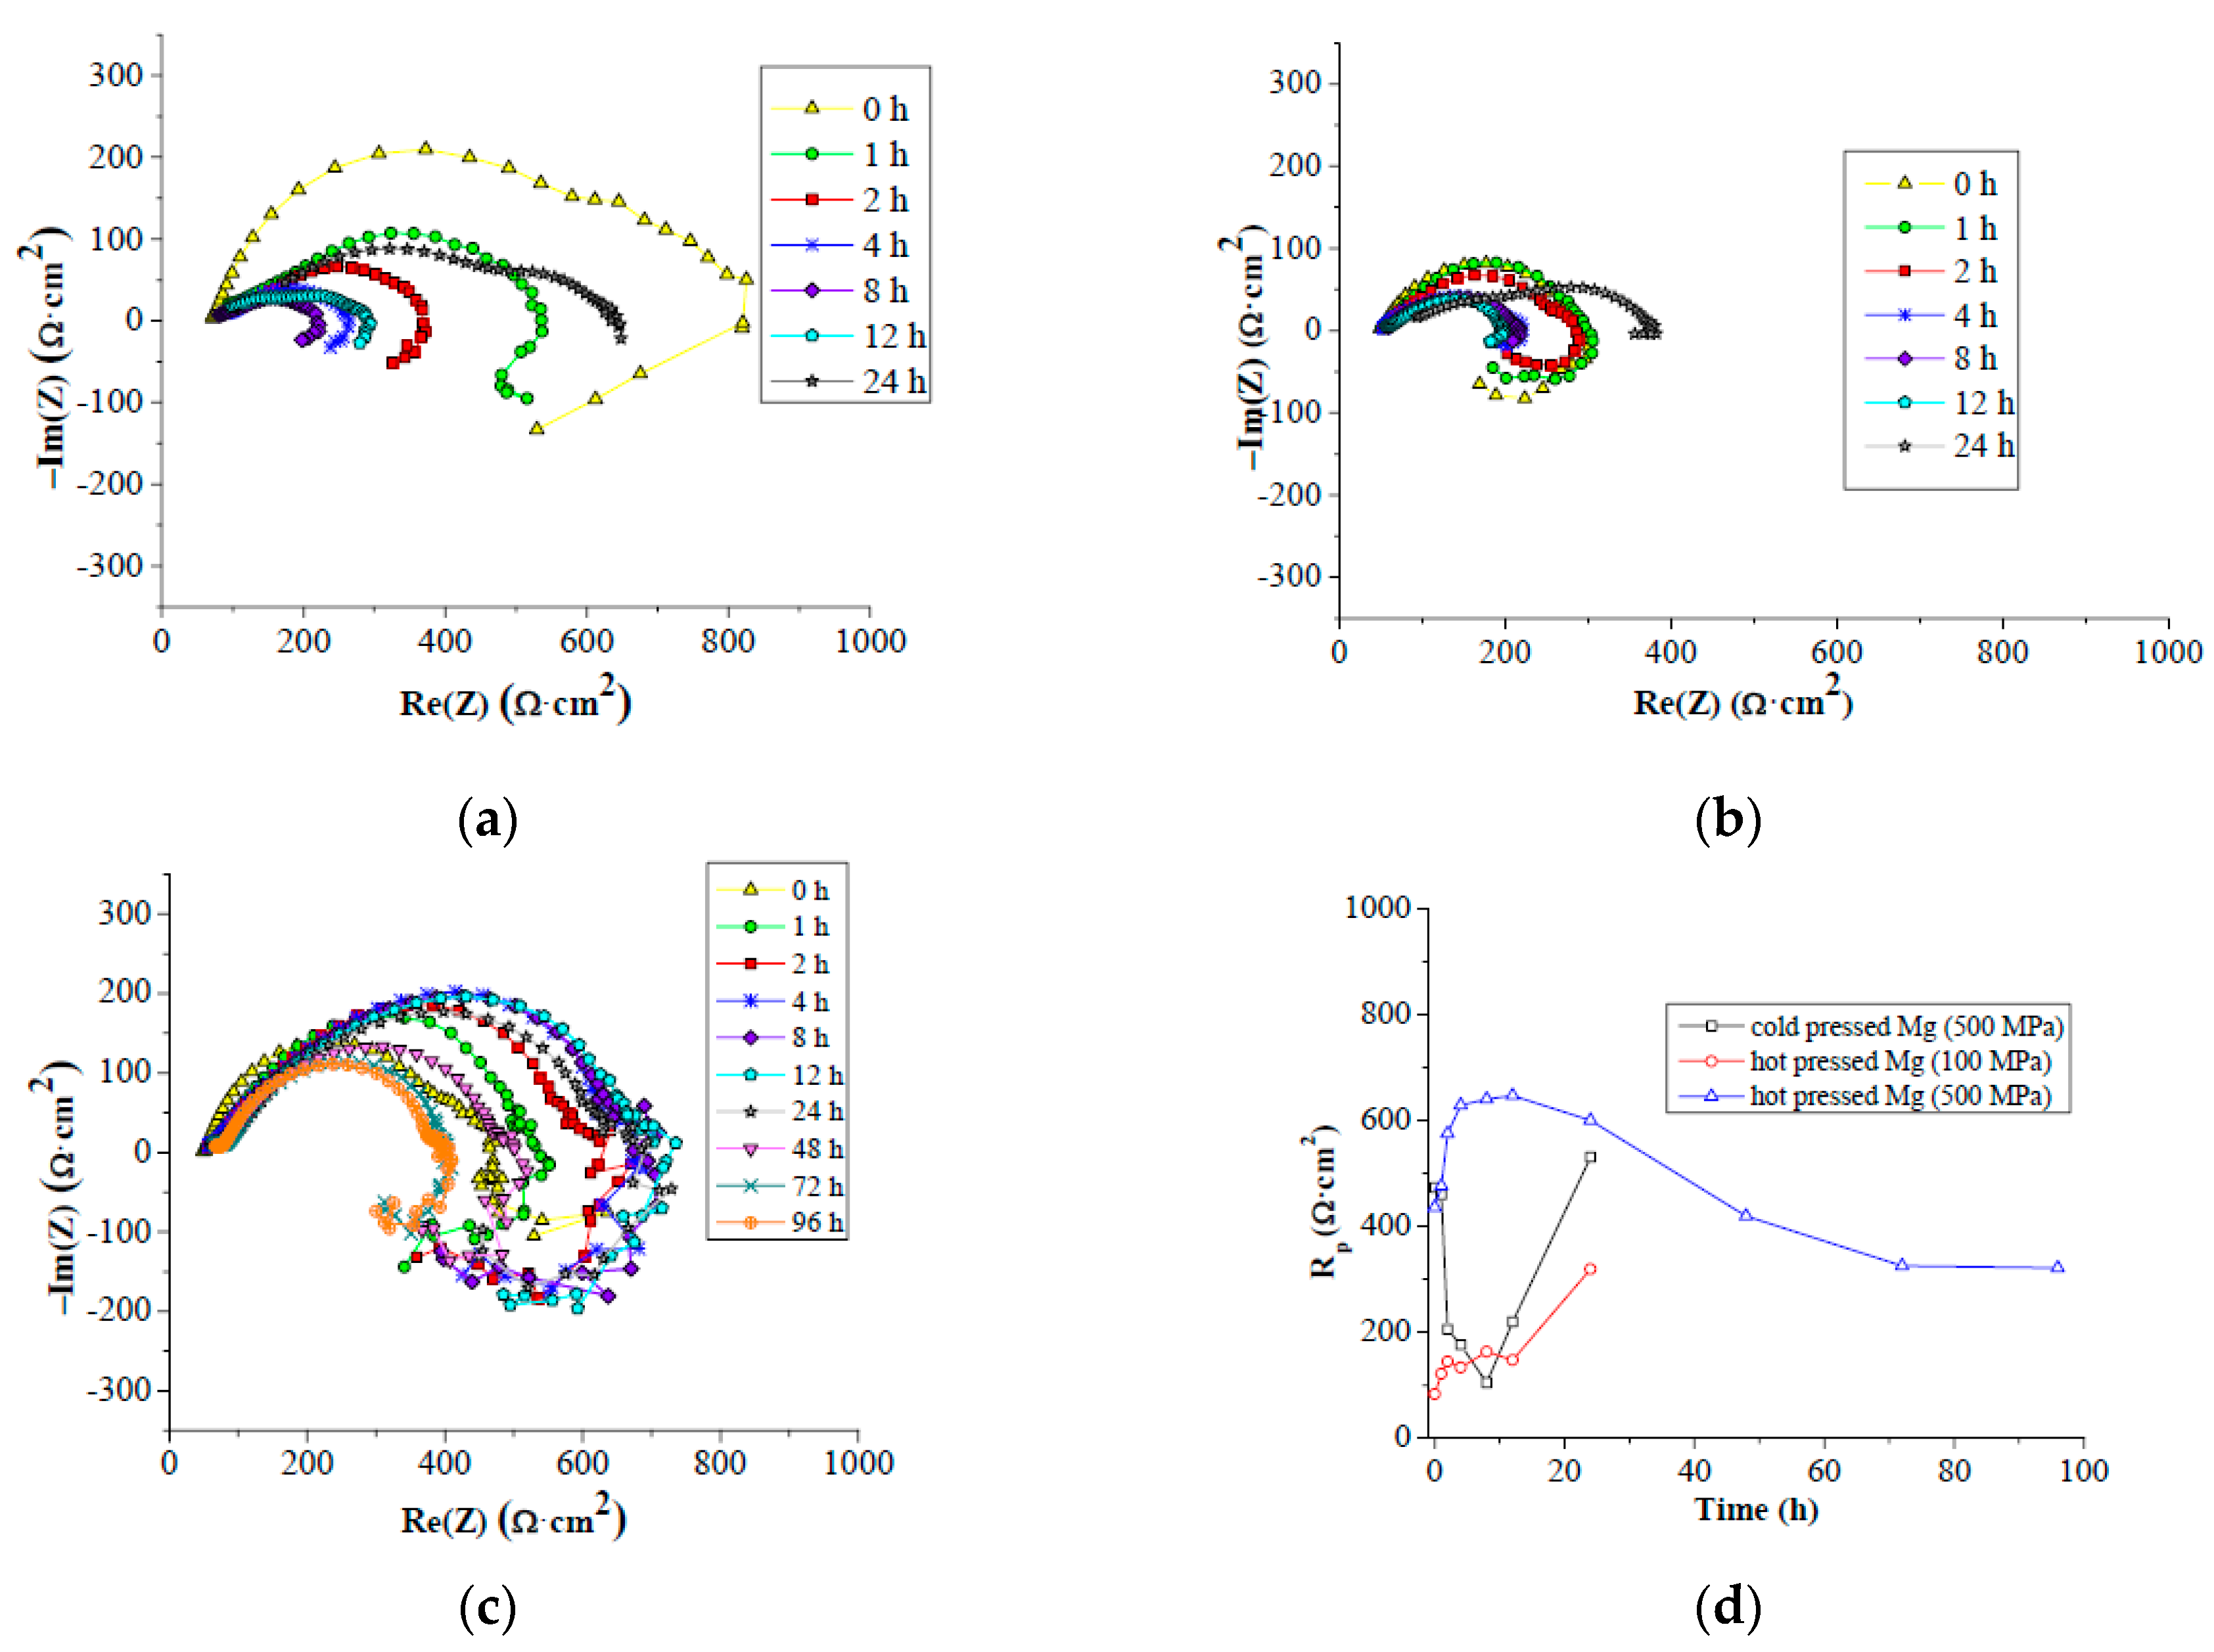
The highest corrosion resistance was reached for hot pressed magnesium materials prepared under 500 MPa in both corrosion mediums. This was proven by higher polarization resistance and duration of the corrosion experiment compared to other material states. The time of experiments indicates more pronounced corrosion attack of samples in HBSS compared to enriched HBSS. This difference was not observed for hot pressed samples prepared under 500 MPa. However, the values of Rp determined for the materials tested in both solution types did not exhibit significant differences, and the higher aggressiveness of HBSS compared to enriched HBSS was not proven with the results. Slightly higher values of Rp reached for different material states in enriched HBSS when compared to HBSS did not show a significant influence of corrosion environment on material properties. However, similar values of Rp were reached at the end of EIS test for all the materials in each corrosion environment. Different material types exhibit similar corrosion behavior regardless of the corrosion environment used.

5. Conclusions

Powder metallurgy processed magnesium compacts prepared at room temperature and at 300 °C, 400 °C and 500 °C under pressures in the range from 100 MPa to 500 MPa were analyzed in terms of the evolution of the microstructure, mechanical properties and electrochemical corrosion characteristics.
Microstructural analysis revealed a positive influence of increasing pressure and temperature on material compaction and porosity. The increase of the compacting pressure used led to increasing of the powder particles’ deformation, which corresponds to the decrease of compacts’ porosity. Elevating pressing temperature resulted in significant enhancement of powder particles’ deformability and a decrease of compacts’ porosity. EBSD analysis showed fine-grained structure within cold compacted powder particles; however, it also revealed that the powder particles were not bonded. Elevated temperature resulted in grain coarsening; however, the powder particles were bonded.
Flexural strength was observed to be enhanced up to five times for the hot pressed samples compared to the cold compacted samples. The samples prepared at 500 °C reached similar values of flexural strength as cold compacted samples. While only the inter-granular fracture mechanism was observed for cold compacted and hot pressed samples prepared under lower pressures (below 300 MPa), samples prepared at 400 °C using higher compacting pressures exhibited also a trans-granular fracture. Vickers microhardness of hot pressed samples was comparable for all the preparation temperatures, and the values were higher than for cold compacted samples (up to 40%).
Electrochemical impedance spectroscopy measurements revealed a positive influence of the hot pressing on the electrochemical corrosion behavior of PM magnesium. For both corrosion environments used, the highest values of polarization resistance in time were determined for the hot pressed samples prepared under 500 MPa. The corrosion mechanism was similar to the cold pressed and hot pressed samples prepared under low pressures, where a layer of corrosion products (thicker for cold compacted samples) was observed on the tested samples’ surface. A similar response of both sample types was observed using HBSS and enriched HBSS (considering the sample preparation conditions). Less pronounced corrosion attack was observed for hot pressed samples prepared under 500 MPa, and also, a similar material response for both the corrosion environment types was observed.
Applying temperatures of 300 °C and 400 °C and high pressures (300 to 500 MPa) for magnesium powder compaction seems to have a significantly positive influence on material bonding, mechanical and electrochemical corrosion properties. A higher compaction temperature was shown to have a detrimental effect on material compaction when using compacting pressure above 200 MPa.

Acknowledgments

This work was supported by Project No. LO1211, Materials Research Centre and by Project No. LO1202, NETME (New Technologies for Mechanical Engineering) center plus, projects of Ministry of Education, Youth and Sports of the Czech Republic under the “National sustainability program”.

Author Contributions

Pavel Doležal and Matěj Březina conceived and designed the experiments. Matěj Březina, Michaela Krystýnová and Jozef Minda performed the experiments. Matěj Březina and Jozef Minda analyzed the data. Stanislava Fintová, Petr Ptáček, Josef Zapletal and Jaromír Wasserbauer contributed reagents/materials/analysis tools. Matěj Březina and Stanislava Fintová wrote the paper.

Conflicts of Interest

The authors declare no conflict of interest. The founding sponsors had no role in the design of the study; in the collection, analyses or interpretation of data; in the writing of the manuscript; nor in the decision to publish the results.

References

  1. Kubásek, J.; Dvorský, D.; Čavojský, M.; Vojtěch, D.; Beronská, N.; Fousová, M. Superior properties of Mg-4Y-3RE-Zr alloy prepared by powder metallurgy. J. Mater. Sci. Technol. 2017, 33, 652–660. [Google Scholar] [CrossRef]
  2. Zhou, T.; Yang, M.; Zhou, Z.; Hu, J.; Chen, Z. Microstructure and mechanical properties of rapidly solidified/powder metallurgy Mg-6Zn and Mg-6Zn-5Ca at room and elevated temperatures. J. Alloys Compd. 2013, 560, 161–166. [Google Scholar] [CrossRef]
  3. Yan, Y.; Cao, H.; Kang, Y.; Yu, K.; Xiao, T.; Luo, J.; Deng, Y.; Fang, H.; Xiong, H.; Dai, Y. Effects of Zn concentration and heat treatment on the microstructure, mechanical properties and corrosion behavior of as-extruded Mg-Zn alloys produced by powder metallurgy. J. Alloys Compd. 2017, 693, 1277–1289. [Google Scholar] [CrossRef]
  4. Chang, I.; Zhao, Y. Advances in Powder Metallurgy: Properties, Processing and Applications; Woodhead Publishing: Cambridge, UK, 2013; p. 90. [Google Scholar]
  5. Suwas, S.; Gottstein, G.; Kumar, R. Evolution of crystallographic texture during equal channel angular extrusion (ECAE) and its effects on secondary processing of magnesium. Mater. Sci. Eng. A 2007, 471. [Google Scholar] [CrossRef]
  6. Shen, J.; Imai, H.; Chen, B.; Ye, X.; Umeda, J.; Kondoh, K. Deformation mechanisms of pure Mg materials fabricated by using pre-rolled powders. Mater. Sci. Eng. A 2016, 658, 309–320. [Google Scholar] [CrossRef]
  7. Stulikova, I.; Smola, B.; Vlach, M.; Kudrnova, H.; Piesova, J. Influence of powder metallurgy route on precipitation processes in MgTbNd alloy. Mater. Charact. 2016, 112, 149–154. [Google Scholar] [CrossRef]
  8. Manne, B.; Bontha, S.; Ramesh, M.R.; Krishna, M.; Balla, V.K. Solid state amorphization of Mg-Zn-Ca system via mechanical alloying and characterization. Adv. Powder Technol. 2017, 28, 223–229. [Google Scholar] [CrossRef]
  9. Bornapour, M.; Celikin, M.; Cerruti, M.; Pekguleryuz, M. Magnesium implant alloy with low levels of strontium and calcium: The third element effect and phase selection improve bio-corrosion resistance and mechanical performance. Mater. Sci. Eng. C 2014, 35, 267–282. [Google Scholar] [CrossRef] [PubMed]
  10. Nayak, S.; Bhushan, B.; Jayaganthan, R.; Gopinath, P.; Agarwal, R.D.; Lahiri, D. Strengthening of Mg based alloy through grain refinement for orthopaedic application. J. Mech. Behav. Biomed. Mater. 2016, 59, 57–70. [Google Scholar] [CrossRef] [PubMed]
  11. Wang, X.; Hu, L.; Liu, K.; Zhang, Y. Grain growth kinetics of bulk AZ31 magnesium alloy by hot pressing. J. Alloys Compd. 2012, 527, 193–196. [Google Scholar] [CrossRef]
  12. Kayhan, S.M.; Tahmasebifar, A.; Koç, M.; Usta, Y.; Tezcaner, A.; Evis, Z. Experimental and numerical investigations for mechanical and microstructural characterization of micro-manufactured AZ91D magnesium alloy disks for biomedical applications. Mater. Des. 2016, 93, 397–408. [Google Scholar] [CrossRef]
  13. Meng, F.; Rosalie, J.M.; Singh, A.; Tsuchiya, K. Precipitation behavior of an ultra-fine grained Mg-Zn alloy processed by high-pressure torsion. Mater. Sci. Eng. A 2015, 644, 386–391. [Google Scholar] [CrossRef]
  14. Reddy, T.H.; Pal, S.; Kumar, K.C.; Mohan, M.K.; Kokol, V. Finite element analysis for mechanical response of magnesium foams with regular structure obtained by powder metallurgy method. Procedia Eng. 2016, 149, 425–430. [Google Scholar] [CrossRef]
  15. Vahid, A.; Hodgson, P.; Li, Y. New porous Mg composites for bone implants. J. Alloys Compd. 2017, 724, 176–186. [Google Scholar] [CrossRef]
  16. Zhang, S.; Zheng, Y.; Zhang, L.; Bi, Y.; Li, J.; Liu, J.; Yu, Y.; Guo, H.; Li, Y. In vitro and in vivo corrosion and histocompatibility of pure Mg and a Mg-6Zn alloy as urinary implants in rat model. Mater. Sci. Eng. C 2016, 68, 414–422. [Google Scholar] [CrossRef] [PubMed]
  17. Khalajabadi, S.Z.; Abdul Kadir, M.R.; Izman, S.; Marvibaigi, M. The effect of MgO on the biodegradation, physical properties and biocompatibility of a Mg/HA/MgO nanocomposite manufactured by powder metallurgy method. J. Alloys Compd. 2016, 655, 266–280. [Google Scholar] [CrossRef]
  18. Bornapour, M.; Muja, N.; Shum-Tim, D.; Cerruti, M.; Pekguleryuz, M. Biocompatibility and biodegradability of Mg-Sr alloys: The formation of Sr-substituted hydroxyapatite. Acta Biomater. 2013, 9, 5319–5330. [Google Scholar] [CrossRef] [PubMed]
  19. Singh Raman, R.K.; Jafari, S.; Harandi, S.E. Corrosion fatigue fracture of magnesium alloys in bioimplant applications: A review. Eng. Fract. Mech. 2015, 137, 97–108. [Google Scholar] [CrossRef]
  20. Yazdimamaghani, M.; Razavi, M.; Vashaee, D.; Moharamzadeh, K.; Boccaccini, A.R.; Tayebi, L. Porous magnesium-based scaffolds for tissue engineering. Mater. Sci. Eng. C 2017, 71, 1253–1266. [Google Scholar] [CrossRef] [PubMed]
  21. Drábiková, J.; Pastorek, F.; Fintová, S.; Doležal, P.; Wasserbauer, J. Improvement of bio-compatible AZ61 magnesium alloy corrosion resistance by fluoride conversion coating. Koroze Ochrana Mater. 2016, 60. [Google Scholar] [CrossRef]
  22. Shadanbaz, S.; Dias, G.J. Calcium phosphate coatings on magnesium alloys for biomedical applications: A review. Acta Biomater. 2012, 8, 20–30. [Google Scholar] [CrossRef] [PubMed]
  23. Chiu, K.Y.; Wong, M.H.; Cheng, F.T.; Man, H.C. Characterization and corrosion studies of fluoride conversion coating on degradable Mg implants. Surf. Coat. Technol. 2007, 202, 590–598. [Google Scholar] [CrossRef]
  24. Carboneras, M.; Hernández, L.S.; Del Valle, J.A.; García-Alonso, M.C.; Escudero, M.L. Corrosion protection of different environmentally friendly coatings on powder metallurgy magnesium. J. Alloys Compd. 2010, 496, 442–448. [Google Scholar] [CrossRef]
  25. Jafari, S.; Singh Raman, R.K.; Davies, C.H.J. Corrosion fatigue of a magnesium alloy in modified simulated body fluid. Eng. Fract. Mech. 2015, 137, 2–11. [Google Scholar] [CrossRef]
  26. Tahmasebifar, A.; Kayhan, S.M.; Evis, Z.; Tezcaner, A.; Çinici, H.; Koç, M. Mechanical, electrochemical and biocompatibility evaluation of AZ91D magnesium alloy as a biomaterial. J. Alloys Compd. 2016, 687, 906–919. [Google Scholar] [CrossRef]
  27. King, A.D.; Birbilis, N.; Scully, J.R. Accurate electrochemical measurement of magnesium corrosion rates; a combined impedance, mass-loss and hydrogen collection study. Electrochim. Acta 2014, 121, 394–406. [Google Scholar] [CrossRef]
  28. Bender, S.; Goellner, J.; Heyn, A.; Schmigalla, S. A new theory for the negative difference effect in magnesium corrosion. Mater. Corros. 2011. [Google Scholar] [CrossRef]
  29. Liao, J.; Hotta, M.; Mori, Y. Improved corrosion resistance of a high-strength Mg-Al-Mn-Ca magnesium alloy made by rapid solidification powder metallurgy. Mater. Sci. Eng. A 2012, 544, 10–20. [Google Scholar] [CrossRef]
  30. Song, G.-L. Corrosion of magnesium alloys. In Woodhead Publishing in Materials; Woodhead Publishing: Philadelphia, PA, USA, 2011; p. 640. [Google Scholar]
  31. Čapek, J.; Vojtěch, D. Properties of porous magnesium prepared by powder metallurgy. Mater. Sci. Eng. C 2013, 33, 564–569. [Google Scholar] [CrossRef] [PubMed]
  32. Čapek, J.; Vojtěch, D. Effect of sintering conditions on the microstructural and mechanical characteristics of porous magnesium materials prepared by powder metallurgy. Mater. Sci. Eng. C 2014, 35, 21–28. [Google Scholar] [CrossRef] [PubMed]
  33. Orazem, M.E.; Tribollet, B. Electrochemical Impedance Spectroscopy; Wiley: Hoboken, NJ, USA, 2008; p. 560. [Google Scholar]
  34. Drápala, J. Hořčík, Jeho Slitiny a Binární Systémy Hořčík—Příměs: Magnesium, Its Alloya and Mg-Admixture Binary Systems; Vysoká škola báňská—Technická Univerzita: Ostrava, Czech Republic, 2004; p. 172. [Google Scholar]
  35. Kang, F.; Li, Z.; Wang, J.T.; Cheng, P.; Wu, H.Y. The activation of 〈c + a〉 non-basal slip in magnesium alloys. J. Mater. Sci. 2012, 47, 7854–7859. [Google Scholar] [CrossRef]
  36. Xin, Y.; Huo, K.; Tao, H.; Tang, G.; Chu, P.K. Influence of aggressive ions on the degradation behavior of biomedical magnesium alloy in physiological environment. Acta Biomater. 2008, 4, 2008–2015. [Google Scholar] [CrossRef] [PubMed]
Figure 1. Magnesium powder SEM (scanning electron microscope): powder particles’ morphology and size distribution.
Metals 07 00461 g001
Figure 2. Microstructure of selected samples: (a,b) cold compacted at 100 MPa; (c,d) cold compacted at 500 MPa; (e,f) hot pressed at 100 MPa, 400 °C; (g,h) hot pressed at 500 MPa, 400 °C; pores are indicated with arrows.
Metals 07 00461 g002aMetals 07 00461 g002b
Figure 3. Electron backscattered diffraction (EBSD) analysis of cold compacted and hot pressed material: (a) SEM image and (b) EBSD map of the cold compacted sample prepared under 400 MPa; (c) SEM image and (d) EBSD map of the hot pressed sample prepared under 400 MPa at 400 °C. Colored-metallic grains of magnesium: dark—grain boundary (lines), pores or oxides (wide gaps).
Metals 07 00461 g003
Figure 4. Three-point bending tests and microhardness measurement results; (a) flexural strength, (b) microhardness reuslts (RT: room temperature).
Metals 07 00461 g004
Figure 5. Selected fracture surfaces of samples’ failure during three-point bending test: (a) cold compacted 100 MPa; (b) cold compacted 500 MPa; (c) hot pressed 100 MPa at 400 °C; (d) hot pressed 500 MPa at 400 °C.
Metals 07 00461 g005
Figure 6. (ac) Equivalent circuits used for evaluation of the Nyquist plots.
Metals 07 00461 g006
Figure 7. Electrochemical behavior of powder metallurgy (PM) magnesium materials in HBSS: (a) cold pressed 500 MPa; (b) hot pressed 100 MPa at 400 °C; (c) hot pressed 500 MPa at 400 °C; (d) comparison of Rp values in time.
Metals 07 00461 g007
Figure 8. Electrochemical behavior of PM magnesium materials in enriched HBSS: (a) cold pressed 500 MPa; (b) hot pressed 100 MPa 400 °C; (c) hot pressed 500 MPa 400 °C; (d) comparison of Rp values in time.
Metals 07 00461 g008
Figure 9. Corroded surface of PM magnesium compacts (the area exposed during EIS measurement is outlined) and specimens cross-sections (A, resin; B, layer of corrosion products; C, compact); (a) cold compacted under 500 MPa, 12 h in HBSS; (b) cold compacted under 500 MPa, 24 h in enriched HBSS; (c) hot pressed under 100 MPa, 400 °C, 12 h in HBSS; (d) hot pressed under 100 MPa, 400 °C, 24 h in enriched HBSS; (e) hot pressed under 500 MPa, 400 °C, 96 h in HBSS; (f) hot pressed under 500 MPa, 400 °C, 96 h in enriched HBSS.
Metals 07 00461 g009aMetals 07 00461 g009b
Figure 10. Corroded cross-section of pure magnesium compacts: (a) cold compacted 500 MPa, 12 h in HBSS; (b) cold compacted 500 MPa, 24 h in enriched HBSS; (c) hot pressed 100 MPa, 400 °C, 12 h in HBSS; (d) hot pressed 100 MPa, 400 °C, 24 h in enriched HBSS; (e) hot pressed 500 MPa, 400 °C, 96 h in HBSS; (f) hot pressed 500 MPa, 400 °C, 96 h in enriched HBSS.
Metals 07 00461 g010
Table 1. Composition of the HBSS (Hank’s Balanced Salt Solution) and enriched HBSS (supplied by GE (General Electric) Healthcare) used.
ComponentConcentration (mg·dm−3)
HBSSEnriched HBSS
NaCl80008000
KCl400400
KH2PO46060
Glucose10001000
Na2HPO44848
MgSO4-98
CaCl2-140
Na2CO3350350
Table 2. Fitted EIS (electrochemical impedance spectroscopy) data for the cold compacted sample prepared under 500 MPa, HBSS.
Time (h)R1 (Ω·cm2)R2 (Ω·cm2)R3 (Ω·cm2)R4 (Ω·cm2)Rp (Ω·cm2)Q2 (F·sn−1·10−6)Q3 (F·sn−1·10−6)n2n3L4 (H)
06513064−161090.5072.500.610.97390
16324400196279.00715.000.670.600
26651161741012840.170.910.742
4635414521914122.160.001.000.541
860190−1−8190520.001.580.470.0142
1277189951892522215.720.670.561
Table 3. Fitted EIS data for the hot pressed sample prepared under 100 MPa at 400 °C, HBSS.
Time (h)R1 (Ω·cm2)R2 (Ω·cm2)R3 (Ω·cm2)R4 (Ω·cm2)Rp (Ω·cm2)Q2 (F·sn−1·10−6)Q3 (F·sn−1·10−6)n2n3L4 (H)
05426343-30573.92676.00.831.00-
150627−1−1627132.18887.00.740.690
24965511−10527136.47759.00.740.394
45147439690474176.86082.00.700.99136
848270162−2268206.95617.00.680.032
1253−3254-251262.626.60.550.86-
Table 4. Fitted EIS data for the hot pressed sample prepared under 500 MPa at 400 °C, HBSS.
Time (h)R1 (Ω·cm2)R2 (Ω·cm2)R3 (Ω·cm2)R4 (Ω·cm2)Rp (Ω·cm2)Q2 (F·sn−1·10−6)Q3 (F·sn−1·10−6)n2n3L3 (H)
054289107-39662.1-0.79-1005
155354.5164-51962.2-0.79-762
256456.5169-62658.0-0.79-540
461647245-89240.4-0.81-733
865512307-81931.6-0.82-2067
1266487283.5-77130.3-0.81-2081
2469368276-64431.6-0.79-1725
4874164156-32048.9-0.76-796
7272114132-24669.0-0.74-703
9678130131-26169.0-0.75-744
Table 5. Fitted EIS data for the cold compacted sample prepared under 500 MPa, enriched HBSS.
Time (h)R1 (Ω·cm2)R2 (Ω·cm2)R3 (Ω·cm2)R4 (Ω·cm2)Rp (Ω·cm2)Q2 (F·sn−1·10−6)Q3 (F·sn−1·10−6)n2n3L (H)
05670355−4547363.6126.30.720.1071
167327376204459105.395.90.710.470
260208129−3205689.8151.10.280.80996
47728156286617624.3285.40.650.630
8761476−5104644.1276.00.440.952
1271137115291219135.4915.50.430.600
2480423107-53028.6652.60.490.68-
Table 6. Fitted EIS data for the hot pressed sample prepared under 100 MPa at 400 °C, enriched HBSS.
Time (h)R1 (Ω·cm2)R2 (Ω·cm2)R3 (Ω·cm2)R4 (Ω·cm2)Rp (Ω·cm2)Q2 (F·sn−1·10−6)Q3 (F·sn−1·10−6)n2n3L (H)
050243125-8363.9-0.75-2799
152255231-121109.8-0.69-2368
252240360-144220.2-0.60-2693
451176539-133366.5-0.53-3512
85612241-163191.691.40.580.92-
125425123-14772.4190.10.610.65-
2470219100-31963.9171.10.410.77-
Table 7. Fitted EIS data for the hot pressed sample prepared under 500 MPa at 400 °C, enriched HBSS.
Time (h)R1 (Ω·cm2)R2 (Ω·cm2)R3 (Ω·cm2)R4 (Ω·cm2)Rp (Ω·cm2)Q2 (F·sn−1·10−6)Q3 (F·sn−1·10−6)n2n3L (H)
053332104-43632.32832.00.850.49-
164262215-47645.2-0.74-1526
265261314-57554.6-0.68-2367
467302326-62953.8-0.66-2520
872288352-64053.6-0.65-2268
1272260387-64753.5-0.65-3215
2484300300-60052.8-0.65-2246
4883194226-41957.0-0.71-2139
7284168157-32537.3-0.77-1410
9677156165-32142.4-0.76-1565

