Experimental Investigation on Electric Current-Aided Laser Stake Welding of Aluminum Alloy T-Joints

1
School of Mechanical Science and Engineering, Jilin University, Changchun 130025, China
2
State Key Laboratory of Advanced Welding and Joining, Harbin Institute of Technology, Harbin 150001, China
*
Author to whom correspondence should be addressed.
Metals 2017, 7(11), 467; https://doi.org/10.3390/met7110467
Submission received: 30 July 2017
/
Revised: 30 October 2017
/
Accepted: 30 October 2017
/
Published: 1 November 2017
(This article belongs to the Special Issue Laser Welding)
Abstract
:In the present study, aluminum alloy T-joints were welded using the laser stake-welding process. In order to improve the welding quality of the T-joints, an external electric current was used to aid the laser stake-welding process. The effects of the process parameters on the weld morphology, mechanical properties, and microstructure of the welded joints were analyzed and discussed in detail. The results indicate that the aided electric current should be no greater than a certain maximum value. Upon increasing the aided electric current, the weld width at the skin and stringer faying surface obviously increased, but there was an insignificant change in the penetration depth. Furthermore, the electric current and pressing force should be chosen to produce an expected weld width at the faying surface, whereas the laser power and welding speed should be primarily considered to obtain an optimal penetration depth. The tensile shear specimens failed across the faying surface or failed in the weld zone of the skin. The specimens that failed in the weld of the skin could resist a higher tensile shear load compared with specimens that failed across the faying surface. The microstructural observations and microhardness results demonstrated that the tensile shear load capacity of the aluminum alloy welded T-joint was mainly determined by the weld width at the faying surface.
1. Introduction
In industrial fields, T-joint structures have been extensively designed and used to decrease weight and improve the structure strength [1,2,3,4]. For T-joint structures, adhesive bonding or the welding process is usually employed to join the skin and stringer [5,6,7,8].
The laser welding process is considered a competitive technology for stake-welded T-joints because of its ability to form high-quality welds with a high aspect ratio (depth-to-width ratio), a small heat-affected zone (HAZ) and a high welding speed [9,10,11]. Romanoff et al. [12] evaluated the rotational stiffness of a steel-welded T-joint using laser stake welding, and their results indicated that the welded T-joint stiffness was mainly influenced by the weld thickness when the skin plate was thicker. Meng et al. [13] studied the weld geometry, microstructure and microhardness of typical laser-welded T-joints. A desired bead geometry of laser lap-welded steel T-joints can be produced by adopting a low welding speed, a thin face plate and a small gap. Li et al. [14] provided a mathematical model to study the porosity induced by the keyhole during the laser stake welding of steel T-joints, which indicated that the porosity formation was primarily attributable to keyhole collapse. In order to combine both advantages, laser-arc hybrid welding has been attempted as a new method to stake weld T-joints. Wang et al. [15] investigated the weld characteristics of laser-TIG (Tungsten Inert Gas) hybrid stake welding of a titanium alloy T-joint. It was found that the gap tolerance between the skin and stringer significantly improved using laser-arc hybrid welding, and it was especially suitable to stake weld T-joints with a thick skin component under high-precision assembly conditions. Hou et al. [16,17] performed a series of comparative investigations on magnesium alloy T-joints welded using different welding methods, including TIG welding, laser welding, laser-TIG welding, and laser-TIG welding with a filler wire. However, the skin of the T-joint was always excessively melted as the laser-arc hybrid stake welded the T-joint.
Friction stir welding is considered one of the most promising welding processes; this is a solid-state joining method for joining aluminum alloys. Fratini et al. [18] welded T-joints of two types of aluminum alloys using friction stir welding, and their results showed that high-quality AA6082 alloy T-joints were welded; however, there were poor results for the AA2024 alloy. Cui et al. [19] fabricated AA6061 T-joints via friction stir welding using three different combinations of skins and stringers. The results showed that increasing the welding speed leads to more welding defects. Zhao et al. [20] focused on the relations between the defects and welding parameters and the tensile properties of the T-joints. Some T-joints without tunnel defects could only be obtained with a traverse speed of 100 mm/min in their experiments, and the welding parameters influenced the features and sizes of the kissing-bond defects. Urbikain et al. [21] put forward a new method that was a combination of two processes, friction drilling and form tapping, for the rapid and economical welding of nutless joints. The combined method achieves a quick way for the production of threaded holes on couples of dissimilar metal alloys, as it is the case of steels and aluminum alloys.
In previous studies, steel T-joints and titanium alloy T-joints stake welding were always carried out by laser welding and laser-arc hybrid welding, respectively, and the combination of friction drilling and a form tapping process was used to join dissimilar metal alloy T-joints. Aluminum alloy T-joints were mainly accomplished via friction stir stake welding. Compared with friction stir welding, laser welding has advantages such as a high welding speed, low distortion, and ease of automation [22,23,24,25]. However, reports on the laser stake welding of aluminum alloy T-joints are rare, although this welding technology has great potential in aviation, aerospace, marine and automobile industries. Therefore, to investigate the feasibility and improve the weld quality of T-joints, in this study, aluminum alloy T-joints were welded via electric current-aided laser stake welding. After welding, the weld morphology, mechanical properties and microstructure of the welded joints were analyzed and discussed in detail.
2. Materials and Methods
The base metal used in this investigation was a 5A06 aluminum alloy plate. Plates that were 150 mm × 80 mm × 2 mm were used as the skin components, and plates that were 150 mm × 30 mm × 10 mm were used as the stringer components.
The chemical composition of the base metal is presented in Table 1. Before welding, the aluminum alloy plates were mechanically cleaned followed by acetone solution cleaning.
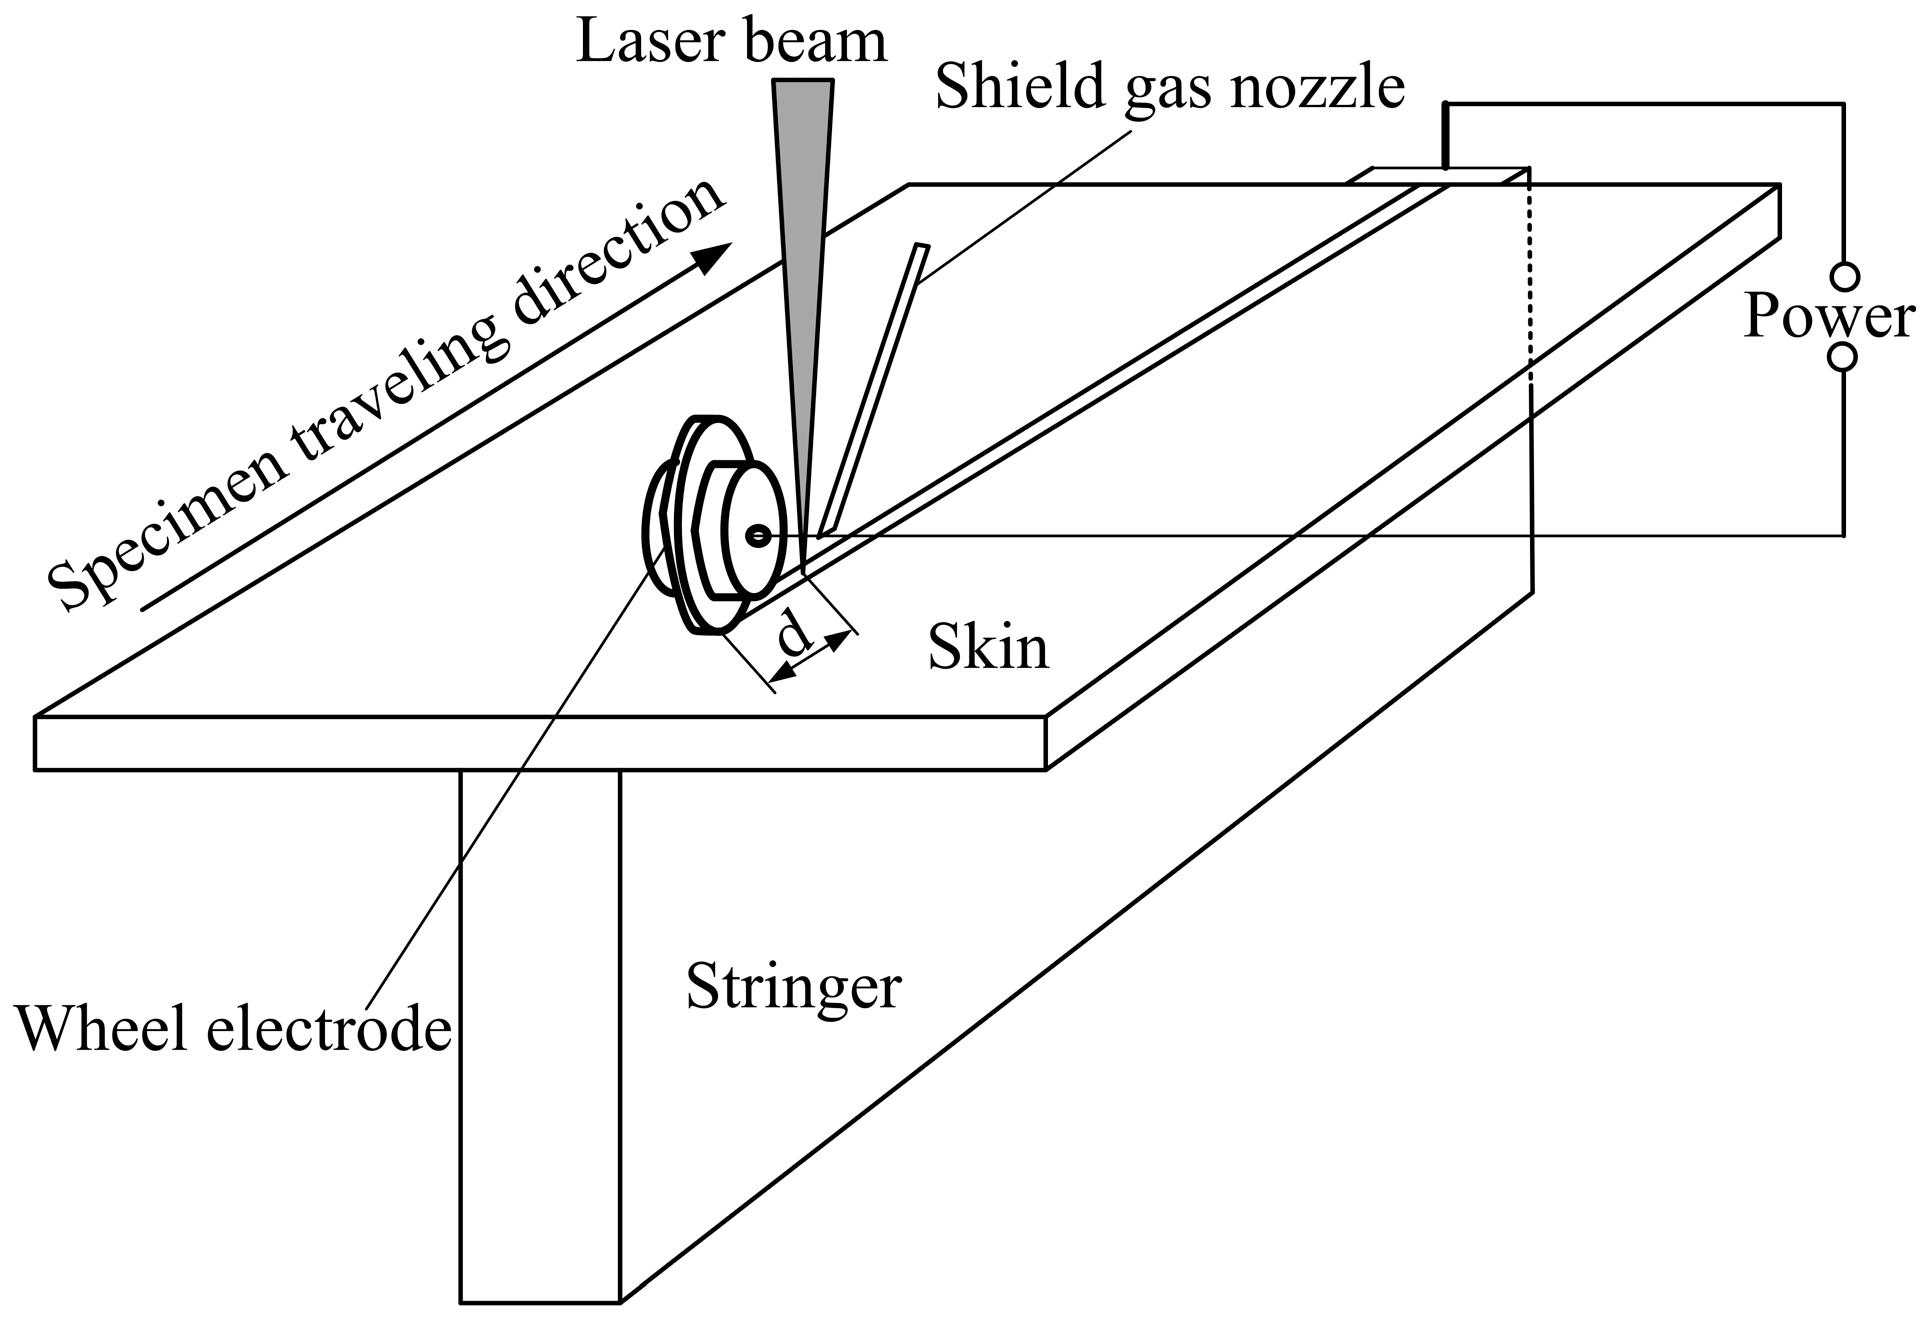
A CO2 laser (DC030; Rofin-Sinar, GmbH, Hamburg, Germany) source operating in continuous wave (CW) mode was used. A combination device (PSG6130 and PSI6200; Bosch Rexroth Company China, Shanghai, China) with an adjustable output electric current was used to supply the aided electric current, which could vary from 2.0 to 13.0 kA. As shown in Figure 1, the 5A06 aluminum alloy T-joints were welded via electric current-aided laser stake welding, as a rolling electrode and stringer component were connected to the positive and negative terminals of the power supply, respectively.
During the electric current-aided laser stake-welding process, the laser beam was focused on the top of the skin surface using a 190 mm focal length lens, and the focused spot diameter was 0.2 mm. The wheel electrode touched the top of the skin surface. While the T-joint specimens moved with the traveling device, the wheel electrode rotated about a fixed axis. The distance, d (illustrated in Figure 1), between the position of the bottom of the wheel electrode and the position of the laser beam focus was fixed at 25 mm. The flow rate of the argon shielding gas was 25 L/min.
Following the welding process, the welded T-joints were carried out to create specimens for metallographic analysis, microhardness and tensile shear tests. Considering the material and shape of the welded joint, the wire electro-discharge machining (WEDM) method was used to manufacture the test specimens [26]. The Instron5500R material tensile machine was used to perform the tensile shear test at a strain rate of 2 mm/min. The self-design clamping was used for the tensile shear test. The schematic diagram of the specimen assembly is shown in Figure 2; the compensation plates were used to avoid the bending moment. To perform the metallographic examination, the welded samples were sectioned, mounted, polished, and etched using a solution of 1 vol % HCl, 1.5 vol % HF, 2.5 vol % HNO3 and 95 vol % H2O for 5 s. The appearance of the weld cross-section and microstructure were observed using an optical microscope (Eclipse E200, Nikon Instruments (Shanghai) Co., Ltd., Shanghai, China). The weld depth and width measurements were obtained from the resulting optical graphs. The microhardness test was performed using a microhardness testing machine (HXD-1000TM; Zhuhai Precision Instrument Co., Ltd., Zhuhai, China) with a 150 g test load. The joint fracture characteristics were examined via scanning electron microscopy (SEM; S-4700; Hitachi High-Technologies in China, Suzhou, China) with an energy-dispersive X-ray spectrometer (EDS), and the SEM images were gained in the secondary electron imaging mode using a 12.5 mm working distance, a 20 kV accelerating voltage and a 40 μA emission current. The experimental equipment used in this study is listed in Table 2.
3. Experimental Results and Discussion
3.1. Weld Morphology of the T-Joint
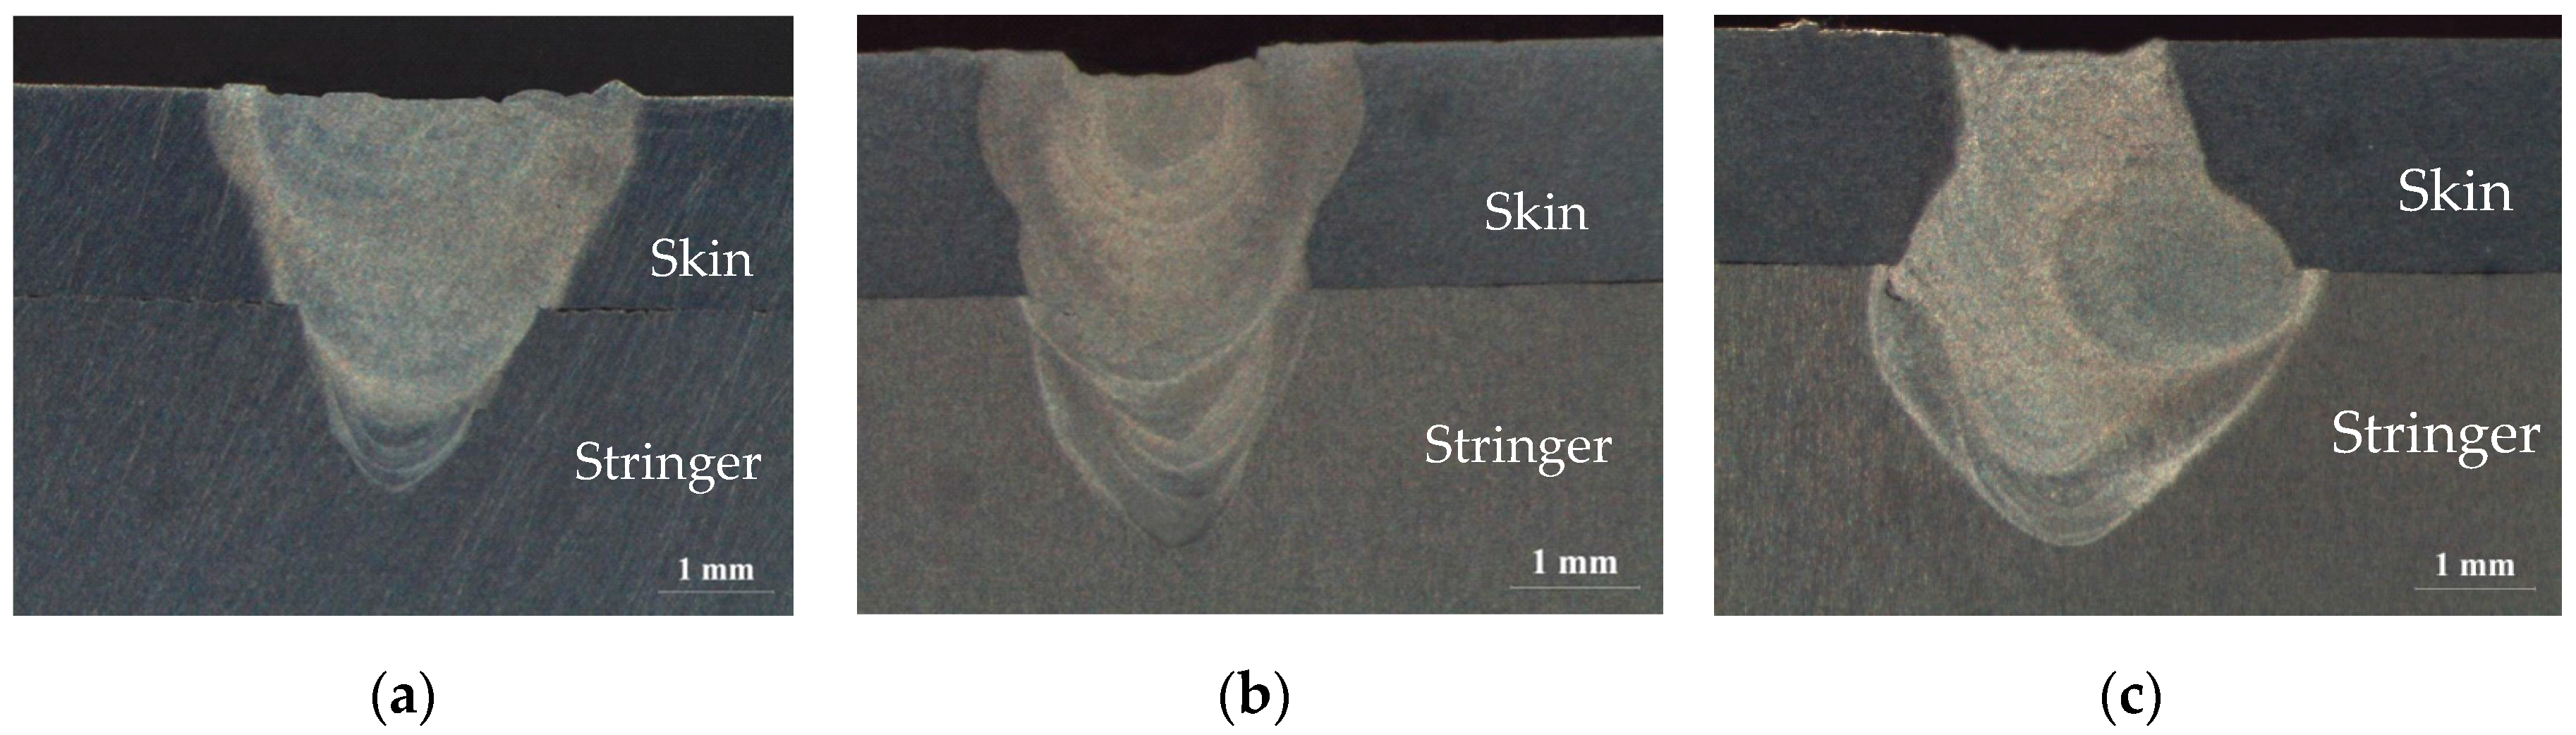
Figure 3 shows typical macrographs of the weld morphology of T-joints produced using different electric current-aided laser stake-welding processes. There was almost no root gap between the skin and stringer owing to the pressing by the wheel electrode, as shown in Figure 3. The weld morphology of the laser welding is a “wedge” profile, whereas the weld morphology noticeably changed in the electric current-aided laser-welded joints. The weld morphology was nearly a “cylindrical” profile, whereas the aided electric current was 3.5 kA, as shown in Figure 3b. The weld morphology exhibited an “amphoral” profile when the aided electric current increased to 5.0 kA, as shown in Figure 3c. However, when the electric current increased to 6.0 kA, the stability of the process clearly reduced, which caused the production of many spatters and serious concavity in the weld center, as shown in Figure 3d. When the electric current was 7.0 kA, the fluid metal in the molten pool flowed in a turbulent manner, and the weld quality was so bad that there was no effective joint between the skin and stringer, as shown in Figure 3e. Thus, the aided electric current in the systematic experimental investigation was varied from 0 to 5.0 kA in the following study.
3.2. Effects of Process Parameters on the Weld Morphology
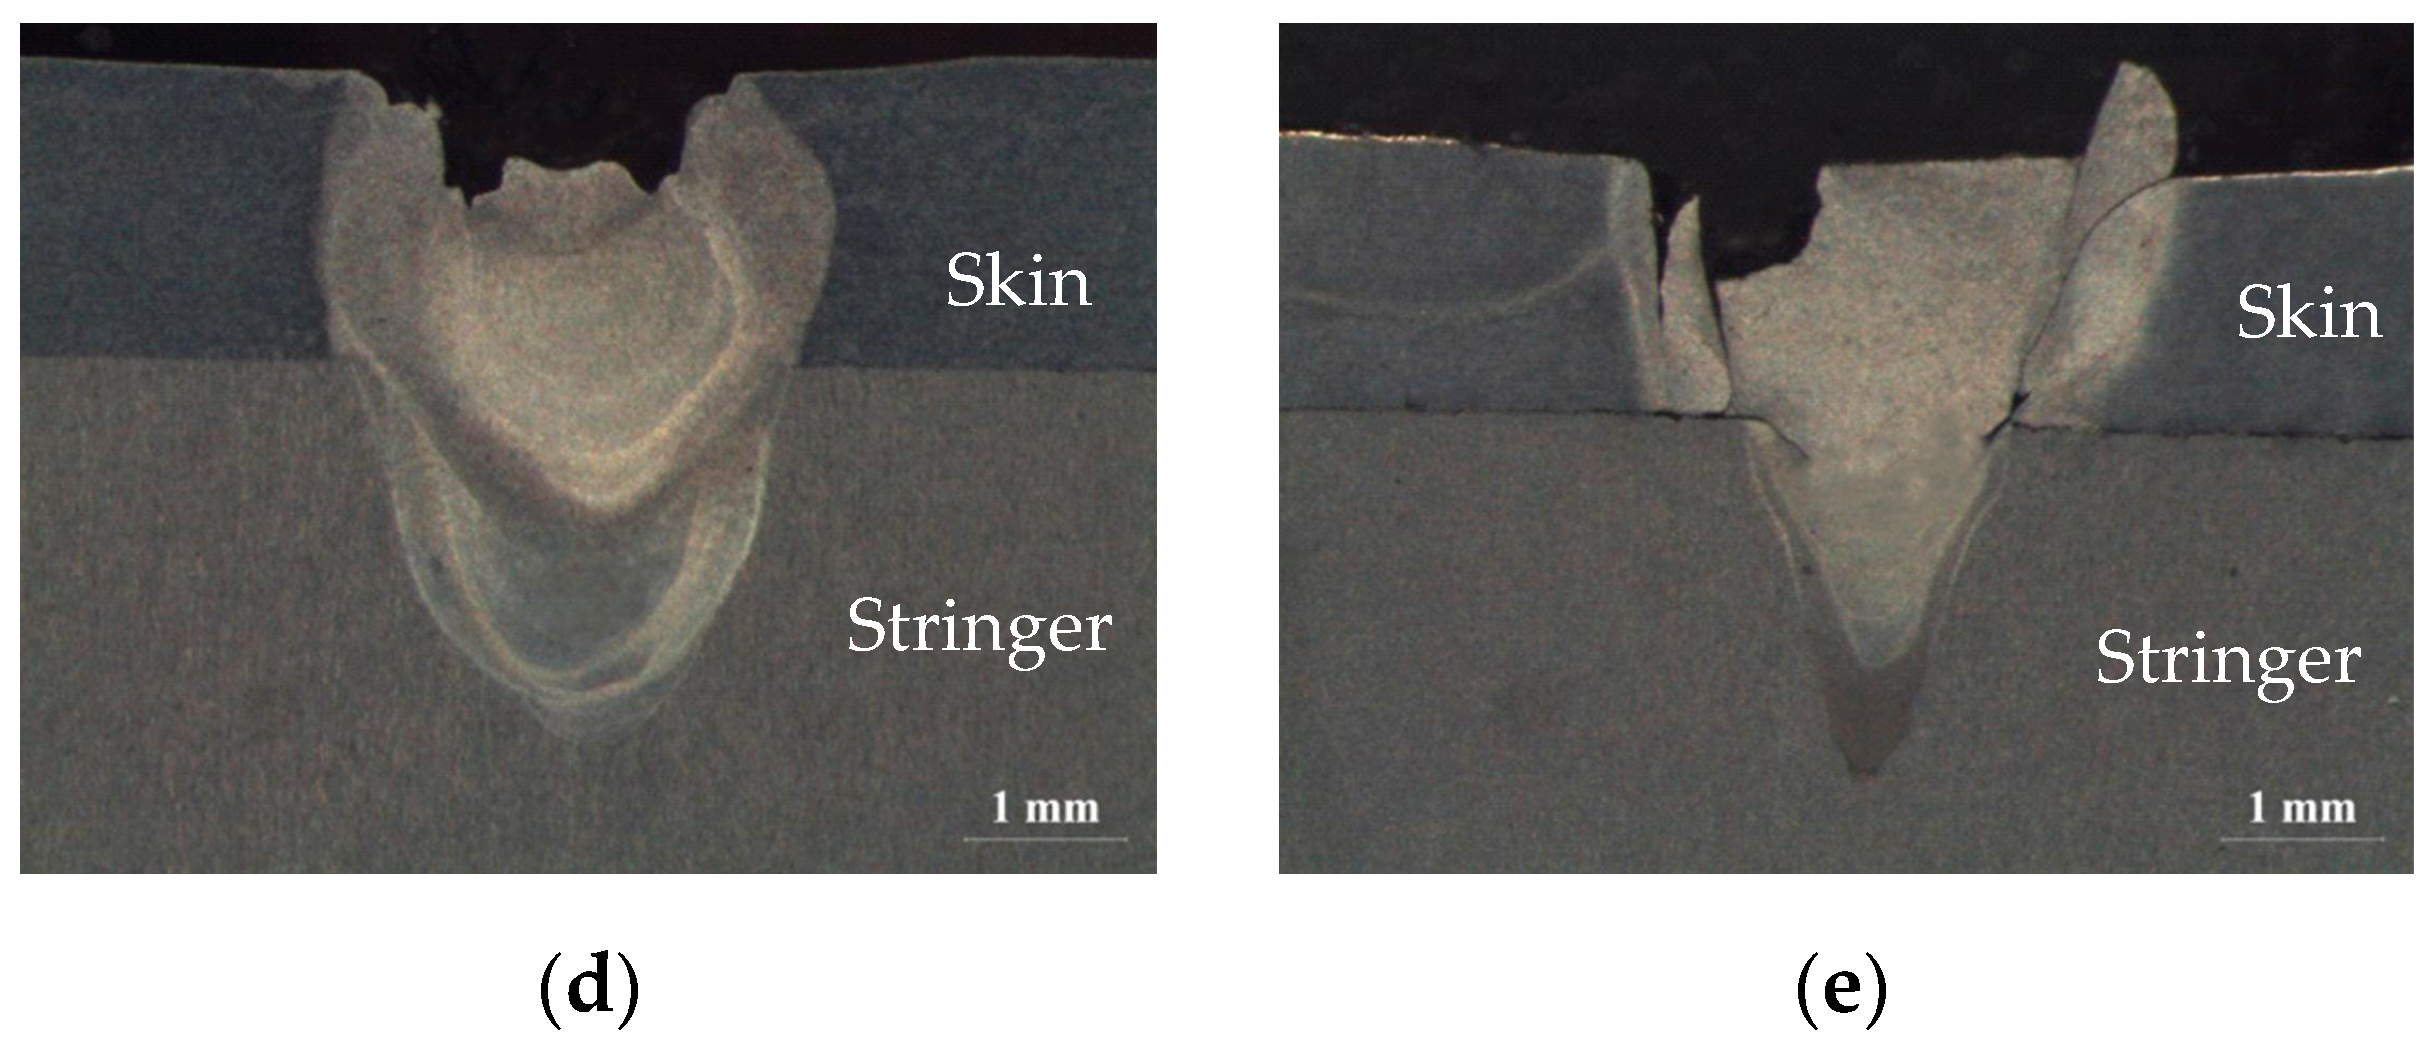
For the stake welded T-joints, the total depth of the weld demonstrates that the penetration capability and the weld width at the faying surface may significantly determine the loading capacity of T-joints. To determine the influence of the process parameters on the weld morphology, two geometric dimensions were extracted, namely, the total depth of the weld (H) and the weld width at the faying surface (W), as shown in Figure 4.
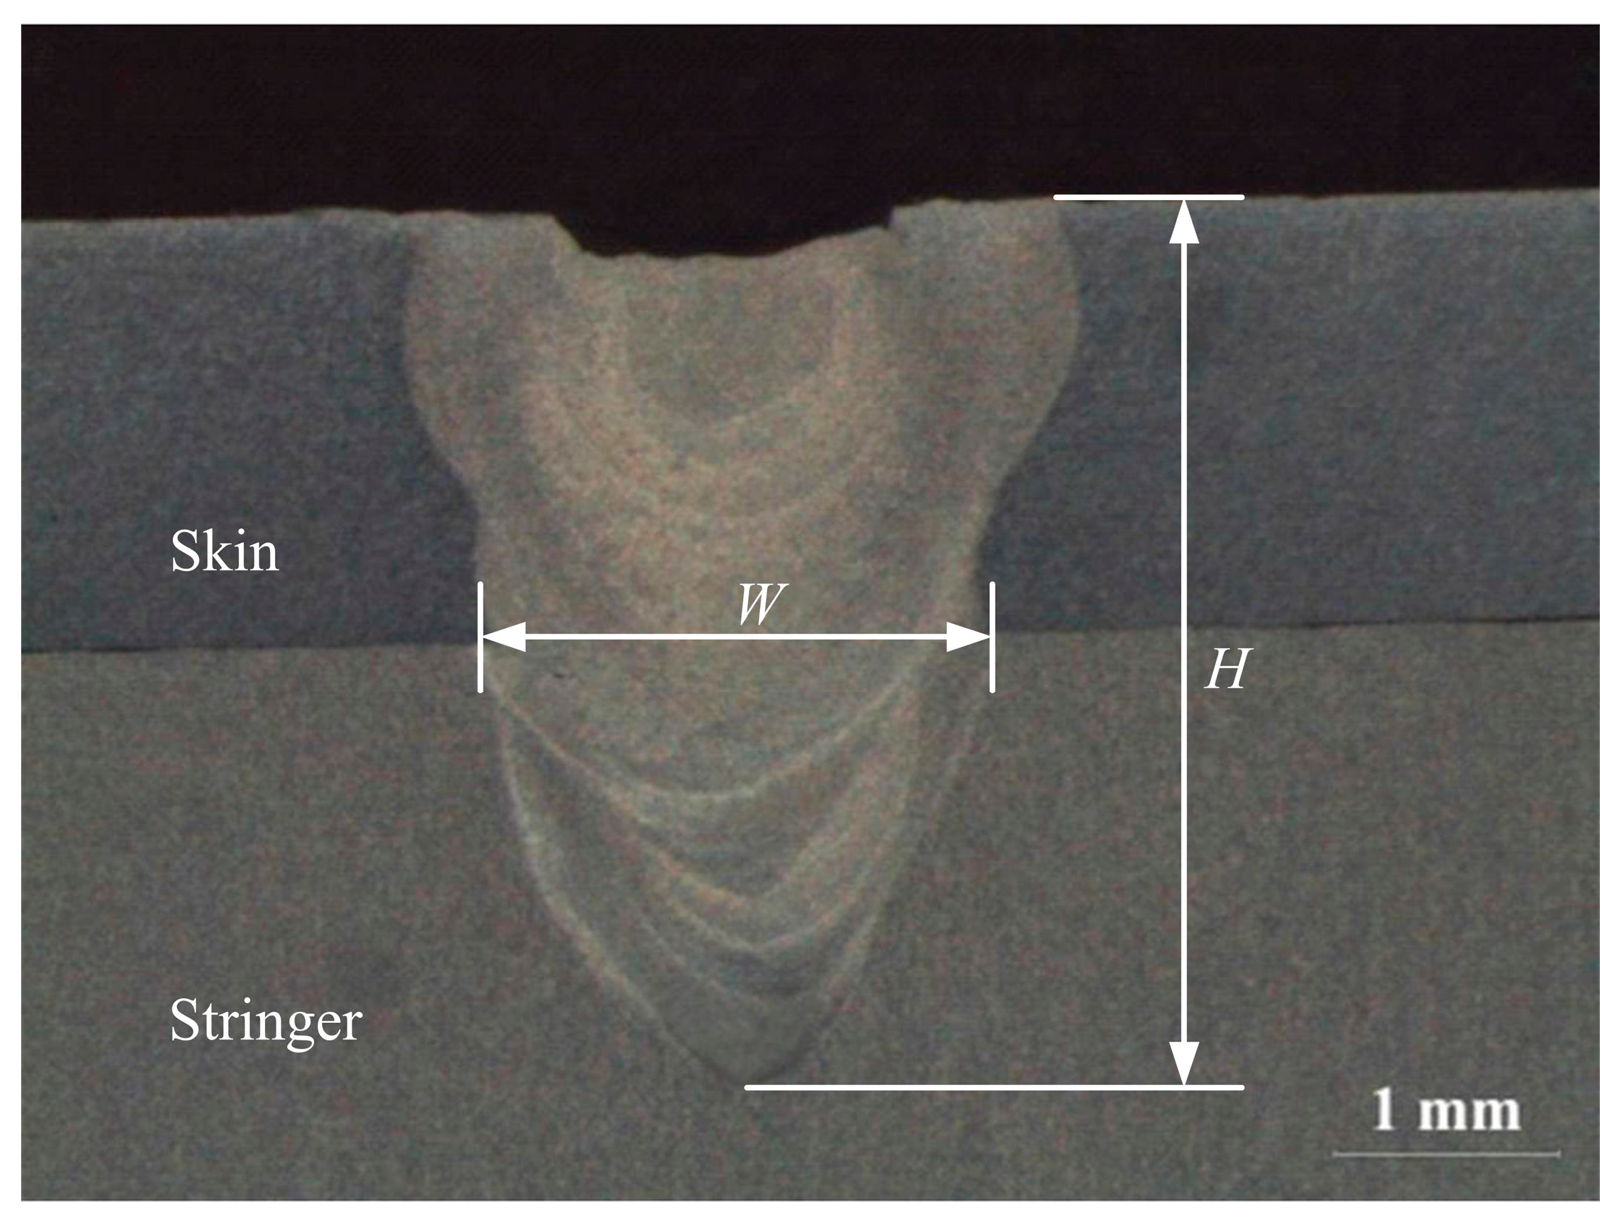
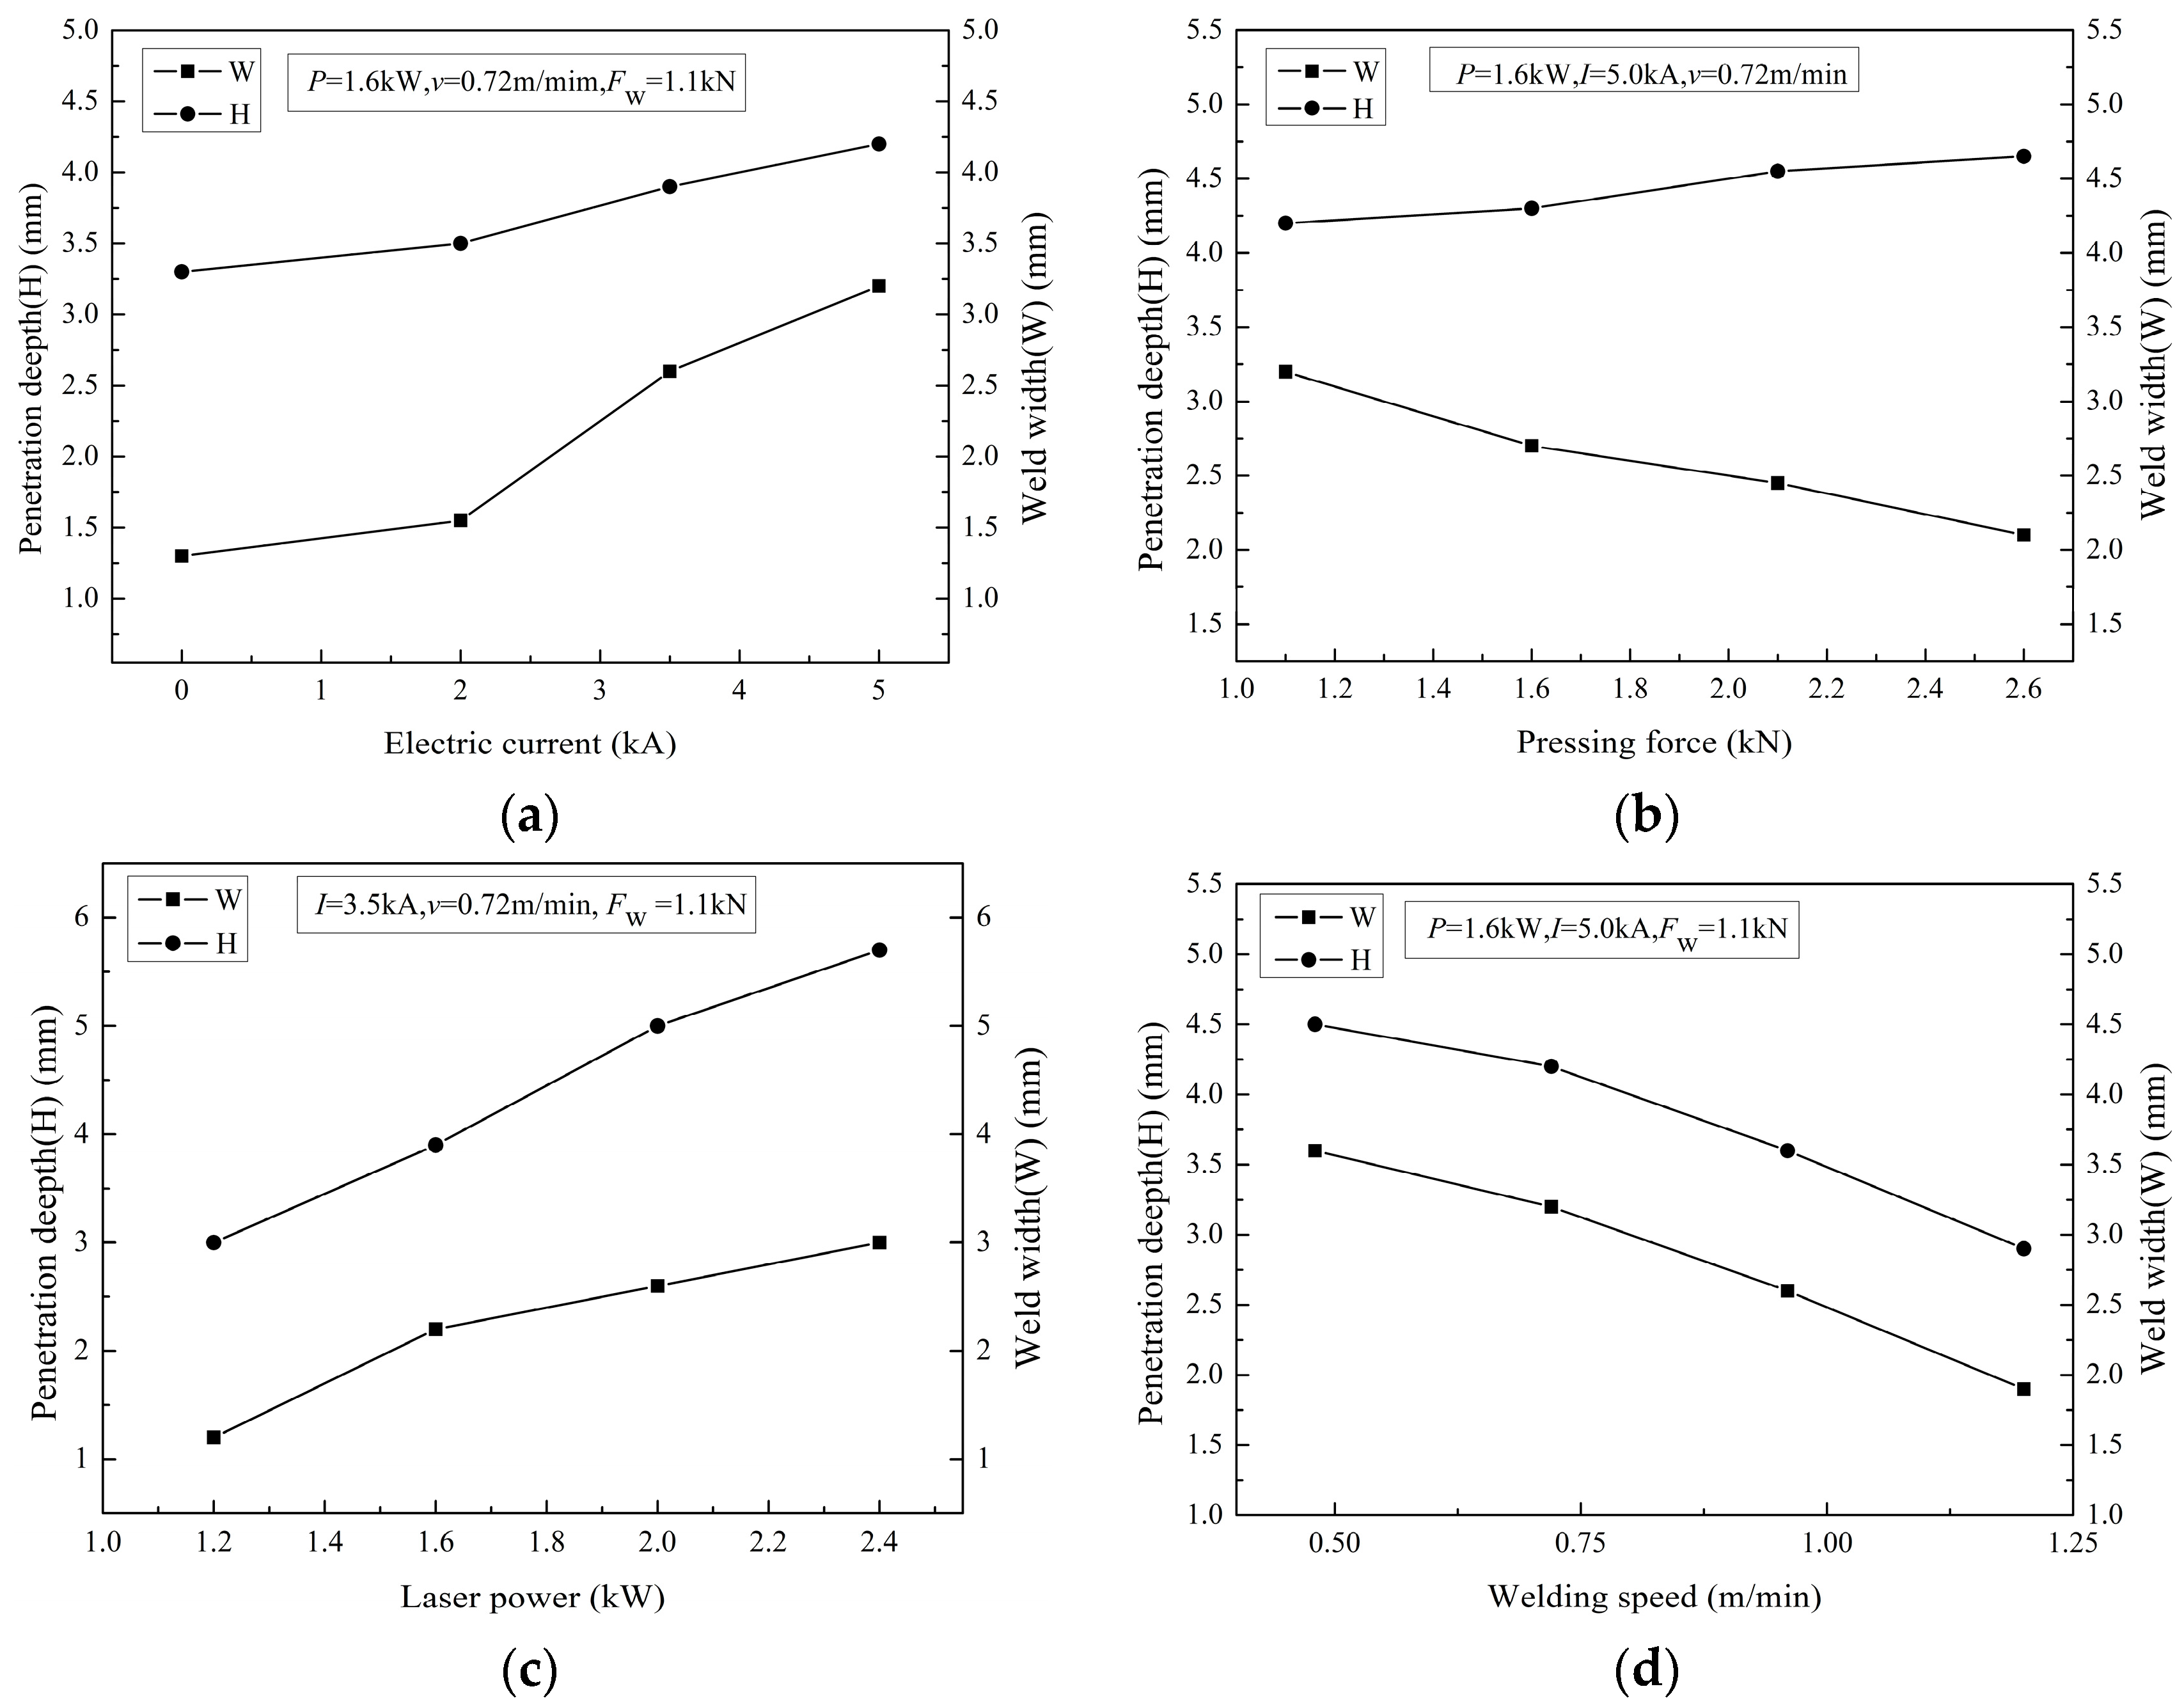
During the electric current-aided laser stake welding of the T-joints, the process parameters mainly included the electric current (I), pressing force (F; applied on the T-joint surface through the wheel electrode), laser power (P), and welding speed (v). Figure 5 indicates the effects of the single process parameters on the geometric dimensions (H and W) of the weld while the other three process parameters were held constant. Using a higher electric current, the weld width at the faying surface (W) and penetration depth (H) both became larger, but there was little change in the penetration depth (H), as shown in Figure 5a. As the aided electric current increased from 0 to 5.0 kA, the weld width at the faying surface varied from 1.3 to 3.2 mm, and the penetration depth ranged from 3.3 to 4.2 mm. It is effective to increase the weld width at the faying surface for T-joints using an aided electric current. Figure 5b displays the effect of pressing force on the weld morphology (H, W) using the same laser power, electric current and welding speed. Upon increasing the pressing force, the penetration depth increased, whereas the weld width at the faying surface decreased. The results showed that the weld width at the faying surface visibly decreased, and the penetration depth exhibited a slower increase. During the electric current-aided laser stake welding of the T-joint, when the electric current is passed through the skin to the stringer, the resistance heat should provide preheating of the skin. The higher the aluminum alloy temperature is, the greater the absorptivity of the aluminum alloy [10]. Therefore, it is beneficial to improve the absorption of the laser on the top of the skin surface, as a result of increasing the penetration depth (H) and weld width at the faying surface (W). In addition, the aided electric current flowed through the faying surface between the skin and stringer, which contributed to additional heat generation (Q = I2Rt, where Q is heat energy, I is current, R is contact resistance, and t is time) resulting from contact electrical resistance at the faying surface [27]. Therefore, the weld width at the faying surface (W) clearly increased upon using the aided electric current, and a higher aided electric current led to a larger weld width at the faying surface (W). However, the contact electrical resistance decreased with increasing pressing force; this reduced additional heat generation at the faying surface, and consequently, the weld width at the faying surface (W) decreased by increasing the pressing force.
Figure 5c displays the effect of the laser power on the weld morphology (H, W) with the same electric current, welding speed and pressing force. As shown in Figure 5c, the penetration depth increased linearly with increasing laser power, whereas the penetration depth increased sharply from 3.0 to 5.7 mm with an increasing laser power from 1.2 to 2.4 kW. The weld width at the faying surface also increased with increasing laser power; however, the growth declined slowly. Figure 5d shows the effect of welding speed on the weld morphology (H, W) with the same electric current, laser power and pressing force. The weld width at the faying surface and penetration depth both clearly decreased when the welding speed increased. The curves for the weld width and penetration depth similarly changed with increasing welding speed. During the laser welding process, a keyhole is created in a liquid molten pool via evaporation of the base metal. The keyhole develops a deep penetration weld and a high depth-to-width ratio weld [10]. With increasing laser power, the weld width at the faying surface (W) and penetration depth (H) increase; however, the variation in the penetration depth (H) is sharper. The welding speed and laser power determine the rate of energy input to the specimen, and a faster welding speed brings about lower energy input, identified by a lower laser power. The weld width and penetration depth (H) at the faying surface (W) both decrease with an increase in welding speed.
As a consequence of the above results, the electric current and pressing force should be chosen to produce an expected weld width at the faying surface, whereas the laser power and welding speed should be primarily considered to obtain an optimal penetration depth for the electric current-aided laser stake welding of aluminum alloy T-joints.
3.3. Tensile Shear Test
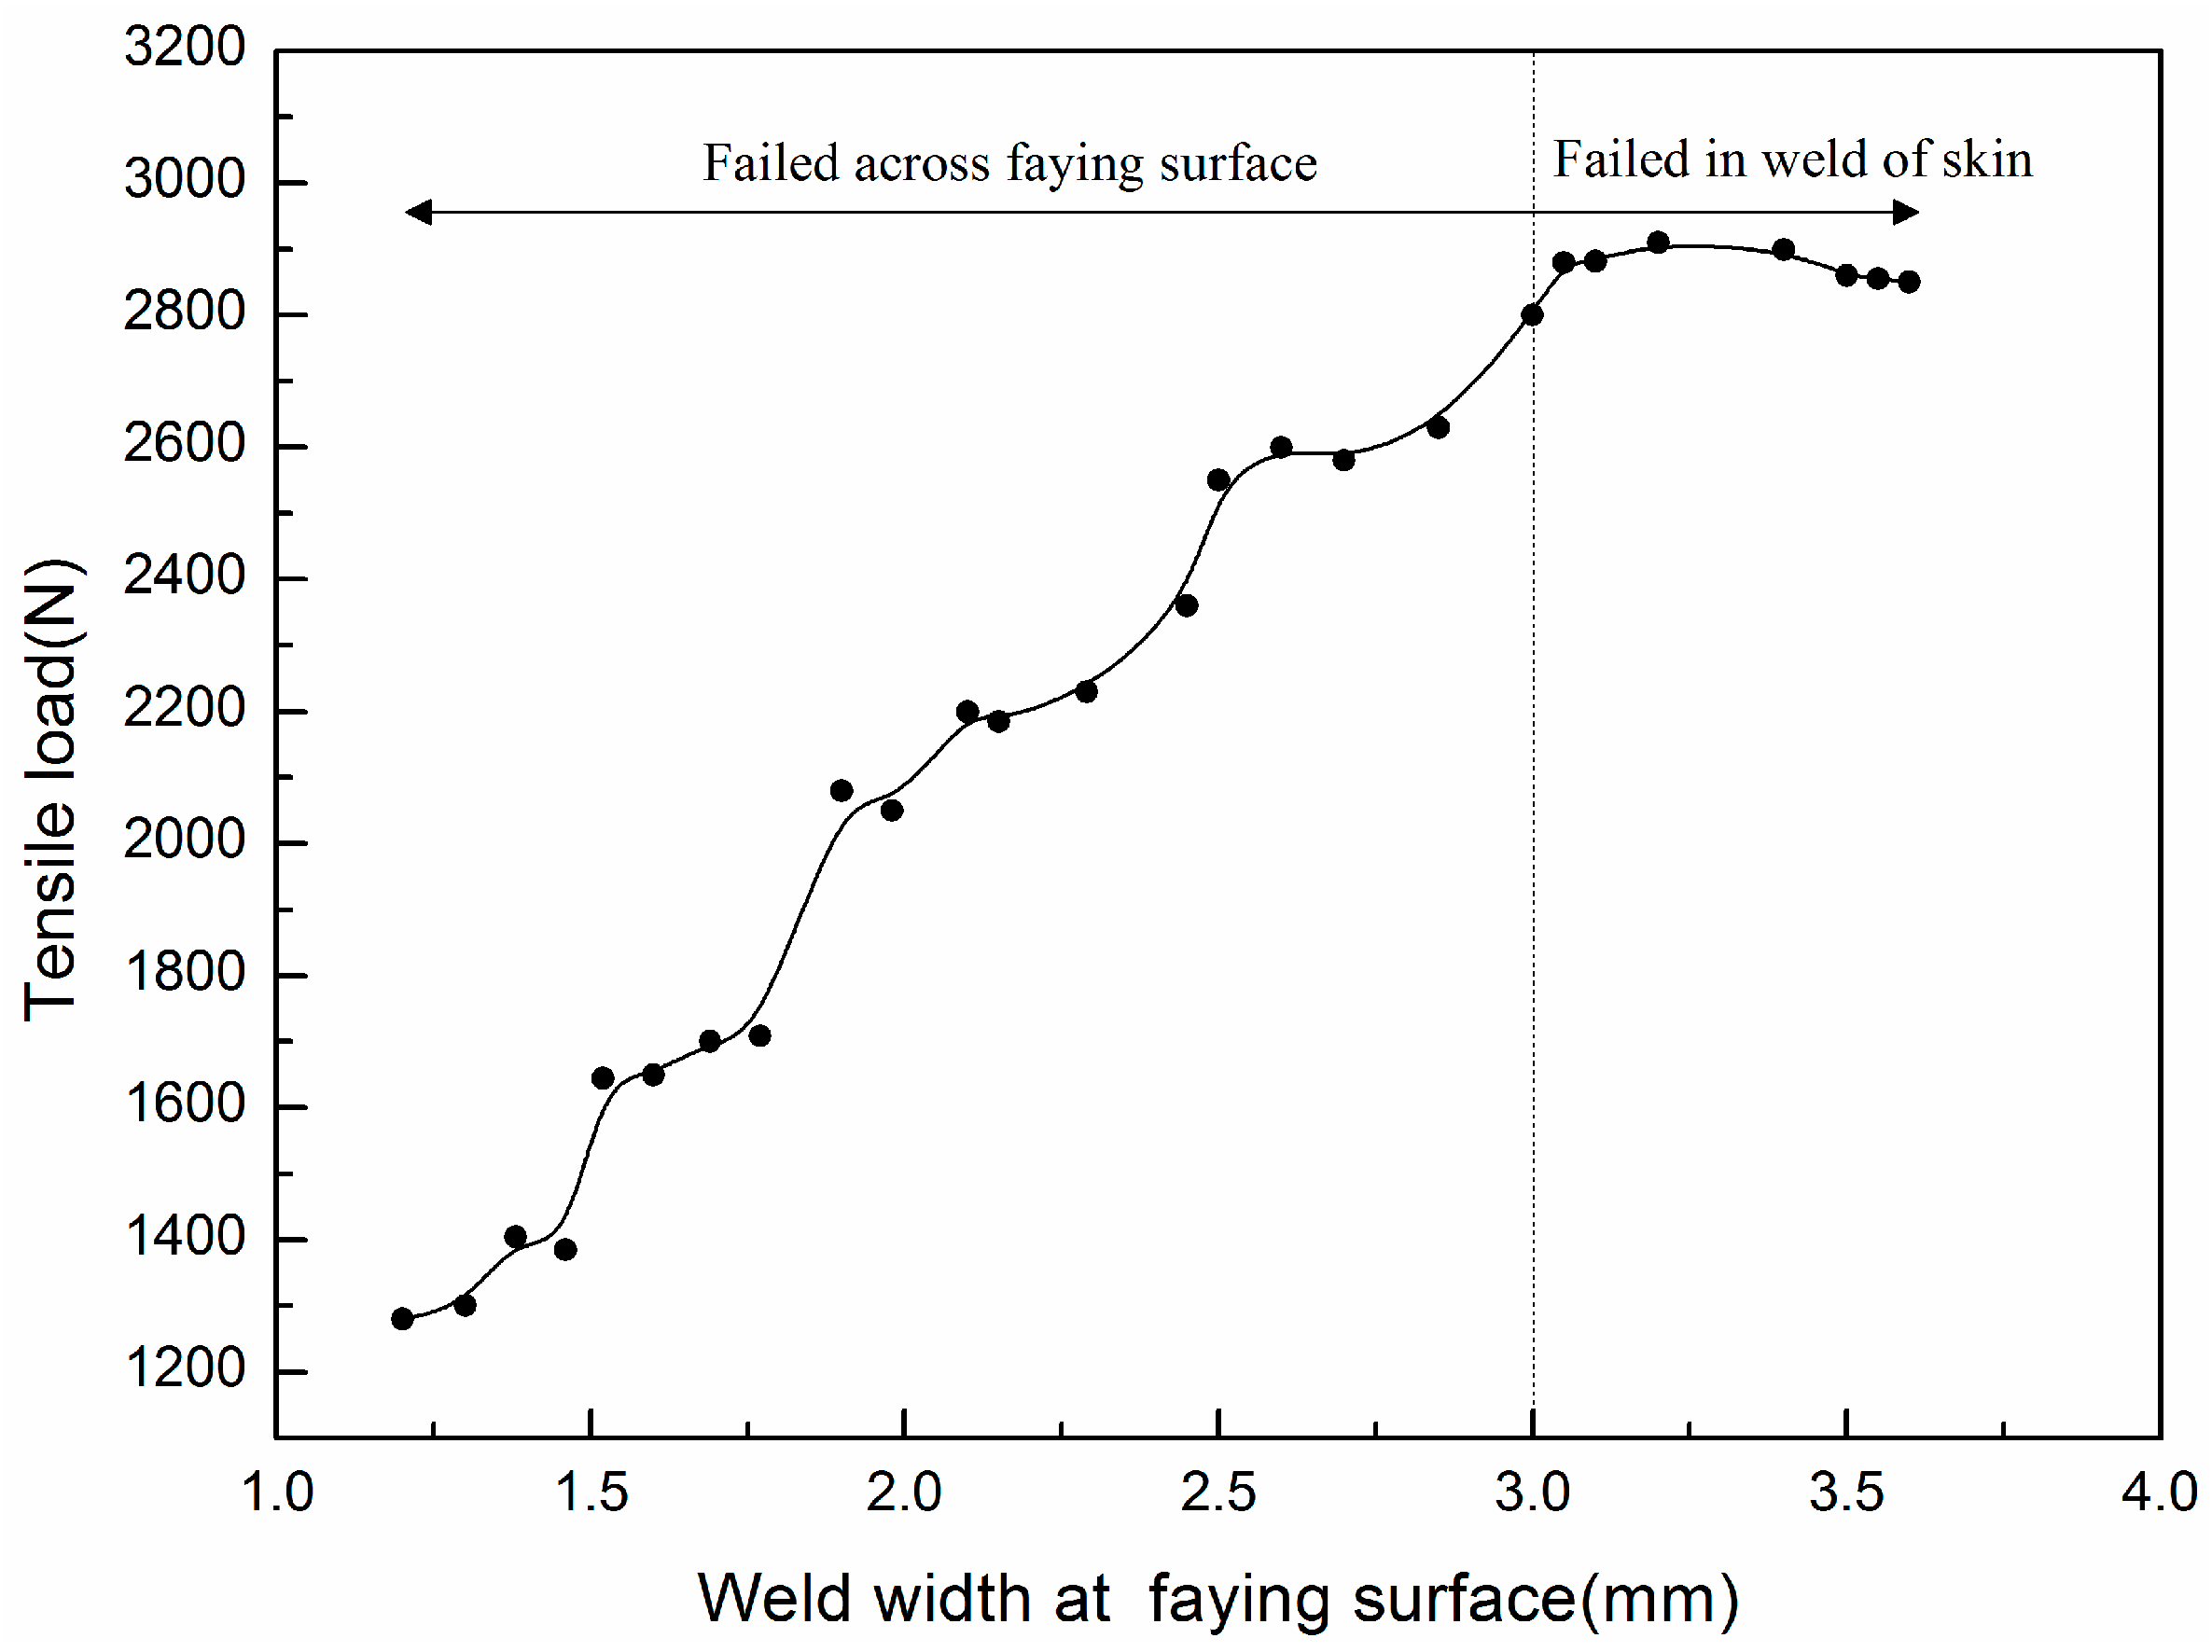
The experimental results indicated that the weld width at the faying surface (W) has a significant effect on the tensile shear loading capacity of welded T-joints. The relationships between the weld width at the faying surface (W) and tensile shear load are provided in Figure 6. The loads sharply increase at first and then decrease slowly with an increase of the weld width at the faying surface (W). Figure 6 shows that the welded T-joint tensile shear load rises from 1280 to 2910 N and then decreases to 2850 N, when the weld width at the faying surface (W) increases from 1.2 to 3.6 mm. The results suggest that the joint tensile shear loading capacity improvement is mainly associated with increasing the weld width at the faying surface (W).
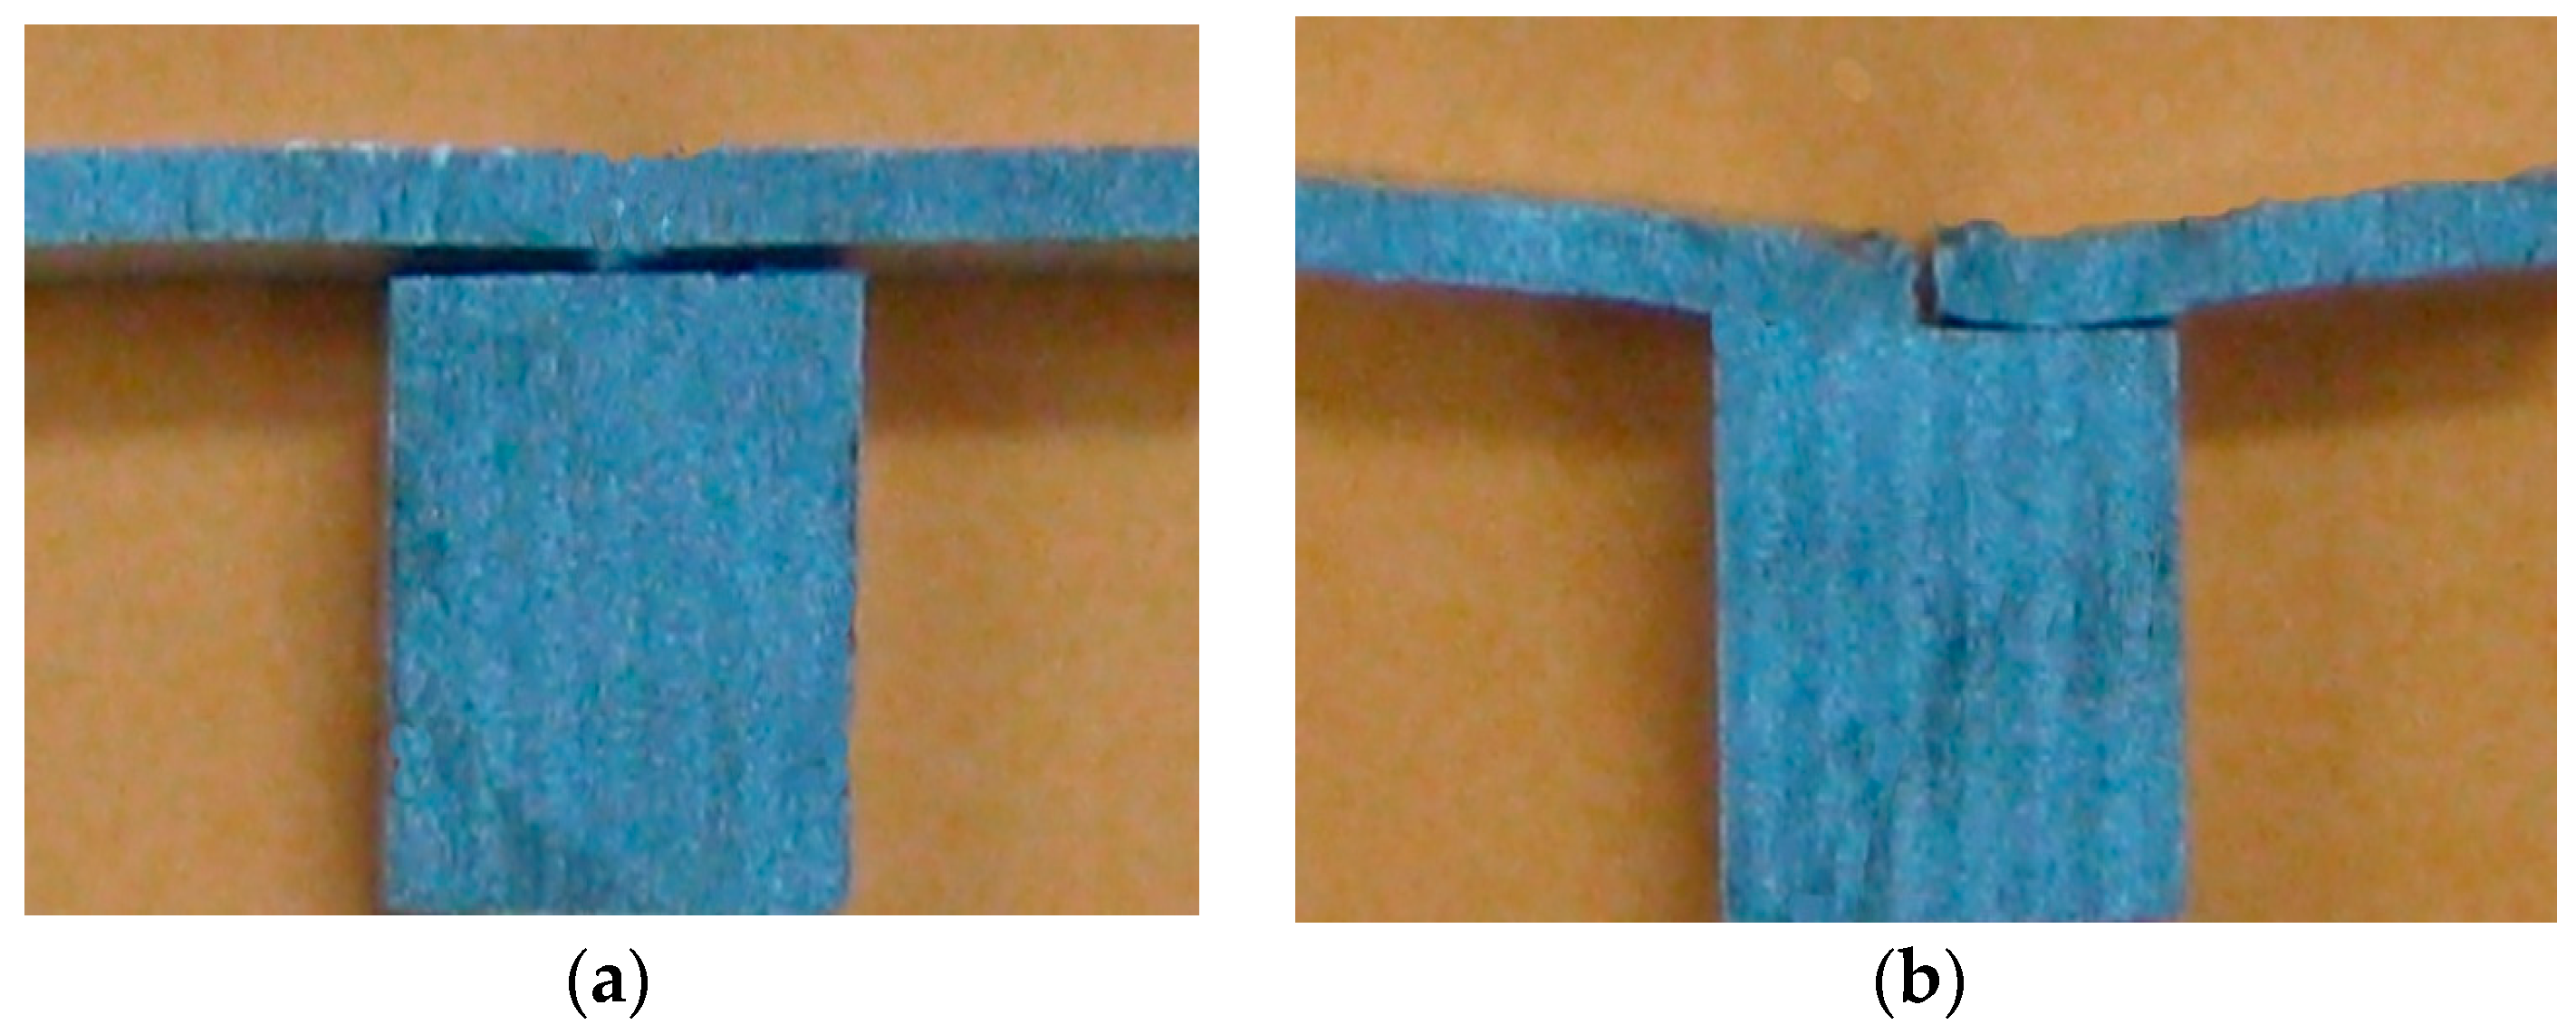
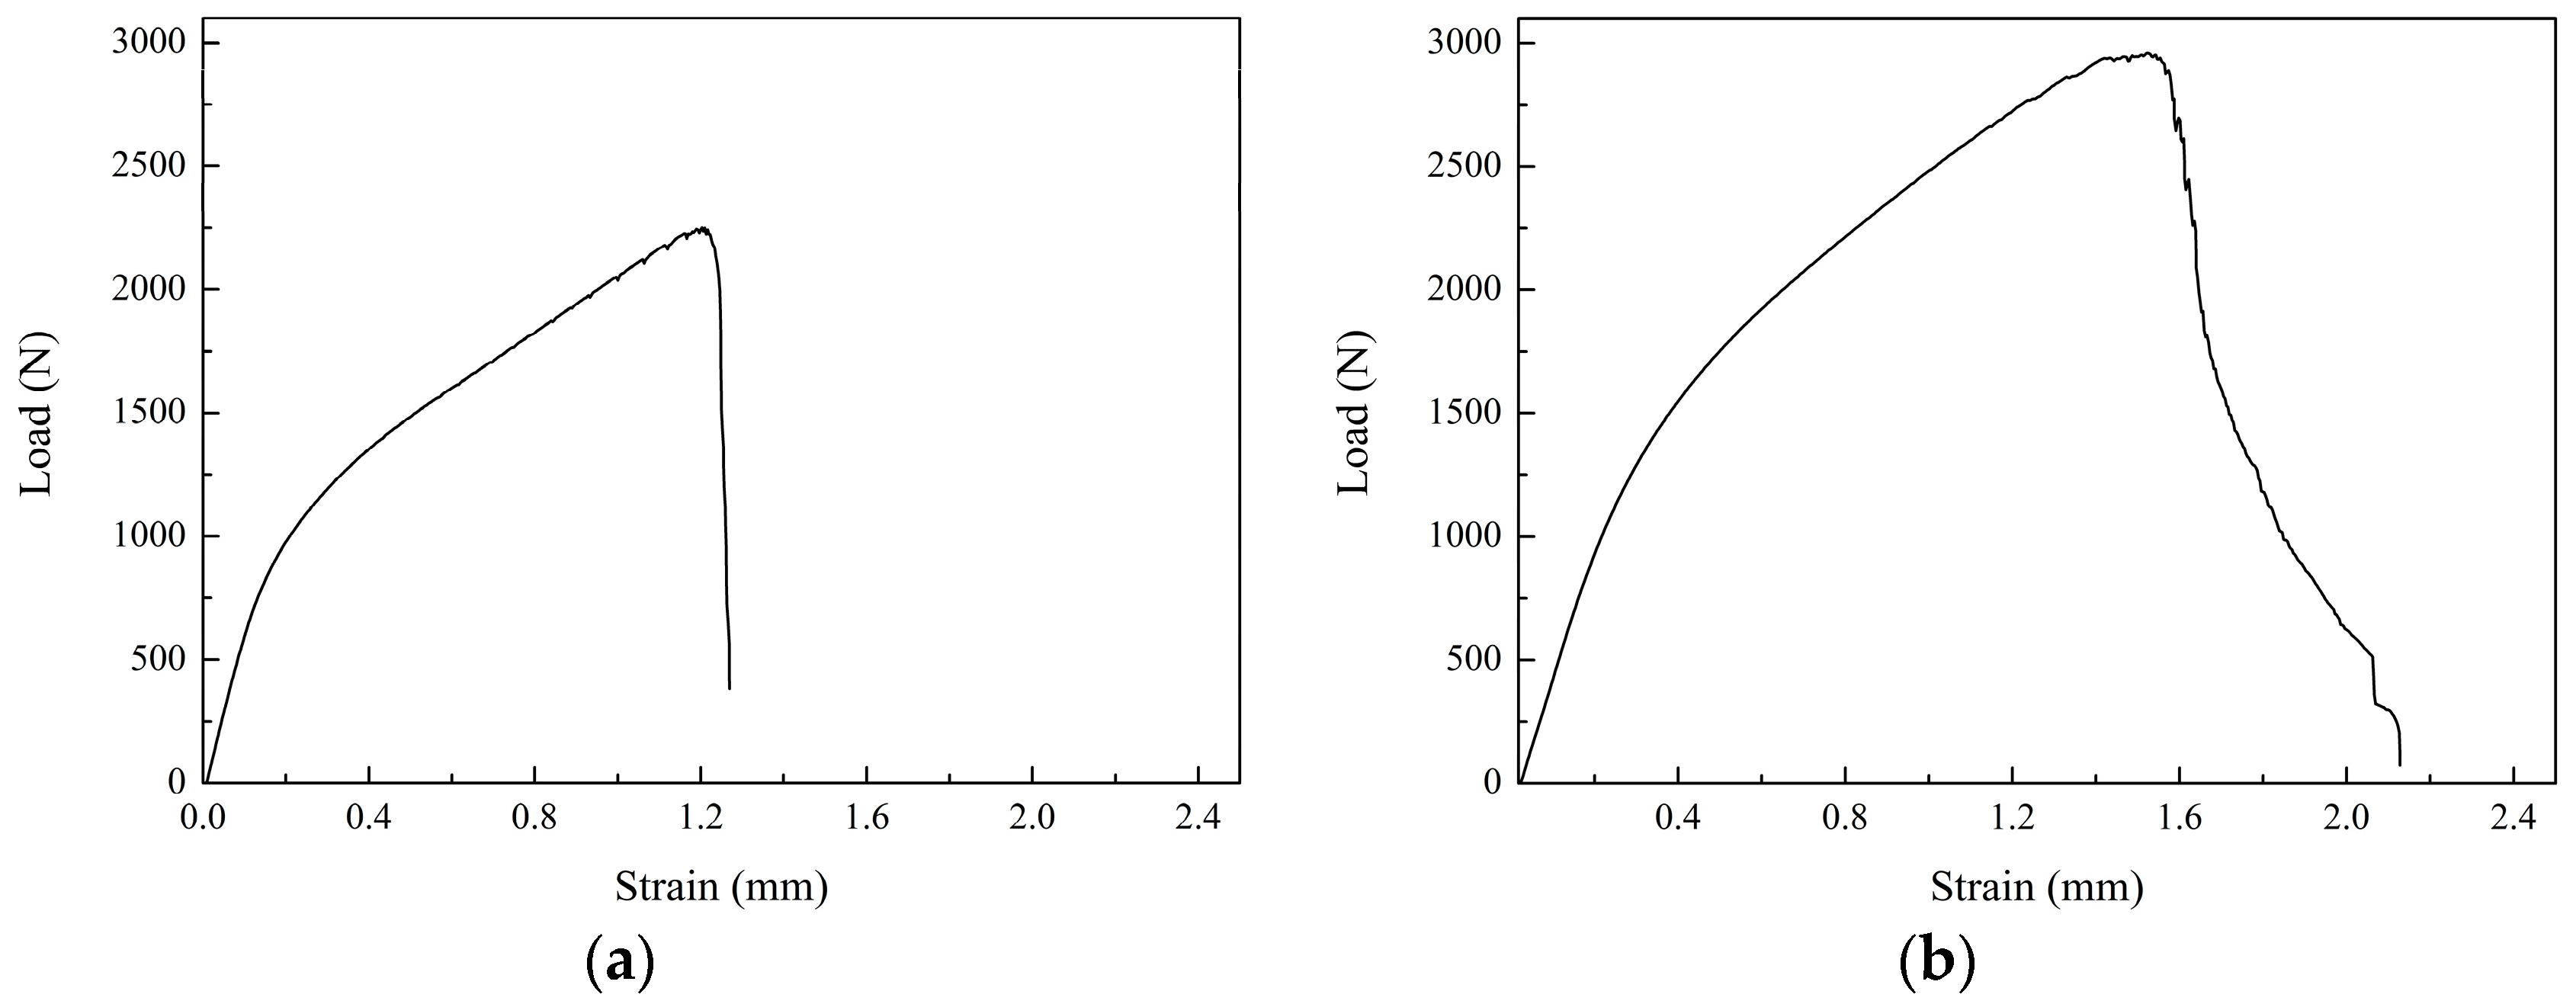
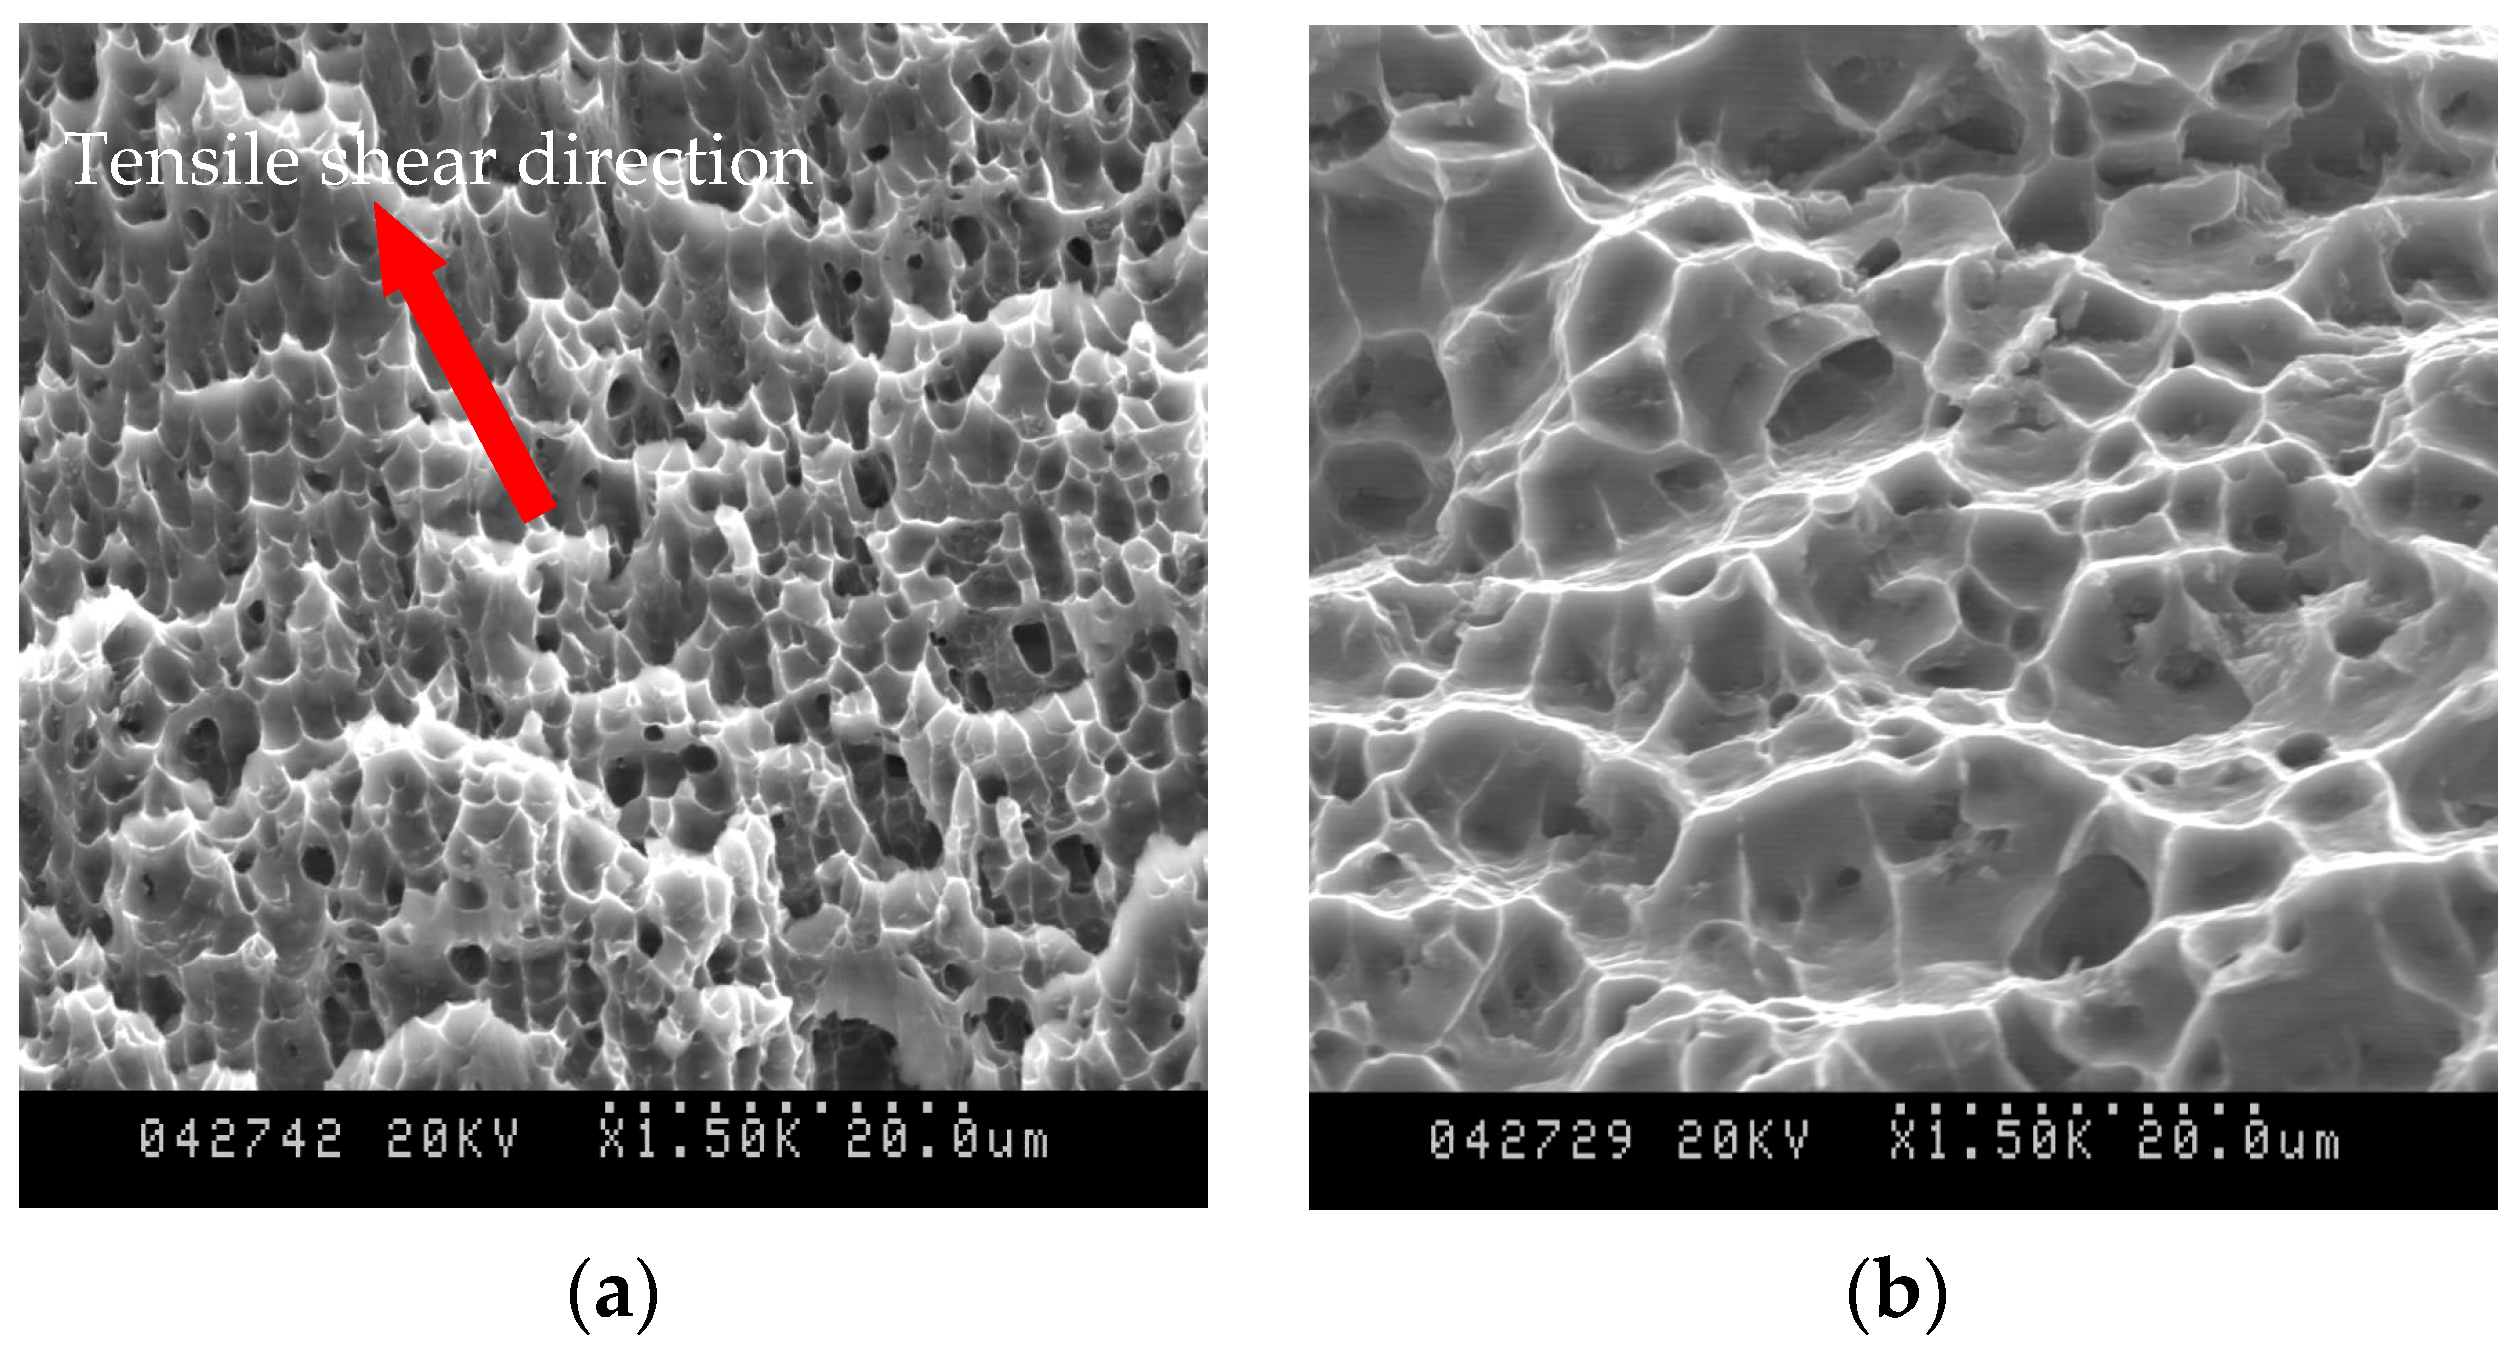
During the tensile shear tests, some tensile shear specimens failed across the faying surface and the others failed in the weld zone of the skin, as shown in Figure 7. As shown in Figure 6, the weld width at the faying surface (W) also has an effect on the failure mode of the welded T-joint. For a relatively small weld width at the faying surface (W; less than 3.0 mm), the tensile shear specimens failed across the faying surface, as shown in Figure 7a. For a relatively large weld width at the faying surface (W; not less than 3.0 mm), the tensile shear specimens failed in the weld of the skin, as shown in Figure 7b. The specimens that failed in the weld of the skin could resist higher tensile shear loads compared with the specimens that failed across the faying surface. Figure 8 shows the load-strain curves of the test specimens of different failed modes. While the test specimen failed across the faying surface, the load reached its maximum and then decreased rapidly, as shown in Figure 8a. While the test specimen failed in the weld of the skin, the load reached the maximum, and then slowly decreased until the joint broke, as shown in Figure 8b. The failure surfaces were observed using SEM. For two types of failed specimens, different fracture surface morphologies were observed at a higher magnification. As shown in Figure 9a, as the tensile shear test specimens failed across the faying surface, the fracture surfaces were flat, and shear fracture features with a plastic deformation along the shear direction were observed. When the tensile shear test specimens failed in the weld of the skin, the fracture surfaces were typical normal fracture features with a ductile failure mode, as shown in Figure 9b.
3.4. Microstructure
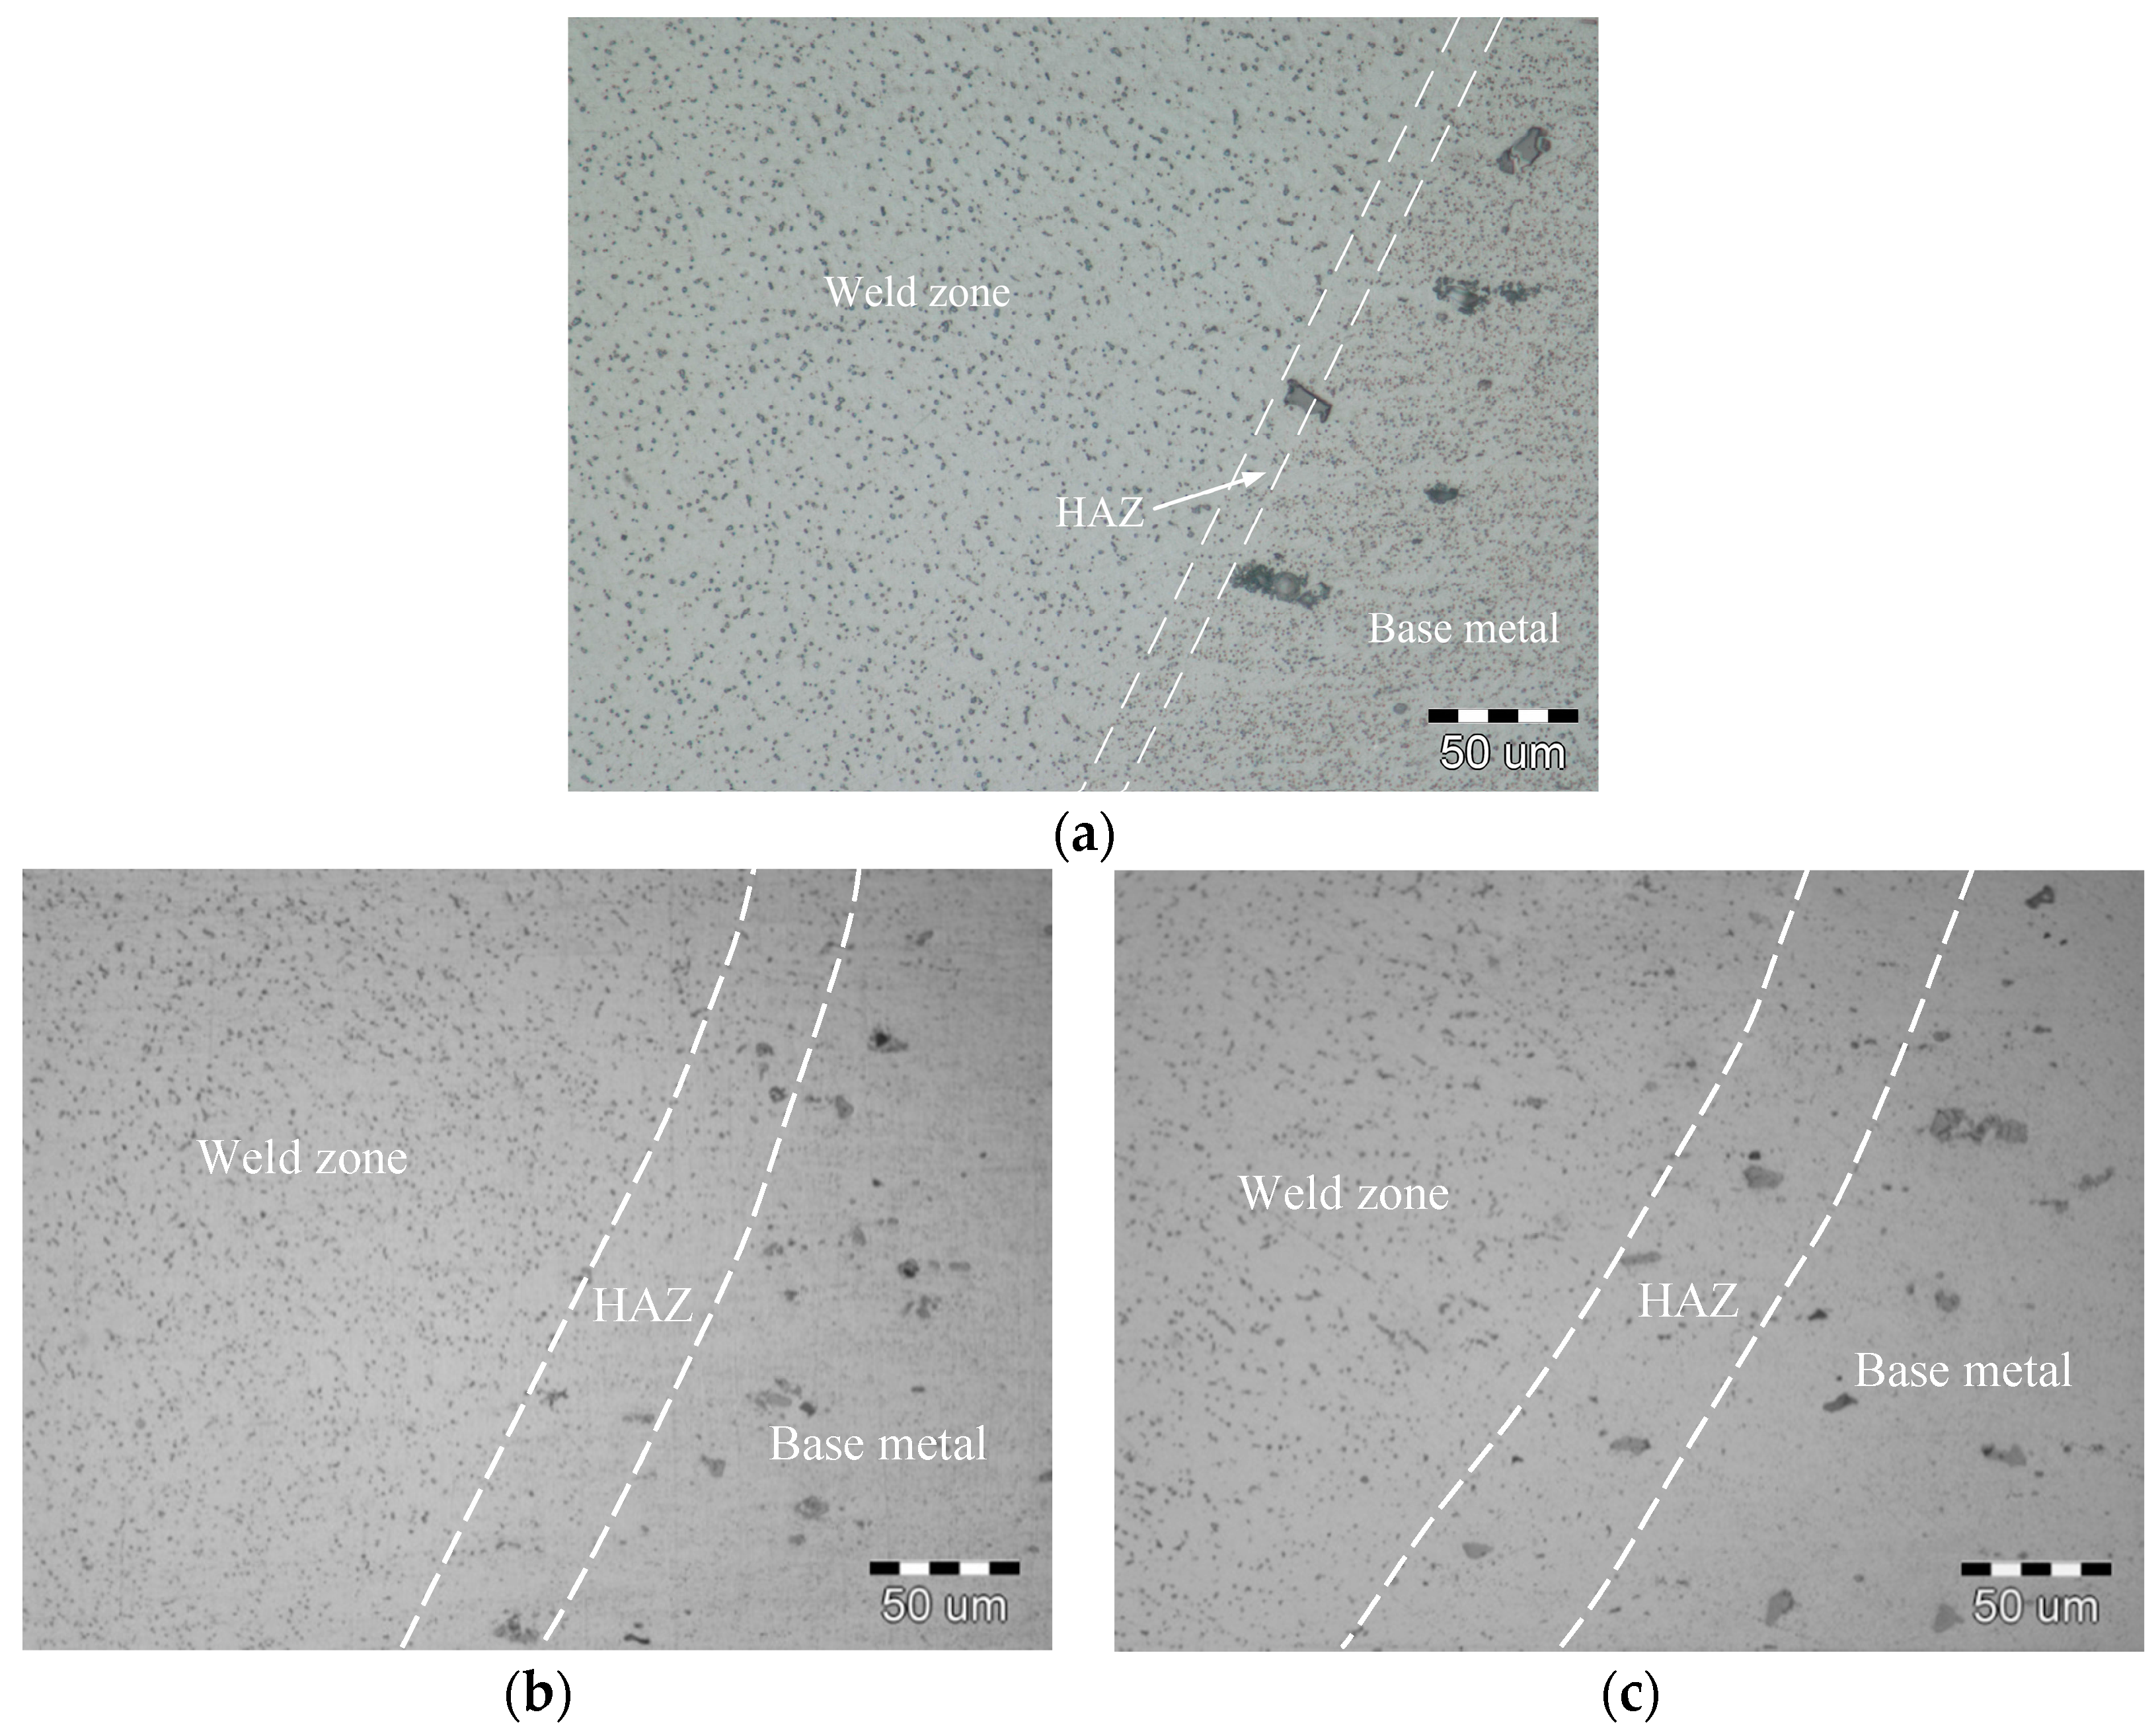
Optical micrographs of the laser-welded and different electric current-aided laser-welded aluminum alloy T-joints (failed across the faying surface and in the weld of the skin, respectively) are shown in Figure 10. The welded joints consisted mainly of the weld zone, the HAZ and the base metal. The experimental results indicate that the fusion line is distinct for a rapid heating/cooling rate during the laser welding process and the HAZ is narrow, as shown in Figure 10a. As shown in Figure 10b,c, the HAZ width is related to the aided electric current, and a higher electric current produces a larger HAZ width during electric current-aided laser welding.
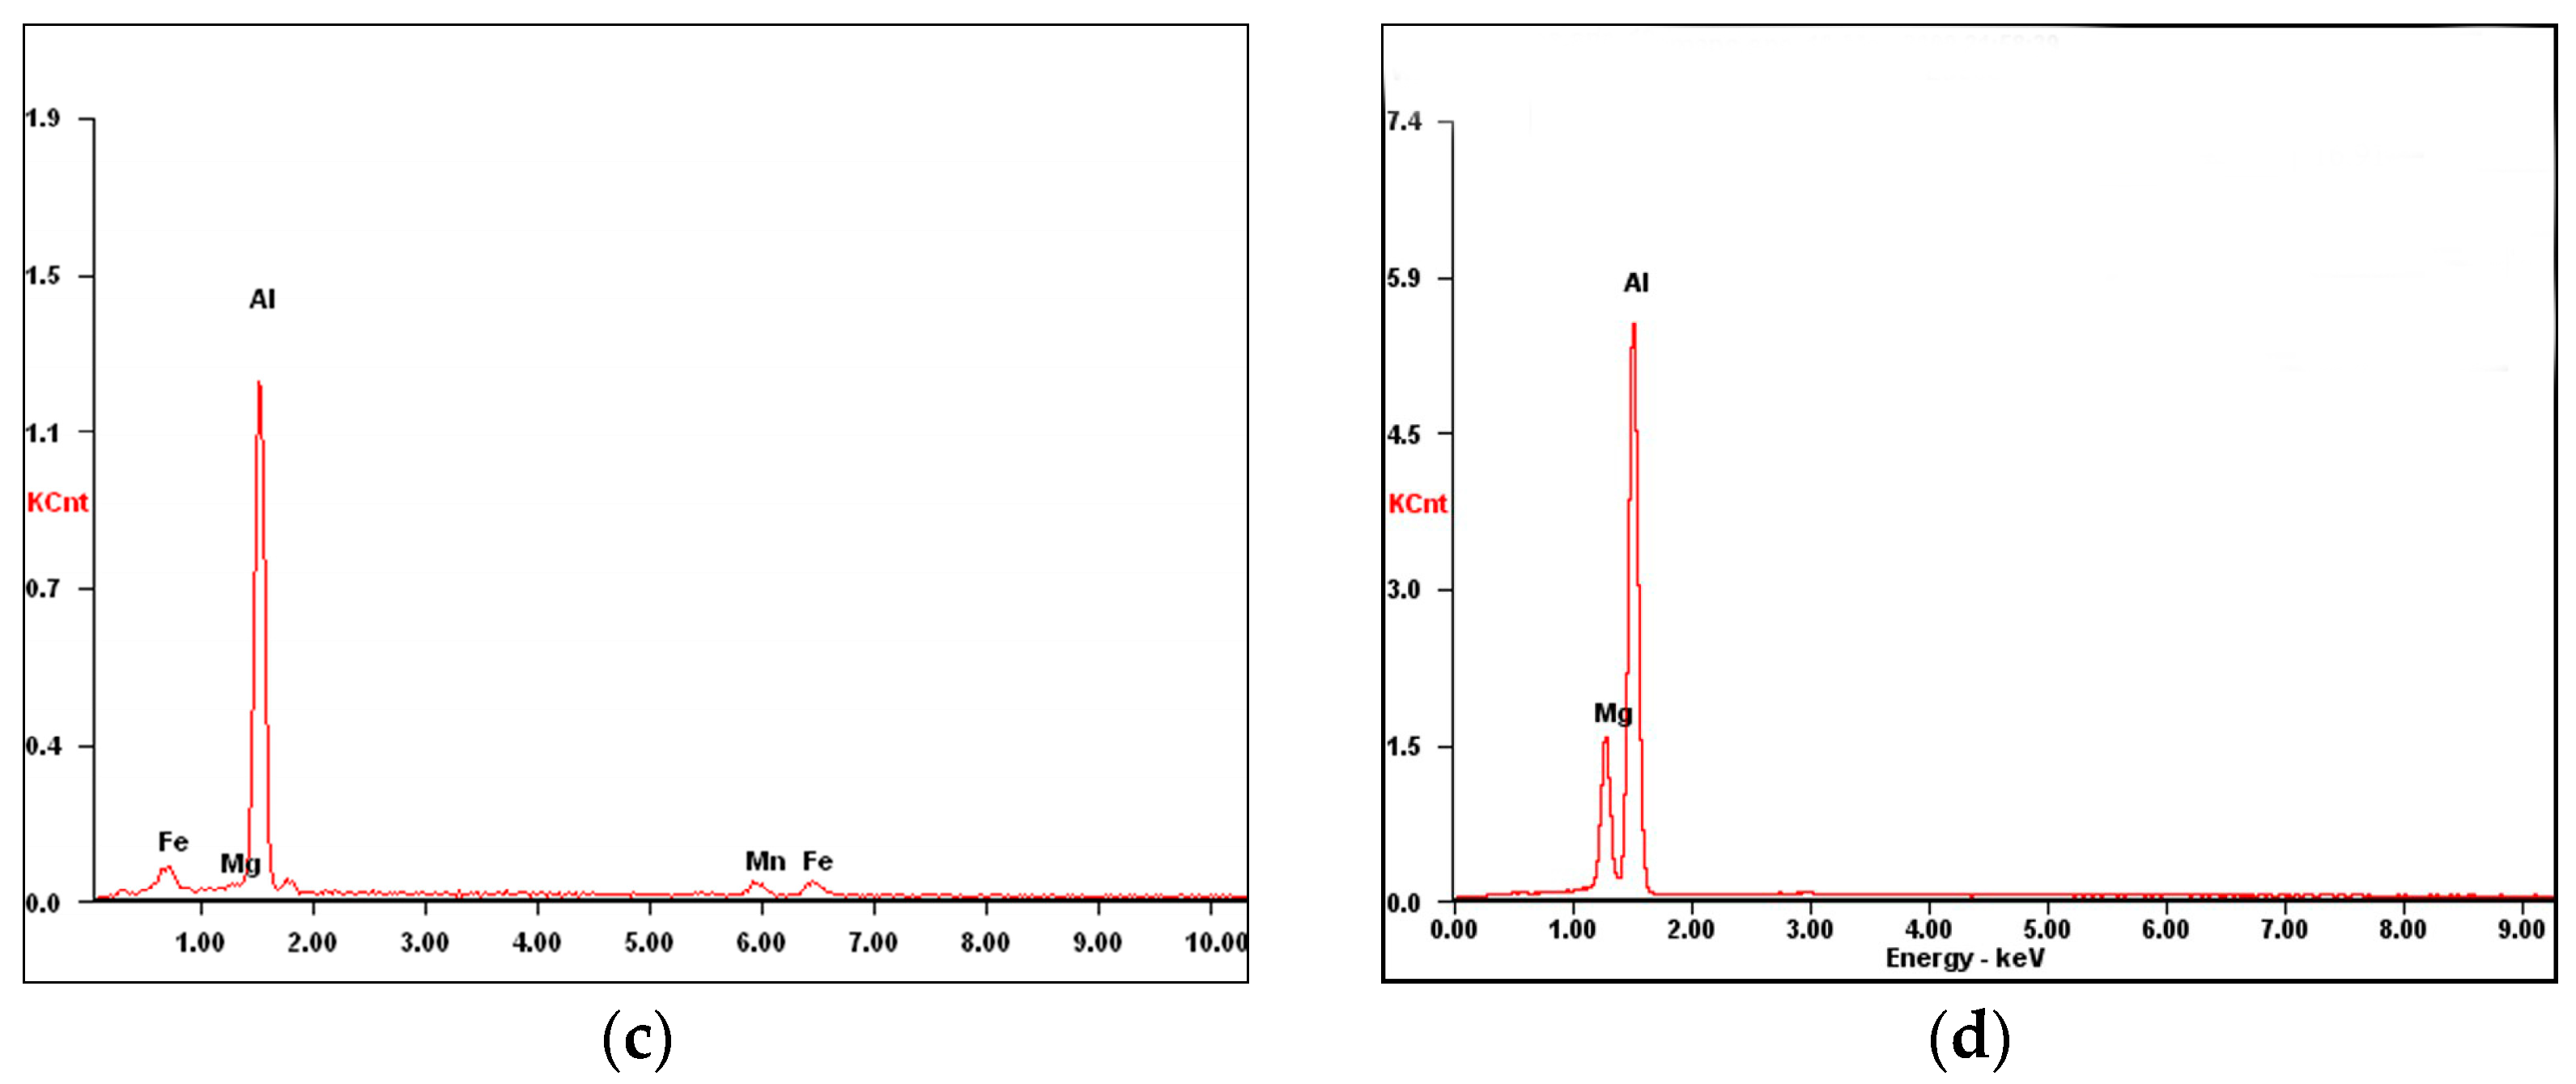
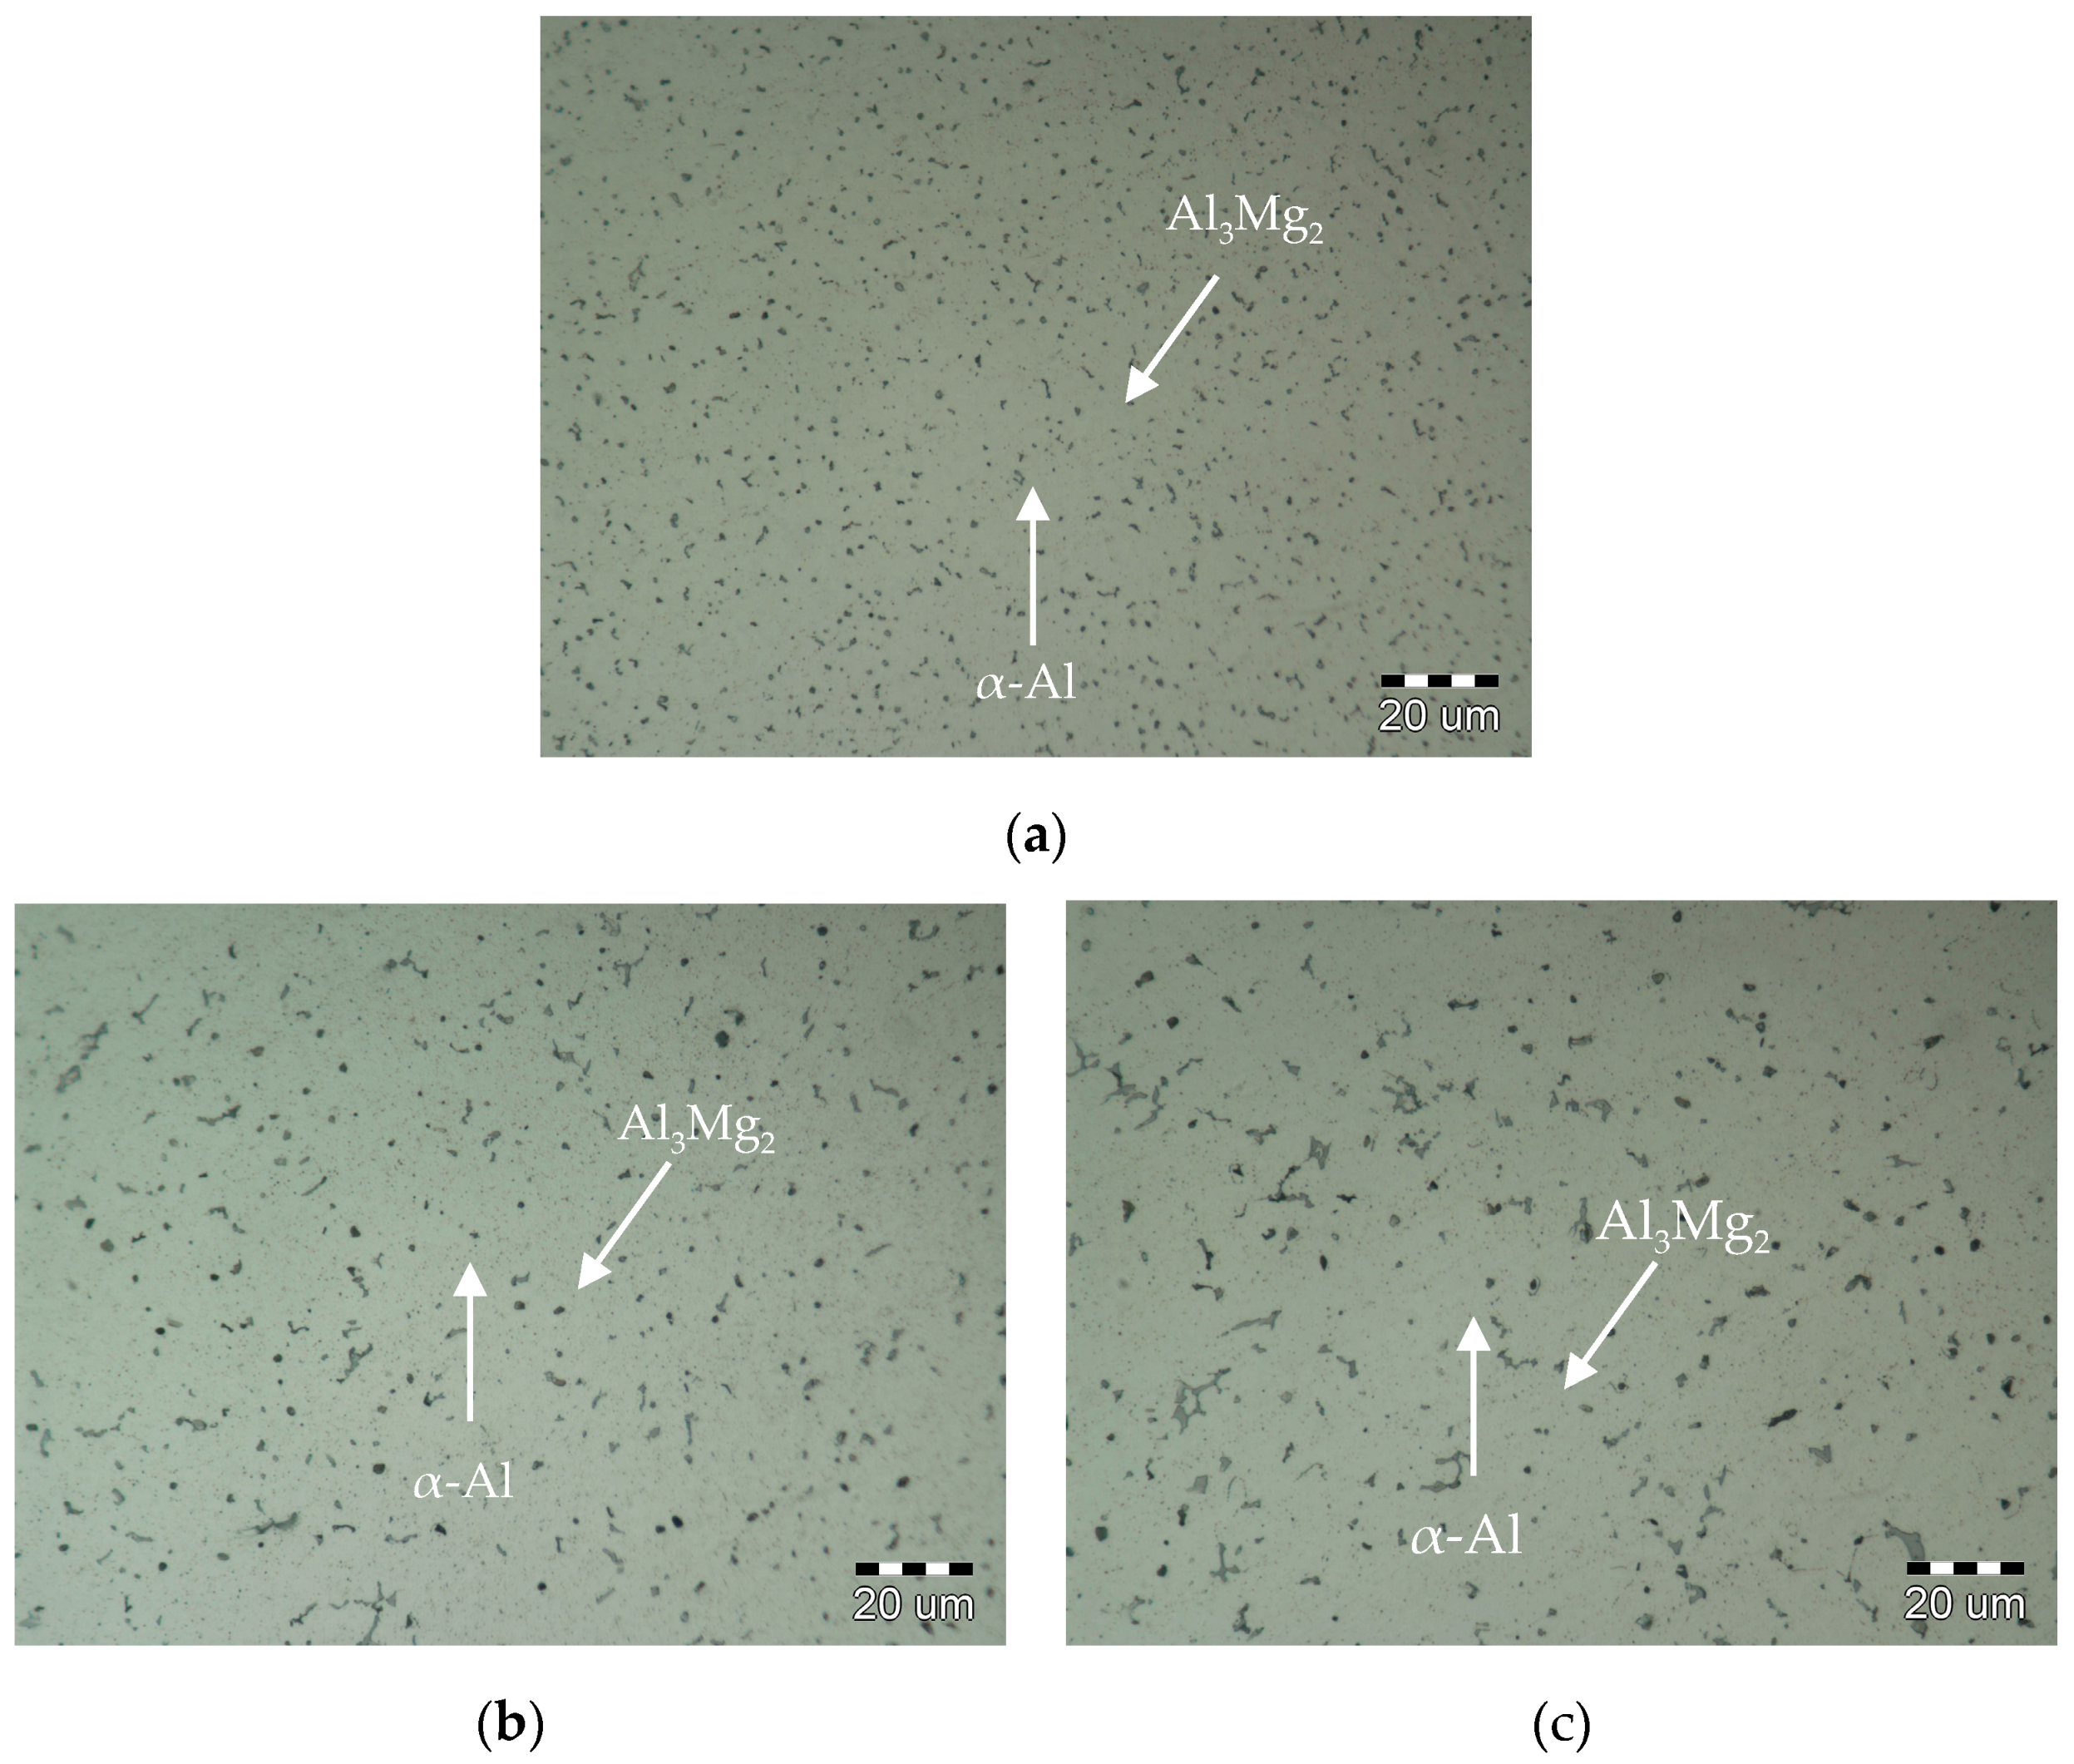
Figure 11a and Figure 12 show the microstructure of the base metal and weld center, respectively. Gao [28] and Wang [29] have investigated the phase components of the 5A06 alloy base metal and its weld metal using X-ray diffraction (XRD) analysis. Their results showed that the 5A06 alloy base metal and its weld metal all mainly consisted of α-Al phase and β phase (Al3Mg2); meanwhile, the other phases were few in quantity and thus there were no obvious phase peaks in the XRD patterns. On the basis of the XRD analysis results in the references [28,29], the phase particles were executed using EDS analysis in this study, and the microstructure observation and EDS analysis results show that the base metal had a distributed second strengthening phase β (Al3Mg2) in the aluminum matrix (α-Al) together with relatively few insoluble particles of Mg2Si and Al6(Fe, Mn), as illustrated in Figure 11. The weld zones for the laser welding and the electric current-aided laser welding consisted of α-Al and phase β with a dispersed distribution, as shown in Figure 12a. The second strengthening phase β in the weld zone of the electric current-aided laser-welded joint was longer than that of the laser weld because of the lower cooling rate. From Figure 12b,c, it is shown that the phase β slightly increased in size and decreased in quantity, with a higher electric current due to the higher heat input.
3.5. Microhardness
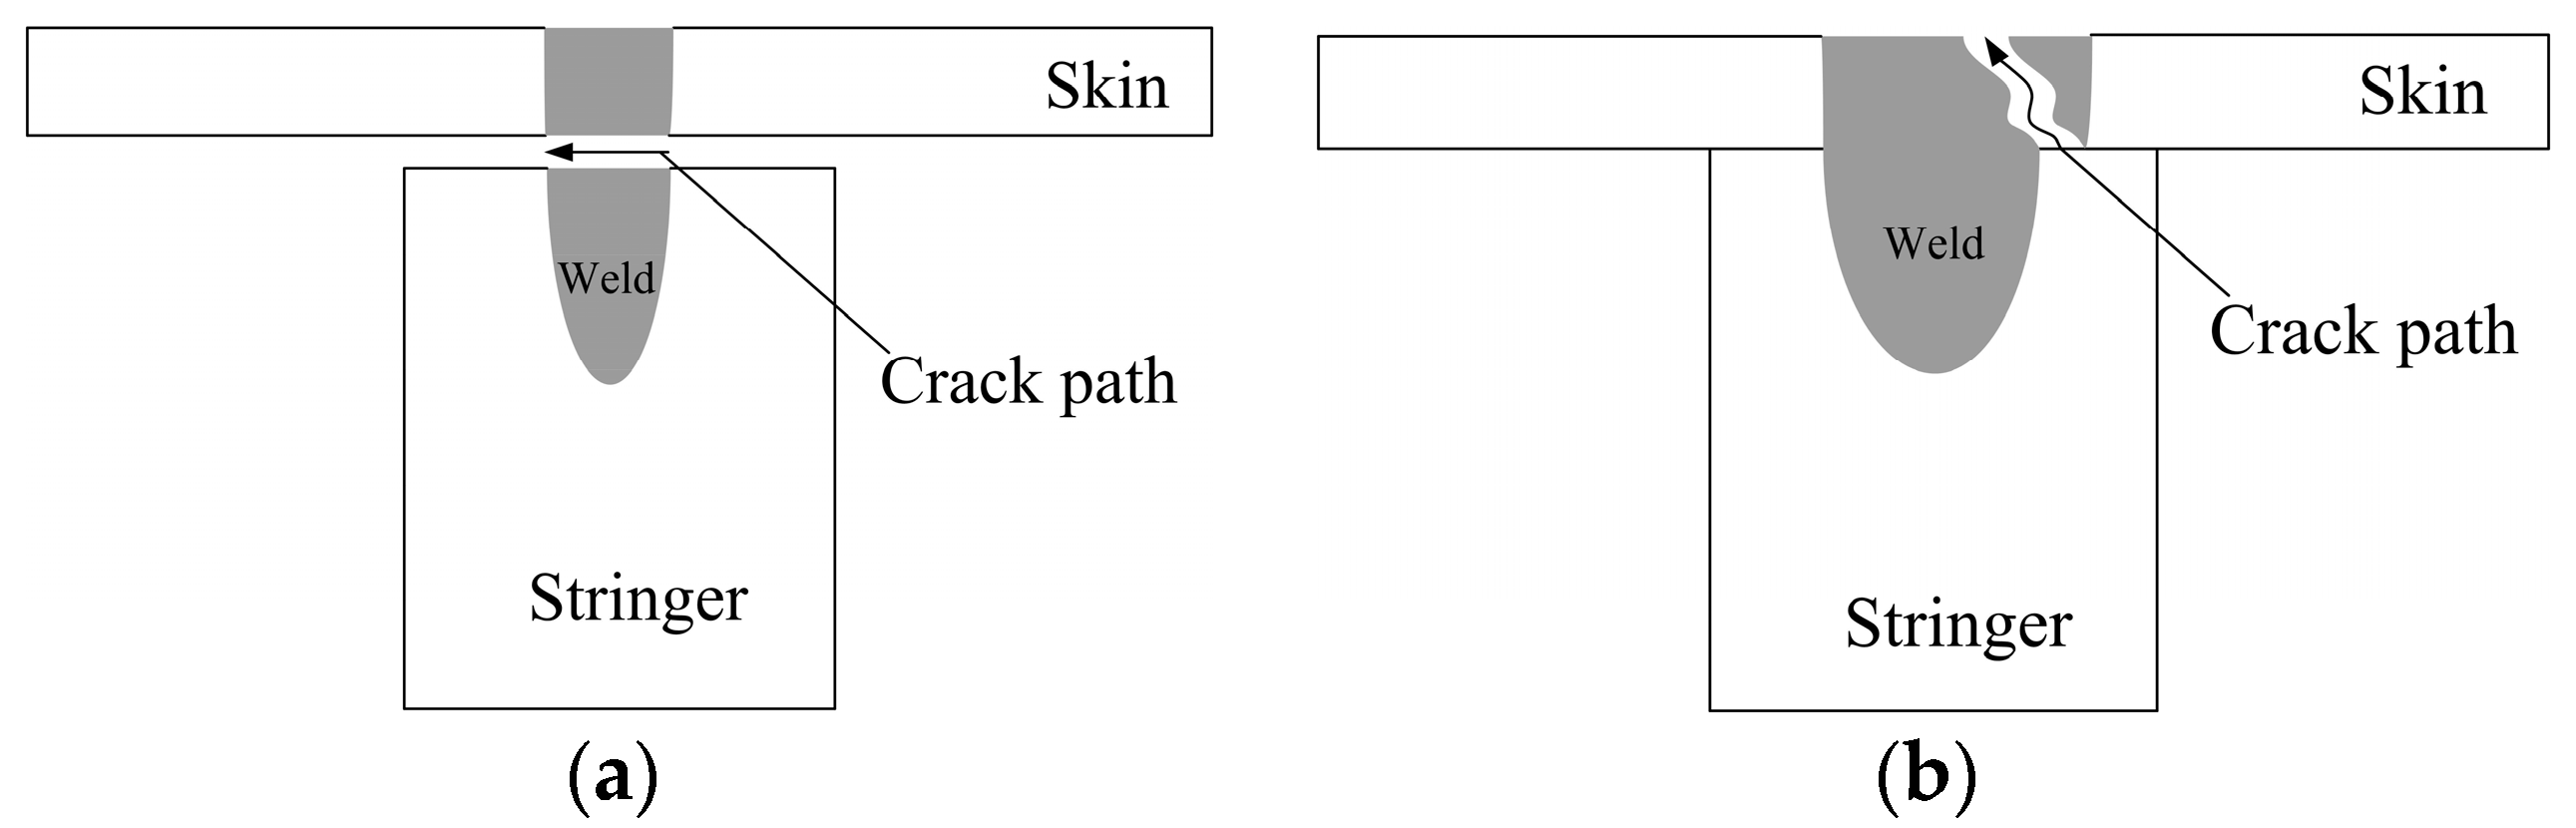
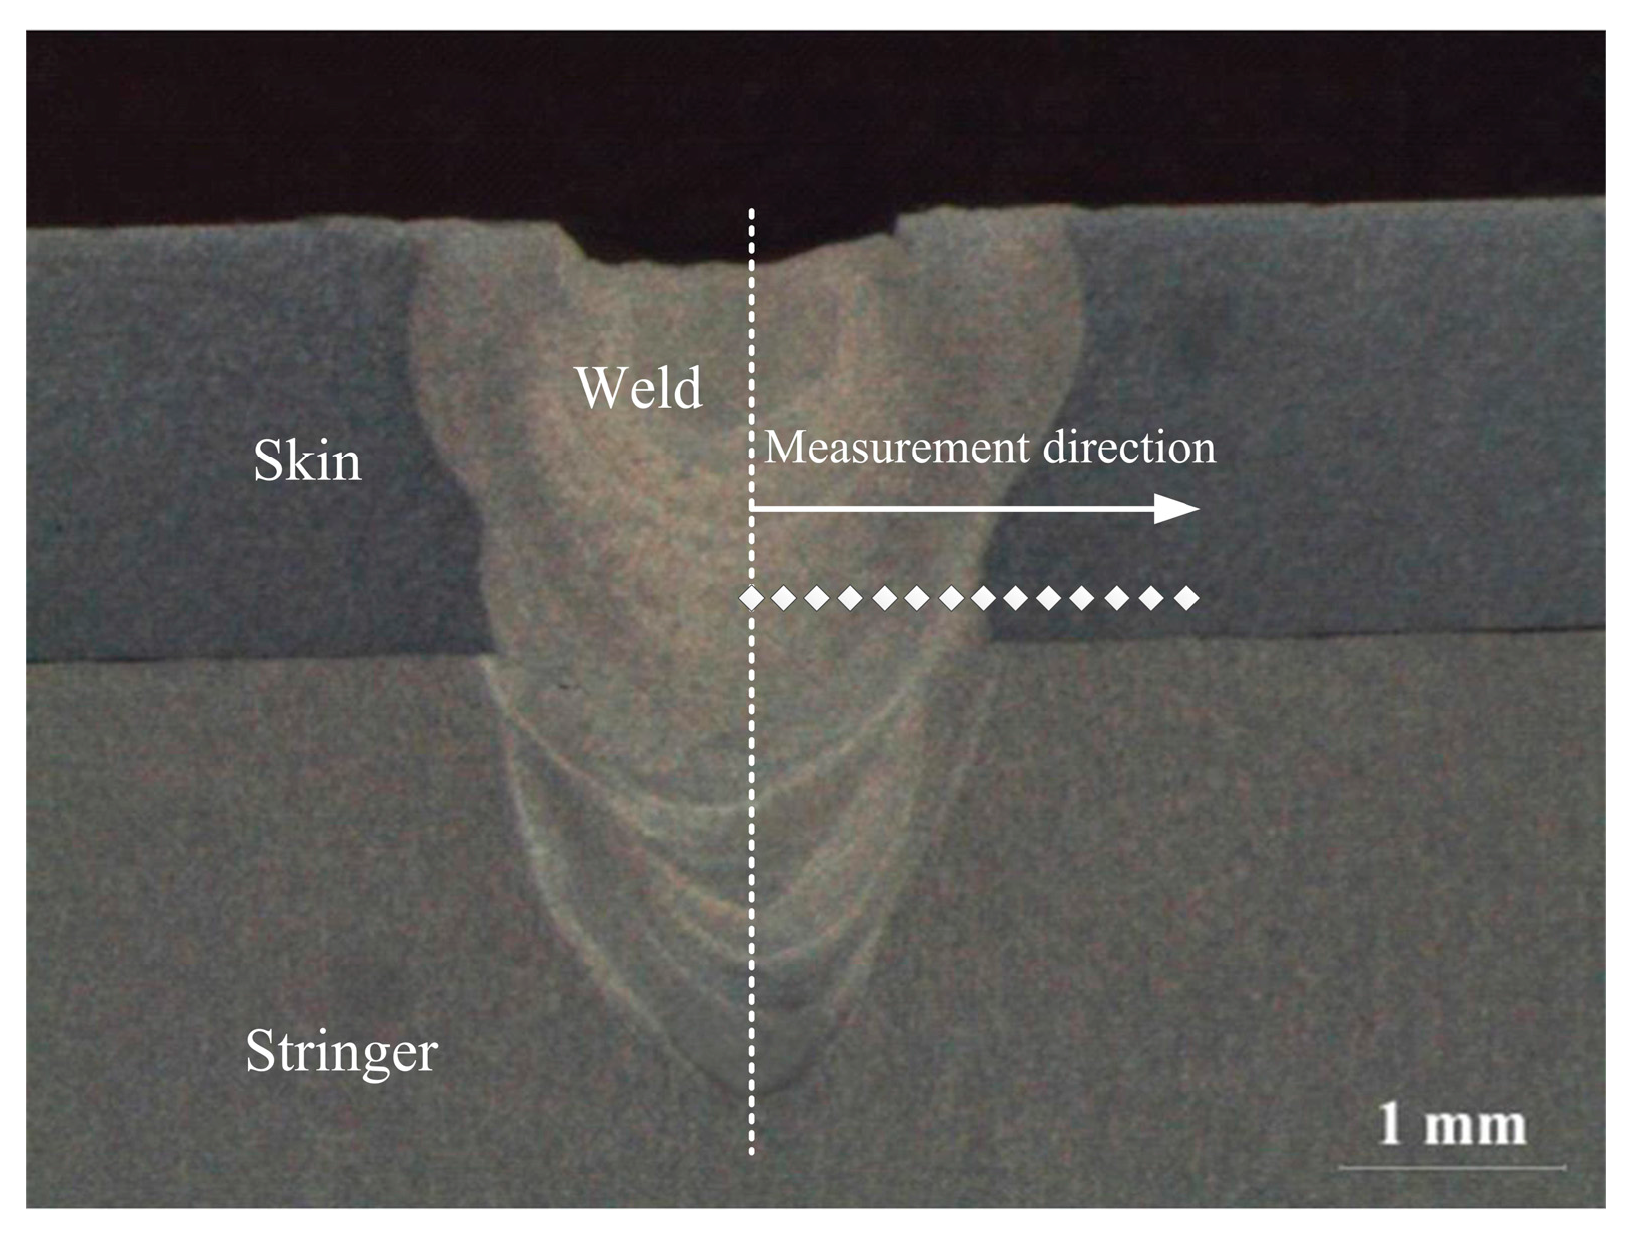
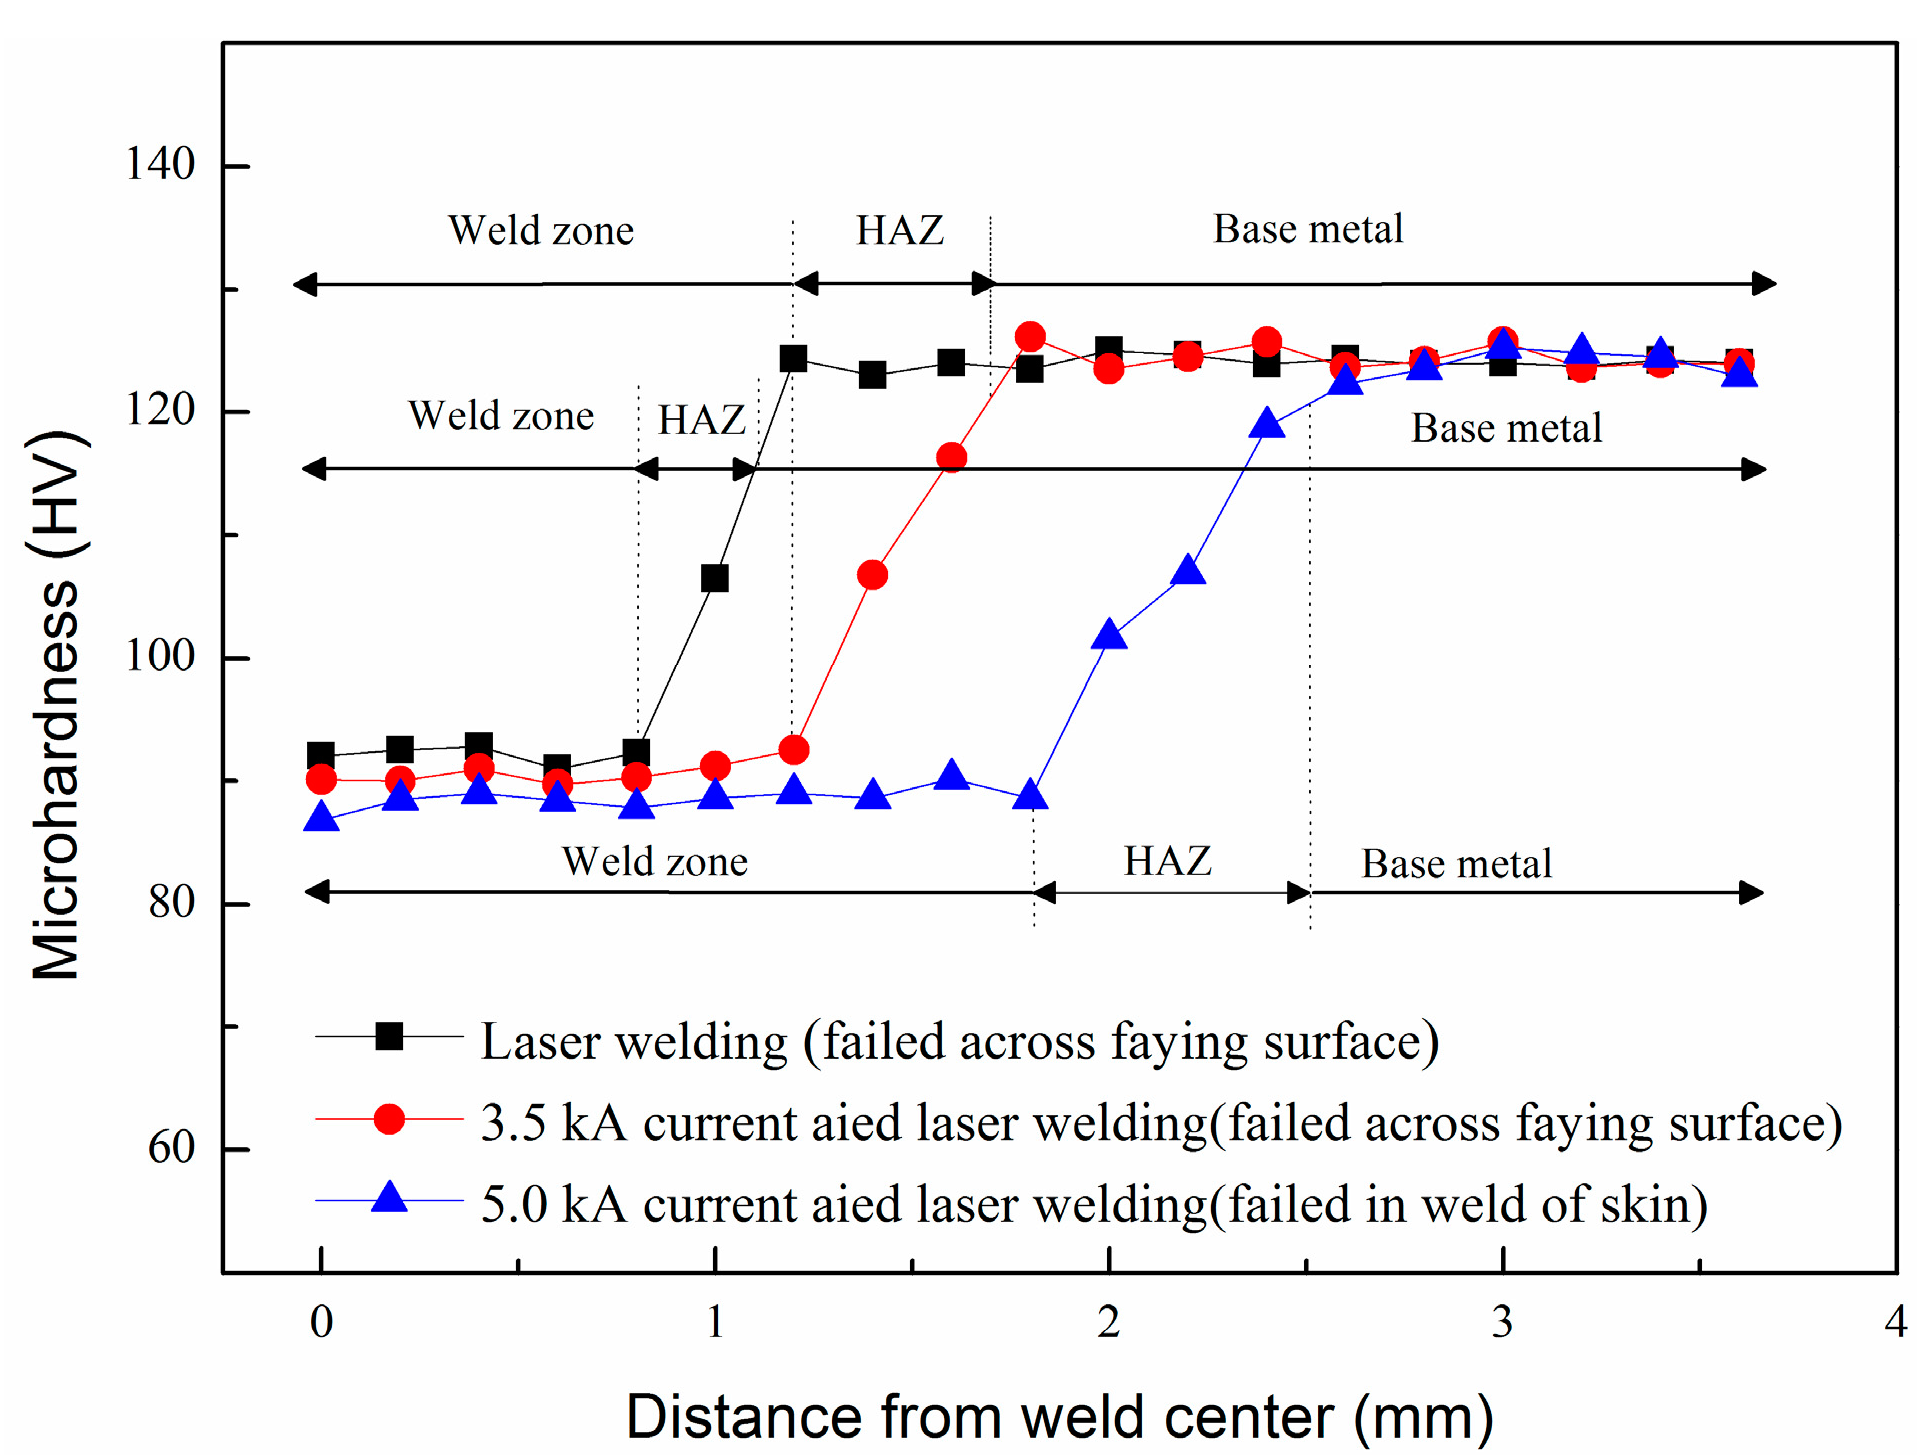
Microhardness tests were conducted on the cross-sections of the welded T-joints, and the measurement location was placed 1.5 mm below the skin surface of the welded T-joints, as illustrated in Figure 13. The microhardness distributions in the laser-welded and different electric current-aided laser-welded aluminum alloy T-joints (which failed across the faying surface and in the weld of the skin, respectively) are shown in Figure 14. For the lase-welded T-joint and for the electric current-aided laser-welded T-joints, the microhardness in the weld zone was the lowest because of the as-cast structure and growth of the strengthening phase β of decreased quantity. The microhardness of the base metal was the highest, which was attributed to the rolling deformation, initial annealing state and extremely fine phase β with a dispersed distribution. In the HAZ, the microhardness with an uneven distribution was higher than that in the weld zone. The hardness of the material reflects the ability to resist deformation; therefore, the hardness is directly relevant to the tensile shear loading capacity. Generally, with a decrease in the hardness, the tensile shear load decreases [30]. Because of the low hardness, the weld zone was the weakest area during the tensile shear tests and easily ruptured. Therefore, in the tensile shear tests, cracks all initiated from the edge of the weld at the faying surface. If the weld width at the faying surface (W) was small, the crack propagated across the faying surface between the skin and stringer until the tensile shear specimens failed, and if the weld width at the faying surface (W) was large, the fracture crack propagated in the weld zone of the skin until the tensile shear specimens failed, as shown in Figure 15.
As shown in Figure 14, the microhardness in the weld zone of the higher-electric-current-aided laser-welded T-joint was slightly lower than that of an even higher electric current. Thus, when the weld width at the faying surface (W) was sufficient and the tensile shear specimens failed in the weld zone of the skin, the welded T-joint tensile shear load increased to the maximum and then slightly decreased because the microstructure changed in the weld zone, as shown in Figure 12b,c, which is consistent with the tensile shear results shown in Figure 6. However, the reduction in the amount of tensile shear load was insignificant, which suggests that the tensile shear load of the aluminum alloy welded T-joint was mainly determined by the weld width at the faying surface (W).
4. Conclusions
Electric current-aided laser-welding technology was developed to stake weld aluminum alloy T-joints. The electric current used should be not more than 5.0 kA; otherwise, as in the present experimental investigation, the process stability reduces, resulting in a poor-quality weld.
With a higher electric current, the weld width at the faying surface (W) and penetration depth (H) both became larger; however, there was little change in the penetration depth (H). The weld width at the faying surface (W) visibly decreased, and the penetration depth had a small variation as the pressing force grew. The penetration depth (H) increased linearly with increasing laser power; however, the growth of the weld width at the faying surface (W) slowly decreased. The weld width and the penetration depth (H) at the faying surface (W) both clearly decreased when the welding speed increased. Consequently, the electric current and pressing force should be chosen to produce an expected weld width at the faying surface (W), whereas the laser power and welding speed should be primarily considered to obtain an optimal penetration depth (H).
The tensile shear load sharply increased at first and then reduced slowly as the weld width at the faying surface (W) increased. Some tensile shear specimens failed across the faying surface, and others failed in the weld zone of the skin. The specimens that failed in the weld of the skin could resist a higher tensile shear load compared with specimens that failed across the faying surface.
Because of the rolling deformation and extremely fine phase β with a dispersed distribution, the microhardness of the base metal was the highest. In the HAZ, the microhardness had an uneven distribution, which was higher than that in the weld zone. The weld zone was the weakest area during the tensile shear tests and was much more likely to rupture. The reduction in microhardness of the weld was only slight compared with that of the base metal and HAZ; therefore, the tensile shear load capacity of the aluminum alloy stake-welded T-joint was mainly determined by the weld width at the faying surface (W).
Acknowledgments
The work was financially supported by the Jilin Scientific and Technological Development Program (20160520055JH).
Author Contributions
Xinge Zhang designed the experiments, performed the experiments, analyzed the data and wrote the paper. Liqun Li and Yanbin Chen provided the experimental materials and laboratory equipment and directed the research. Zhaojun Yang and Xiaocui Zhu contributed to the discussion and interpretation of the results.
Conflicts of Interest
The authors declare no conflict of interest.
References
- Romanoff, J.; Varsta, P.; Remes, H. Laser-welded web-core sandwich plates under patch-loading. Mar. Struct. 2007, 20, 25–48. [Google Scholar] [CrossRef]
- Jelovica, J.; Romanoff, J.; Klein, R. Eigenfrequency analyses of laser-welded web-core sandwich panels. Thin-Walled Struct. 2016, 101, 120–128. [Google Scholar] [CrossRef]
- Jelovica, J.; Romanoff, J.; Ehlers, S.; Varsta, P. Influence of weld stiffness on the buckling strength of laser-welded web-core sandwich plates. J. Constr. Steel Res. 2012, 77, 12–18. [Google Scholar] [CrossRef]
- Janasekaran, S.; Tan, A.W.; Yusof, F.; Abdul Shukor, M.H. Influence of the overlapping factor and welding speed on T-Joint welding of Ti6Al4V and Inconel600 using low-power fiber laser. Metals 2016, 6, 134. [Google Scholar] [CrossRef]
- Knox, E.M.; Cowling, M.J.; Winkle, I.E. Adhesively bonded steel corrugated core sandwich construction for marine applications. Mar. Struct. 1998, 11, 185–204. [Google Scholar] [CrossRef]
- Silva, L.F.M.; Adams, R.D. The strength of adhesively bonded T-joints. Int. J. Adhes. Adhes. 2002, 22, 311–315. [Google Scholar] [CrossRef]
- Grant, L.D.R.; Adams, R.D.; Silva, L.F.M. Effect of the temperature on the strength of adhesively bonded single lap and T joints for the automotive industry. Int. J. Adhes. Adhes. 2009, 29, 535–542. [Google Scholar] [CrossRef]
- Frank, D. Fatigue strength assessment of laser stake-welded T-joints using local approaches. Int. J. Fatigue 2015, 73, 77–87. [Google Scholar] [CrossRef]
- Meng, W.; Li, Z.G.; Huang, J.; Wu, Y.X.; Cao, R. Effect of gap on plasma and molten pool dynamics during laser lap welding for T-joints. Int. J. Adv. Manuf. Technol. 2013, 69, 1105–1112. [Google Scholar] [CrossRef]
- Duley, W.W. Laser Welding, 1st ed.; John Wiley and Sons Ltd.: New York, NY, USA, 1998; pp. 1–9. [Google Scholar]
- Köse, C.; Karaca, E. Robotic Nd:YAG fiber Laser welding of Ti-6Al-4V alloy. Metals 2017, 7, 221. [Google Scholar] [CrossRef]
- Meng, W.; Li, Z.G.; Huang, J.; Wu, Y.X.; Chen, J.H.; Katayama, S. The influence of various factors on the geometric profile of laser lap welded T-joints. Int. J. Adv. Manuf. Technol. 2014, 74, 1625–1636. [Google Scholar] [CrossRef]
- Romanoff, J.; Remes, H.; Socha, G.; Jutila, M.; Varsta, P. The stiffness of laser stake welded T-joints in web-core sandwich structures. Thin-Walled Struct. 2007, 45, 453–462. [Google Scholar] [CrossRef]
- Li, K.; Lu, F.G.; Cui, H.C.; Li, X.B.; Tang, X.H.; Li, Z.G. Investigation on the effects of shielding gas on porosity in fiber laser welding of T-joint steels. Int. J. Adv. Manuf. Technol. 2015, 77, 1881–1888. [Google Scholar] [CrossRef]
- Wang, M.; Jiang, M.L.; Wei, Q.; Gu, K.F. Technique of laser-TIG hybrid T-shape joint welding of titanium Alloy. Adv. Mater. Res. 2011, 291–294, 841–847. [Google Scholar] [CrossRef]
- Hou, Z.L.; Li, C.B.; Liu, L.M. Laser-TIG Hybrid Welding of Magnesium Alloy T-Joint with Cold Filler Wire. Mater. Trans. 2015, 56, 1242–1247. [Google Scholar] [CrossRef]
- Li, C.B.; Liu, L.M. Investigation on weldability of magnesium alloy thin sheet T-joints: Arc welding, laser welding, and laser-arc hybrid welding. Int. J. Adv. Manuf. Technol. 2013, 65, 27–34. [Google Scholar] [CrossRef]
- Fratini, L.; Buffa, G.; Shivpuri, R. Influence of material characteristics on plastomechanics of the FSW process for T-joints. Mater. Des. 2009, 30, 2435–2445. [Google Scholar] [CrossRef]
- Cui, L.; Yang, X.Q.; Zhou, G.; Xu, X.D.; Shen, Z.K. Characteristics of defects and tensile behaviors on friction stir welded AA6061-T4 T-joints. Mater. Sci. Eng. A 2012, 543, 58–68. [Google Scholar] [CrossRef]
- Zhao, Y.; Zhou, L.L.; Wang, Q.Z.; Yan, K.; Zou, J.S. Defects and tensile properties of 6013 aluminum alloy T-joints by friction stir welding. Mater. Des. 2014, 57, 146–155. [Google Scholar] [CrossRef]
- Urbikain, G.; Perez, J.M.; Lacalle, L.N.L.D.; Andueza, A. Combination of friction drilling and form tapping processes on dissimilar materials for making nutless joints. Proc. Inst. Mech. Eng. Part B J. Eng. Manuf. 2016. [Google Scholar] [CrossRef]
- Hong, K.M.; Shin, Y.C. Prospects of laser welding technology in the automotive industry: A review. J. Mater. Process. Technol. 2017, 245, 46–69. [Google Scholar] [CrossRef]
- Caiazzo, F.; Alfieri, V.; Corrado, G.; Argenio, P.; Barbieri, G.; Acerra, F.; Innaro, V. Laser beam welding of a Ti–6Al–4V support flange for buy-to-fly reduction. Metals 2017, 7, 183. [Google Scholar] [CrossRef]
- Hou, X.P.; Yang, X.Q.; Cui, L.; Zhou, G. Influences of joint geometry on defects and mechanical properties of friction stir welded AA6061-T4 T-joints. Mater. Des. 2014, 53, 106–117. [Google Scholar] [CrossRef]
- Lee, H.S.; Yoon, J.H.; Yoo, J.T.; No, K. Friction stir welding process of aluminum-lithium alloy 2195. Procedia Eng. 2016, 149, 62–66. [Google Scholar] [CrossRef]
- Krahmer, D.M.; Polvorosa, R.; Lacalle, L.N.L.D.; Alonso-Pinillos, U.; Abate, G.; Riu, F. Alternatives for specimen manufacturing in tensile testing of steel plates. Exp. Tech. 2016, 40, 1–11. [Google Scholar] [CrossRef]
- Ertek Emre, H.; Kaçar, R. Resistance Spot Weldability of Galvanize Coated and Uncoated TRIP Steels. Metals 2016, 6, 299. [Google Scholar] [CrossRef]
- Gao, S.; Wu, Z.S.; Jin, P.F.; Wang, J.J.; Shuai, P. Effect of deep cryogenic treatment on microstructure of 5A06 aluminum alloy MIG welded joint welding. Mater. Sci. Forum 2012, 724, 182–185. [Google Scholar] [CrossRef]
- Wang, L.X.; Cong, B.Q.; Qi, B.J.; Li, W.; Yang, M.X.; Yang, Z.; Li, Y.L. Effect of ultra-high frequency pulse square-wave current on 5A06 aluminum alloy HPVP-GTAW joints. Trans. China Weld. Inst. 2013, 34, 61–64. [Google Scholar]
- Chen, Y.B.; Miao, Y.G.; Li, L.Q.; Wu, L. Joint performance of laser-TIG double-side welded 5A06 aluminum alloy. Trans. Nonferrous Met. Soc. China 2009, 19, 26–31. [Google Scholar] [CrossRef]
Figure 1.
Schematic diagram of the set-up of electric current-aided laser stake welding of a T-joint.
Figure 1.
Schematic diagram of the set-up of electric current-aided laser stake welding of a T-joint.

Figure 2.
Schematic diagram of the specimen preparation and assembly for the tensile shear tests.
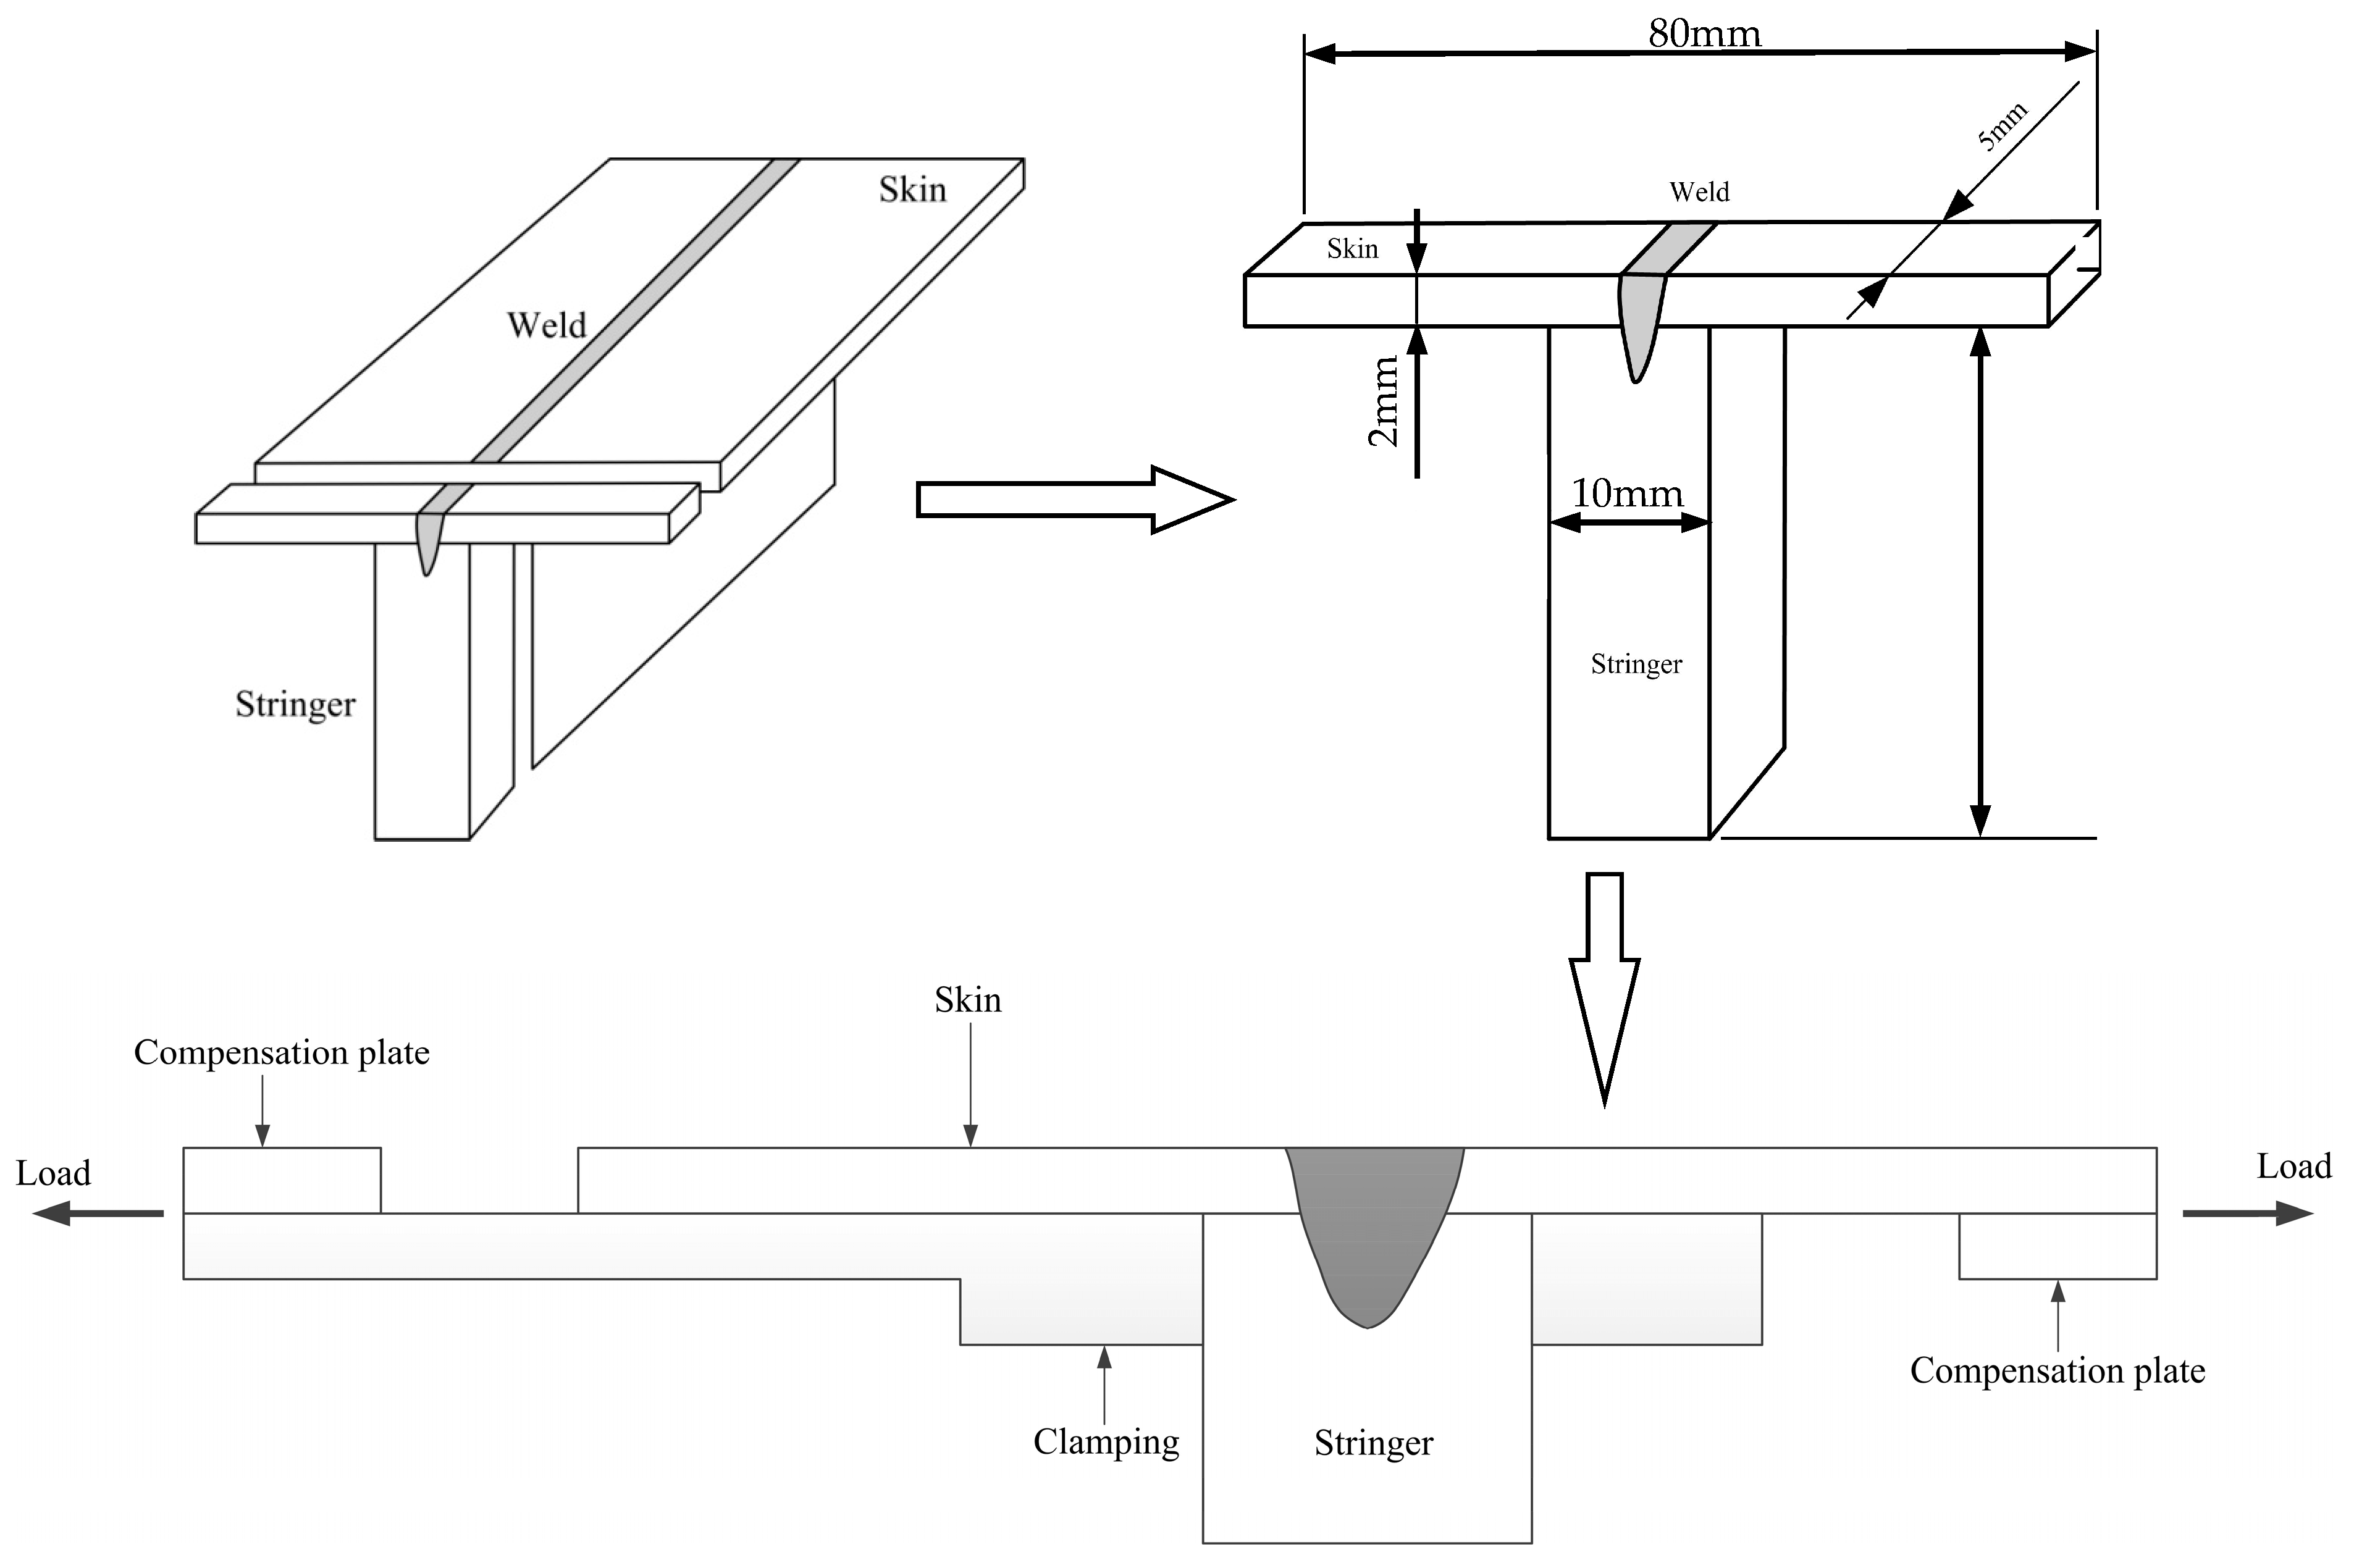
Figure 3.
Typical macrographs of the weld morphology produced with different aided electric currents (fixed process parameters: laser power, P = 1.6 kW; welding speed, v = 0.72 m/min; pressing force, F = 1.1 kN): (a) 0 kA; (b) 3.5 kA; (c) 5.0 kA; (d) 6.0 kA; (e) 7.0 kA.
Figure 3.
Typical macrographs of the weld morphology produced with different aided electric currents (fixed process parameters: laser power, P = 1.6 kW; welding speed, v = 0.72 m/min; pressing force, F = 1.1 kN): (a) 0 kA; (b) 3.5 kA; (c) 5.0 kA; (d) 6.0 kA; (e) 7.0 kA.


Figure 4.
Definitions of the geometric dimensions of the weld morphology.

Figure 5.
Effects of the different process parameters on the weld morphology (W, H): (a) electric current; (b) pressing force; (c) laser power; (d) welding speed.
Figure 5.
Effects of the different process parameters on the weld morphology (W, H): (a) electric current; (b) pressing force; (c) laser power; (d) welding speed.

Figure 6.
Relationship between weld width at the faying surface (W) and tensile shear load.

Figure 7.
Macrographs of the failed tensile shear test specimens: (a) failed across the faying surface; (b) failed in the weld of the skin.
Figure 7.
Macrographs of the failed tensile shear test specimens: (a) failed across the faying surface; (b) failed in the weld of the skin.

Figure 8.
Load-strain curves of the failed tensile shear test specimens: (a) failed across the faying surface; (b) failed in the weld of the skin.
Figure 8.
Load-strain curves of the failed tensile shear test specimens: (a) failed across the faying surface; (b) failed in the weld of the skin.

Figure 9.
Scanning electron microscopy (SEM) images showing the fracture morphology of the failed specimens: (a) failed across the faying surface; (b) failed in the weld of the skin.
Figure 9.
Scanning electron microscopy (SEM) images showing the fracture morphology of the failed specimens: (a) failed across the faying surface; (b) failed in the weld of the skin.

Figure 10.
Microstructure of the welded joint: (a) laser welding; (b) 3.5 kA electric current-aided laser welding; (c) 5.0 kA electric current-aided laser welding.
Figure 10.
Microstructure of the welded joint: (a) laser welding; (b) 3.5 kA electric current-aided laser welding; (c) 5.0 kA electric current-aided laser welding.

Figure 11.
(a) Microstructure of the base metal; (b) energy-dispersive X-ray spectrometer (EDS) result of the phase particle A (Mg2Si); (c) EDS result of the phase particle B (Al6(Fe, Mn)); (d) EDS results of the phase particle C (Al3Mg2).
Figure 11.
(a) Microstructure of the base metal; (b) energy-dispersive X-ray spectrometer (EDS) result of the phase particle A (Mg2Si); (c) EDS result of the phase particle B (Al6(Fe, Mn)); (d) EDS results of the phase particle C (Al3Mg2).
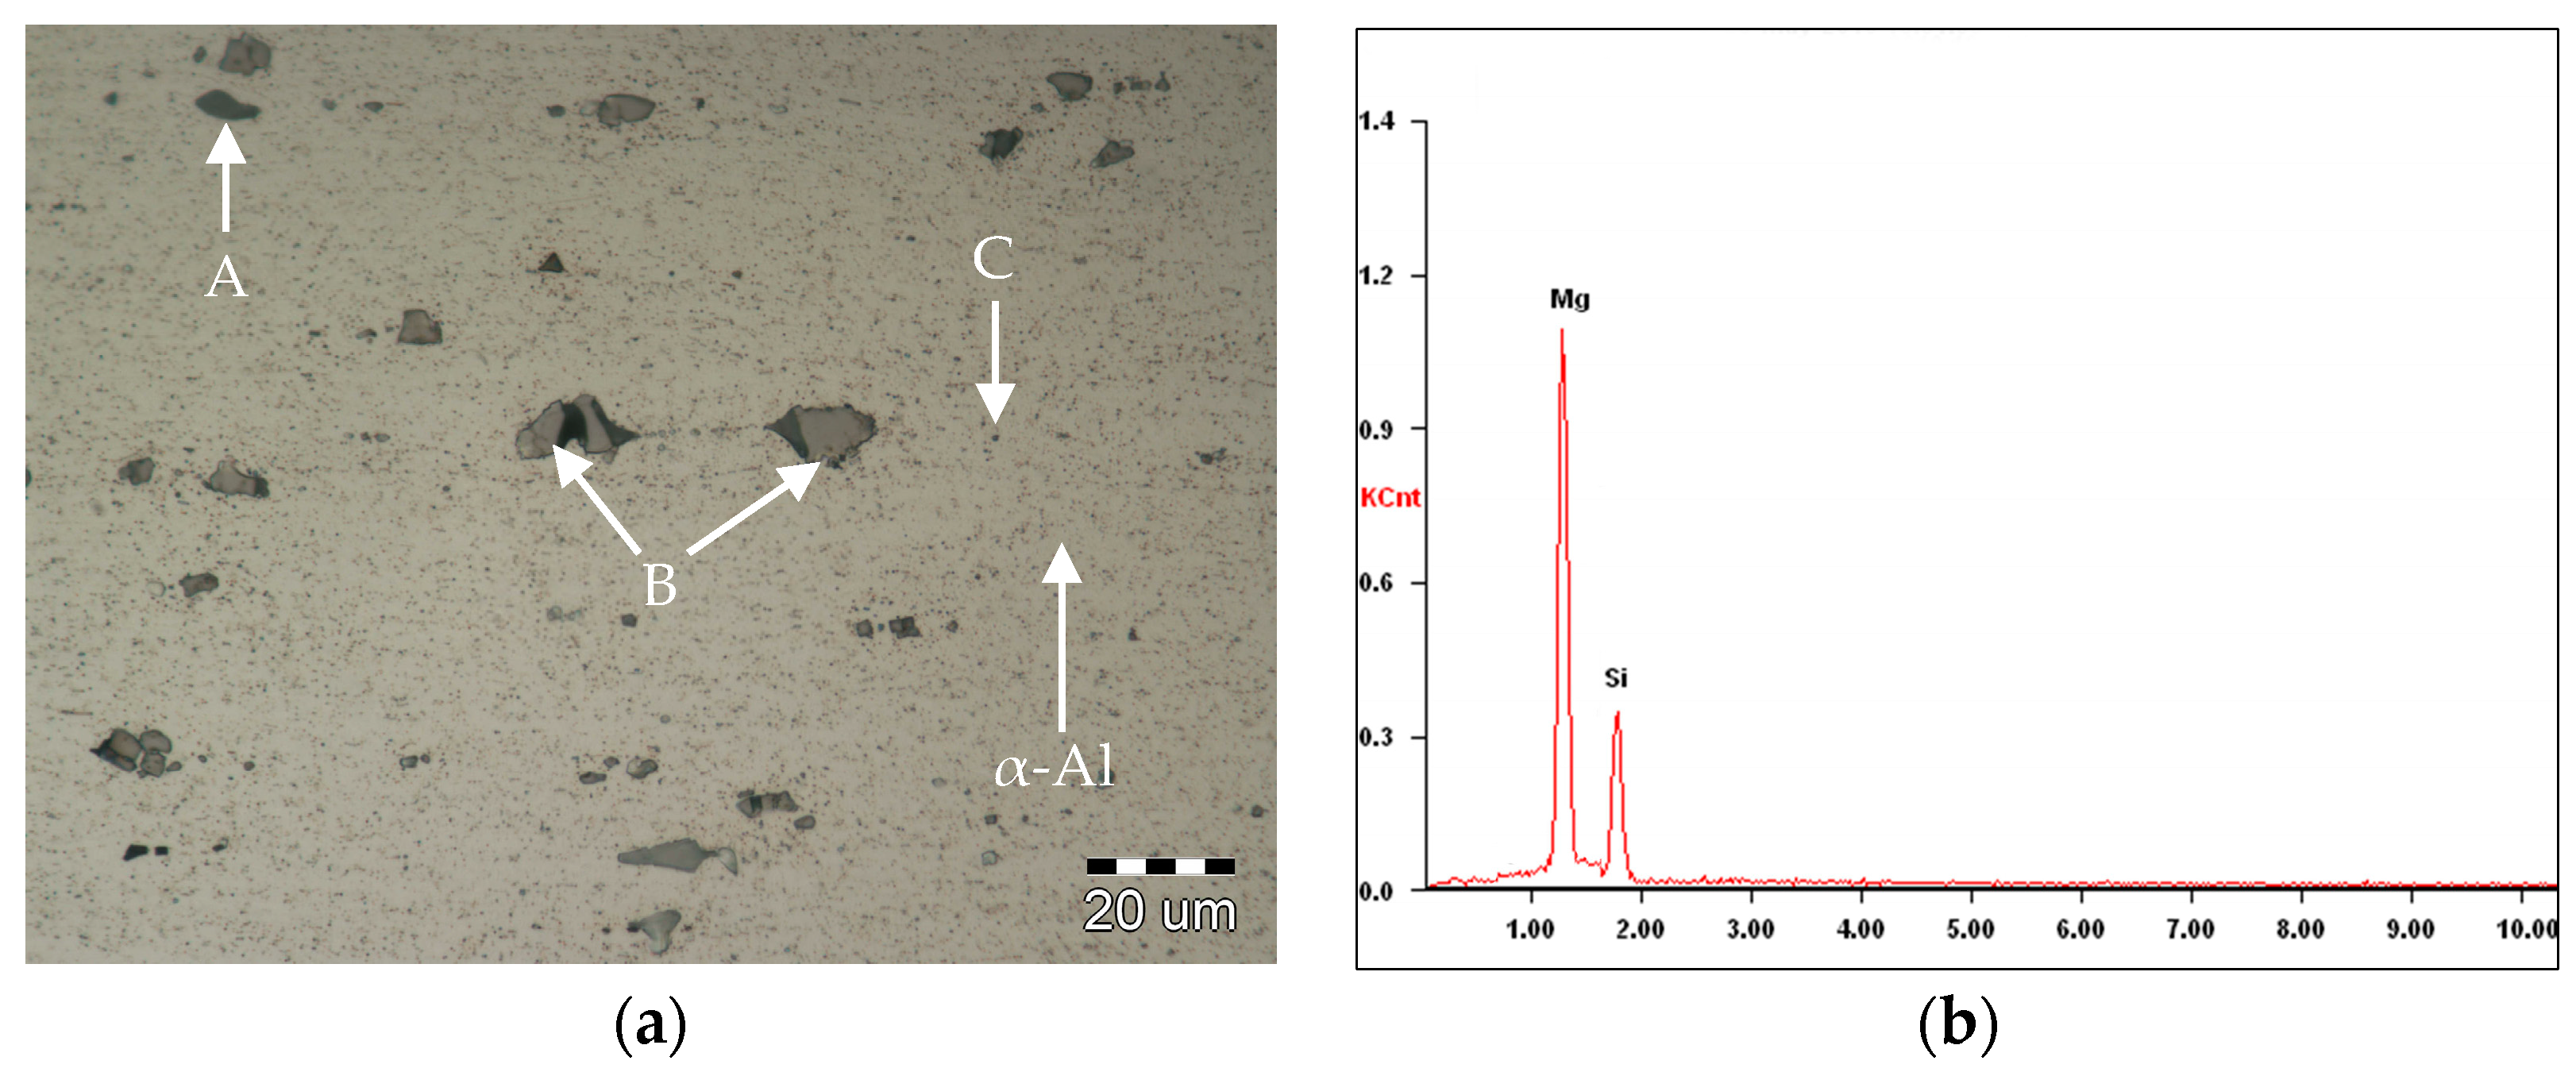

Figure 12.
Microstructure of (a) the weld center from laser welding; (b) the weld center from 3.5 kA electric current aided laser welding; (c) the weld center from 5.0 kA electric current aided laser welding.
Figure 12.
Microstructure of (a) the weld center from laser welding; (b) the weld center from 3.5 kA electric current aided laser welding; (c) the weld center from 5.0 kA electric current aided laser welding.

Figure 13.
Schematic illustration of the microhardness measurement location and direction.

Figure 14.
Microhardness distribution for different welded T-joints.

Figure 15.
Schematic illustration of sample failure modes: (a) failed across the faying surface; (b) failed in the weld of skin.
Figure 15.
Schematic illustration of sample failure modes: (a) failed across the faying surface; (b) failed in the weld of skin.

Table 1.
Chemical composition of the 5A06 aluminum alloy (wt %).
| Material | Mg | Mn | Si | Cu | Zn | Fe | Ti | Al |
|---|---|---|---|---|---|---|---|---|
| 5A06 | 5.8–6.8 | 0.5–0.8 | 0.4 | 0.1 | 0.2 | 0.4 | 0.02 | Balance |
Table 2.
The experimental equipment used in this study.
| Equipment | Model, Supplier |
|---|---|
| CO2 laser source | DC030; Rofin-Sinar, GmbH |
| Electric current supply device | PSG6130 and PSI6200; Bosch Rexroth Company |
| Tensile test machine | Instron5500R, Adivision of Illinois Tool Works Inc. |
| Optical microscope | Eclipse E200, Nikon Instruments, Ltd. |
| Microhardness test machine | HXD-1000TM; Zhuhai Precision Instrument Co., Ltd. |
| Scanning electron microscopy | S-4700; Hitachi, Ltd. |
© 2017 by the authors. Licensee MDPI, Basel, Switzerland. This article is an open access article distributed under the terms and conditions of the Creative Commons Attribution (CC BY) license (http://creativecommons.org/licenses/by/4.0/).
Share and Cite
MDPI and ACS Style
Zhang, X.; Li, L.; Chen, Y.; Yang, Z.; Zhu, X. Experimental Investigation on Electric Current-Aided Laser Stake Welding of Aluminum Alloy T-Joints. Metals 2017, 7, 467. https://doi.org/10.3390/met7110467
AMA Style
Zhang X, Li L, Chen Y, Yang Z, Zhu X. Experimental Investigation on Electric Current-Aided Laser Stake Welding of Aluminum Alloy T-Joints. Metals. 2017; 7(11):467. https://doi.org/10.3390/met7110467
Chicago/Turabian StyleZhang, Xinge, Liqun Li, Yanbin Chen, Zhaojun Yang, and Xiaocui Zhu. 2017. "Experimental Investigation on Electric Current-Aided Laser Stake Welding of Aluminum Alloy T-Joints" Metals 7, no. 11: 467. https://doi.org/10.3390/met7110467
Note that from the first issue of 2016, this journal uses article numbers instead of page numbers. See further details here.