Numerical Study on Solidification Behavior and Structure of Continuously Cast U71Mn Steel


The State Key Laboratory of Refractories and Metallurgy, Wuhan University of Science and Technology, Wuhan 430081, China
*
Author to whom correspondence should be addressed.
Metals 2017, 7(11), 483; https://doi.org/10.3390/met7110483
Submission received: 26 September 2017
/
Revised: 31 October 2017
/
Accepted: 31 October 2017
/
Published: 7 November 2017
Abstract
:The solidification behavior and structure of continuous casting high rail U71Mn bloom, under different secondary cooling conditions and superheat, were numerically investigated using the Cellular Automaton-Finite Element (CAFE) model implemented with ProCAST software. Nail shooting and macro etch experiments of the bloom samples under different cooling conditions were conducted to verify the model of macroscopic solidification and structure. The results showed that the simulated results of the solidified shell and solidification structure are basically consistent with experimental results. The secondary cooling condition has little effect on the grain size and distribution of the bloom, while both the bloom surface and corner temperatures are higher and the temperature rise at the beginning of the air-cooling zone is smaller under the super-slow cooling condition. The percentage of center-equiaxed grains decreases from 44.6% to 20.1% and the grain average radius increases from 1.025 to 1.128 mm when the superheat increases from 15 to 40 K, with little change in the grain size occurring between 15 and 20 K. Moreover, for a step increase in the superheat of 5 K, the solidification end is lengthened by about 0.19 m and the surface temperature is enhanced by 3 K. The super-slow secondary cooling condition with the superheat controlled within 20 K is suitable for big-bloom casting.
1. Introduction
The solidification structure of continuous casting bloom (especially the center shrinkage and segregation of the bloom) has significant effects on the quality of the final products [1]. Center-equiaxed grains can effectively prevent the formation of solidification bridges and redistribute the residual impure liquid: The center segregation decreases as the center-equiaxed ratio increases. Furthermore, columnar grains will lead to the deterioration of mechanical properties [2]. For high-carbon big blooms, the solidification structure is difficult to evaluate and measure experimentally, because of the complicated branches and interactions and the huge number of grains. Therefore, numerical simulation has become an effective way to analyze the solidification behavior and structure during the continuous casting process. At present, deterministic [3], stochastic [4] and phase field approaches [5] are the main methods of modeling the solidification structure evolution of steels and alloys. Deterministic modeling cannot describe the probabilistic phenomena occurring in solidification and neglect the grain selection, equiaxed–columnar transition (CET) near to the mold wall. Phase field is suitable for the direct modeling of dendritic grain morphology, but needs huge computational resources and is limited to a relatively small equiaxed grain without a full side-branch structure. Stochastic methods include the Monte Carlo (MC) and cellular automaton (CA) techniques, although the former cannot be used to quantitatively investigate the effect of the various thermo-physical phenomena. The CA technique effectively describes the grain structure at a mesoscopic scale and the dendritic growth and arm branching at a microscopic scale. In the 1990s, Gandin et al. [6,7] developed the Cellular Automaton-Finite Element (CAFE) model by combining the CA technique with the finite element (FE) method. This CAFE model has been successfully applied in simulating the solidification behavior and structure [8,9,10]. In recent years, several published works have used the CAFE model to investigate the solidification structure during the continuous casting process [11,12,13,14,15]. However, most of them focus only on the structure during the continuous casting process and the heat transfer results associated with the solidification structure are ignored. It is known that both the heat transfer behavior and the temperature field are the foundations of the solidification structure, and the macroscopic heat transfer behavior and structure jointly decide the quality of the bloom.
The rapid development of high-speed railway in China is driving the gradual increase in demand of a higher quality of raw materials. In this paper, the solidification behavior, temperature field and solidification structure during the continuous casting process of 380 mm × 280 mm heavy rail U71Mn bloom were numerically investigated using the CAFE model through ProCAST software. The thickness of the solidified shell, at two positions in the air-cooling zone under different secondary cooling conditions, was measured by nail shooting experiments to validate the model of macroscopic solidification. Macro etch experiments were also conducted to verify the model of solidification structure. Furthermore, the effects of both the secondary cooling types and superheat on the macroscopic solidification and structure are also discussed and compared to find ideal casting conditions for the bloom.
2. Model Descriptions
2.1. Basic Assumptions
To simplify the calculation process of the numerical simulation, the following four assumptions were made on the heat transfer characteristics and industrial conditions of the big bloom [16]:
- (1)
- Heat transfer along the casting direction is ignored as it occurs much less in comparison to the heat transfer in the direction along the cross-sectional during the continuous casting process of round blooms.
- (2)
- For the existence of interspace between the mold and bloom, the heat transfer in the mold can be calculated by the average heat flux.
- (3)
- The effect of the fluid flow of molten steel on the internal heat transfer and structure is ignored during the calculations.
- (4)
- Given that there is uniform heat transfer in each part of secondary cooling zone, the heat exchange of the bloom in the secondary cooling zone can be described by the heat transfer coefficient.
2.2. Governing Equations
2.2.1. Thermal Transport
The temperature field obeys the following unsteady heat flow equation [12]:
where T is the local temperature; λ, ρ and cp are the thermal conductivity, density and specific heat of the steel, respectively; and represent the temperature gradient at x and y direction.
2.2.2. Heterogeneous Nucleation
The continuous nucleation model based on a Gaussian distribution is applied for heterogeneous nucleation [6,17]:
where n(ΔT) is the number of nucleation sites for an undercooling temperature of ΔT; is the mean nucleation undercooling; is nucleation undercooling for the standard deviation; is the maximum nucleation density.
2.2.3. Kinetics of Dendritic Tip Growth
The simplified KGT model (proposed by Kurz, Giovanola and Trivedi) [18] is applied to calculate the kinetics of dendritic tip growth. This is expressed in the following equation:
where a2 and a3 are the fitting polynomial coefficients of the dendrite tip growth kinetic parameters; v is growth rate (v) of dendrite tip when the undercooling temperature is ΔT.
3. Simulation Procedures and Model Validation
3.1. Model Building
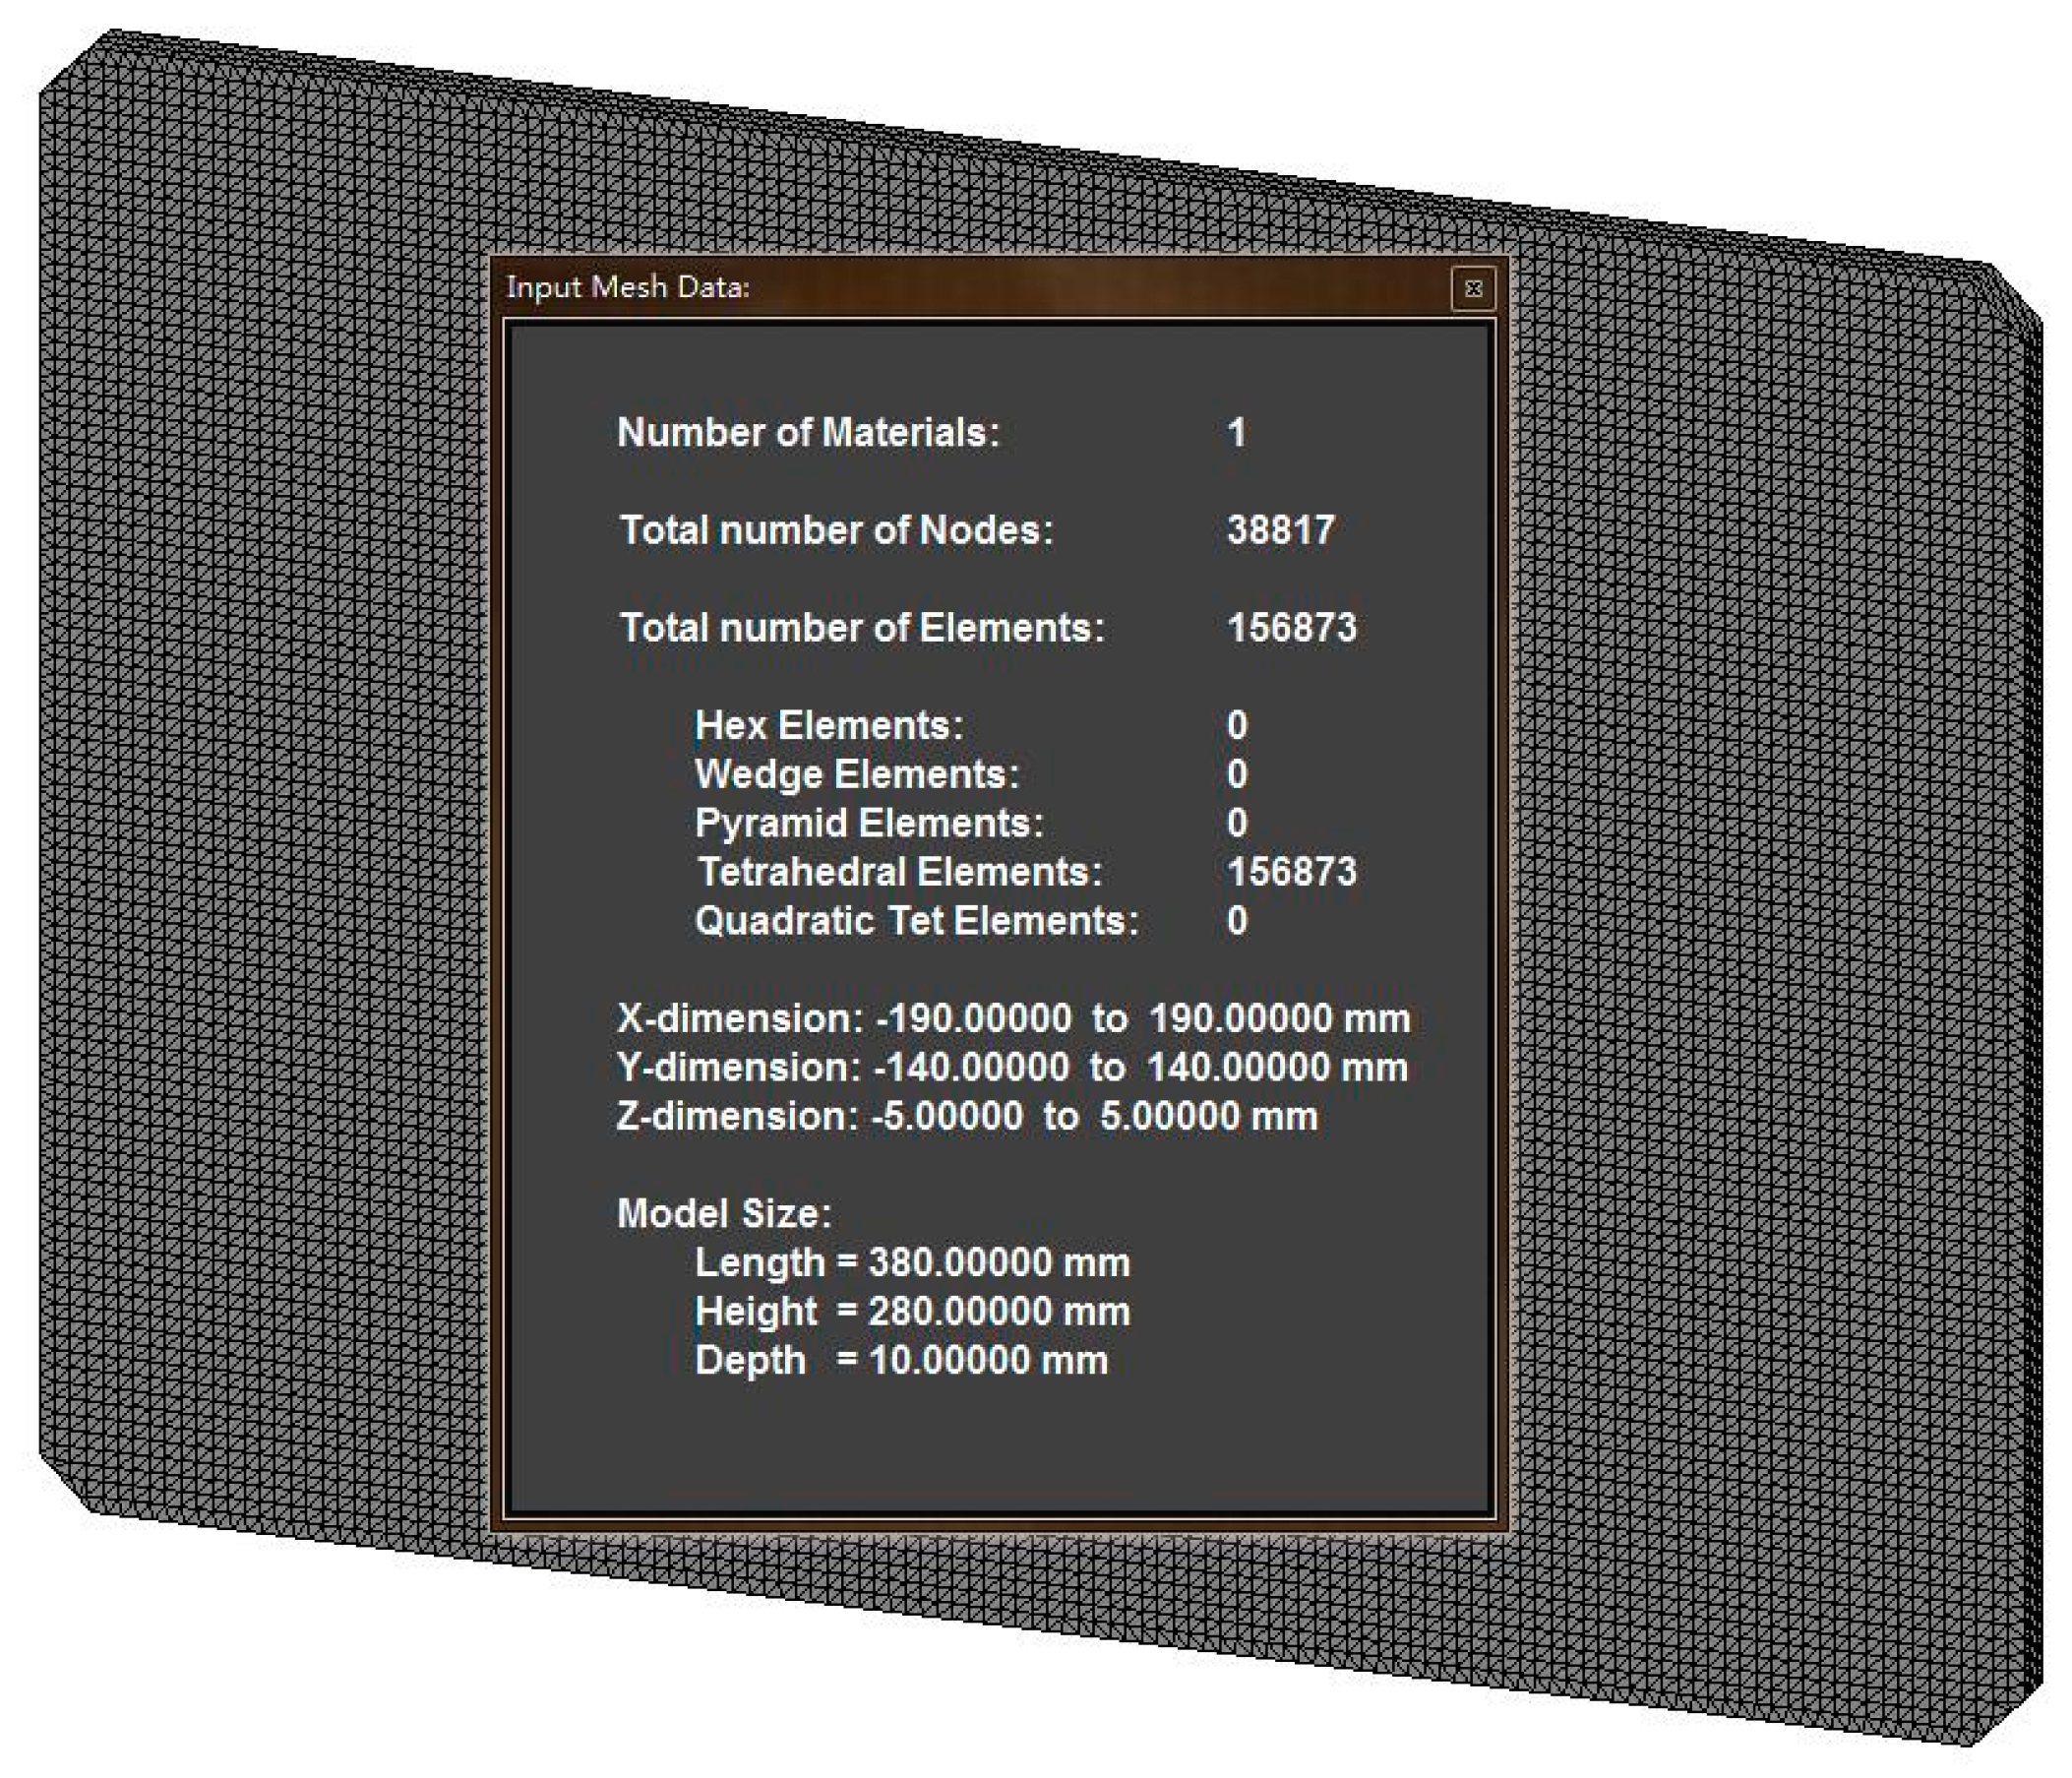
A 380 mm × 280 mm × 10 mm slice model with four 10 mm chamfered corners was developed in Pro/Engineer (5.0, Parametric Technology Corporation, Needham, MA, USA) then meshed with ProCAST software (2011.0, EIS Group, Paris, France). The total nodes and cells in the meshed model are 38,817 and 156,873, respectively. The meshed model is displayed in Figure 1.
3.2. Casting Conditions and Parameters
Table 1 lists the main parameters of the bloom-casting machine, where SSC and SC represent the super-slow cooling and the slow cooling conditions, respectively. Figure 2 shows the variation in the thermal-physical parameters (density, enthalpy, solid fraction and thermal conductivity) at various temperatures. These values are calculated through ProCAST by inputting the chemical compositions of the steel. Furthermore, the liquidus (Tl) and solidus (Ts) temperature of the steel are 1746.15 and 1640.15 K, respectively.
The high rail steel U71Mn is split into five main Fe-X binary systems: Fe-C, Fe-Si, Fe-Mn, Fe-P, and Fe-S. The composition c0, liquidus slope m, partition coefficient k, and the solute diffusion coefficient D of Fe-X alloys and the Gibbs-Thompson coefficient Г are listed in Table 2. These values are also applied in the calculation of a2 and a3 [13]:
3.3. Initial and Boundary Conditions
The temperature of liquid steel in the slice is supposed to be equally distributed and equal with the temperature of liquid steel in tundish. The heat transfer boundary conditions for the bloom slice in each section of the caster can be set as follows. In the mold zone, the average heat flux is applied:
where ρw, cw, W and ΔT are the density, specific heat, flow rate, and temperature difference of cooling water, respectively; S is the effective contact area.
In the secondary cooling zone, the heat transfer coefficient of the water spray condition is calculated from Equation (8), while Equation (9) is applied for air-mist cooling conditions:
where h and w are the heat transfer coefficient and spray water density, respectively; α and β are the correction factors.
In the air-cooling zone, the heat flux density can be calculated with the following equation:
where σ is the Steven–Boltzmann constant (5.67 × 10⁻⁸ W·m−2·K−4); ε is the radiate heat transfer coefficient; T and Tw are the temperatures of the bloom surface and the environment, respectively.
3.4. Model Validation
3.4.1. Validation of Heat Transfer
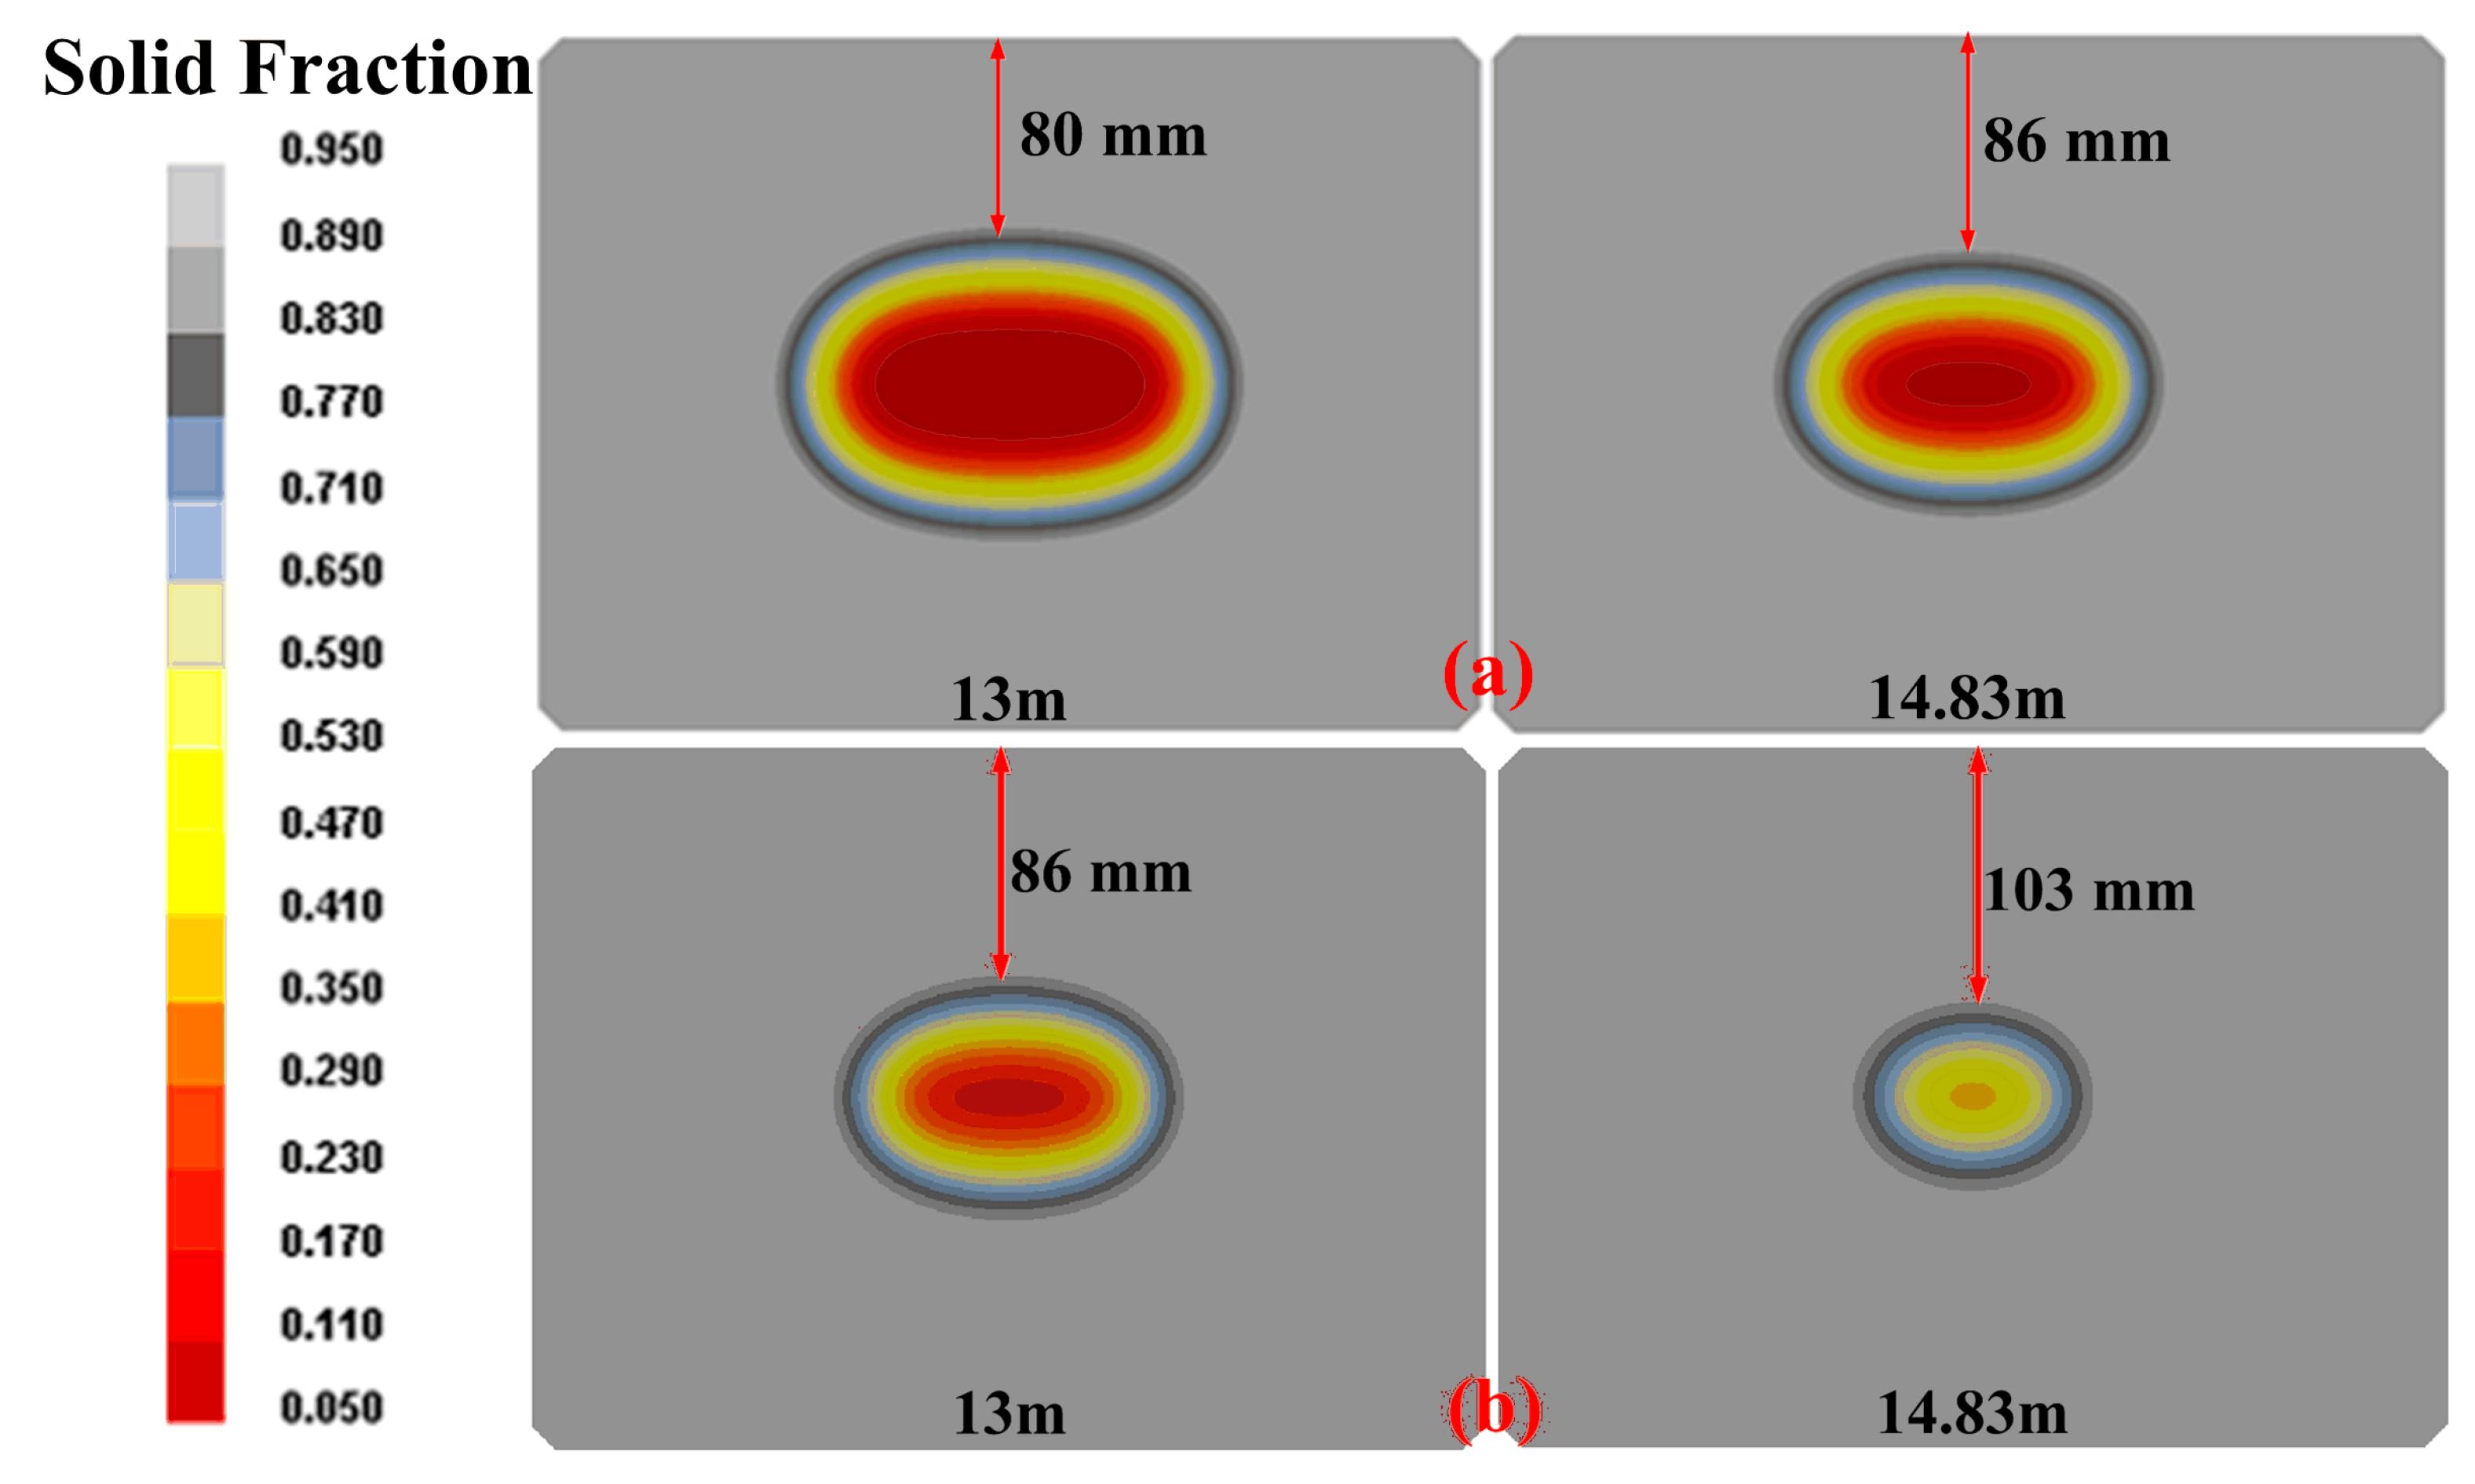
A nail shooting experiment is one of the best ways to measure the thickness of the bloom solidified shell, being easy to operate and reliable. It is usually used to validate the simulation results of macroscopic solidification. During the continuous casting process, the nails with a tracer of sulfur are shot into the bloom perpendicular to the surface with a nail shooting gun. The nails have sufficient momentum to penetrate the solidified shell and the tips melt in the liquid. Thus, the sulfur is quickly distributed into the molten steel. After acid pickling and sulfur printing, the thickness of the solidified shell can be determined according to the morphology of sulfur. Detailed information about both the technique and the equipment used in the nail shooting experiment are reported elsewhere [19]. Two blooms under different secondary cooling conditions are tested. For each bloom, the shell thicknesses at two testing positions are measured. The testing positions at each bloom are 13 m (1#) and 14.83 m (2#) below the meniscus. Figure 3 shows part of the solidified sulfur printing samples from the nail shooting experiments: Black trace is the diffused sulfur in the nails. Figure 4 shows the contours of solid fraction distribution in the cross sections of testing points under the SSC (a) and SC (b) conditions, respectively. Table 4 compares measured and simulated solidified shell thickness.
It can be seen from the experimental and numerical results that the thicknesses of the solidified shell at 13 m and 14.83 m below the meniscus are within 83–89 mm and 89–103 mm respectively (for a range of different cooling conditions), and solidification end is within 17.23–19.69 m. Compared to the measured results, the simulated solidified shell thickness errors are within 4%. Thus, the heat transfer model is acceptable in this situation.
3.4.2. Validation of Solidification Structure
The industrial continuous casting blooms are polished and etched. The etching solution, V(HNO3):V(HCI):V(HF):V(H2O) = 2.5:1.5:1:95, was used to etch the grain boundary, and the metallographic images were observed using a camera (Canon, Tokyo, Japan). Figure 5 shows the comparison of the numerical and experimental solidification structures under SSC (a) and SC (b), respectively, in which the superheat of each bloom is 25 K. The percentages of center-equiaxed grains in the industrial blooms are about 27.9% for SSC and 28.2% for SC, while the calculated equiaxed grain ratios are 28.7% for SSC and 28.9% for SC.
The solidification macrostructure at a quarter of the equiaxed grain zone (see position “A” on the right picture of Figure 5a) in the industrial bloom under SSC was observed by optical microscope (OM). The solidification structures of this sample under ten fields of views were measured and one of the ten fields filmed by OM was showed in Figure 6. The averaged grain radius in the ten fields was counted to be around 0.678 mm, and the statistical averaged grain radius of the simulated results at the same position is 0.689 mm.
It can be seen that the simulation results of the solidification structure distributions and size are basically consistent with the experimental results.
4. Results and Discussion
4.1. Effect of Secondary Cooling Types
To investigate, more specifically, the effect of secondary cooling types on the temperature field, solidification process and structure in the continuous casting bloom, the numerical results of the heat transfer and structure under the two cases mentioned above are discussed and compared statistically in this part.
Figure 7 shows the temperature variations in the bloom center, wide surface and corner along the casting direction under different secondary cooling conditions. Figure 8 presents the contours of solid fraction distribution at the end of the secondary cooling zone (z = 9.72 m) under different cooling conditions. Combining the information shown in Figure 4, Figure 7 and Figure 8, it can be seen that the secondary cooling condition has significant effects on the temperature field and solidification behavior of the continuous casting bloom. Compared to SC, the growth velocity of the solidifying shell is obviously smaller in SCC: The solidified shell thickness is 64 mm at 9.72 m below the meniscus, 80 mm at 13 m below the meniscus and 86 mm at 14.83 m below the meniscus for SCC; whereas the thicknesses of the solidified shell at the same positions are 76, 86 and 103 mm, respectively, for SC. The metallurgical lengths under different secondary cooling conditions are 17.23 m for SC and 19.56 m for SSC, and the length of the mushy zone at the bloom center is 8.10 m for SC and 10.56 m for SSC. The surface and corner temperatures of the bloom under the SSC condition are relatively high. The surface temperature before the air-cooling zone is larger than 1370 K: Increasing from 1370 K at 9.72 m below the meniscus to 1410 K at 11.5 m below the meniscus when entering the air-cooling zone. It then decreases to 1270 K at 26 m below the meniscus. Whereas the surface temperature at the end of the secondary cooling zone under SC is 1255 K. This increases to 1354 K at 12.5 m below the meniscus, where a remarkable rise happens in a short distance when entering the air-cooling zone, followed by a gradual decrease to 1227 K at 26 m below the meniscus. The temperature variations of the bloom corner under different secondary cooling conditions have a similar changing trend as the surface temperature. The corner temperatures under different secondary cooling conditions are 1070 K for SSC and 930 K for SC at end of secondary cooling zone, followed by an increase to 1200 K at 13.92 m below the meniscus for SCC and 1140 K at 17.34 m below the meniscus for SC. A rise of more than 150 K happens within the first two meters of the air-cooling zone for the SC condition. Higher surface and corner temperatures, as well as smaller temperature rise per meter, result in less opportunity to cause bloom surface cracks.
The numerical results of the solidification structure of the bloom under SCC (a) and SC (b) are presented in Figure 5. As it is not possible to visually detect the grain difference between these two cases, a statistical analysis is particularly necessary in this situation. Table 5 provides a comparison of the statistic grain parameters under different secondary cooling conditions in a quarter of bloom cross section. No. Grains and Mean Surf represent the total number of the grains and average surface area of each grain, respectively; Equiaxed ratio is the ratio of equiaxed grain in the bloom center; Nl and Na are the grain number per meter and per square meter, respectively. It can be seen that the total grain number, Nl, Na and the center-equiaxed grain ratio under SC are slightly larger when compared with the SSC condition, while the grain mean surface area and mean radius are a little smaller. The grain average radius is about 1.089 mm for SSC and 1.066 mm for SC, and the ratios of bloom center-equiaxed grain are around 28.7% for SSC and 28.9% for SC. Comparing the parameters of the grain sizes and distributions under SSC and SC, it is evident that the secondary cooling condition has limited effects on the solidification structure of the bloom, because both the SSC and SC themselves belong to the slow cooling conditions.
After comprehensively considering the results of the temperature field and solidification structure under SCC and SC, in order to reduce the chance of bloom surface defects, center porosity and segregation, the super-slow cooling condition is more acceptable for continuous casting blooms.
4.2. Effect of Superheat
Qu et al. [20] numerically analyzed the solidification structure of a 280 mm × 325 mm continuous casting bloom and discussed the effect of casting speed and superheat on the solidification structure. They found that the final solidification structure changed less when the casting speed fluctuation was within ±0.5 m/min and that the casting temperature had significant effects on the structure. They also found that the grain size increased as the superheat was enhanced, and the ratio of center-equiaxed grain decreased as the superheat increased. To guarantee bloom quality, finding an appropriate casting superheat for bloom casting is essential.
Figure 9 presents the temperature variations of the bloom surface and centerline along the casting direction under different superheat. In this study, the superheat values that were considered are 15, 20, 25, 30 and 40 K, and the secondary cooling condition used in these cases was SSC. It can be seen from Figure 9 that the superheat has little effect on the solidification length and surface temperature of the bloom during the continuous casting process. The bloom solidifies end elongates from 19.15 to 20.10 m as the superheat increases from 15 to 40 K: each 5 K rise in the superheat results in a metallurgical length increase of about 0.19 m and about a 3 K rise in bloom surface temperature.
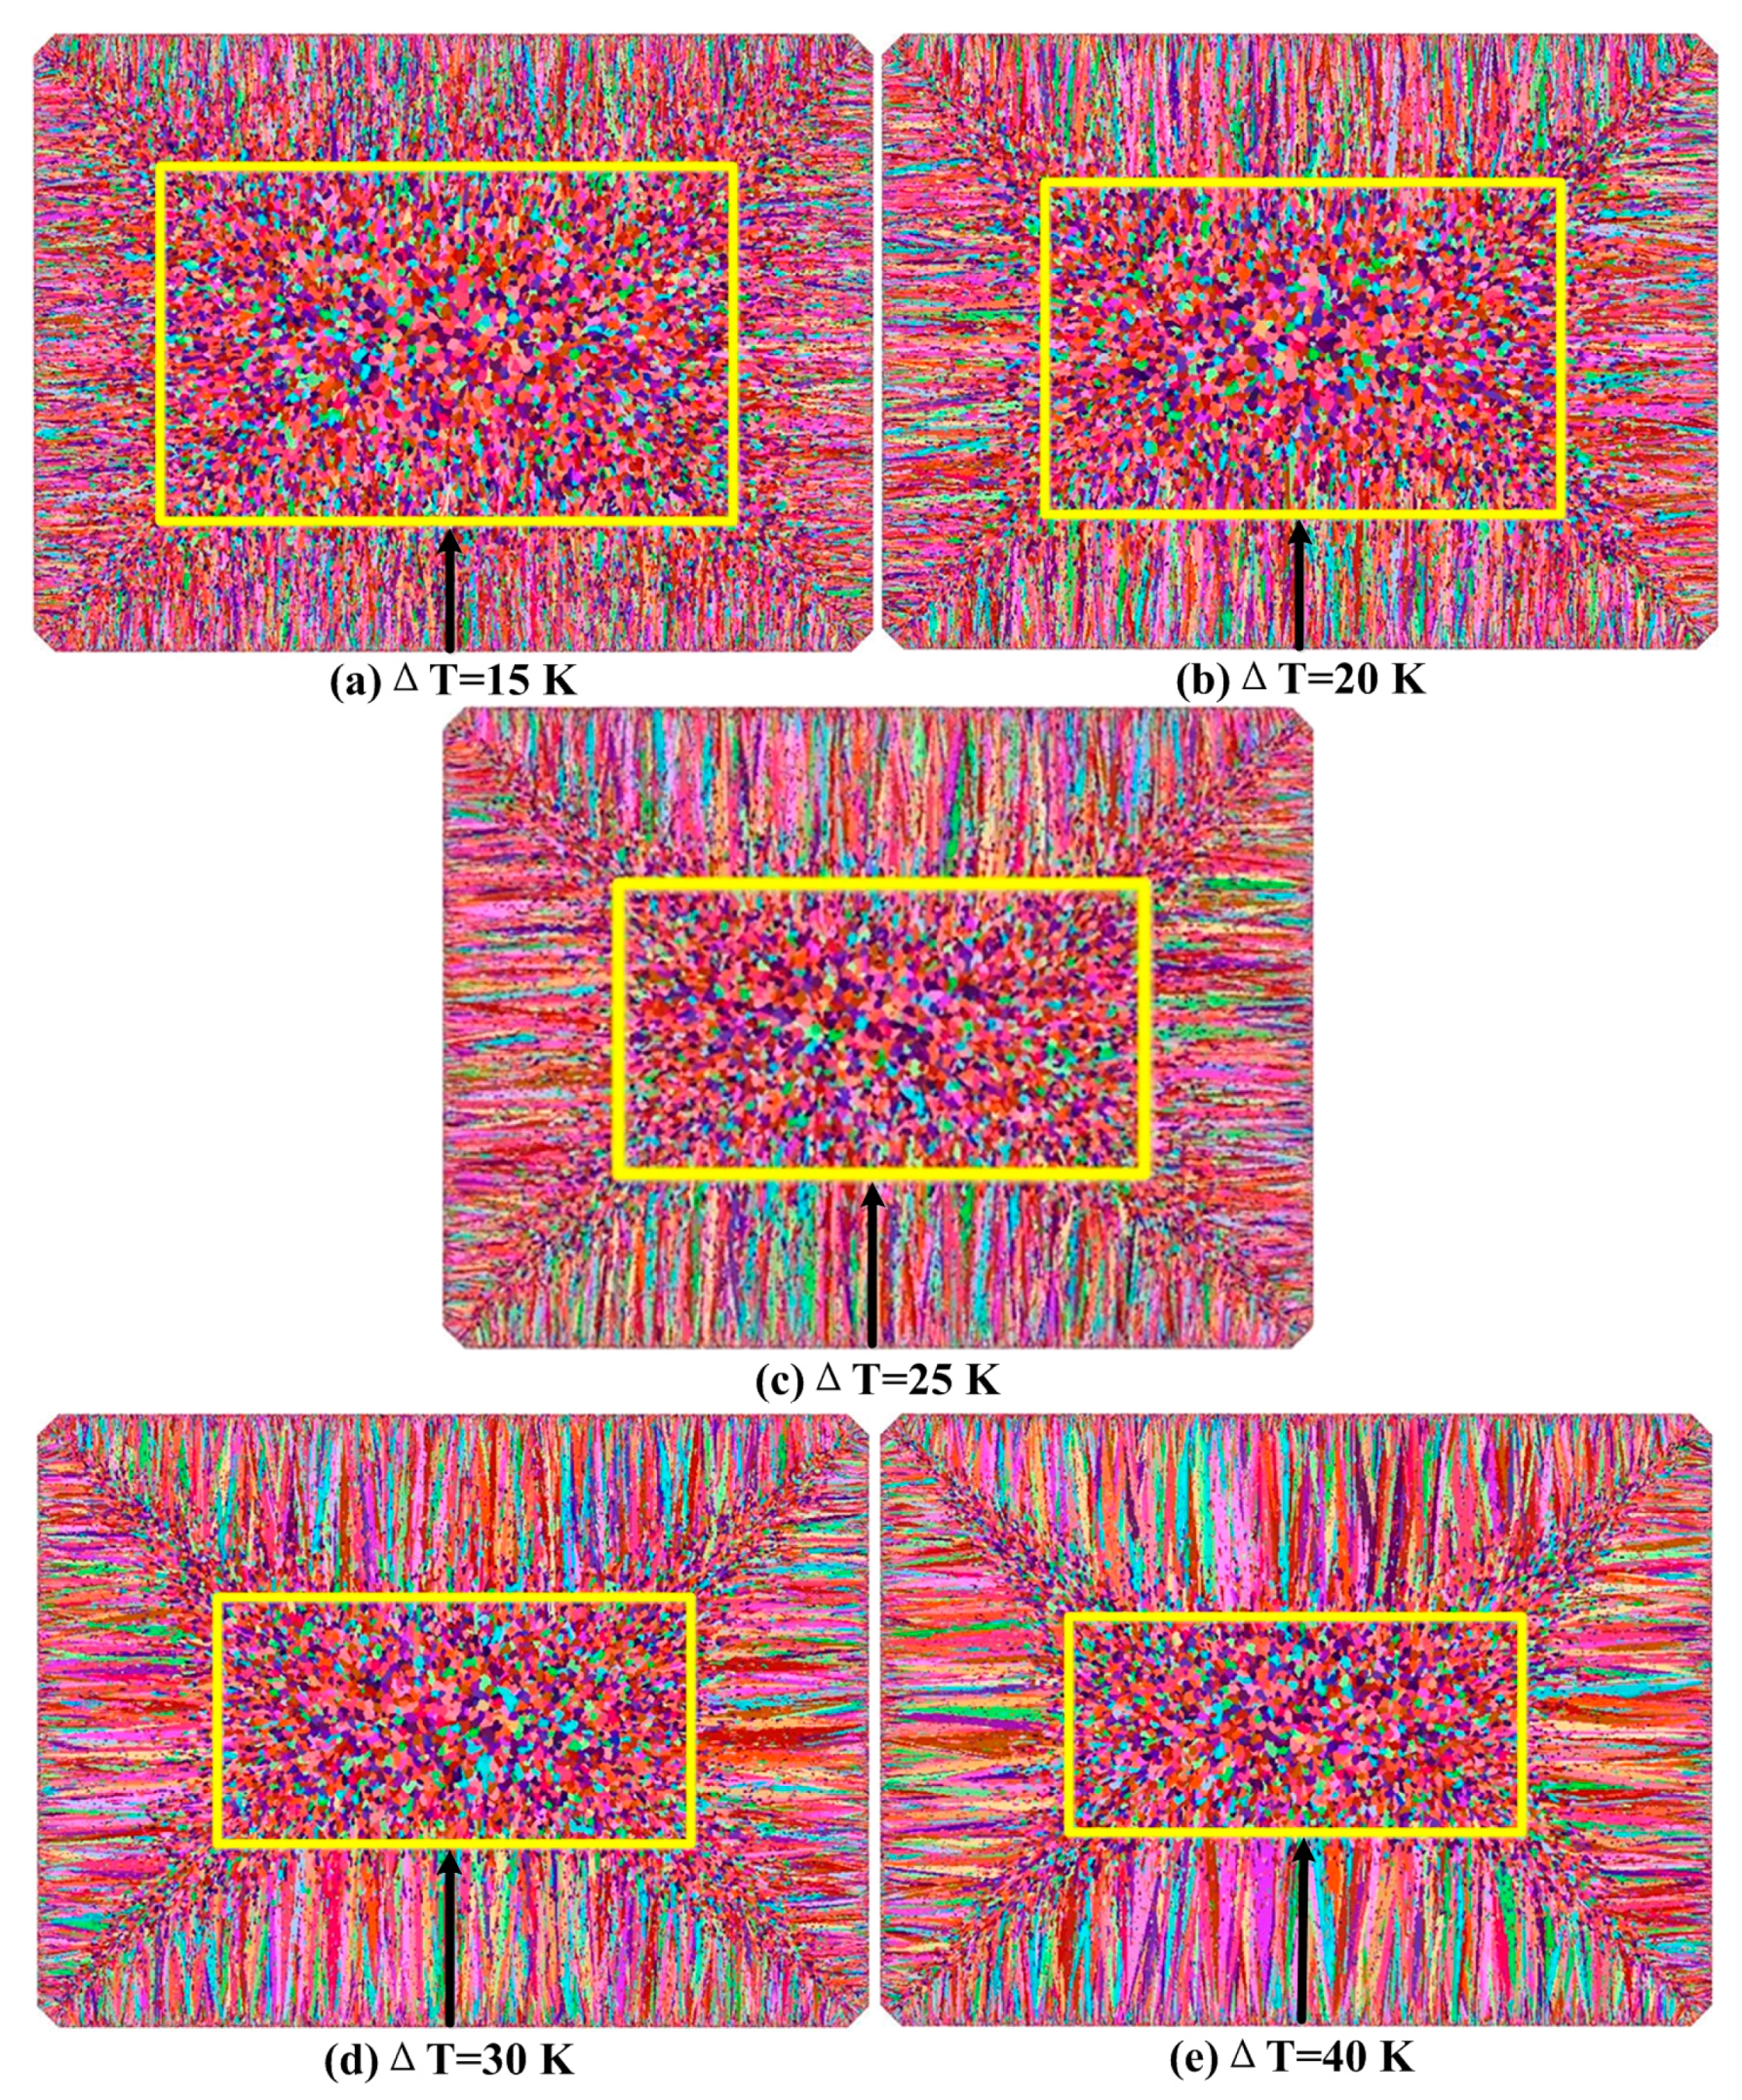
Figure 10 presents the simulated solidification structure in the bloom under different superheat. Table 6 lists the statistics results of the grain parameters and distributions in a quarter of the bloom cross-section under different superheat. It can be clearly seen that the ratio of center-equiaxed grain markedly deceases as superheat increases. Increasing superheat also causes the columnar grains to grow bigger and the coarse columnar crystal sites to become larger. The total number of grains is 17,666 when superheat is 15 K, decreasing to 14,771 when the superheat rises to 40 K. The average surface area of the grains increases from 1.503 × 10⁻⁶ m2 when the superheat is 15 K to 1.797 × 10⁻⁶ m2 when the superheat is 40 K. The average radius of grain increases from 1.025 to 1.128 mm at the same time. The grain number per meter and per square meter decreases as the superheat increases, and the ratio of center-equiaxed grains markedly changes. The percentages of center-equiaxed grain under different superheat are 44.6% for 15 K, 33.8% for 20 K, 28.7% for 25 K, 24.5% for 30 K and 20.1% for 40 K. The difference in the grain parameters and distributions between 15 K and 20 K is very small: the average radius only increases by about 0.011 mm. The difference in grain size between 20 K and 25 K is relatively bigger. In particular, the average radius increases by about 0.052 mm. The size of both columnar and equiaxed grains remains at a relative low level, and the ratio of center-equiaxed crystal is high, when the superheat is within 20 K. Whereas the percentage of equiaxed grains decreases, the columnar crystal grows larger, and the average grain size increase suddenly when the superheat is over 20 K. For big-bloom castings, the quality of final products will be improved if the superheat is properly decreased when the casting temperature meets the required level for a normal production process. The casting temperature should not be either too low or too high: low superheat can easily cause nozzle clogging during the pouring process and high superheat will lead to a low percentage of center-equiaxed grain, serious center porosity and macrosegregation. Usually, the casting superheat for high-carbon steel is controlled within 25–30 K in many steelmaking plants. However, it can be reduced to within 20 K with the application of either tundish heating or insulation technologies during the pouring process. In this case, the percentage of center-equiaxed grain can be controlled by more than 33.8%, and average grain radius is smaller than 1.04 mm when the casting superheat is within 20 K.
5. Conclusions
The solidification behavior and structure of the continuous casting process under different secondary cooling conditions and superheat were discussed and compared in this paper, and both nail-shooting and macro etch experiments were conducted to validate the numerical results of solidification behavior and structure, respectively. The conclusions are summarized as follows:
- (1)
- The simulated results of the solidified shell, solidification structure distributions and equiaxed grain size are basically consistent with the nail shooting, macro etch experiments and OM observations; errors in the shell thickness are controlled within 4%.
- (2)
- Compared to the slow cooling condition, the solidification end of the bloom is 2.46 m longer and the length of the bloom center mushy zone increases by about 1.46 m under the super-slow cooling condition. However, the bloom surface and corner temperatures are higher, and the degree of temperature rise when entering air-cooling zone is much smaller. Furthermore, the solidification structure shows little change under these two secondary cooling conditions.
- (3)
- As the superheat increases, the average grain size increases, while there is an apparent decrease in the percentage of center-equiaxed grains. When the superheat increases from 15 to 40 K, the center-equiaxed grain ratio decreases from 44.6% to 20.1% and the grain average radius increases from 1.025 to 1.128 mm. The difference in grain size between 15 and 20 K is tiny. A step size increase in the superheat of 5 K causes an increase of only about 0.19 m in the solidification end length, and an increase of 3 K in the surface temperature. The super heat should be controlled within 20 K.
Acknowledgments
The authors would like to express their gratitude for the financial support by the National Natural Science Foundation of China No. 51471122, 51604200 and 51774217, and the Key Program of Natural Science Foundation of Hubei Province of China No. 2015CFA128.
Author Contributions
Hongwei Ni and Hua Zhang conceived and designed the study. Qing Fang performed the experiments and simulations. Bao Wang and Chengsong Liu contributed to the result analysis and paper preparation. Qing Fang wrote the manuscript.
Conflicts of Interest
The authors declare no conflict of interest.
References
- Yamazaki, M.; Natsume, Y.; Harada, H.; Ohsasa, K. Numerical simulation of solidification structure formation during continuous casting in Fe-0.7 Mass% C alloy using cellular automaton method. ISIJ Int. 2006, 46, 903–908. [Google Scholar] [CrossRef]
- Straffelini, G.; Lutterotti, L.; Tonolli, M.; Lestani, M. Modeling solidification structures of steel round billets obtained by continuous casting. ISIJ Int. 2011, 51, 1448–1453. [Google Scholar] [CrossRef]
- Anand, G.; Datta, S.; Chattopadhyay, P.P. Deterministic approach for microstructurally engineered formable steel. Int. J. Metall. Eng. 2013, 2, 69–78. [Google Scholar]
- Nastac, L. A 3D stochastic mesoscopic model for prediction of, structure evolution during solidification of dendritic alloys. Metall. Res. Technol. 2014, 111, 311–319. [Google Scholar] [CrossRef]
- Rezende, J.; Senk, D.; Hüttenmeister, D. Phase-field modeling of the dendrite growth morphology with influence of solid-liquid interface effects. Steel Res. Int. 2015, 86, 65–72. [Google Scholar] [CrossRef]
- Rappaz, M.; Gandin, C.A. Probabilistic modelling of structure formation in solidification processes. Acta Mater. 1993, 41, 345–360. [Google Scholar] [CrossRef]
- Gandin, C.A.; Desbiolles, J.L.; Rappaz, M.; Thevoz, P. A three-dimensional cellular automation-finite element model for the prediction of solidification grain structures. Metall. Mater. Trans. A 1999, 30, 3153–3165. [Google Scholar] [CrossRef]
- Zhu, H.; Jiang, Z.; Li, H.; Zhu, J.; Feng, H.; Zhang, S.; Zhang, B.; Wang, P.; Liu, G. Effect of solidification pressure on compactness degree of 19Cr14Mn0.9N high nitrogen steel using CAFE method. Steel Res. Int. 2017, 88, 1600509, in press. [Google Scholar] [CrossRef]
- Zhang, H.; Zhang, L. Modeling on the solidification structure of Fe-Ni-based alloys using cellular automaton method. Metall. Res. Technol. 2016, 113, 410. [Google Scholar] [CrossRef]
- Song, W.; Zhang, J.; Wang, S.; Wang, B.; Han, L. Simulation of solidification structure of Fe-6.5% Si alloy using cellular automaton-finite element method. J. Cent. South Univ. 2016, 23, 2156–2164. [Google Scholar] [CrossRef]
- Luo, Y.Z.; Zhang, J.M.; Wei, X.D.; Xiao, C.; Hu, Z.F.; Yuan, Y.Y.; Chen, S.D. Numerical simulation of solidification structure of high carbon SWRH77B billet based on the CAFE method. Ironmak. Steelmak. 2013, 39, 26–30. [Google Scholar] [CrossRef]
- Zeng, J.; Chen, W. Effect of secondary cooling conditions on solidification structure and central macrosegregation in continuously cast high-carbon rectangular billet. High Temp. Mater. Process. 2015, 34, 577–583. [Google Scholar] [CrossRef]
- Bai, L.; Wang, B.; Zhong, H.; Ni, J.; Zhai, Q.; Zhang, J. Experimental and numerical simulations of the solidification process in continuous casting of slab. Metals 2016, 6, 53. [Google Scholar] [CrossRef]
- Hou, Z.; Cheng, G.; Jiang, F.; Qian, G. Compactness degree of longitudinal section of outer columnar grain zone in continuous casting billet using cellular automaton-finite element method. ISIJ Int. 2013, 53, 655–664. [Google Scholar] [CrossRef]
- Fang, Q.; Ni, H.W.; Wang, S.J.; Zang, H. Numerical simulation on the solidification structure of Ø600 mm continuous casting round bloom. IOP Conf. Ser. Mater. Sci. Eng. 2016, 117, 012036. [Google Scholar] [CrossRef]
- Lally, B.; Biegler, L.; Henein, H. Finite difference heat transfer modeling for continuous casting. Metall. Mater. Trans. B 1990, 21, 761–770. [Google Scholar] [CrossRef]
- Gandin, C.A.; Rappaz, M. A coupled finite element-cellular automaton model for the prediction of dendritic grain structures in solidification processes. Acta Metall. Mater. 1994, 42, 2233–2246. [Google Scholar] [CrossRef]
- Kurz, W.; Giovanola, B.; Trivedi, R. Theory of microstructural development during rapid solidification. Acta Mater. 1986, 34, 823–830. [Google Scholar] [CrossRef]
- Long, M.J.; Chen, D.F.; Wang, Q.X.; Luo, D.H.; Han, Z.W.; Liu, Q.; Gao, W.X. Determination of CC slab solidification using nail shooting technique. Ironmak. Steelmak. 2012, 39, 370–377. [Google Scholar] [CrossRef]
- Qu, T.; Wang, S.; Feng, K. Numerical simulation on solidification structure of bloom during continuously casting process. Contin. Cast. 2013, 1, 7–11. (In Chinese) [Google Scholar]
Figure 1.
Exhibition of meshed slice model.

Figure 2.
Variations of the thermo-physical parameters with temperature of U71Mn steel: (a) density; (b) enthalpy; (c) solid fraction; (d) thermal conductivity.
Figure 2.
Variations of the thermo-physical parameters with temperature of U71Mn steel: (a) density; (b) enthalpy; (c) solid fraction; (d) thermal conductivity.
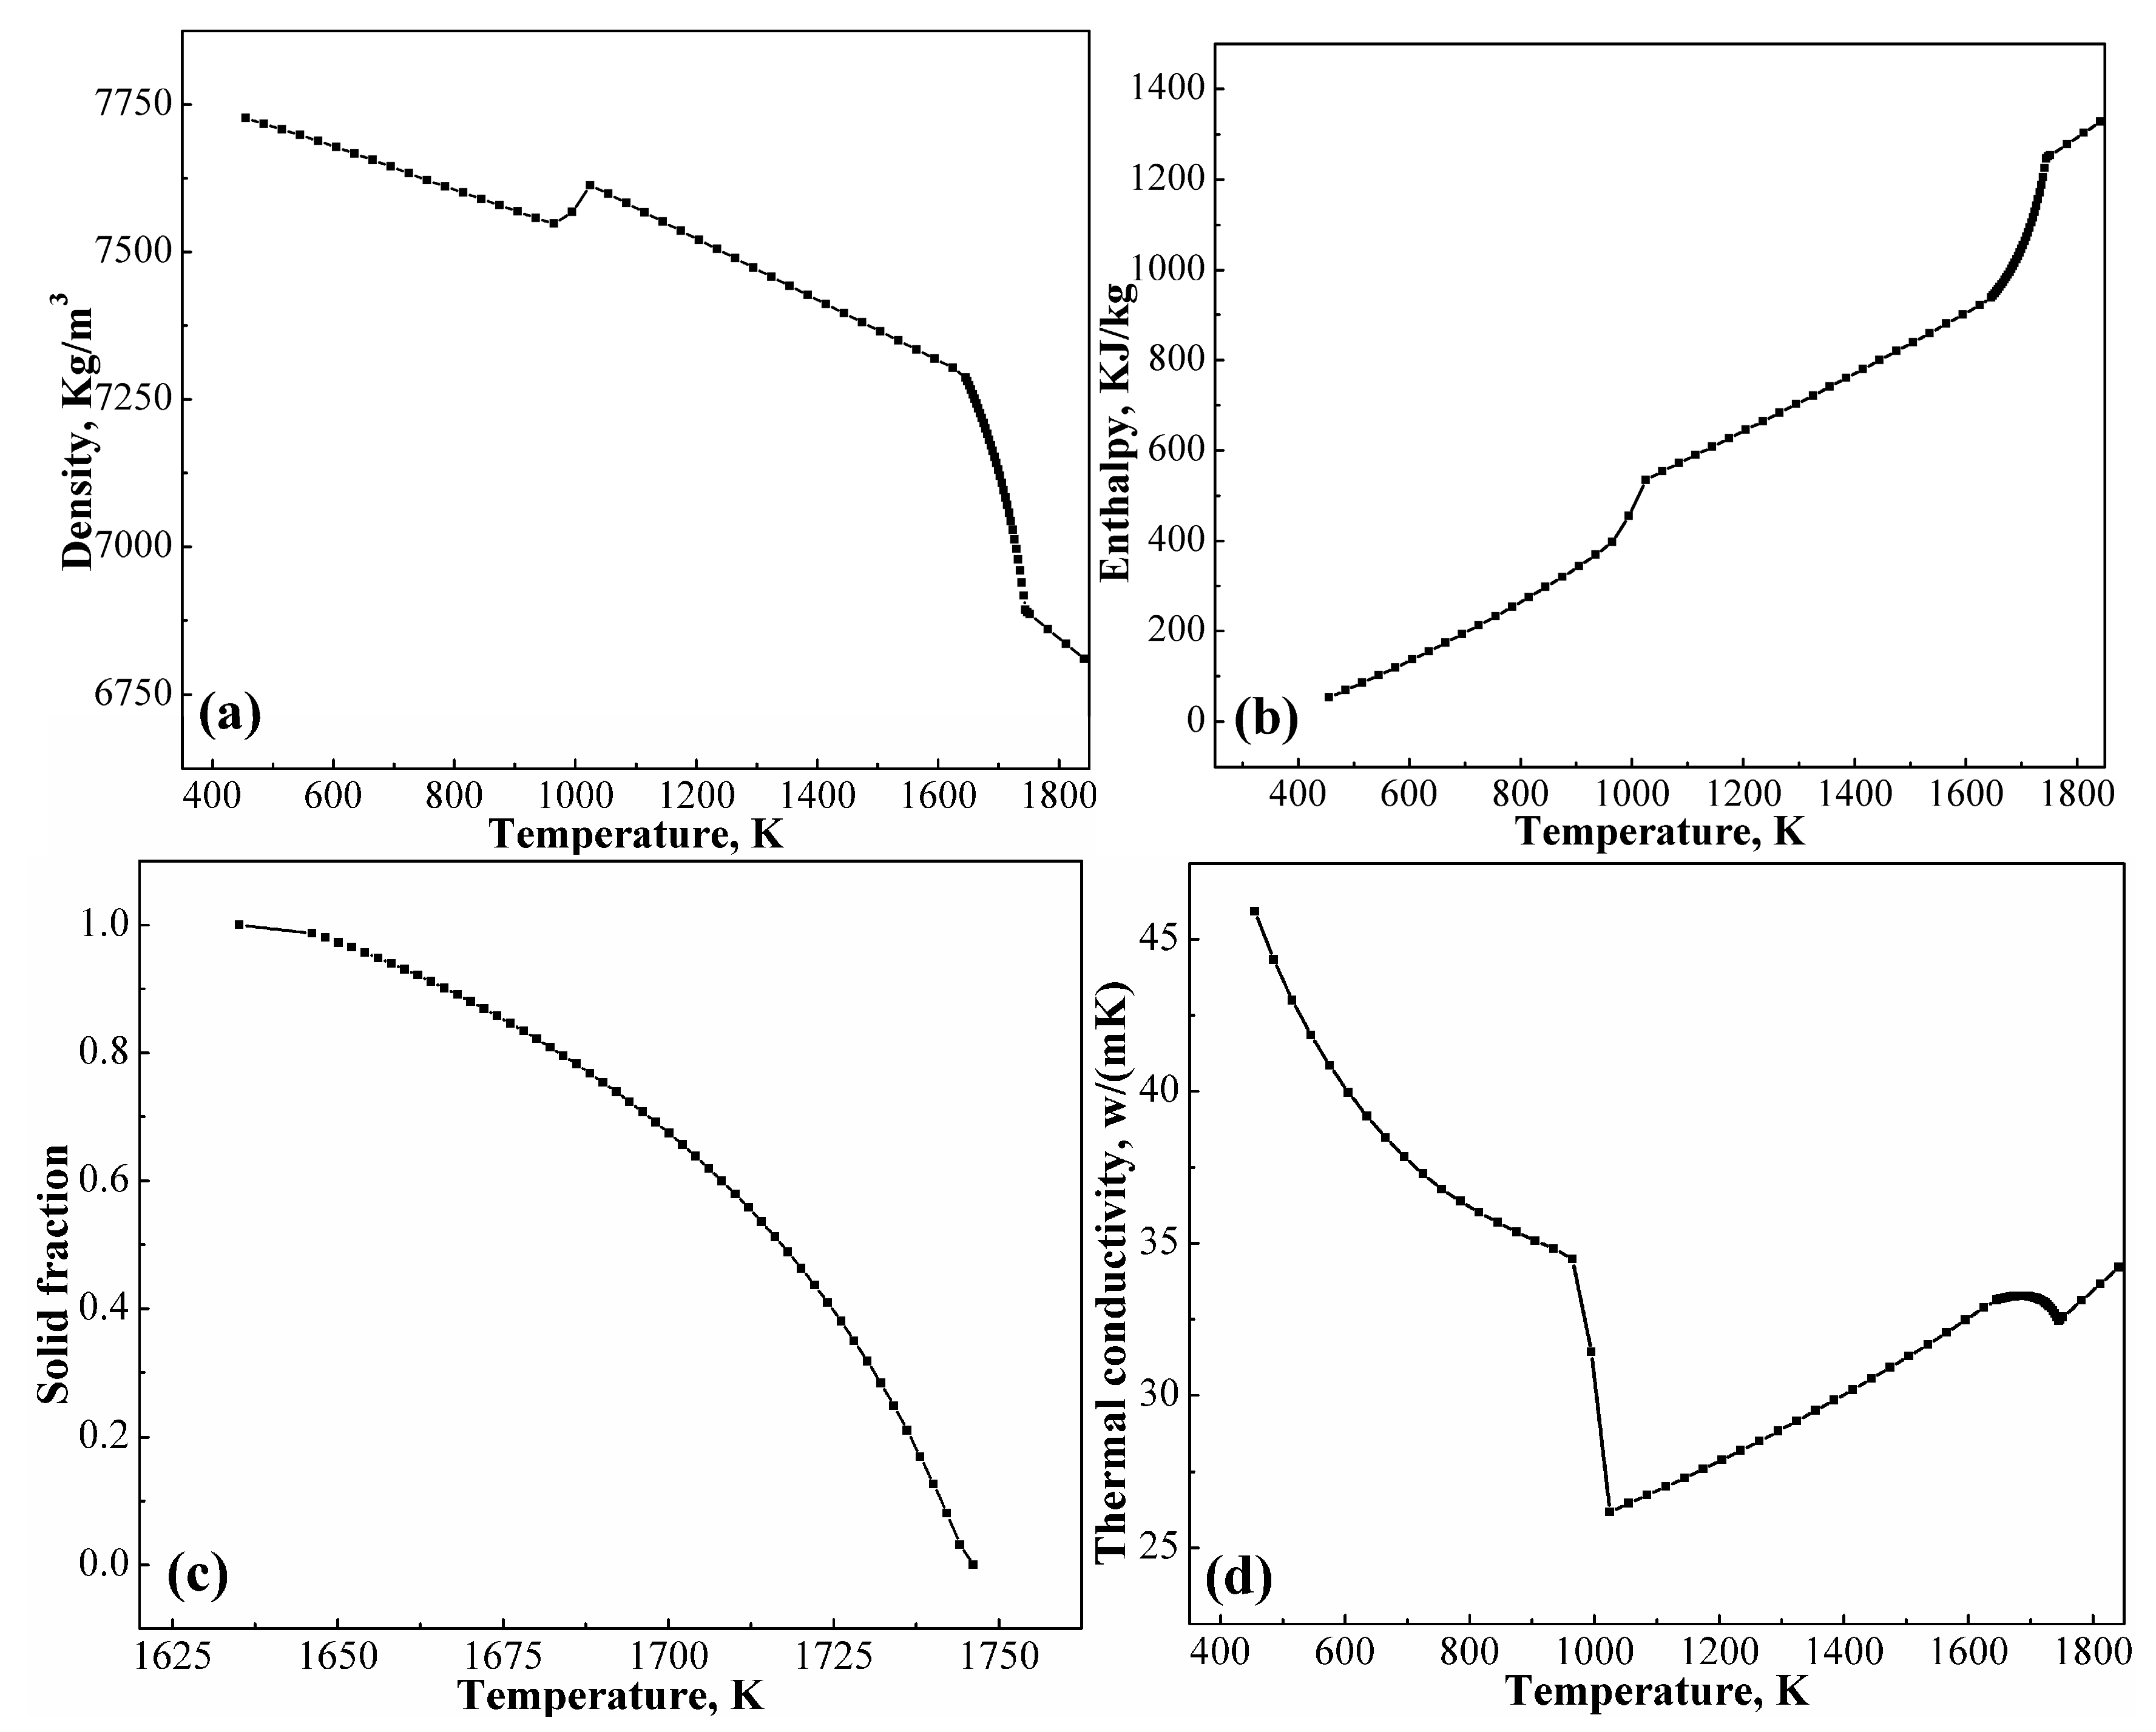
Figure 3.
Photographs of sulfur printing samples for nail shooting experiments: (a) SSC (Super-slow cooling); (b) SC (Slow cooling).
Figure 3.
Photographs of sulfur printing samples for nail shooting experiments: (a) SSC (Super-slow cooling); (b) SC (Slow cooling).
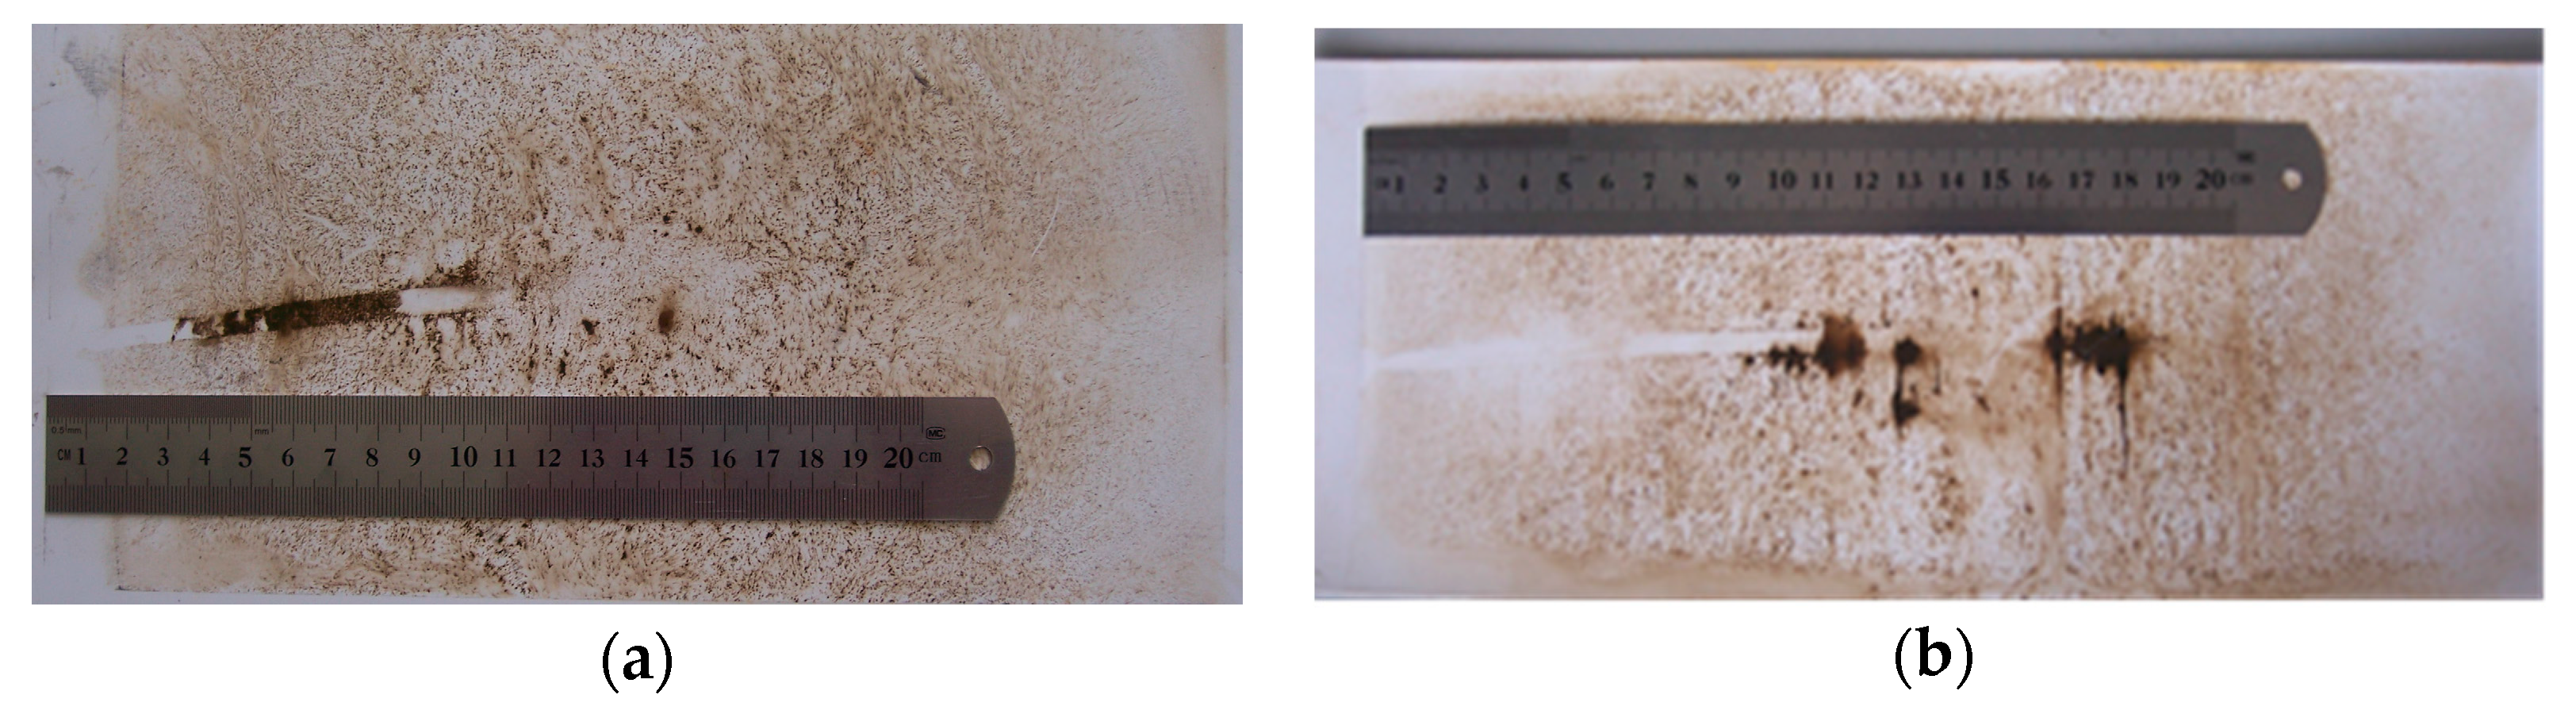
Figure 4.
Solid fraction distributions at testing positions for SSC (a) and SC (b).

Figure 5.
Comparison of numerical and experimental structure under SSC (a) and SC (b).
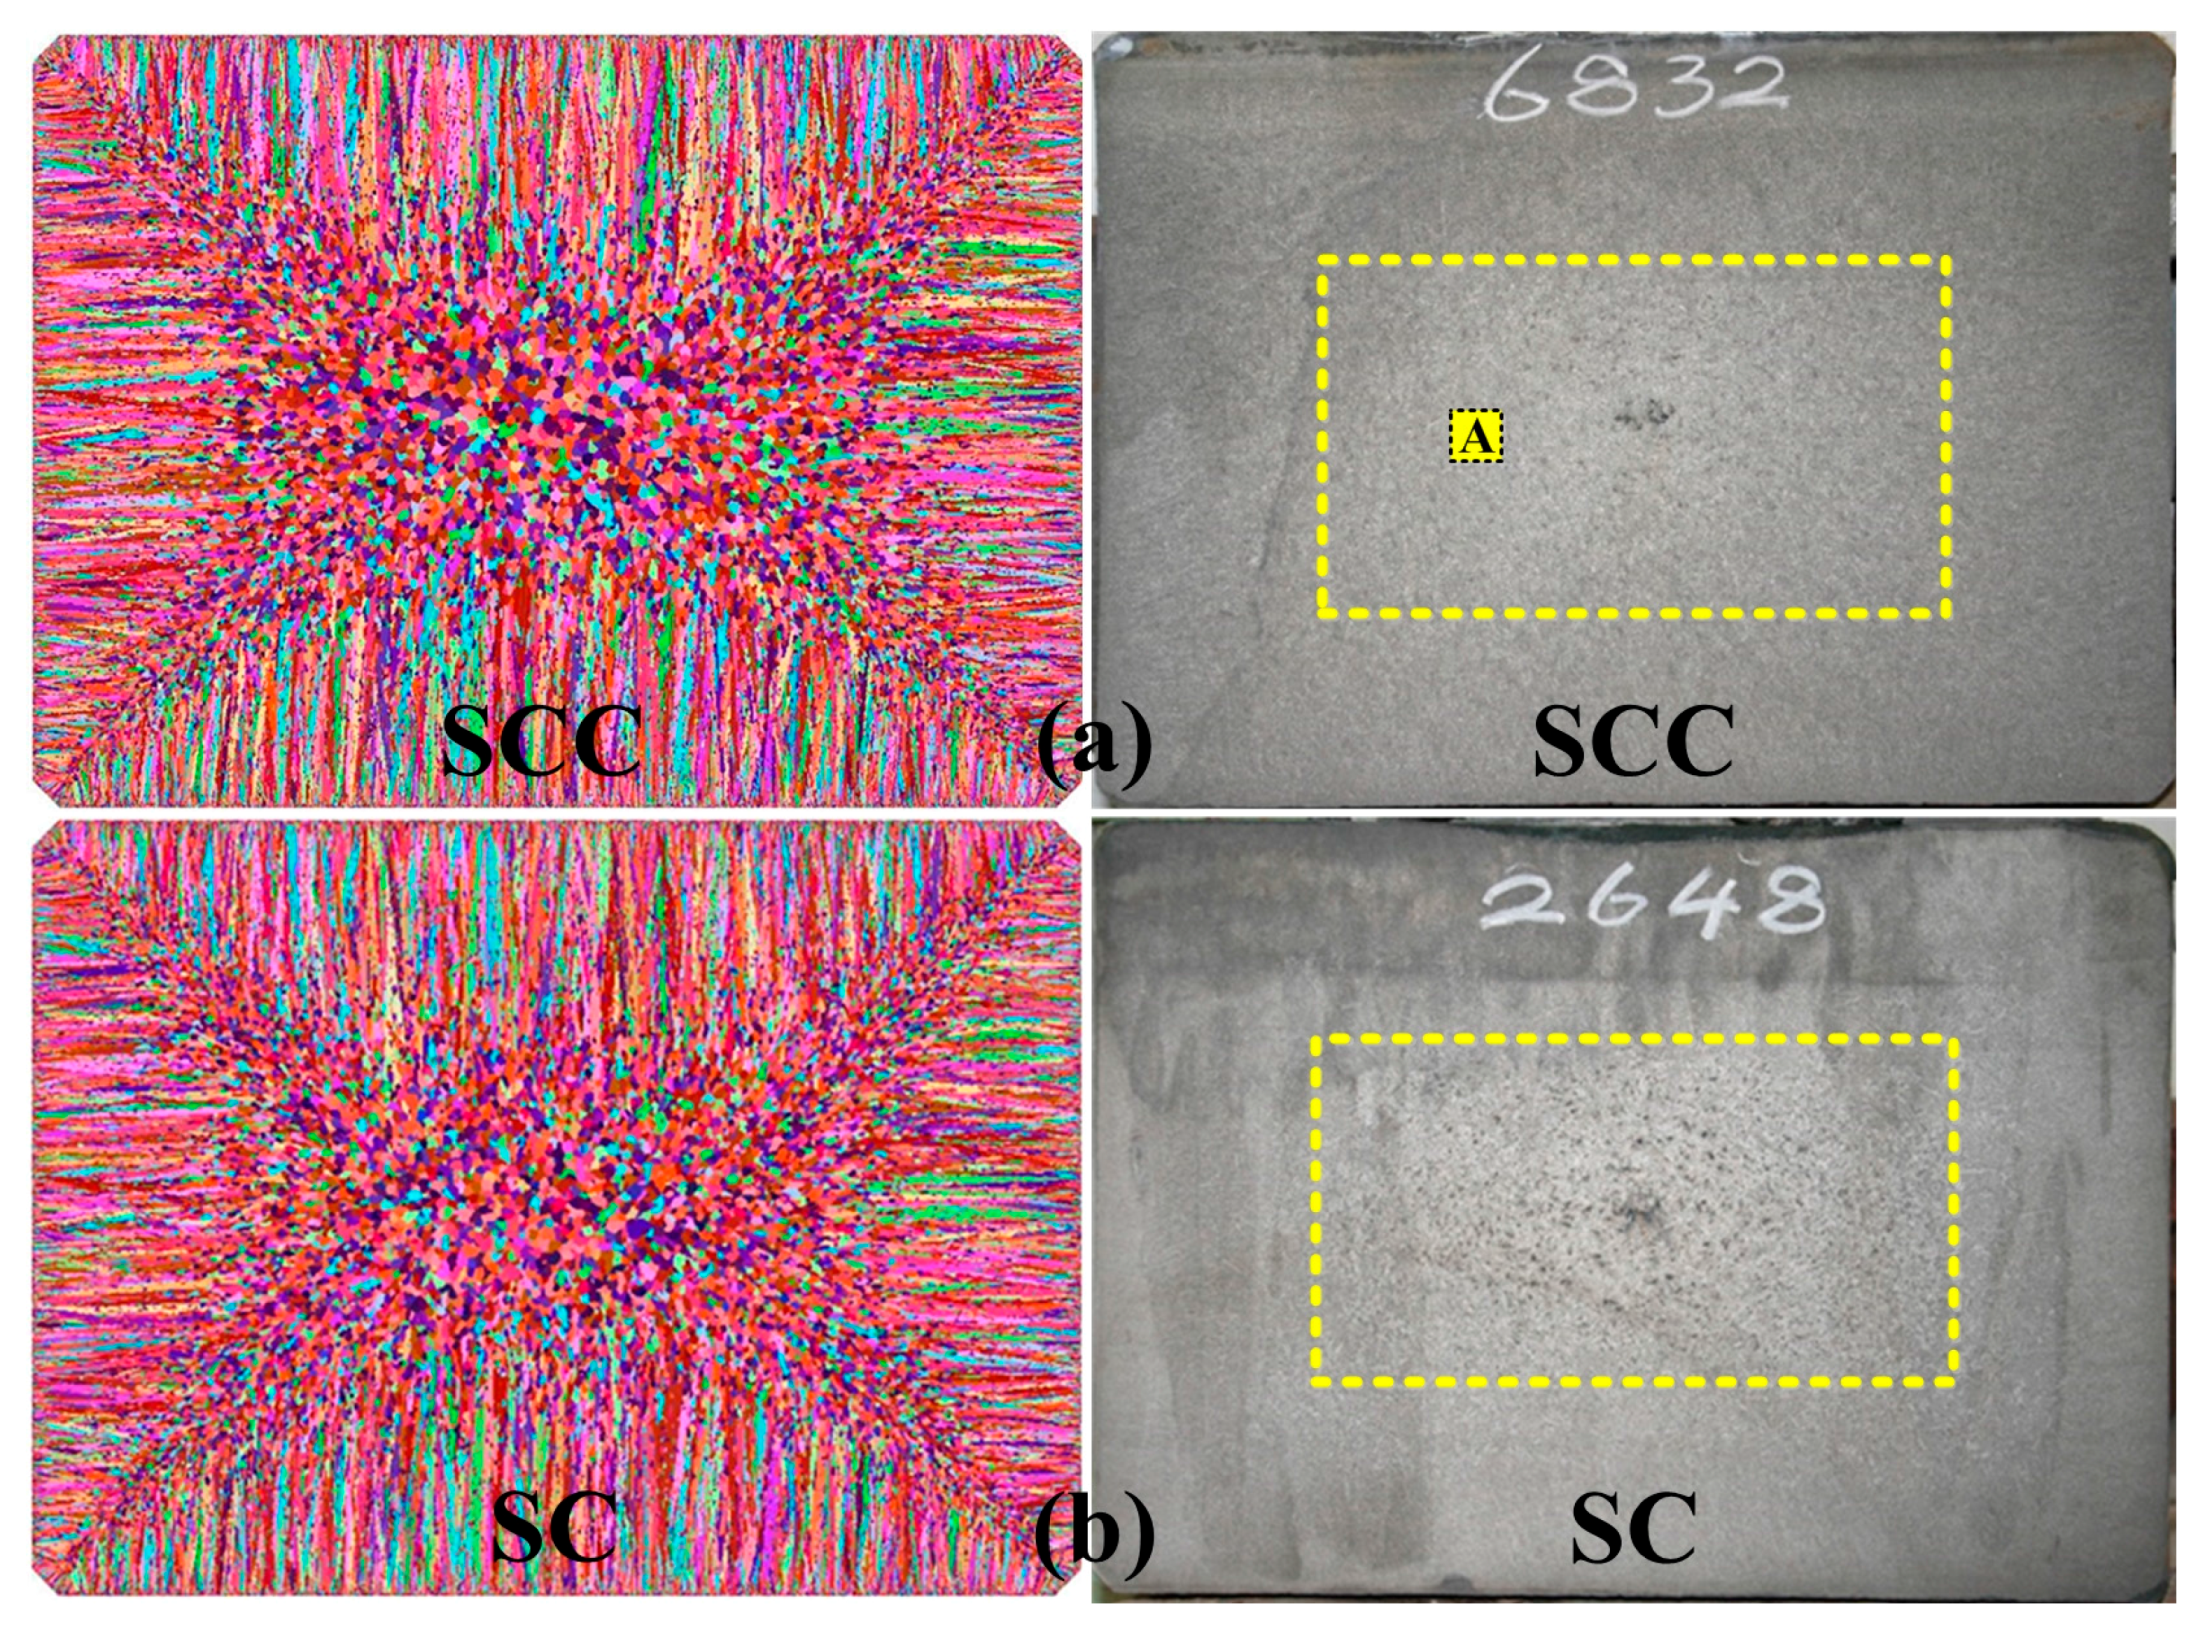
Figure 6.
Micrographs showing macrostructure of center-equiaxed grains.
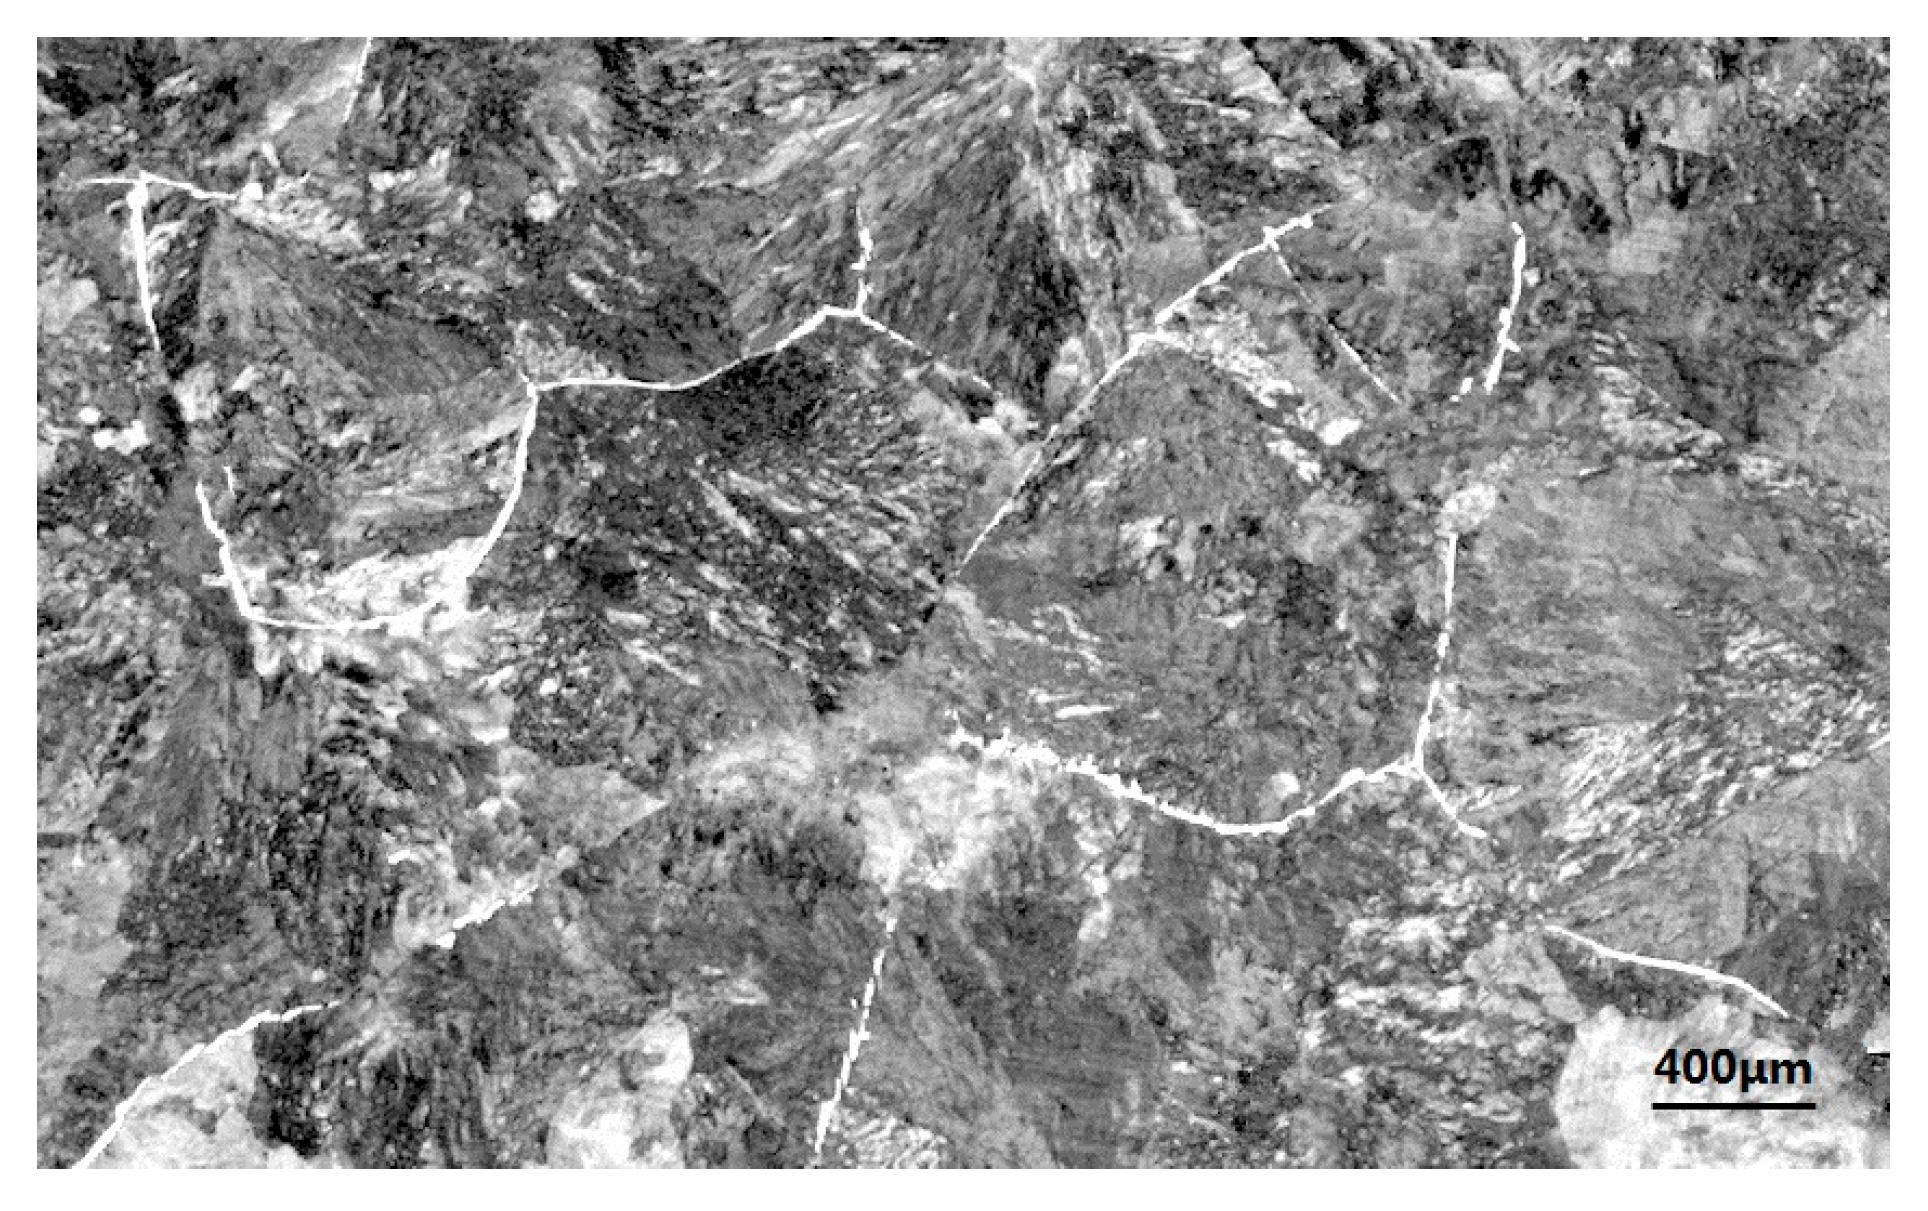
Figure 7.
Center, surface and corner temperature variations along casting direction for SSC and SC.
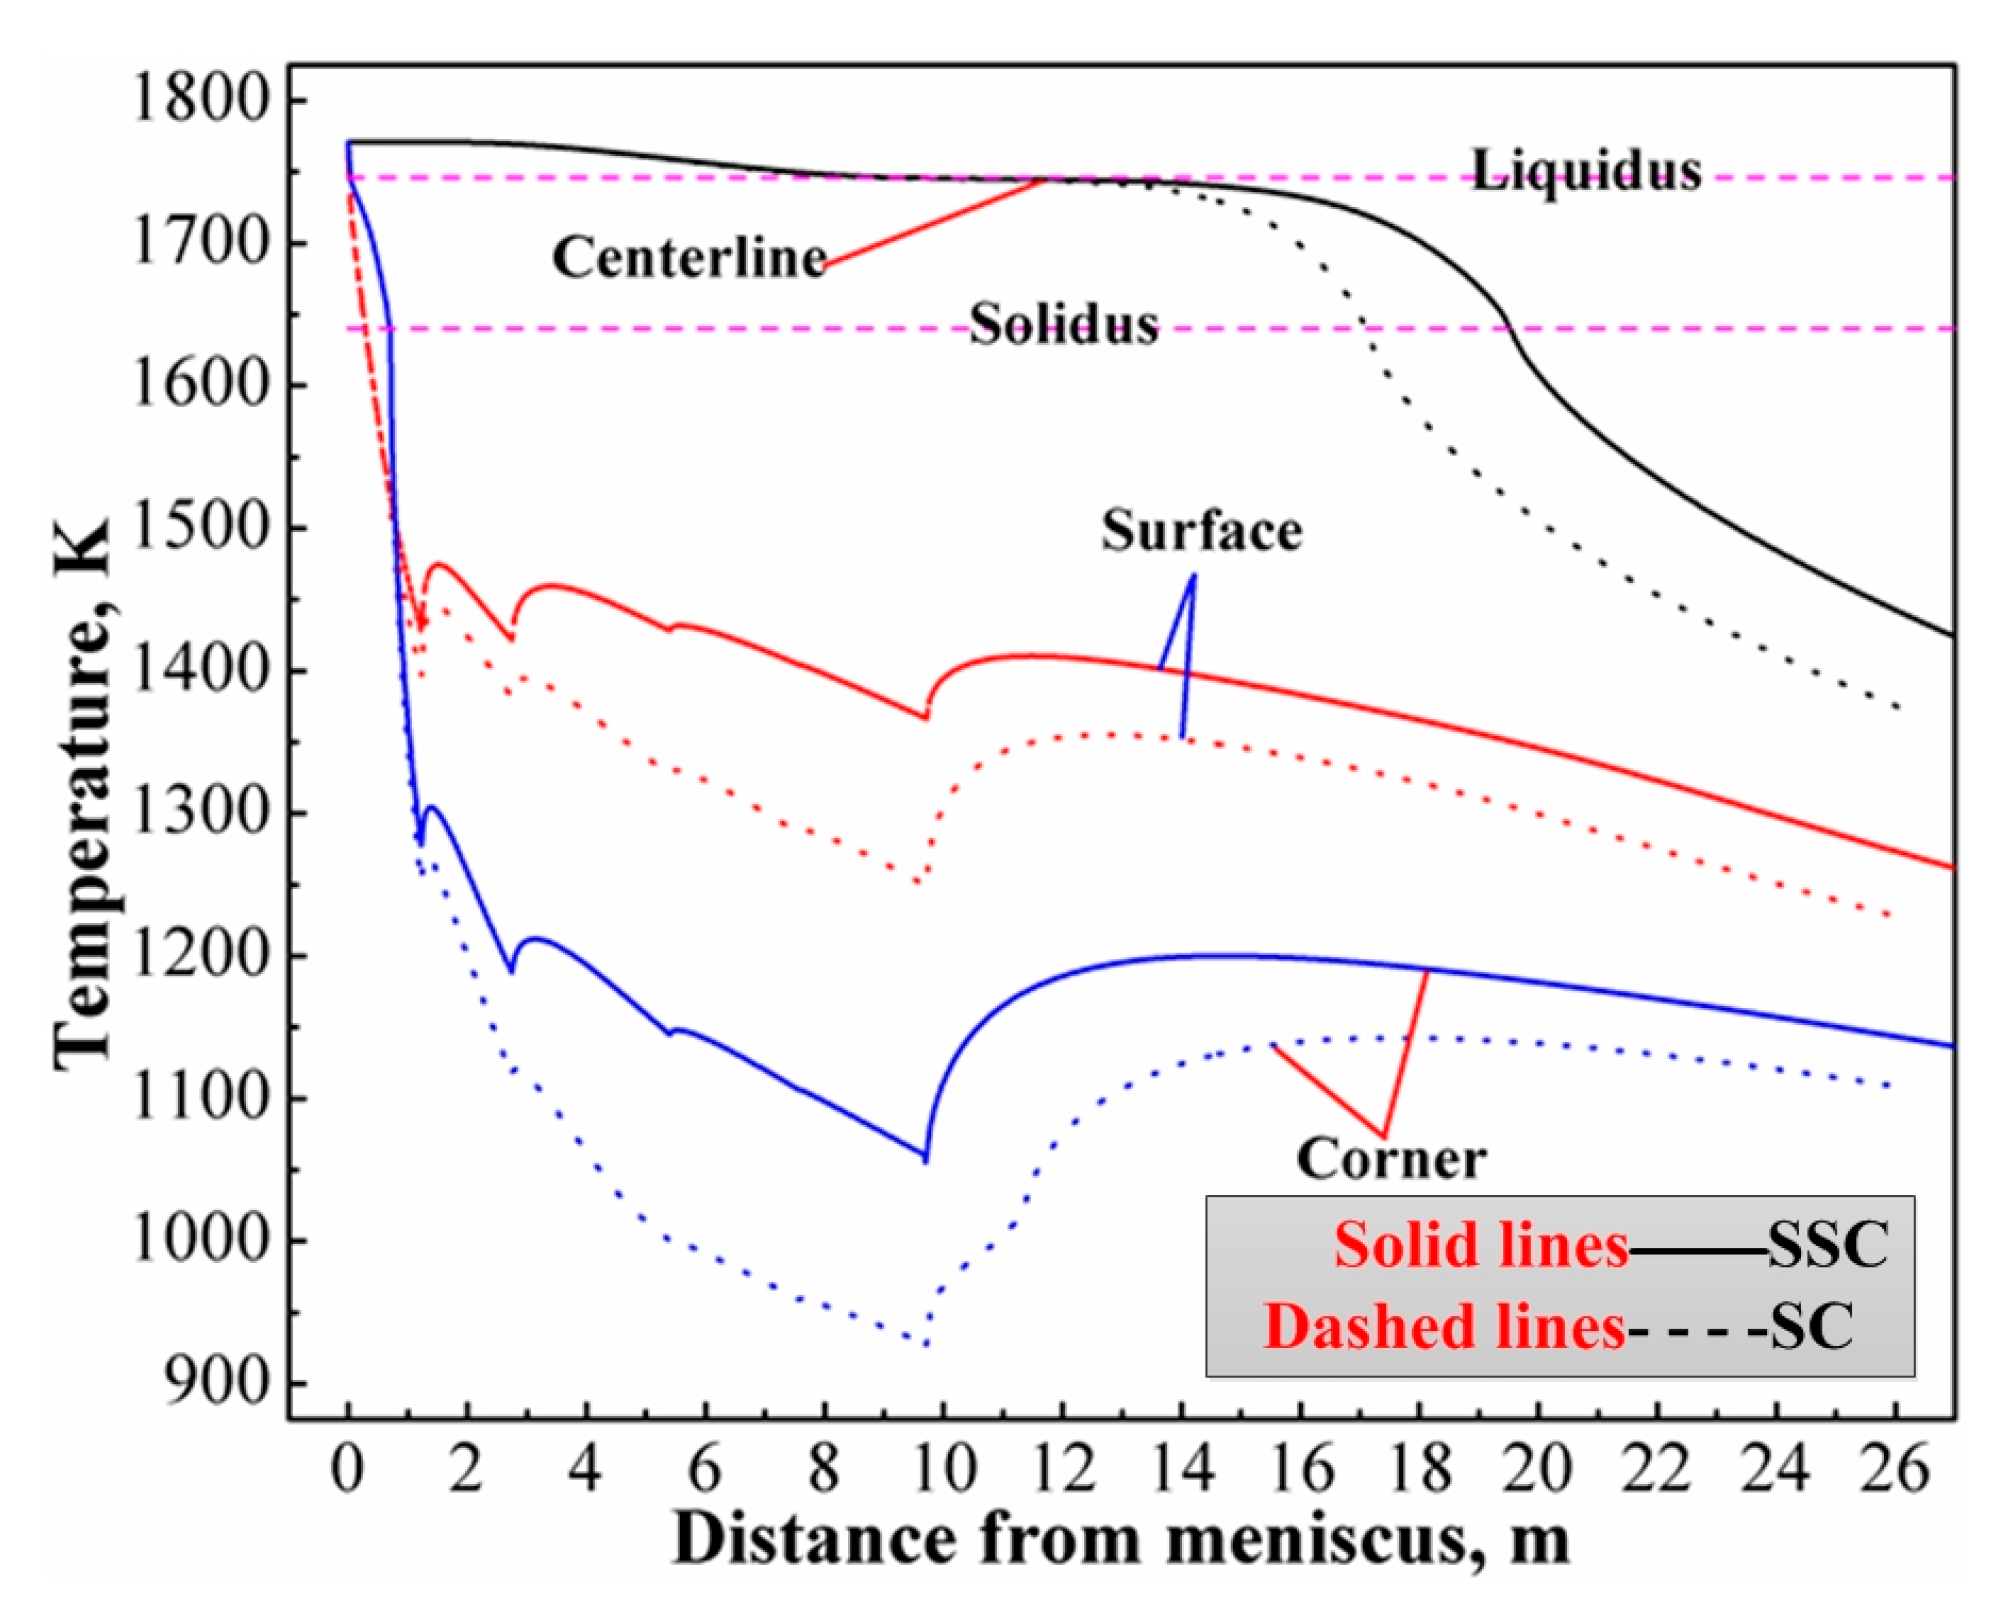
Figure 8.
Contours of solid fraction at end of secondary cooling zone under SSC (a) and SC (b).
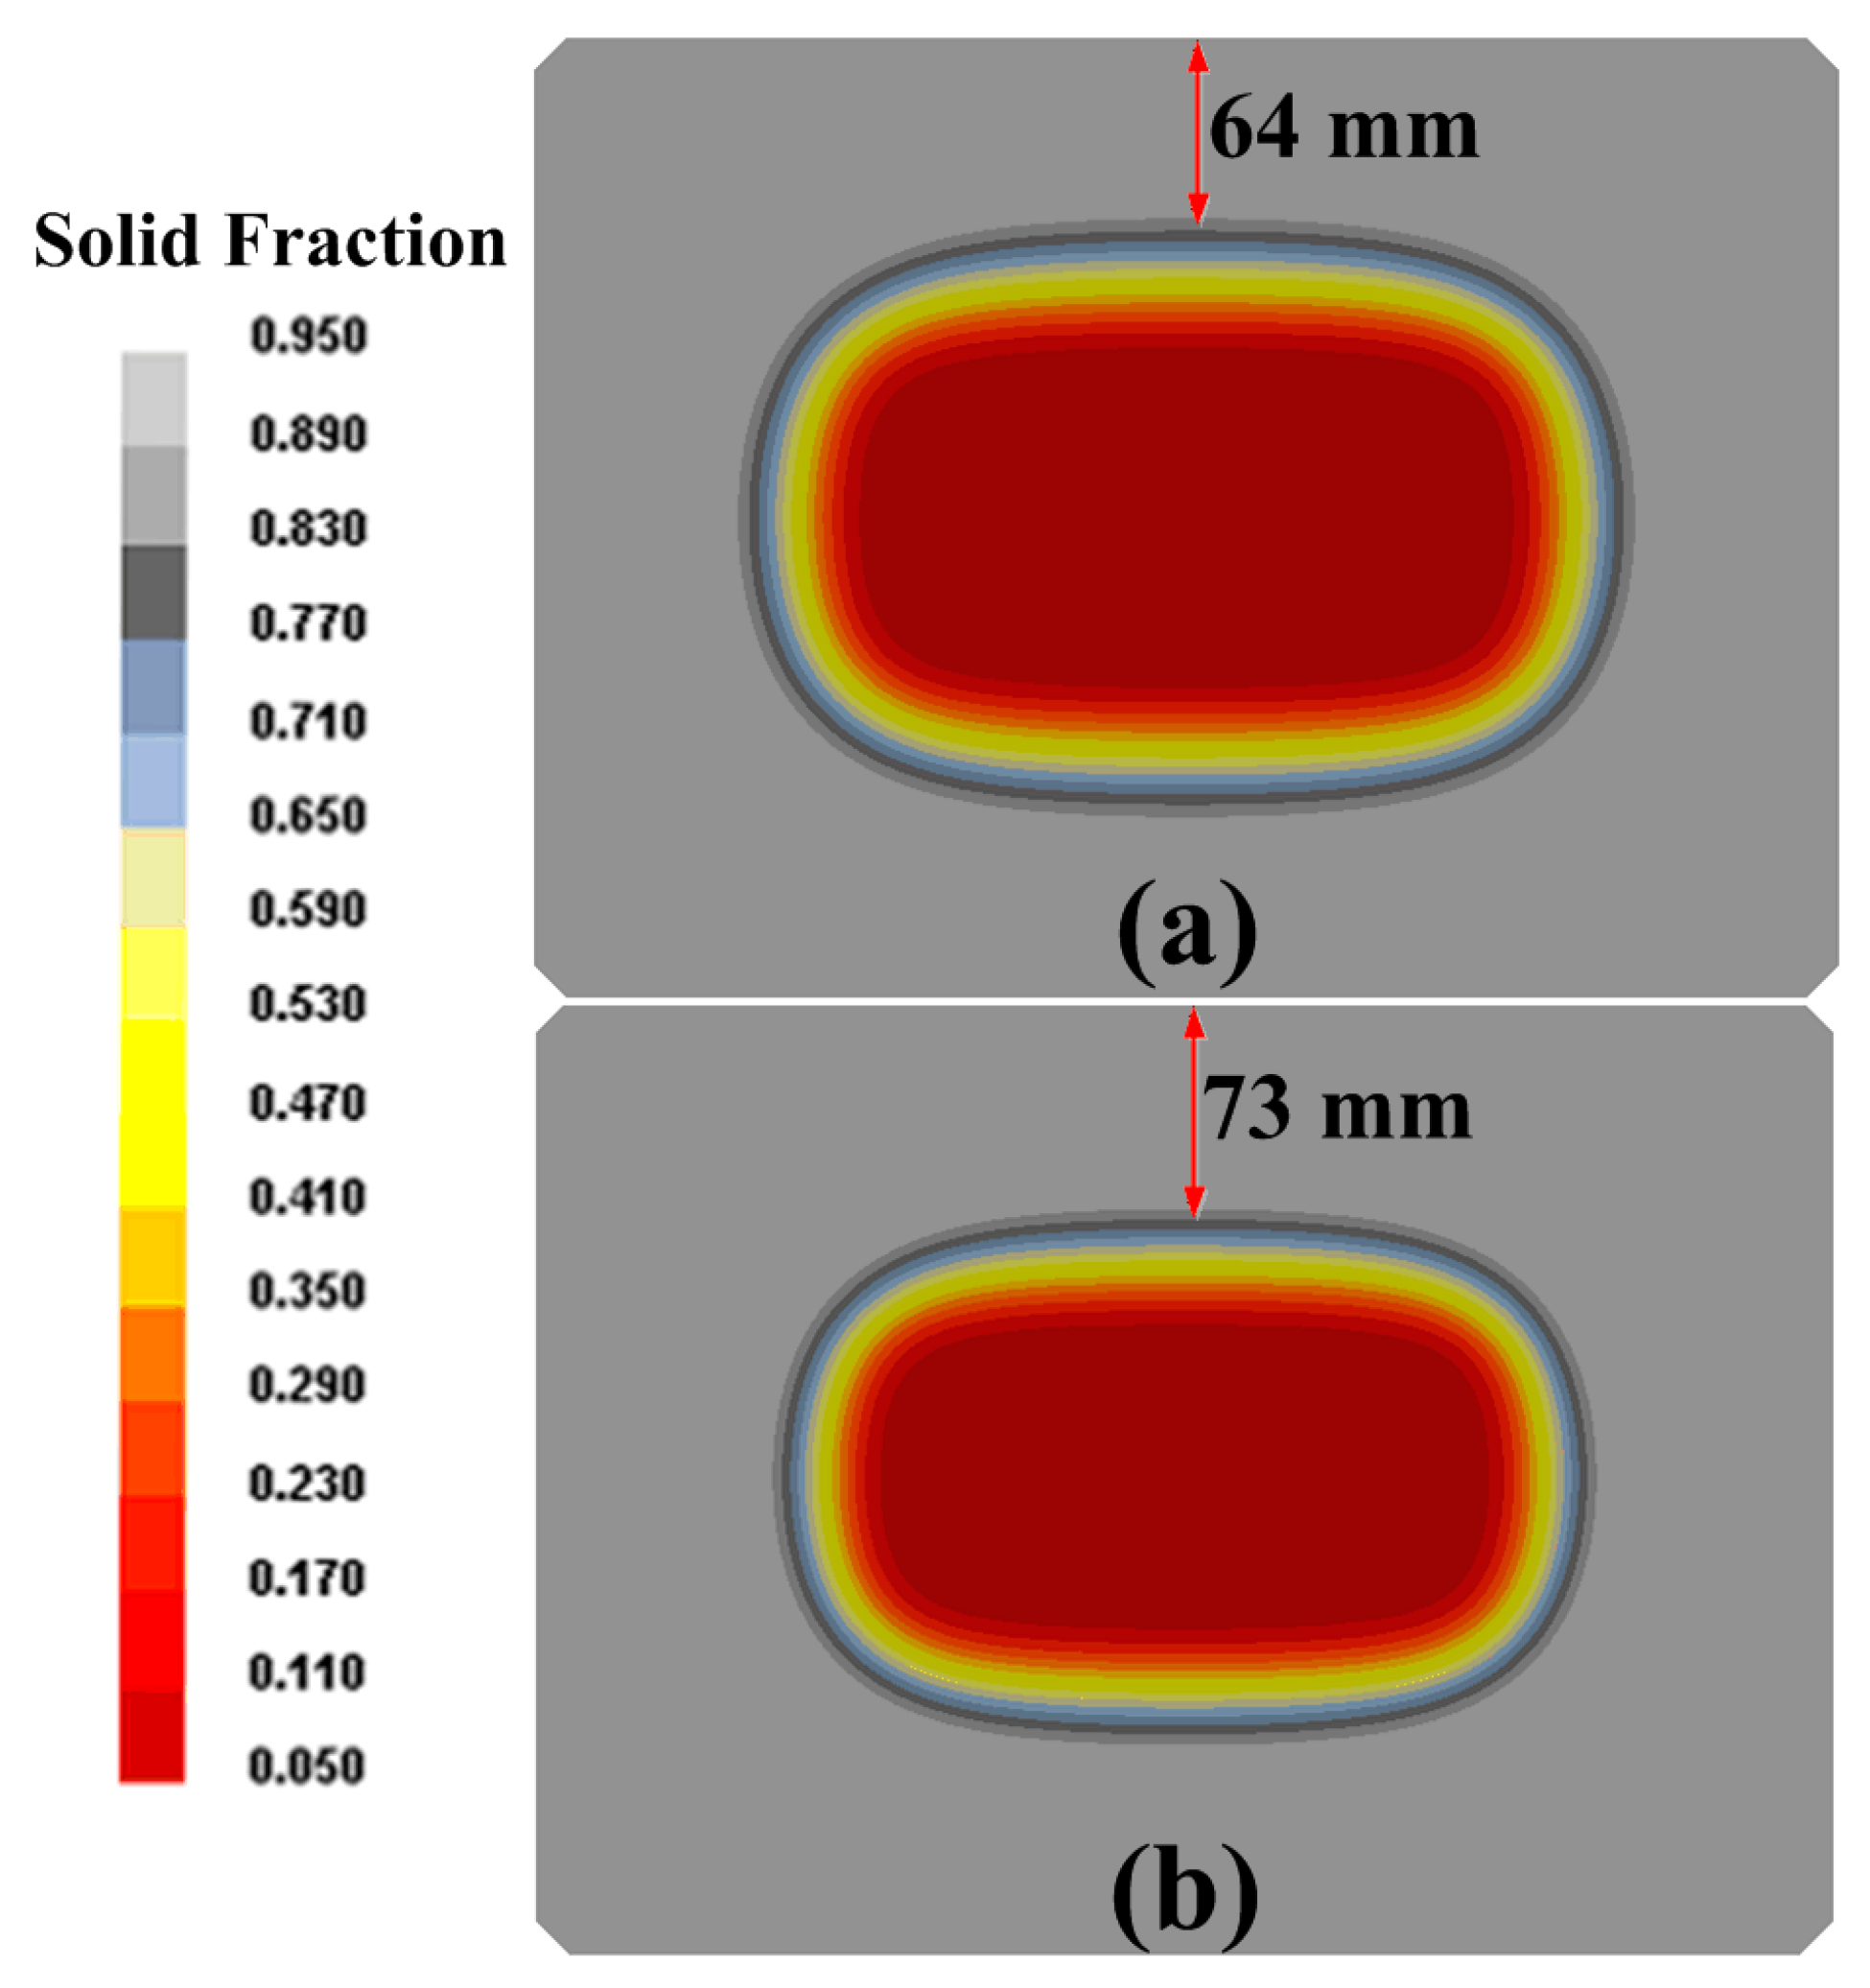
Figure 9.
Temperature variations of bloom surface and centerline along the casting direction under different superheat.
Figure 9.
Temperature variations of bloom surface and centerline along the casting direction under different superheat.
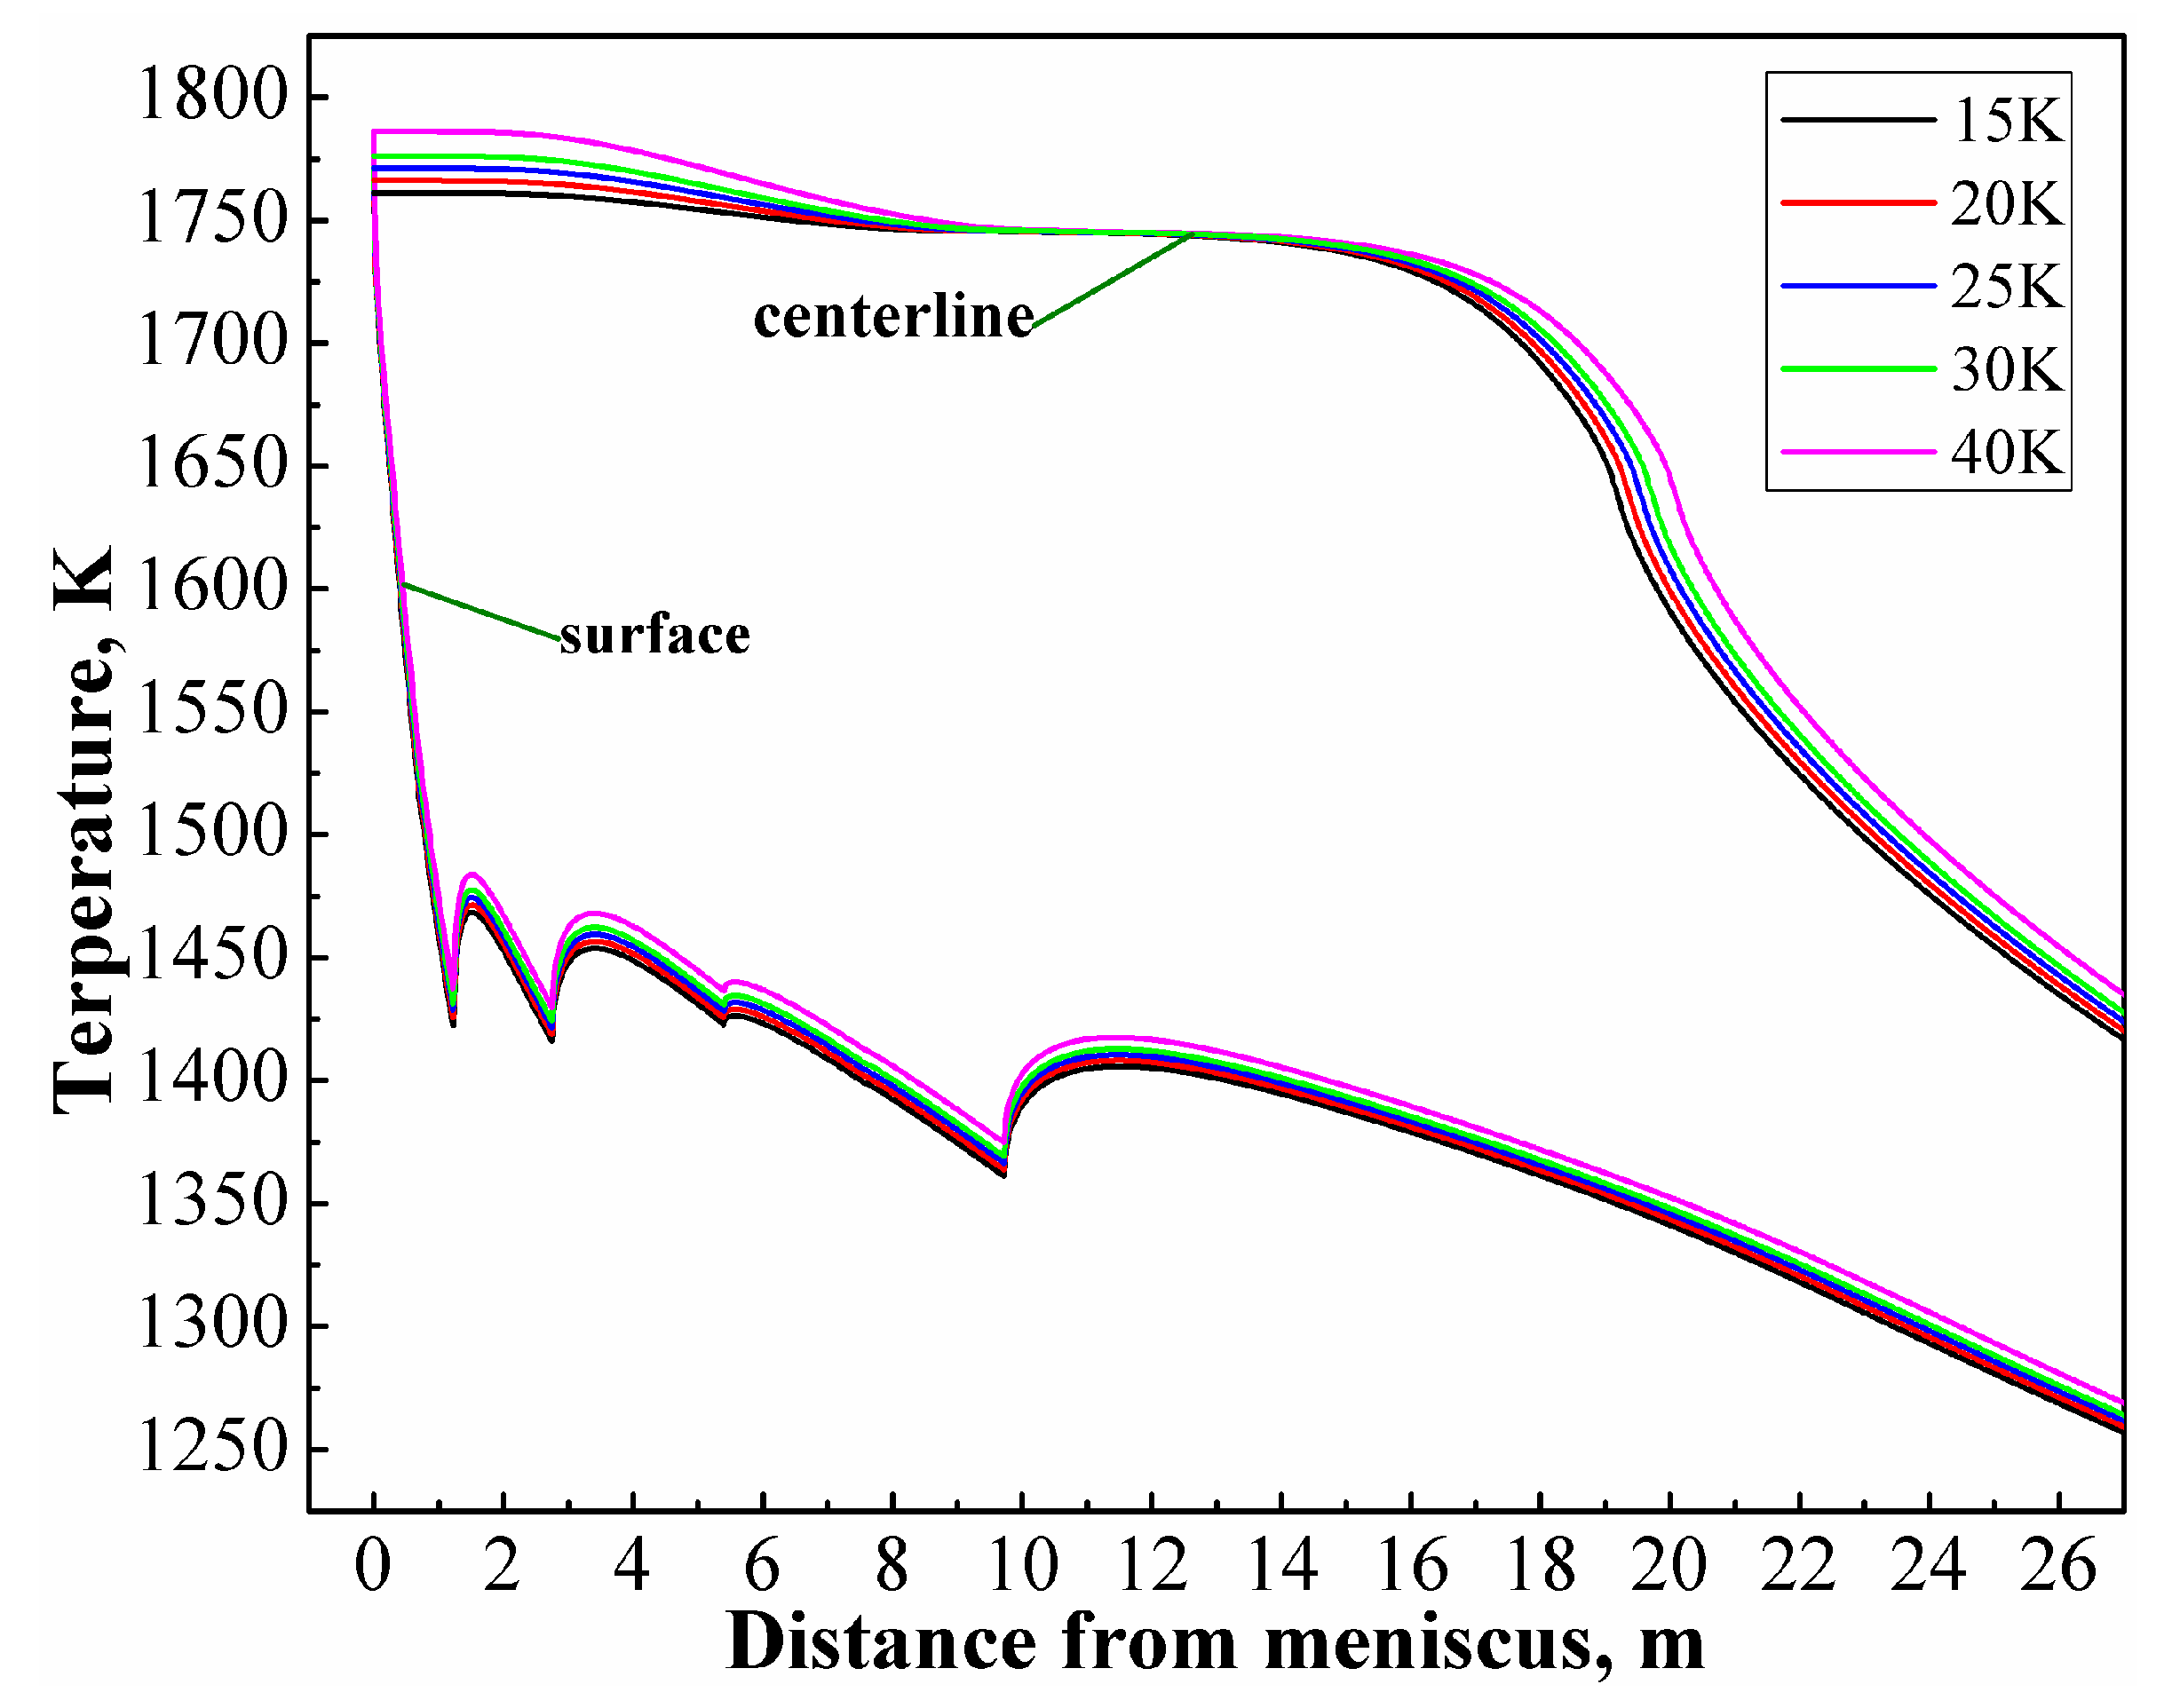
Figure 10.
Solidification structure in the bloom under different superheat: (a) 15 K, (b) 20 K, (c) 25 K, (d) 30 K, (e) 40 K.
Figure 10.
Solidification structure in the bloom under different superheat: (a) 15 K, (b) 20 K, (c) 25 K, (d) 30 K, (e) 40 K.

Table 1.
Parameters of the bloom caster (SC: Slow cooling; SSC: Super-slow cooling).
| Parameters | Value |
|---|---|
| Arc radius, m | 12 |
| Bloom cross section, mm2 | 380 × 280 |
| Chamfer mold dimension, mm | 10 |
| Effective height of mold, mm | 700 |
| Secondary cooling system | Zone I: spray cooling Zone II~V: air-mist cooling |
| Maximum metallurgical length, m | 26 |
| Casting speed, m/min | 0.63 |
| Water quantity in mold, L/min | 2600 |
| End of secondary cooling zone, m | 9.72 |
| Secondary cooling water rate, L/kg | 0.365 for SC, 0.198 for SSC |
Table 2.
Composition, liquidus slope, solute partition coefficient, diffusion coefficient, and Gibbs-Thompson coefficient of binary Fe-X steels.
Table 2.
Composition, liquidus slope, solute partition coefficient, diffusion coefficient, and Gibbs-Thompson coefficient of binary Fe-X steels.
| Element | c0, % | m | k | D, m2/s | Γ, m·K |
|---|---|---|---|---|---|
| C | 0.725 | −78 | 0.34 | 1.1 × 10⁻⁸ | 3 × 10⁻⁷ |
| Si | 0.355 | −21 | 0.05 | 3.5 × 10⁻⁹ | |
| Mn | 0.985 | −5 | 0.68 | 2.4 × 10⁻⁹ | |
| P | 0.014 | −34 | 0.06 | 4.7 × 10⁻⁹ | |
| S | 0.002 | −40 | 0.025 | 4.5 × 10⁻⁹ |
Table 3.
Nucleation parameters of CAFE (Cellular Automaton-Finite Element) model.
| Parameters | ΔTs,max, K | ΔTs,σ, K | ns | ΔTv,max, K | ΔTv,σ, K | nv | a2 | a3 |
|---|---|---|---|---|---|---|---|---|
| Value | 1 | 0.1 | 1 × 10⁸ | 3.5 | 1 | 1 × 10⁹ | 2.343 × 10⁻⁶ | 2.7737 × 10⁻⁶ |
Table 4.
Comparison of measured and simulated solidified shell thickness.
| Condition | Position, m | Measured, mm | Simulated, mm | Error, % | Liquid Core Length, m |
|---|---|---|---|---|---|
| SCC | 13.00 | 83 | 80 | 3.6 | 19.69 |
| 14.83 | 88 | 86 | 2.3 | ||
| SC | 13.00 | 89 | 86 | 3.4 | 17.23 |
| 14.83 | - | 103 | - |
Table 5.
Statistic grain parameters under different cooling conditions (1/4 cross section).
| Condition | No. Grains | Mean Surf/m2 | Nl/m | Na/m2 | Mean Radius/m | Equiaxed Ratio % |
|---|---|---|---|---|---|---|
| SSC | 16,357 | 1.623196 × 10⁻⁶ | 1.053651 × 10³ | 6.160937 × 10⁵ | 1.088757 × 10⁻³ | 28.7 |
| SC | 17,303 | 1.534888 × 10⁻⁶ | 1.091288 × 10³ | 6.517252 × 10⁵ | 1.065995 × 10⁻³ | 28.9 |
Table 6.
Statistic of grain parameters in the bloom under different superheat (1/4 section).
| ΔT | No. Grains | Mean Surf/m2 | Nl/m | Na/m2 | Mean Radius/m | Equiaxed Ratio % |
|---|---|---|---|---|---|---|
| 15 | 17,666 | 1.502860 × 10⁻⁶ | 1.071519 × 10³ | 6.653978 × 10⁵ | 1.025176 × 10⁻³ | 44.6 |
| 20 | 17,315 | 1.533325 × 10⁻⁶ | 1.061892 × 10³ | 6.521773 × 10⁵ | 1.036561 × 10⁻³ | 33.8 |
| 25 | 16,357 | 1.623195 × 10⁻⁶ | 1.053651 × 10³ | 6.160938 × 10⁵ | 1.088757 × 10⁻³ | 28.7 |
| 30 | 15,830 | 1.681266 × 10⁻⁶ | 1.030924 × 10³ | 5.961813 × 10⁵ | 1.101718 × 10⁻³ | 24.5 |
| 40 | 14,771 | 1.797409 × 10⁻⁶ | 9.854707 × 10² | 5.563564 × 10⁵ | 1.127640 × 10⁻³ | 20.1 |
© 2017 by the authors. Licensee MDPI, Basel, Switzerland. This article is an open access article distributed under the terms and conditions of the Creative Commons Attribution (CC BY) license (http://creativecommons.org/licenses/by/4.0/).
Share and Cite
MDPI and ACS Style
Fang, Q.; Ni, H.; Zhang, H.; Wang, B.; Liu, C. Numerical Study on Solidification Behavior and Structure of Continuously Cast U71Mn Steel. Metals 2017, 7, 483. https://doi.org/10.3390/met7110483
AMA Style
Fang Q, Ni H, Zhang H, Wang B, Liu C. Numerical Study on Solidification Behavior and Structure of Continuously Cast U71Mn Steel. Metals. 2017; 7(11):483. https://doi.org/10.3390/met7110483
Chicago/Turabian StyleFang, Qing, Hongwei Ni, Hua Zhang, Bao Wang, and Chengsong Liu. 2017. "Numerical Study on Solidification Behavior and Structure of Continuously Cast U71Mn Steel" Metals 7, no. 11: 483. https://doi.org/10.3390/met7110483
Note that from the first issue of 2016, this journal uses article numbers instead of page numbers. See further details here.