Inhibition of Brass (80/20) by 5-Mercaptopentyl-3-Amino-1,2,4-Triazole in Neutral Solutions
by
 ,
,
Ivan А. Arkhipushkin
1,2, 
Khidmet S. Shikhaliev
3,
Andrei Y. Potapov
3,
Lyudmila V. Sapronova
4 and
Leonid P. Kazansky
2,* 1
Department of Chemical Enginering, Dmitry Mendeleev Russian Chemical Technology University, 9 Miusskaya sq., 125047 Moscow, Russia
2
Laboratory of Physico-chemical Fundamentals of Corrosion Inhibition of Metals and Alloys, Russian Academy of Sciences (RAS), A.N. Frumkin Institute of Physical Chemistry and Electrochemistry (IPCE RAS), 31 Leninski prospect, 119071 Moscow, Russia
3
Department of Organic Chemistry, Voronezh State University, 1 Universitetskaya sq., 394006 Voronezh, Russia
4
Department of Organic Chemistry, Peoples’ Friendship University of Russia (RUDN University), 6 Miklukho-Maklaya st., 117198 Moscow, Russia
*
Author to whom correspondence should be addressed.
Metals 2017, 7(11), 488; https://doi.org/10.3390/met7110488
Submission received: 12 September 2017
/
Revised: 31 October 2017
/
Accepted: 5 November 2017
/
Published: 9 November 2017
(This article belongs to the Special Issue Corrosion Inhibition)
Abstract
:The effect of the adsorption of 5-mercaptopentyl-3-amino-1,2,4-triazole (MPATA) on the corrosive behavior of brass (Cu80/Zn20) in neutral (pH 7.4) borate buffer solutions with and without 0.01 M NaCl was studied. Electrochemical methods show significant decrease of the anodic and cathodic currents on the polarization curves in the presence of MPATA. X-ray photoelectron spectroscopy (XPS) reveals MPATA adsorption on the brass surface from an inhibitor solution. After 17 h of exposure, a mixed complex [CuxZnyMPATAz] with a thickness of about 3–3.5 nm is formed on the surface. This nanolayer has sufficient protective ability to withstand corrosion tests in a salt fog chamber: after 5 days of testing, the samples remain glossy and less than 1% of the surface has been damaged. After corrosion tests in a salt fog chamber, the surface of unprotected samples is enriched with zinc, while at the surface of inhibitor-treated samples, the copper and zinc are present in practically equal contents.
1. Introduction
Brass, an alloy of copper and zinc, is an important and interesting material, known for its technological properties and finds wide application, ranging from mechanical engineering to medical application and arts. In each of these areas of brass exploitation, there are factors that cause the alloy to undergo corrosion destruction, most often beginning with a selective dissolution of zinc [1,2,3,4,5,6,7,8,9,10]. One of the scientifically substantiated and economically expedient methods of protecting brass from corrosion is to use inhibitors, and azoles are found to be the most efficient. Early works were devoted to studies of azoles: 1,2,4-triazole (TA), 3-amino-1,2,4-triazole (ATA), and the most popular 1,2,3-benzotriazole (BTA) as corrosion inhibitors for ferrous and non-ferrous metals and their alloys [11,12,13,14,15,16,17,18,19,20,21,22,23,24,25,26,27,28,29,30,31,32,33,34,35,36,37,38,39]. Lately, many studies are devoted to the analysis of new, more effective inhibitors, whose structures contain various substituents improving inhibiting characteristics. On one hand, they can influence the electronic properties of the active sites of molecules involved in donor-acceptor bonds with the surface metal atoms, and on the other hand, create hydrophobic layers on the surface that prevent the access of aggressive media components to the metal.
Behavior of copper and zinc in a neutral medium was previously studied in the presence of 5-mercaptopentyl-3-amino-1,2,4-triazole (MPATA) (Figure 1), and its high efficiency was shown [40,41,42,43]. We believed that it would be interesting to study adsorption and protective ability of MPATA for brass in a neutral borate buffer solution (pH 7.4) with and without NaCl. For this purpose, electrochemical measurements, X-ray photoelectron spectroscopy (XPS), as well as corrosion tests in a salt fog chamber were undertaken.
2. Experimental Section
To synthesize MPATA, 26 g (0.2 M) of 5-mercapto-3-amino-1,2,4-triazole was dissolved in 80 mL of 10% aqueous sodium hydroxide solution and n-pentyl iodide (35.6 g, 0.2 M) was added dropwise over 3 h to the resulting solution. The MPATA precipitate (18 g with yield 48%) was filtered off, washed with water, dried, and used without further purification.
Due to poor solubility in water, the MPATA powder was previously dissolved in a small (1–2 mL) amount of ethanol, then diluted to the desired amount with borate buffer solution (pH 7.4).
The electrochemical measurements were carried out at 20 °C in a conventional three-electrodes cell assembly in borate buffer solution (pH 7.4) with the addition of 0.01 M NaCl. A flat 10 × 10 mm2 electrode was cut out from 2 mm thick brass (Cu/Zn = 80/20) plate, and then soldered to the output wire to be connected to the potentiostat and embedded in epoxy resin. The working surface was polished with SiC emery paper 400, 600, 1000 grit, washed with distilled water, and degreased ultrasonically in ethanol. The polarization curves were recorded with the potentiostat IPC Pro M (IPC, Moscow, Russia) and Ag/AgCl electrode (+0.22V relative to the standard hydrogen electrode) provided with a Luggin capillary was used as the reference electrode, and all the potentials E are given relative to it. The auxiliary electrode was a Pt plate.
After polishing, the electrode was immersed in borate buffer solution containing 0.01 M NaCl for 15 min, then the pre-determined concentrations of MPATA was introduced. Steady state was reached within 15 min and after that, the polarization was applied. The scan rate was set at 1 mV/s. Polarization curves are given in logarithmic current scale to reveal suppression of the first anodic peak of copper oxidation to Cu+. Each measurement was run three times to achieve a consistent result.
The 10 × 15 mm2 samples for XPS studies were cut out from the same brass plate, the surface was ground with a coarse (1000), then fine (2500), emery paper (1913 Siawat fc, Frauenfeld, Switzerland). Then samples were polished with diamond powder (2/1) to a mirror finish and washed with double distilled water in an ultrasonic bath. In our preliminary experiments, we have found that 5 min immersion of brass samples in buffer solution with MPATA concentration higher than 0.02 mM resulted in formation of the complex layer with thickness 3–3.5 nm. Therefore, the concentration 0.01 mM was selected to follow the thickness of the surface layers depending on the immersion time. After immersion in 0.01 mM inhibitor solution at room temperature during predetermined time (without NaCl), the samples were washed for 1 min in the ultrasonic bath to remove physically adsorbed molecules, then fixed on the holder, and transferred to the spectrometer fast entry lock chamber. The solutions were deaerated by bubbling argon gas for 20 min prior to each measurement.
XPS measurements were performed using OMICRON ESCA+ spectrometer (Omicron NanoTechnology, Taunusstein, Germany) with the Al-anode (the radiation energy 1486.6 eV and power 252 W). The pass energy of the analyzer was set at 20 eV, and in some cases at 10 eV to increase the resolution. To take into account the charge of the samples, the position of the XPS peaks was standardized by the C1s peak of the hydrocarbon impurities from the atmosphere, which binding energy Eb was taken equal to 285.0 eV. The base pressure in the analyzer chamber was kept no higher than 8 × 10⁻¹⁰ mbar. The spectra were deconvoluted into components after subtraction of the background determined by the Shirley method [44]. The element ratios were calculated using integral intensities under the peaks, taking into account the photoionization cross sectionsσ of the corresponding electron shells [45], excluding CuLMM and ZnLMM. Using the integrated intensity of the peaks and the MultiQuant program [46], the thicknesses of the layers formed on the surface were calculated with allowance for the mean free path of the electrons, λ, according to the formula of Cumpson and Seah [47]. Each experiment was repeated twice.
To analyze the quantitative and qualitative composition of films formed on the surface of metal samples in the presence of inhibitor, the spectra of C1s, O1s, N1s, S2p, Cu2p3/2, Zn2p3/2, CuL3M4,5M4,5 (CuLMM), and ZnL3M4,5M4,5 (ZnLMM) electrons were analyzed. When analyzing copper and zinc, we should accept that the positions of the Cu2p3/2 and Zn2p3/2 peaks for the metallic and oxidized states practically coincide, but the Auger spectra of CuLMM and ZnLMM electrons differ markedly in the form and position of maxima for individual substances. This fact was used to fit experimental spectra by summing up individual components (metal, oxide, and complex), as suggested in [42,43,48,49].
Samples for corrosion tests were also cut out from brass plate, ground with emery paper (1000 and 2500), polished with diamond paste (0.25 μm; TedPella, Inc., Redding, CA, USA) to mirror finish gloss, degreased with ethanol, and immersed in 2.0 mM MPATA water solution for 5 min. Afterwards, the dried sampleswere suspended in a salt fog chamber (Umwelttechnik Weiss SC-450, Reiskirchen-Lindenstruth, Germany). The tests consisted of a periodic spray (15 min)/condensation (45 min) of brine in the chamber at the interval of 1 h. The temperature in the chamber was kept at 35 °C.
3. Results and Discussion
3.1. Electrochemical Research
A single peak corresponding to the oxidation of copper to Cu+ is observed on the anodic curve of the alloy, while the second peak denoted as oxidation of copper to Cu2+, observed for pure copper [29,35,50], is not observed (Figure 2). The polarization curves are close, presented in [19,20,49], despite the media and composition are not identical.
At these conditions, low concentrations (up to 0.15 mM MPATA) slightly decrease copper dissolution at −60 mV, but at the same time increase the current at +180 mV. Yet, 0.2 mM suppresses Cu+ formation 10 times and shifts the activation potential to +500 mV. At 1.0 mM, anodic formation of Cu+ and Cu2+ is almost inhibited up to +500 mV, but at the highest concentration this substance does not shift the breakdown potential of the passive state to positive values.
Cathodic curve obtained at 1.0 mM MPATA reveals the suppression of all observed cathodic reactions and a significant shift of 200 mV towards negative potentials for hydrogen evolution reaction. This allows us to conclude that during immersion of the brass electrode in MPATA-containing solution the protective film is formed and the MPATA molecule behaves mixed anodic-cathodic inhibitor.
3.2. X-ray Photoelectron Spectroscopy (XPS) Measurements
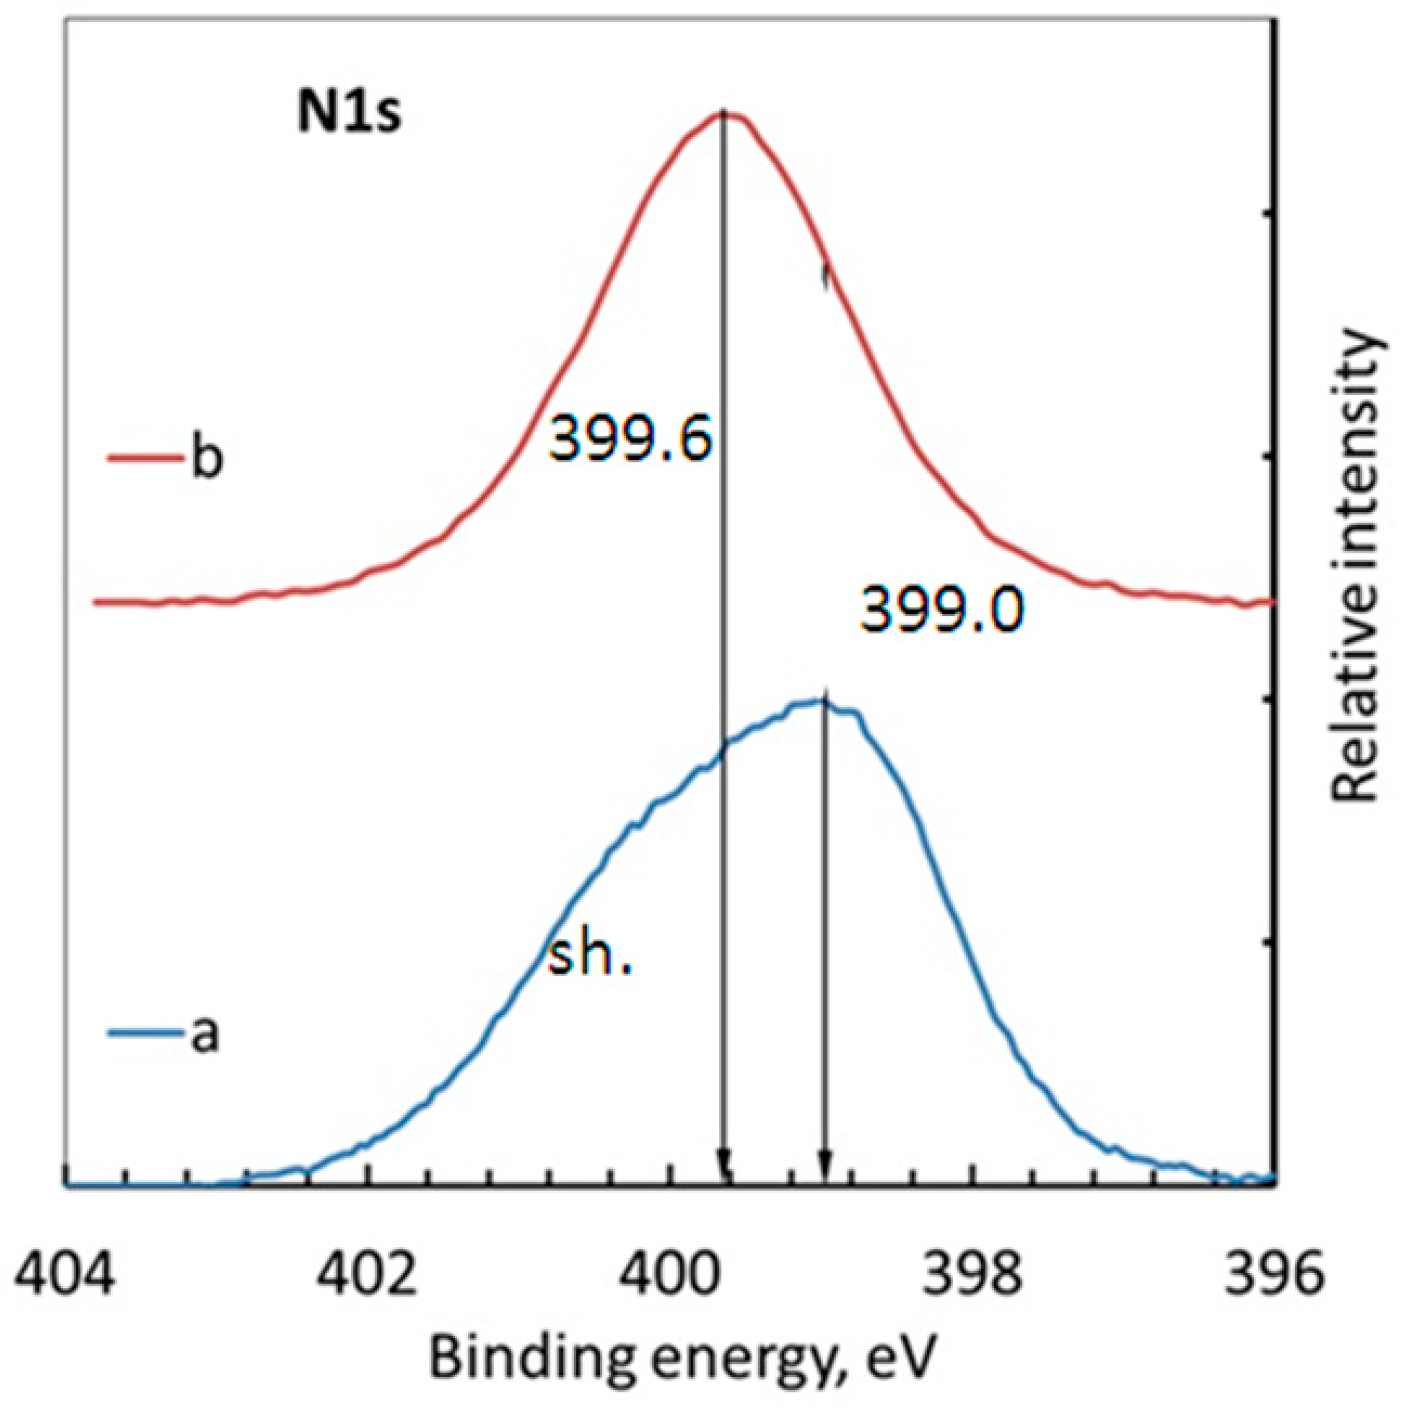
The XPS method was used to determine the composition of the surface layers formed on brass samples after treatment in the MPATA solutions. The brass samples reveal the peaks of N1s and S2p electrons, indicating the strong adsorption of the inhibitor, which is not removed even by ultrasonic washing. In addition, a third component appears in the Auger CuLMM and ZnLMM spectra, whose positions differ markedly from the spectra of the corresponding metals and oxides. This, as well as changes in the N1s spectra, in comparison with the individual MPATA, reveals the formation of a complex of copper and zinc with an inhibitor upon its adsorption on the surface.Due to the high-resolution spectra (20 eV), the nitrogen states in the spectrum of the inhibitor powder may be differentiated. The peak was clearly asymmetric and had a maximum at 399.0 eV (a in Figure 3). A shoulder at ~400 eV, being due to the protonated nitrogen (Figure 1), disappears upon adsorption, the maximum shifts to 399.6 eV, and the peak becomes symmetric and narrows from 2.58 eV to 2.05 eV (b in Figure 3). This is explained by the interaction of triazole with metal cations through nitrogen atoms in a heterocycle with proton removal and electron density equalization [19,42,43]. As the theoretical studies suggest, deprotonated form for triazoles is the active species for inhibiting corrosion [51].
Sulfur, whose S2p peak (Figure 4) also demonstrates the presence of MPATA in the surface film and whose amount is taken in calculating of the complex, does not participate in the formation of chemical bonds with metal atoms as a heteroatom in other inhibitors having thione or thiol form. The position of the peak in the spectrum of S2p is almost frozen within the range: 163.8 ± 0.1 eV. It should be noted that the atomic ratio N/S observed on the samples exposed to buffer solutions with MPATA was close to one found for the MPATA powder, namely 4/1.
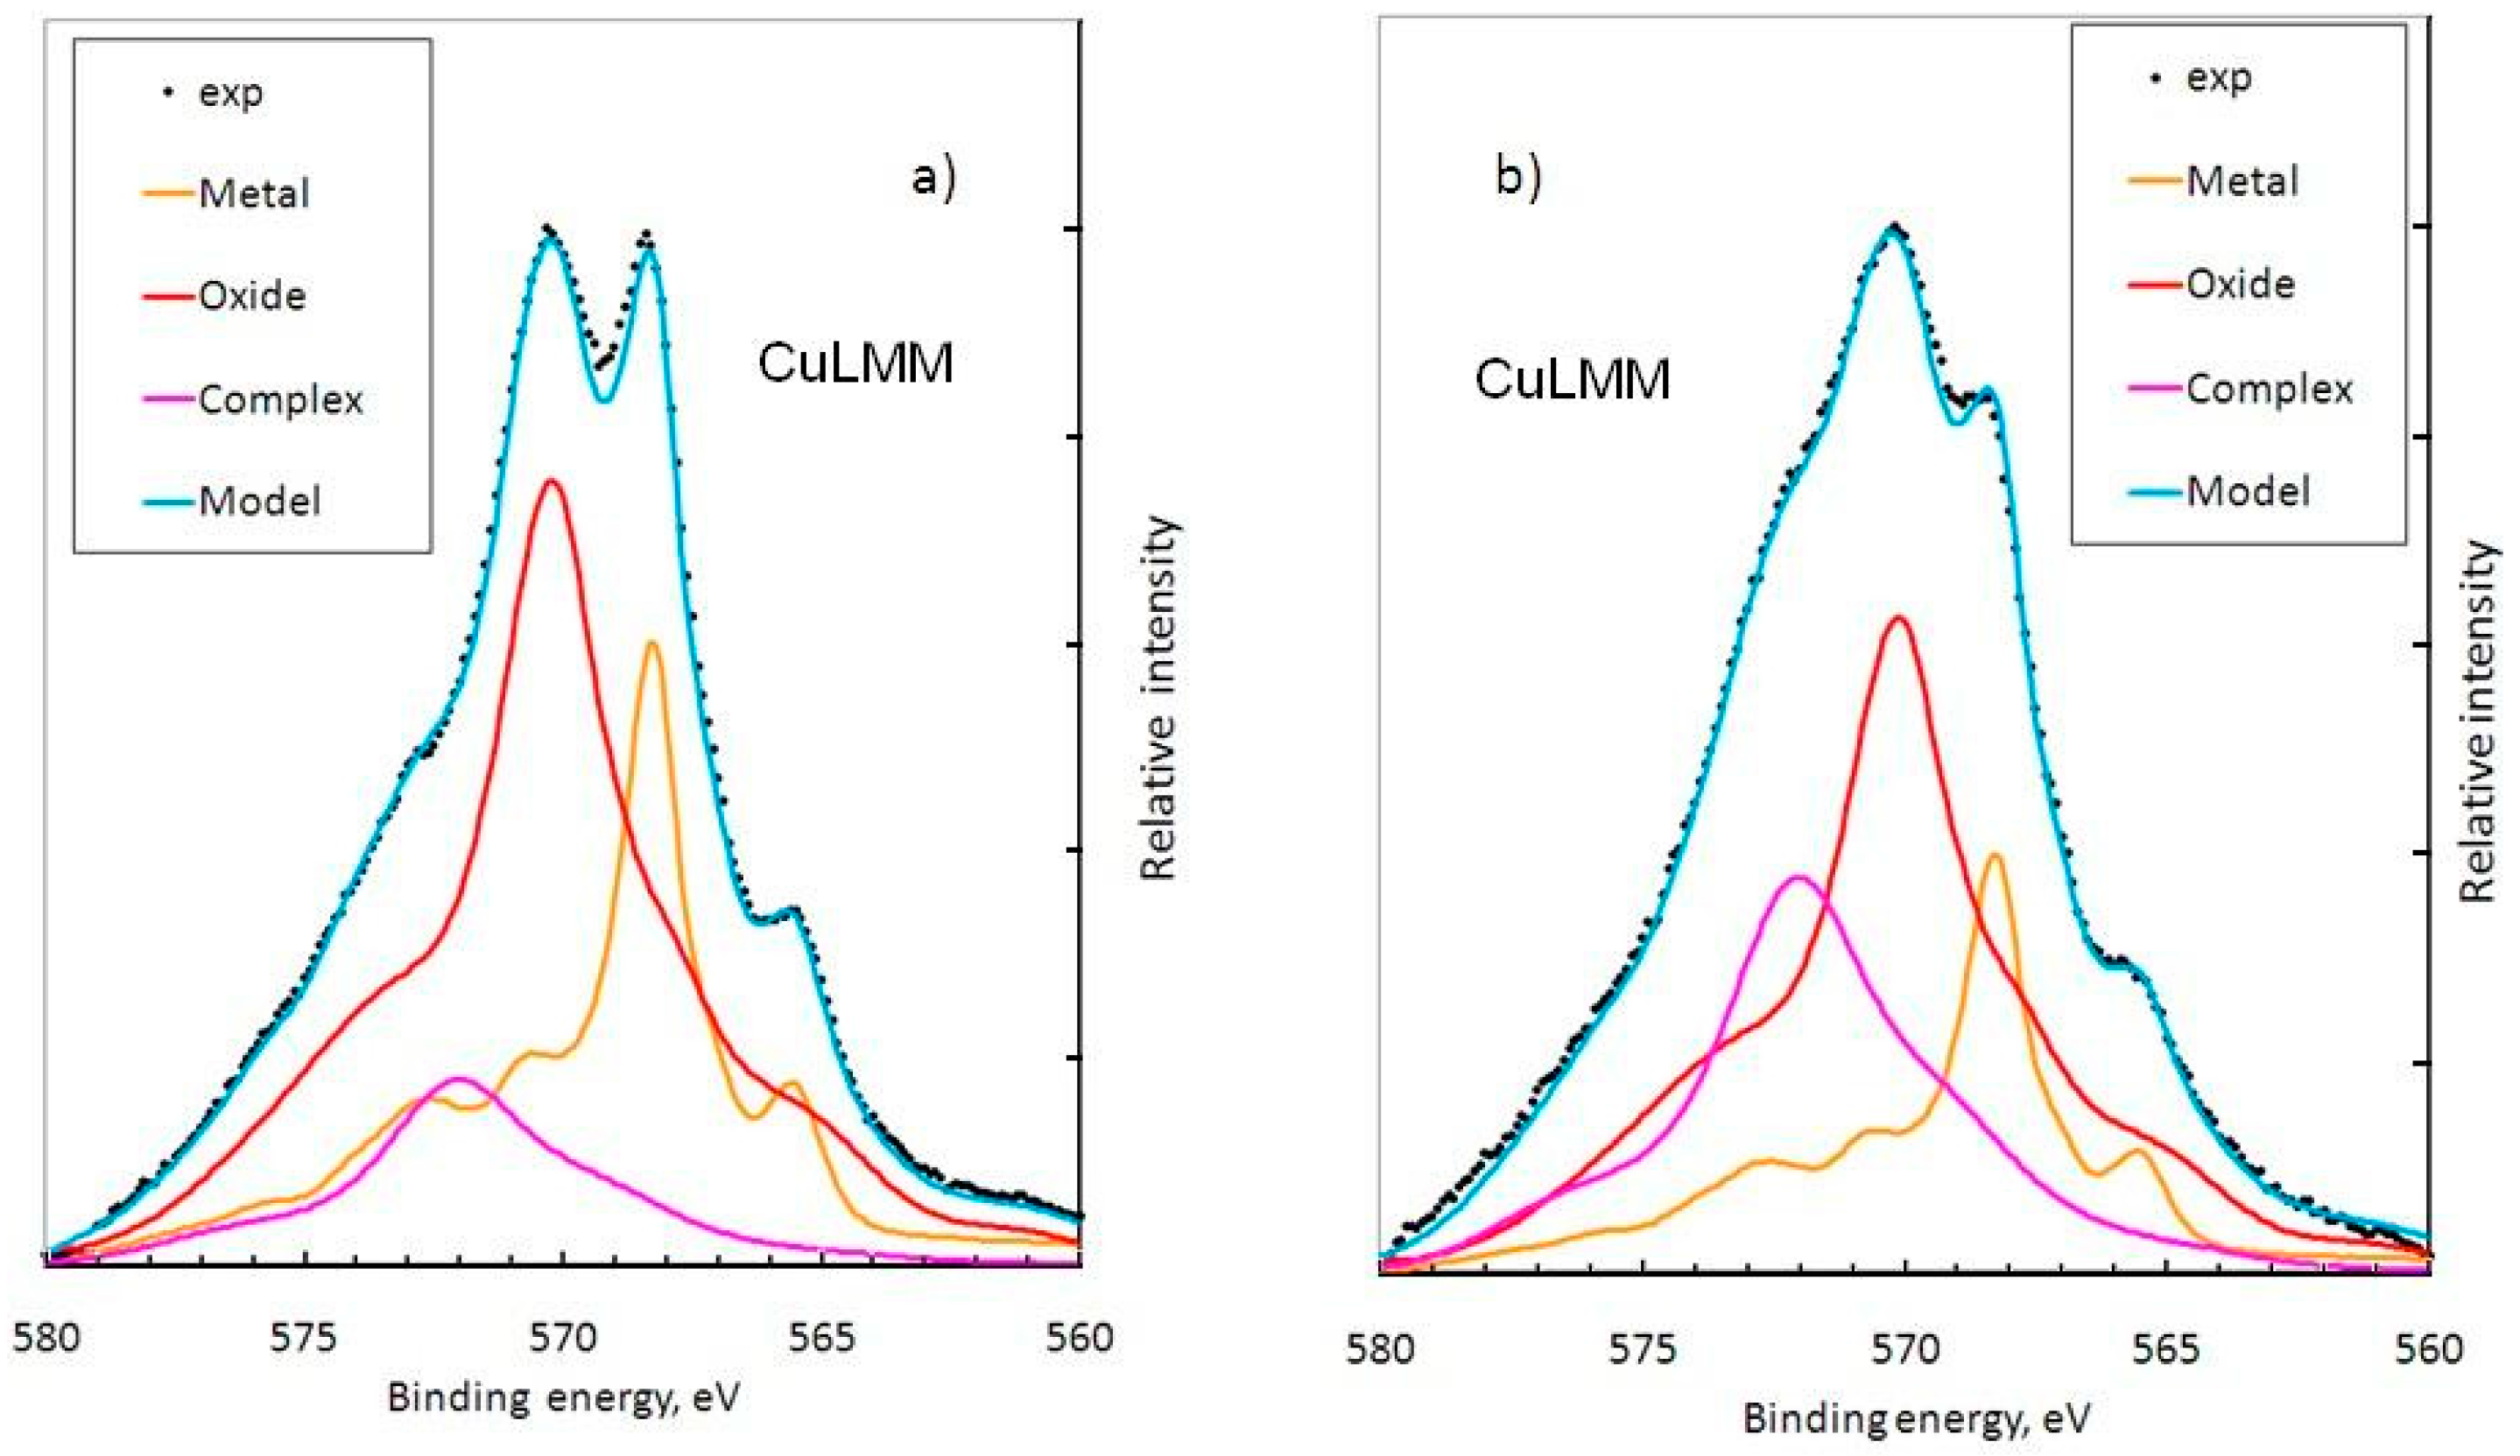
As we have mentioned, the Cu2p and Zn2p peaks are not informative to distinguish Cu0, Cu+ and Zn0, Zn2+, therefore, Auger lines are used for identification of species formed on the surface of brass. As examples, two Auger CuLMM spectra are presented in Figure 5 with possible separation into three components: metallic copper, cuprous oxide, and copper complex with MPATA. The methods to produce the components will be given below.
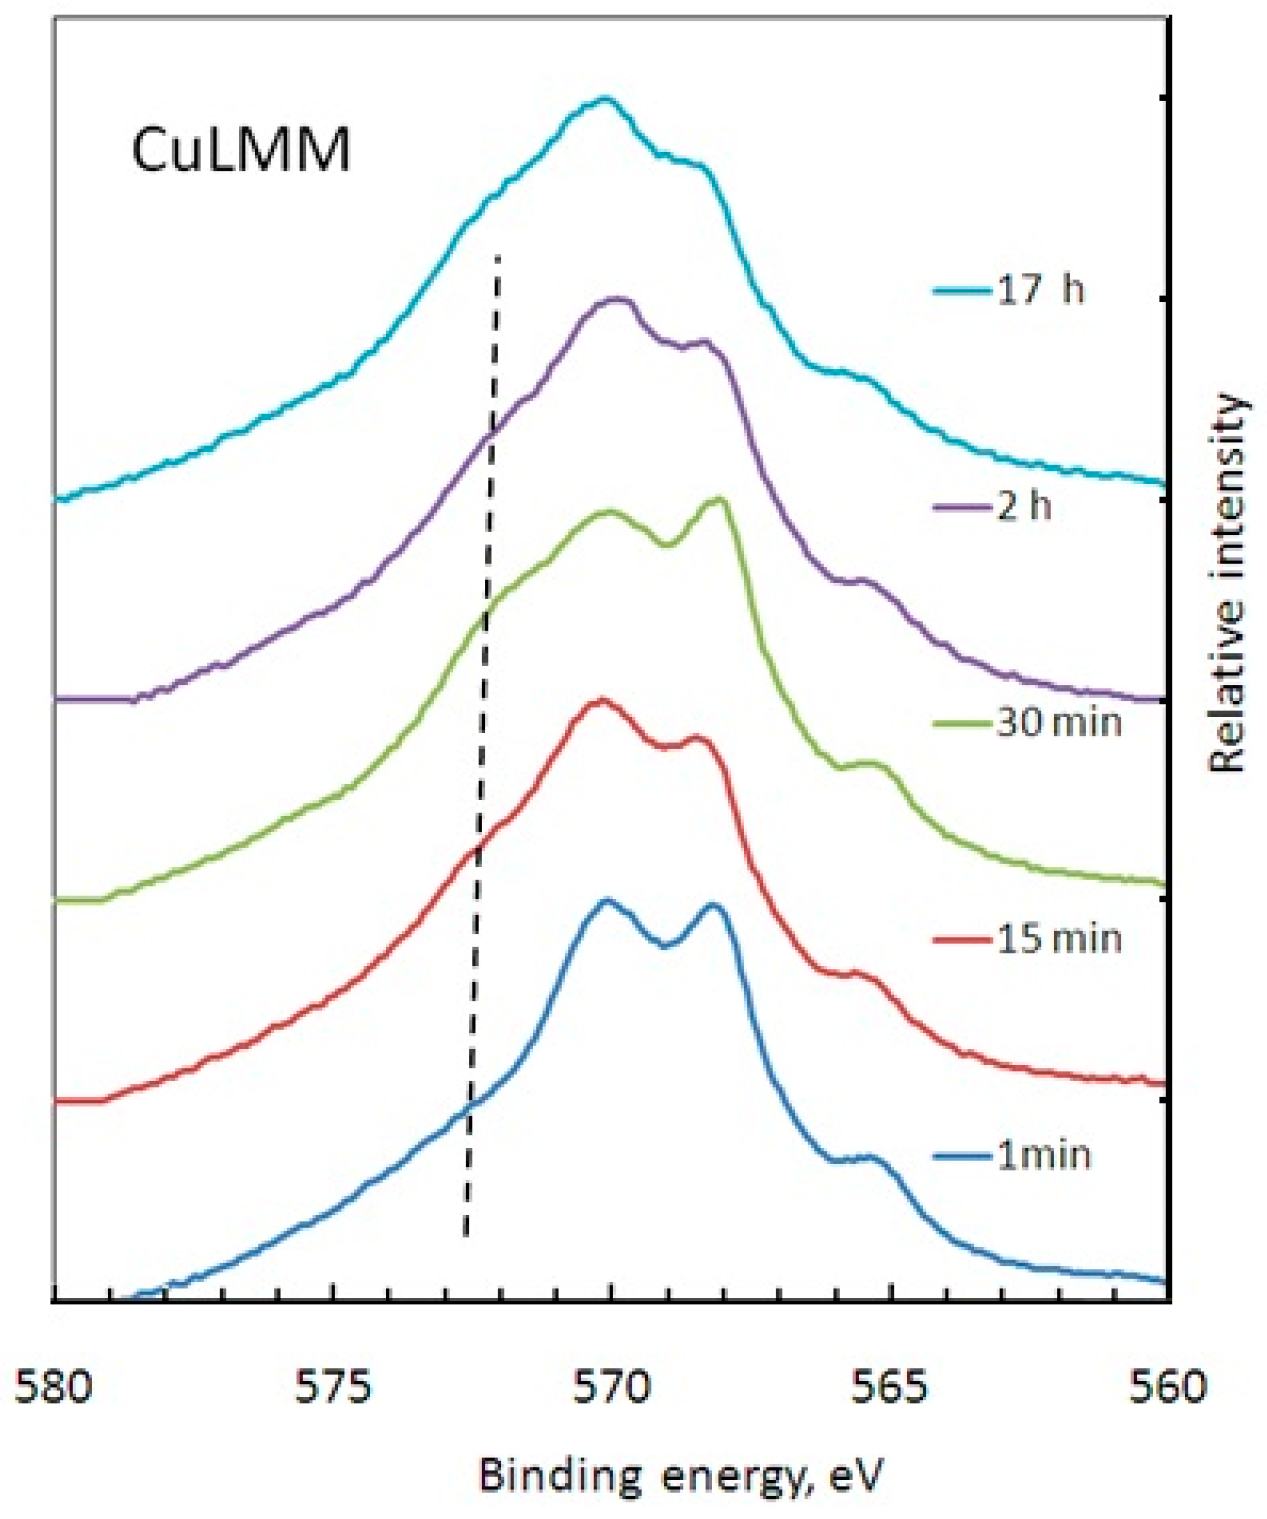
When the brass samples are exposed in MPATA solution, the CuLMM spectra are modified (Figure 6). In a blank solution, only metallic (main peak at 568.0 eV) and oxide (main peak at 570.0 eV) components are present in the spectrum. After one minute of immersion of the sample in solution with an inhibitor, a third component (hump) appears, whose maximum is observed at 572.2 eV (Figure 5). This component may belong to the CuMPATA complex with the atomic ratio Cu:S:N = 1:1:4 [43]. With increasing the immersion time, this part of the spectrum, which, as we believe, belongs to the copper complex, slightly increases, but after 15 min, it reaches almost maximum.
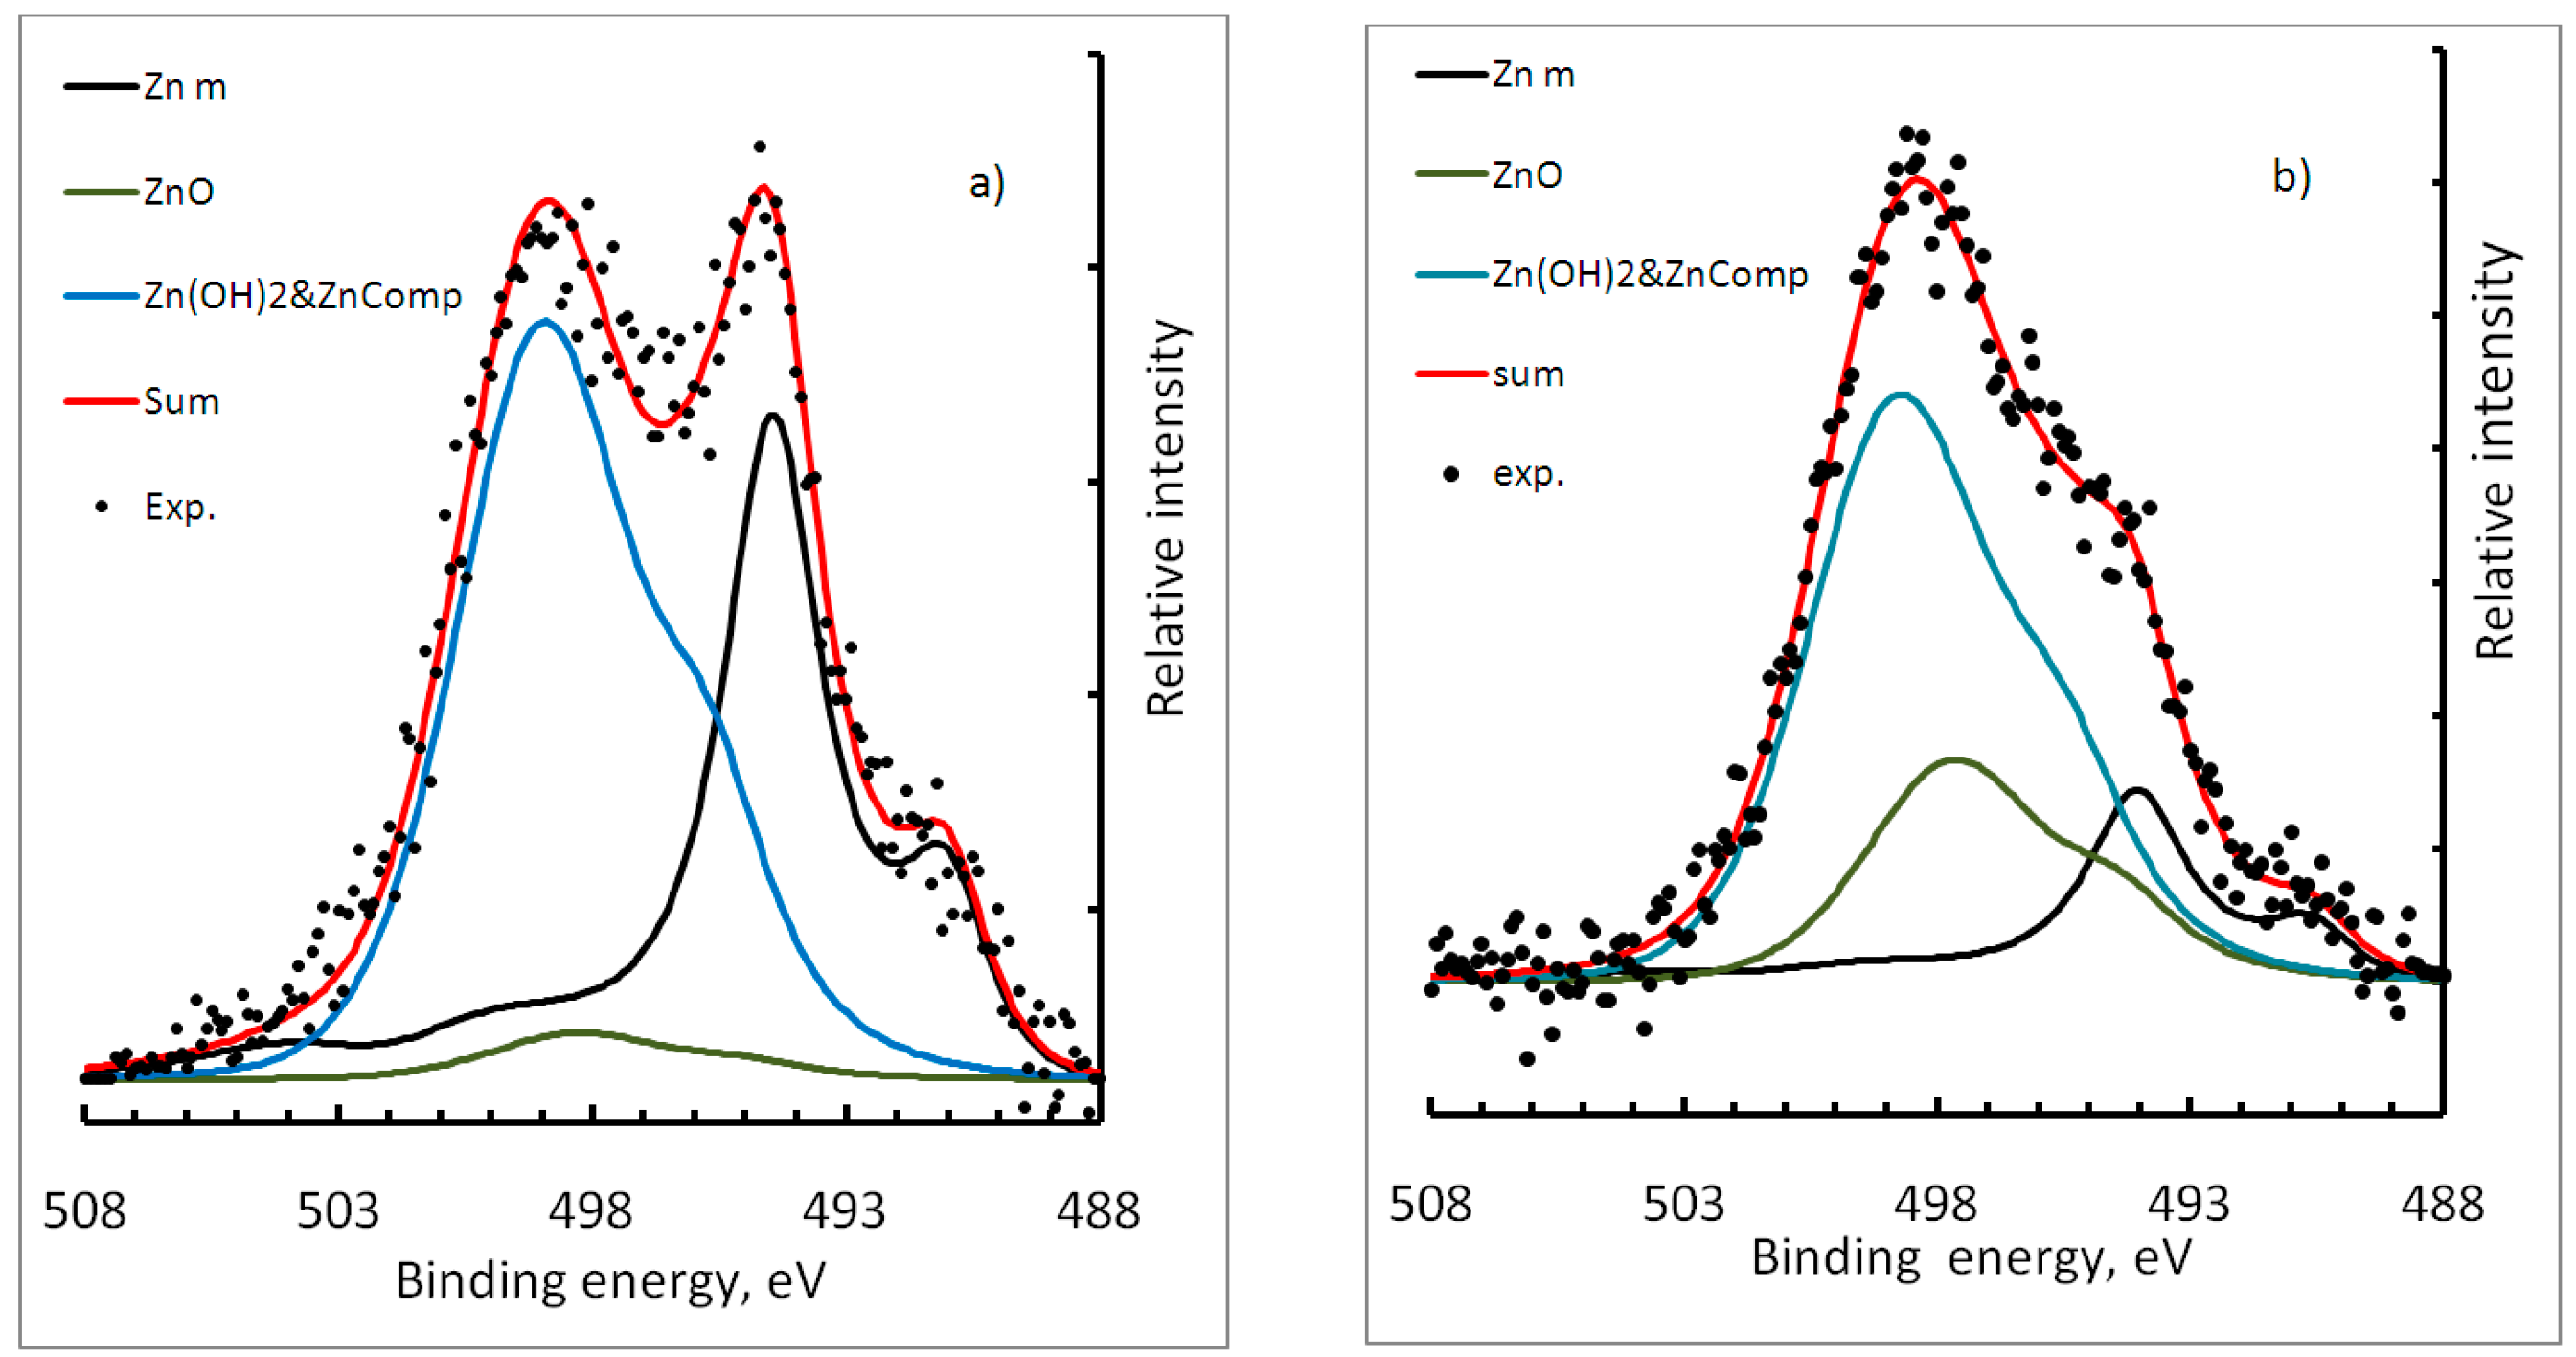
At the same time, the ZnLMM spectrum was also changing and it can be deconvoluted in principle into four components: metallic, oxide, hydroxide, and complex with MPATA [42,51]. Unfortunately, intensity of ZnLMM spectra was rather low (Figure 7) to make reasonable deconvolution, and possible summation of components may be regarded as tentative. Nevertheless, the spectra show gradual disappearance of metallic contribution with increasing immersion time.
To calculate the thickness of the formed films, the Auger spectra CuLMM were deconvoluted into individual components (oxide, metal, and complex), as was done in Figure 5 to determine their ratio in the surface layer. The deconvolution and fitting of the spectra were carried out in such a way that the difference between a modeled spectrum and the experimental one was minimal. The position and shape of the individual components of the CuLMM spectrum were determined using a copper sample.
To obtain the metallic component, the copper sample was etched in the chamber of the spectrometer by Ar+ ions. The Cu2O spectrum was obtained by exposing the sample for a long time in water at 90 °C without air access until a sufficiently thick oxide layer was grown and the signal from the metal bulk was not seen. The absence of bivalent copper was confirmed by the absence of the shake-up satellites in the Cu2p spectra. The CuMPATA complex spectrum was obtained by long time exposure of the sample in a solution with a high concentration of inhibitor also without access of air. The immersion time was controlled by the absence of Cu2+.
The same procedure was done in the case of ZnLMM spectra for zinc sample. However, in the case of brass, we obtained very noisy spectra and that is why the deconvolution was accomplished only for three components: Zn0, ZnO, and Zn(OH)2. To calculate atomic content, the photoionization cross sections of CuLMM and ZnLMM were determined from relation between the integrated intensities of the photoelectron peaks: Cu2p3/2 and CuLMM for Cu(m), CuCNS, and CuSO4; and Zn2p3/2 and ZnLMM for Zn(m), ZnO, and ZnSO4 [52]. Further, for the rest of the elements, we have used standard Scofield’s photoionization cross-sections [45].
We can only guess what part of Zn(OH)2 component includes complex with MPATA, because the ratio S/Cu = 1/(1 ± 0.2). We can also write that the surface complex has composition Cu1−xZnxMPATA where x< 0.2, but for further discussion, it is not so important.
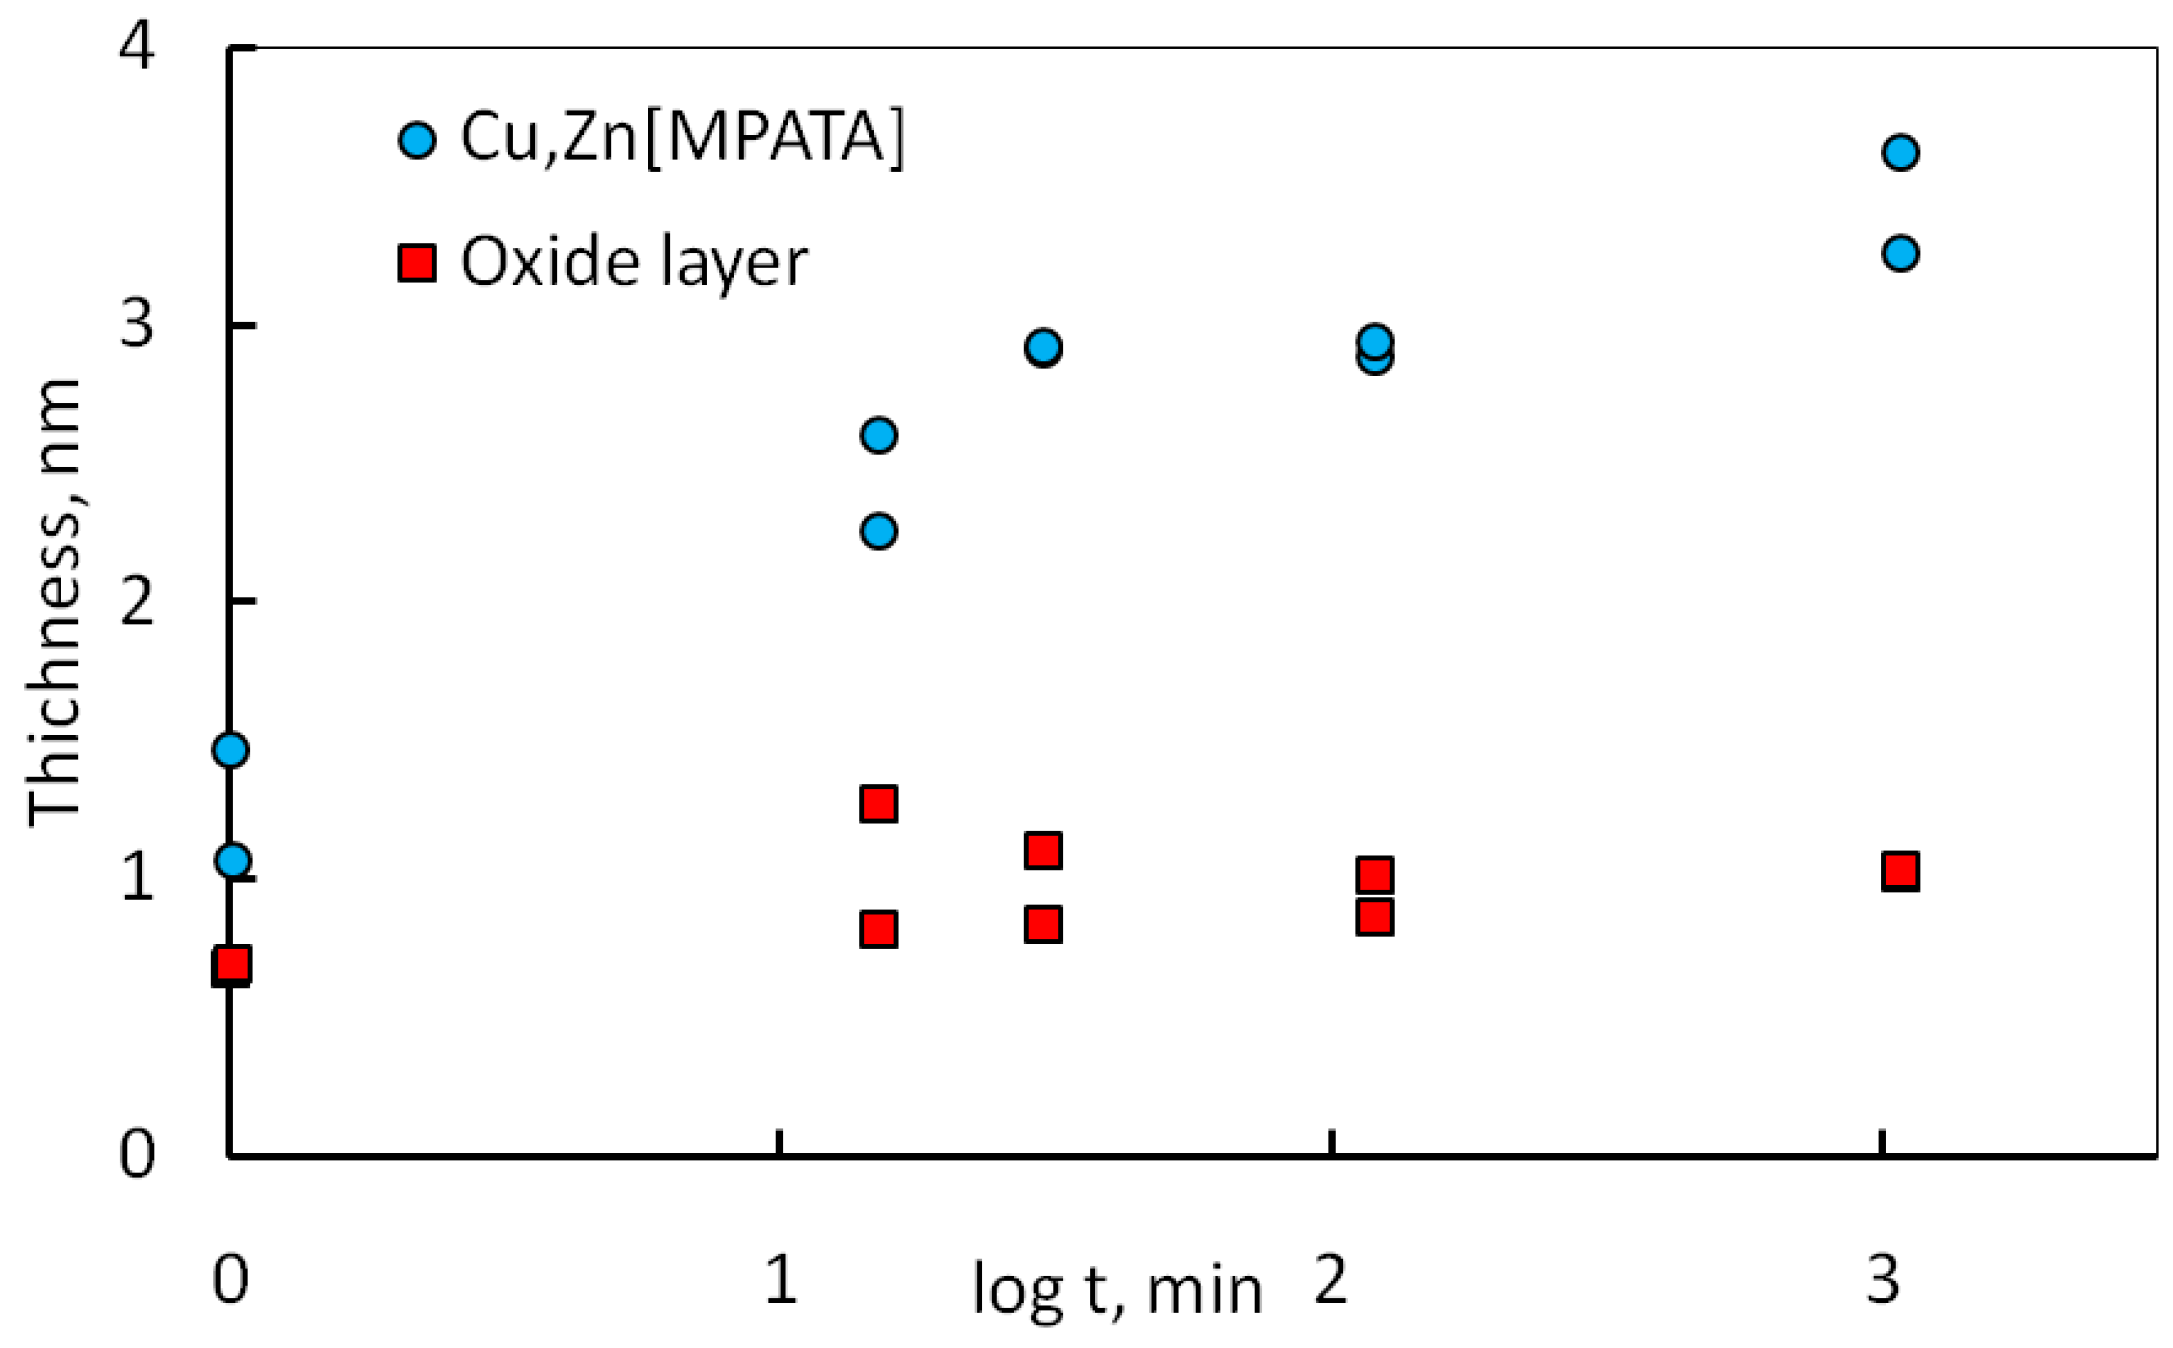
After deconvolution of the CuLMM and ZnLMM spectra into individual components, as shown in Figure 5 and Figure 7, we obtained the composition of Zn and Cu in the surface layers (Table 1). The obtained intensities of the peaks of the rest elements C1s, O1s, N1s, and S2p, were put into the MultiQuant program for calculating the thickness of surface films. The following surface model consisting of supposed homogeneous plane-parallel layers was taken for calculations: hydrocarbon and other air pollution, then a layer of moisture adsorbed from the air, then a mixed complex of Cu1−xZnxMPATA, where x < 0.2, located on a copper-zinc oxide layer that covers the brass substrate. The results of calculating the thickness are shown in Figure 8.
There are some studies devoted to effects of the chloride ions on the behavior of copper and brass [17,22,26,50,51,52,53,54], and it was shown that only large concentrations substantially influence kinetics of the formation and composition of various films on the surface of metals. In our case, adding 0.01 M NaCl notably decreased Zn content in the surface film, leaving the thicknesses of complex and oxide unchanged for the same immersion time.
3.3. Discussion
According to our electrochemical study, the first anodic peak corresponds to oxidation of copper up to Cu+:
2Cu + H2O = Cu2O + 2H+ + 2ē
Naturally, in the presence of chloride ions, this process goes more actively, especially for zinc. Therefore, at the steady state potential, the surface is already covered with cuprous oxide and the upmost surface layer is presented by Cu–OH [55]. That is why the surface of brass sample exposed in borate buffer solution containing 0.01 M NaCl for 15 min presents only Cu2O with thickness of 1.5 nm with 5% of Zn (total) and traces of chloride.
Adding MPATA into solution results in the following reaction:
and in case of brass, with partial replacement of copper with zinc. As we have shown, the thorough ultrasonic washing of the surface of samples after exposure in MPATA solutions does not remove the adsorbed layer of the MPATA complex. The calculated thickness of the complex is much larger than the size of MPATA molecule and the first monolayer forms quite quickly. We think that the formed complex has a polymeric nature as proposed in [43], constructing chains –Cu–N–N–Cu– using nitrogen atoms N1 and N2 from the azole cycle. In such chains, some places may be occupied by zinc to satisfy the ratio Cu/Zn. The similar polymer complexes were proposed by Finsgar et al. [56], when benzotriazole forms a protective film when adsorbed on copper. Formation of such polymeric complexes creating reliable protective barrier against oxidation of copper and brass becomes an accepted view [57,58,59,60,61,62]. We see also that the oxide layer practically does not change its thickness.
Cu–OH + MPATA = CuMPATA + HOH
3.4. Corrosion Tests
Corrosion tests were carried out in a salt fog chamber with periodic spraying of brine every hour. Figure 9a shows two samples after 4 spraying/condensation cycles. During this time, the sample without the inhibitor completely darkens and is coated with corrosion products. Samples with preliminary applied inhibitor (Figure 9b) were then left for 5 days. Samples retained their luster, although salt crystals were visible on the surface, and corrosion regions were observed on the plates—however, the spots covered not more than 1% of the surface.
To study the surface after the corrosion tests, small samples were prepared for the XPS measurements (Figure 10). Samples were kept for 20 cycles in a salt fog chamber, then without washing were placed in the spectrometer chamber. Corrosion damage on the inhibitor-treated sample is barely noticeable, while on the unprotected sample, the selective dissolution regions of the alloy are distinctly visible: areas with metallic copper are evident. In this connection, it was of interest to know the composition of the surface and to establish the behavior of the alloy with an inhibitor and without an inhibitor in the presence of chloride ions.
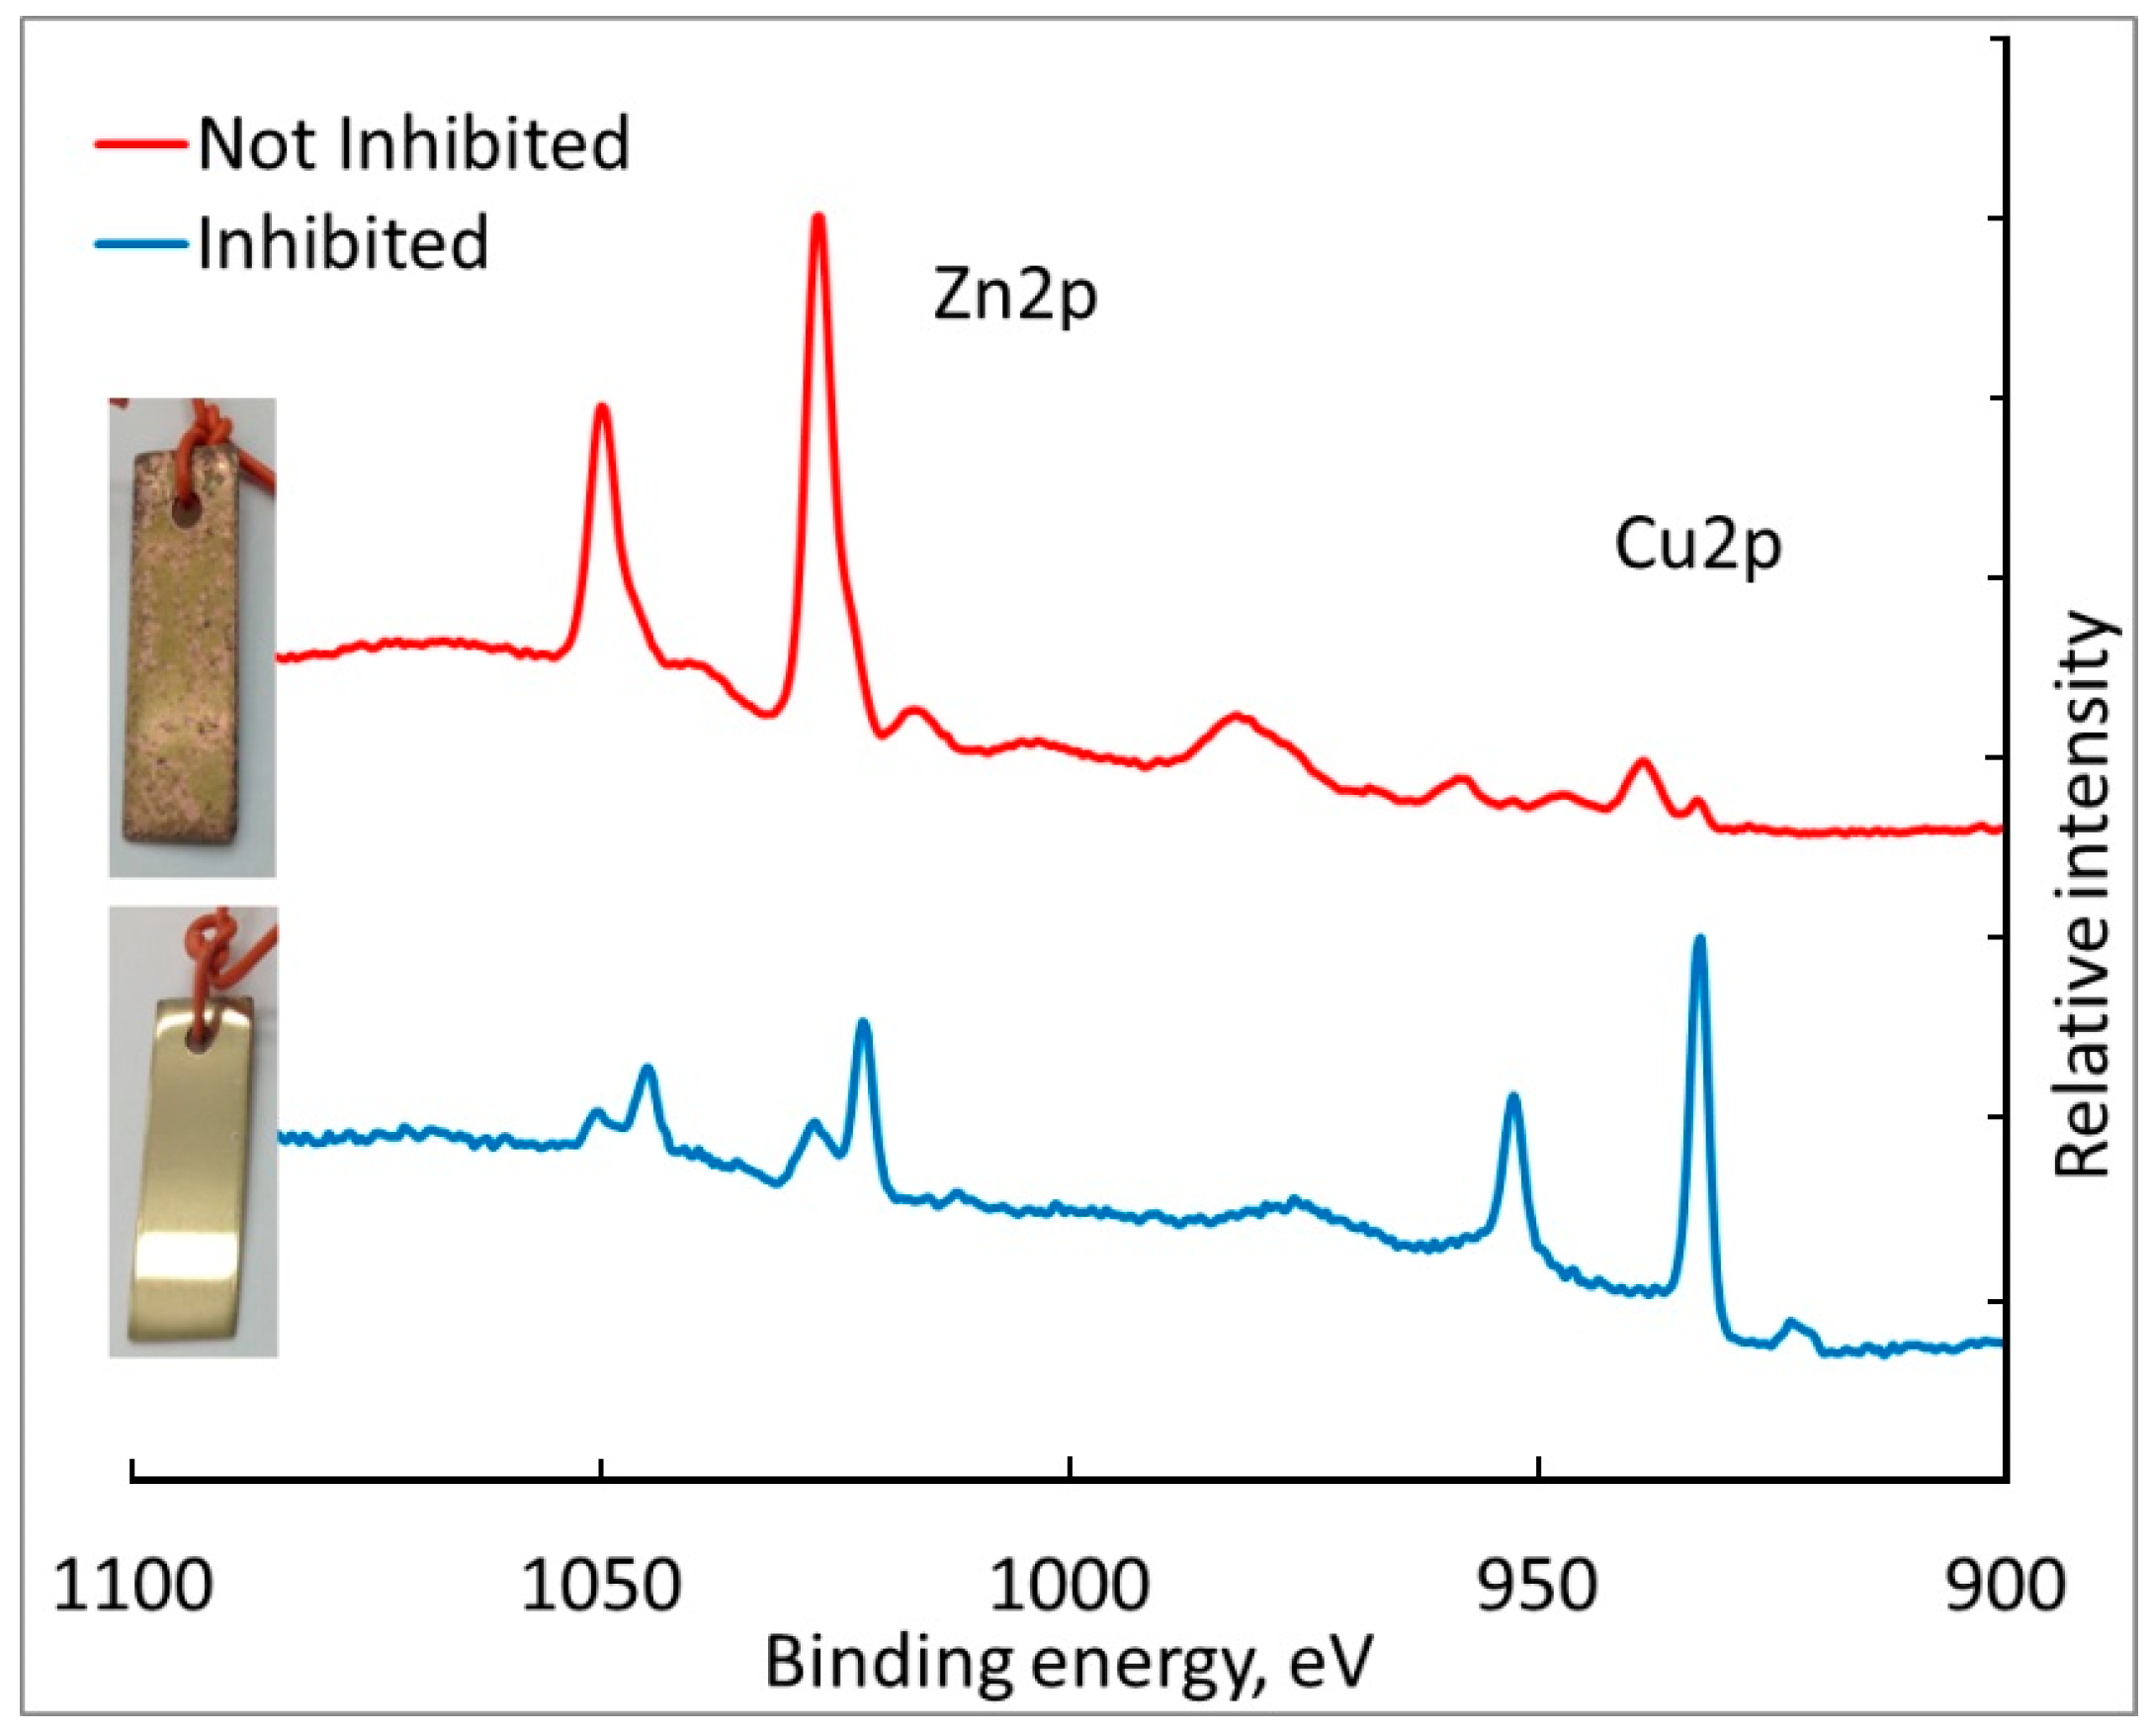
Analysis of the surface composition showed that the sample without the inhibitor is almost completely covered with zinc compounds, and the surface of the samples treated with MPATA contains XPS peaks of copper and zinc (Figure 11). Such behavior was found earlier in the study of brass with benzotriazole [17] and mercaptobenzothiazole (MBT) in NaCl solution [52]. This phenomenon for brass in the presence of chloride still does not have a clear explanation, although there is some speculation in the literature [63] on the formation of zinc chloride complexes of composite structure.
Despite the fact that the samples were not washed after the tests, the amount of chloride on the surface is 14 times less than that of zinc—hence the assumption that the surface zinc presents in the form of chloride should be rejected. The observed duplicated peaks of Cu2p and Zn2p are probably due to local different charging of the surface of the samples, since during the tests, it is covered with a thick oxide layer and some spots of surface become non-conductive. On the other hand, leaching of some atoms creates vacancies [32,54] around left atoms and therefore they experience different charging that results in doubling the spectrum. But this question requires more thorough approach.
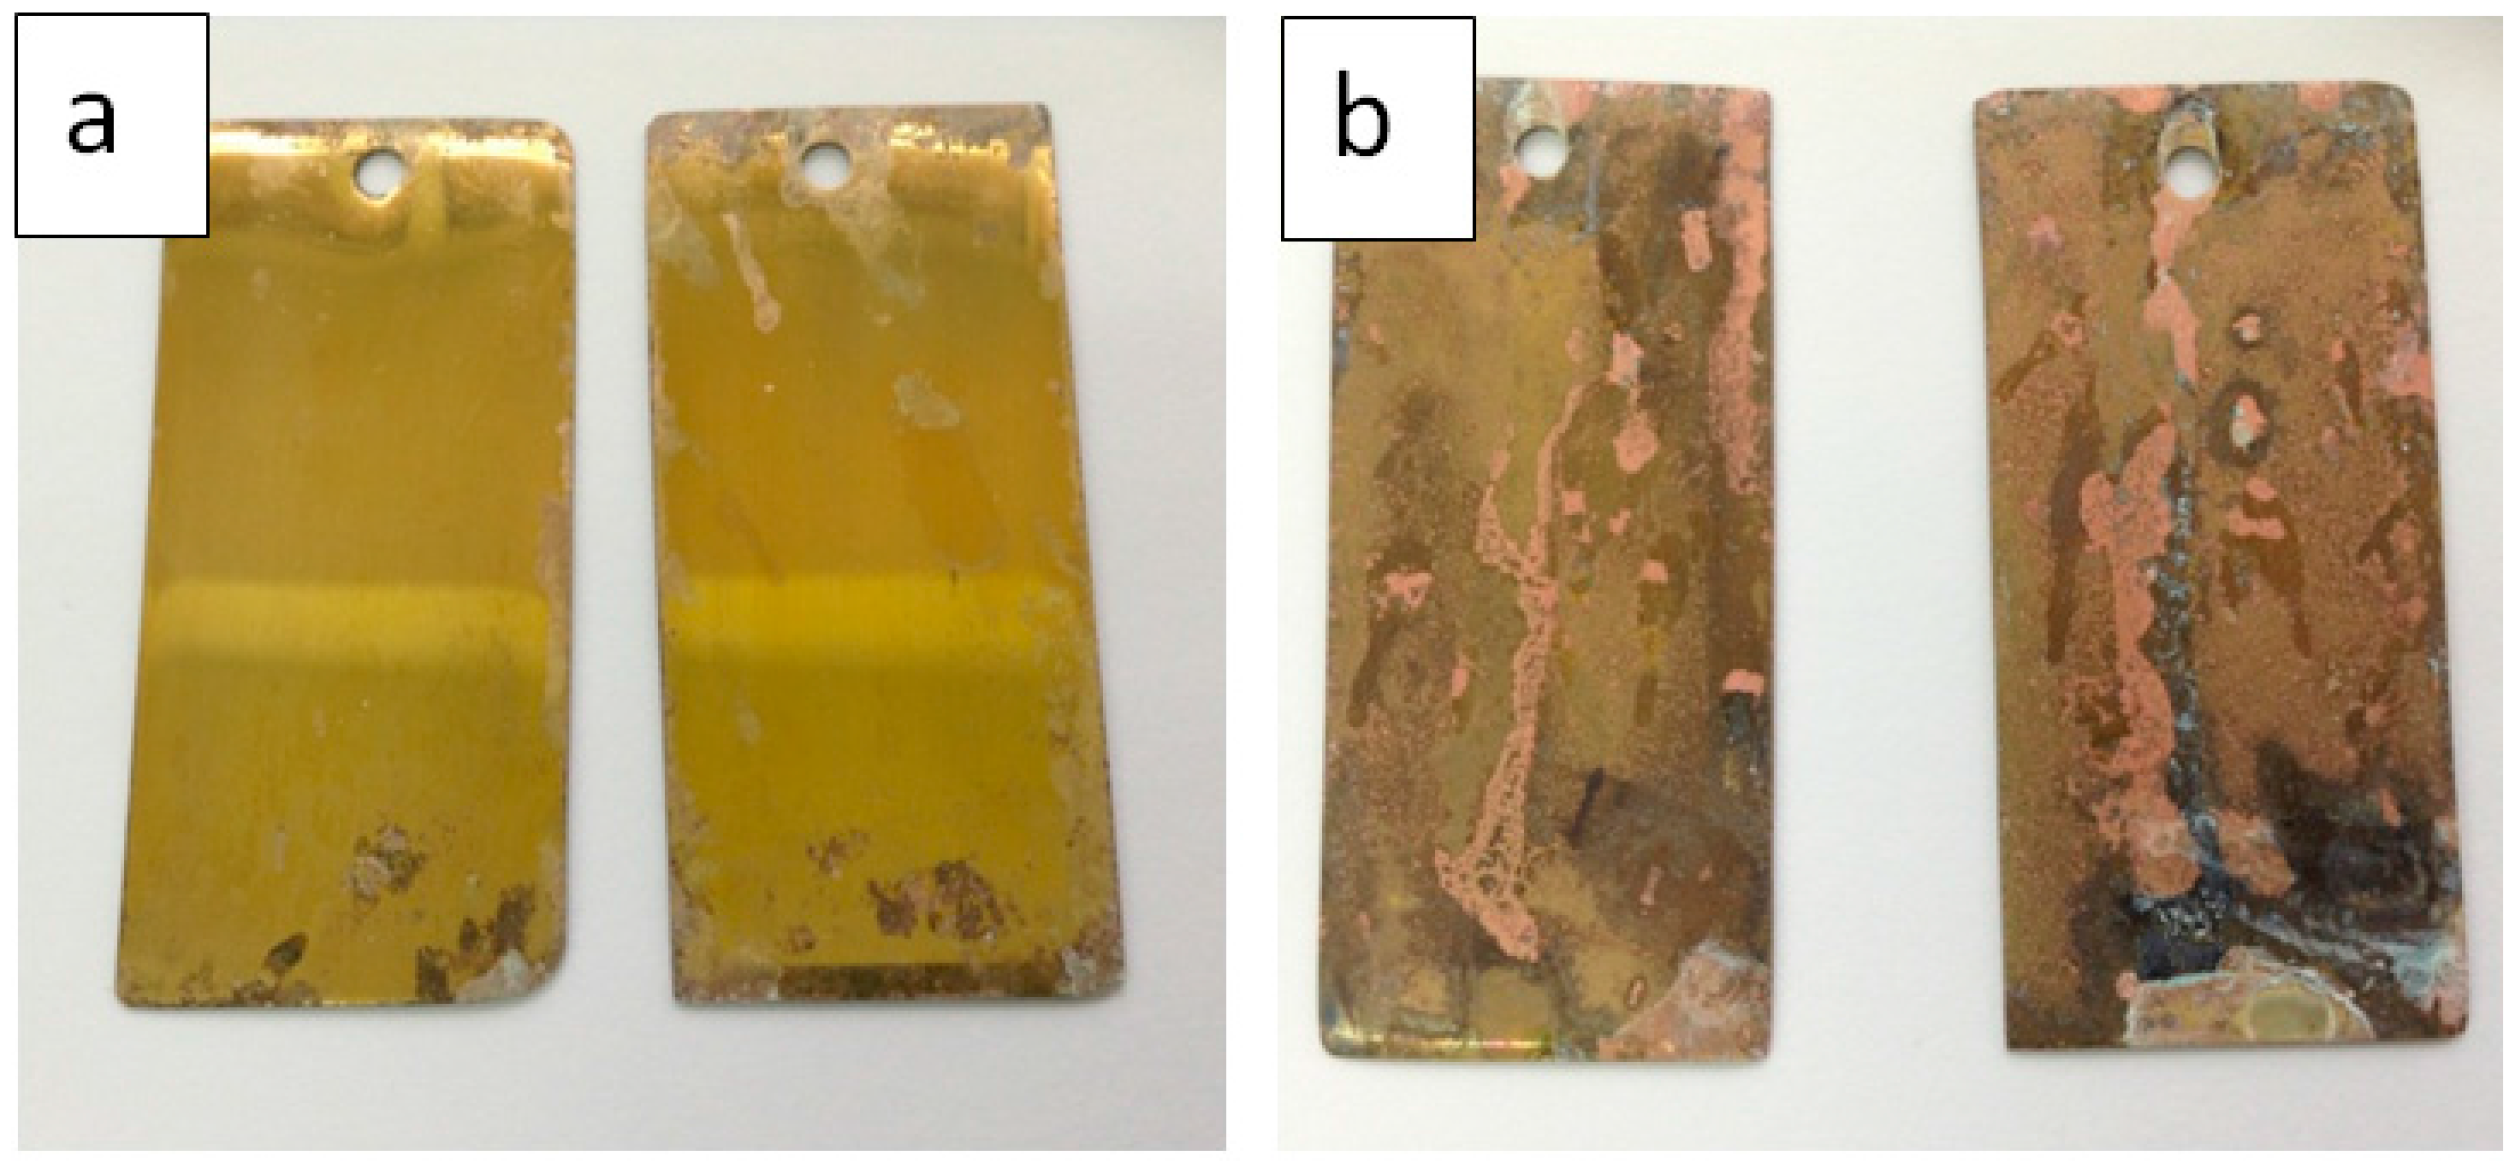
To show the advantage in the efficiency of protection properties of MPATA over other well-known corrosion inhibitors, we have carried out the same corrosion tests with brass plates protected by 2-mercaptobenzotiazole (MBT) (shown in Figure 12a) and by 5(6)-mononitrobenzimidazole (MNBI) (shown in Figure 12b). Samples protected by MBT remain glossy, but have darker shade in comparison with ones protected by MPATA. They also have more local corrosion spots. It should be pointed out that MBT has very low solubility in neutral solutions and the whole amount of a substance did not solve completely. On the other hand, MNBI dissolved instantly, but failed to protect brass even after 1 day of salt spray test. Nevertheless, it should be mentioned that all three substances, according to XPS, formed almost the same thickness of metal-organic protective layer (≈4 nm).
Thus, corrosion tests have shown that the MPATA may protect brass surfaces better than MBT and much better than MNBI that goes in parallel with decreasing the free adsorption energy of these compounds on copper in neutral solutions [41].
4. Conclusions
- Electrochemical measurements have shown that addition of 1 mM MPATA results in complete suppression of anodic dissolution of copper: the main component of the brass alloy.
- The analysis of X-ray photoelectron spectra had shown that treatment of brass in MPATA solution results in formation a protective film consisted of the complexes [Cu1−xZnxMPATA] (where x < 0.2) whose thickness does not exceed 3–3.5 nm.
- During corrosion tests, it was found that even after 5 days in a salt fog chamber with hourly spraying, brass samples protected with an inhibitor retain their gloss and have damage less than 1% of the surface.
Acknowledgments
Financial support by grant No. 16-03-00646 given by the Russian Foundation of Basic Research is greatly acknowledged. This publication was also supported by the Ministry of Education and Science of the Russian Federation (the Agreement number 02.a03.21.0008).
Author Contributions
Leonid P. Kazansky conceived, designed the study and analyzed the data; Khidmet S. Shikhaliev synthesized and contributed reagents, discussed the data; Andrei Y. Potapov and Lyudmila V. Sapronova analyzed reagents and prepared the samples; Ivan А. Arkhipushkin performed the potentiometry, corrosion, XPS–experiments and wrote the paper.
Conflicts of Interest
The authors declare no conflict of interest.
References
- Newman, R.C.; Burstein, G.T. The anodic behavior of freshly generated α-brass surfaces. Corros. Sci. 1981, 21, 119–128. [Google Scholar] [CrossRef]
- Polunin, A.V.; Pschelnikov, A.P.; Losev, V.V.; Marshakov, I.K. Electrochemical studies of the kinetics and mechanism of brass dezincification. Electrochim. Acta 1982, 27, 467–475. [Google Scholar] [CrossRef]
- Dinnappa, R.K.; Mayanna, S.M. The dezincification of brass and its inhibition in acidic chloride and sulphate solutions. Corros. Sci. 1987, 27, 349–361. [Google Scholar] [CrossRef]
- Trethewey, R.; Pinwill, I. The dezincification of free-machining brasses in sea water. Surf. Coat. Technol. 1987, 30, 289–307. [Google Scholar] [CrossRef]
- Zou, J.; Wang, D.; Qiu, W. Solid-state diffusion during the selective dissolution of brass: Chronoamperometry and positron annihilation study. Electrochim. Acta 1997, 42, 1733–1737. [Google Scholar] [CrossRef]
- Morales, J.; Esparza, P.; Gonzales, S.; Vasquez, L.; Salvarezza, R.C.; Arvia, A.J. Kinetics and mechanism of α-brass dealloying in aqueous 0.5 M sodium chloride solution derived from combined scanning tunneling microscopy and electrochemical data. Langmuir 1996, 12, 500–507. [Google Scholar] [CrossRef]
- Kumar, S.; Sankara Narayanan, T.S.N.; Manimaran, A.; Suresh Kumar, M. Effect of lead content on the dezincification behavior of leaded brass in neutral and acidified 3.5% NaCl solution. Mater. Chem. Phys. 2007, 106, 134–141. [Google Scholar] [CrossRef]
- Kabasakaloglu, M.; Kıyak, T.; Sendil, O.; Asan, A. Electrochemical behavior of brass in 0.1 M NaCl. Appl. Surf. Sci. 2002, 193, 167–174. [Google Scholar] [CrossRef]
- Karpagavalli, R.; Balasubramaniam, R. Development of novel brasses to resist dezincification. Corros. Sci. 2007, 49, 963–979. [Google Scholar] [CrossRef]
- Cocco, F.; Elsener, B.; Fantauzzi, M.; Atzei, D.; Rossi, A. Nanosized surface films on brass alloys by XPS and XAES. RSC Adv. 2016, 6, 31277. [Google Scholar] [CrossRef]
- Hollander, O.; May, R.C. The Chemistry of azole copper corrosion inhibitors in cooling waters. Corrosion 1985, 41, 39–45. [Google Scholar] [CrossRef]
- De Costa, S.L.F.A.; Agostinho, S.M.L.; Nobe, K. Rotating ring-disk electrode studies of Cu-Zn alloy electrodissolution in 1M HCl effect of benzotriazole. J. Electrochem. Soc. 1993, 140, 3483–3488. [Google Scholar] [CrossRef]
- Shih, H.C.; Tzou, R.J. Effect of benzotriazole on the stress corrosion cracking and the electrochemical polarization of 70/30 brass in fluoride solutions. J. Electrochem. Soc. 1991, 138, 958–961. [Google Scholar] [CrossRef]
- Otieno-Alego, V.; Schweinsberg, D.P.; Hope, G.A.; Notoya, T. An electrochemical and SERS study of the effect of 1-[N,N-bis-(hydroxyethyl)aminomethyl]-benzotriazole on the acid corrosion and dezincification of 60/40 brass. Corros. Sci. 1996, 38, 213–223. [Google Scholar] [CrossRef]
- Fenelon, M.; Breslin, C.B. An electrochemical study of the formation of benzotriazole surface films on copper, zinc and a copper-zinc alloy. J. Appl. Electrochem. 2001, 31, 509–516. [Google Scholar] [CrossRef]
- Nagiub, A.; Mansfeld, F. Evaluation of corrosion inhibition of brass in chloride media using EIS and ENA. Corros. Sci. 2001, 43, 2147–2171. [Google Scholar] [CrossRef]
- Kosec, T.; Merl, D.K.; Milošev, I. Impedance and XPS study of benzotriazole films formed on copper, copper-zinc alloys and zinc in chloride solution. Corros. Sci. 2008, 50, 1987–1997. [Google Scholar] [CrossRef]
- Mamas, S.; Kiyak, T.; Kabasakaloglu, M.; Koc, A. The effect of benzotriazole on brass corrosion. Mater. Chem. Phys. 2005, 93, 41–47. [Google Scholar] [CrossRef]
- Kosec, T.; Milošev, I.; Pihlar, B. Benzotriazole as an inhibitor of brass corrosion in chloride solution. Appl. Surf. Sci. 2007, 253, 8863–8873. [Google Scholar] [CrossRef]
- Milošev, I.; Kosec, T. Electrochemical and spectroscopic study of benzotriazole films formed on copper, copper-zinc alloys and zinc in chloride solution. Chem. Biochem. Eng. Q. 2009, 23, 53–60. [Google Scholar]
- Gerengi, H.; Darowicki, K.; Bereket, G.; Slepski, P. Evaluation of corrosion inhibition of brass-118 in artificial seawater by benzotriazole using dynamic EIS. Corros. Sci. 2009, 51, 2573–2579. [Google Scholar] [CrossRef]
- Antonijevic, M.M.; Bogdanovic, G.D.; Radovanovic, M.B.; Petrovic, M.B.; Stamenkovic, A.T. Influence of pH and chloride ions on electrochemical behavior of brass in alkaline solution. Int. J. Electrochem. Sci. 2009, 4, 654–661. [Google Scholar]
- Zerjav, G.; Milošev, I. Protection of copper against corrosion in simulated urban rain by the combined action of benzotriazole, 2-mercaptobenzimidazole and stearic acid. Corros. Sci. 2015, 98, 180–191. [Google Scholar] [CrossRef]
- Ravichandran, R.; Rajendran, N. Influence of benzotriazole derivatives on the dezincification of 65–35 brass in sodium chloride. Appl. Surf. Sci. 2005, 239, 182–192. [Google Scholar] [CrossRef]
- Cohen, S.L.; Brusic, V.A.; Kaufman, F.B.; Frankel, G.S.; Motakef, S.; Rush, B. X-ray photoelectron spectroscopy and ellipsometry studies of the electrochemically controlled adsorption of benzotriazole on copper surfaces. J. Vac. Sci. Technol. 1990, A8, 2417–2424. [Google Scholar] [CrossRef]
- Yanardag, T.; Özbay, S.; Dinçer, S.; Aksüt, A.A. Corrosion inhibition efficiency of benzimidazole and benzimidazole derivatives for zinc, copper and brass. Asian J. Chem. 2012, 24, 47–52. [Google Scholar]
- Gao, G.; Liang, C.H. 1,3-Bis-diethylamino-propan-2-ol as volatile corrosion inhibitor for brass. Corros. Sci. 2007, 49, 3479–3493. [Google Scholar] [CrossRef]
- Tuck, C.D.S.; Powell, C.A.; Nuttall, J. Corrosion of Copper and Its Alloys; Elsevier: Houston, TX, USA, 2010; pp. 1938–1968. [Google Scholar]
- Milic, S.M.; Antonijevic, M.M. Some aspects of copper corrosion in presence of benzotriazole and chloride ions. Corros. Sci. 2009, 51, 28–34. [Google Scholar] [CrossRef]
- Karpagavalli, R.; Cairns Darran, R.; Rajeswari, S. Synergistic inhibition effect of 2-mercaptobenzothiazole and Tween-80 on the corrosion of brass in NaCl solution. Appl. Surf. Sci. 2008, 254, 4483–4493. [Google Scholar]
- Ebrahimzadeha, M.; Gholami, M.; Momeni, M.; Kosari, A.; Moayeda, M.H.; Davoodi, A. Theoretical and experimental investigations on corrosion controlof 65Cu-35Zn brass in nitric acid by two thiophenolderivatives. Appl. Surf. Sci. 2015, 332, 384–392. [Google Scholar] [CrossRef]
- Qiu, P.; Leygraf, C. Initial oxidation of brass induced by humidified air. Appl. Surf. Sci. 2011, 258, 1235–1241. [Google Scholar] [CrossRef] [PubMed]
- Jiang, L.; Lan, Y.; He, Y.; Li, Y.; Luo, J. 1,2,4-Triazole as a corrosion inhibitor in copper chemical mechanical polishing. Thin Solid Films 2014, 556, 395–404. [Google Scholar] [CrossRef]
- Mountassir, Z.; Srhiri, A. Electrochemical behaviour of Cu-40Zn in 3% NaCl solution polluted by sulphides: Effect of aminotriazole. Corros. Sci. 2007, 49, 1350–1361. [Google Scholar] [CrossRef]
- Rajkumar, G.; Sethuraman, M.G. Corrosion protection ability of self-assembled monolayer of 3-amino-5-mercapto-1,2,4-triazole on copper electrode. Thin Solid Films 2014, 562, 32–36. [Google Scholar] [CrossRef]
- Bag, S.K.; Chakraborty, S.B.; Roy, A.; Chaudhuri, S.R. 2-Aminobenzimidazole as corrosion inhibitor for 70–30 brass in ammonia. Br. Corros. J. 1996, 31, 207–212. [Google Scholar] [CrossRef]
- Morales, J.; Esparza, P.; Fernandez, G.T.; Gonzalez, S.; Garcia, J.E.; Caceres, J.; Salvarezza, R.C.; Arvia, A.J. A comparative study on the passivation and localized corrosion of α- and β-brass in borate buffer solutions containing sodium chloride-II. X-ray photoelectron and Auger electron spectroscopy data. Corros. Sci. 1995, 37, 231–239. [Google Scholar] [CrossRef]
- Al-kharafi, F.M.; El-Shamy, A.M.; Ateya, B.G. Comparative effects of tolytriazole and benzotriazole against sulfide attack on copper. Int. J. Electrochem. Sci. 2009, 4, 1351–1364. [Google Scholar]
- Viswanathan, S.S. A review on recent patents in corrosion Inhibitors. Recent Pat. Corros. Sci. 2010, 2, 6–12. [Google Scholar]
- Kuznetsov, Y.I.; Agafonkina, M.O.; Shikhaliev, K.S.; Andreeva, N.P.; Potapov, A.Y. Adsorption and passivation of copper by triazoles in neutral aqueous solution. Int. J. Corros. Scale Inhib. 2014, 3, 137–148. [Google Scholar] [CrossRef]
- Agafonkina, M.O.; Kuznetsov, Y.I.; Andreeva, N.P.; Shikhaliev, K.S.; Potapov, A.Y. Adsorption and passivation of copper by S-containing heterocyclic compounds in neutral aqueous solution. Corros. Mater. Prot. 2016, 3, 29–38. [Google Scholar]
- Makarychev, Y.B.; Arkhipushkin, I.A.; Karpukhina, T.A.; Shikhaliev, H.S.; Kazansky, L.P. Formation of protective layers by some azoles on zinc in aqueous solutions. Corros. Mater. Prot. 2016, No 2, 20–27. [Google Scholar]
- Arkhipushkin, I.A.; Shikhaliev, K.S.; Vagramyan, T.A.; Kazansky, L.P. Adsorption of 5-mercaptopentyl-3-amino-1,2,4-triazole on copper in neutral solutions. Corros. Mater. Prot. 2016, 7, 17–23. [Google Scholar]
- Shirley, D.A. High-resolution X-ray photoemission spectrum of the valence bands of gold. Phys. Rev. B 1972, 5, 4709–4713. [Google Scholar] [CrossRef]
- Scofield, H. Hartree-Slater subshell photoionization cross-sections at 1254 and 1487 eV. J. Electron Spectrosc. Relat. Phenom. 1976, 8, 129–137. [Google Scholar] [CrossRef]
- Mohai, M. MultiQuant: Multimodel XPS quantification software. Surf. Interface Anal. 2004, 36, 828–832. [Google Scholar] [CrossRef]
- Cumpson, P.J.; Seah, M.P. Elastic scattering corrections in AES and XPS. II. Estimating attenuation lengths and conditions required for their valid use in overlayer/substrate experiments. Surf. Interface Anal. 1997, 25, 430–446. [Google Scholar] [CrossRef]
- Speckmann, H.D.; Haupt, S.; Strehblow, H.H. A quantitative surface analytical study of electrochemically-formed copper oxides by XPS and X-ray-induced Auger spectroscopy. Surf. Interface Anal. 1988, 11, 148–155. [Google Scholar] [CrossRef]
- Milošev, I.; Strehblow, H.-H. Electrochemical behavior of Cu-xZn alloys in borate buffer solution at pH 9.2. J. Electrochem. Soc. 2003, 150, B517–B524. [Google Scholar]
- Arjmand, F.; Adriaens, A. Influence of pH and chloride concentration on the corrosion of unalloyed copper in NaCl solution: A comparative study between the micro and macro scales. Materials 2012, 5, 2439–2464. [Google Scholar] [CrossRef] [Green Version]
- Milošev, I.; KosecMikic, T.; Gaberscek, M. The effect of Cu-rich sub-layer on the increased corrosion resistance of Cu-xZn alloys in chloride containing borate buffer. Electrochim. Acta 2006, 52, 415–426. [Google Scholar] [CrossRef]
- Kazansky, L.P.; Pronin, Y.E.; Arkhipushkin, I.A. XPS study of adsorption of 2-mercaptobenzothiazole on a brass surface. Corros. Sci. 2014, 89, 21–29. [Google Scholar] [CrossRef]
- Ismail, K.M.; El-Egami, S.S.; Abdelatah, M. Effect of Zn and Pb as alloying elements on the electrochemical behavior of brass in borate solution. J. Appl. Electrochem. 2001, 31, 663–670. [Google Scholar] [CrossRef]
- Kear, G.; Barker, B.D.; Walsh, F.C. Electrochemical corrosion of unalloyed copper in chloride media—A critical review. Corros. Sci. 2004, 46, 109–135. [Google Scholar] [CrossRef]
- Otmacic, H.; Telegdi, J.; Papp, K.; Stupnišek-Lisac, E. Protective properties of an inhibitor layer formed on copper in neutral chloride solution. J. Appl. Electrochem. 2004, 34, 545–550. [Google Scholar] [CrossRef]
- Finšgar, M.; Peljhan, S.; Kokalj, A.; Kovac, J.; Milošev, I. Determination of the Cu2O thickness on btah-inhibited copper by reconstruction of auger electron spectra. J. Electrochem. Soc. 2010, 157, C295–C301. [Google Scholar] [CrossRef]
- Chadwick, D.; Hashemi, T. Electron spectroscopy of corrosion inhibitors: Surface films formed by 2-mercaptobenzothiazole and 2-mercaptobenzimidazole on copper. Surf. Sci. 1979, 89, 649–659. [Google Scholar] [CrossRef]
- Finšgar, M. 2-Mercaptobenzimidazole as a copper corrosion inhibitor: Part II. Surface analysis using X-ray photoelectron spectroscopy. Corros. Sci. 2013, 72, 90–98. [Google Scholar] [CrossRef]
- Hashemi, T.; Hogarth, C.A. X-ray induced Auger spectroscopy of the surface films formed by benzotriazole on zinc and zinc alloys. Spectrochim. Acta 1988, 43, 783–787. [Google Scholar] [CrossRef]
- Finšgar, M.; Milošev, I. Inhibition of copper corrosion by 1,2,3-benzotriazole: Areview. Corros. Sci. 2010, 52, 2737–2749. [Google Scholar] [CrossRef]
- Antonijevic, M.M.; Petrovic, M.B. Copper corrosion inhibitors. A review. Int. J. Electrochem. Sci. 2008, 3, 1–28. [Google Scholar]
- Kuznetsov, Y.I.; Kazansky, L.P. Physico-chemical aspects of metal protection by azoles as corrosion inhibitors. Russ. Chem. Rev. 2008, 77, 219–232. [Google Scholar] [CrossRef]
- Al-Kharafi, F.M.; Ateya, B.G.; Abd Allah, R.M. Selective dissolution of brass in saltwater. J. Appl. Electrochem. 2004, 34, 47–53. [Google Scholar] [CrossRef]
Figure 1.
Molecular structure of 5-mercaptopentyl-3-amino-1,2,4-triazole (MPATA).
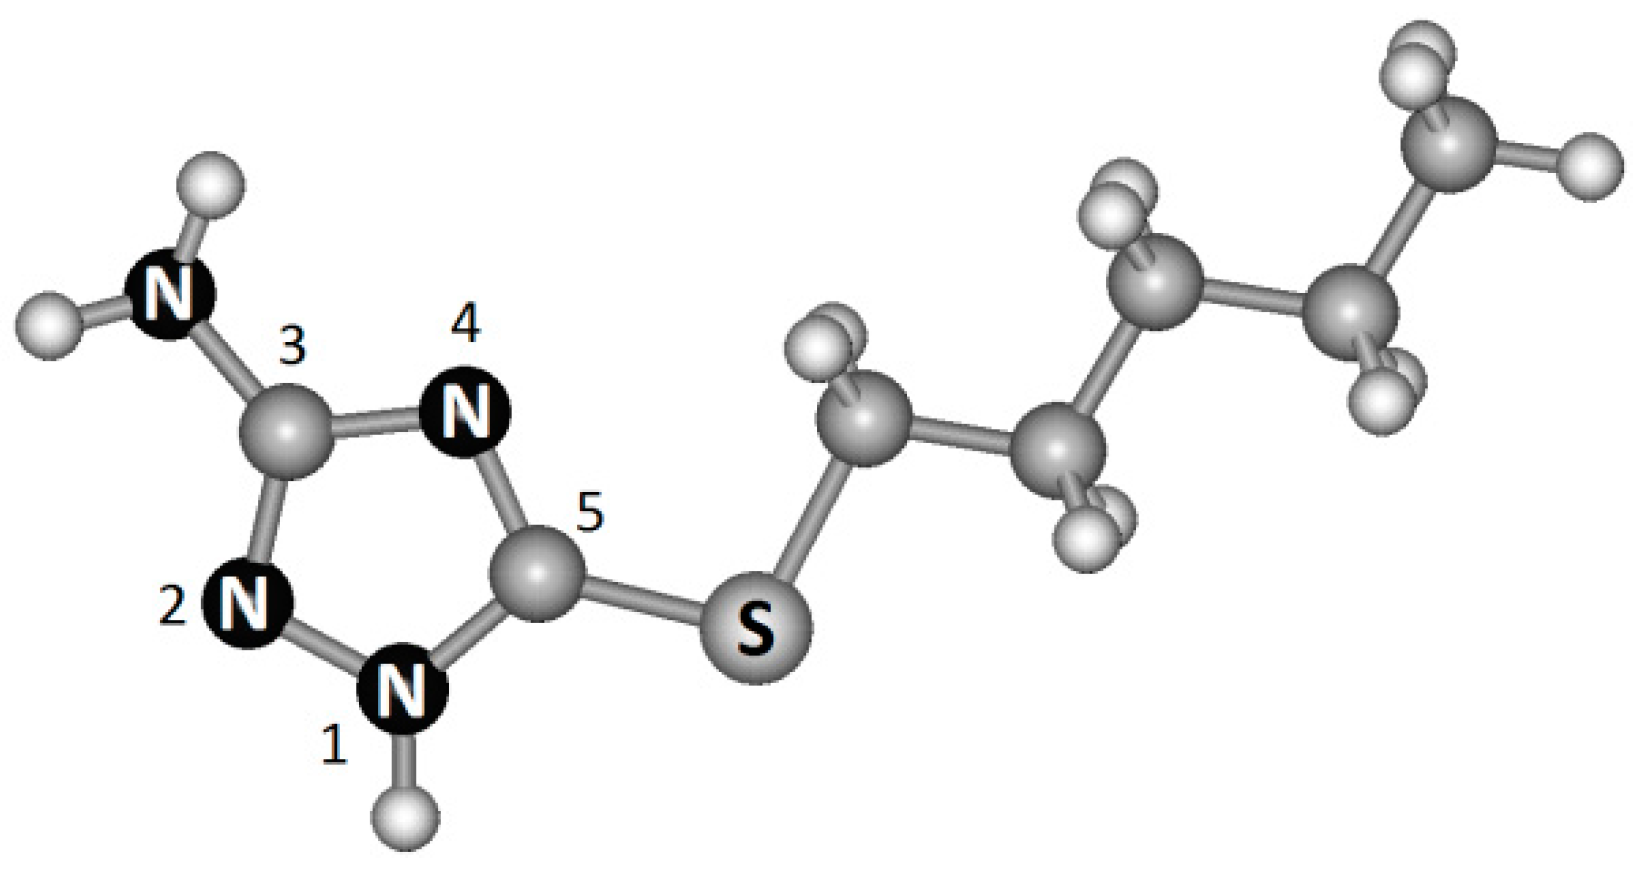
Figure 2.
The anodic and cathodic polarization curves of brass in borate buffer solution depending on MPATA concentration (0.01 M NaCl pH 7.4).
Figure 2.
The anodic and cathodic polarization curves of brass in borate buffer solution depending on MPATA concentration (0.01 M NaCl pH 7.4).
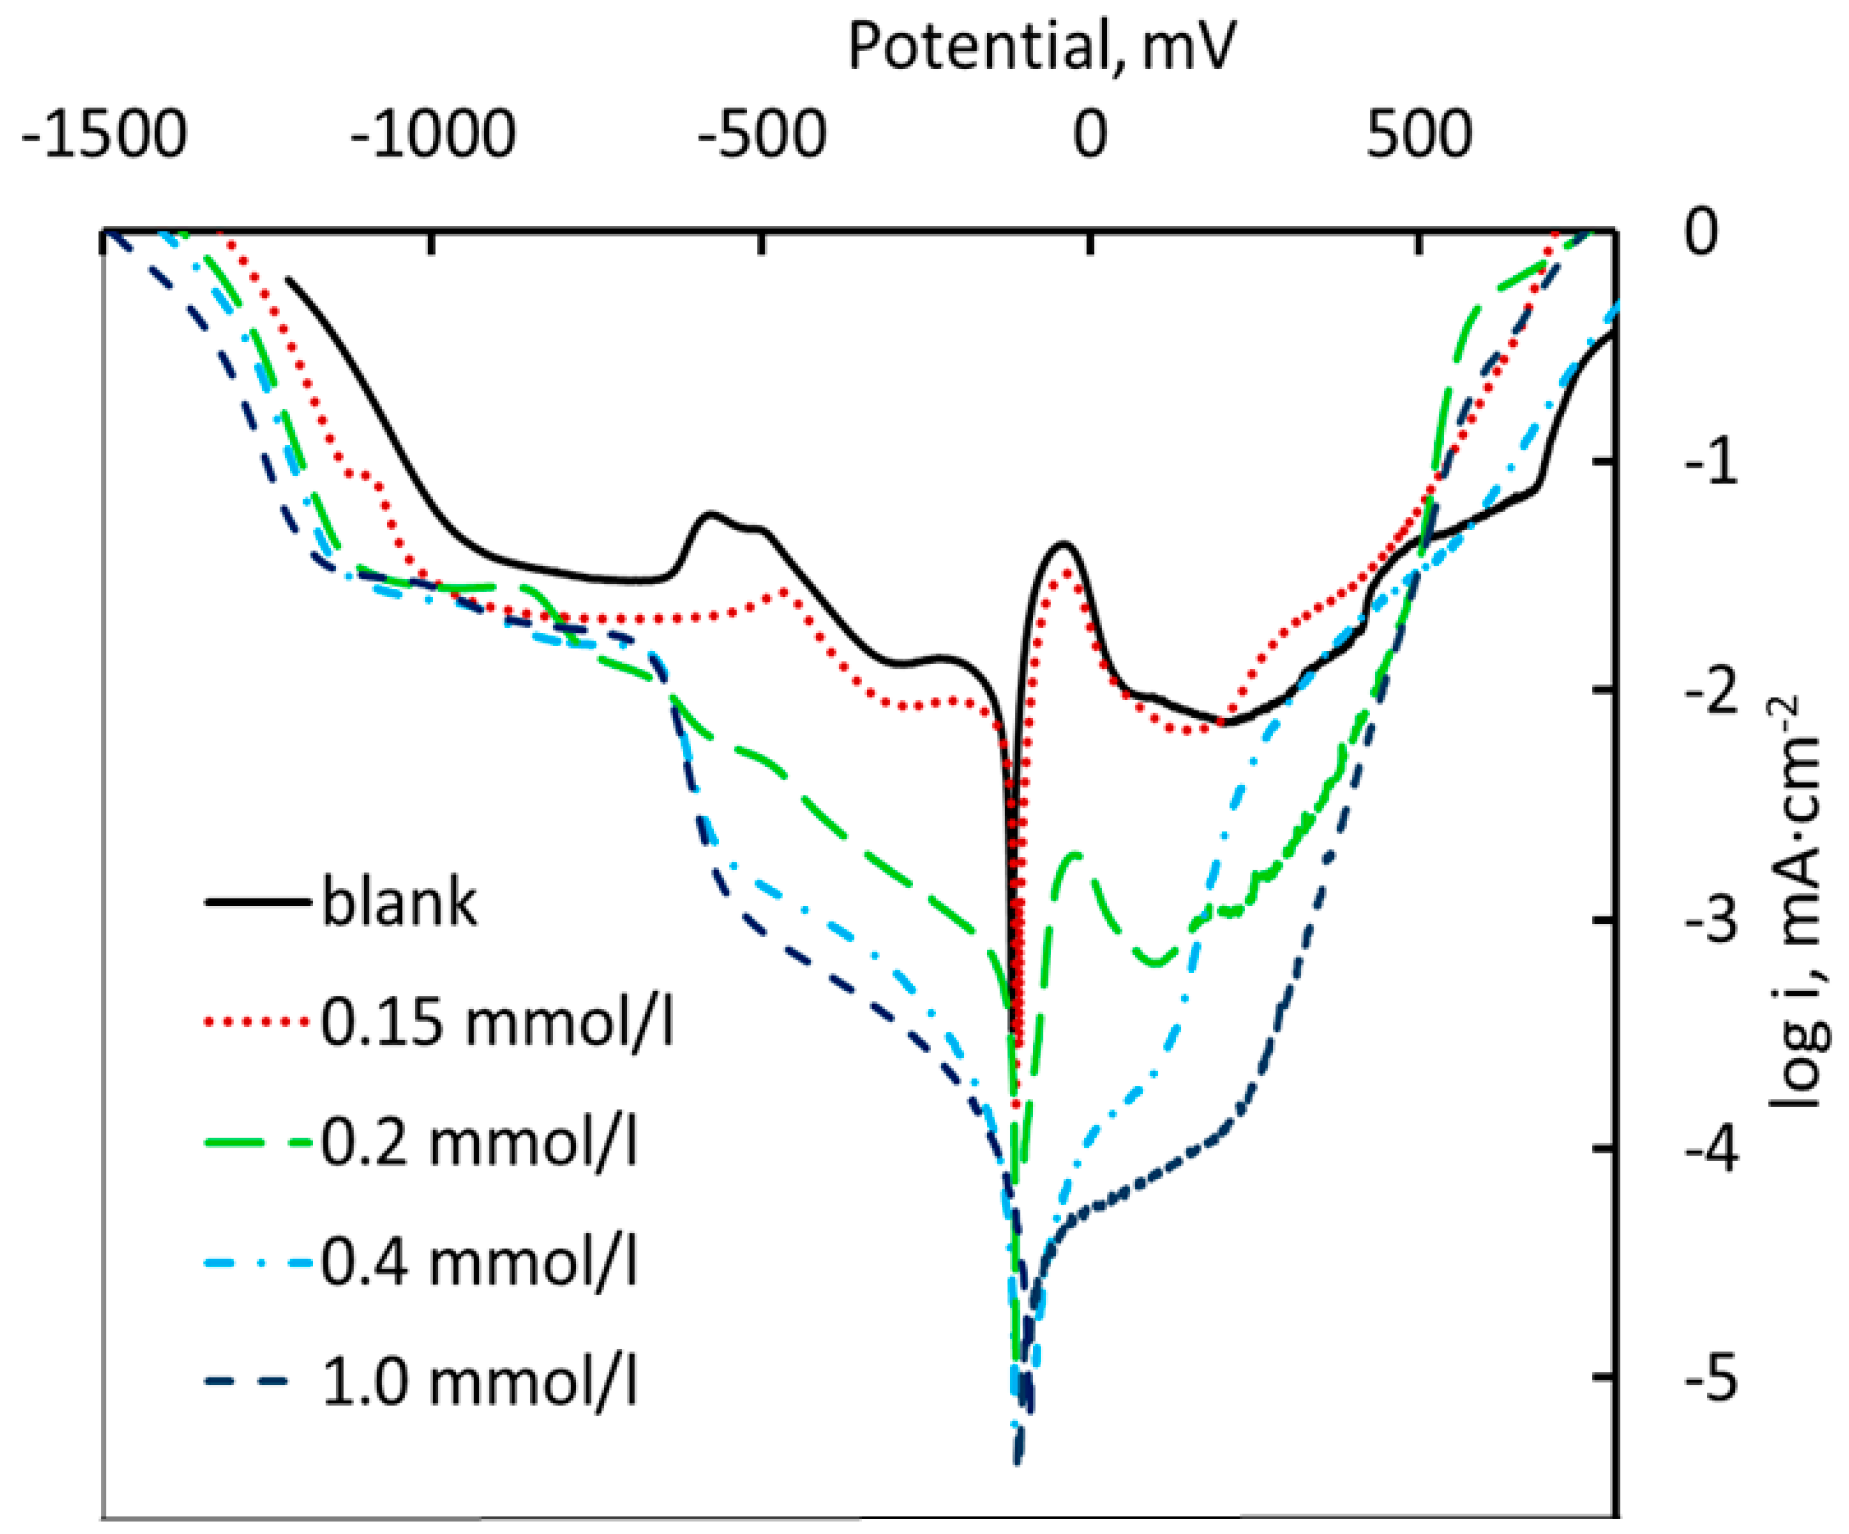
Figure 3.
X-ray photoelectron spectroscopy (XPS) of N1s electrons. a: MPATA powder; b: on the surface of brass after 17 h immersion in the buffer solution with 0.01 mM MPATA.
Figure 3.
X-ray photoelectron spectroscopy (XPS) of N1s electrons. a: MPATA powder; b: on the surface of brass after 17 h immersion in the buffer solution with 0.01 mM MPATA.

Figure 4.
XPS (X-ray photoelectron spectroscopy) of S2p electrons on the surface of brass after 17 h immersion in the buffer solution with 0.01 mM MPATA.
Figure 4.
XPS (X-ray photoelectron spectroscopy) of S2p electrons on the surface of brass after 17 h immersion in the buffer solution with 0.01 mM MPATA.
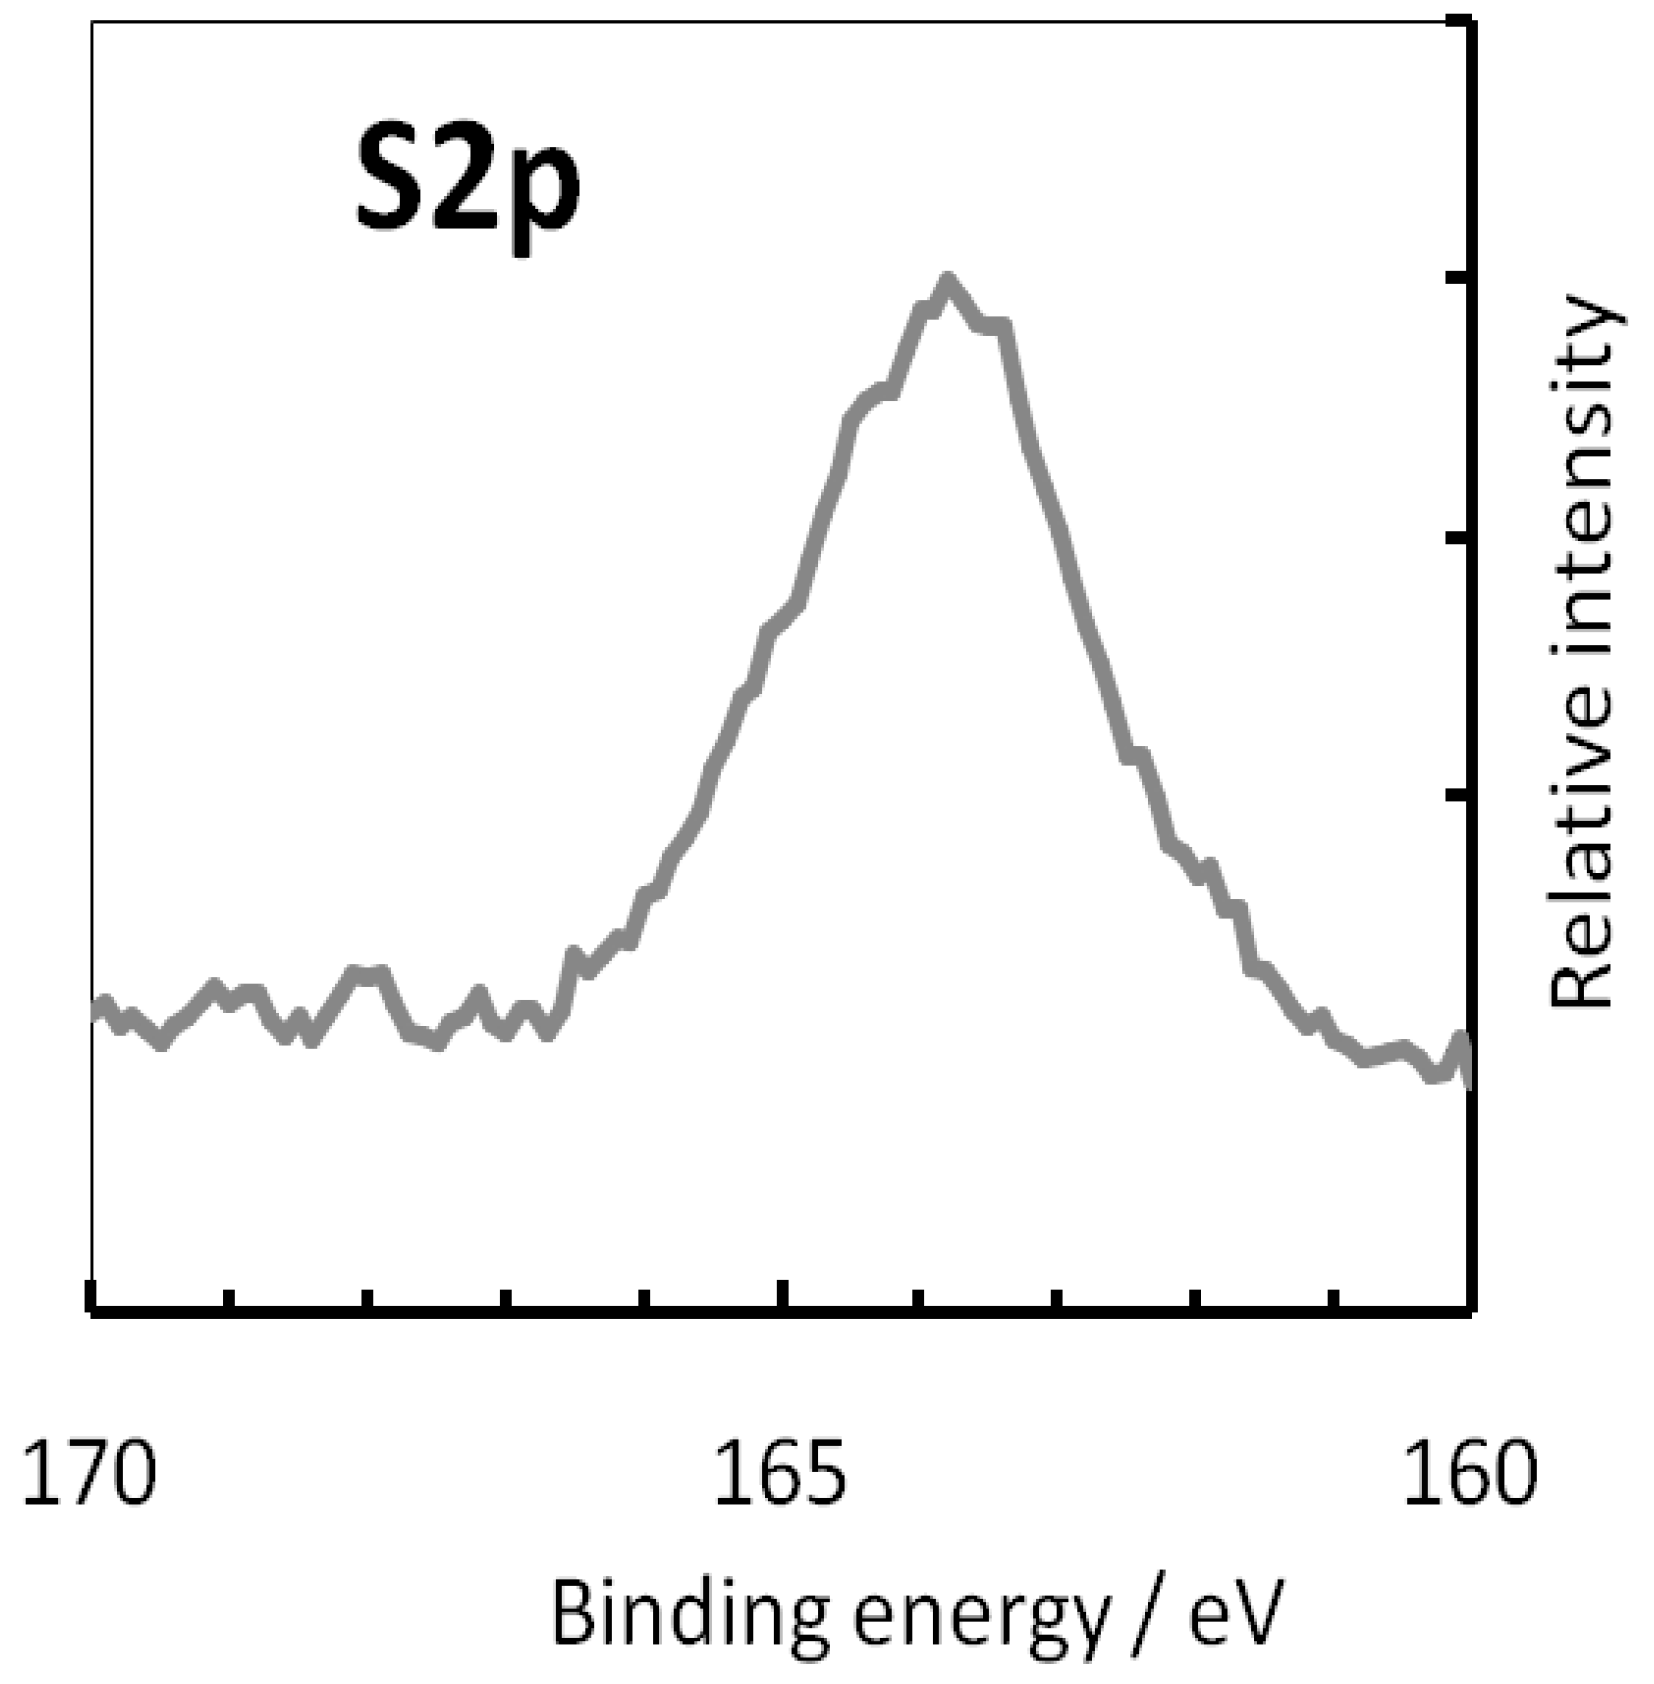
Figure 5.
Deconvolution of the Auger CuLMM spectra into individual components for samples exposed in 0.01 mM MPATA solution: (a) 1 min; (b) 17 h.
Figure 5.
Deconvolution of the Auger CuLMM spectra into individual components for samples exposed in 0.01 mM MPATA solution: (a) 1 min; (b) 17 h.

Figure 6.
Evolution of the Auger CuLMM spectrum, depending on exposure time of the brass sample in 0.01 mM MPATA solution (broken line presents position of CuMPATA complex).
Figure 6.
Evolution of the Auger CuLMM spectrum, depending on exposure time of the brass sample in 0.01 mM MPATA solution (broken line presents position of CuMPATA complex).

Figure 7.
Deconvolution of the Auger ZnLMM spectra into individual components for samples exposed in 0.01 mM MPATA solution after 1 min (a) and after 17 h (b).
Figure 7.
Deconvolution of the Auger ZnLMM spectra into individual components for samples exposed in 0.01 mM MPATA solution after 1 min (a) and after 17 h (b).

Figure 8.
Thickness of the complex and oxide films formed on brass surface depending on exposure time in 0.01 mM MPATA solution.
Figure 8.
Thickness of the complex and oxide films formed on brass surface depending on exposure time in 0.01 mM MPATA solution.

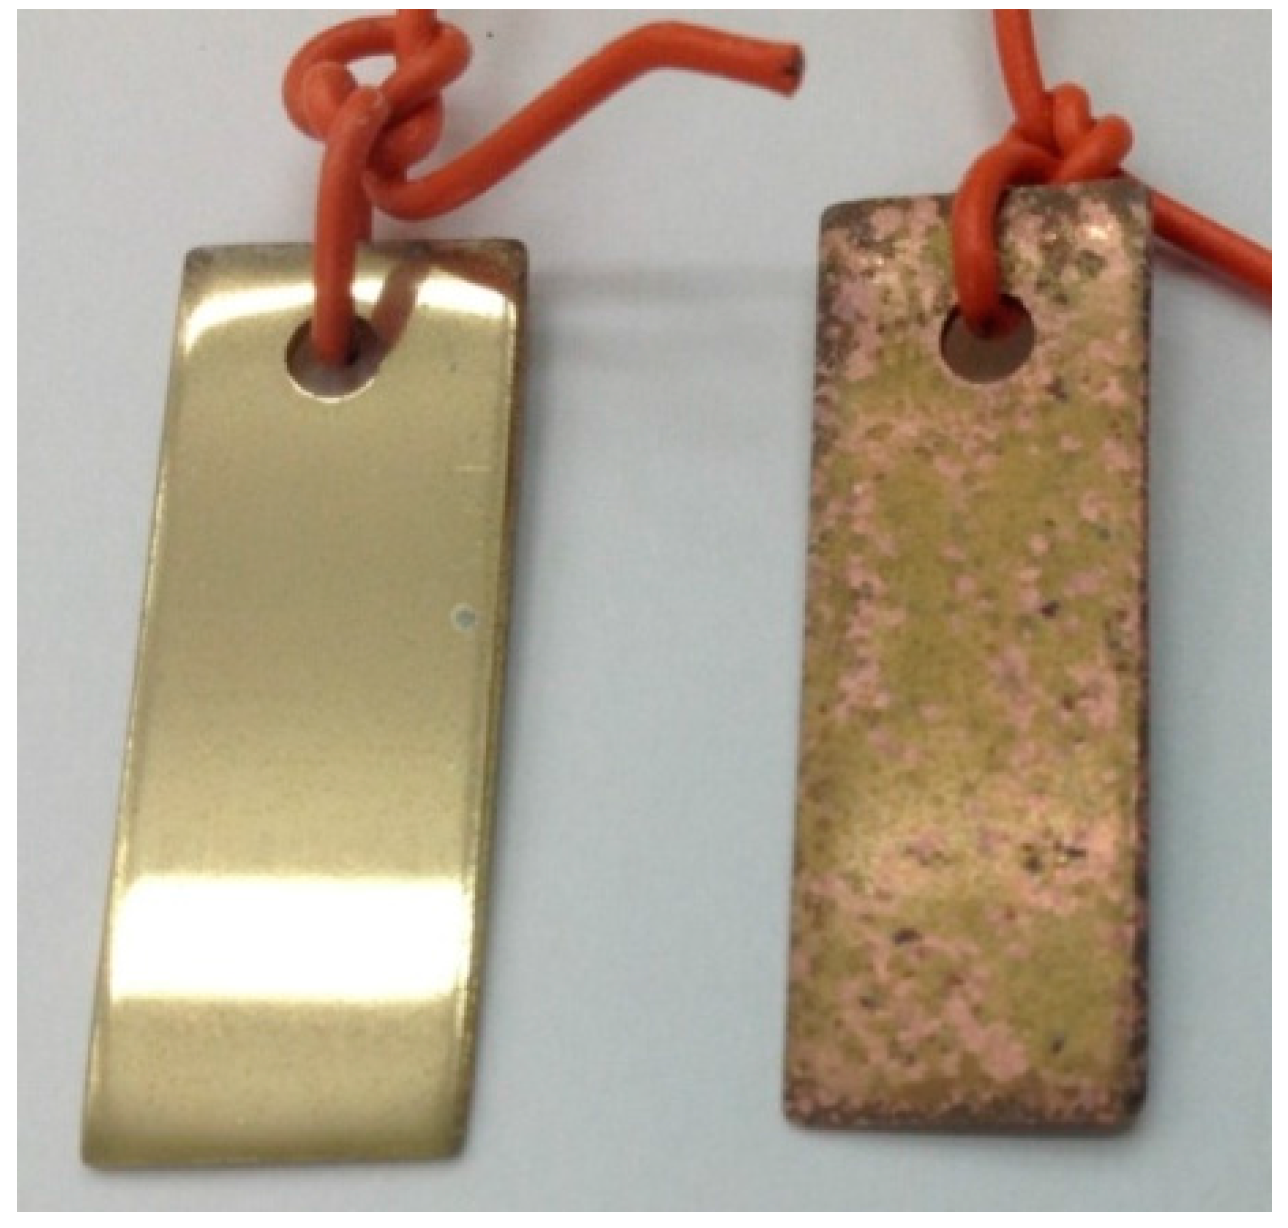
Figure 9.
View of samples after corrosion tests: (a) samples with inhibitor and without after 4 cycles of tests; (b) sample with the applied inhibitor after 135 test cycles (5 days).
Figure 9.
View of samples after corrosion tests: (a) samples with inhibitor and without after 4 cycles of tests; (b) sample with the applied inhibitor after 135 test cycles (5 days).
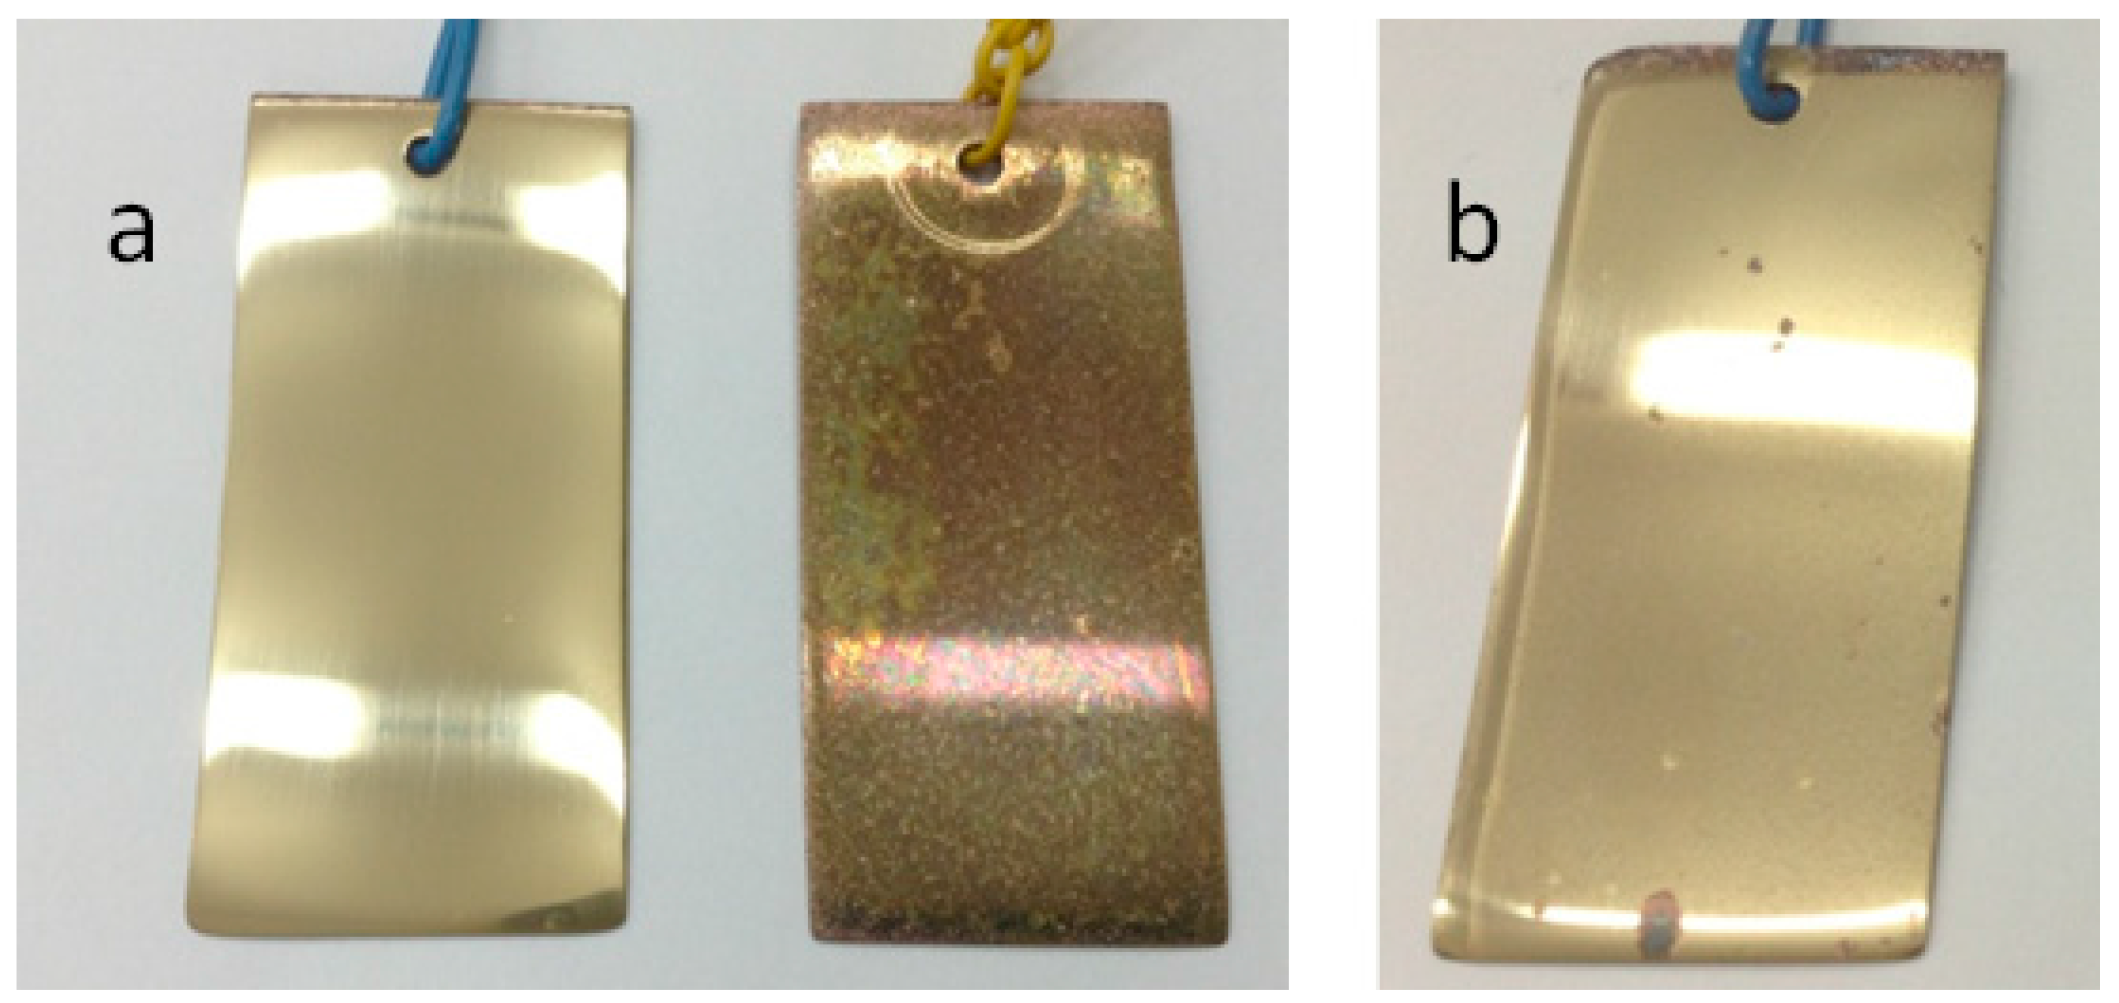
Figure 10.
Samples (inhibited-left, uninhibited-right) for XPS-studies after 20 cycles in the salt fog chamber.
Figure 10.
Samples (inhibited-left, uninhibited-right) for XPS-studies after 20 cycles in the salt fog chamber.

Figure 11.
Composition of brass surface by XPS after corrosion tests in salt fog chamber.

Figure 12.
Brass samples after 5 days of salt spray corrosion test: (a) sample treated with MBT; (b) sample treated with MNBI.
Figure 12.
Brass samples after 5 days of salt spray corrosion test: (a) sample treated with MBT; (b) sample treated with MNBI.


Table 1.
Composition of Zn and Cu in surface layers (at %) after brass exposition in borate buffer solution (0.01 mM MPATA).
Table 1.
Composition of Zn and Cu in surface layers (at %) after brass exposition in borate buffer solution (0.01 mM MPATA).
| Time | Zn(OH)2 | ZnO | Zn(m) | CuMPATA | Cu2O | Cu(m) |
|---|---|---|---|---|---|---|
| 1 min | 4.42 | 0.30 | 2.64 | 12.80 | 37.78 | 42.06 |
| 15 min | 1.80 | 0.40 | 2.40 | 30.26 | 37.07 | 28.06 |
| 30 min | 1.50 | 0.58 | 2.07 | 33.68 | 31.61 | 30.56 |
| 120 min | 2.94 | 0.65 | 1.59 | 36.02 | 30.84 | 27.95 |
| 1020 min | 4.26 | 1.93 | 1.05 | 45.41 | 27.54 | 19.81 |
© 2017 by the authors. Licensee MDPI, Basel, Switzerland. This article is an open access article distributed under the terms and conditions of the Creative Commons Attribution (CC BY) license (http://creativecommons.org/licenses/by/4.0/).
Share and Cite
MDPI and ACS Style
Arkhipushkin, I.А.; Shikhaliev, K.S.; Potapov, A.Y.; Sapronova, L.V.; Kazansky, L.P. Inhibition of Brass (80/20) by 5-Mercaptopentyl-3-Amino-1,2,4-Triazole in Neutral Solutions. Metals 2017, 7, 488. https://doi.org/10.3390/met7110488
AMA Style
Arkhipushkin IА, Shikhaliev KS, Potapov AY, Sapronova LV, Kazansky LP. Inhibition of Brass (80/20) by 5-Mercaptopentyl-3-Amino-1,2,4-Triazole in Neutral Solutions. Metals. 2017; 7(11):488. https://doi.org/10.3390/met7110488
Chicago/Turabian StyleArkhipushkin, Ivan А., Khidmet S. Shikhaliev, Andrei Y. Potapov, Lyudmila V. Sapronova, and Leonid P. Kazansky. 2017. "Inhibition of Brass (80/20) by 5-Mercaptopentyl-3-Amino-1,2,4-Triazole in Neutral Solutions" Metals 7, no. 11: 488. https://doi.org/10.3390/met7110488
Note that from the first issue of 2016, this journal uses article numbers instead of page numbers. See further details here.