Article

Fabrication and Characterization of a Low Magnetic Zr-1Mo Alloy by Powder Bed Fusion Using a Fiber Laser

1
Department of Materials Processing, Graduate School of Engineering, Tohoku University, Sendai 980-8579, Japan
2
Institute of Biomaterials and Bioengineering, Tokyo Medical and Dental University, Tokyo 101-0062, Japan
*
Author to whom correspondence should be addressed.
Metals 2017, 7(11), 501; https://doi.org/10.3390/met7110501
Submission received: 19 October 2017 / Revised: 4 November 2017 / Accepted: 8 November 2017 / Published: 13 November 2017
(This article belongs to the Special Issue Zirconium Alloys)

Abstract

:
A low magnetic Zr-1Mo alloy was fabricated by a powder bed fusion (PBF) process using a fiber laser. The microstructure, surface morphology, and pore distribution of the as-built Zr-1Mo alloy were observed. Its magnetic susceptibility and Vickers hardness were evaluated by magnetic susceptibility balance and a microindentation tester, respectively. The as-built Zr-1Mo alloy mainly consisted of an α′ phase with an acicular structure. From the processing maps of the surface morphology and pore distribution, open pores on the top surface due to the lack of fusion corresponded to grid-like distributed pores, and large pores corresponded to balling particles on the top surface. The Vickers hardness was influenced by the oxygen and nitrogen contents rather than the porosity. The magnetic susceptibilities of the as-built Zr-1Mo alloy still were one-third those of Ti-6Al-4V and Ti-6Al-7Nb, thus PBF can be applicable to the fabrication process for the low magnetic Zr-1Mo alloy.

Graphical Abstract

1. Introduction

Magnetic resonance imaging (MRI) is a non-invasive diagnostic medical imaging technique widely used to acquire detailed information about internal anatomy and the function of various organs in the body in both health and disease [1]. However, MRI diagnosis is inhibited when there are metallic implants in the human body. This is mainly due to the formation of artefacts around the implants in MRI images caused by the magnetic susceptibility difference between the human body and implants [2]. To decrease the artefacts, it is necessary to develop novel materials with low magnetic susceptibility available to therapeutic devices in MRI diagnostic environments.
Zirconium has been recognized as a noncytotoxic, hypoallergenic, nonmutagenic, noncarcinogenic, nongenotoxic, and biocompatible metals [3,4,5,6,7]. In recent years, several novel Zr-based alloys—such as Zr-Ti alloys [8,9], Zr-Mo alloys [10,11,12], Zr-Nb alloys [13,14,15,16], and Zr-Ru alloys [17]—were reported as potential candidates for biomedical application. One of these studies reported that a Zr-1Mo alloy showed acceptable strength, high corrosion resistance, and low cytotoxicity in addition to lower magnetic susceptibility as compared to Co-Cr and Ti alloys [10,18].
On the other hand, powder bed fusion (PBF) process using a fiber laser has attracted increasing attention in the biomedical and aerospace industries because PBF possesses a lot of advantages, namely reduced raw material usage, near-net-shape production without expensive molds, design freedom using 3D CAD (Computer Aided Design) data, and so on. Moreover, due to the layer upon layer manufacturing, the PBF process is capable of producing extremely complex geometry that cannot be obtained using conventional production routes. Tailor-made metallic implants appropriate for the individual characteristics of each patient could also be realized by PBF [19,20]. Additionally, from a metallurgical point of view, fine grains can be achieved due to rapid solidification during this process, so that strength could be enhanced [21,22,23]. However, due to the particularity of this technology, not only process parameters [24,25,26], such as laser scanning speed, laser power, powder layer thickness, hatch distance, hatch styles, as well as contour and base plate heating, but also material properties such as melting point, surface tension of the melt, and thermal conductivity play important roles on the final quality of products fabricated by PBF. Therefore, extensive research is still needed to understand a given material.
To the best of our knowledge, there is scant literature available regarding the feasibility of PBF for the fabrication of biomedical Zr-based alloys. In this study, Zr-1Mo alloy builds were fabricated by PBF with various process parameters to obtain high relative density and low magnetic susceptibility. The effects of the process parameters on surface morphology, pore distribution, and hardness of as-built Zr-1Mo alloy builds were also investigated. These experimental results may provide direct guidelines regarding the PBF process for the biomedical Zr-1Mo alloy in the future.

2. Experimental Procedure

2.1. Powder Material

The gas-atomized and sieved under 45 μm Zr-1Mo alloy powder was prepared. The chemical composition is shown in Table 1. The Zr-1Mo powder was spherical (Figure 1), and the size distributions of d10, d50, and d90 were 15.9, 31.7, and 46.2 μm, respectively.

2.2. Preparation of Zr-1Mo Alloy Builds

Zr-1Mo was fabricated using a PBF machine (MLab R, Concept Laser, Liehtenfels, Germany) with a 100 W ytterbium fiber laser with a wavelength of 1070 nm. Prior to the building of specimens, the process chamber was purged with argon until the oxygen content reached less than 0.1% to reduce oxygen contamination. The process parameters used are listed in Table 2. The energy density (E) was used as a measure of the averaged applied energy per volume of material during the scanning of a layer:
E = P v · h · d
where P is the laser power, v is the scanning speed, h is the hatch distance, and d is the layer thickness [27,28]. Cylinders 6 mm in diameter and 6 mm in length were fabricated by PBF with various process parameters. Cylinders 3 mm in diameter and 25 mm in length were prepared for magnetic susceptibility testing. A chessboard scanning strategy, which has been described elsewhere [29,30], was employed to reduce the thermal residual stress in the final builds. Forged Ti-6Al-4V ELI (Extra Low Interstitials) and Zr-1Mo alloys were also prepared for comparison.

2.3. Characterization of Zr-1Mo Alloy Builds

The surface roughness of the top surface of the as-built Zr-1Mo alloys were examined by laser microscope (LM; VK-X200, Keyence, Osaka, Japan). The size, distribution, and morphology of pores on polished surfaces perpendicular to the building direction were observed using an optical microscope (OM; Optiphot, Nikon, Tokyo, Japan). The relative density was quantified from these OM images using ImageJ (1.46r, National Institutes of Health, Bethesda, MD, USA). X-ray diffractometer (XRD; SmartLab, Rigaku, Tokyo, Japan) was employed to analyze the phase constitution of the experimental Zr-1Mo alloys. The microstructures of the builds were observed by field emission scanning electron microscope (FESEM; JSM-6500F, JEOL, Tokyo, Japan) and high-resolution transmission electron microscope (HRTEM; HF-2000EDX, Hitachi, Tokyo, Japan). Specimens for FESEM observation were prepared using a twin-jet polisher with a solution containing HClO4 (8%), butyl alcohol (37%), and methyl alcohol at 223 K and 20.5 V after a general metallurgical polishing method. Transmission electron microscope (TEM) bulk specimens were prepared by grinding to a thickness of 50 μm and thinned by the ion-milling method (GATAN PPIS Model 691, Gatan Inc., Sarasota, FL, USA) at a voltage of 4 kV. Vickers hardness testing was conducted at a load of 7 N for 10 s and repeated 11 times in different positions of each specimen to find the average result using a digital hardness tester (HM-200, Mitutoyo, Kawasaki, Japan). Magnetic susceptibility was measured using a magnetic balance (MSB-MKI, Sherwood Scientific, Cambridge, UK) with a magnetic field of 0.35 T at room temperature. The direction of the applied magnetic field was normal to the longitudinal direction of the bar. Magnetic susceptibility was measured at least three times for each specimen. Oxygen and nitrogen contents were measured by the inert gas fusion-IR (infrared) absorption method (ONH836, Leco, St. Joseph, MI, USA).

3. Results

Figure 2 shows the top surface roughness of the as-built Zr-1Mo alloy with various energy densities. Basically, surface roughness decreased with the increase of energy density despite different scanning speeds. However, when the energy density was higher than 70 J·mm−3, surface roughness decreased with the decrease of scanning speed, which was confirmed by energy densities lower than 70 J·mm−3.
Figure 3 shows the relative density of the as-built Zr-1Mo alloy as a function of energy density. All as-built specimens had porosities of less than 2.0% within the range of tested parameters. The relative density showed a peak value of 99.9% at the energy density of 50.2 J·mm−3 using a scanning speed of 1050 mm·s−1, and then slightly decreased with the further increase of energy density, in which builds fabricated with low scanning speeds showed lower relative densities.
Figure 4 shows SEM micrographs at the top surface of the as-built Zr-1Mo alloys with various energy densities. Three kinds of top-surface morphologies were observed: the surface pore (Figure 4a, sputter particle (Figure 4b,d), and balling particle (Figure 4c) types.
Figure 5 shows the processing map of the surface morphology at five different scanning speeds and corresponding energy densities. When the energy density was lower than 40.2 J·mm−3, the surface possessed open pores due to insufficient laser track width or a hatch distance that was too wide. When the energy density was higher than 40.2 J·mm−3, open pores became invisible on the surface, and instead, some spatter particles due to the splashing of molten metal during laser scanning were observed. When both the energy density and the scanning speed were very high, not only spatter particles but also some balling particles were observed on the surface. This phenomenon is the so-called “balling effect”, which was reported elsewhere [31,32]. The size of balling particles reached hundreds of microns, which is much larger than that of spatter particles (ca. (circa) less than tens of microns).
Figure 6 shows OM micrographs of the polished surface of as-built Zr-1Mo alloys with various scanning speeds. A fully dense build was obtained at an energy density of 48.6 J·mm−3, with a scanning speed of 1050 mm·s−1, and pores several microns large were observed, as shown in Figure 6b. Four kinds of pore distributions were observed, namely, grid-like distributed pores (Figure 6a), randomly distributed pores (Figure 6c), and large pores (Figure 6d).
Figure 7 shows a processing map of the pore distribution at five different scanning speeds and their corresponding energy densities. When the energy density was lower than 40.2 J·mm−3, grid-like distributed pores were observed at all tested scanning speeds. Fully dense specimens, which have a relative density higher than 99.7%, were obtained by employing higher scanning speeds and a middle energy density range. At scanning speeds of less than 900 mm·s−1 and energy densities higher than 40.2 J·mm−3, randomly distributed pores with a spherical shape and a size of 10–30 μm were observed. The number of pores on a cross section perpendicular to the building direction seemed to increase as the energy density increased.
Figure 8 shows SEM images of as-built Zr-1Mo alloys with various energy densities. Fine acicular microstructures with the intercept length of ca. 1 μm were observed in all specimens, irrespective of energy density. It has been reported that as-cast Zr-1Mo alloys have a fine acicular microstructure consisting of an α′ phase [10]. According to the microstructure, the as-cast alloy showed larger intercept lengths of ca. 2 μm, so that the as-built alloy possessed a finer microstructure than the as-cast alloy.
Figure 9 shows a TEM image of the as-built alloy. A mass of twins was observed in the acicular microstructure. Selected area electron diffraction (SAED) inserted in the TEM image confirmed a hexagonal close-packed crystal structure. Diffraction patterns originating from the β or ω phases were invisible. This characteristic microstructure may be acknowledged as an α′ martensite microstructure.
Figure 10a shows the mass magnetic susceptibility of as-built Zr-1Mo alloys with various energy densities. The magnetic susceptibility of as-built Zr-1Mo alloys averaged (1.51 ± 0.02) × 10−8 m3·kg−1, and each susceptibility was almost the same irrespective of the different energy densities. This indicates that the effects of process parameters on magnetic susceptibility are not significant. Figure 10b shows the averaged magnetic susceptibility of as-built Zr-1Mo alloys—as-cast Zr-1Mo alloy, pure Zr, and Ti-6Al-4V ELI alloy. As-built Zr-1Mo alloys showed comparable magnetic susceptibilities to as-cast Zr-1Mo alloys. This may be due to the similarity of the phase constitution between as-built and as-cast specimens. Also, the magnetic susceptibilities of as-built Zr-1Mo alloys still remains one-third that of Ti-6Al-4V, which is widely used in biomedical implants. Biocompatibility is also an important indicator for biomedical implants. As-cast Zr-1Mo alloy shows an excellent in vitro biocompatibility [12]. As-built Zr-1Mo alloy builds and as-cast Zr-1Mo alloy show the same composition and similar microstructure. Therefore, we assume as-built Zr-1Mo alloy builds also have an excellent biocompatibility.
Figure 11 shows the Vickers hardness contour map against scanning speeds and energy densities. Vickers hardness was carried out for the 27 specimens to obtain the contour map. These specimens were built with different energy densities from 35.2 to 84.4 J·mm−3 and with changing scanning speeds from 600 to 1200 mm·s−1. Standard deviation of the hardness was from 3.1 to 12.8 HV. The Vickers hardness increased with increasing energy densities at the same scanning speed. When the energy density is the same, the hardness increased slightly with increasing scanning speed.
Figure 12a,b shows oxygen and nitrogen concentrations of as-built Zr-1Mo alloys as a function of energy density. Oxygen and nitrogen concentrations increased with increased energy densities. It was also found that these concentrations at higher energy densities increased with increasing scanning speed.

4. Discussion

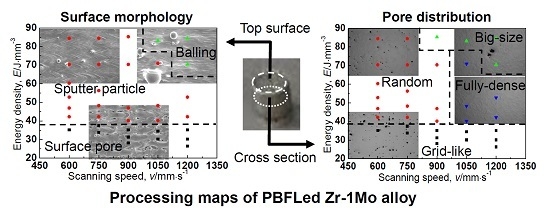
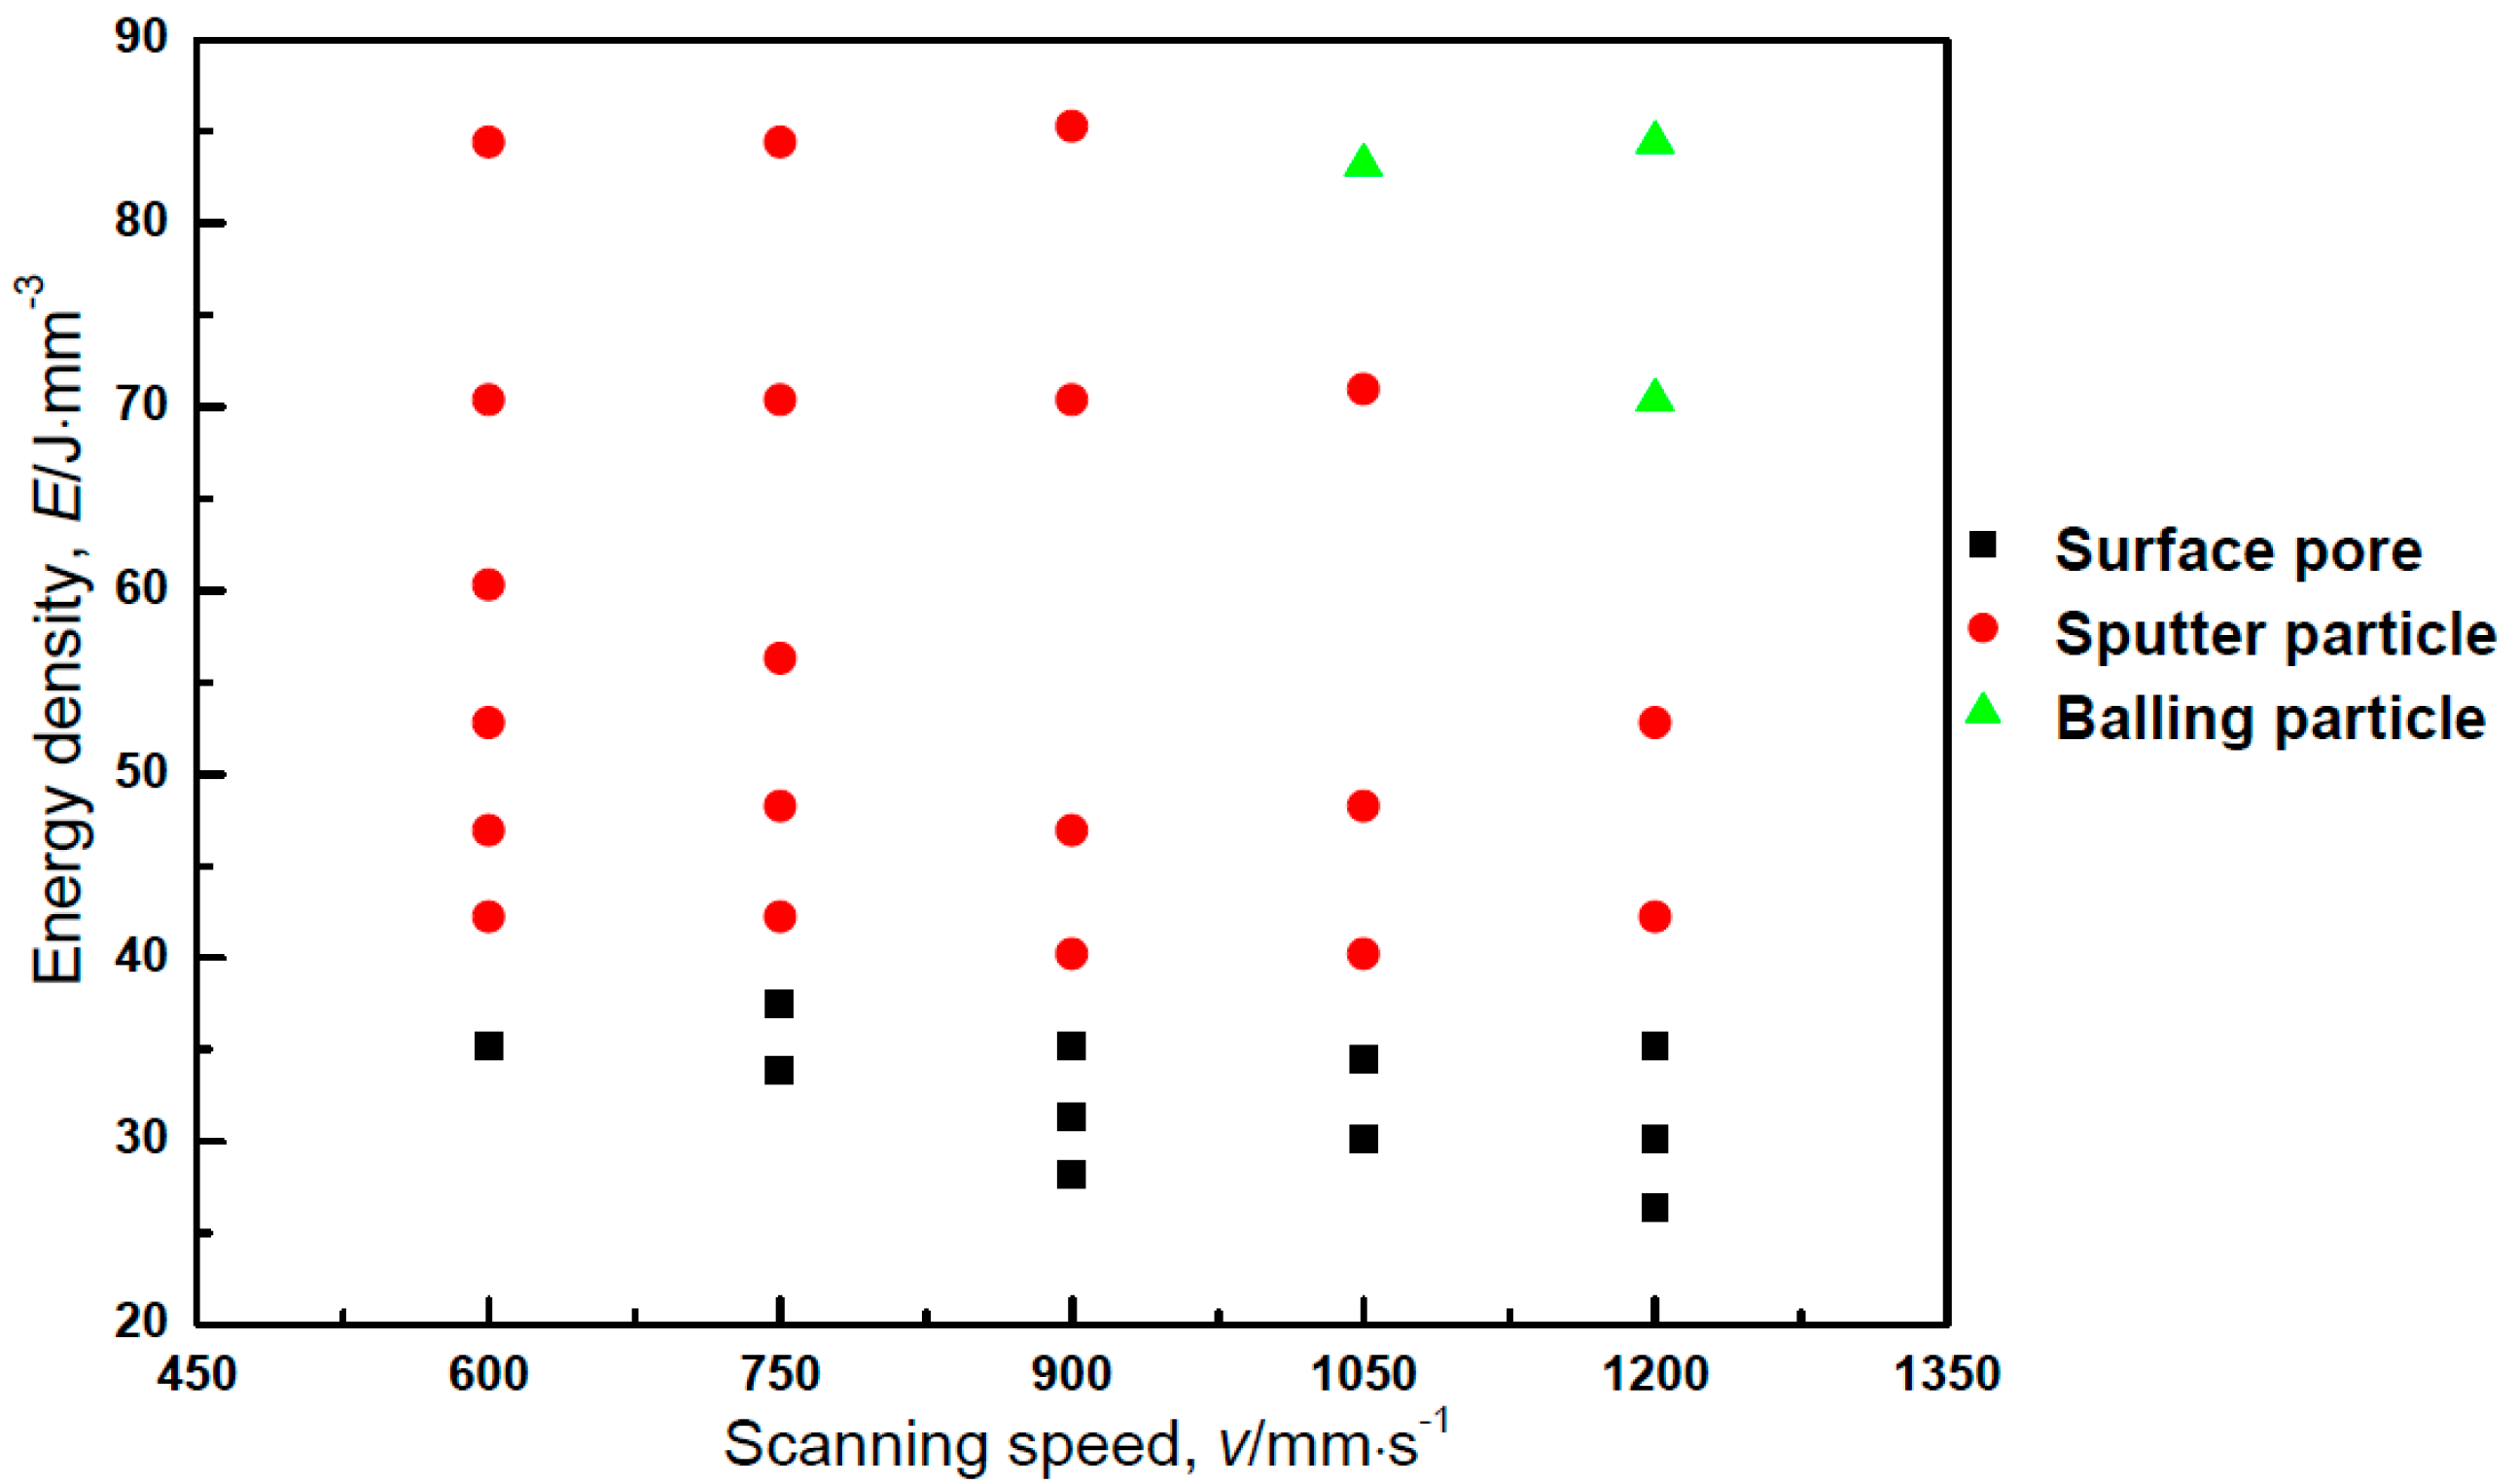
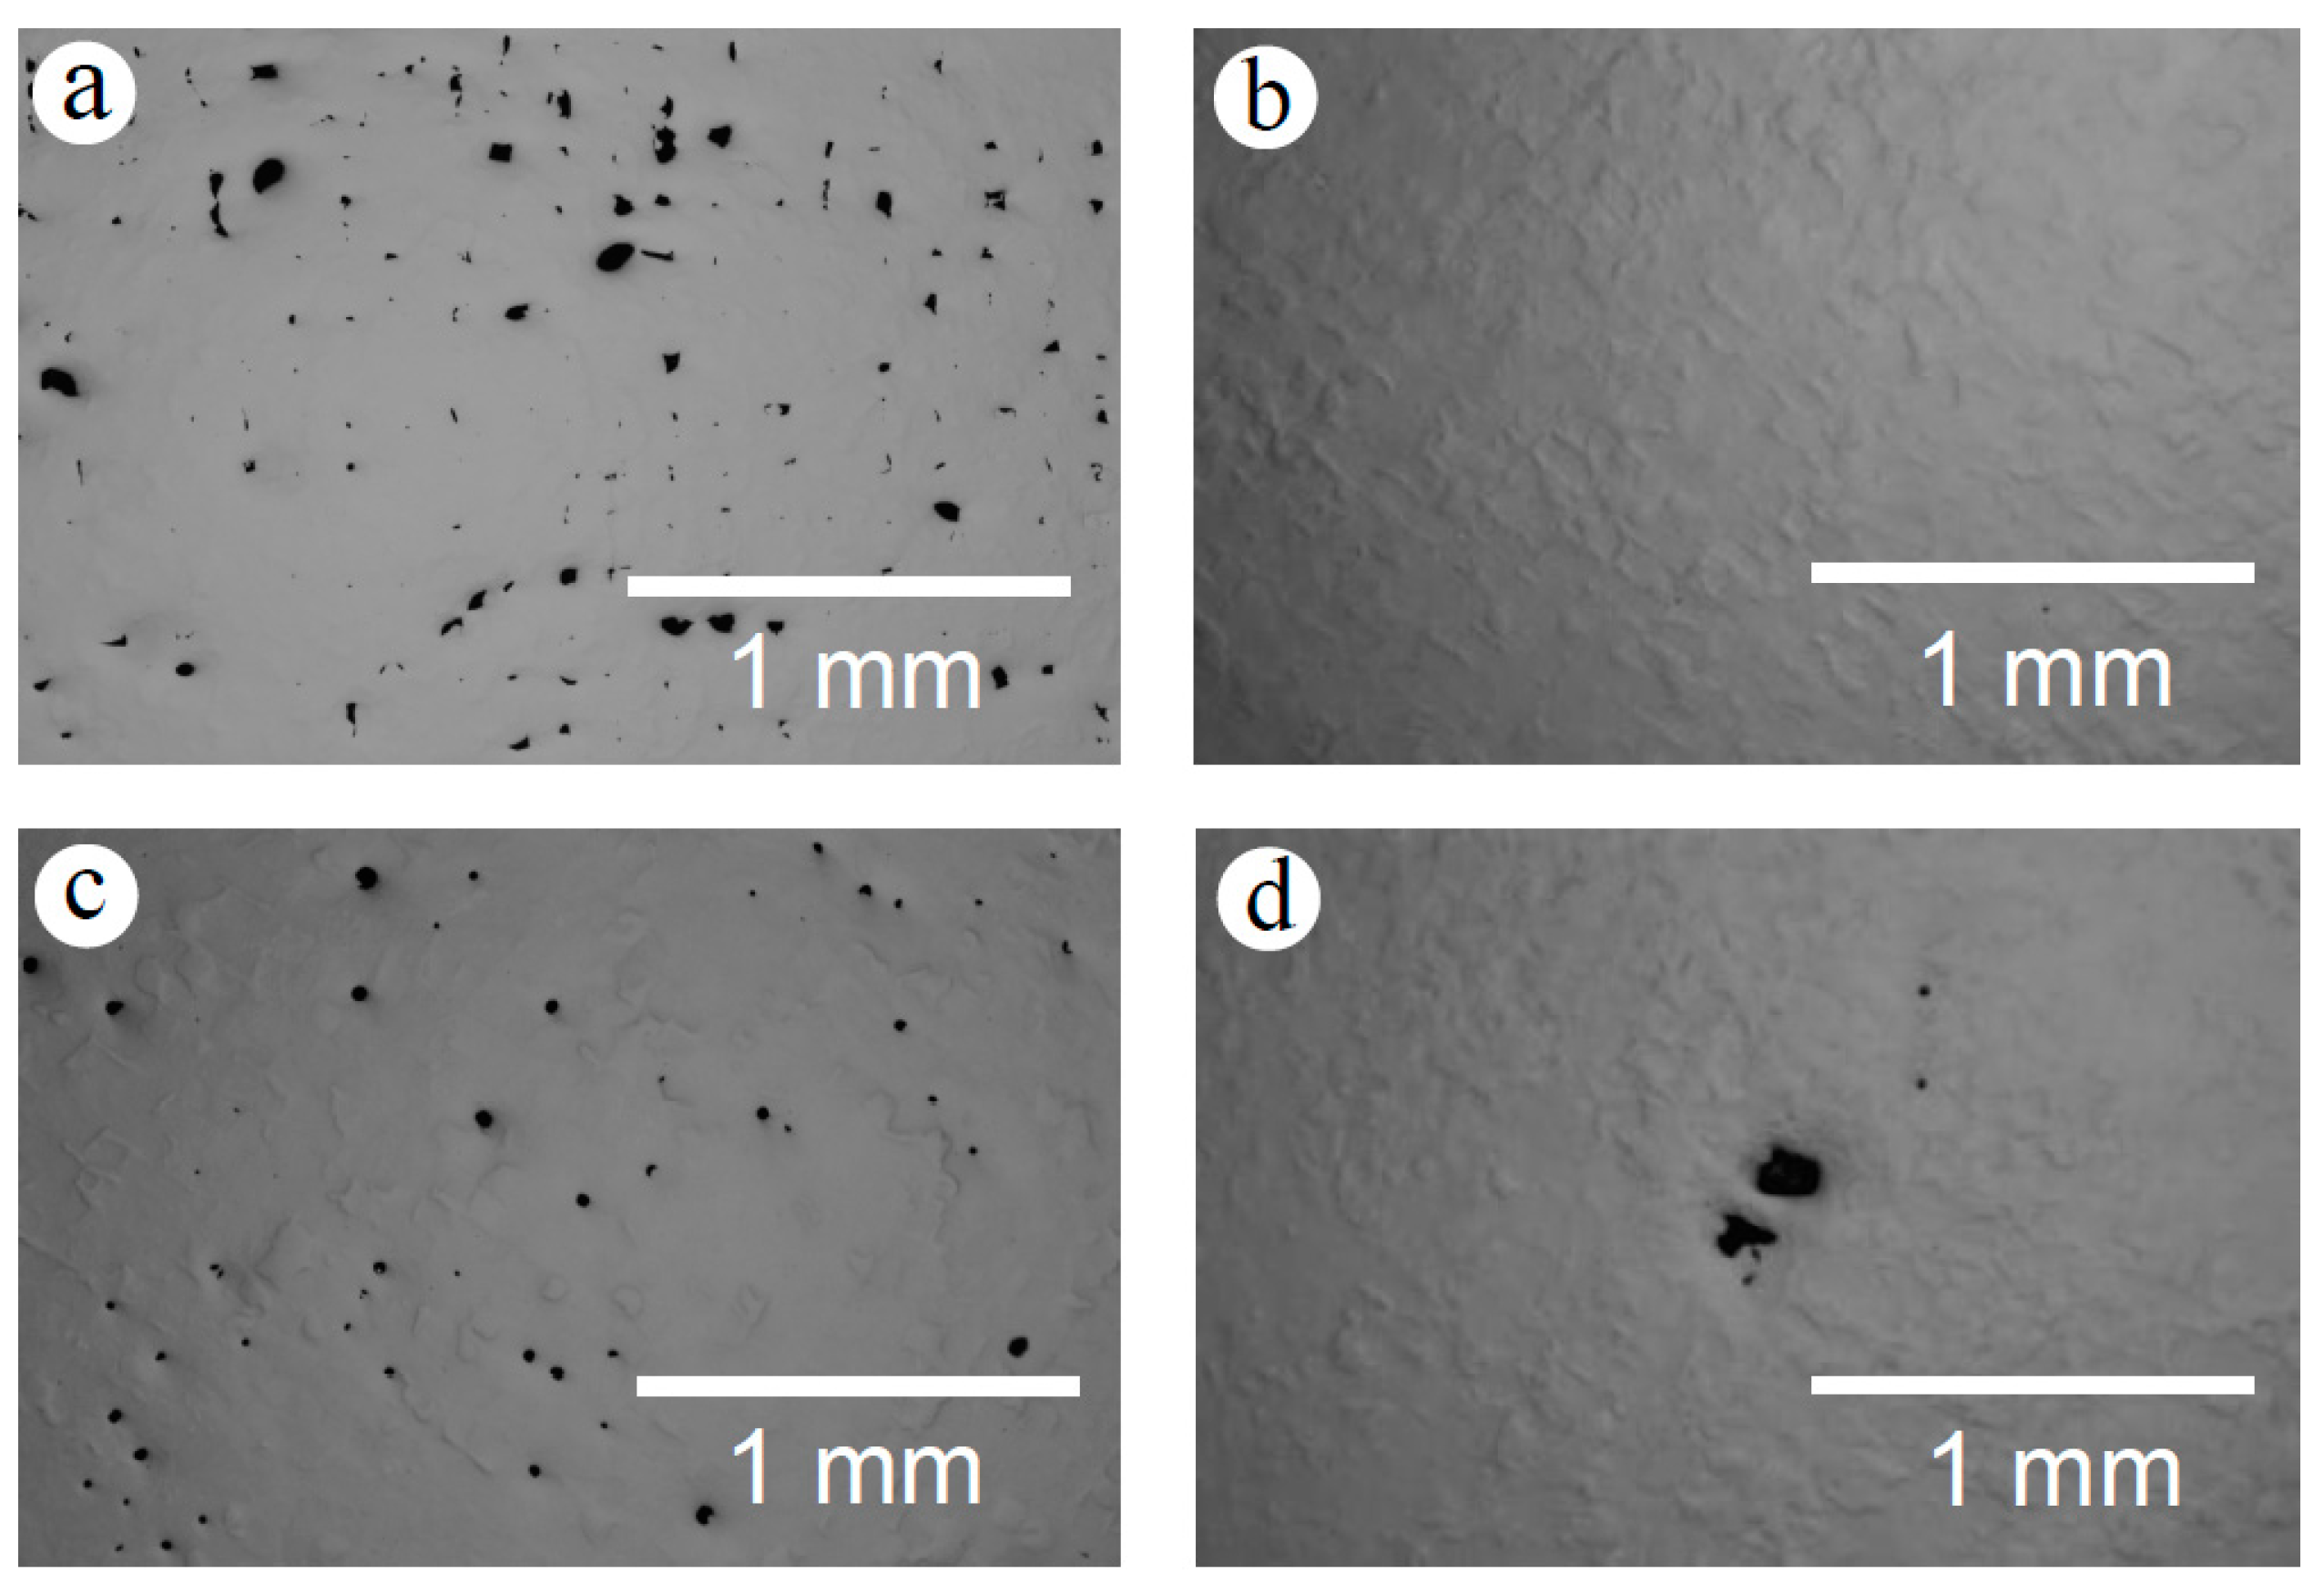
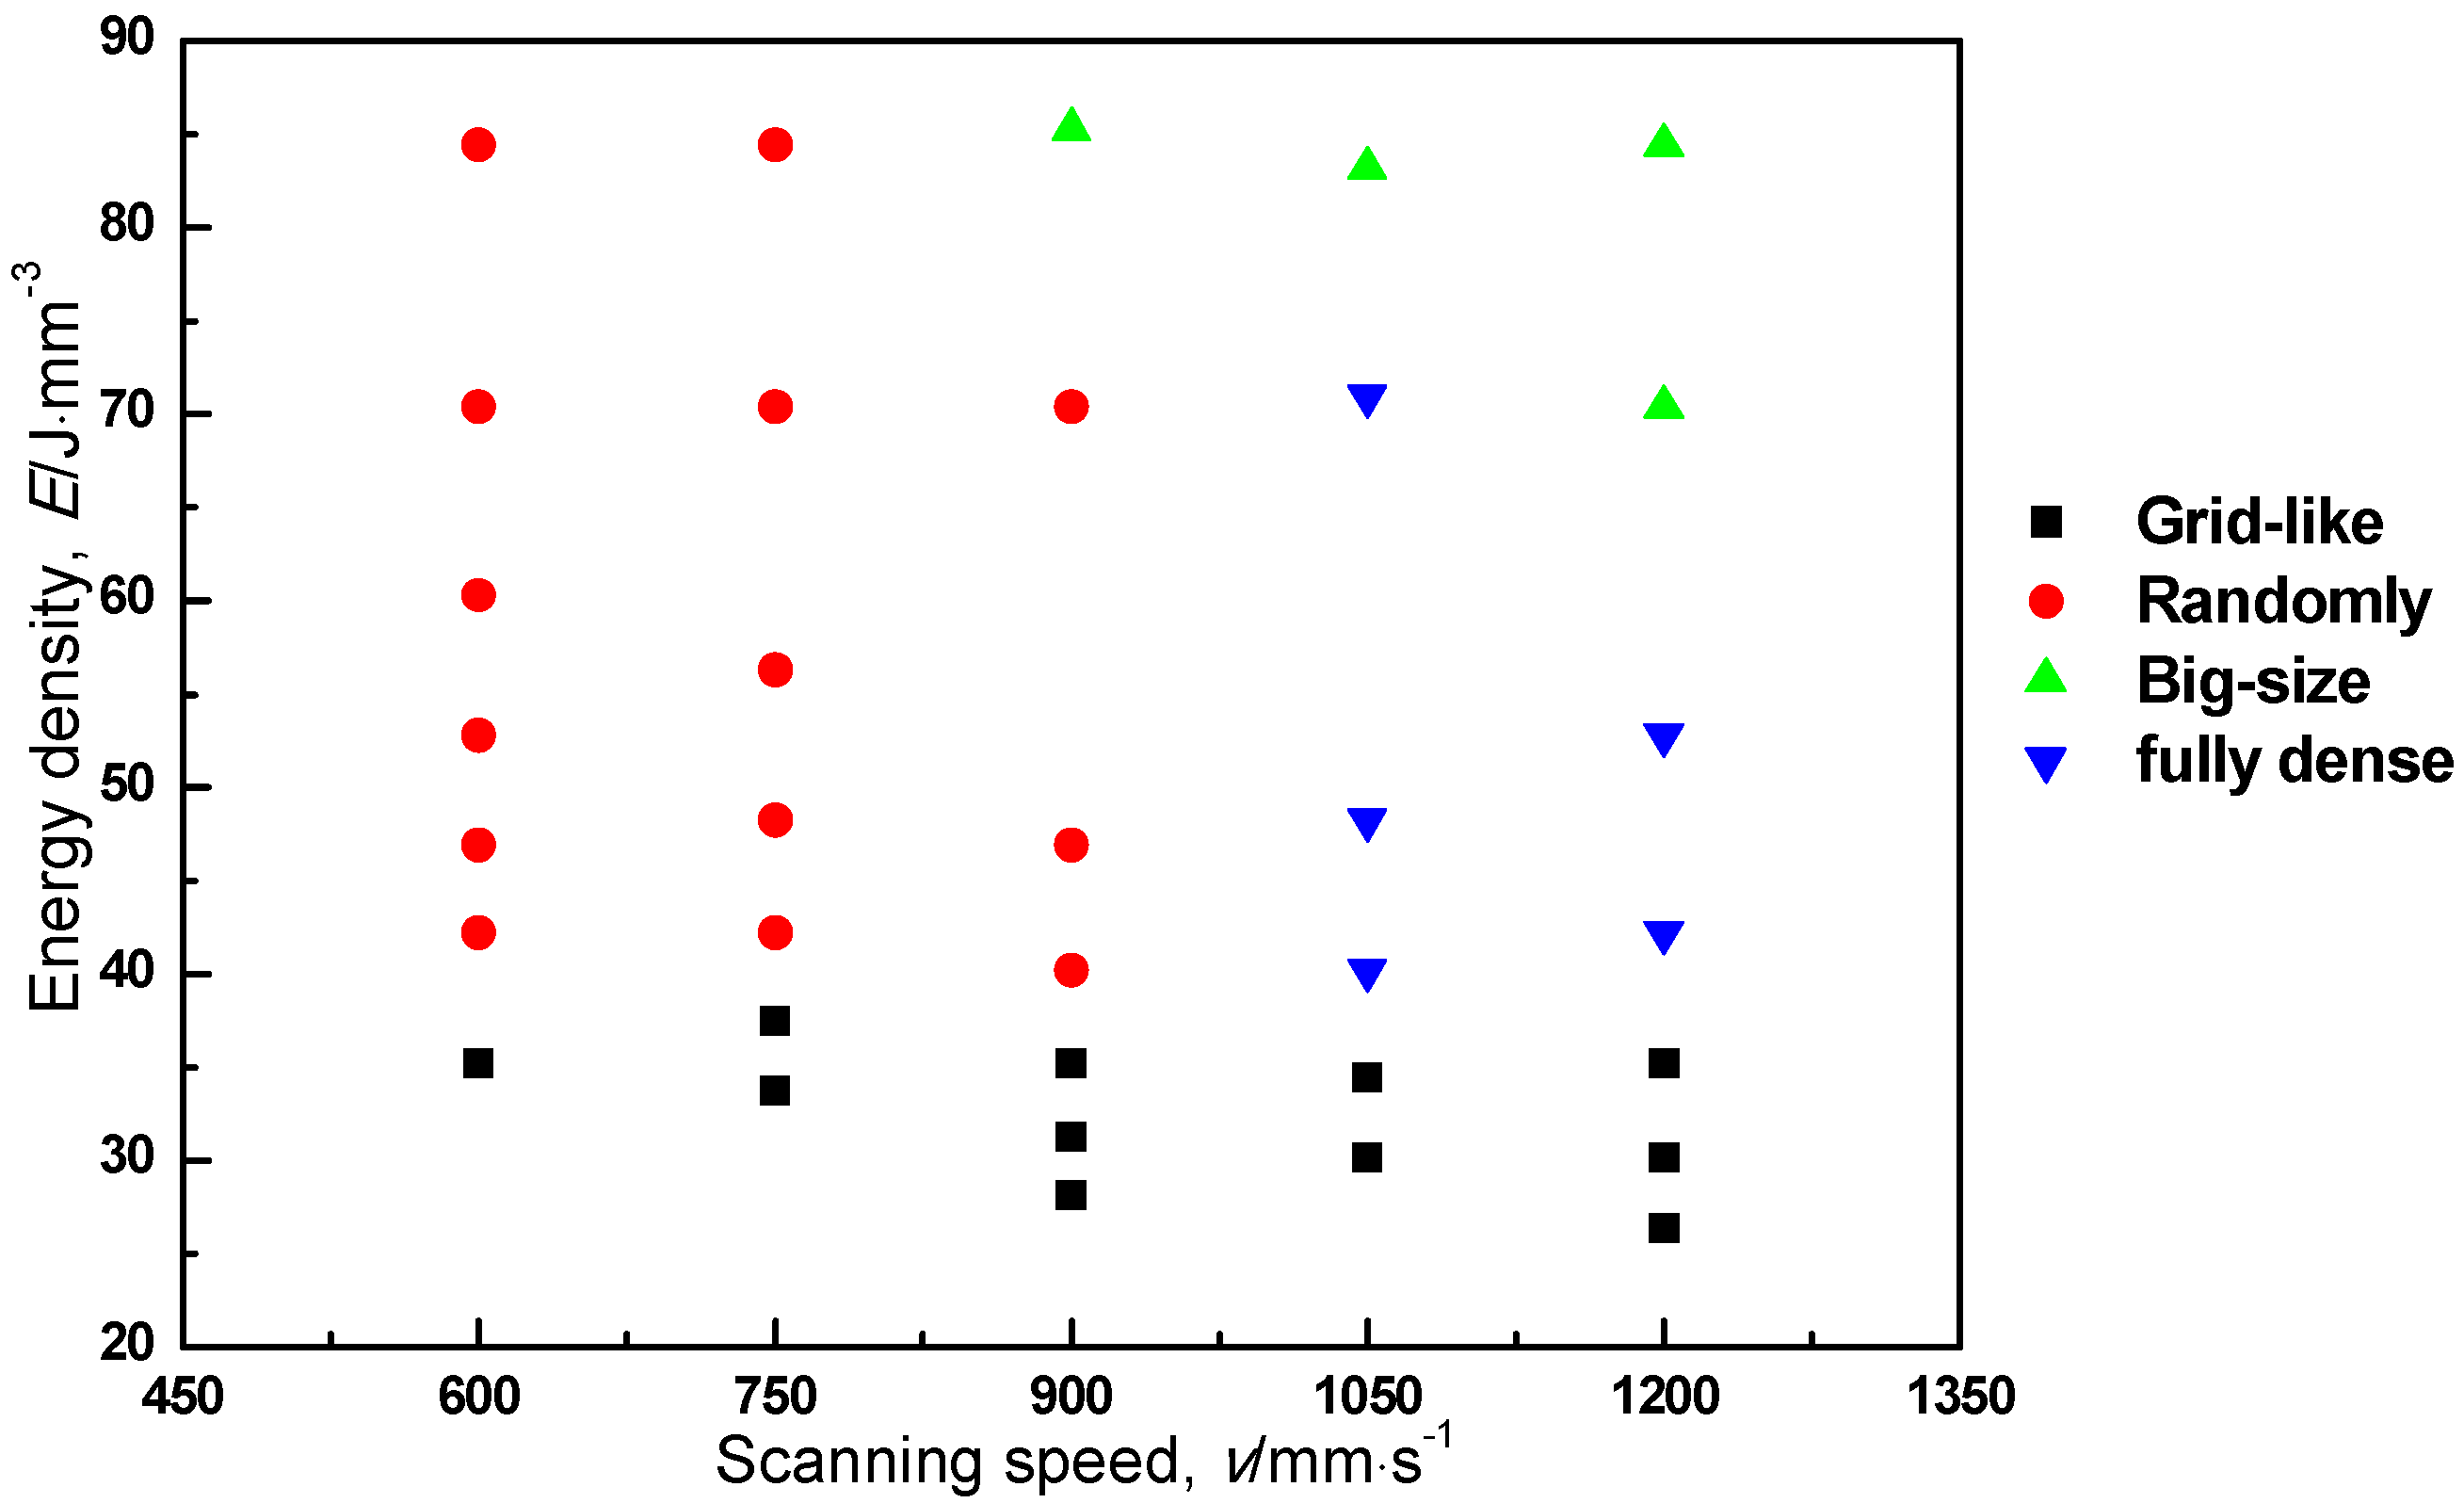
4.1. Relationship between Surface Morphology and Pore Distribution

According to the processing maps of surface morphology (Figure 5) and pore distribution (Figure 7), the surface pore zone seems to correspond with the grid-like distributed pore zone at the low energy density zone. When the energy density was low, the bead could not be overlapped due to the bead width being narrower than hatching distance, and grid-like laser tracks were formed. Thus, surface pores and grid-like pores are formed for the same reason, i.e., the lack of fusion.
On the other hand, the balling particle zone (Figure 5) also seems to agree with the large pore zone (Figure 7), indicating that balling particles may be caused by the formation of large pores. The balling phenomenon can be explained by the stability of the liquid cylinder during PBF [33]. Stable melt tracks are crucial to avoiding the balling effect during laser scanning; however, unstable melt tracks will cause the cylinder’s diameter to oscillate, which could lead to the formation of surface waves. Gusarov and Smurov [34] reported the stability of the melt track during the PBF process using the Plateau-Rayleigh instability theory [35]. According to this theory, stable melting behavior during laser scanning could be ensured by a larger diameter of the melt track, which can be caused by a lower scanning speed. In other words, higher scanning speeds may lead to unstable melt tracks, causing the formation of balling particles. As shown in Figure 6d, the size of the balling particles was over 200 μm, which is much larger than the laser spot size of ca. 45 μm and the average powder diameter. When such large particles form on the surface during the PBF process, these particles may inhibit homogenous powder raking and melting around and beneath them. In this way, large pores are considered to be formed due to the balling particles caused by unstable melting at higher scanning speeds.
Although the spatter particle zone (Figure 5) seems to overlap the randomly distributed and the fully dense zone (Figure 7), sputter particles are not a dominant factor in the formation of randomly distributed pores, as these pores can be observed at scanning speeds lower than or equal to 900 mm·s−1. The reason the randomly distributed pores are formed is discussed in the following section.

4.2. The Formation Mechanism of Randomly Distributed Pores

Figure 13 shows schematic drawings of the formation mechanism of randomly distributed pores. When the laser scans the metallic powders, a melt pool is formed, depending on the laser’s power and scanning speed. The surface of the liquid metal becomes dented when the recoil pressure (i.e., the metal vapor pressure) overcomes the surface tension at the melting pool. Due to the extremely high temperature of the melting pool, the evaporation of metallic material during laser scanning could possibly occur, as was reported elsewhere [36,37]. This evaporation could lead to instantaneous volume expansion by solid–gas transformation and then produce pressure on the melting pool. This pressure is known as recoil pressure (pr), which can be calculated by
p r = p 0 exp [ Δ H v R ( 1 T v 1 T m ) ]
where p0 is the atmospheric pressure, ΔHv is the evaporation of latent heat, R is the universal gas constant, Tm is the melting pool temperature, and Tv is the boiling temperature [38,39,40]. According to Equation (2), the recoil pressure increases as the melt pool temperature increases. On the other hand, the surface tension decreases as the melt temperature increases. Therefore, a low scanning speed should lead to a high recoil pressure and low surface tension, followed by a more deeply dented melting pool. This behavior could progress with laser reflection in the dented area. After laser scanning, the dented surface collapses and may form bridges during cooling. The residual pores in the melting pool may become spherical due to surface tension and be randomly distributed by Marangoni flows [41].

4.3. Vickers Hardness of As-Built Zr-1Mo Alloys

As shown in Figure 11, higher energy densities and higher scanning speeds resulted in higher Vickers hardness. Since all as-built Zr-1Mo specimens have similar microstructural features, such as phase constitution and average grain size (intercept length), the effect of microstructure on the hardness of as-built Zr-1Mo alloys should be similar.
Figure 14 shows the Vickers hardness of as-built Zr-1Mo alloys as a function of the relative density with various scanning speeds. There is not a compendious correlation between relative density and Vickers hardness because the hardness changed from 285 to 345 HV with substantially less difference in porosity. Therefore, it is supposed that the effect of the relative density on the Vickers hardness of as-built Zr-1Mo alloys is limited in this porosity range. This tendency is in good agreement with that of the pure titanium builds fabricated by PBF [42]. The reason for hardening with increasing energy density was reported to be the increasing concentration of interstitial atoms (especially O, N). As shown in Figure 12a,b, oxygen and nitrogen concentrations roughly increased with increases in energy densities and scanning speeds. Higher energy densities of the laser caused higher melting pool temperatures and longer melting times, as discussed above. Due to this effect, O and/or N could solute the Zr-1Mo alloy to increase the hardness, even when the PBF process was performed in an Ar atmosphere with an O2 content of less than 0.1%.
Next, we discuss the effect of scanning speeds on increasing hardness at the same energy density. Juechter et al. [37] reported that lower scanning speeds led to stronger heat loss during irradiation, caused by increasing local interaction times between beam and powder. Higher scanning speeds apparently lead to shorter local interaction times, so that higher scanning speeds effectively apply energy from the laser. Also, due to the narrower hatch distance and higher scanning speed, residual heat from the adjacent scanned lines is effectively available for melting. Therefore, a higher Vickers hardness at the higher scanning speed could be obtained due to the higher actual energy density and residual temperature at the build surface.

5. Conclusions

Zr-1Mo alloy builds with high relative densities (ca. 99.7%) were successfully fabricated by PBF. The α′ phase, with an acicular structure containing a mass of twins, was dominantly observed in the builds. From processing maps of the surface morphology and pore distribution, we found that open pores on the top surface due to the lack of fusion corresponded to grid-like distributed pores, and large pores corresponded to balling particles of more than 200 μm on the top surface. The formation of randomly distributed pores can be explained by the balance between the recoil pressure and the surface tension of the melt track. The Vickers hardness was influenced by oxygen and nitrogen contents rather than by porosity. The hardness increased with increasing scanning speeds, possibly due to higher actual input energy and residual temperature. The magnetic susceptibilities of the α′-based Zr-1Mo alloy builds still maintained one-third those of Ti-6Al-4V and Ti-6Al-7Nb; thus, PBF can have applications in the fabrication process in low magnetic Zr-1Mo alloys.

Acknowledgments

This work was partially supported by a Grant-in-Aid for Fundamental Scientific Research (Kiban B: Nos. 22360287 and 15H04140) from the Ministry of Education, Culture, Sports, Science and Technology of Japan. This work was also partially supported by an S-innovation (No. 16im0502002h) from the Japan Agency for Medical Research and Development.

Author Contributions

Naoyuki Nomura contributed to the conception and design of the experiments; Hisashi Doi, Yusuke Tsutsumi and Takao Hanawa partially contributed to the design of the experiments. Xiaohao Sun performed the experiments; Xiaohao Sun, Weiwei Zhou and Keiko Kikuchi contributed to data analyzation; Naoyuki Nomura and Akira Kawasaki gave the constructive suggestions of this manuscript. Xiaohao Sun wrote the paper.

Conflicts of Interest

The authors declare no conflict of interest.

References

  1. Fatahi, M.; Speck, O. Magnetic resonance imaging (MRI): A review of genetic damage investigations. Mutat. Res. Rev. Mutat. Res. 2015, 764, 51–63. [Google Scholar] [CrossRef] [PubMed]
  2. Imai, H.; Tanaka, Y.; Nomura, N.; Tsutsumi, Y.; Doi, H.; Kanno, Z.; Ohno, K.; Ono, T.; Hanawa, T. Three-dimensional quantification of susceptibility artifacts from various metals in magnetic resonance images. Acta Biomater. 2013, 9, 8433–8439. [Google Scholar] [CrossRef] [PubMed]
  3. Biesiekierski, A.; Wang, J.; Gepreel, M.A.; Wen, C. A new look at biomedical ti-based shape memory alloys. Acta Biomater. 2012, 8, 1661–1669. [Google Scholar] [CrossRef] [PubMed]
  4. Yamamoto, A.; Honma, R.; Sumita, M. Cytotoxicity evaluation of 43 metal salts using murine fibroblasts and osteoblastic cells. J. Biomed. Mater. Res. 1998, 39, 331–340. [Google Scholar] [CrossRef]
  5. Messer, R.L.W.; Lucas, L.C. Evaluations of metabolic activities as biocompatibility tools: A study of individual ions’ effects on fibroblasts. Dent. Mater. 1999, 15, 1–6. [Google Scholar] [CrossRef]
  6. Wataha, J.C. Biocompatibility of dental casting alloys: A review. J. Prosthet. Dent. 2000, 83, 223–234. [Google Scholar] [CrossRef]
  7. Scarano, A.; Di Carlo, F.; Quaranta, M.; Piattelli, A. Bone response to zirconia ceramic implants: An experimental study in rabbits. J. Oral Implantol. 2003, 29, 8–12. [Google Scholar] [CrossRef]
  8. Ho, W.-F.; Chen, W.-K.; Wu, S.-C.; Hsu, H.-C. Structure, mechanical properties, and grindability of dental Ti-Zr alloys. J. Mater. Sci. Mater. Med. 2008, 19, 3179–3186. [Google Scholar] [CrossRef] [PubMed]
  9. Hsu, H.-C.; Wu, S.-C.; Sung, Y.-C.; Ho, W.-F. The structure and mechanical properties of as-cast Zr-Ti alloys. J. Alloys Compd. 2009, 488, 279–283. [Google Scholar] [CrossRef]
  10. Suyalatu; Nomura, N.; Oya, K.; Tanaka, Y.; Kondo, R.; Doi, H.; Tsutsumi, Y.; Hanawa, T. Microstructure and magnetic susceptibility of as-cast Zr-Mo alloys. Acta Biomater. 2010, 6, 1033–1038. [Google Scholar] [CrossRef] [PubMed]
  11. Suyalatu; Kondo, R.; Tsutsumi, Y.; Doi, H.; Nomura, N.; Hanawa, T. Effects of phase constitution on magnetic susceptibility and mechanical properties of Zr-rich Zr-Mo alloys. Acta Biomater. 2011, 7, 4259–4266. [Google Scholar] [CrossRef] [PubMed]
  12. Zhou, F.Y.; Wang, B.L.; Qiu, K.J.; Li, L.; Lin, J.P.; Li, H.F.; Zheng, Y.F. Microstructure, mechanical property, corrosion behavior, and in vitro biocompatibility of Zr-Mo alloys. J. Biomed. Mater. Res. B Appl. Biomater. 2013, 101, 237–246. [Google Scholar] [CrossRef] [PubMed]
  13. Kajima, Y.; Takaichi, A.; Yasue, T.; Doi, H.; Takahashi, H.; Hanawa, T.; Wakabayashi, N. Evaluation of the shear bond strength of dental porcelain and the low magnetic susceptibility Zr-14Nb alloy. J. Mech. Behav. Biomed. Mater. 2016, 53, 131–141. [Google Scholar] [CrossRef] [PubMed]
  14. Nomura, N.; Tanaka, Y.; Suyalatu; Kondo, R.; Doi, H.; Tsutsumi, Y.; Hanawa, T. Effects of phase constitution of Zr-Nb alloys on their magnetic susceptibilities. Mater. Trans. 2009, 50, 2466–2472. [Google Scholar] [CrossRef]
  15. Kondo, R.; Shimizu, R.; Nomura, N.; Doi, H.; Suyalatu; Tsutsumi, Y.; Mitsuishi, K.; Shimojo, M.; Noda, K.; Hanawa, T. Effect of cold rolling on the magnetic susceptibility of Zr-14Nb alloy. Acta Biomater. 2013, 9, 5795–5801. [Google Scholar] [CrossRef] [PubMed]
  16. Nie, L.; Zhan, Y.; Hu, T.; Chen, X.; Wang, C. Beta-type Zr-Nb-Ti biomedical materials with high plasticity and low modulus for hard tissue replacements. J. Mech. Behav. Biomed. Mater. 2014, 29, 1–6. [Google Scholar] [CrossRef] [PubMed]
  17. Li, H.F.; Zhou, F.Y.; Li, L.; Zheng, Y.F. Design and development of novel MRI compatible zirconium-ruthenium alloys with ultralow magnetic susceptibility. Sci. Rep. 2016, 6, 24414. [Google Scholar] [CrossRef] [PubMed]
  18. Zhou, F.Y.; Qiu, K.J.; Li, H.F.; Huang, T.; Wang, B.L.; Li, L.; Zheng, Y.F. Screening on binary Zr-1X (X = Ti, Nb, Mo, Cu, Au, Pd, Ag, Ru, Hf and Bi) alloys with good in vitro cytocompatibility and magnetic resonance imaging compatibility. Acta Biomater. 2013, 9, 9578–9587. [Google Scholar] [CrossRef] [PubMed]
  19. Salmi, M.; Tuomi, J.; Paloheimo, K.S.; Björkstrand, R.; Paloheimo, M.; Salo, J.; Kontio, R.; Mesimäki, K.; Mäkitie, A.A. Patient-specific reconstruction with 3D modeling and DMLS additive manufacturing. Rapid Prototyp. J. 2012, 18, 209–214. [Google Scholar] [CrossRef]
  20. Poukens, J.; Laeven, P.; Beerens, M.; Nijenhuis, G.; Sloten, J.V.; Stoelinga, P.; Kessler, P. A classification of cranial implants based on the degree of difficulty in computer design and manufacture. Int. J. Med. Robot. 2008, 4, 46–50. [Google Scholar] [CrossRef] [PubMed]
  21. Vrancken, B.; Thijs, L.; Kruth, J.-P.; Van Humbeeck, J. Heat treatment of Ti6Al4V produced by selective laser melting: Microstructure and mechanical properties. J. Alloys Compd. 2012, 541, 177–185. [Google Scholar] [CrossRef]
  22. Prashanth, K.G.; Scudino, S.; Klauss, H.J.; Surreddi, K.B.; Löber, L.; Wang, Z.; Chaubey, A.K.; Kühn, U.; Eckert, J. Microstructure and mechanical properties of Al-12Si produced by selective laser melting: Effect of heat treatment. Mater. Sci. Eng. A 2014, 590, 153–160. [Google Scholar] [CrossRef]
  23. Attar, H.; Prashanth, K.G.; Chaubey, A.K.; Calin, M.; Zhang, L.C.; Scudino, S.; Eckert, J. Comparison of wear properties of commercially pure titanium prepared by selective laser melting and casting processes. Mater. Lett. 2015, 142, 38–41. [Google Scholar] [CrossRef]
  24. Prashanth, K.G.; Scudino, S.; Maity, T.; Das, J.; Eckert, J. Is the energy density a reliable parameter for materials synthesis by selective laser melting? Mater. Res. Lett. 2017, 5, 386–390. [Google Scholar] [CrossRef]
  25. Scipioni Bertoli, U.; Wolfer, A.J.; Matthews, M.J.; Delplanque, J.P.R.; Schoenung, J.M. On the limitations of volumetric energy density as a design parameter for selective laser melting. Mater. Des. 2017, 113, 331–340. [Google Scholar] [CrossRef]
  26. Prashanth, K.G.; Scudino, S.; Eckert, J. Defining the tensile properties of Al-12Si parts produced by selective laser melting. Acta Mater. 2017, 126, 25–35. [Google Scholar] [CrossRef]
  27. Carter, L.N.; Wang, X.; Read, N.; Khan, R.; Aristizabal, M.; Essa, K.; Attallah, M.M. Process optimisation of selective laser melting using energy density model for nickel based superalloys. Mater. Sci. Technol. 2016, 32, 657–661. [Google Scholar] [CrossRef]
  28. Gong, H.; Rafi, K.; Gu, H.; Janaki Ram, G.D.; Starr, T.; Stucker, B. Influence of defects on mechanical properties of Ti-6Al-4V components produced by selective laser melting and electron beam melting. Mater. Des. 2015, 86, 545–554. [Google Scholar] [CrossRef]
  29. Sing, S.L.; Yeong, W.Y.; Wiria, F.E. Selective laser melting of titanium alloy with 50 wt% tantalum: Microstructure and mechanical properties. J. Alloys Compd. 2016, 660, 461–470. [Google Scholar] [CrossRef]
  30. Qiu, C.; Adkins, N.J.E.; Attallah, M.M. Microstructure and tensile properties of selectively laser-melted and of hiped laser-melted Ti-6Al-4V. Mater. Sci. Eng. A 2013, 578, 230–239. [Google Scholar] [CrossRef]
  31. Li, R.; Liu, J.; Shi, Y.; Wang, L.; Jiang, W. Balling behavior of stainless steel and nickel powder during selective laser melting process. Int. J. Adv. Manuf. Technol. 2011, 59, 1025–1035. [Google Scholar] [CrossRef]
  32. Tolochko, N.K.; Mozzharov, S.E.; Yadroitsev, I.A.; Laoui, T.; Froyen, L.; Titov, V.I.; Ignatiev, M.B. Balling processes during selective laser treatment of powders. Rapid Prototyp. J. 2004, 10, 78–87. [Google Scholar] [CrossRef]
  33. Niu, H.J.; Chang, I.T.H. Instability of scan tracks of selective laser sintering of high speed steel. Scr. Mater. 1999, 41, 1229–1234. [Google Scholar] [CrossRef]
  34. Gusarov, A.V.; Smurov, I. Modeling the interaction of laser radiation with powder bed at selective laser melting. Phys. Procedia 2010, 5, 381–394. [Google Scholar] [CrossRef]
  35. Chandrasekhar, S. Hydrodynamic and Hydromagnetic Stability; Courier Corporation: North Chelmsford, MA, USA, 2013. [Google Scholar]
  36. Verhaeghe, F.; Craeghs, T.; Heulens, J.; Pandelaers, L. A pragmatic model for selective laser melting with evaporation. Acta Mater. 2009, 57, 6006–6012. [Google Scholar] [CrossRef]
  37. Juechter, V.; Scharowsky, T.; Singer, R.F.; Körner, C. Processing window and evaporation phenomena for Ti-6Al-4V produced by selective electron beam melting. Acta Mater. 2014, 76, 252–258. [Google Scholar] [CrossRef]
  38. Pang, S.; Chen, W.; Zhou, J.; Liao, D. Self-consistent modeling of keyhole and weld pool dynamics in tandem dual beam laser welding of aluminum alloy. J. Mater. Process. Technol. 2015, 217, 131–143. [Google Scholar] [CrossRef]
  39. Pang, S.; Chen, X.; Zhou, J.; Shao, X.; Wang, C. 3D transient multiphase model for keyhole, vapor plume, and weld pool dynamics in laser welding including the ambient pressure effect. Opt. Lasers Eng. 2015, 74, 47–58. [Google Scholar] [CrossRef]
  40. Qiu, C.; Panwisawas, C.; Ward, M.; Basoalto, H.C.; Brooks, J.W.; Attallah, M.M. On the role of melt flow into the surface structure and porosity development during selective laser melting. Acta Mater. 2015, 96, 72–79. [Google Scholar] [CrossRef]
  41. Scriven, L.E.; Sternling, C.V. The marangoni effects. Nature 1960, 187, 186–188. [Google Scholar] [CrossRef]
  42. Santos, E.C.; Osakada, K.; Shiomi, M.; Kitamura, Y.; Abe, F. Microstructure and mechanical properties of pure titanium models fabricated by selective laser melting. J. Mech. Eng. Sci. 2004, 218, 711–719. [Google Scholar] [CrossRef]
Figure 1. SEM (Scanning Electron Microscope) image of the Zr-1Mo powders used in this study.
Metals 07 00501 g001
Figure 2. The top surface roughness of the as-built Zr-1Mo alloys as a function of energy density.
Metals 07 00501 g002
Figure 3. The relative density of the as-built Zr-1Mo alloys as a function of energy density.
Metals 07 00501 g003
Figure 4. SEM micrographs of the polished surface of the as-built Zr-1Mo alloys with various energy densities: (a) 26.4 J·mm−3; (b) 60.3 J·mm−3; (c,d) 84.4 J·mm−3: (c) balling particle, (d) sputter particle; and scanning speeds: (ac) 1200 mm·s−1, (d) 600 mm·s−1.
Metals 07 00501 g004
Figure 5. Processing map of the surface morphology at five different scanning speeds and corresponding energy densities.
Metals 07 00501 g005
Figure 6. OM (Optical Microscope) micrographs of the polished surface of the as-built Zr-1Mo alloys with various scanning speeds: (a) 1200 mm·s−1, (b) 1050 mm·s−1, (c) 600 mm·s−1, (d) 1200 mm·s−1, and energy densities: (a) 26.4 J·mm−3, (b) 48.3 J·mm−3, (c,d) 84.4 J·mm−3.
Metals 07 00501 g006
Figure 7. Processing map of the pore distribution at five different scanning speeds and corresponding energy densities.
Metals 07 00501 g007
Figure 8. SEM images of the as-built Zr-1Mo alloys with various energy densities: (a) 35.2 J·mm−3, (b) 52.8 J·mm−3, (c) 60.3 J·mm−3, (d) 84.4 J·mm−3.
Metals 07 00501 g008
Figure 9. TEM (Transmission Electron Microscope) image of the as-built Zr-1Mo alloys at the energy density of 52.8 J·mm−3. The dashed lines indicate grain boundaries of an acicular crystal, and the white arrows indicate twins in the grain.
Metals 07 00501 g009
Figure 10. (a) The mass magnetic susceptibility of the as-built Zr-1Mo alloys with various energy densities; (b) The magnetic susceptibility of the as-built Zr-1Mo alloys averaged from specimens subjected to PBF (powder bed fusion), as-cast Zr-1Mo alloys, and Ti-6Al-4V ELI (Extra Low Interstitials) alloy.
Metals 07 00501 g010
Figure 11. Vickers hardness contour map against scanning speed and energy density.
Metals 07 00501 g011
Figure 12. (a) The oxygen concentrations of the as-built Zr-1Mo alloys as a function of energy density; (b) The nitrogen concentrations of the as-built Zr-1Mo alloys as a function of energy density.
Metals 07 00501 g012
Figure 13. The schematic drawings of the formation mechanism of randomly distributed pores.
Metals 07 00501 g013
Figure 14. Vickers hardness of the as-built Zr-1Mo alloys as a function of relative density (RD).
Metals 07 00501 g014
Table 1. The chemical composition of the gas-atomized Zr-1Mo powder.
CompositionNHOFeCMoCrHfSnZr
mass %0.0030.00170.0490.0060.050.930.010.020.32balence
Table 2. Process parameters for Zr-1Mo alloy powders.
Scanning Speed (mm·s−1)Laser Power (W)Scan StrategyLayer Thickness (μm)Hatch Distance (μm)Selected LaserSubstrateAtmosphereEnergy Density (J·mm−3)
600–120095Chess (5 × 5 mm2)2537.5–180Yb fiber laser (λ = 1070 nm)Ti (90 × 90 mm2)Ar (O2 < 0.1%)26.4–84.4

