Effect of Ni-Content on the Transformation Temperatures in NiTi-20 at. % Zr High Temperature Shape Memory Alloys

1
Department of Materials Science and Engineering, University of North Texas, Denton, TX 76203, USA
2
ATI Specialty Alloys and Components, Albany, OR 97321, USA
*
Author to whom correspondence should be addressed.
Metals 2017, 7(11), 511; https://doi.org/10.3390/met7110511
Submission received: 18 October 2017
/
Revised: 15 November 2017
/
Accepted: 16 November 2017
/
Published: 21 November 2017
(This article belongs to the Special Issue Shape Memory Alloys 2017)
Abstract
:The effect of Ni-content on phase transformation behavior of NiTi-20 at. % Zr high temperature shape memory alloy (HTSMA) is investigated over a small composition range, i.e., 49.8, 50.0 and 50.2 at. % Ni, by differential scanning calorimetry (DSC), high-energy synchrotron radiation X-ray diffraction (SR-XRD), scanning electron microscopy (SEM), and transmission electron microscopy (TEM). All samples show a monoclinic B19′ martensitic structure at room temperature. It is shown that even with these small variations in Ni-content, the alloy shows vastly different transformation temperatures and responds in a drastically different manner to aging treatments at 550 and 600 °C. Lastly, a discussion on H-phase composition with respect to bulk composition is presented.
1. Introduction
Since the discovery of the shape memory effect in near equi-atomic binary Ni–Ti alloys [1], considerable research efforts have been made to control the transformation temperatures (TTs), microstructure, and shape memory properties through alloying and thermo–mechanical processing [2]. Through this research, Ni–Ti-based shape memory alloys (SMAs) have now become an important technological material for a wide array of applications [3,4], i.e., specifically medical devices [5], actuators [6], etc. Despite this eclectic and ever-expanding list of applications, there exists more opportunity to enlarge the realm of potential uses by increasing the temperatures at which the characteristic phase transformation occurs, most notably in the aerospace industry [6,7,8,9].
It has been shown that binary Ni–Ti can exhibit maximum TTs of approximately 115 °C [2,6], specifically the austenitic finish (Af), but this can readily be increased by adding ternary additions such as Au, Pt, Pd, Hf or Zr to create high temperature SMAs (HTSMAs); however, with the exception of Hf and Zr, these additions increase production cost greatly, making them economically impractical for almost all applications, especially in the private sector where profit is the main concern. Following this logic, there still exists a need to create viable cost-effective HTSMAs. While NiTiHf HTSMAs are currently being heavily investigated due to their ease of processability and excellent shape memory characteristics, it is worth noting that Hf still costs ten times the price of Zr and is twice as dense; meaning that producing acceptable NiTiZr HTSMAs would allow for cheaper and lighter devices, two of the most important aspects in the aerospace industry. Therefore, it has been determined by the authors that the pursuit of NiTiZr HTSMAs is of both technological and intellectual importance.
The beneficial effects of Zr additions to Ni–Ti were first reported by Eckelmeyer et al. [10] in 1976 and later expanded by Adu Judom et al. [11] and Hsieh et al. [12,13] to include higher atomic percentages while still maintaining the characteristic austenite-to-martensite phase transformation, up to 25 at. % Zr when substituting for Ti and the amounts of Ti and Zr sum to above 51 at. %. Early research focused on Ti-rich compositions due to their higher TTs but soon proved to be too brittle, exhibited poor thermal stability, and formed a large number of intermetallic phases such NiTiZr Laves phase, Ni7(Ti,Zr)2, Ni10(Ti,Zr)7,and NiZr [13,14]; however, recent research has shifted to Ni-rich compositions due to the formation of nanoscale precipitates first recognized by Sandu et al. [15,16].
Since its indexing by Han et al. [17], hence the common name “H-phase”, in a NiTiHf HTSMA, numerous groups have reported and characterized the same structure in both NiTiHf and NiTiZr HTSMAs [7,18,19,20,21,22,23,24,25,26,27]. Most notably Yang et al. [24], who performed high resolution S/TEM and atomic modeling to verify the stability of the orthorhombic structure in Ni-rich NiTiHf, but spectrum of compositions has been reported for the phase, most notably with respect to the Ti:(Zr/Hf) ratio while maintaining a Ni:(Ti,Hf/Zr)approximately equal to 1-1.2:1 [17,23,24,26,27,28]. By this point, NiTiZr HTSMAs have slowly been disregarded, not only due to their initial failures but also due to the rapid success of comparable Hf alloys; although Evirgen et al. [18,19] studied the microstructural and shape memory effects of slightly Ni-rich NiTiZr and showed that the addition of these nanoprecipitates of the appropriate size could not only increase TTs but also the shape memory properties and thermal stability of the alloys. However, to the authors’ knowledge, there has yet to be a systematic study that examines how small changes in Ni-content of near equimolar compositions in NiTiZr HTSMAs can affect precipitation, TTs, transformation stability, and microstructure. It is the intent of this study to fill this void and to elucidate precipitation regions based on composition and aging temperature by examining three NiTi-20 at. % Zr HTSMAs with small changes in Ni-content. The three HTSMAS are subsequently characterized by differential scanning calorimetry (DSC), scanning electron microscopy (SEM), transmission electron microscopy (TEM), and high-energy synchrotron X-ray diffraction (SR-XRD).
2. Materials and Methods
Three 200 g ingots of NiTi-20 at. % Zr with Ni-content of 49.8, 50.0 and 50.2 at. % (referred to Ni-lean, equimolar and Ni-rich, respectively, throughout the paper) were arc-melted in an inert argon environment using high purity elemental Ni, Ti, and Zr at ATI Specialty Alloys and Components and supplied to the University of North Texas for further investigation. The as-cast ingots were then sectioned into approximate 7 × 7 × 45 mm3 strips and solutionized at 1000 °C for 1 h in air to remove any casting effects and subsequently mechanically polished to remove the formed oxide layer. Rolling of alloys was not attempted because all three compositions exhibited gross cracking during water quenching after solutionizing treatment. Solutionized samples were then sectioned into 7 × 7 × 1 mm3 slices, so that aging at 550, 600 and 800 °C for various times could be examined under the same starting metallurgical conditions. Aging at 550 °C was chosen since it is the generally accepted peak aging temperature for Ni-rich NiTiHf/Zr HTSMA [7,18,26]. Aging at 600 °C was chosen since this will increase the precipitation rate. Aging at 800 °C was chosen to investigate possible precipitation during hot rolling applications.
TTs were examined using a Netzsch differential scanning calorimetry (DSC) (Selb, Deutschland) 204 F1 Phoenix at a heating rate of 10 °C/min while under a helium environment to negate oxidation. Sample weights were kept between 20–30 mg and then thermally cycled from 50–400 °C. In addition, some samples were cycled 10 times to assess stability of the transformation. The austenitic and martensitic start, peak, and finish temperatures (As, Ap, Af, Ms, Mp and Mf respectively) represent the onset, peak position and the end of the transformation peaks measured in the DSC experiments.
High-energy synchrotron radiation X-ray diffraction (SR-XRD,) measurements were collected at the Advanced Photon Source (APS) in Argonne National Laboratory at the sector 11-ID-C beam line in transmission mode with a sample thickness of approximately 1 mm. For ex situ experiments, Debye–Scherrer diffraction patterns (APS, Argonne, IL, USA) were taken at a beam energy of approximately 105.1 keV and rectangular beam size of 0.3 × 0.3 mm2 for an exposure time of 0.5 s/frame incorporating 8 summed frames for approximately 4 s total exposure time for each measurement. Diffraction data was collected using a Perkin Elmer amorphous silicon detector, which was positioned approximately 1.8 m from the sample and calibrated using Ce2O powder. For in situ experiments, Debye–Scherrer diffraction patterns were continuously collected as the sample was heated from 30 to 550 °C at a rate of 30 °C/min and held for 3 h to observe precipitate growth. These measurements were recorded at a beam energy of 105.1 keV with a beam size of 0.5 × 0.5 mm2 for an exposure time of 0.1 s/frame incorporating 100 summed frames for an approximate total exposure time of 10 s for each diffraction pattern. A 2 mm stainless steel block was placed in front of the beam before the sample to act as an absorber to prevent overexposure of the diffraction patterns. Data analysis was performed using a combination of Fit2D [29], custom matlab code [30], Fiji [31], an imageJ package, for qualitative phase analysis, and MAUD [32], Materials Analysis Using Diffraction, for Reitveld refinement of the lattice parameters. Powder diffraction data for binary NiTi B19′ (PDF number: 03-065-0145) [33] was used as a starting point for refinement of NiTiZr martensitic phase. Ti2Ni phase structural parameters were obtained from the COD database [34] (COD ID: 2310267 [35]) and H-phase parameters were obtained from Yang et al. [24] and used for identification of XRD reflections.
Scanning electron microscopy (SEM) was performed using a Hitachi TM3030 (Tokyo, Japan). Samples were etched with a 26 mL glycerol, 6 mL concentrated HNO3, and 1 mL concentrated HF solution for 5 s. Area fraction was calculated using a total image area of 0.25 mm2 and measuring at least 3000 particles for each alloy. Transmission electron microscopy (TEM) samples were prepared using the lift-out method on an FEI Nova 200 Nanolab dual beam SEM (Hillboro, OR, USA)/focused ion beam (FIB) and thinned to an appropriate thickness for TEM imaging. High angle annular dark field scanning TEM (HAADF-STEM) images were collected using an FEI Techai G2 F20 S-Twin 200 keV field-emission S/TEM equipped with an EDS system to allow for compositional analysis. The HAADF detector specifically allows for Z-contrast imaging in STEM mode so that precipitation could easily be identified within the martensitic matrix.
3. Results
3.1. Differential Scanning Calorimetry (DSC) for Transformation Temperatures
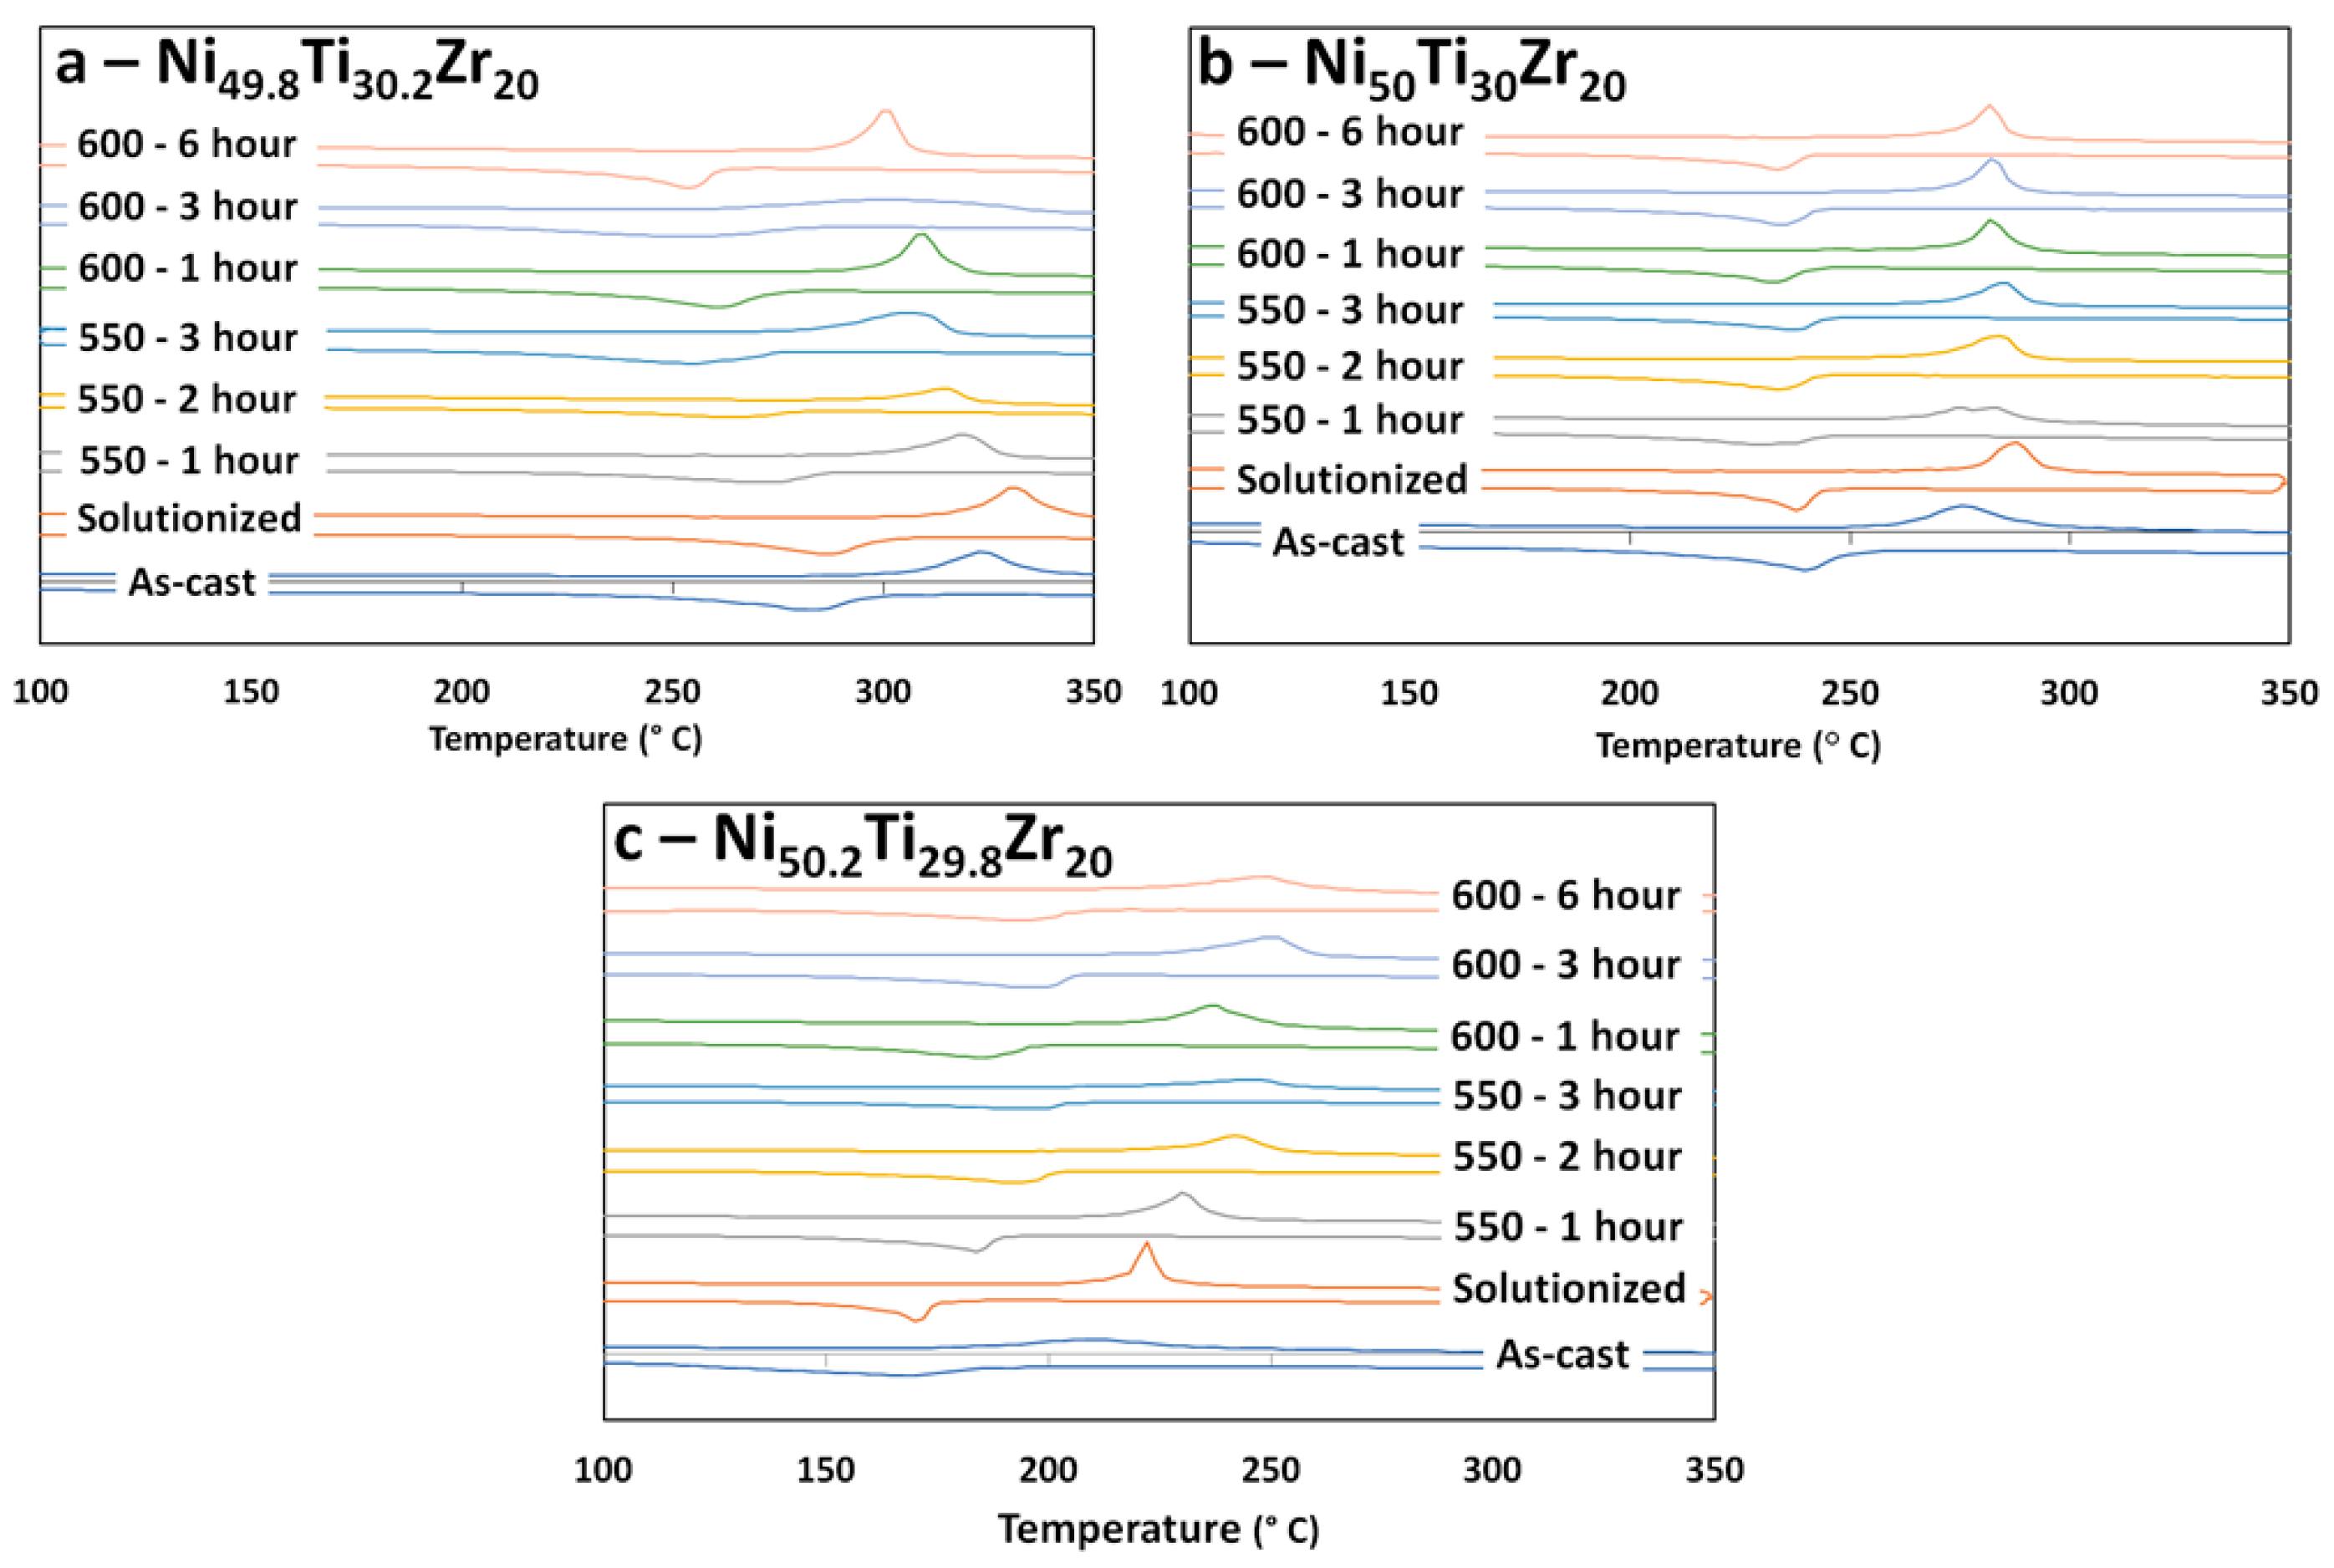
Figure 1a–c shows the DSC data over two thermal cycles for the Ni-lean, Equimolar, and Ni-rich samples, respectively. In the solutionized condition, the Ni-lean alloy exhibits the highest TTs, followed by the equimolar alloy and then the Ni-rich alloy. After aging at 550 and 600 °C, all three alloys show different responses with respect to changes in TTs. For the Ni-lean case, both the austenitic and martensitic phase transformation peaks continually fall to lower temperatures and slightly broaden with increasing aging times. The Ni-rich alloy exhibits the opposite trend with respect to TTs position. As aging times increase, TTs also increase while a peak broadening is also observed. The equimolar alloy is observed to be less sensitive to aging effects with only minor changes in the DSC curves despite what aging treatment is employed. The one exception to this is the 550 °C for 1 h (lowest temperature and shortest time); a two-stage transformation is observed at this heat treatment.
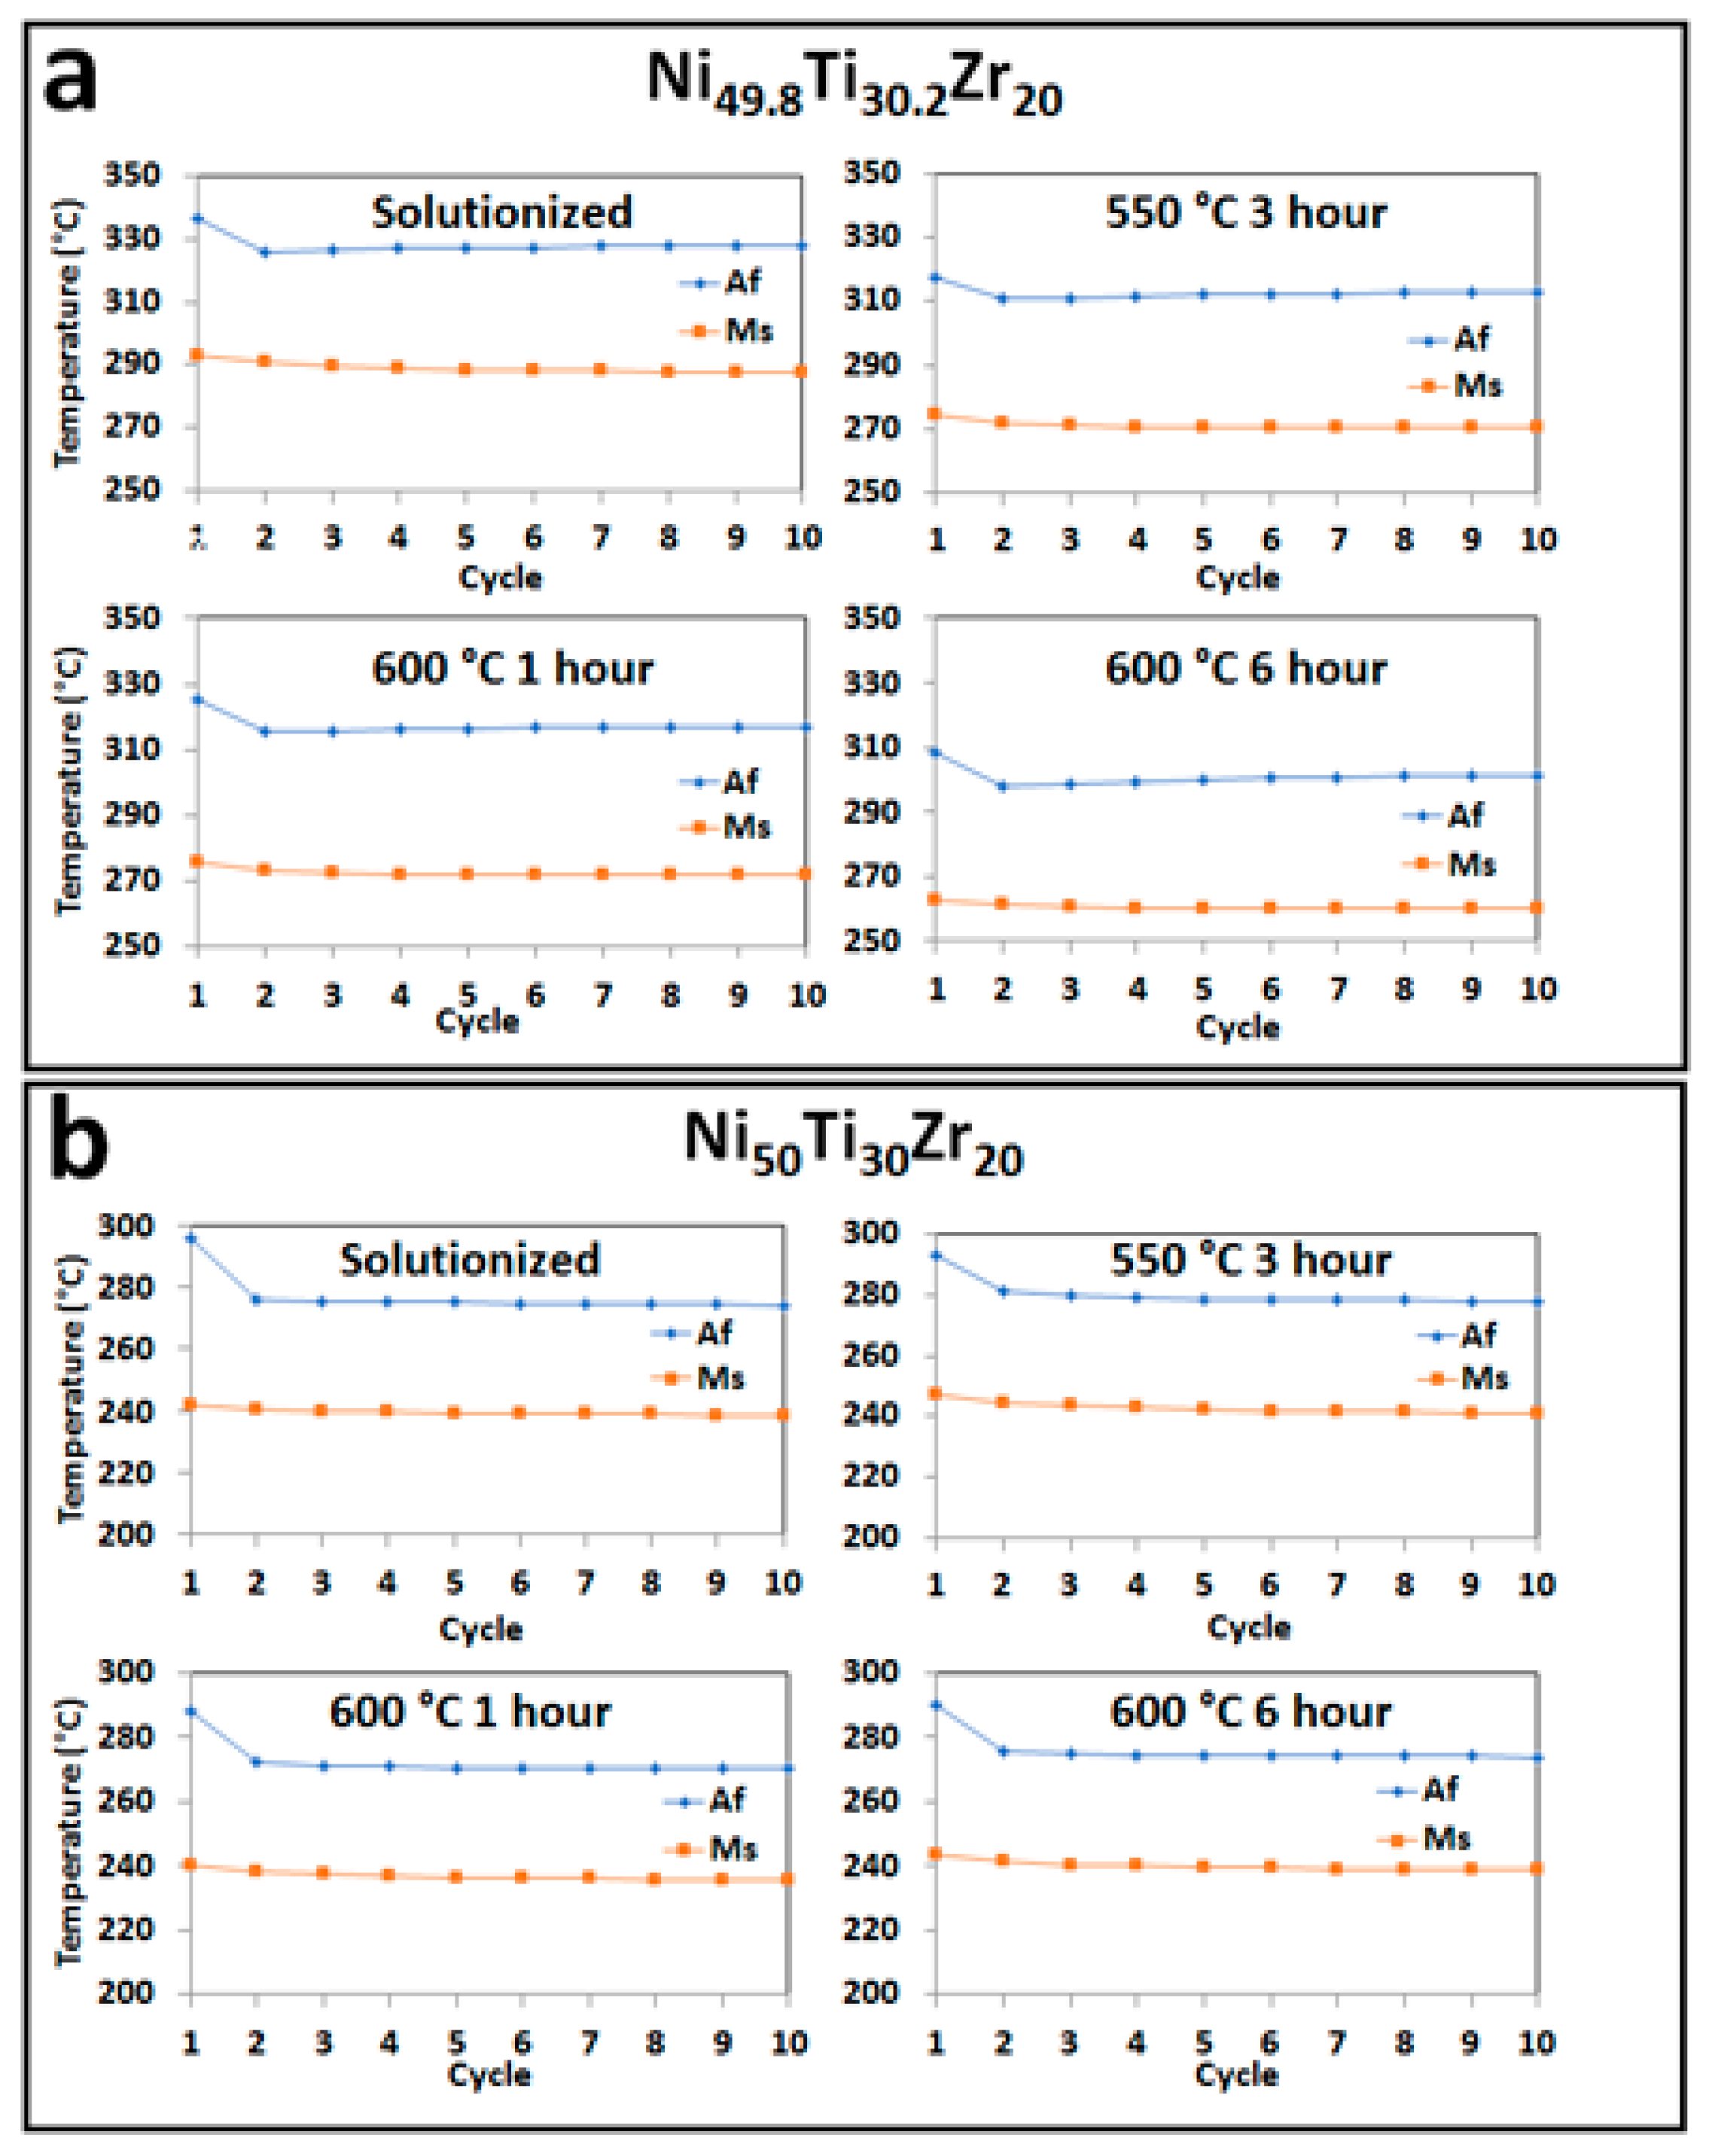
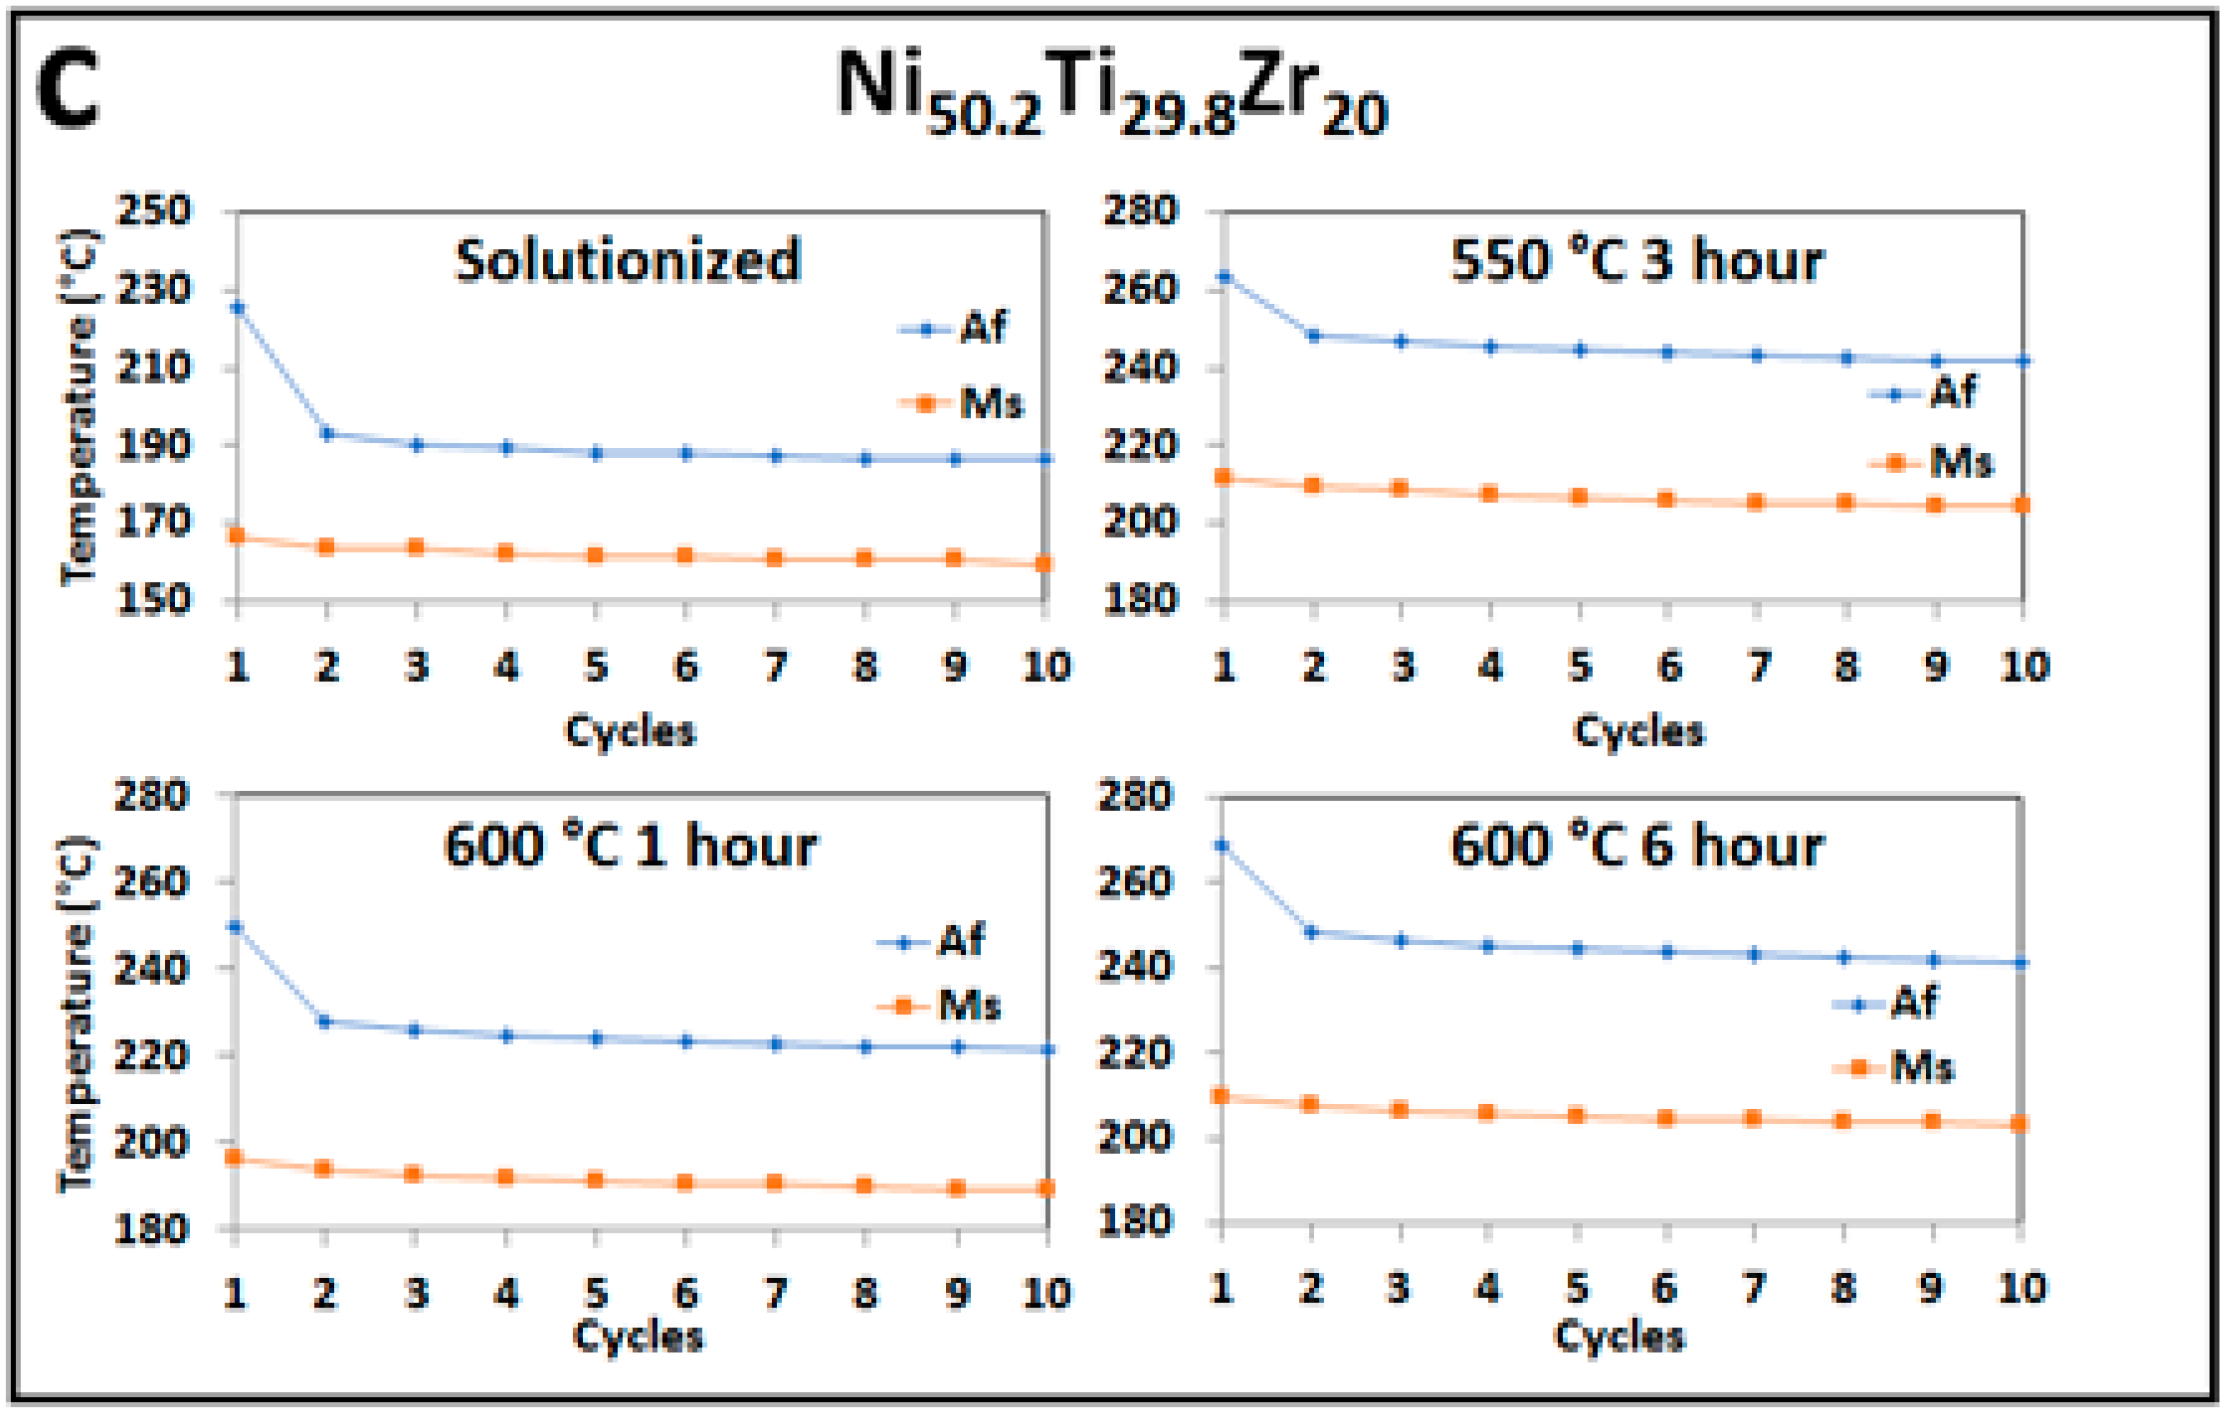
Figure 2a–c shows the transformation peak positions, specifically Af and Ms, from DSC measurements over ten thermal cycles for the solutionized, 550 °C for 3 h, 600 °C for 1 h, and 600 °C for 6 h conditions for the Ni-lean, equimolar, and Ni-rich alloy, respectively. For the rest of this article, we will define a stable transformation as a temperature drop less than 0.5 °C between consecutive cycles for both Af and Ms. Using this criterion and examining the solutionized conditions, it is observed that the Ni-lean and equimolar exhibit a stable phase transformation after only three heating cycles, while the Ni-rich achieves stability after eight thermal cycles. Aging the Ni-lean and equimolar samples does not affect the overall stability of the transformation with all three aging treatments showing a transformation temperature stabilization after 3–4 heating cycles. For the Ni-rich sample, all three heat treatments again reach transformation stabilization after eight heating cycles, similar to the solutionized sample, but the overall transformation temperature drop for the Af, i.e., the transformation temperature at cycle one minus cycle ten, is approximately 15 °C less for all three heat treatments, 39.5 °C for the solutionized and approximately 25 °C for the heat-treated samples. Overall, the Ni-lean and the equimolar samples show much better stability in TTs than the Ni-rich sample no matter which heat treatment schedule is performed.
3.2. Microstructural and High Energy Synchrotron Radiation X-ray Diffraction (SR-XRD) Analysis
Figure 3a–c shows SEM images of the Ni-lean, equimolar, and Ni-rich alloy, respectively, in the solutionized condition. The micrographs indicate a mostly martensitic structure with the presence of (Ti,Zr)2Ni or (Ti,Zr)4Ox type precipitates in all the samples, black phases in the micrographs. These will be discussed as (Ti,Zr)2Ni precipitates for the remainder of this article. The area fraction of the (Ti,Zr)2Ni precipitates increases with decreasing Ni-content and the size of the precipitates also increases slightly with the Ni-lean showing a higher distribution of large particles. Other conditions, are not shown due to a lack of change associated with the micrographs at SEM resolution and therefore will no longer be discussed.
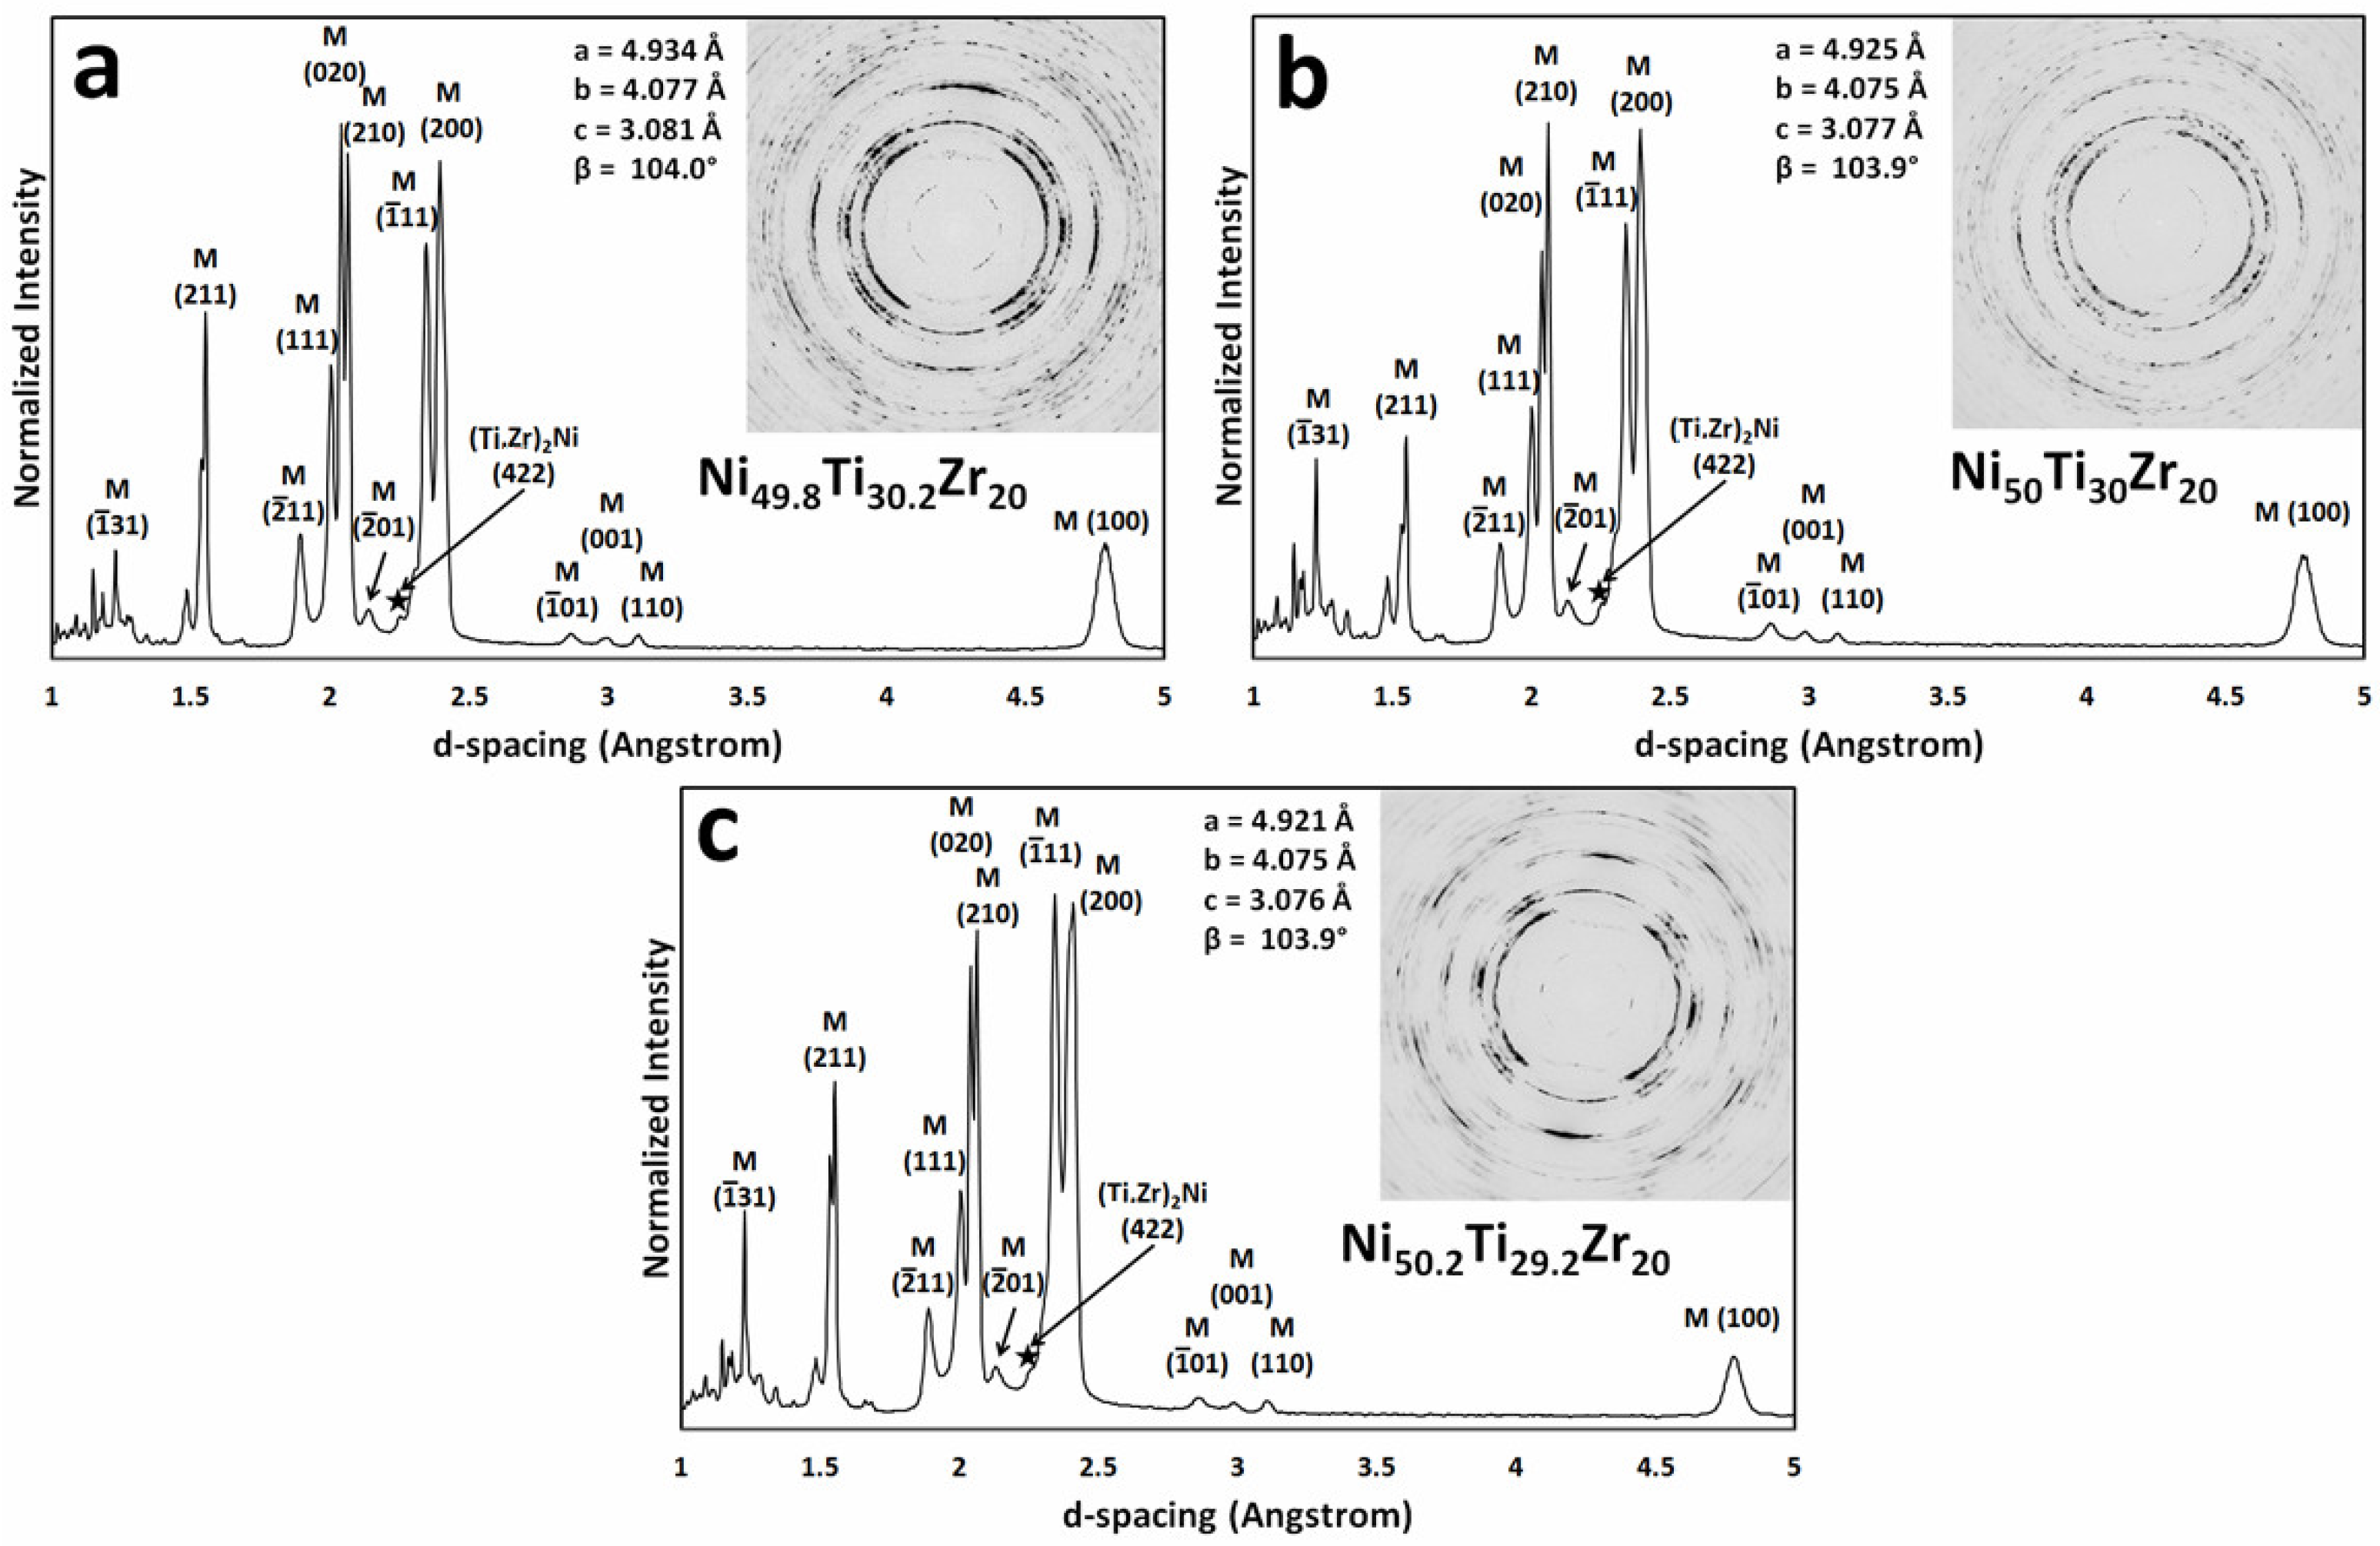
Figure 4a–c shows both the full Debye–Scherrer diffraction patterns and the corresponding 1-D integrated diffraction pattern from ex situ experiments for the solutionized conditions of the Ni-lean, equimolar and Ni-rich alloy, respectively. The calculated lattice parameters using a Reitveld refinement fitting method are also given. All three alloys show similar results that indicate a fully monoclinic B19′ structure and residual texture, i.e., oriented diffraction spots, associated with the casting process. In addition, all of the diffraction patterns appear “spotty” due to the small beam size in relation to the grain size although enough grains are being irradiated to confirm that the alloys exhibit polycrystalline behavior. Based on SEM images, it is estimated that approximately 2500 grains, martensitic lathes, are within the irradiated volume. Lastly, the only notable second phase present is a (Ti,Zr)2Ni peak centered at 2.26 Å, which is observable in all the samples but is highest in intensity in the Ni-lean case, Figure 4a. No residual austenite is detected in any of the solutionized conditions.
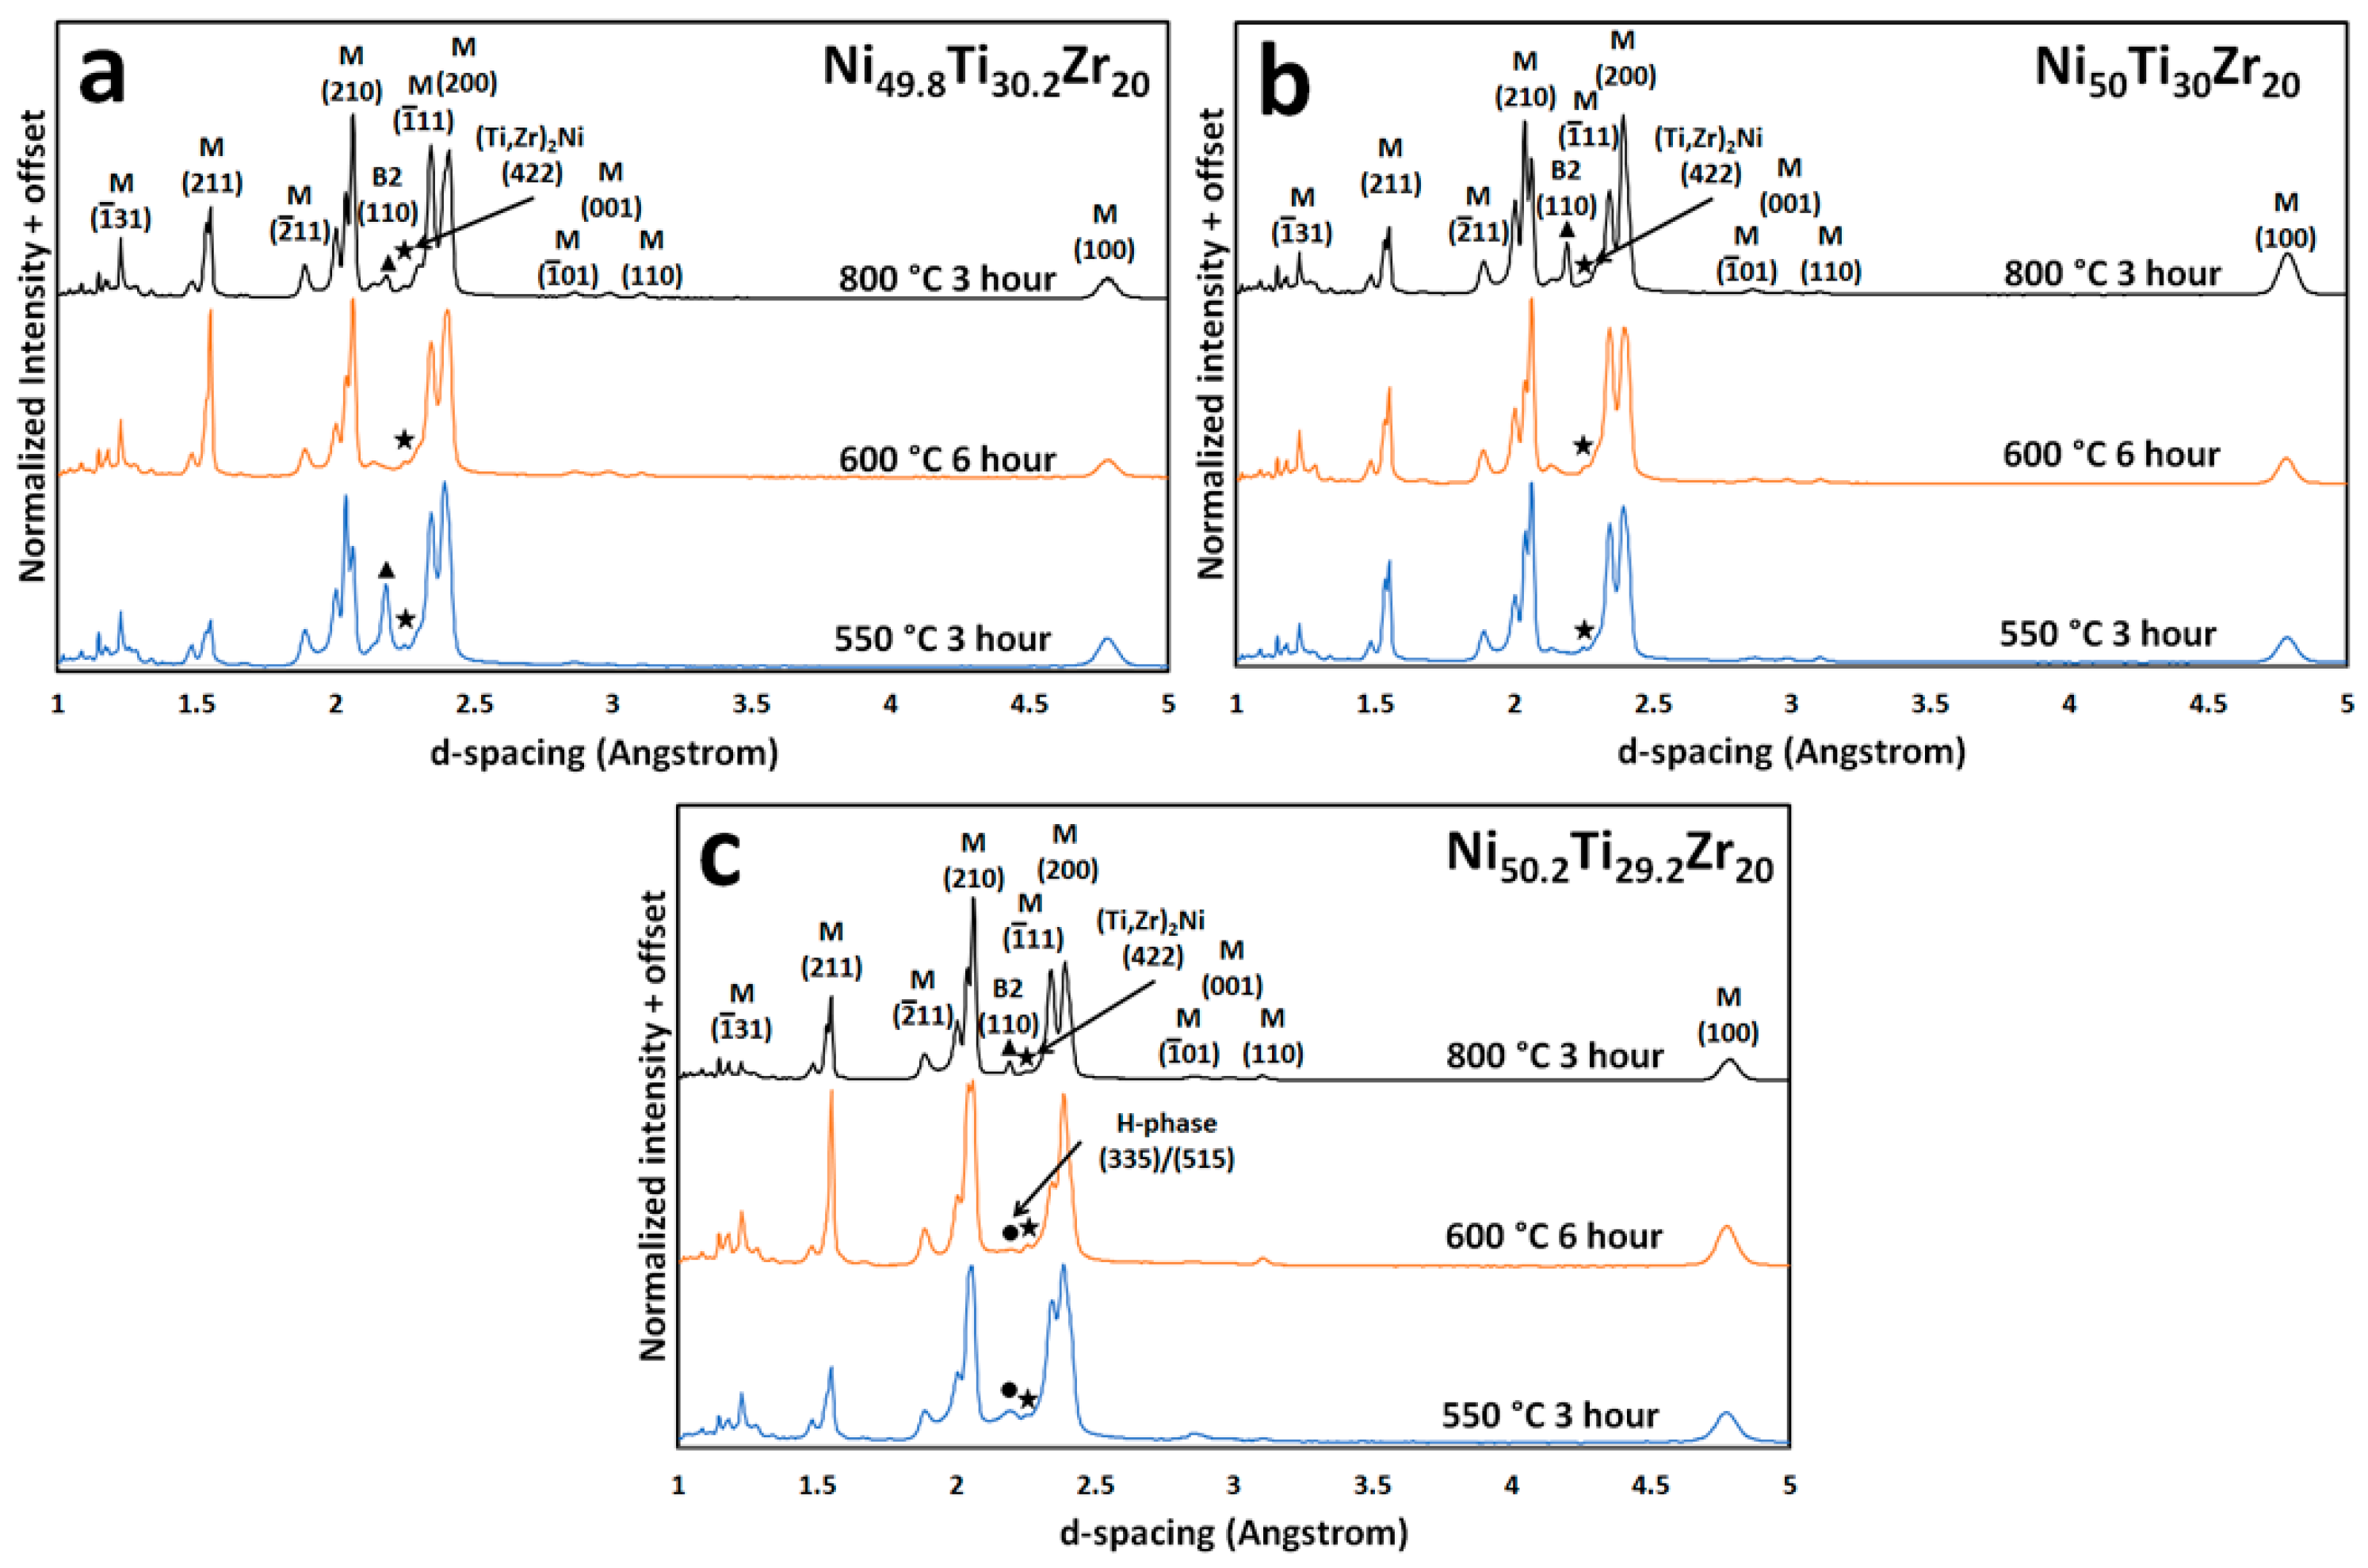
Figure 5a–c shows integrated 1-D diffraction patterns from ex situ experiments, which have been normalized and offset, for the 550 °C for 3 h, 600 °C for 6 h, and 800 °C for 3 h heat treatment conditions for the Ni-lean, equimolar and Ni-rich case. Looking at the Ni-lean case, Figure 5a, it is observed that a sharp peak is apparent between the martensitic fingers at approximately 2.19 Å and is indexed to be residual austenite residing in the martensite matrix. This peak is most prevalent in the 550 °C for 3 h and least visible in the 600 °C for 6 h condition, which is most likely due to the small interaction volume associated with the micro-beam used to collect the diffraction data in addition to the low intensity, spotty nature of the residual austenite throughout the matrix. The main point of interest however is tracking the (Ti,Zr)2Ni precipitate phase, e.g., small peak at 2.25 Å. From the diffraction patterns taken during ex situ experiments, it is not readily obvious that any meaningful change in amount of precipitates can be observed. Figure 5b shows the diffraction data for the equimolar alloy. No observable phase growth is observed at any condition when the alloy is treated at 550 °C or 600 °C for any amount of time. However, once the temperature is raised to 800 °C for 3 h, the same peak for the residual austenite at 2.19 Å is observed. In Figure 5c, the Ni-rich 1-D diffraction data, a different broad peak is observed, centered at 2.21 Å, in the diffraction data when the alloy is treated at 550 °C or 600 °C. This peak has been indexed as the nano-strengthening H-phase seen in other NiTiZr and NiTiHf HTSMAs compositions [7,17,18,23,26,28] using the basis positions from Yang et al. [24]. Once the temperature increases to 800 °C, the presence of the broad H-phase peak is no longer observed, but rather the sharp residual austenite peak at 2.19 Å is observed instead.
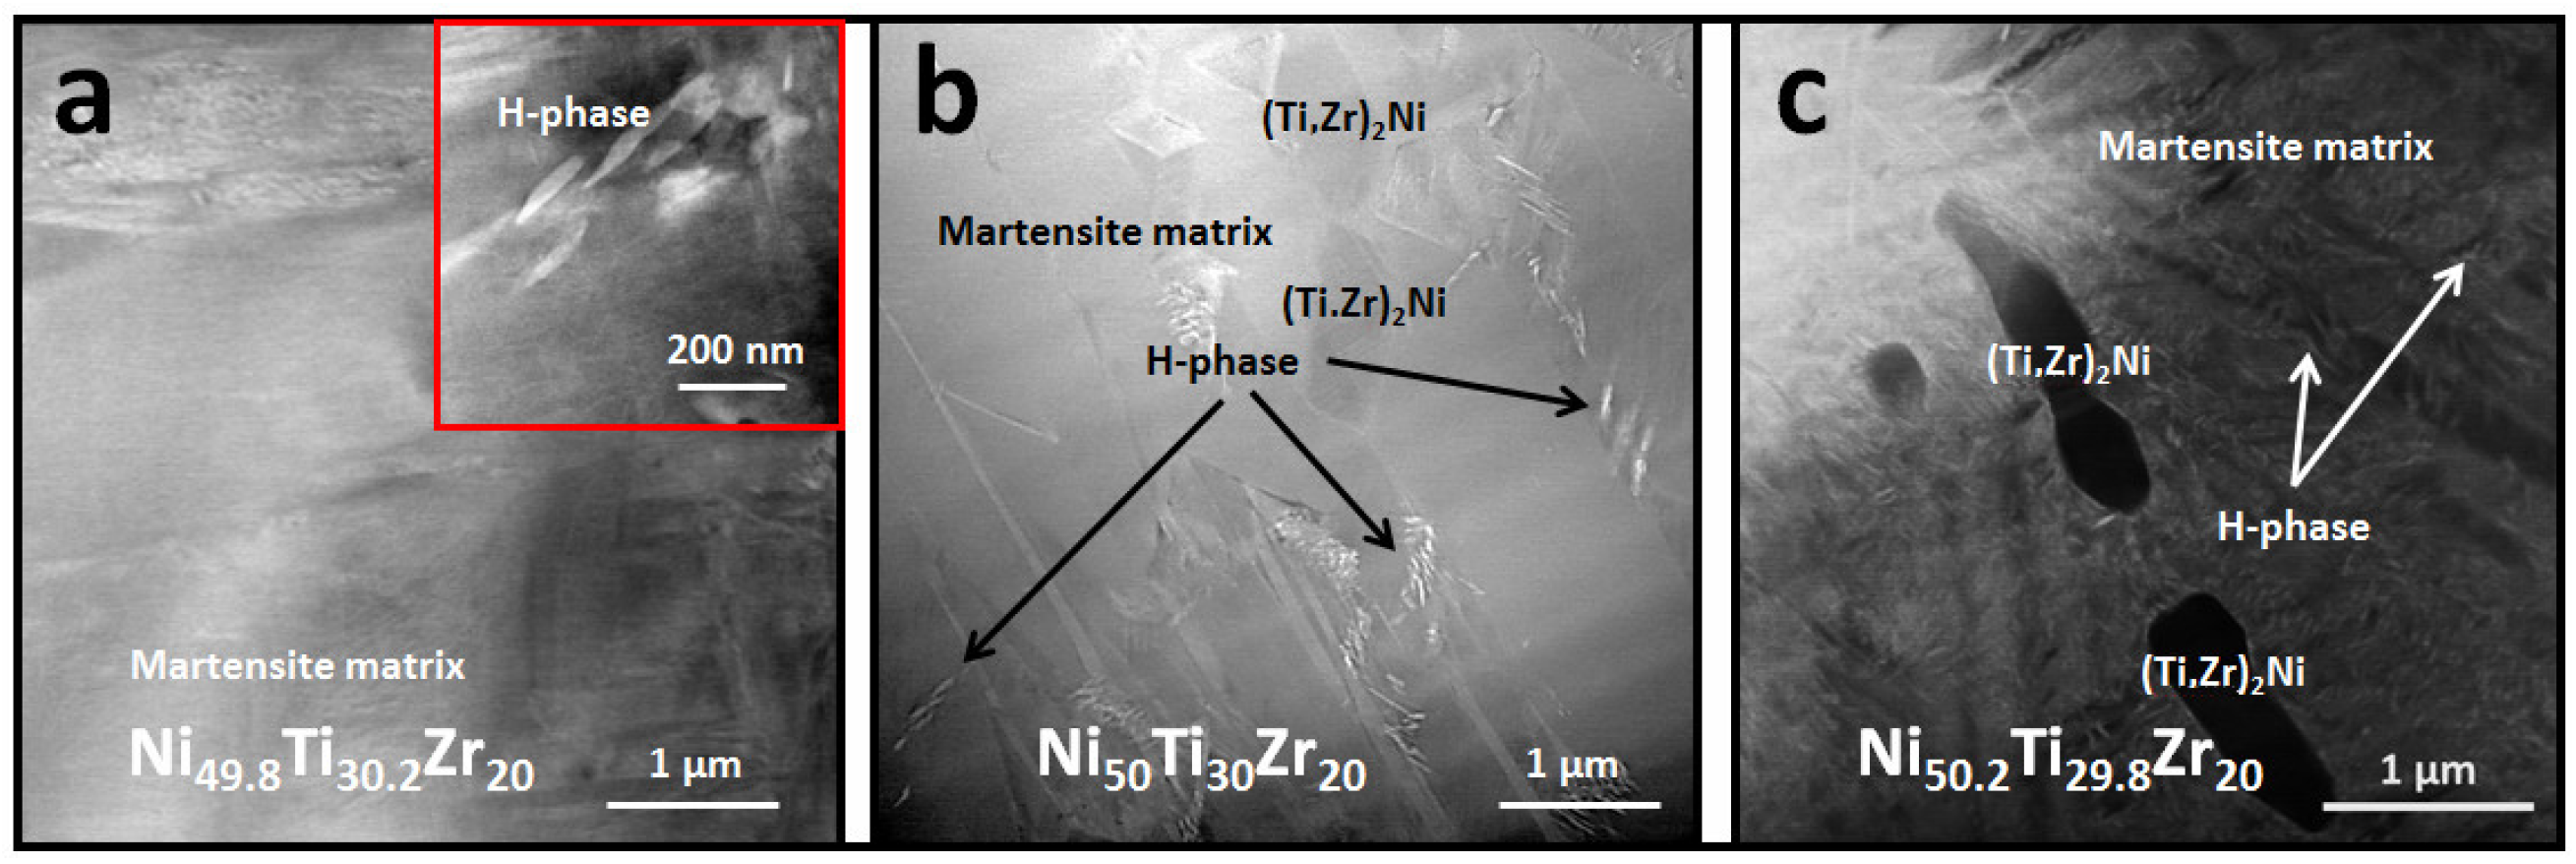
Figure 6a–c shows HAADF-STEM images for the 600 °C 6 h heat treatment for the Ni-lean, equimolar, and Ni-rich alloys, respectively. For the Ni-lean case, a low contrast image is observed with no major precipitation on the sub-micron scale. The inset in Figure 6a shows small localized grain boundary precipitation on the martensitic lathes of the nanoscale H-phase and confirmed by EDS measurements, although this was the only location on the entire TEM liftout where these precipitates were observed. The equimolar alloy shows a few (Ti,Zr)2Ni precipitates but no major amount of precipitation; however, small pockets of H-phase along the martensitic lathes are observed. These are evident by the bright white spots in the micrographs due to the higher atomic concentration of Zr with respect to the matrix. The Ni-rich alloy exhibits an appreciable concentration of the lenticular H-phase precipitates on the order 130 ± 50 nm in length and 35 ± 8 nm in width homogenously dispersed throughout the martensitic matrix. In addition, two large (Ti,Zr)2Ni precipitates are also observed.
Figure 7 presents the measured average composition for the observed H-phase precipitates over the nominal Ni-content. It should be noted that only three H-phase precipitates were observed in the entire Ni-lean TEM liftout and only approximately 15–20 were found in the equimolar TEM liftout. The measured composition of the H-phase gives an approximate at. % Ni:(Ti,Zr) ratio of 1:1 for all three alloys but the relative amount of Ti and Zr appears to deviate when Ni-content is above 50 at. % with a 10 at. % increase in Zr-content for the measured precipitates in the Ni-rich alloy.
Figure 8a–c shows the integrated normalized 1-D diffraction patterns from in situ SR-XRD experiments for the Ni-lean, equimolar, and Ni-rich alloys, respectively, at 550 °C for 0, 1, 2, and 3 h of the isothermal hold in the d-spacing range of 2.00–2.75 Å. XRD measurements collected during in situ experiments were performed with a slightly larger beam size, with respect to the diffraction data collected during ex situ experiments, to improve grain statistics. In addition, in situ measurements allow for observation of the phase evolution at a single location on the samples, and therefore remove any area dependent errors that can be produced using a micro-beam for ex situ measurements. In all cases, a small amount of the Ti2O and hexagonal Ti2ZrO are observed. Also, a small reflection originating from TiC is observed and likely was formed during casting of the alloys. Al2O3 peaks are also observed, but these are due to the insulation in the furnace used during the experiment. For the Ni-lean alloy, it is evident from the relative intensity of the austenite (110) and the (Ti,Zr)2Ni (422), that there exist a larger fraction of the (Ti,Zr)2Ni precipitates within the irradiated volume upon initially reaching 550 °C (0 h diffraction pattern) than is observed in either the equimolar or Ni-rich alloy. It is observed that the relative intensity of the austenite (110) and the (Ti,Zr)2Ni (422) is changing with time due to the decrease in intensity of the austenite (110) peak because of orientation changes within the B2 phase within the interaction volume, while the intensity of (Ti,Zr)2Ni (422) peak is relatively the same throughout the duration. As time is increased, the intensity of the other two (Ti,Zr)2Ni reflections shown in Figure 8 grow, that is the (511) at 2.16 Å and the (331) at 2.57 Å, throughout the duration of the experiment. This observation can be explained as the (Ti,Zr)2Ni phase does not act like a homogenous powder phase as it is in a low volume fraction. In the equimolar alloy, there exist an initial amount of the (Ti,Zr)2Ni precipitates but no major growth of the (Ti,Zr)2Ni phase is observed within the 3 h of the experiment. The Ni-rich alloy also shows an initial amount of (Ti,Zr)2Ni precipitates but with a much lower intensity with respect to both the Ni-lean and equimolar alloys. As the sample is heated, little change is observed with regards to phase precipitation.
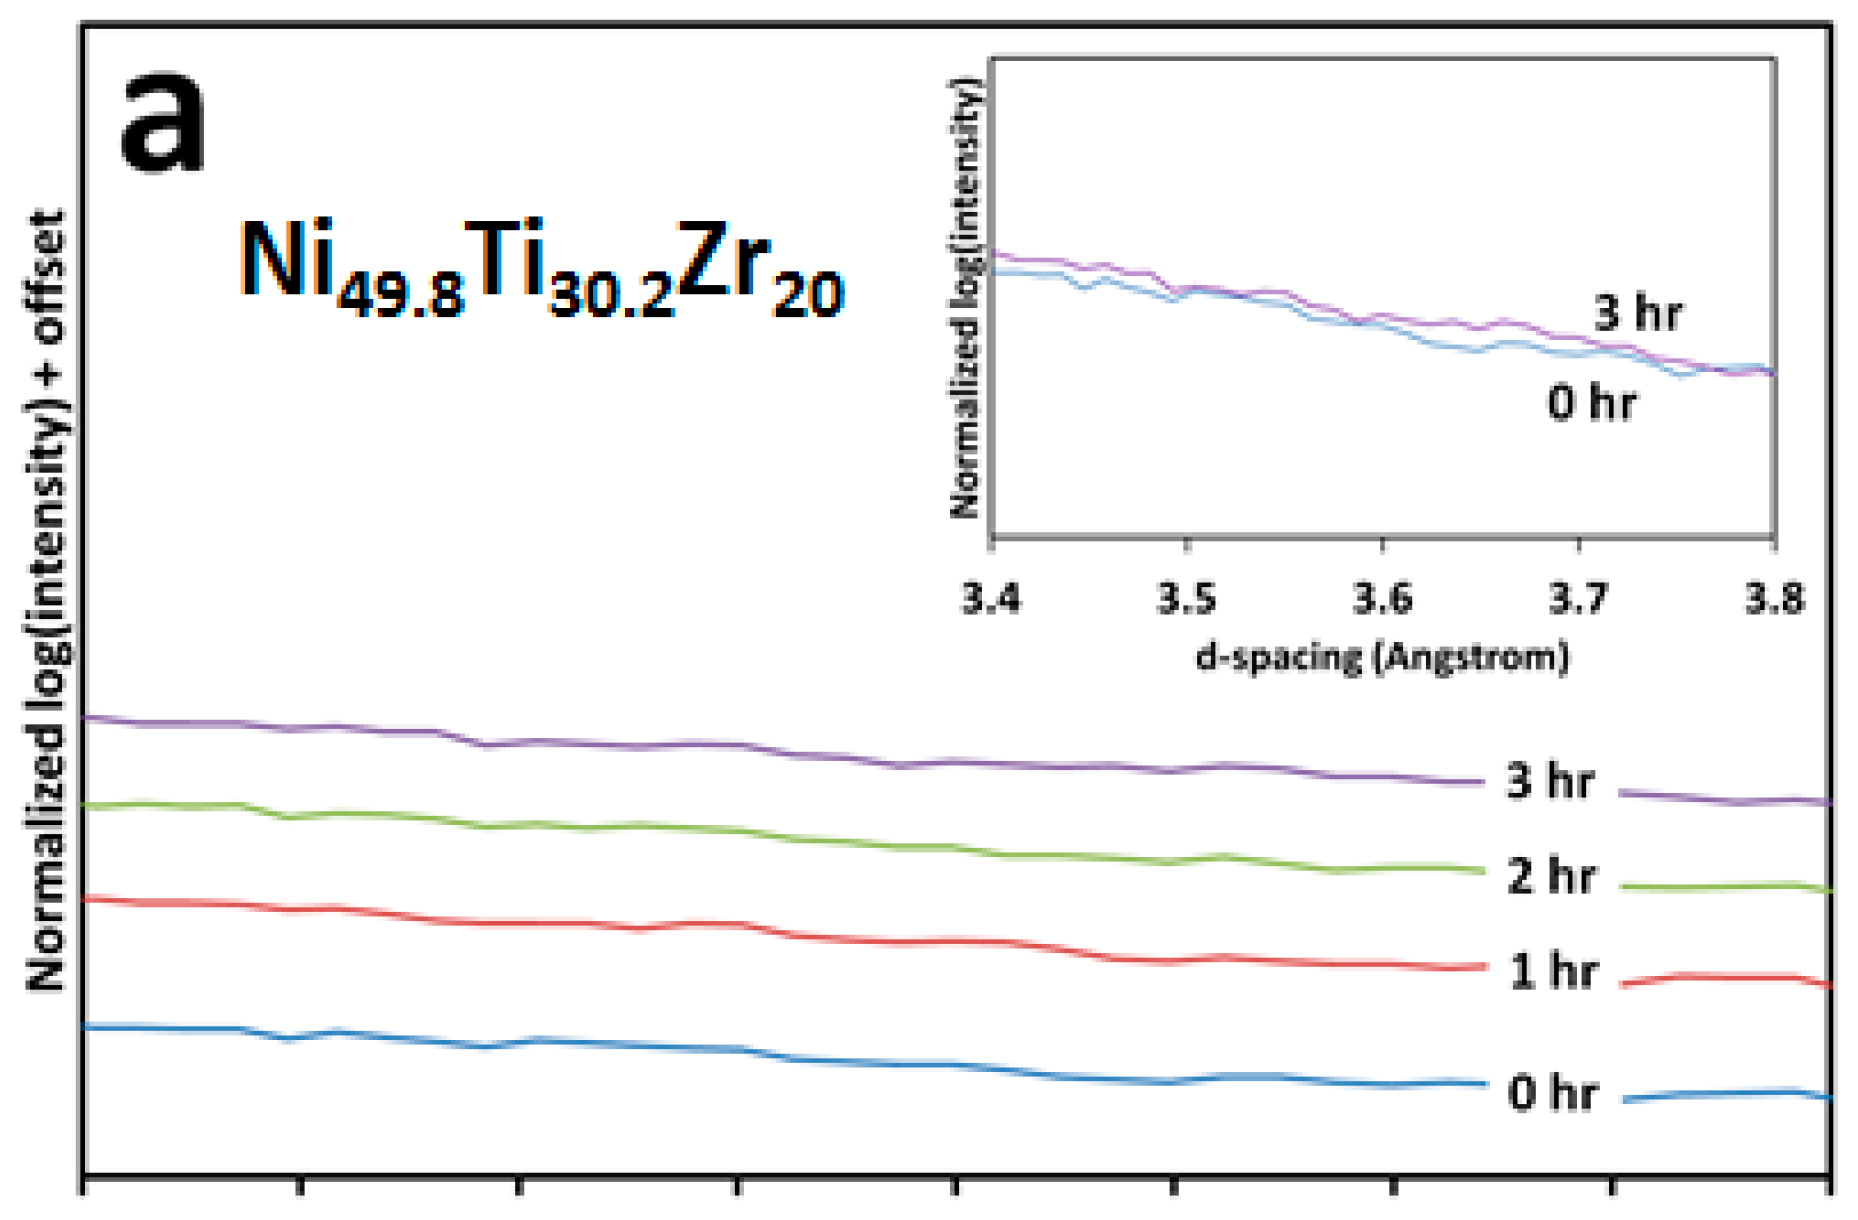
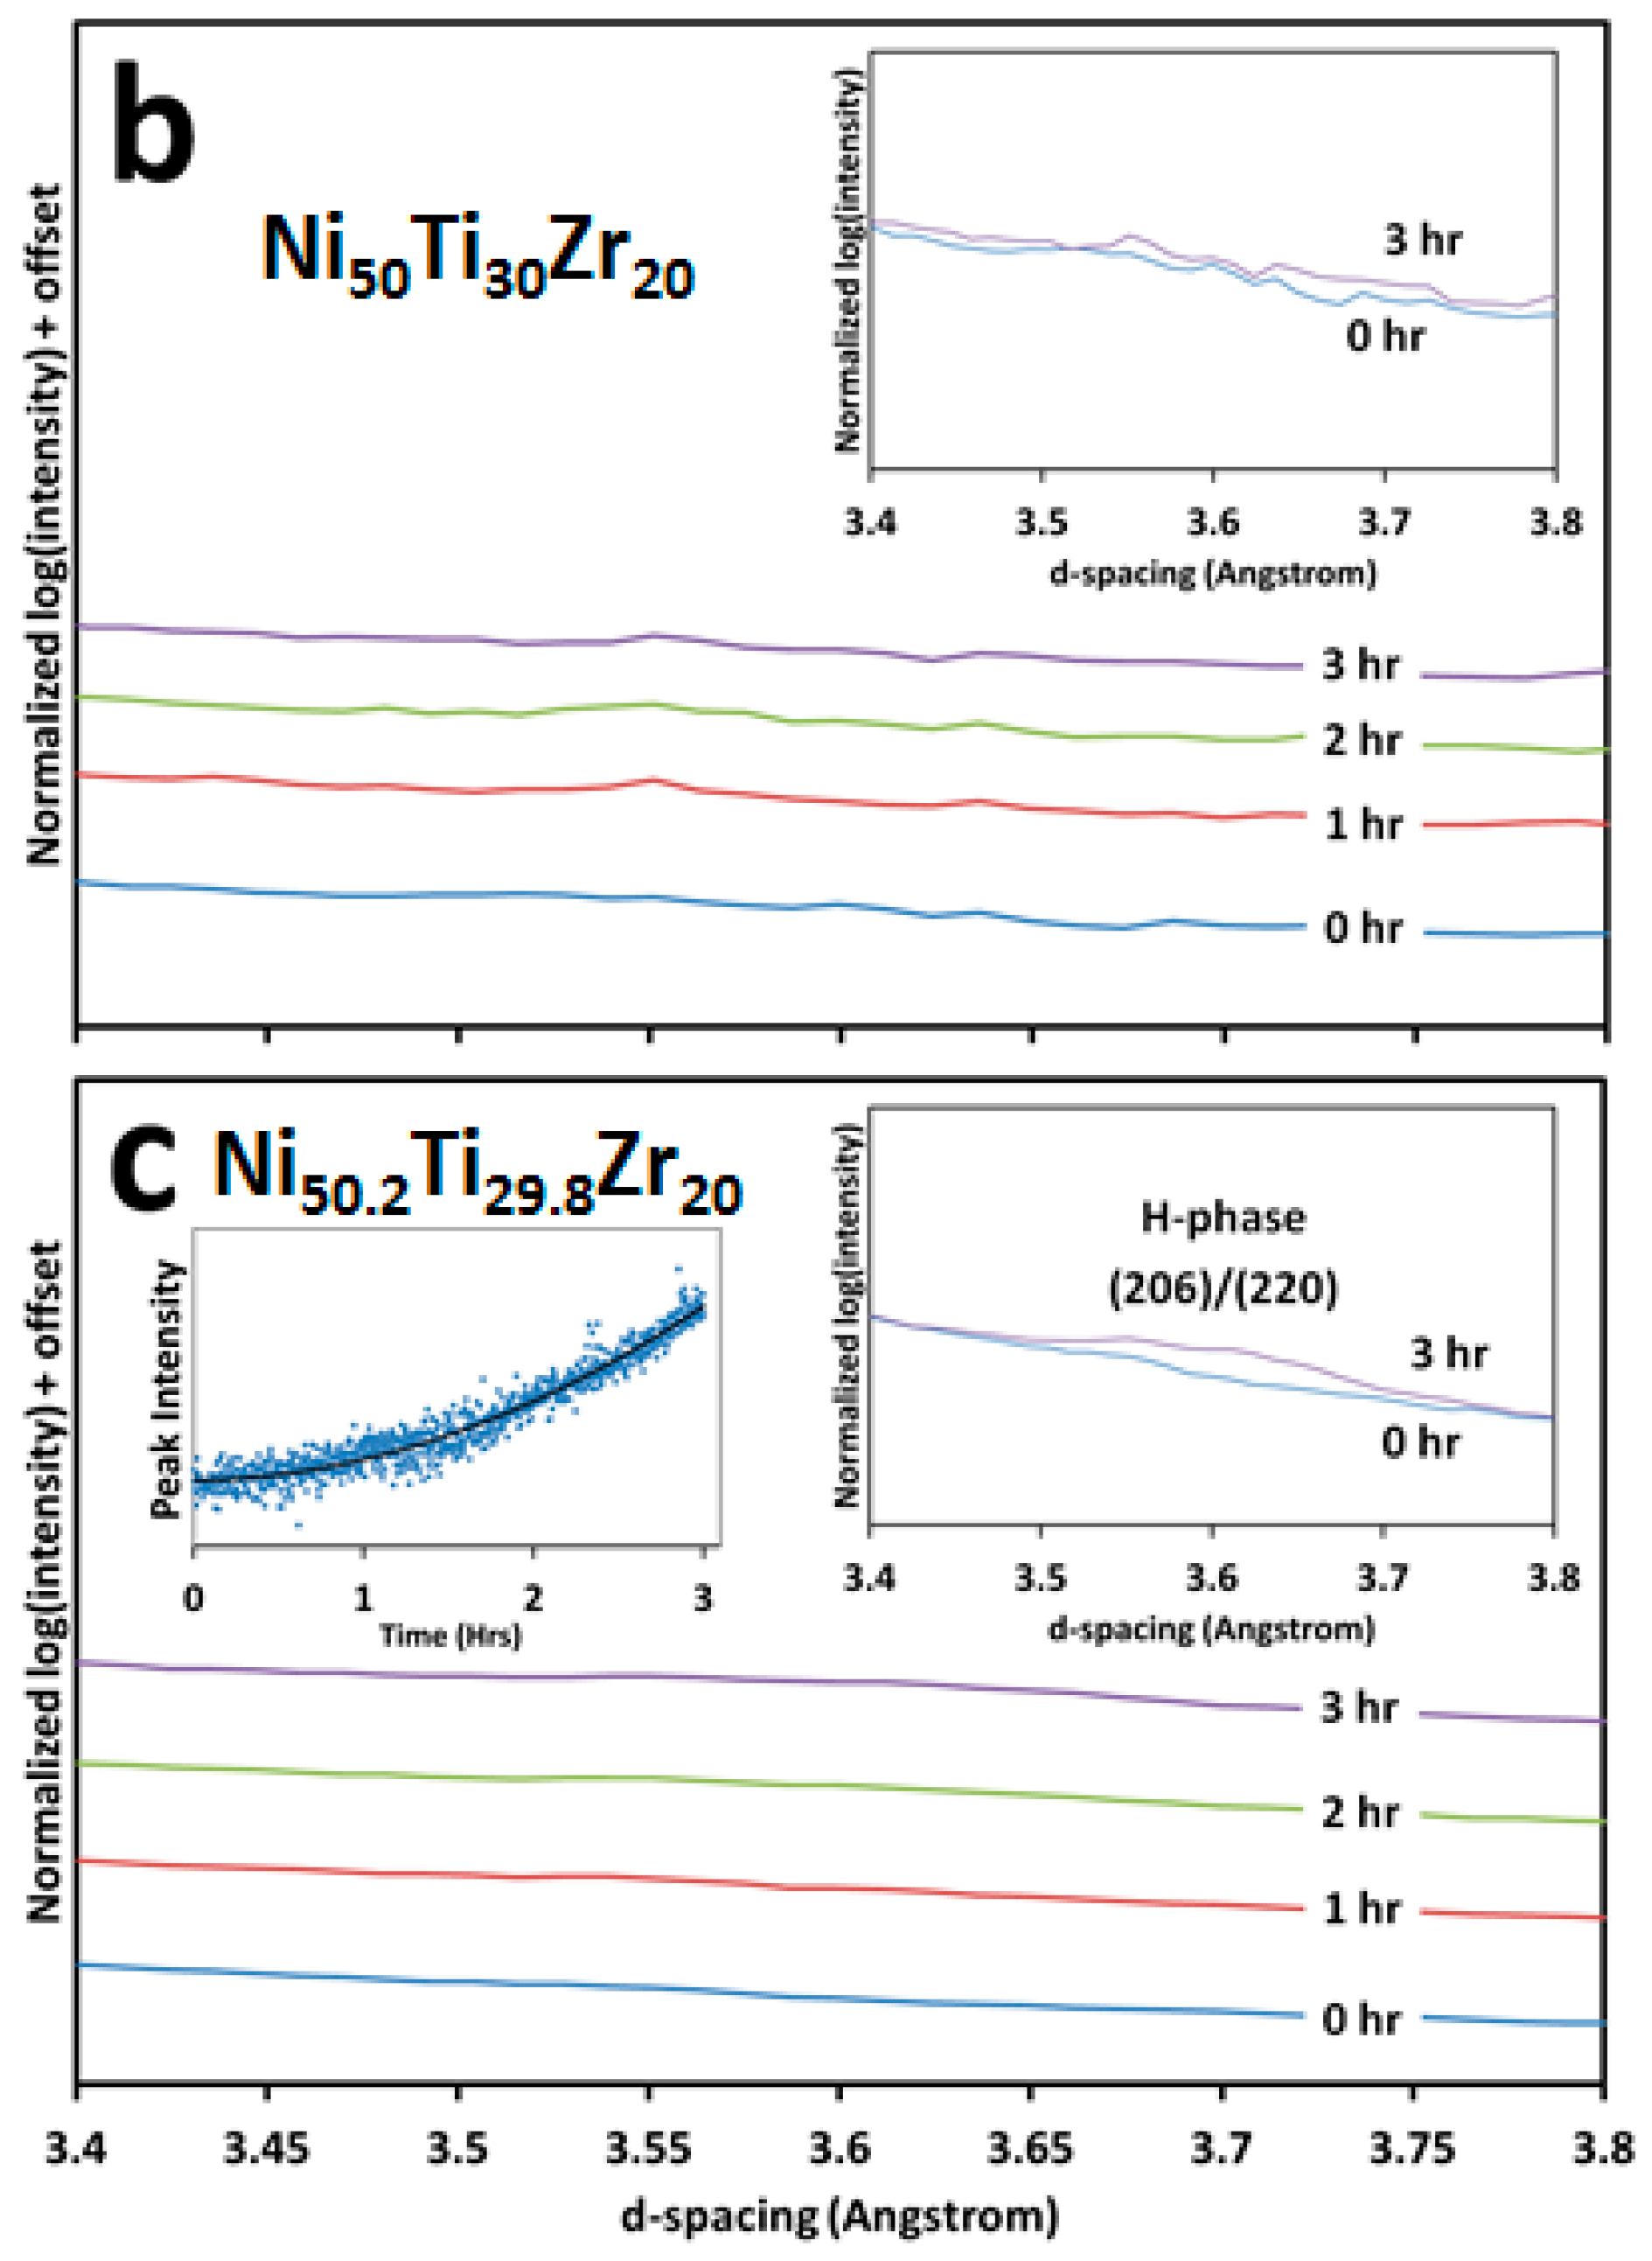
Figure 9a–c shows the integrated normalized 1-D diffraction patterns from the in situ SR-XRD experiments for the Ni-lean, equimolar, and Ni-rich alloys, respectively, at 550 °C for 0, 1, 2 and 3 h of the isothermal hold in the d-spacing range 3.4–3.8 Å with an inset of the 0 and 3 h stacked to emphasize the change. In this d-spacing range, it is possible to independently observe the growth of (206)/(220) H-phase reflections, centered at 3.57 and 3.61 Å, respectively. It is clear, that no measureable growth is observed in either the Ni-lean or equimolar but a small broad hump becomes visible as aging proceeds in the Ni-rich alloy indicating the growth of the H-phase precipitates. The peak is observed to be very low in intensity and extremely broad in the aging condition due to the volume fraction and size scale associated with its formation.
4. Discussion
4.1. Transformation Temperatures and Precipitation with Respect to Ni-Content
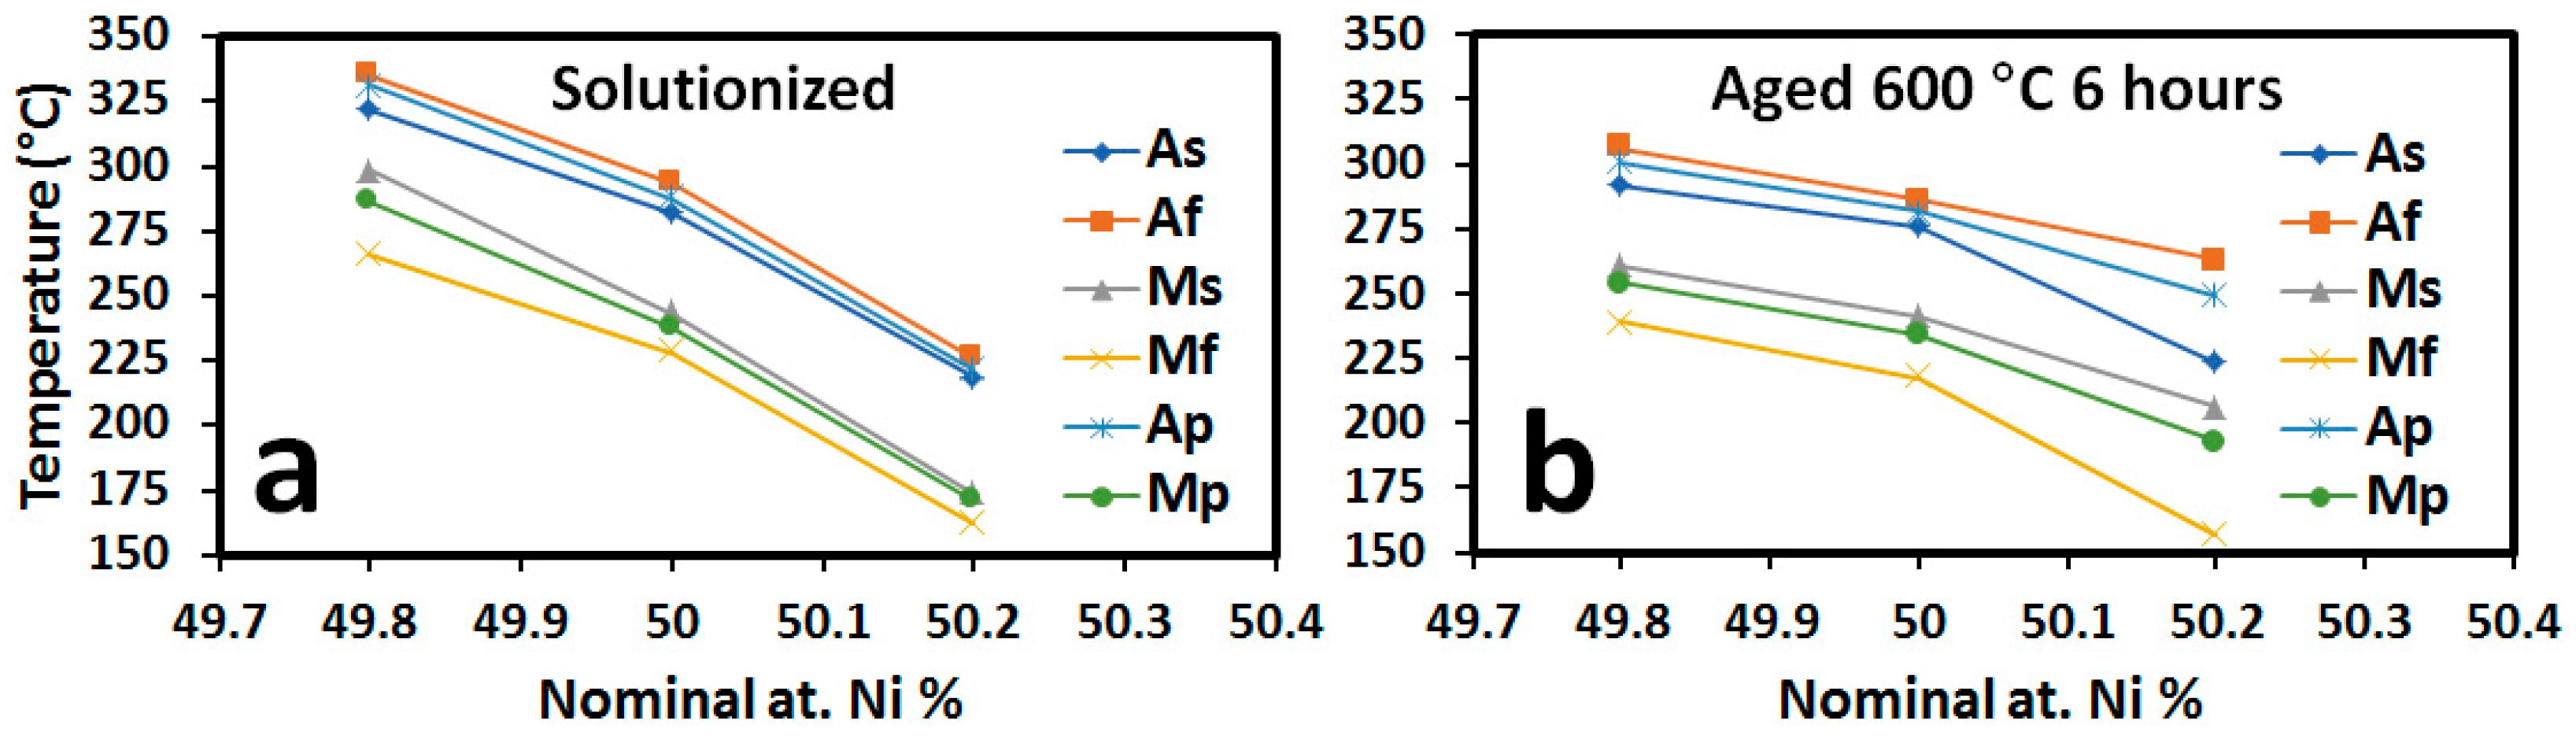
Figure 8a shows a plot of the transformation temperatures of the solutionized condition vs. nominal Ni at. %. It is important to note the sharp drop in TTs from the Ni-lean, 49.8 at. % Ni, to the Ni-rich, 50.2 at. % Ni, composition. There is an approximate 110 °C change in both the austenitic and martensitic TTs. When compared with previous research for binary NiTi of similar compositions (Ni49.8Ti50.2 and Ni50.2Ti49.8), only an approximate 36 °C change [36] is seen over this composition range. This confirms that strict composition control during production is even more important in NiTiZr HTSMAs than in conventional binary NiTi SMAs due to the inclusion of the Zr atoms substituting on the Ti-sites in the B19′ and B2 structures. All the alloys investigated in this study respond very differently when aging at 550 and 600 °C. For brevity, only the peak positions for the two characteristic phase transformations, Ap and Mp, will be discussed but other TT metrics, i.e., As, Af, Ms and Mf follow the same trends.
Starting with the Ni-lean case, TTs drop as the alloy is aged at 550 and 600 °C. At 550 °C, a continual drop in both the Ap and Mp is observed from 1–3 h with a maximum drop of 25 °C and 31 °C for the Ap and Mp, respectively, after aging for 3 h. When the temperature is increased to 600 °C, the drop in TTs almost completely levels off after a 3 h heat treatment with a drop of approximately 30 and 33 °C for the Ap and Mp, respectively. The drop in TTs can be explained by the formation of the (Ti,Zr)2Ni precipitates, as confirmed by the SR-XRD patterns from the in situ experiment presented in Figure 8a, which upon their formation or coarsening will cause the depletion of Ti from the martensitic matrix, therefore, creating a slightly higher Ni-content in the B19′ structure, which is directly proven to drop TTs in Figure 10a. It can be concluded that the precipitation/coarsening rate of (Ti,Zr)2Ni precipitates is faster at 600 °C than at 550 °C, although no in situ data was collected at 600 °C, since the TTs drop at 600 °C for 1 h and 550 °C for 3 h is approximately the same, 25 °C for the Ap and 30 °C for the Mp, In addition, precipitation of the (Ti,Zr)2Ni phase is observed at 800 °C, thereby confirm its growth stability in the range of 550–800 °C.
Aging the equimolar alloy show little change, with only slight drops, e.g., 5 and 4 °C for the Ap and Mp, respectively, and this behavior is confirmed by the in situ experiment in Figure 8b, in the TTs peak position observed when heat treating at 600 °C for 6 h. The exception to this is the 550 °C for 1 h, in which a multi-step transformation is observed. This is generally attributed to grain boundary precipitation or an intermediate R-phase transformation in binary NiTi alloys [37], and this is most likely the cause in this instance as H-phase grain boundary precipitation has been directly observed in HAADF-STEM image for the 600 °C for 6 h heat treatment, Figure 6b. Once the fine precipitates grow larger, the effect is no longer observed since the precipitate density along the grain boundaries has decreased due to coarsening [38]. The volume fraction of these H-phase precipitates is so small, and therefore no major changes in TTs peak position are observed. In addition, there is likely some co-precipitation of the (Ti,Zr)2Ni precipitates throughout the alloy due to local changes in composition throughout the bulk, thereby leaving the B19′ matrix composition relatively unaffected.
The Ni-rich alloy responds by increasing TTs upon heat treating at 550 and 600 °C. The maximum temperature increases observed are 28 and 22 °C for the Ap and Mp, respectively, due to the 600 °C 6 h treatment. The reason for this temperature increase can be attributed to the formation of the Ni-rich nano-scale H-phase observed in the SR-XRD data collected during both ex situ and in situ experiments (Figure 5c and Figure 9c respectively) and the HAADF-STEM micrograph (Figure 6c) which cause a Ni depletion in the B19′ martensitic matrix. In addition, the homogenous distribution of the nano-scale H-phase, like Ni4Ti3 in binary NiTi, creates strain fields in the martensitic matrix that also aid in increasing transformation temperatures [2,7,18,19]; however, this amount of change in TTs is already achieved between 2–3 h at 600 °C, so it is likely that further heat treatments are causing coarsening of the precipitates rather an increase in phase amount. Aging at 550 °C has the same effect, but an obviously slower precipitation rate as the TTs observed at 550 °C for 3 h never fully reach the maximum observed when aging at 600 °C. This observation leads to the conclusion that the equilibrium volume fraction has yet to be reached and longer aging times at 550 °C can produce slightly higher TTs than what is reported in this article.
It should be noted that the ex situ experimental data (Figure 5) did not lead to solid experimental evidence with regards to the precipitation paths and the shifts in TTs. This can be attributed to the small interaction volume, the changing of the observation point, the low volume fraction change of the precipitates, and the high amount of reflections present due to the martensitic structure. All these factors together make it difficult to see the minor changes happening within the martensitic matrix due to the aging conditions. This result speaks to the limitations of experimental techniques to determine relative change in such compositionally dependent alloys, even with high resolution SR-XRD. There is still value in presenting the data, as not only does it show limitations, but also provides a link to the DSC experimental data and the aging conditions. The main conclusion, however, comes from the in situ experimental data (Figure 8 and Figure 9) that Ni-lean alloys can shift TTs to lower temperature by aging due to the formation of (Ti, Zr)2Ni (causing depletion of Ti from the matrix) and Ni-rich alloys can shift TTs to higher temperature by aging due to the formation of H-phase (causing depletion of Ni from the matrix).
Figure 10b presents the samples aged at 600 °C for 6 h over the nominal Ni at. %. Examining the peak positions of both the austenitic and martensitic transformation, it is observed that the transformation temperatures are much closer than in the previously solutionized condition. In this condition, there is now only 50 and 65 °C for the Ap and Mp, respectively, because of the now closer B19′ matrix compositions. It is evident that as the alloys are heat treated they are slowly moving toward an equimolar composition in the martensite, and therefore, TTs are moving closer together with respect to the solutionized condition.
Examining the thermal stability of the phase transformation with respect to Ni-content (Figure 2a–c), the Ni-lean and equimolar samples exhibit a much more stable transformation regardless of the heat treatment. This can be explained since the precipitation reactions have a much smaller effect at the cycling temperature. Cycling was performed up to 500 °C, allowing for the Ni-rich sample to potentially undergo changes in the H-phase size and amount. This is not the case in the Ni-lean sample as the formation of (Ti,Zr)2Ni precipitates are generally already large (greater than 1 micron), and therefore do not cause changes in the TTs due to the dispersion of nano-precipitates which induce a strain field in the martensite matrix, and the precipitation rate of the (Ti,Zr)2Ni precipitates is slow at this temperature; however, in the Ni-rich alloy, cycling to 500 °C can cause meaningful changes in the microstructure of the material, and therefore, the material is different from the previous cycle in regards to amount and internal strain produced by the nano-precipitation of H-phase. The equimolar alloy shows little sensitivity to aging at 550 and 600 °C, therefore, the phase transformations are already stable after only 2–4 thermal cycles.
4.2. Aging at 550 °C and 600 °C vs. Annealing at 800 °C
It has already been previously discussed that the precipitation reactions and sensitivity at 550 and 600 °C are very different in the Ni-lean, equimolar, and Ni-rich compositions even over the small composition range examined in this study; however, it is worth discussing that as temperature is increased by solutionizing or heat treating, the alloys begin to behave more similarly. Looking specifically at the 800 °C SR-XRD results presented in Figure 5a–c, it is observed that all three alloys show very similar diffraction patterns. At this temperature, the Ni-rich alloy shows the same sharp peak associated with the formation of residual austenite and does not show the broad peak associated with the growth of the H-phase. The lack of precipitation of the H-phase in the 800 °C 3 h condition can also be deduced by assuming that transformation temperatures would either (1) show little change or (2) drop slightly because of the relaxation of residual strain due to casting. Although the data is not presented in this work, DSC was performed on the Ni-rich 800 °C 3 h sample, Ap = 220 °C and Mp = 150 °C, and it was confirmed that TTs slightly decreased from the solutionized condition, Ap = 221 °C and Mp = 170 °C. Therefore, it is concluded that the formation of the nano-scale H-phase can be avoided, or already formed nano-scale H-phase can be removed by annealing at temperatures greater than 800 °C for Ni-rich NiTiZr HTSMAs.
4.3. Composition of the H-Phase
Figure 6a–c shows that there is an appreciable volume fraction of lenticular precipitates homogenously dispersed in the matrix of the Ni-rich alloy that is not apparent in either the Ni-lean or equimolar composition. EDS analysis confirms that the composition of the precipitate is consistent with the H-phase reported by other researchers [17,23,24,26,27,28], i.e., a slightly Ni-rich precipitate, as expected. As noted earlier, the formation of H-phase precipitates was also observed in both the Ni-lean and equimolar alloys, but only in small clusters centered along the grain boundaries of the martensitic lathes. As expected, these clusters were more prevalent in the equimolar alloy, due to the slightly higher Ni-content, but still were not in a significant amount. However, EDS analysis was performed on the precipitates for each alloy (Figure 7), and the results suggest that the H-phase has a variable (Ti,Zr) composition based on the alloy composition. This variable Zr content change would adjust the Zr content in the matrix as the precipitates form, but it has been shown that changes in Zr content only affect TTs by 0.17 °C/0.1 at. % Zr [11]; therefore, this effect is muted by the changing Ni content which as shown in this article results in an approximate 27.5 °C/0.1 at. % Ni in the range studied. Hornbuckle et al. [28] investigated the possibility of compositionally dependent H-phase based on heat treatment time and found no statistical difference but stopped short of examining alloy composition with respect to H-phase composition. However, reported results of H-phase composition have differed vastly since its discovery leading to the hypothesis that H-phase could have a composition range depending on the alloy studied [17,23,24,26,27,28]. Our results appear to support this position, but more rigorous methods (i.e., atom probe tomography) are needed to completely verify this hypothesis.
5. Conclusions
Three different NiTi-20 at. % Zr alloys with varying Ni-content were created and characterized using DSC, SR-XRD, SEM, and TEM. Based on analysis of the data, the following conclusions were made:
- Small changes in at. % Ni have a dramatic effect on the TTs of the NiTi-20 at. % Zr system, even more so than in binary NiTi. From 49.8–50.2 at. % Ni, a drop of the 110 °C of the Af is observed while in binary the same composition range only changes the Af by approximately 36 °C, meaning composition control is even more crucial in the NiTi-20 at. % Zr system.
- TTs can be tuned for a given application through aging treatments. The Ni-rich alloy, 50.2 at. %, can be shifted to higher transformation temperatures due to the formation of nanoscale H-phase precipitates, while the Ni-lean alloy can be shifted to lower transformation temperatures due to the formation of (Ti,Zr)2Ni precipitates. In both Ni-lean and Ni-rich cases, precipitation results in moving the martensite matrix composition toward the equimolar composition. The equimolar alloy, however, shows little response to aging.
- The Ni-rich alloy forms fine nano-scale H-phase precipitates when aging at lower temperatures, i.e., 550 and 600 °C, but these precipitates no longer form when temperature is increased, i.e., 800 °C. Although equimolar and Ni-lean alloys do not show an appreciable amount of H-phase, some local pockets exist along martensitic grain boundaries.
- H-phase is shown to shift compositionally with changes in Ni-content. Specifically by increasing the Zr content in the precipitate from 30 at. % to 40 at. % Zr in the equimolar and Ni-rich conditions, respectively. This behavior helps explain the wide range of H-phase compositions reported in the literature in both NiTi-Hf and -Zr alloys.
Acknowledgments
The authors acknowledge Nathan Ley for collecting ex situ SR-XRD measurements. The authors acknowledge the Materials Research Facility (MRF) at the University of North Texas for access to electron microscopes used in the characterization. This research used resources of the Advanced Photon Source, a U.S. Department of Energy (DOE) Office of Science User Facility operated for the DOE Office of Science by Argonne National Laboratory under Contract No. DE-AC02-06CH11357. The authors would also like to thank Yang Ren at APS sector 11 for help with collecting diffraction patterns.
Author Contributions
M.C. performed the experiments, analyzed the data, and wrote/edited manuscript; J.D.S. performed TEM imaging of samples; B.V.D. provided samples and funding; M.L.Y. designed experiments, provide experimental feedback, and wrote/edited manuscript.
Conflicts of Interest
The authors declare no conflict of interest.
References
- Buehler, W.; Wiley, R. Tini-ductile intermetallic compound. Trans. Am. Soc. Met. 1962, 55, 269–276. [Google Scholar]
- Otsuka, K.; Ren, X. Physical metallurgy of Ti–Ni-based shape memory alloys. Prog. Mater. Sci. 2005, 50, 511–678. [Google Scholar] [CrossRef]
- Mohd Jani, J.; Leary, M.; Subic, A.; Gibson, M.A. A review of shape memory alloy research, applications and opportunities. Mater. Des. (1980–2015) 2014, 56, 1078–1113. [Google Scholar] [CrossRef]
- Van Humbeeck, J. Non-medical applications of shape memory alloys. Mater. Sci. Eng. A 1999, 273–275, 134–148. [Google Scholar] [CrossRef]
- Pelton, A.; Duerig, T.; Stöckel, D. A guide to shape memory and superelasticity in nitinol medical devices. Minim. Invasive Ther. Allied Technol. 2004, 13, 218–221. [Google Scholar] [CrossRef] [PubMed]
- Benafan, O.; Brown, J.; Calkins, F.; Kumar, P.; Stebner, A.; Turner, T.; Vaidyanathan, R.; Webster, J.; Young, M. Shape memory alloy actuator design: Casmart collaborative best practices and case studies. Int. J. Mech. Mater. Des. 2014, 10, 1–42. [Google Scholar] [CrossRef]
- Benafan, O.; Noebe, R.; Padula, S., II; Vaidyanathan, R. Microstructural response during isothermal and isobaric loading of a precipitation-strengthened Ni-29.7Ti-20Hf high-temperature shape memory alloy. Metall. Mater. Trans. A 2012, 43, 4539–4552. [Google Scholar] [CrossRef]
- Hartl, D.J.; Lagoudas, D.C. Aerospace applications of shape memory alloys. Proc. Inst. Mech. Eng. Part G J. Aerosp. Eng. 2007, 221, 535–552. [Google Scholar] [CrossRef]
- Calkins, F.; Mabe, J.; Ruggeri, R. Overview of boeing’s shape memory alloy based morphing aerostructures. In Proceedings of the SMASIS08: ASME Conference on Smart Materials, Adaptive Structures and Intelligent Systems, Ellicott City, MD, USA, 28–30 October 2008; pp. 1–11. [Google Scholar]
- Eckelmeyer, K. The effect of alloying on the shape memory phenomenon in nitinol. Scr. Metall. 1976, 10, 667–672. [Google Scholar] [CrossRef]
- David, N.A.I.; Thoma, P.E.; Kao, M.Y.; Angst, D.R. High Transformation Temperature Shape Memory Alloy. U.S. Patents 5114504, 19 May 1992. [Google Scholar]
- Hsieh, S.; Wu, S. A study on lattice parameters of martensite in Ti50.5−xNi49.5Zrx shape memory alloys. J. Alloys Compd. 1998, 270, 237–241. [Google Scholar] [CrossRef]
- Hsieh, S.F.; Wu, S.K. Room-temperature phases observed in Ti53−xNi47Zrx high-temperature shape memory alloys. J. Alloys Compd. 1998, 266, 276–282. [Google Scholar] [CrossRef]
- Pu, Z.J.; Tseng, H.-K.; Wu, K.-H. Martensite transformation and shape memory effect of NiTi-Zr high-temperature shape memory alloys. Proc. SPIE 1995, 2441, 171–178. [Google Scholar]
- Sandu, A.M.; Tsuchiya, K.; Yamamoto, S.; Todaka, Y.; Umemoto, M. Influence of isothermal ageing on mechanical behaviour in Ni-rich Ti–Zr–Ni shape memory alloy. Scr. Mater. 2006, 55, 1079–1082. [Google Scholar] [CrossRef]
- Sandu, A.M.; Tsuchiya, K.; Tabuchi, M.; Yamamoto, S.; Todaka, Y.; Umemoto, M. Microstructural evolution during isothermal aging in Ni-rich Ti-Zr-Ni shape memory alloys. Mater. Trans. 2007, 48, 432–438. [Google Scholar] [CrossRef]
- Han, X.D.; Wang, R.; Zhang, Z.; Yang, D.Z. A new precipitate phase in a tinihf high temperature shape memory alloy. Acta Mater. 1998, 46, 273–281. [Google Scholar] [CrossRef]
- Evirgen, A.; Karaman, I.; Noebe, R.; Santamarta, R.; Pons, J. Effect of precipitation on the microstructure and the shape memory response of the Ni50.3Ti29.7Zr20 high temperature shape memory alloy. Scr. Mater. 2013, 69, 354–357. [Google Scholar] [CrossRef]
- Evirgen, A.; Karaman, I.; Santamarta, R.; Pons, J.; Hayrettin, C.; Noebe, R.D. Relationship between crystallographic compatibility and thermal hysteresis in Ni-rich NiTiHf and NiTiZr high temperature shape memory alloys. Acta Mater. 2016, 121, 374–383. [Google Scholar] [CrossRef]
- Karaca, H.; Acar, E.; Tobe, H.; Saghaian, S. NiTiHf-based shape memory alloys. Mater. Sci. Technol. 2014, 30, 1530–1544. [Google Scholar] [CrossRef]
- Meng, X.; Cai, W.; Zheng, Y.; Zhao, L. Phase transformation and precipitation in aged Ti–Ni–Hf high-temperature shape memory alloys. Mater. Sci. Eng. A 2006, 438, 666–670. [Google Scholar] [CrossRef]
- Pérez-Sierra, A.M.; Pons, J.; Santamarta, R.; Karaman, I.; Noebe, R.D. Stability of a Ni-rich Ni-Ti-Zr high temperature shape memory alloy upon low temperature aging and thermal cycling. Scr. Mater. 2016, 124, 47–50. [Google Scholar] [CrossRef]
- Prasher, M.; Sen, D. Influence of aging on phase transformation and microstructure of Ni50.3Ti29.7Zr20 high temperature shape memory alloy. J. Alloys Compd. 2014, 615, 469–474. [Google Scholar] [CrossRef]
- Yang, F.; Coughlin, D.R.; Phillips, P.J.; Yang, L.; Devaraj, A.; Kovarik, L.; Noebe, R.D.; Mills, M.J. Structure analysis of a precipitate phase in an Ni-rich high-temperature NiTiHf shape memory alloy. Acta Mater. 2013, 61, 3335–3346. [Google Scholar] [CrossRef]
- Stebner, A.P.; Bigelow, G.S.; Yang, J.; Shukla, D.P.; Saghaian, S.M.; Rogers, R.; Garg, A.; Karaca, H.E.; Chumlyakov, Y.; Bhattacharya, K.; et al. Transformation strains and temperatures of a Nickel–Titanium–Hafnium high temperature shape memory alloy. Acta Mater. 2014, 76, 40–53. [Google Scholar] [CrossRef]
- Coughlin, D.R.; Phillips, P.J.; Bigelow, G.S.; Garg, A.; Noebe, R.D.; Mills, M.J. Characterization of the microstructure and mechanical properties of a 50.3Ni–29.7Ti–20Hf shape memory alloy. Scr. Mater. 2012, 67, 112–115. [Google Scholar] [CrossRef]
- Saghaian, S.M.; Karaca, H.E.; Tobe, H.; Pons, J.; Santamarta, R.; Chumlyakov, Y.I.; Noebe, R.D. Effects of Ni content on the shape memory properties and microstructure of Ni-rich NiTi-20Hf alloys. Smart Mater. Struct. 2016, 25, 095029. [Google Scholar] [CrossRef]
- Hornbuckle, B.C.; Sasaki, T.T.; Bigelow, G.S.; Noebe, R.D.; Weaver, M.L.; Thompson, G.B. Structure–property relationships in a precipitation strengthened Ni–29.7Ti–20Hf (at%) shape memory alloy. Mater. Sci. Eng. A 2015, 637, 63–69. [Google Scholar] [CrossRef]
- Hammersley, A. Fit2d: An Introduction and Overview; European Synchrotron Radiation Facility Internal Report ESRF97HA02T; ESRF: Grenoble, France, 1997; Volume 68. [Google Scholar]
- Young, M.; Almer, J.; Daymond, M.; Haeffner, D.; Dunand, D. Load partitioning between ferrite and cementite during elasto-plastic deformation of an ultrahigh-carbon steel. Acta Mater. 2007, 55, 1999–2011. [Google Scholar] [CrossRef]
- Schindelin, J.; Arganda-Carreras, I.; Frise, E.; Kaynig, V.; Longair, M.; Pietzsch, T.; Preibisch, S.; Rueden, C.; Saalfeld, S.; Schmid, B. Fiji: An open-source platform for biological-image analysis. Nat. Methods 2012, 9, 676–682. [Google Scholar] [CrossRef] [PubMed]
- Lutterotti, L.; Matthies, S.; Wenk, H. Maud: A friendly java program for material analysis using diffraction. IUCr Newslett. CPD 1999, 21, 14–15. [Google Scholar]
- Kudoh, Y.; Tokonami, M.; Miyazaki, S.; Otsuka, K. Crystal structure of the martensite in Ti-49.2 at. % Ni alloy analyzed by the single crystal x-ray diffraction method. Acta Metall. 1985, 33, 2049–2056. [Google Scholar] [CrossRef]
- Gražulis, S.; Daškevič, A.; Merkys, A.; Chateigner, D.; Lutterotti, L.; Quiros, M.; Serebryanaya, N.R.; Moeck, P.; Downs, R.T.; Le Bail, A. Crystallography open database (cod): An open-access collection of crystal structures and platform for world-wide collaboration. Nucleic Acids Res. 2011, 40, D420–D427. [Google Scholar] [CrossRef] [PubMed]
- Yurko, G.; Barton, J.; Parr, J. The crystal structure of Ti2Ni (a correction). Acta Crystallogr. 1962, 15, 1309. [Google Scholar] [CrossRef]
- Frenzel, J.; George, E.P.; Dlouhy, A.; Somsen, C.; Wagner, M.F.X.; Eggeler, G. Influence of Ni on martensitic phase transformations in NiTi shape memory alloys. Acta Mater. 2010, 58, 3444–3458. [Google Scholar] [CrossRef]
- Allafi, J.K.; Ren, X.; Eggeler, G. The mechanism of multistage martensitic transformations in aged Ni-rich NiTi shape memory alloys. Acta Mater. 2002, 50, 793–803. [Google Scholar] [CrossRef]
- Moshref-Javadi, M.; Seyedein, S.H.; Salehi, M.T.; Aboutalebi, M.R. Age-induced multi-stage transformation in a Ni-rich NiTiHf alloy. Acta Mater. 2013, 61, 2583–2594. [Google Scholar] [CrossRef]
Figure 1.
Offset Raw DSC data for the (a) Ni-lean, (b) equimolar and (c) Ni-rich alloys showing transformation temperatures (TTs) as a function of heat treatment.
Figure 1.
Offset Raw DSC data for the (a) Ni-lean, (b) equimolar and (c) Ni-rich alloys showing transformation temperatures (TTs) as a function of heat treatment.

Figure 2.
TT position acquired from DSC thermal cycling data for the (a) Ni-lean, (b) equimolar and (c) Ni-rich alloys over ten heating and cooling cycles. Only Af and Ms are shown for clarity, however both As and Mf show a similar trend in all cases.
Figure 2.
TT position acquired from DSC thermal cycling data for the (a) Ni-lean, (b) equimolar and (c) Ni-rich alloys over ten heating and cooling cycles. Only Af and Ms are shown for clarity, however both As and Mf show a similar trend in all cases.


Figure 3.
Backscattered electron (BSE) micrographs of the solutionized conditions for the (a) Ni-lean, (b) equimolar, and (c) Ni-rich alloys. All alloys show a similar martensitic structure with increasing amounts of the (Ti,Zr)2Ni precipitates (black phase) scattered within the martensitic matrix as (Ti,Zr) amount is increased. Calculated % area fraction is given in the bottom left of each micrograph.
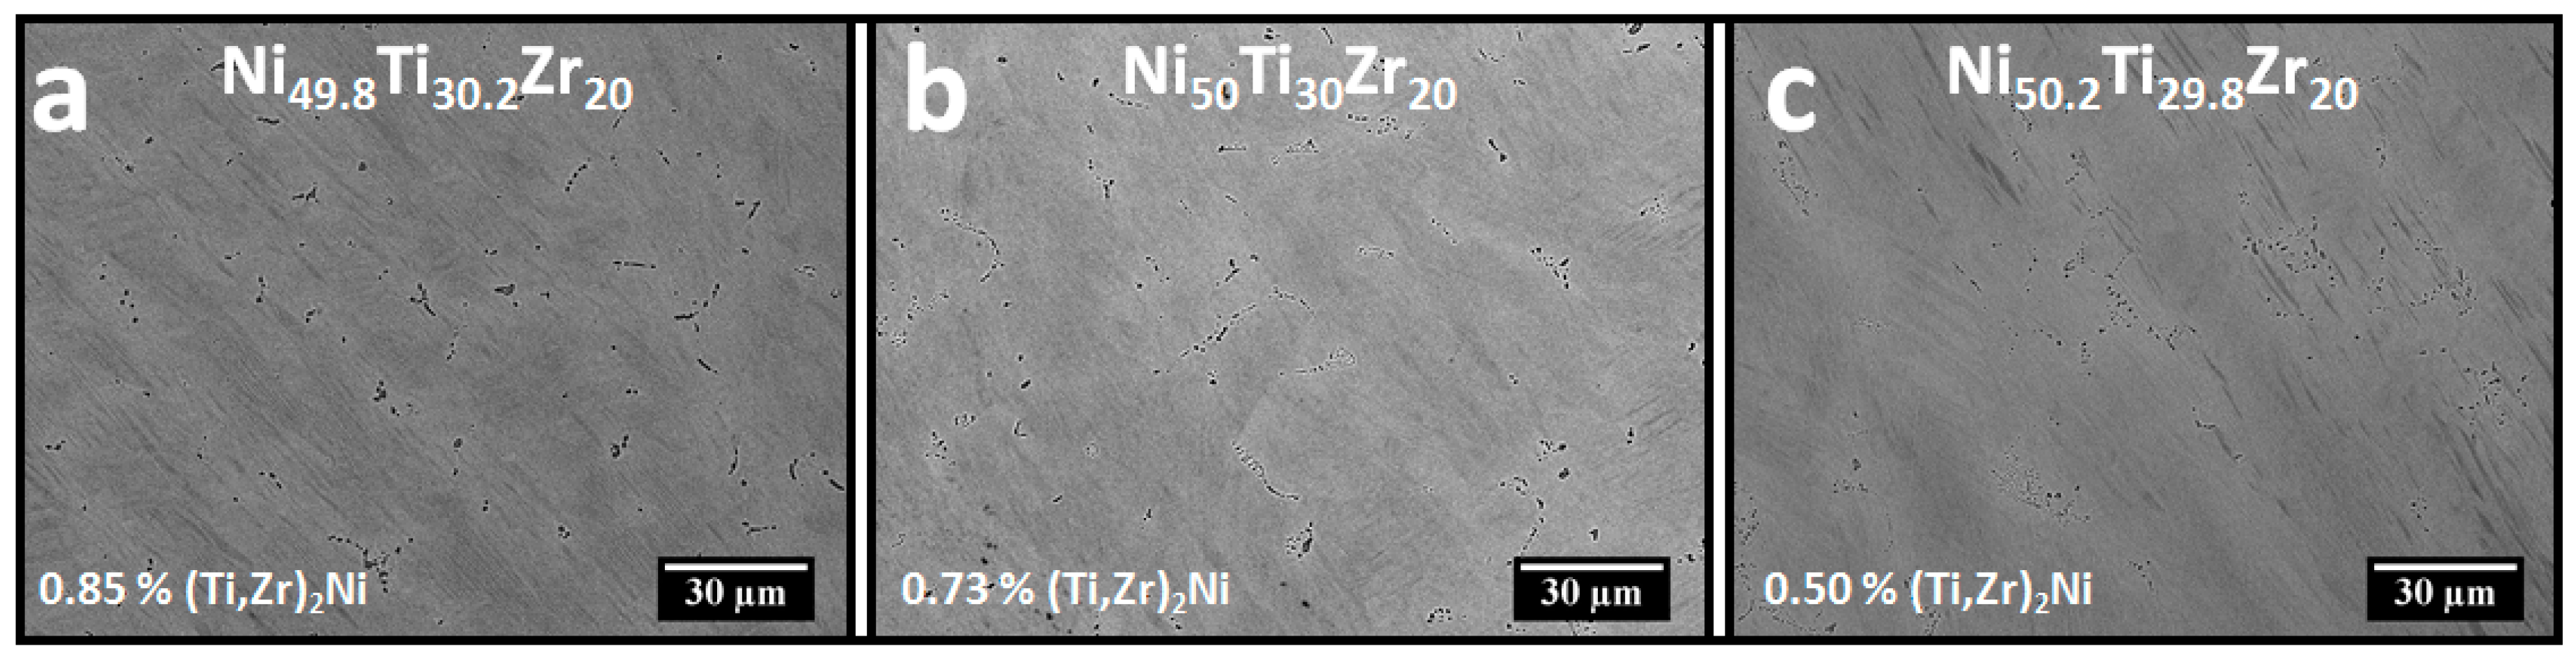
Figure 4.
SR-XRD diffraction data from ex situ experiments including both the full Debye–Scherrer diffraction pattern and the integrated normalized 1-D diffraction pattern collected for the (a) Ni-lean, (b) equimolar, and (c) Ni-rich in the solutionized condition. Confirms the B19′ martensitic structure present in all three alloys at room temperature. Selected martensite peaks indexed for clarity and calculated lattice parameters obtained by the Reitveld method also included in each graph.

Figure 5.
SR-XRD integrated normalized 1-D diffraction patterns from ex situ experiments for select heat treatment conditions for the (a) Ni-lean, (b) equimolar and (c) Ni-rich condition illustrating different precipitation growth. The appearance of residual austenite is evident in some of the conditions (peak at 2.19 Å indicated with a triangle). Growth of the (Ti,Zr)2Ni precipitates is not obvious in any of the samples (peak at 2.25 Å indicated by a star), while H-phase growth is observed in the Ni-rich alloy by the appearance of a broad peak (peak at 2.21 Å indicated by a circle).

Figure 6.
Representative HAADF-STEM images for the (a) Ni-lean, (b) equimolar and (c) Ni-rich alloys after a 600 °C 6 h heat treatment. The bright white lenticular phase are the H-phase due to its higher Zr content with respect to the matrix and the large dark phase seen in (b,c) correspond to (Ti,Zr)2Ni precipitates. Inset in (a) shows the only small pocket of H-phase precipitates within the Ni-lean martensitic matrix. In both (b,c) it is observed that (Ti,Zr)2Ni and H-phase precipitates are in the material, with more H-phase growth in the (c) Ni-rich alloy.

Figure 7.
Average measured composition of the observed H-phase precipitates over nominal at. Ni content obtained with from EDS measurements.
Figure 7.
Average measured composition of the observed H-phase precipitates over nominal at. Ni content obtained with from EDS measurements.
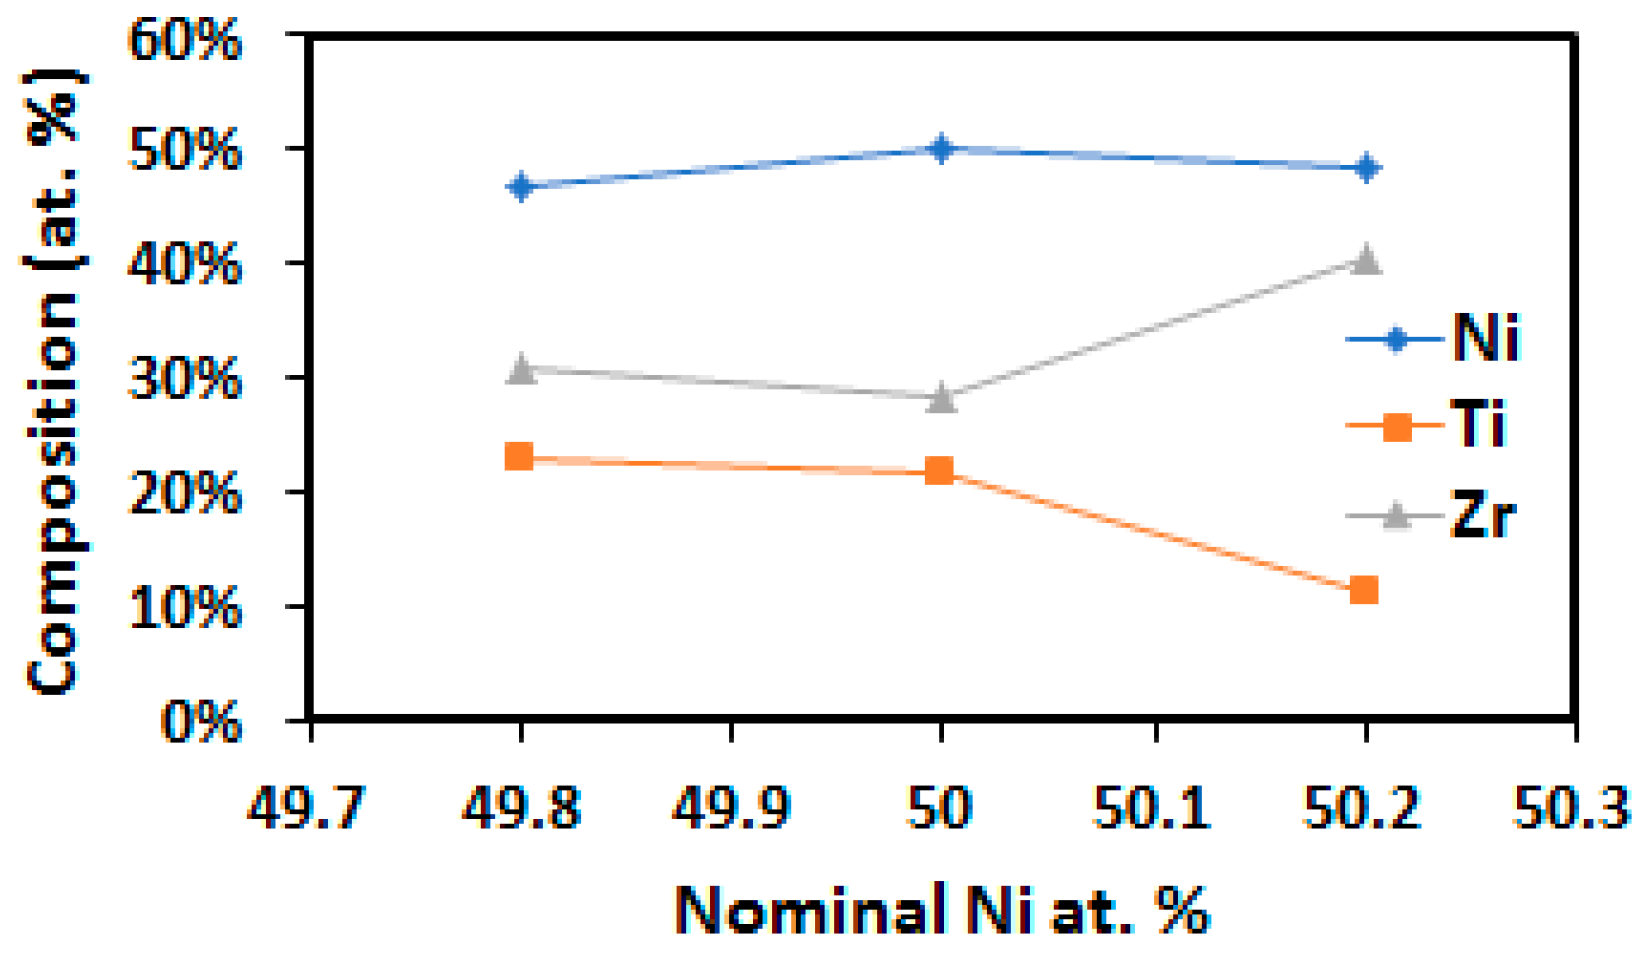
Figure 8.
Integrated normalized 1-D diffraction patterns from the in situ SR-XRD experiments for an isothermal hold at 550 °C at 0, 1, 2, and 3 h over the d-spacing range 2–2.75 Å for the (a) Ni-lean with insets of the peak growth of the (331) and (511) for the (Ti,Zr)2Ni phase, (b) equimolar, and (c) Ni-rich condition illustrating different precipitation and oxide growth. Al2O3 reflections correspond to the insulation in the furnace.
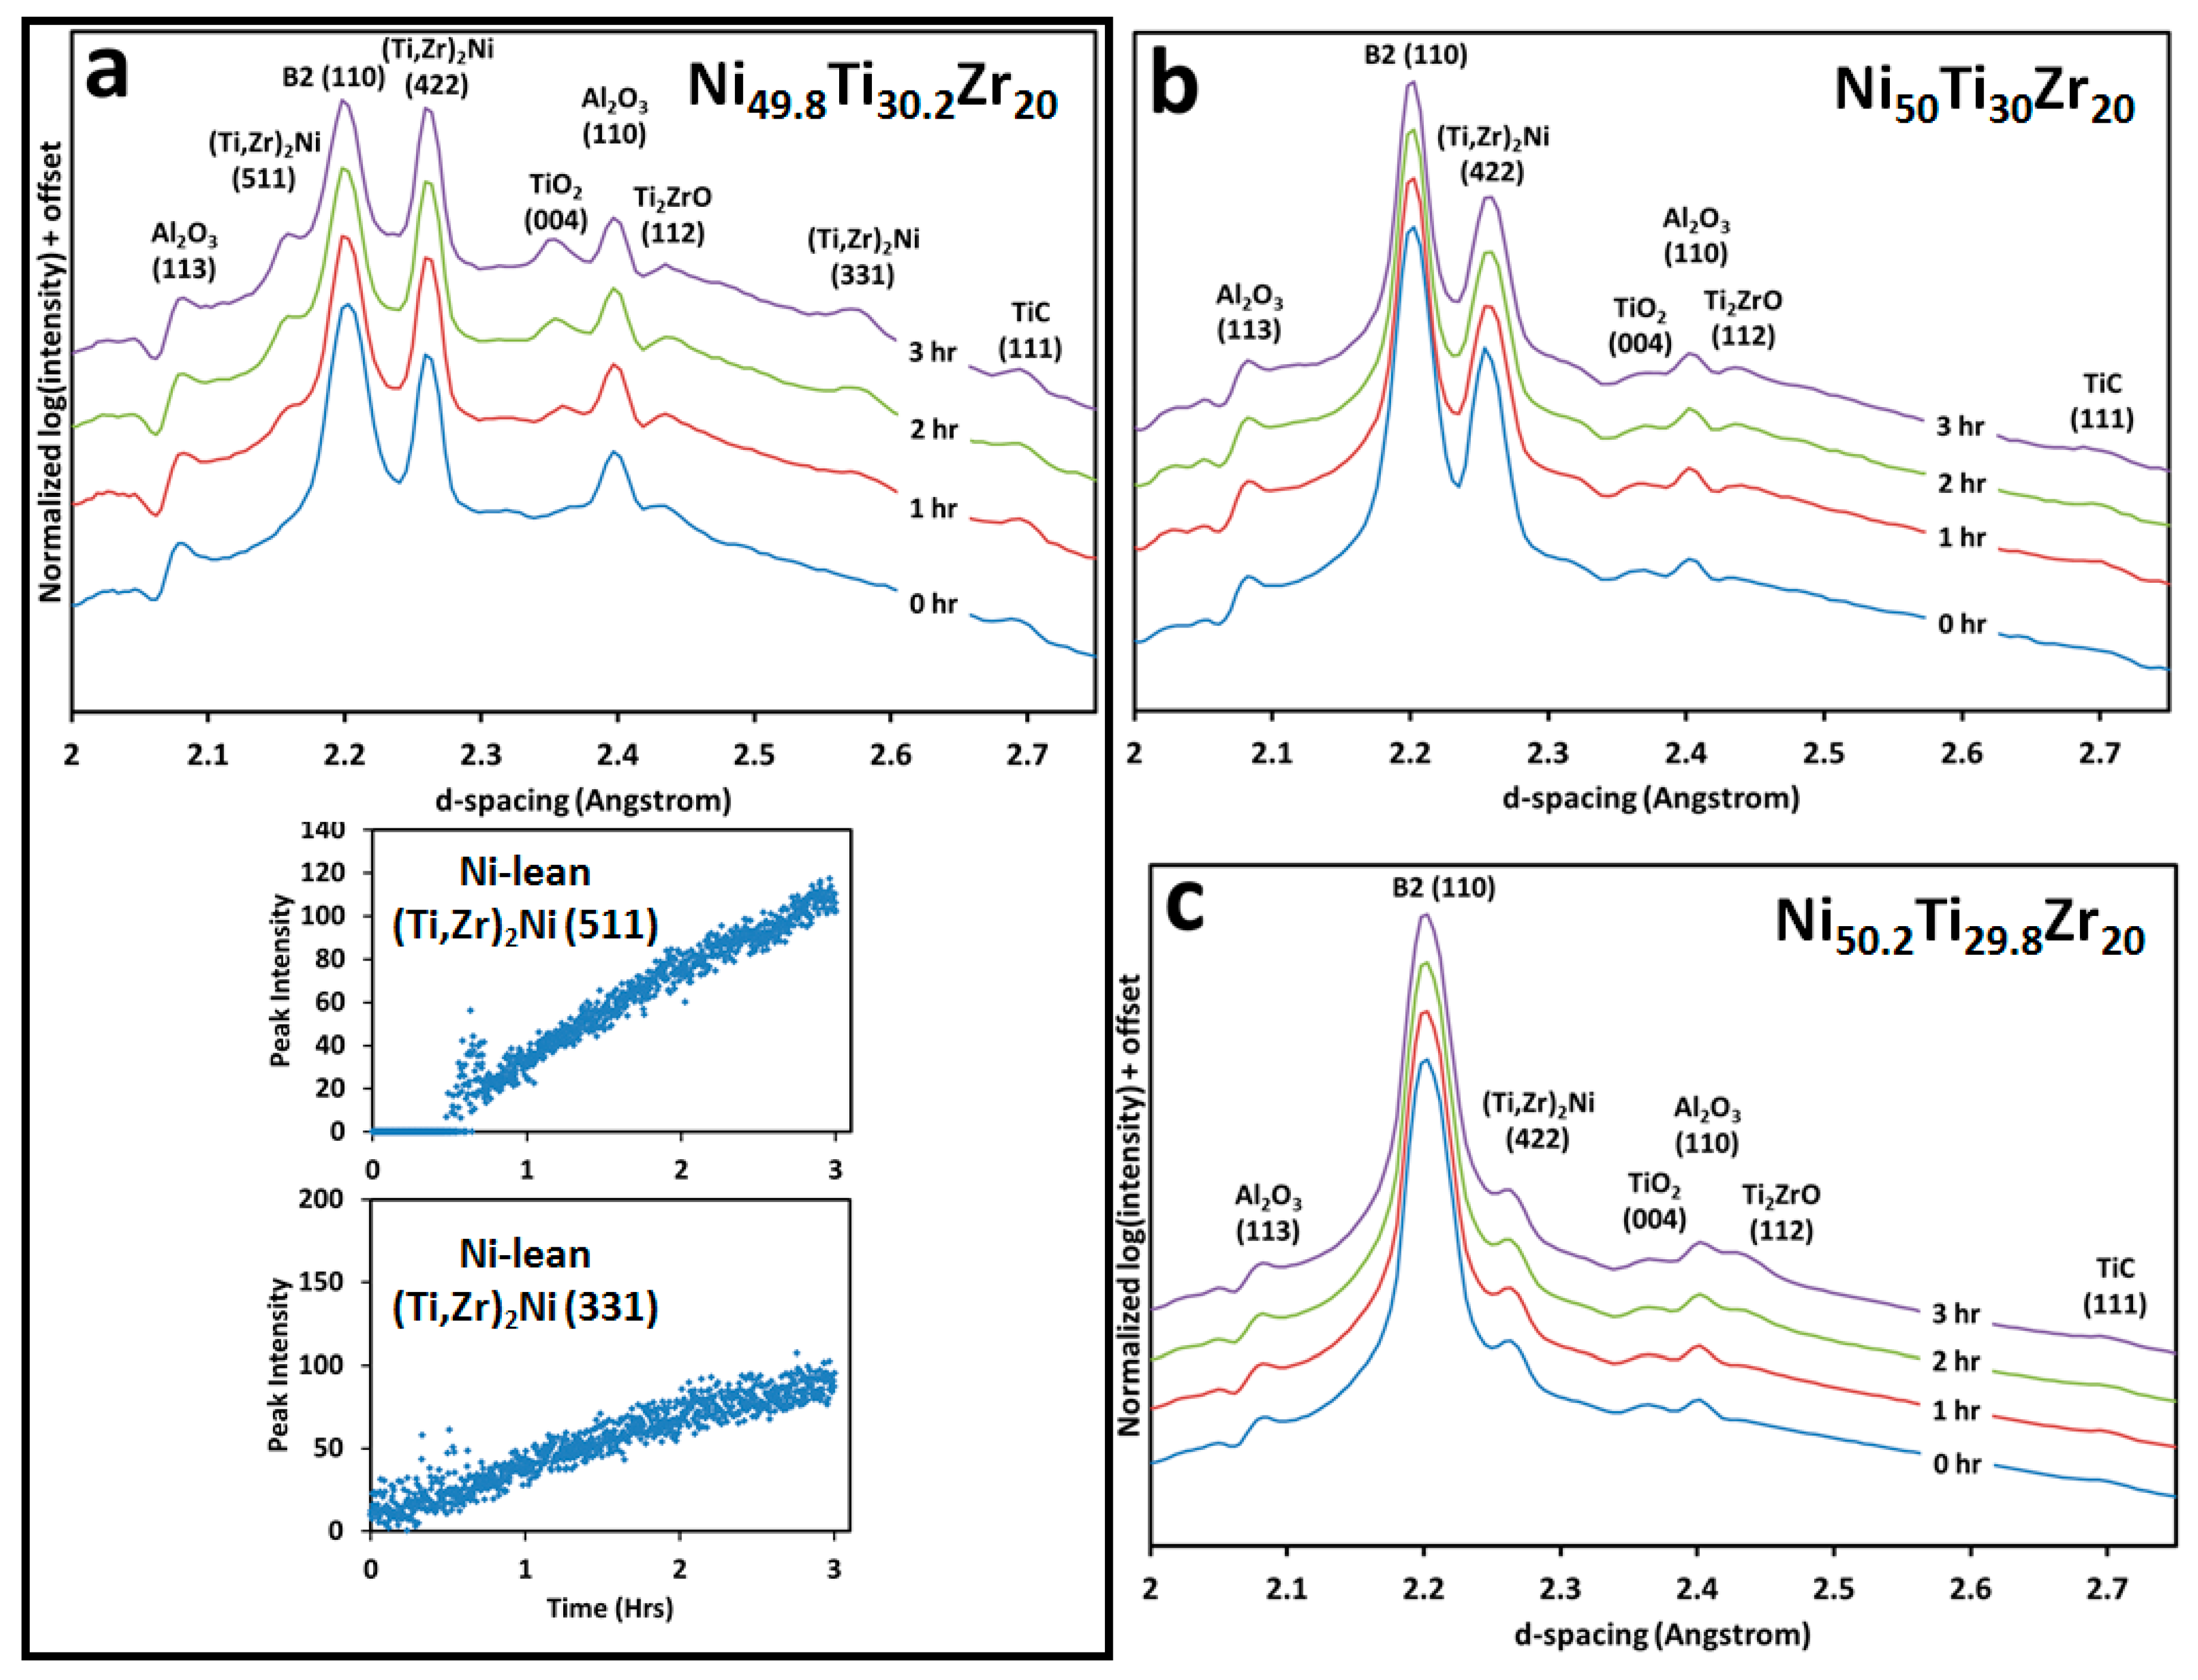
Figure 9.
Integrated normalized 1-D diffraction patterns from the in situ SR-XRD experiment for an isothermal hold at 550 °C at 0, 1, 2 and 3 h over the d-spacing range 3.4–3.8 Å for the (a) Ni-lean, (b) equimolar, and (c) Ni-rich condition. The only measureable phase growth is due to the formation of the nanoscale H-phase precipitates. The insets allow for better visualization of the subtle change caused by the formation of the precipitate phase and in (c) the growth of the peak intensity over time is shown.


Figure 10.
Transformation temperatures for the (a) solutionized and (b) aged at 600 °C for 6 h over the nominal at. Ni content. As the non-equimolar alloys are aged, the matrix composition moves closer to equimolar values therefore shifting transformation temperatures to overall closer values.
Figure 10.
Transformation temperatures for the (a) solutionized and (b) aged at 600 °C for 6 h over the nominal at. Ni content. As the non-equimolar alloys are aged, the matrix composition moves closer to equimolar values therefore shifting transformation temperatures to overall closer values.

© 2017 by the authors. Licensee MDPI, Basel, Switzerland. This article is an open access article distributed under the terms and conditions of the Creative Commons Attribution (CC BY) license (http://creativecommons.org/licenses/by/4.0/).
Share and Cite
MDPI and ACS Style
Carl, M.; Smith, J.D.; Van Doren, B.; Young, M.L. Effect of Ni-Content on the Transformation Temperatures in NiTi-20 at. % Zr High Temperature Shape Memory Alloys. Metals 2017, 7, 511. https://doi.org/10.3390/met7110511
AMA Style
Carl M, Smith JD, Van Doren B, Young ML. Effect of Ni-Content on the Transformation Temperatures in NiTi-20 at. % Zr High Temperature Shape Memory Alloys. Metals. 2017; 7(11):511. https://doi.org/10.3390/met7110511
Chicago/Turabian StyleCarl, Matthew, Jesse D. Smith, Brian Van Doren, and Marcus L. Young. 2017. "Effect of Ni-Content on the Transformation Temperatures in NiTi-20 at. % Zr High Temperature Shape Memory Alloys" Metals 7, no. 11: 511. https://doi.org/10.3390/met7110511
Note that from the first issue of 2016, this journal uses article numbers instead of page numbers. See further details here.