Article

Optimization of Thermo-Mechanical Processing for Forging of Newly Developed Creep-Resistant Magnesium Alloy ABaX633

by
Kamineni Pitcheswara Rao
1,*,
Chalasani Dharmendra
1,
Yellapregada Venkata Rama Krishna Prasad
2,
Norbert Hort
3 and
Hajo Dieringa
3
1
Department of Mechanical and Biomedical Engineering, City University of Hong Kong, Tat Chee Avenue, Kowloon, Hong Kong
2
Independent Researcher, No. 2/B, Vinayaka Nagar, Bengaluru 560024, India
3
Magnesium Innovation Centre, Helmholtz Zentrum Geesthacht, Max-Planck-Strasse 1, 21502 Geesthacht, Germany
*
Author to whom correspondence should be addressed.
Metals 2017, 7(11), 513; https://doi.org/10.3390/met7110513
Submission received: 28 October 2017 / Revised: 13 November 2017 / Accepted: 14 November 2017 / Published: 21 November 2017
(This article belongs to the Special Issue Light Weight Alloys: Processing, Properties and Their Applications)

Abstract

:
The compressive strength and creep resistance of cast Mg-6Al-3Ba-3Ca (ABaX633) alloy has been measured in the temperature range of 25 to 250 °C, and compared with that of its predecessor ABaX422. The alloy is stronger and more creep-resistant than ABaX422, and exhibits only a small decrease of yield stress with temperature. The higher strength of ABaX633 is attributed to a larger volume fraction of intermetallic particles (Al, Mg)2Ca and Mg21Al3Ba2 in its microstructure. Hot deformation mechanisms in ABaX633 have been characterized by developing a processing map in the temperature and strain rate ranges of 300 to 500 °C and 0.0003 to 10 s−1. The processing map exhibits two workability domains in the temperature and strain rate ranges of: (1) 380 to 475 °C and 0.0003 to 0.003 s−1, and (2) 480–500 °C and 0.003 to 0.5 s−1. The apparent activation energy values estimated in the above two domains (204 and 216 kJ/mol) are higher than that for lattice self-diffusion of Mg, which is attributed to the large back-stress that is caused by the intermetallic particles. Optimum condition for bulk working is 500 °C and 0.01 s−1 at which hot workability will be maximum. Flow instability is exhibited at lower temperatures and higher strain rates, as well as at higher temperatures and higher strain rates. The predictions of the processing map on the workability domains, as well as the instability regimes are fully validated by the forging of a rib-web (cup) shaped component under optimized conditions.

Graphical Abstract

1. Introduction

Magnesium alloys are being developed for automotive applications where strength and creep resistance is of paramount importance [1]. Attempts to improve creep strength of Mg-Al alloys by the addition of rare-earth elements or Ca + Sr or Ca + Ba have led to the development of commercial alloys, like AE42 and AE44, MRI230D and DieMag422 [2]. In these alloys, the formation of intermetallic precipitates, such as Al11RE3, Al4RE, Al2RE (AE series), Mg2Ca, Al4Sr, (Mg, Al)2Ca, CaMgSn (Ca + Sr containing alloys), and Mg17Ba2, Mg23Ba6, Mg2Ba (Ca + Ba containing alloys), are responsible to enhancing the creep resistance. In recent years, Mg-Al-Ba-Ca (ABaX) alloys with higher concentration of alloying elements are being developed [3,4,5] to obtain enhanced creep resistance, and these include alloys like ABaX422, ABaX633, and ABaX844. In these systems, barium, in combination with Mg and Al, forms a ternary phase Mg21Al3Ba2 while Ca forms (Al, Mg)2Ca, both occurring independently at grain boundaries in the cast alloys. While all of these alloys exhibited creep resistance better than AE42, only ABaX633 has shown significantly higher creep resistance than both MRI230D and ABaX422 [2,4]. The effect of Ba and Ca addition to Mg-Al alloys on strength and elongation showed that the tensile strength increases in the order ABaX211, ABaX422, and ABaX633 [4]. However, high concentrations of alloying elements give rise to several problems of chemical segregation, non-uniform precipitate distribution, micro-porosity, and casting defects. To mitigate these problems, it is essential to subject the cast alloys to thermo-mechanical processing at higher temperatures. The aim of the present investigation is to develop technology for hot working of ABaX633 alloy using processing map technique and validate the results by conducting hot forging. ABaX633 has been chosen since this gives optimum creep resistance as well as microstructural control during casting.

2. Experimental Details

The magnesium alloy Mg-6Al-3Ba-3Ca billet was prepared by melting pure elemental metals under SF6 and argon gas cover. After melt has reached 720 °C, it was held at that temperature for 10 min before casting it into a preheated steel mold of 100 mm diameter and 300 mm height with about 50 mm riser. The cast billet was sliced into disks, from which cylindrical specimens of 10 mm diameter and 15 mm of height were machined for performing compression tests. A hole of 1 mm diameter and 5 mm depth was machined at mid-height of the specimen to reach the center. A thermocouple was inserted into this hole for controlling the heating of the specimen and measuring its instantaneous temperature during the entire compression test. The testing procedure was described in detail earlier [6]. The specimens were deformed under uniaxial compression in the temperature from 300 to 500 °C at 40 °C intervals and at six strain rates in the range of 0.0003 to 10 s−1. In order to achieve constant true strain rates during compression, an exponential decay in the actuator speed of the servo hydraulic machine (DARTEC, M1000/RK, Bournemouth, UK) was applied. Graphite powder mixed with grease as carrier was used as the lubricant at the specimen-die interfaces. The specimens were deformed up to a true strain of about 1 and were quenched in water. The deformed specimens were sectioned in the center parallel to the compression axis for microstructural observation. After cold mounting in plastic molds, the cut surfaces of the specimens were ground, polished, and etched with dilute nitric acid for obtaining the microstructures. Compression tests were also conducted at a strain rate of 0.001 s−1 to obtain the mechanical properties of the alloy in the temperature range of 25 to 250 °C at 25 °C intervals. Experimental details of the forging experiments designed to validate the results of the processing map were described in an earlier publication [7], and a brief description was included later in the relevant section.

3. Results and Discussion

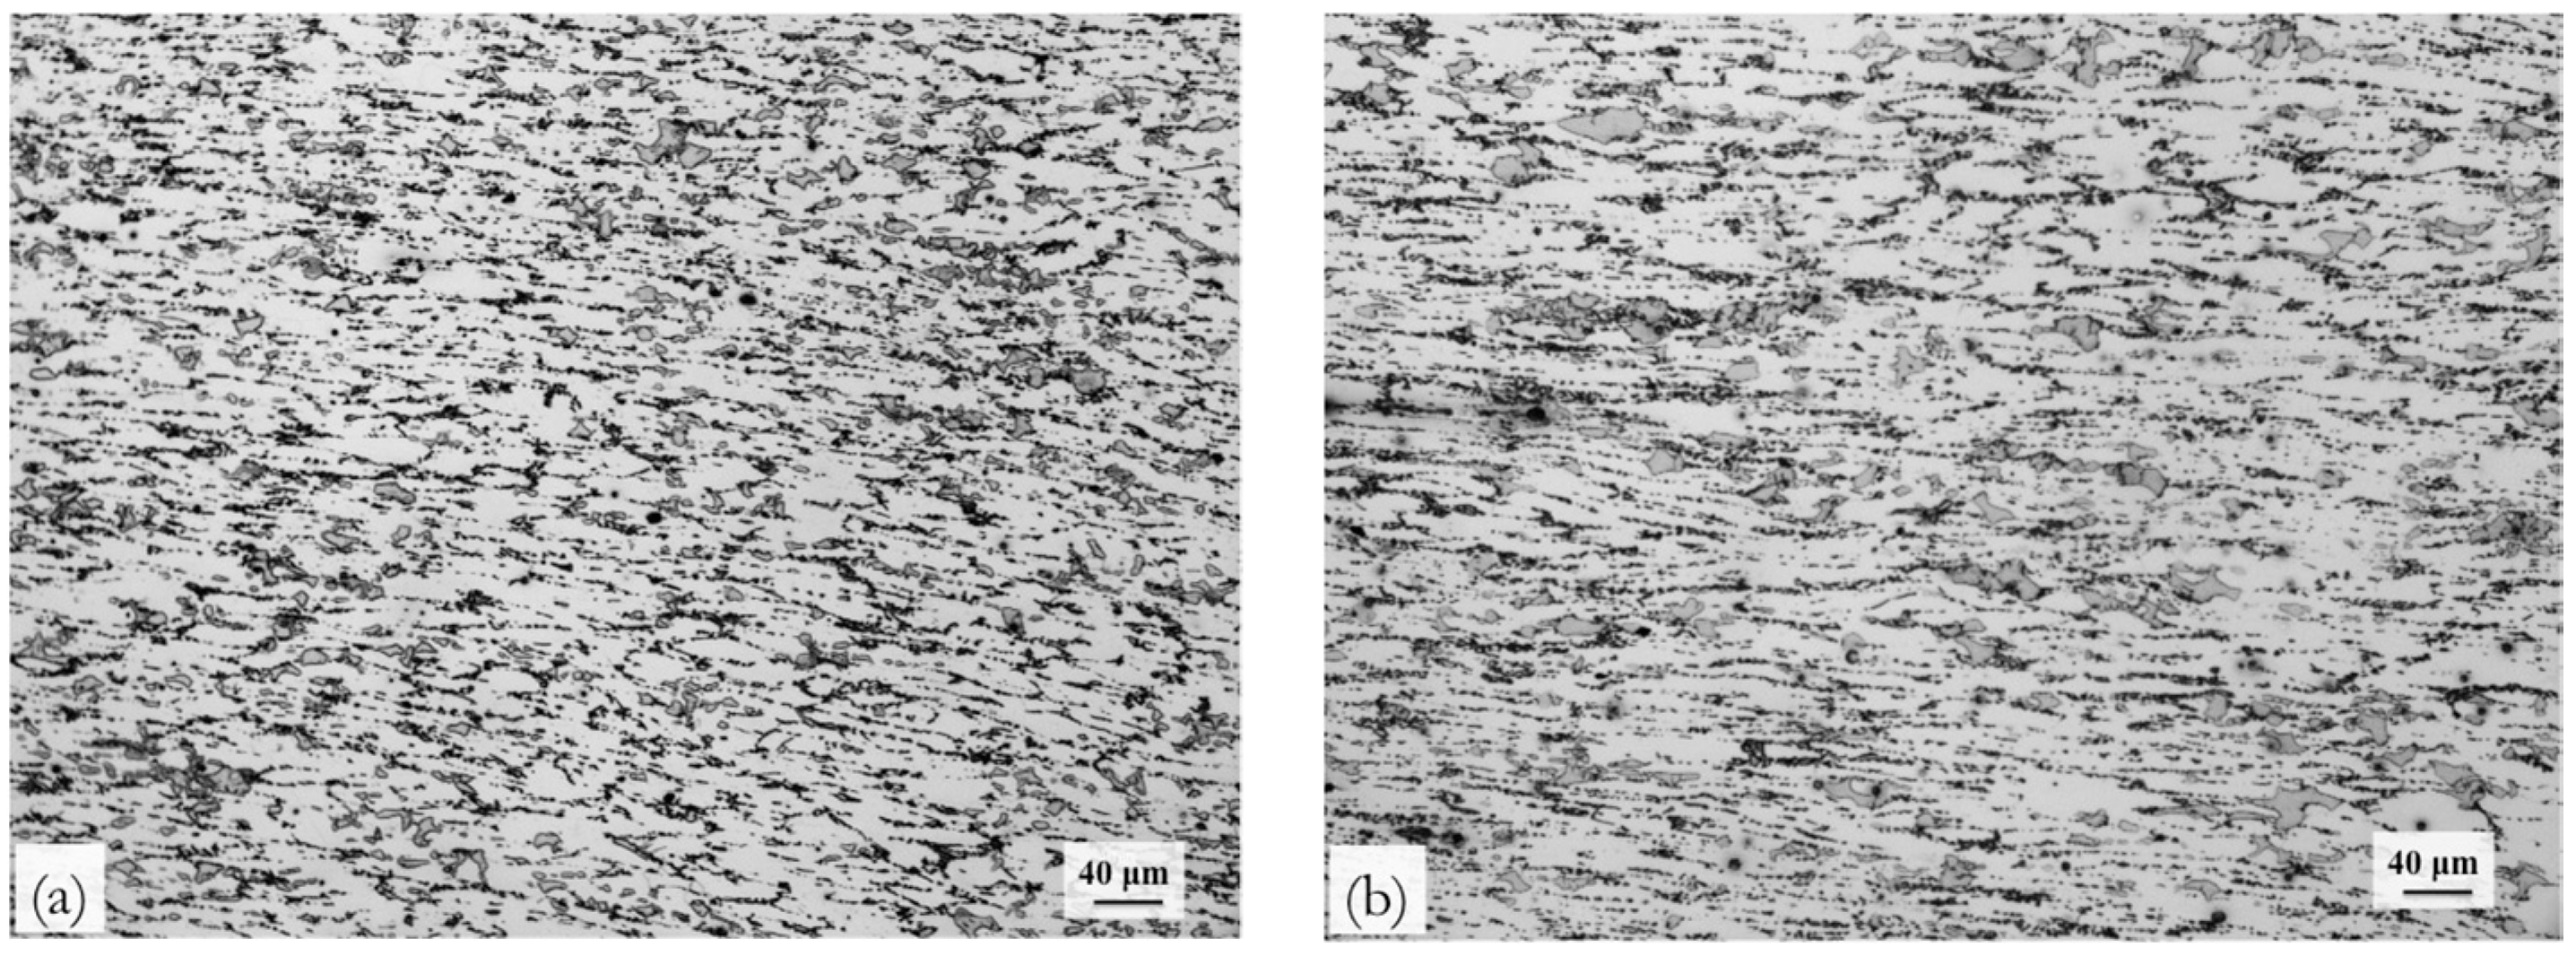
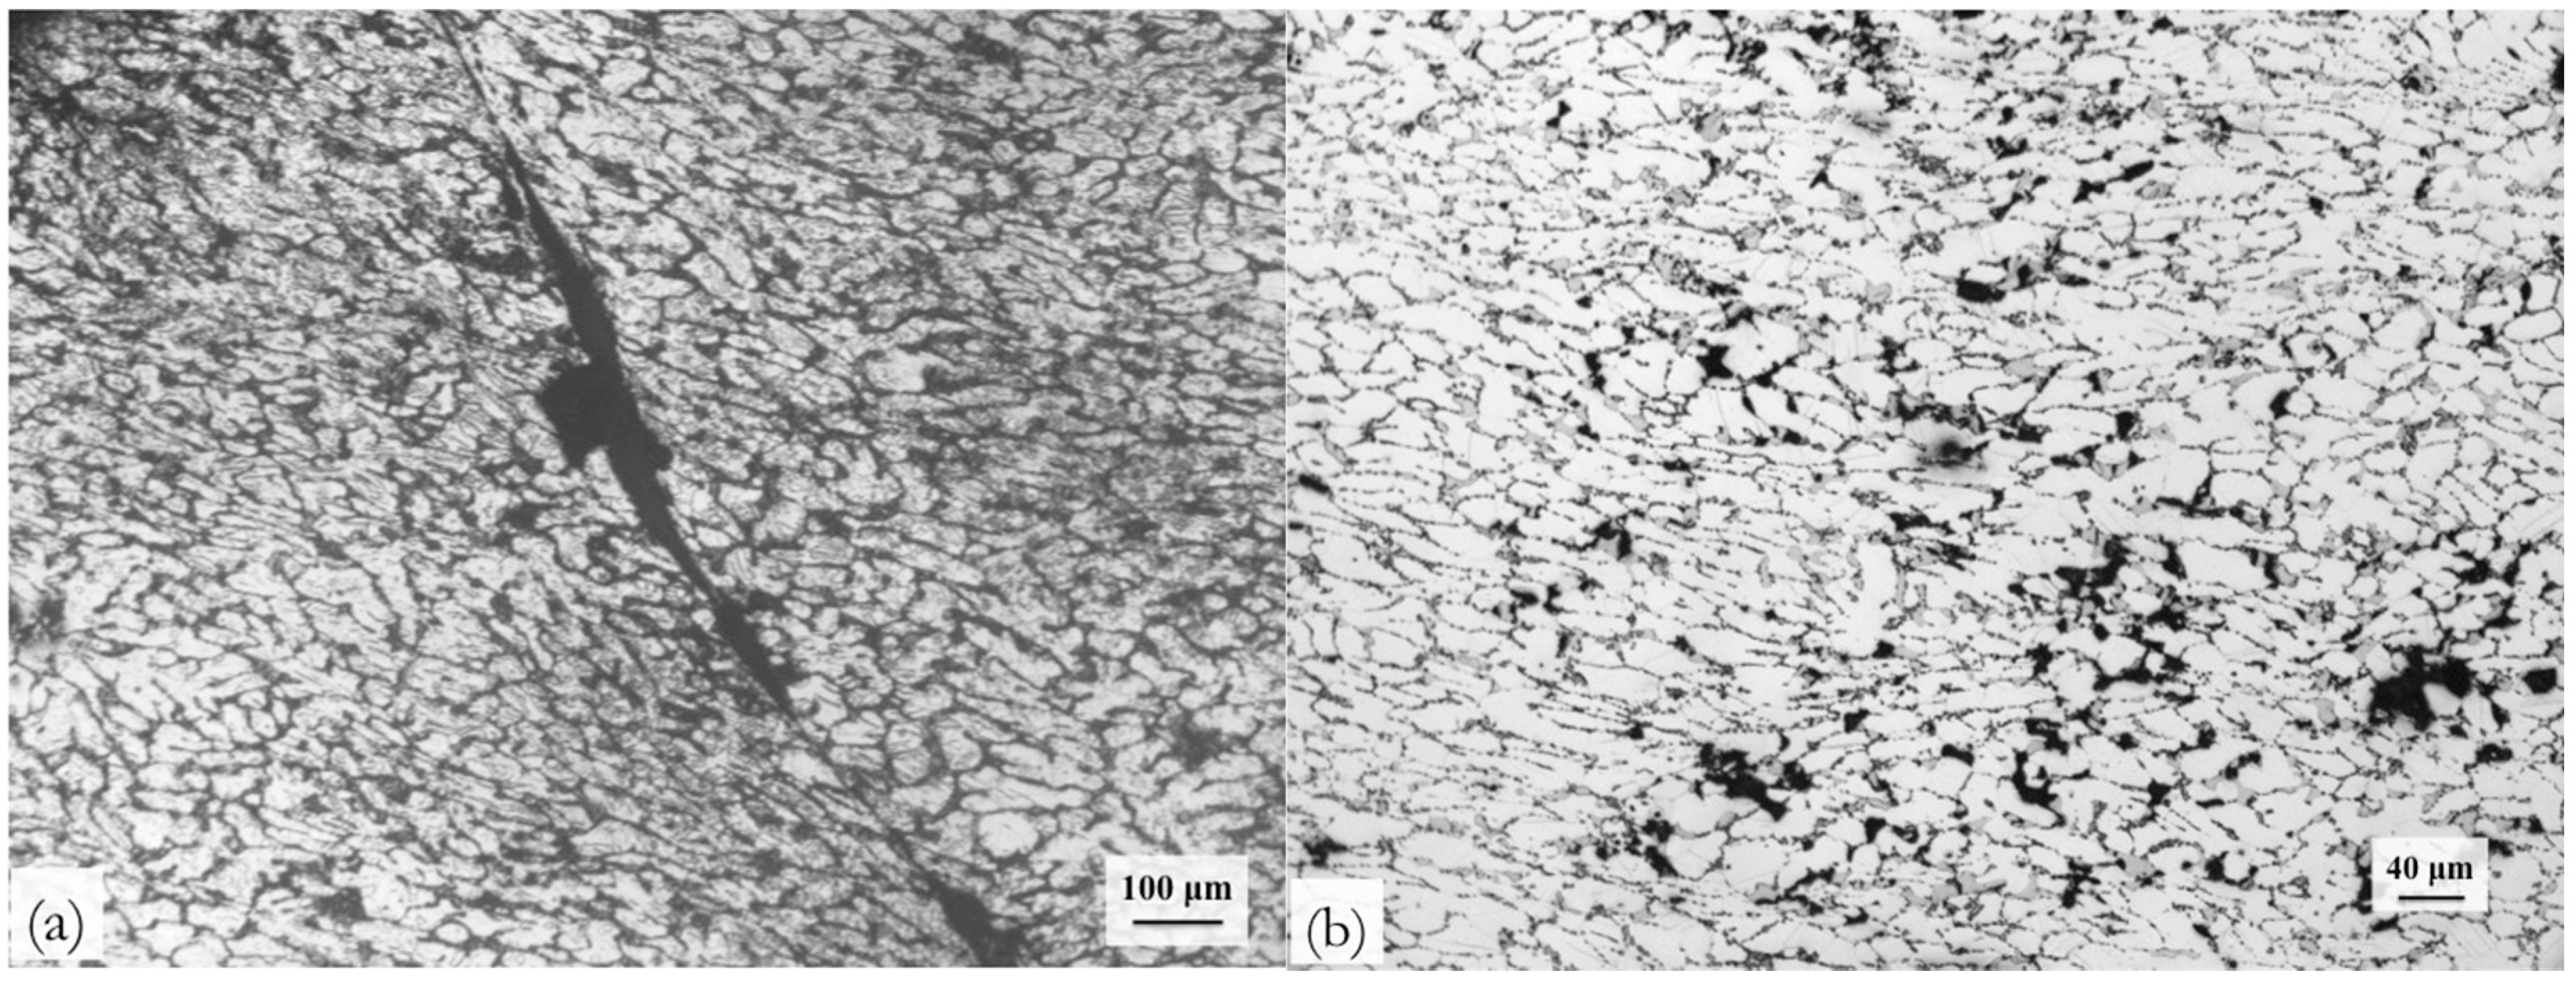
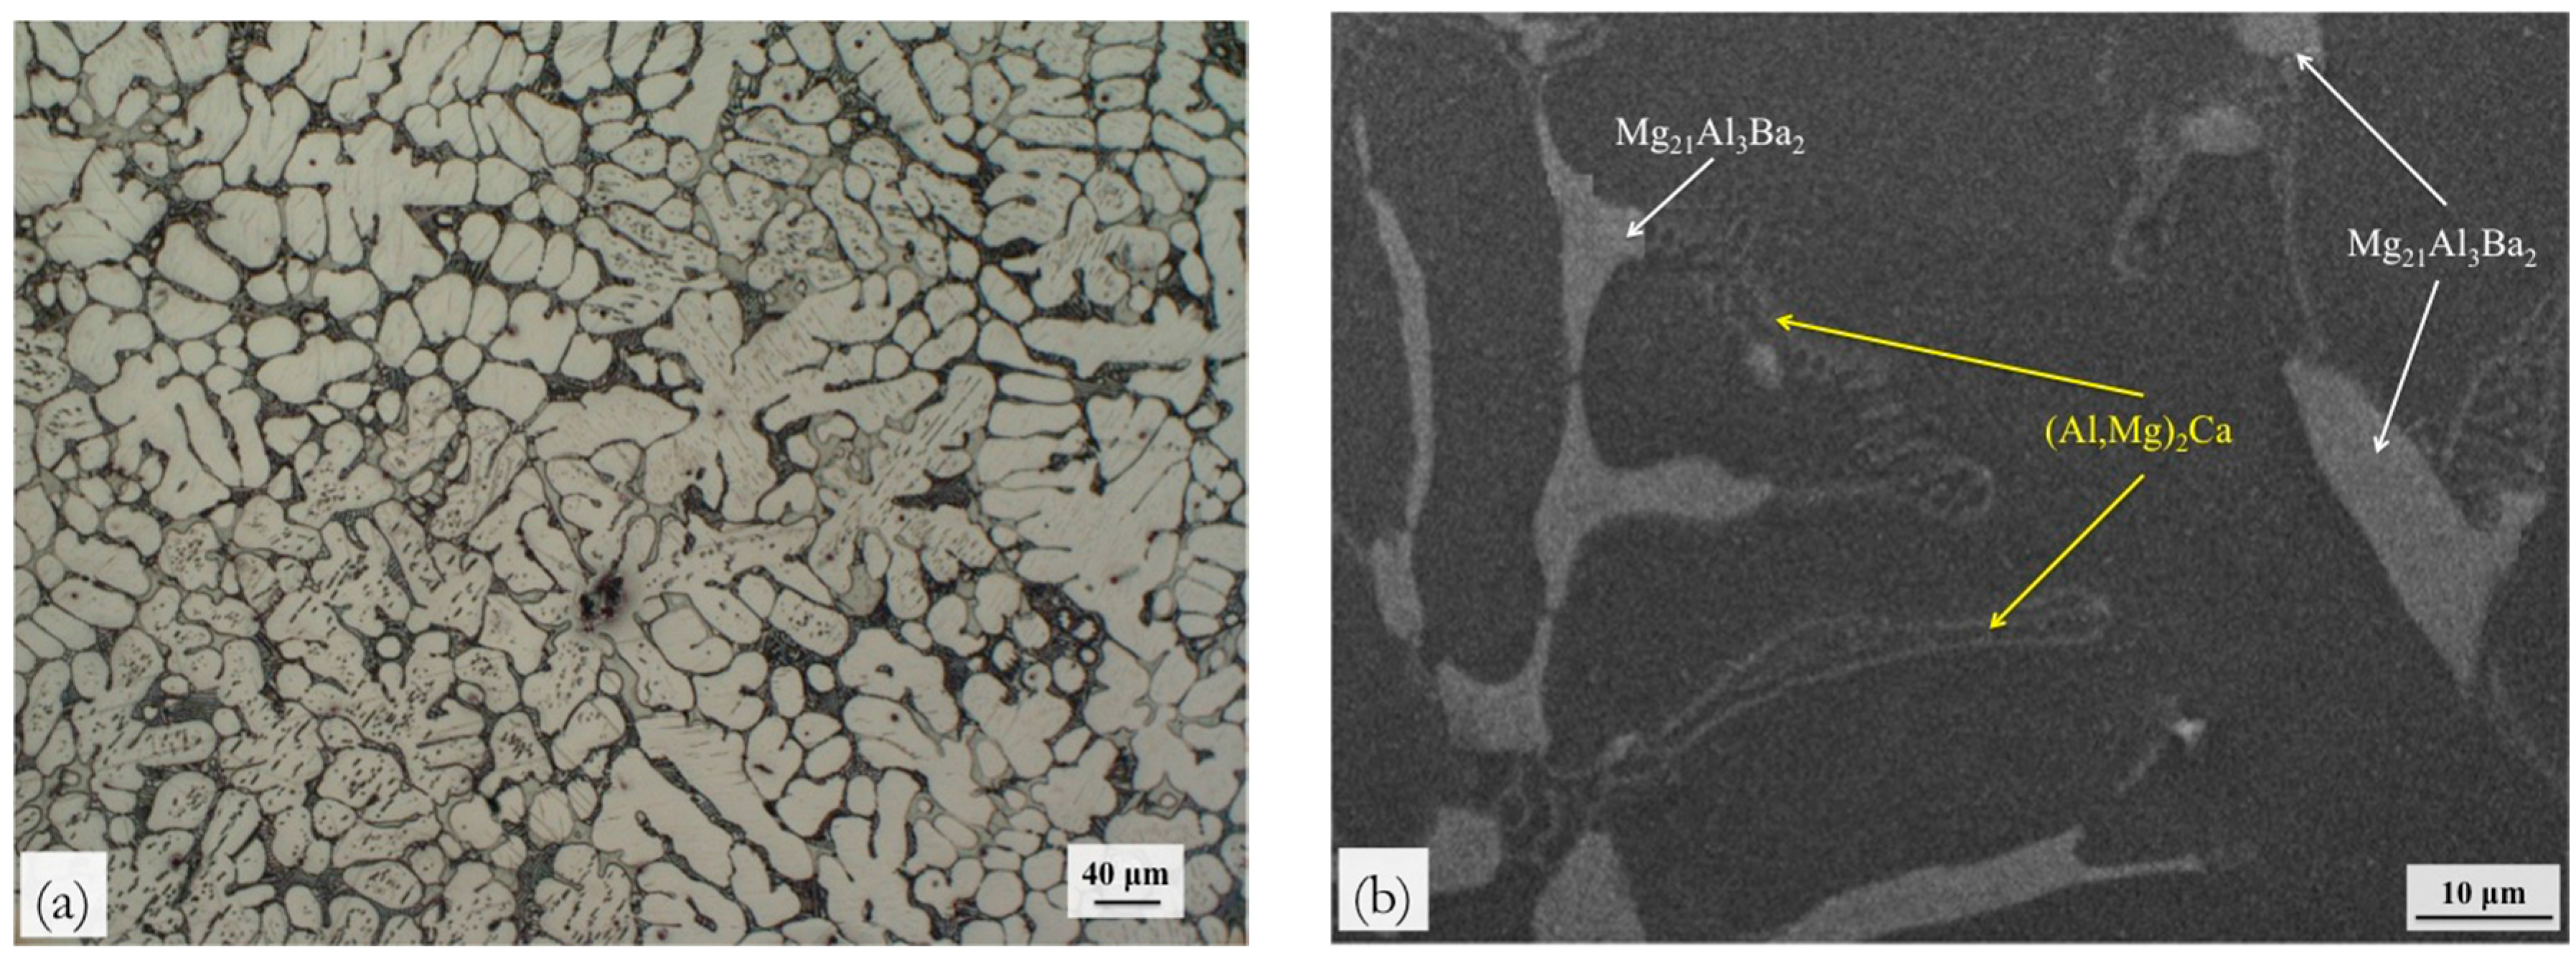
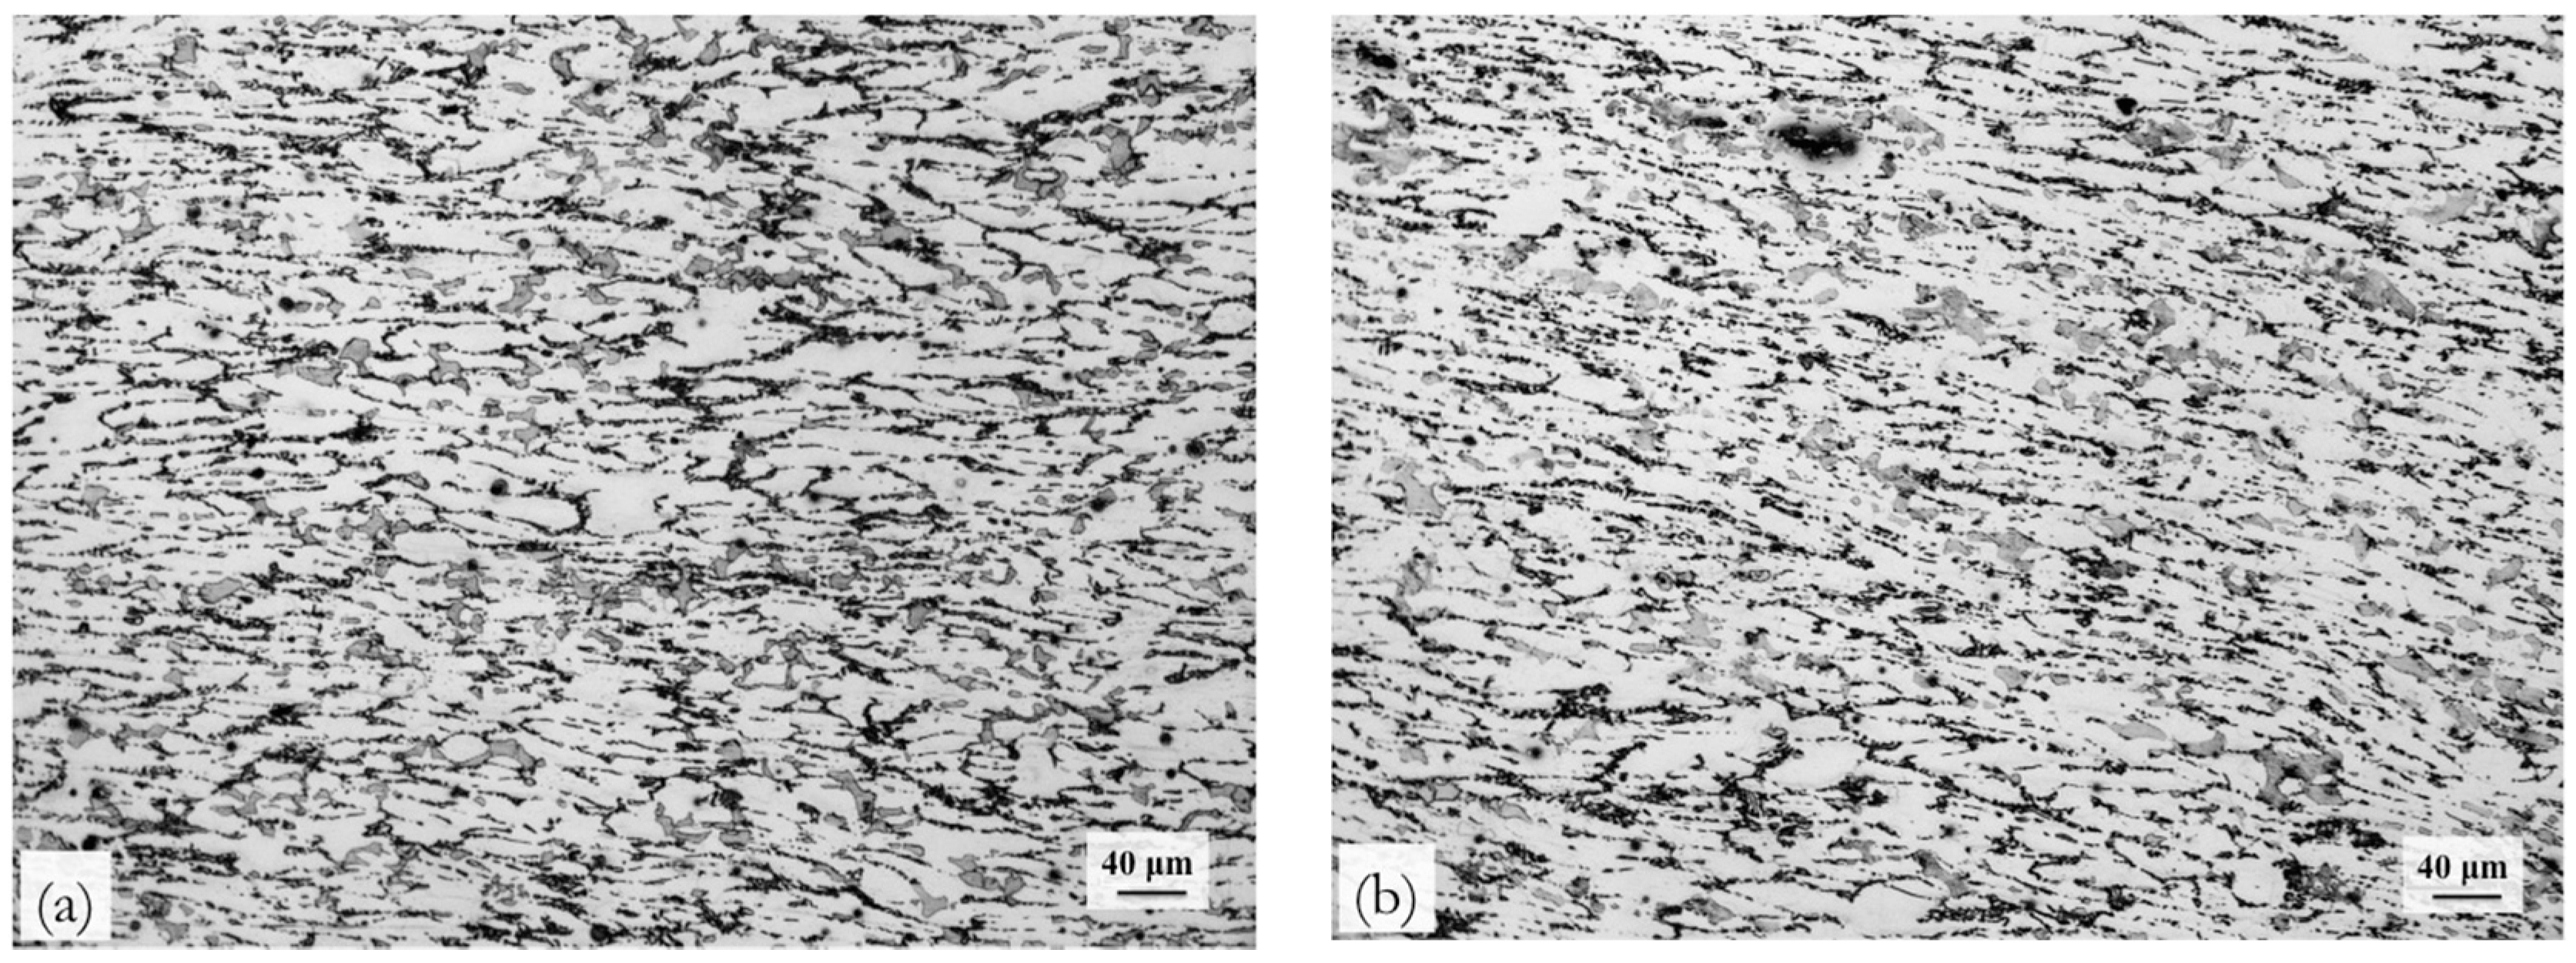
3.1. Characterization of Initial Alloy

The chemical composition of the ABaX633 alloy is shown in Table 1. The optical micrograph of as-cast microstructure of ABaX633 alloy is shown in Figure 1a. The average grain size is about 22 µm. The microstructure exhibits dark and light grey colored phases at the grain boundaries. Figure 1b shows the scanning electron micrograph, and the energy dispersive spectroscopy (JEOL 5600 SEM, JEOL Ltd., Akishima, Tokyo) analysis revealed that the black lamellar phase is (Al, Mg)2Ca and the lighter grey phase is Mg21Al3Ba2 [4].
The macro- and the micro-hardness values recorded on ABaX633 alloy are compared with that of another alloy (ABaX422) belonging to the same family of alloys, but with lower concentration of alloying elements. The results are shown in Table 2, which reveals that the ABaX633 is harder and the micro-hardness of each of the individual phases is higher. This may be attributed to the higher concentration of the alloying elements.

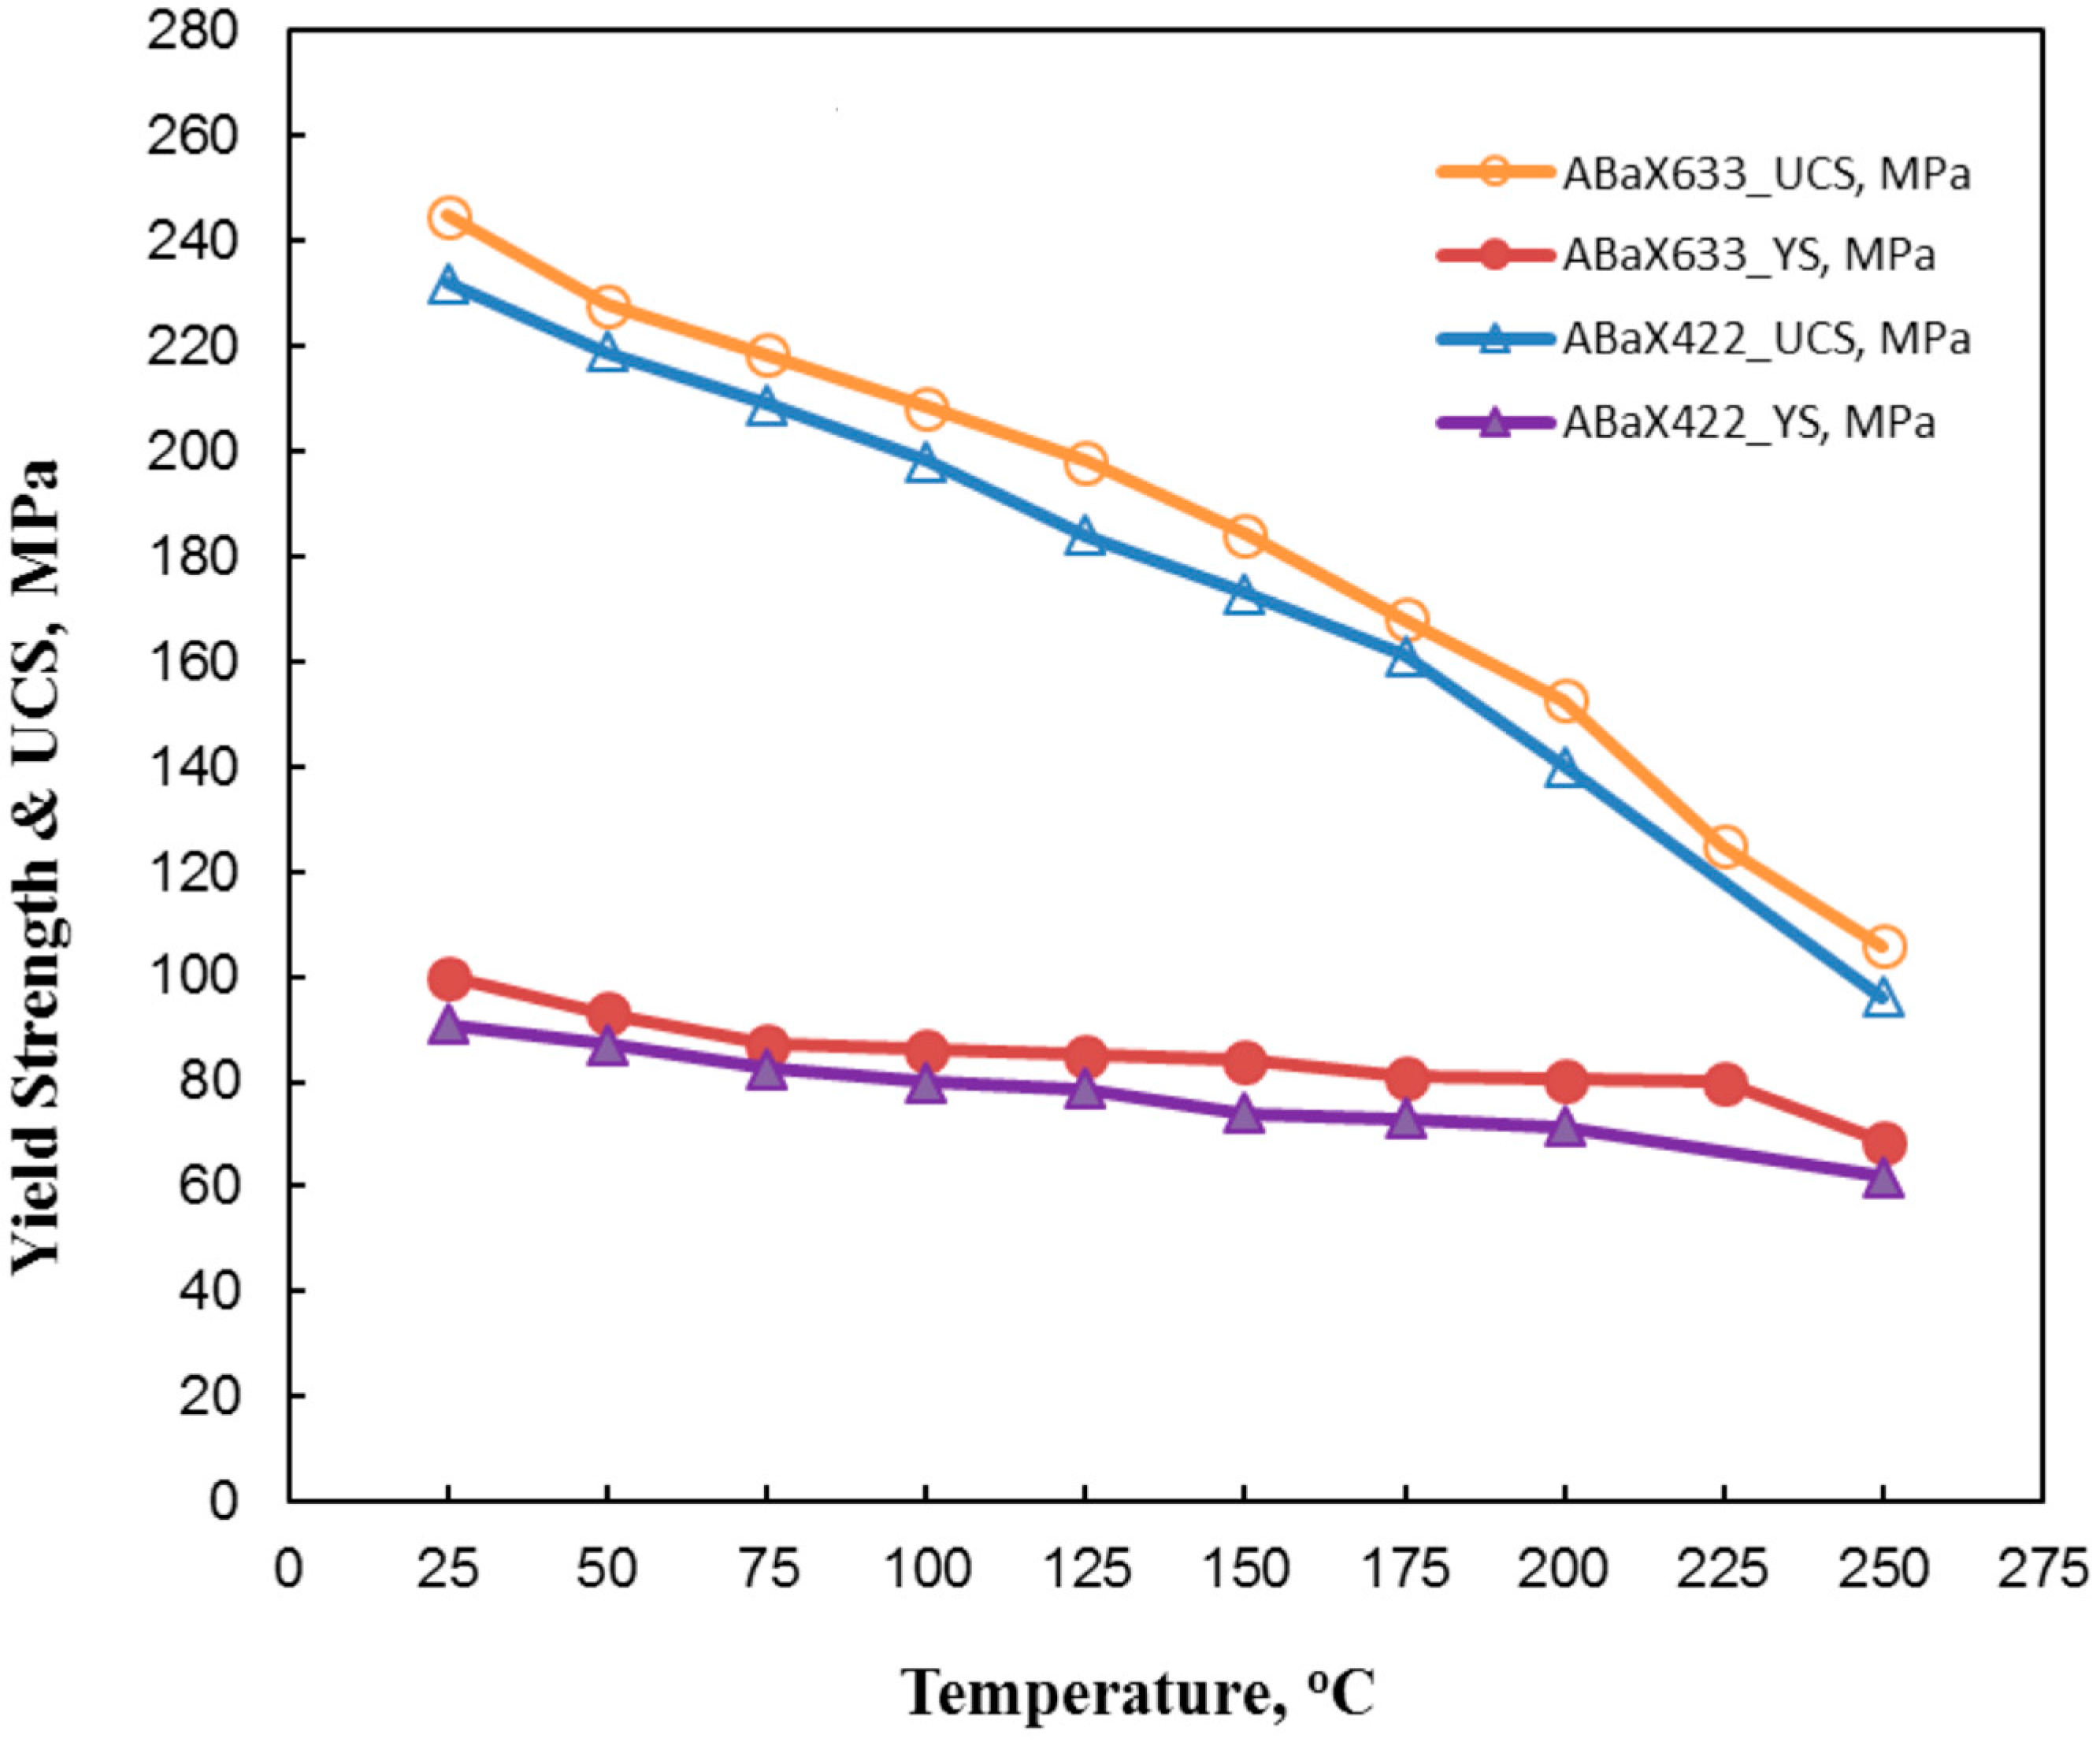
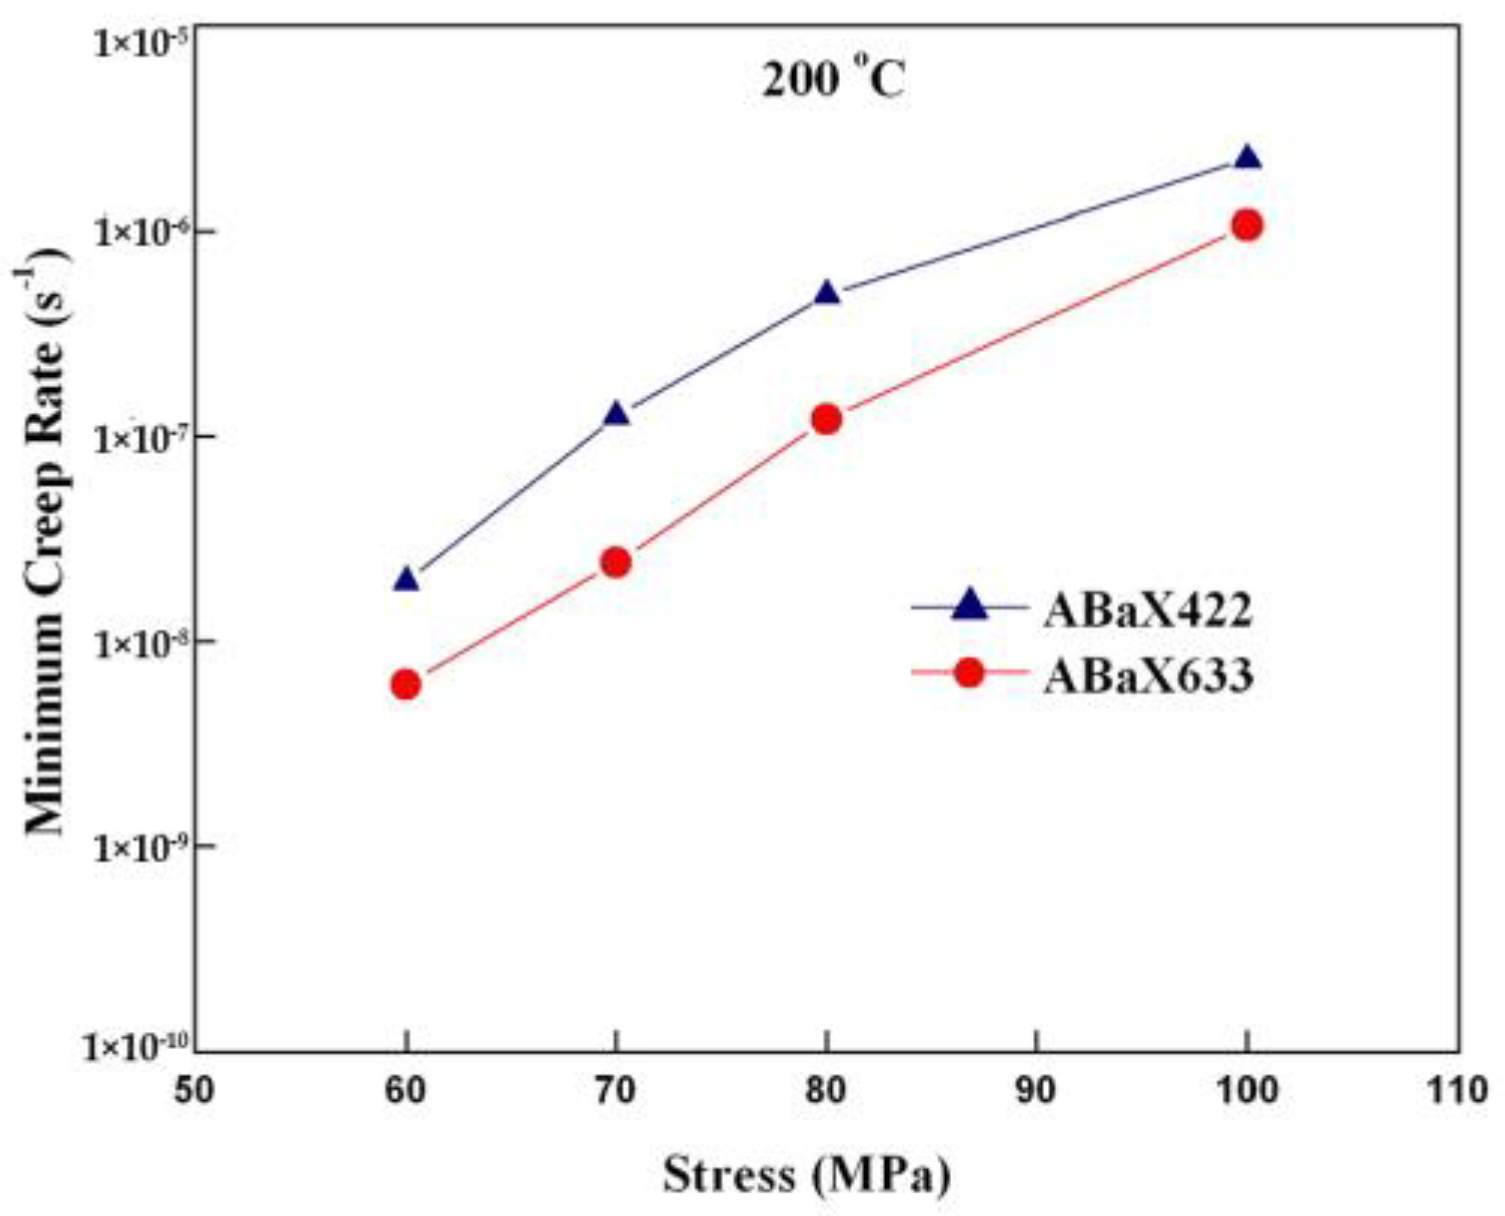
3.2. Creep and Compressive Strength

Compression creep tests at a high temperature of 200 °C were performed on cylindrical specimens (6 mm diameter and 15 mm length) under various constant stresses of 60, 70, 80, and 100 MPa for ABaX633 alloy and the creep rates that were obtained are shown in Figure 2. For comparison purpose, data on its predecessor alloy ABaX422 is also included in the figure. It is evident that ABaX633 alloy exhibited better creep resistance, i.e., lower creep rate, than ABaX422 at all the applied stress levels.
To evaluate the compressive strength of the alloy, compression tests were conducted in the temperature range of 25 to 250 °C at a strain rate of 0.0001 s−1. The ultimate compressive strength (UCS) and yield strength (YS) of the ABaX633 alloy are shown in Figure 3, and are compared with its predecessor, ABaX422 [8]. While the YS decreases only slightly with temperature, UCS drops steeply for both of the alloys. The relative increase in the strength of ABaX633 may be attributed to a higher solid solution strengthening by Al and the larger volume fraction of Ba and Ca containing intermetallic phases at the grain boundaries.

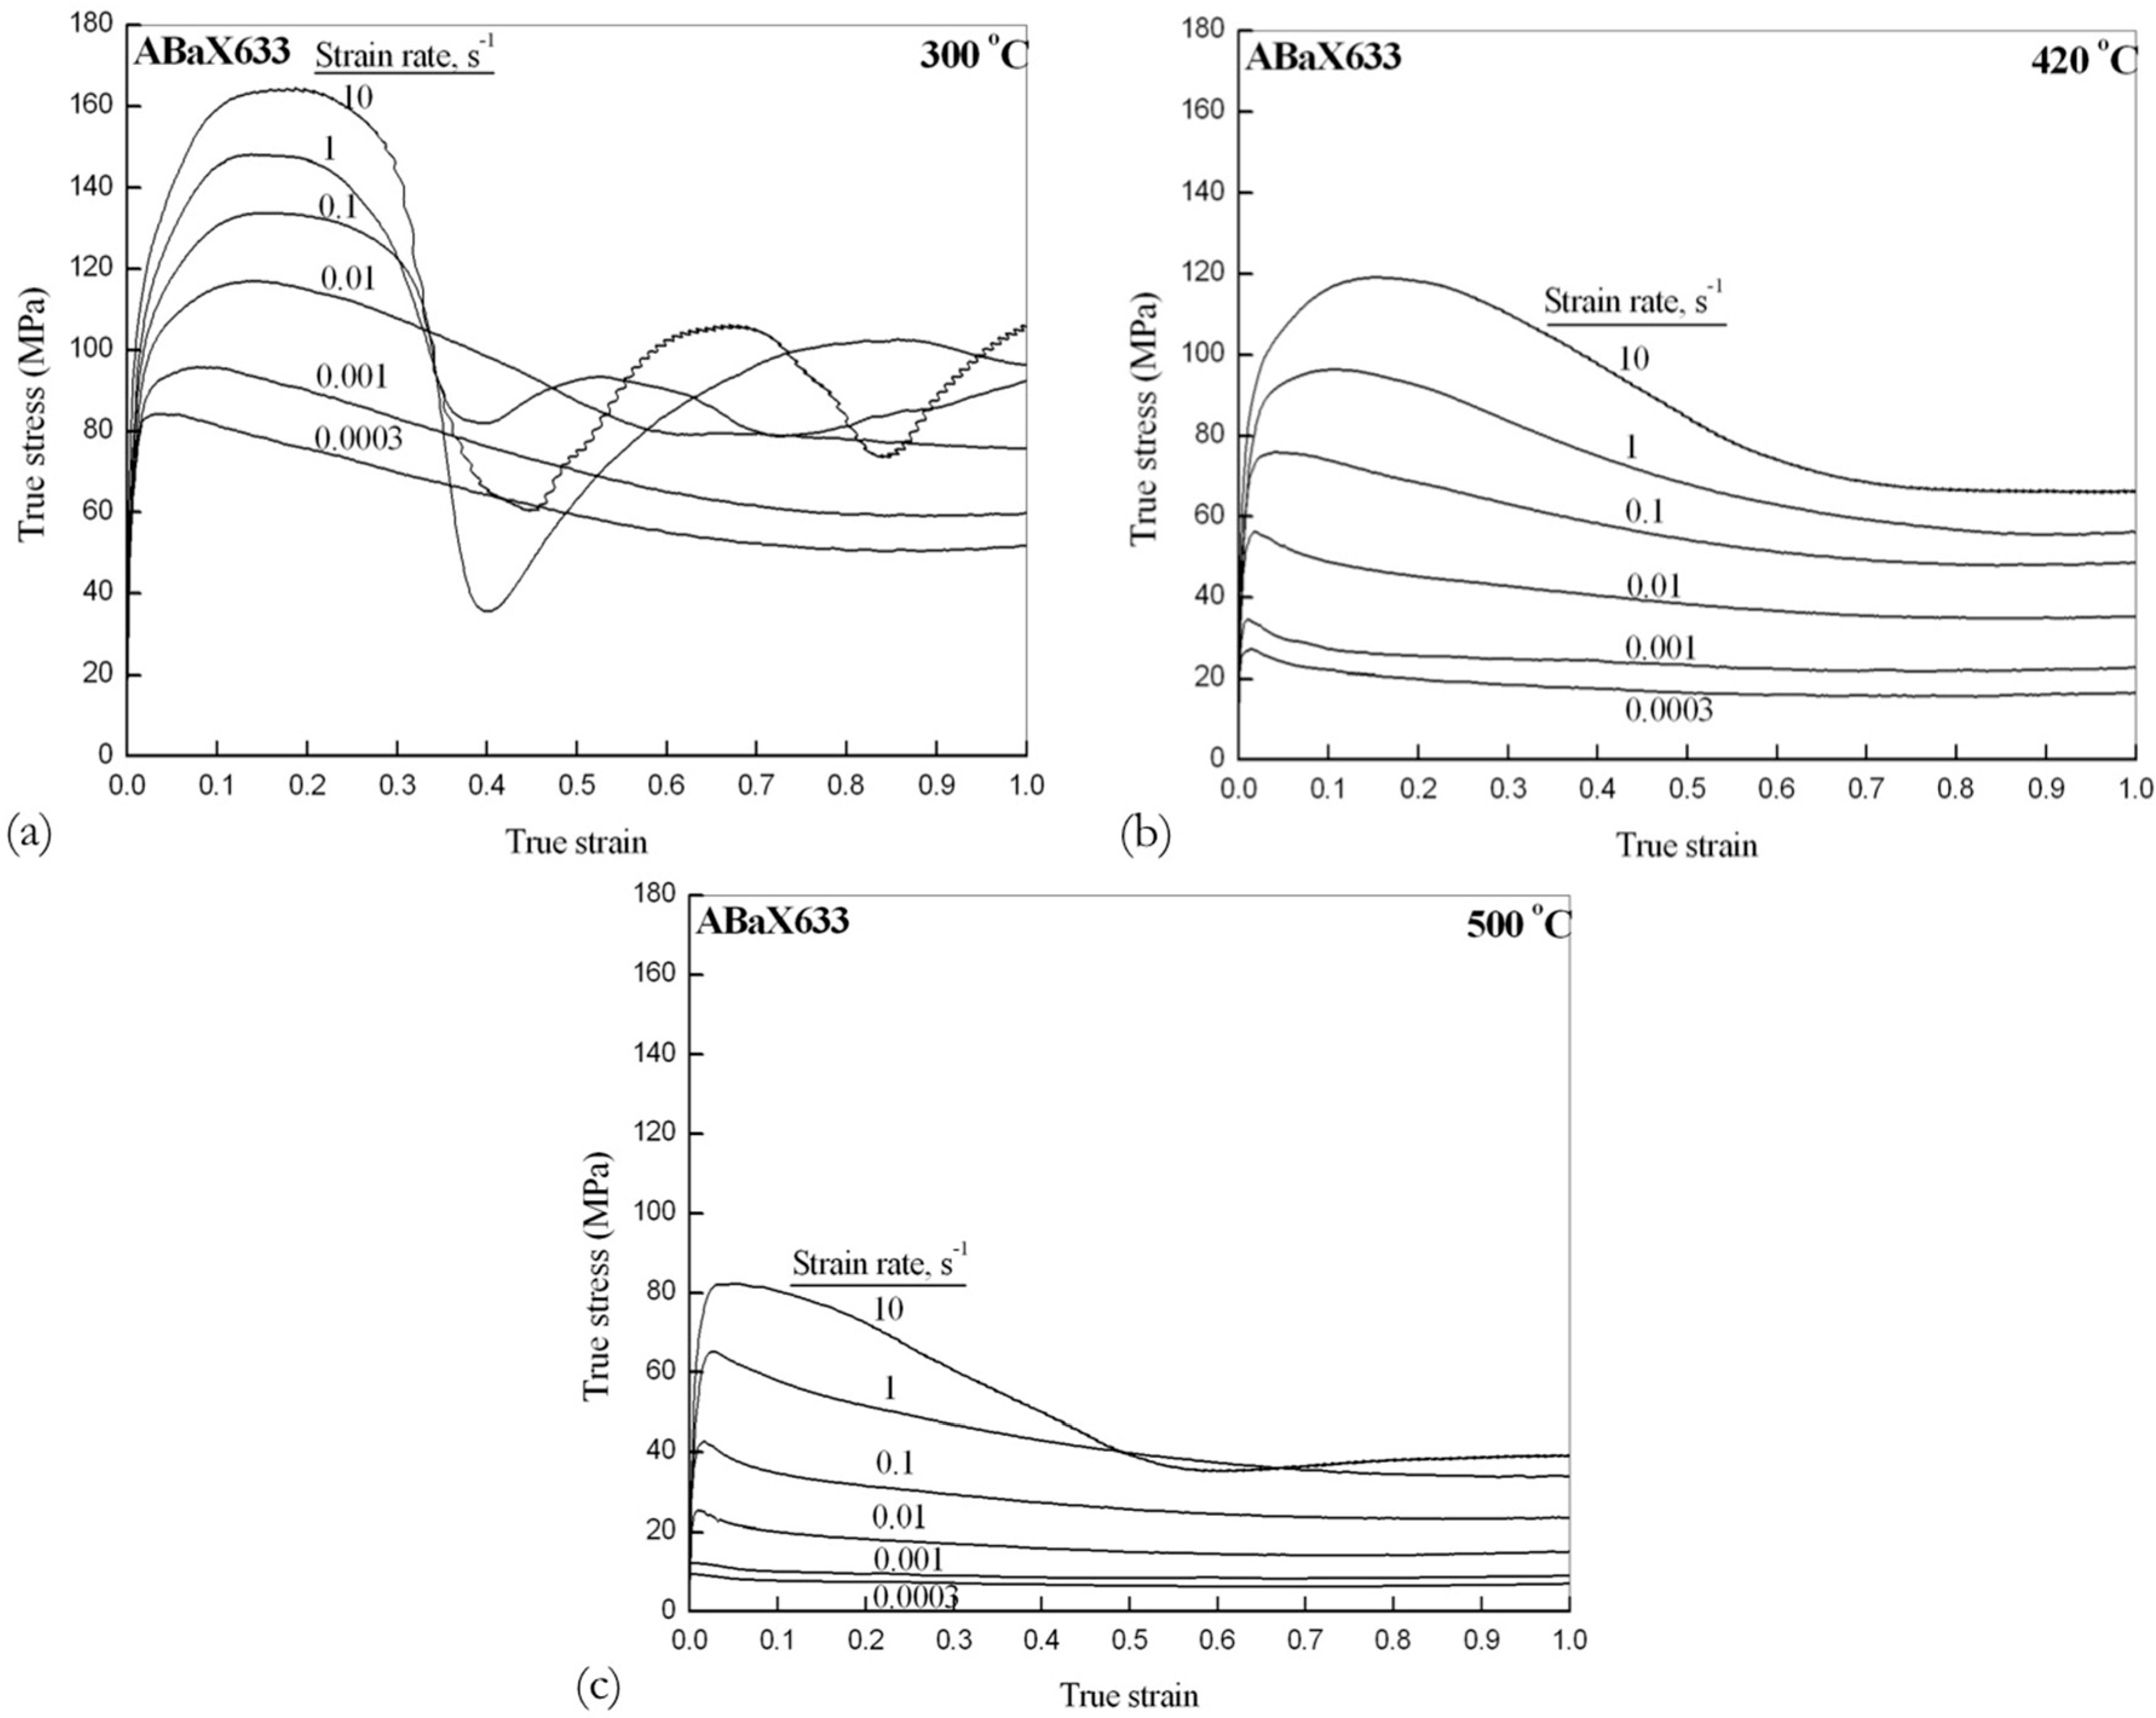
3.3. Stress-Strain Curves
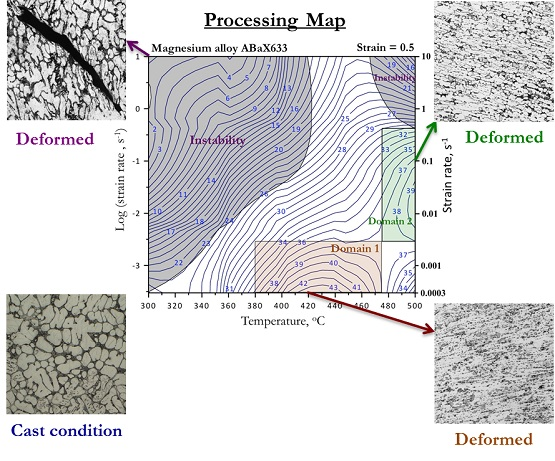
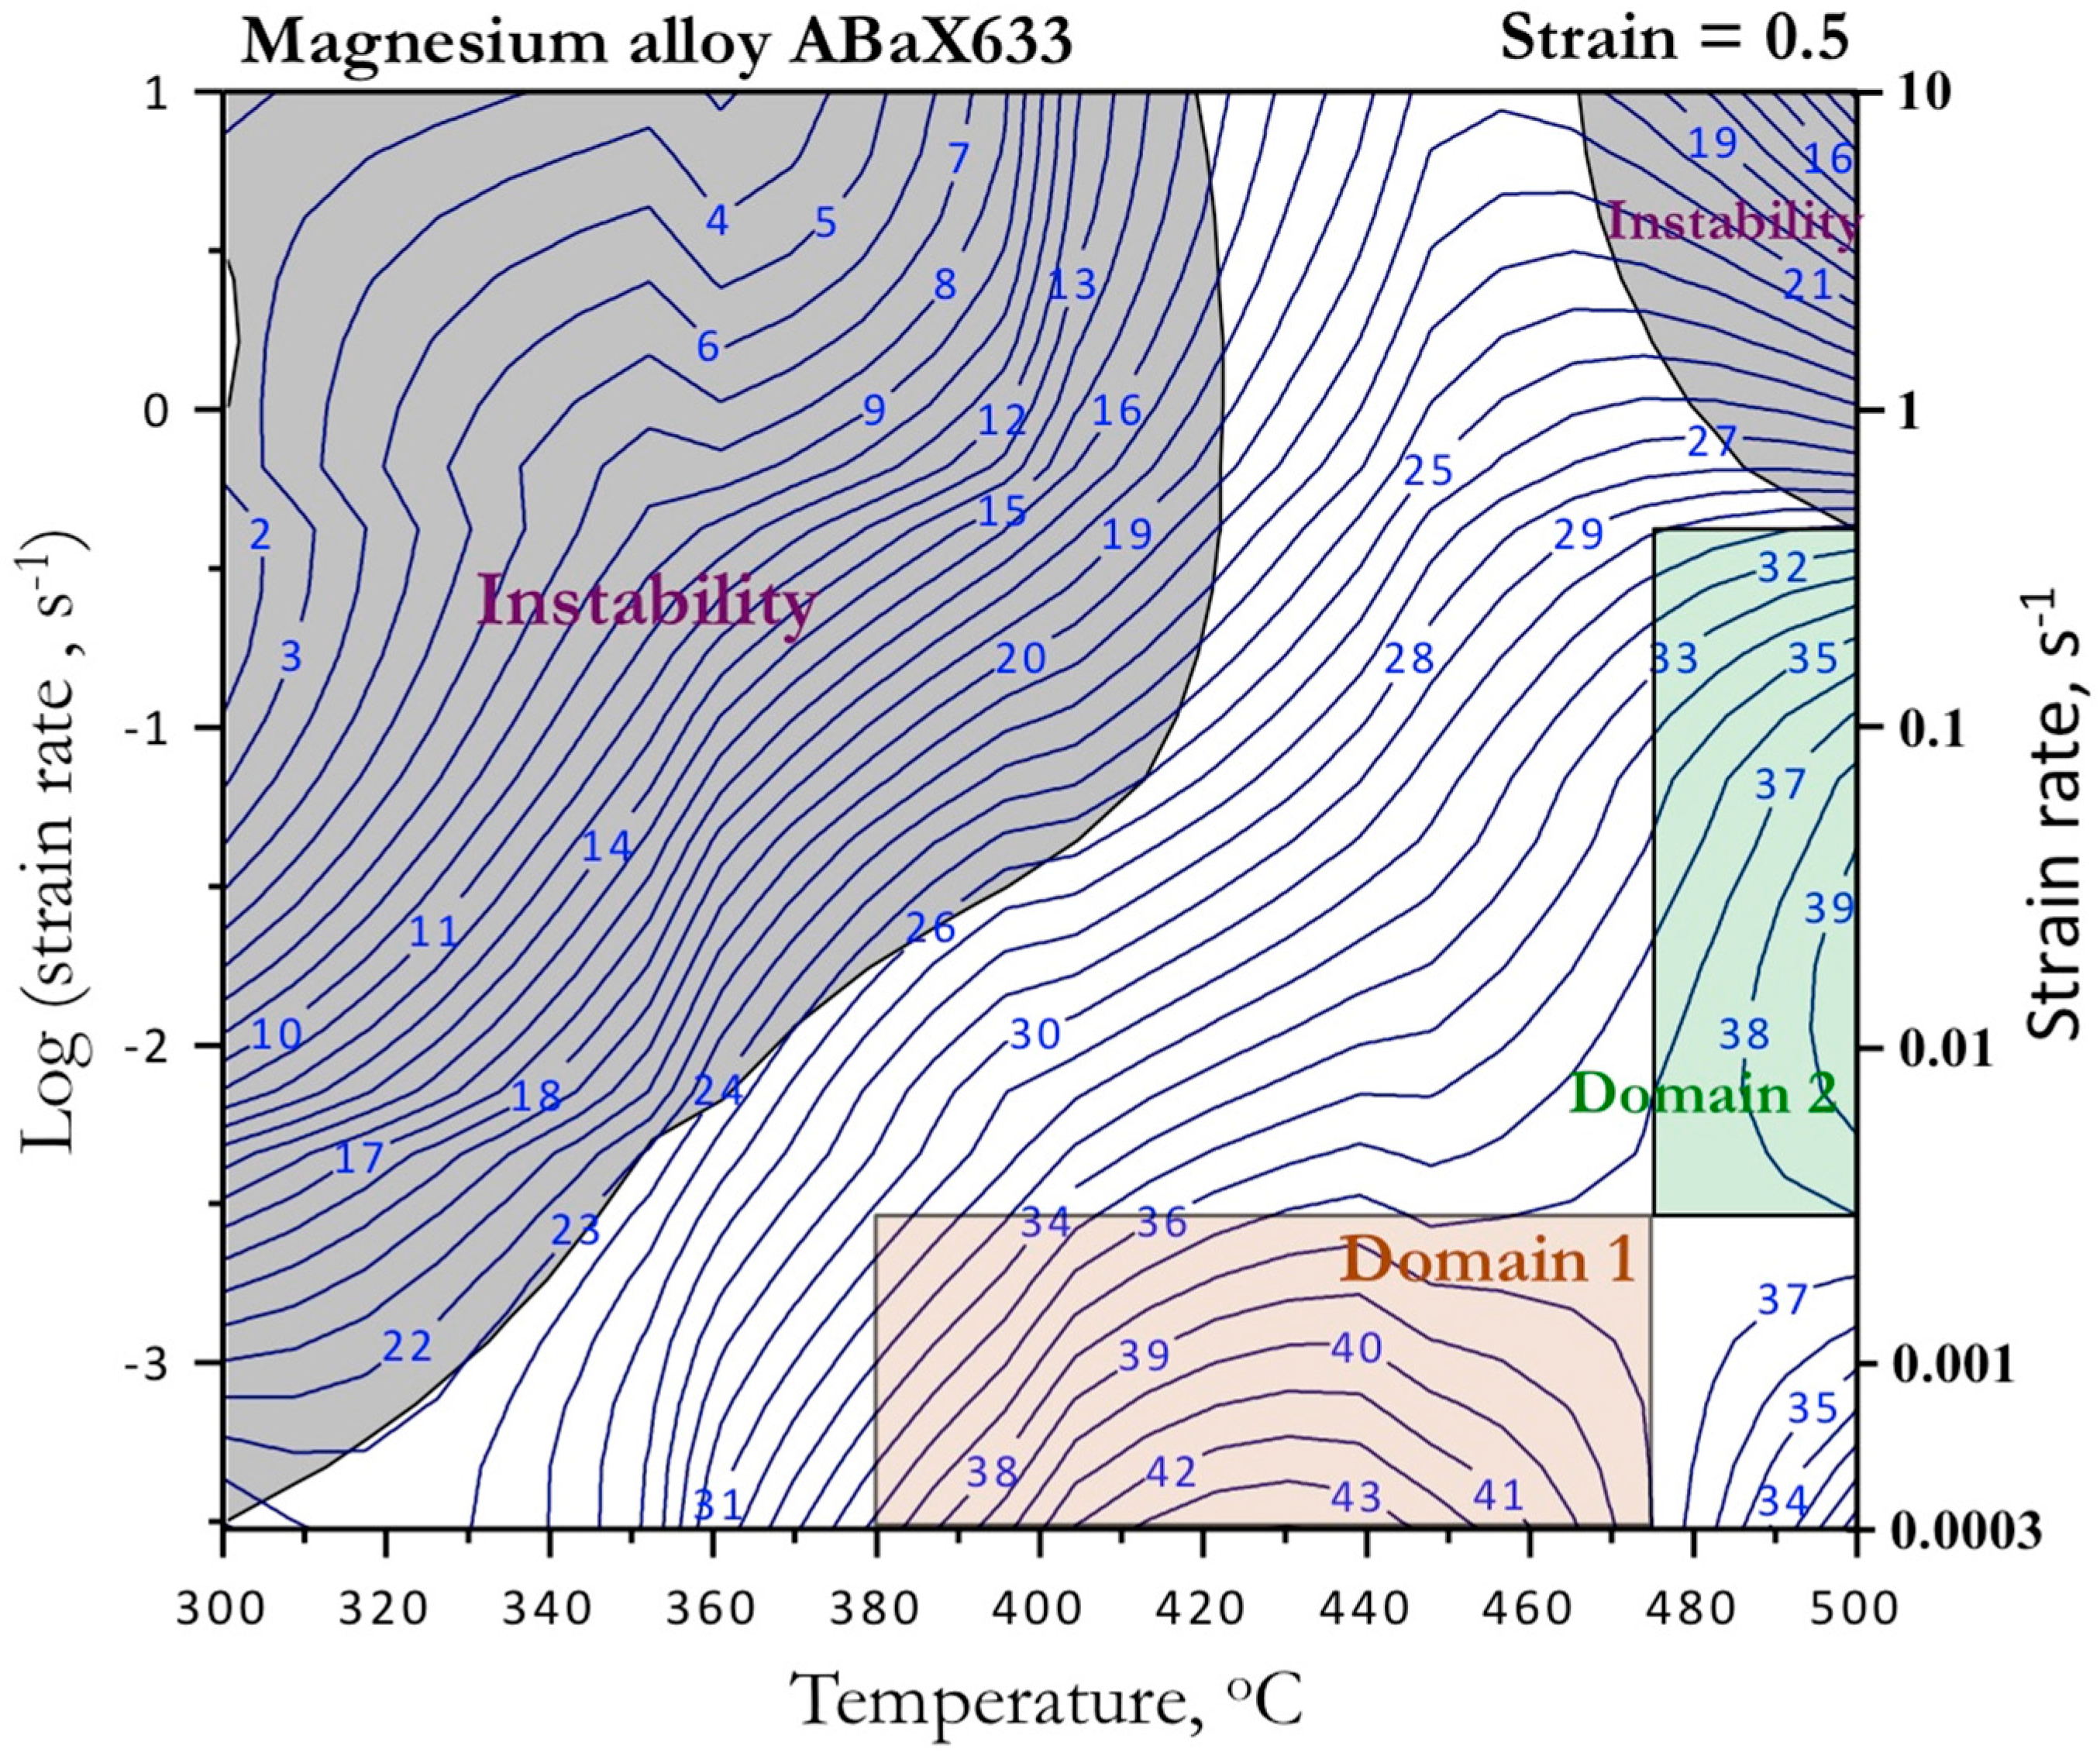
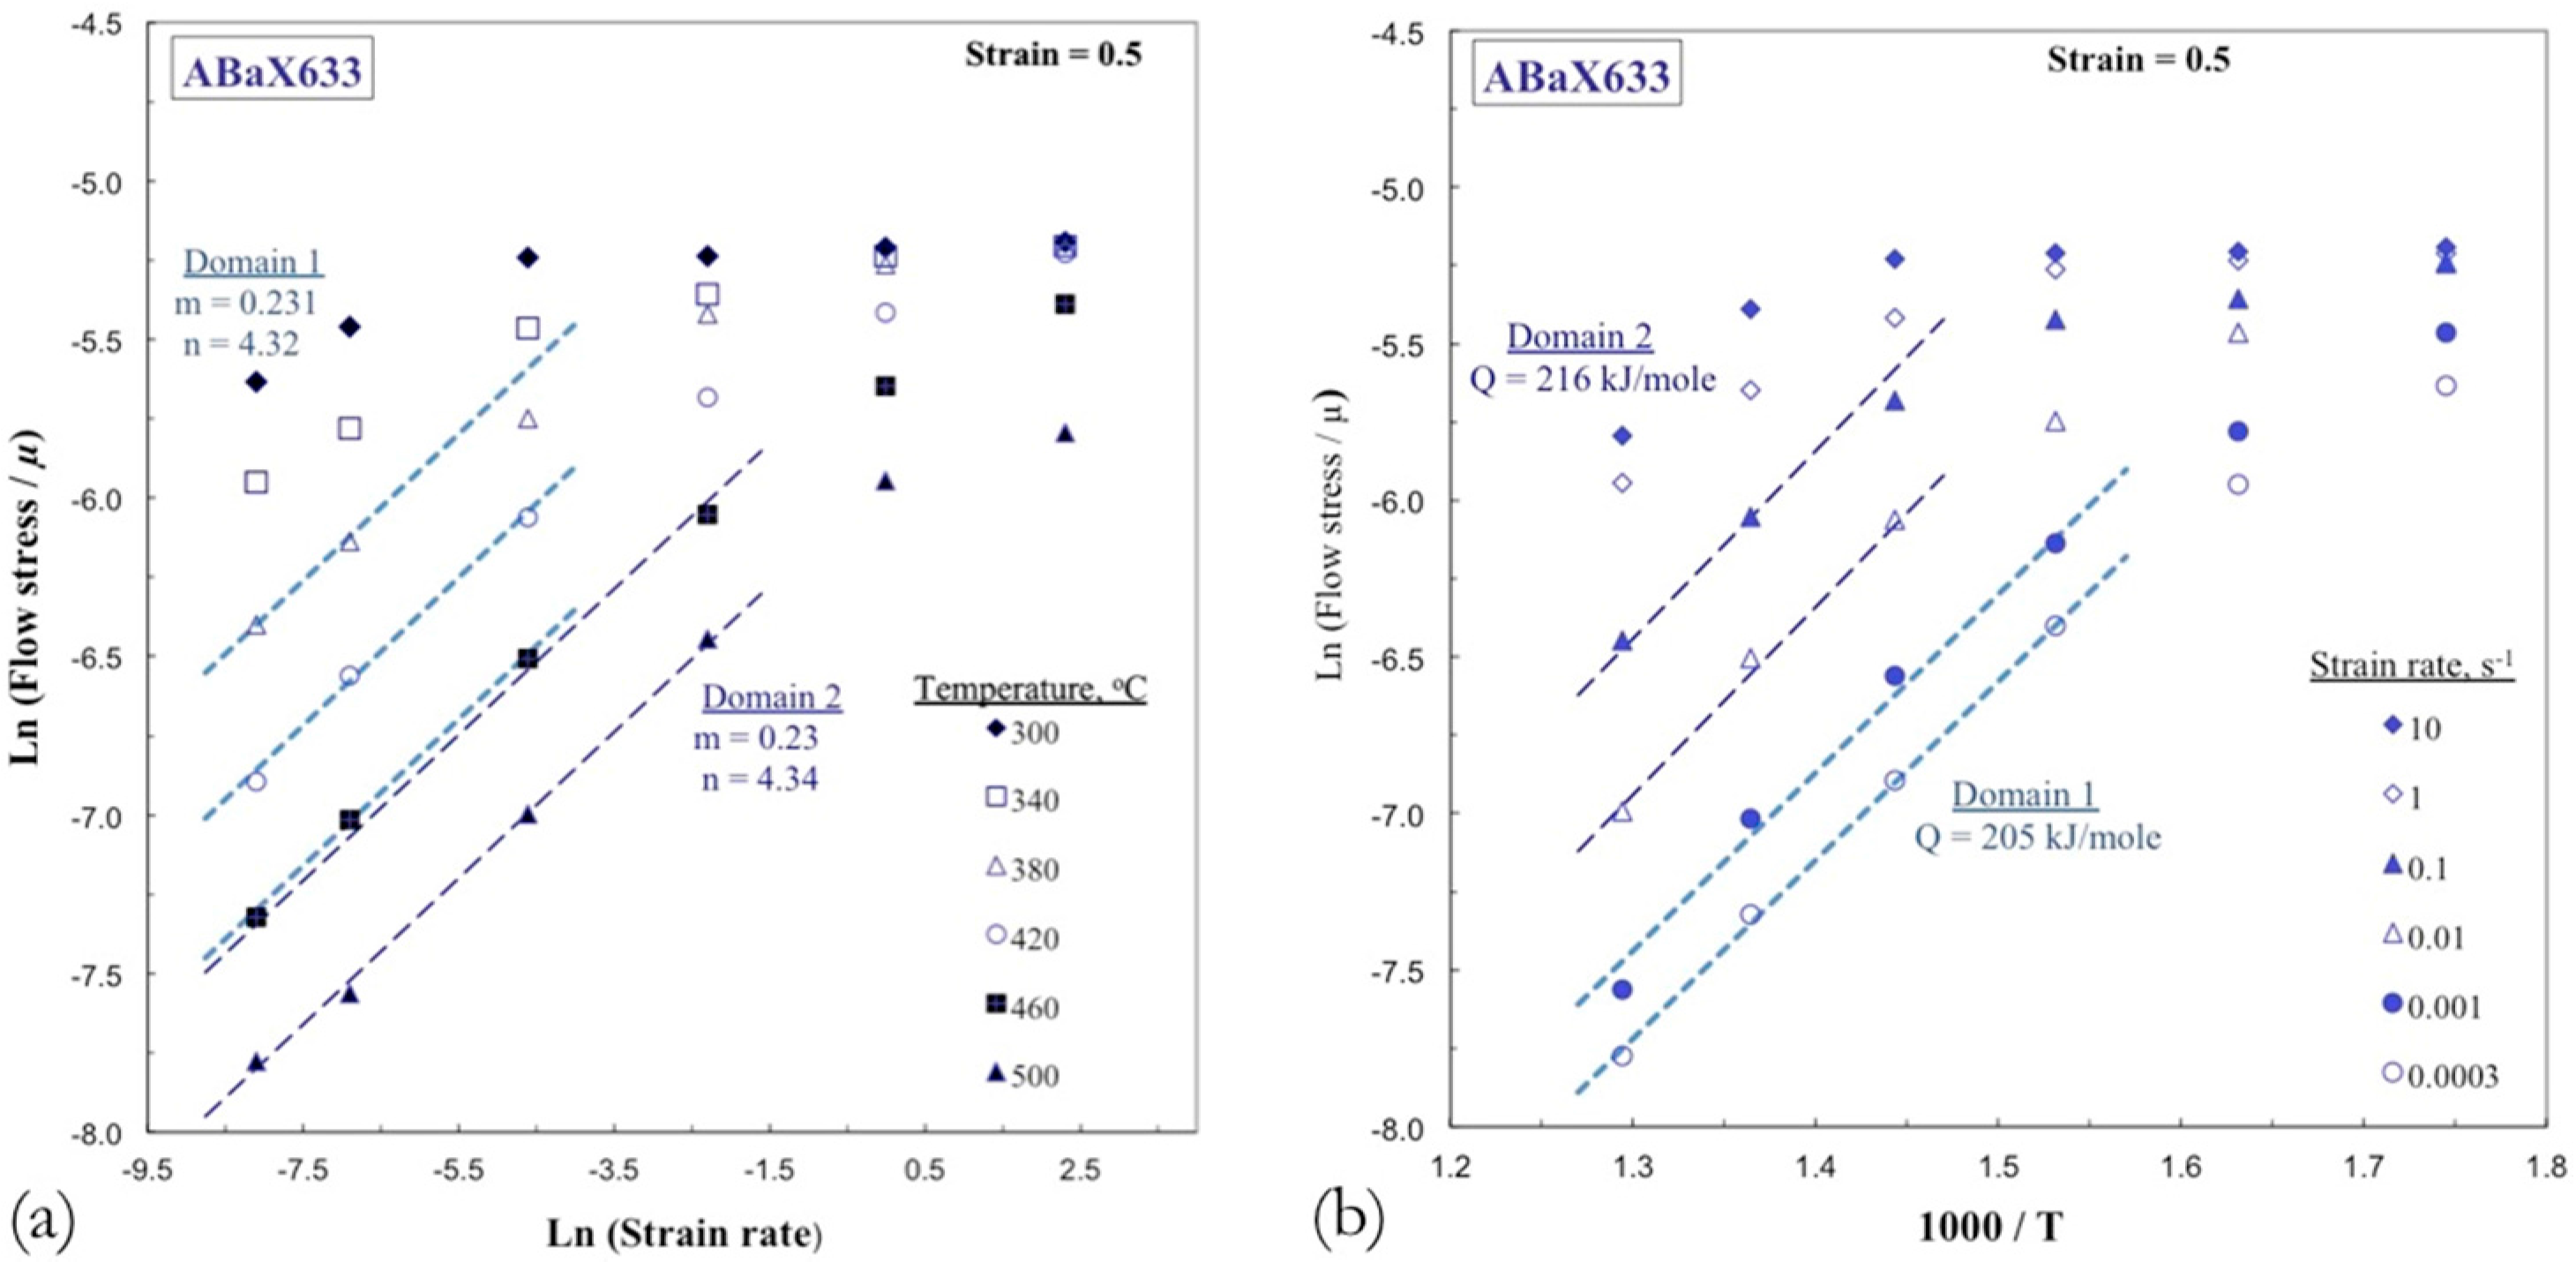
The true stress-true strain curves obtained on ABaX633 alloy at three different temperatures and all of the strain rates are shown in Figure 4a–c. At the lowest test temperature of 300 °C, the flow curves exhibited (Figure 4a) violent oscillation after initial peak at higher strain rates (>0.01 s−1) while at lower strain rates the flow reached a steady-state at larger strains. As the test temperature is increased beyond 420 °C, the flow curves showed (Figure 4b,c) initial peak followed by a steady state. The shapes of deformed specimens under different temperature and strain rate conditions are shown in Figure 5. It may be noted that the specimens have sheared under conditions where the flow curves exhibited oscillations, while at higher temperatures and lower strain rates, the deformation was homogenous leading to near circular shape.

3.4. Processing Map

In this approach, the material undergoing hot deformation is considered to be a non-linear dissipator of applied power [9,10]. The factor that partitions the applied power between deformation heat and microstructural changes is the strain rate sensitivity (m) of flow stress of the material. A measure of efficiency of power dissipation that is attributable to cause microstructural changes can be calculated by comparing with an ideal linear dissipator using the equation:
η = 2m/(m + 1)
The variation of η with temperature and strain rate at a chosen strain level can be represented as a three-dimensional “power dissipation map”. However, it is more convenient to use as an iso-efficiency contour map so as to identify “domains” where the dissipation efficiencies reach peaks (mountains) and they are surrounded by troughs (valleys) that separate the domains or change-over from one domain to another. Conceptually, each domain represents a dominant mechanism through which microstructural change occurs, and this may be confirmed by the microstructural examination of the deformed specimens.
The material may also undergo non-uniform deformation under certain conditions of processing and leads to flow instability because of the irreversibility of plastic flow. This may lead to the development of adiabatic shear bands or flow localization within the material, which is undesirable in metal forming. The corresponding sets of conditions are termed as “regimes”, in which the flow becomes unstable or non-uniform. On the basis of extremum principles of irreversible thermodynamics, as applied to large plastic flow [11], conditions that would cause such flow instabilities can be readily identified by estimating an instability parameter, ξ:
ξ ( ε ˙ ) =   ln [ m / ( m + 1 ) ]   ln ε ˙   + m   0
The flow instability regimes are established, where ξ is negative in the selected range of temperature and strain rate. A “flow instability map” can thus be established and is normally presented as a contour map so as to delineate the “regimes”. A processing map is the superimposition of flow instability map over the power dissipation map. With the help of such a composite map, one can easily identify suitable temperature-strain rate windows for hot working, in which microstructurally “safe” mechanisms like dynamic recrystallization (DRX) occur and flow instability regimes are avoided.
The kinetic rate equations are helpful in finding out the activation energy of rate controlling deformation mechanisms. Jonas et al. [12] have proposed an equation for hot deformation that relates flow stress (σ) to strain rate ( ε ˙ ) and temperature (T):
ε ˙ = A σ n exp [ Q / R T ]
where A is a constant, n is a stress exponent, Q is the activation energy, and R is the gas constant. This rate equation can be used to estimate the activation parameters n and Q for each domain of the processing map so as to determine the corresponding rate-controlling mechanism.
The processing map developed at a strain of 0.5 is shown in Figure 6. At this strain and beyond, the material flow is of steady-state type. The features exhibited by maps obtained at other strains are not largely different from those seen in Figure 6. The map exhibited two domains at temperature and strain rate ranges:
(1). 380 to 475 °C and 0.0003 to 0.003 s−1 with a peak efficiency of 43% occurring at 430 °C and 0.0003 s−1 (Domain 1), and
(2). 480 to 500 °C and 0.003 to 0.5 s−1 with a peak efficiency of 39% occurring at 500 °C and 0.01 s−1 (Domain 2).
The map also exhibits two regimes of instability, one at lower temperatures and higher strain rates, and the other at higher temperatures (>470 °C) and higher strain rates (>0.5 s−1). The microstructural manifestations of the flow instability are discussed later.
The microstructure recorded on specimen deformed under peak efficiency conditions (420 °C/0.0003 s−1) is shown in Figure 7a, which exhibits dynamic recrystallization (DRX). The initial as-cast microstructure is transformed into a wrought form due to this process. Similar microstructure is obtained at a higher strain rate (0.001 s−1) within the domain, which is shown in Figure 7b. Under the temperature conditions of the domain (380–475 °C), basal and prismatic slip processes will be favored. Due to the low stacking fault energy for basal slip [13], the recovery mechanism that is associated with these slip processes and to nucleate DRX will be dislocation climb process, which is controlled by lattice diffusion.
Activation analysis of the temperature and strain rate dependency of flow stress using kinetic rate equation (Equation (3)) has been done with the help of data corresponding to Domain 1. The plot of the variation of flow stress with strain rate on a natural logarithmic scale is shown in Figure 8a for different test temperatures. The stress exponent evaluated from the linear relationship is 4.32. Arrhenius plot showing the variation of flow stress (normalized with shear modulus of pure magnesium (16.5 GPa) with an inverse of absolute temperature is shown in Figure 8b, from which apparent activation energy of 205 kJ/mol has been estimated. This value is higher than that for lattice self-diffusion (135 kJ/mol) in magnesium [14]. This apparent high value may be attributed to the contribution of back-stress to dislocation mobility that is caused by the presence of large volume fraction of intermetallic particles present in the as-cast microstructure. Taking this into account and discounting for the particle effect on the apparent activation energy, it may be concluded that lattice-diffusion is a plausible cause for recovery of dislocations on basal and prismatic slip systems. The slower strain rates at which Domain 1 occurs gives further support to diffusion-controlled mechanism for the nucleation of DRX.
The microstructure that is recorded under peak efficiency conditions (500 °C /0.01 s−1) of Domain 2 is shown in Figure 9a, which exhibits recrystallized grain structure replacing the as-cast initial one. This suggests that DRX has occurred in this domain also. The microstructure obtained at a higher strain rate (0.1 s−1) is shown in Figure 9b, which also confirms the occurrence of DRX. The temperature range for this domain is higher (>480 °C), which favors the activation of pyramidal slip systems, especially the second order pyramidal slip {11 2 2} <11 2 3>. Due to the large availability of intersecting slip planes in this system and a higher stacking fault energy [15], the likely recovery mechanism will involve cross-slip of screw dislocations. The values of stress exponent and apparent activation energy evaluated from the flow stress data in this domain, as plotted in Figure 8, are 4.34 and 216 kJ/mol, respectively. The presence of large back stress has an obvious contribution to the apparent activation energy.
As far as hot working is concerned, the above results suggest that bulk hot forming may be done in the second domain, the optimum conditions being 500 °C and 0.01 s−1, since the workability will be maximum in this domain. On the other hand, finish forming may be done at slow speeds and lower temperatures, corresponding to Domain 1, the optimum conditions being 420 °C and 0.0003 s−1. The grain size in the product will be finer that will result in better mechanical properties.

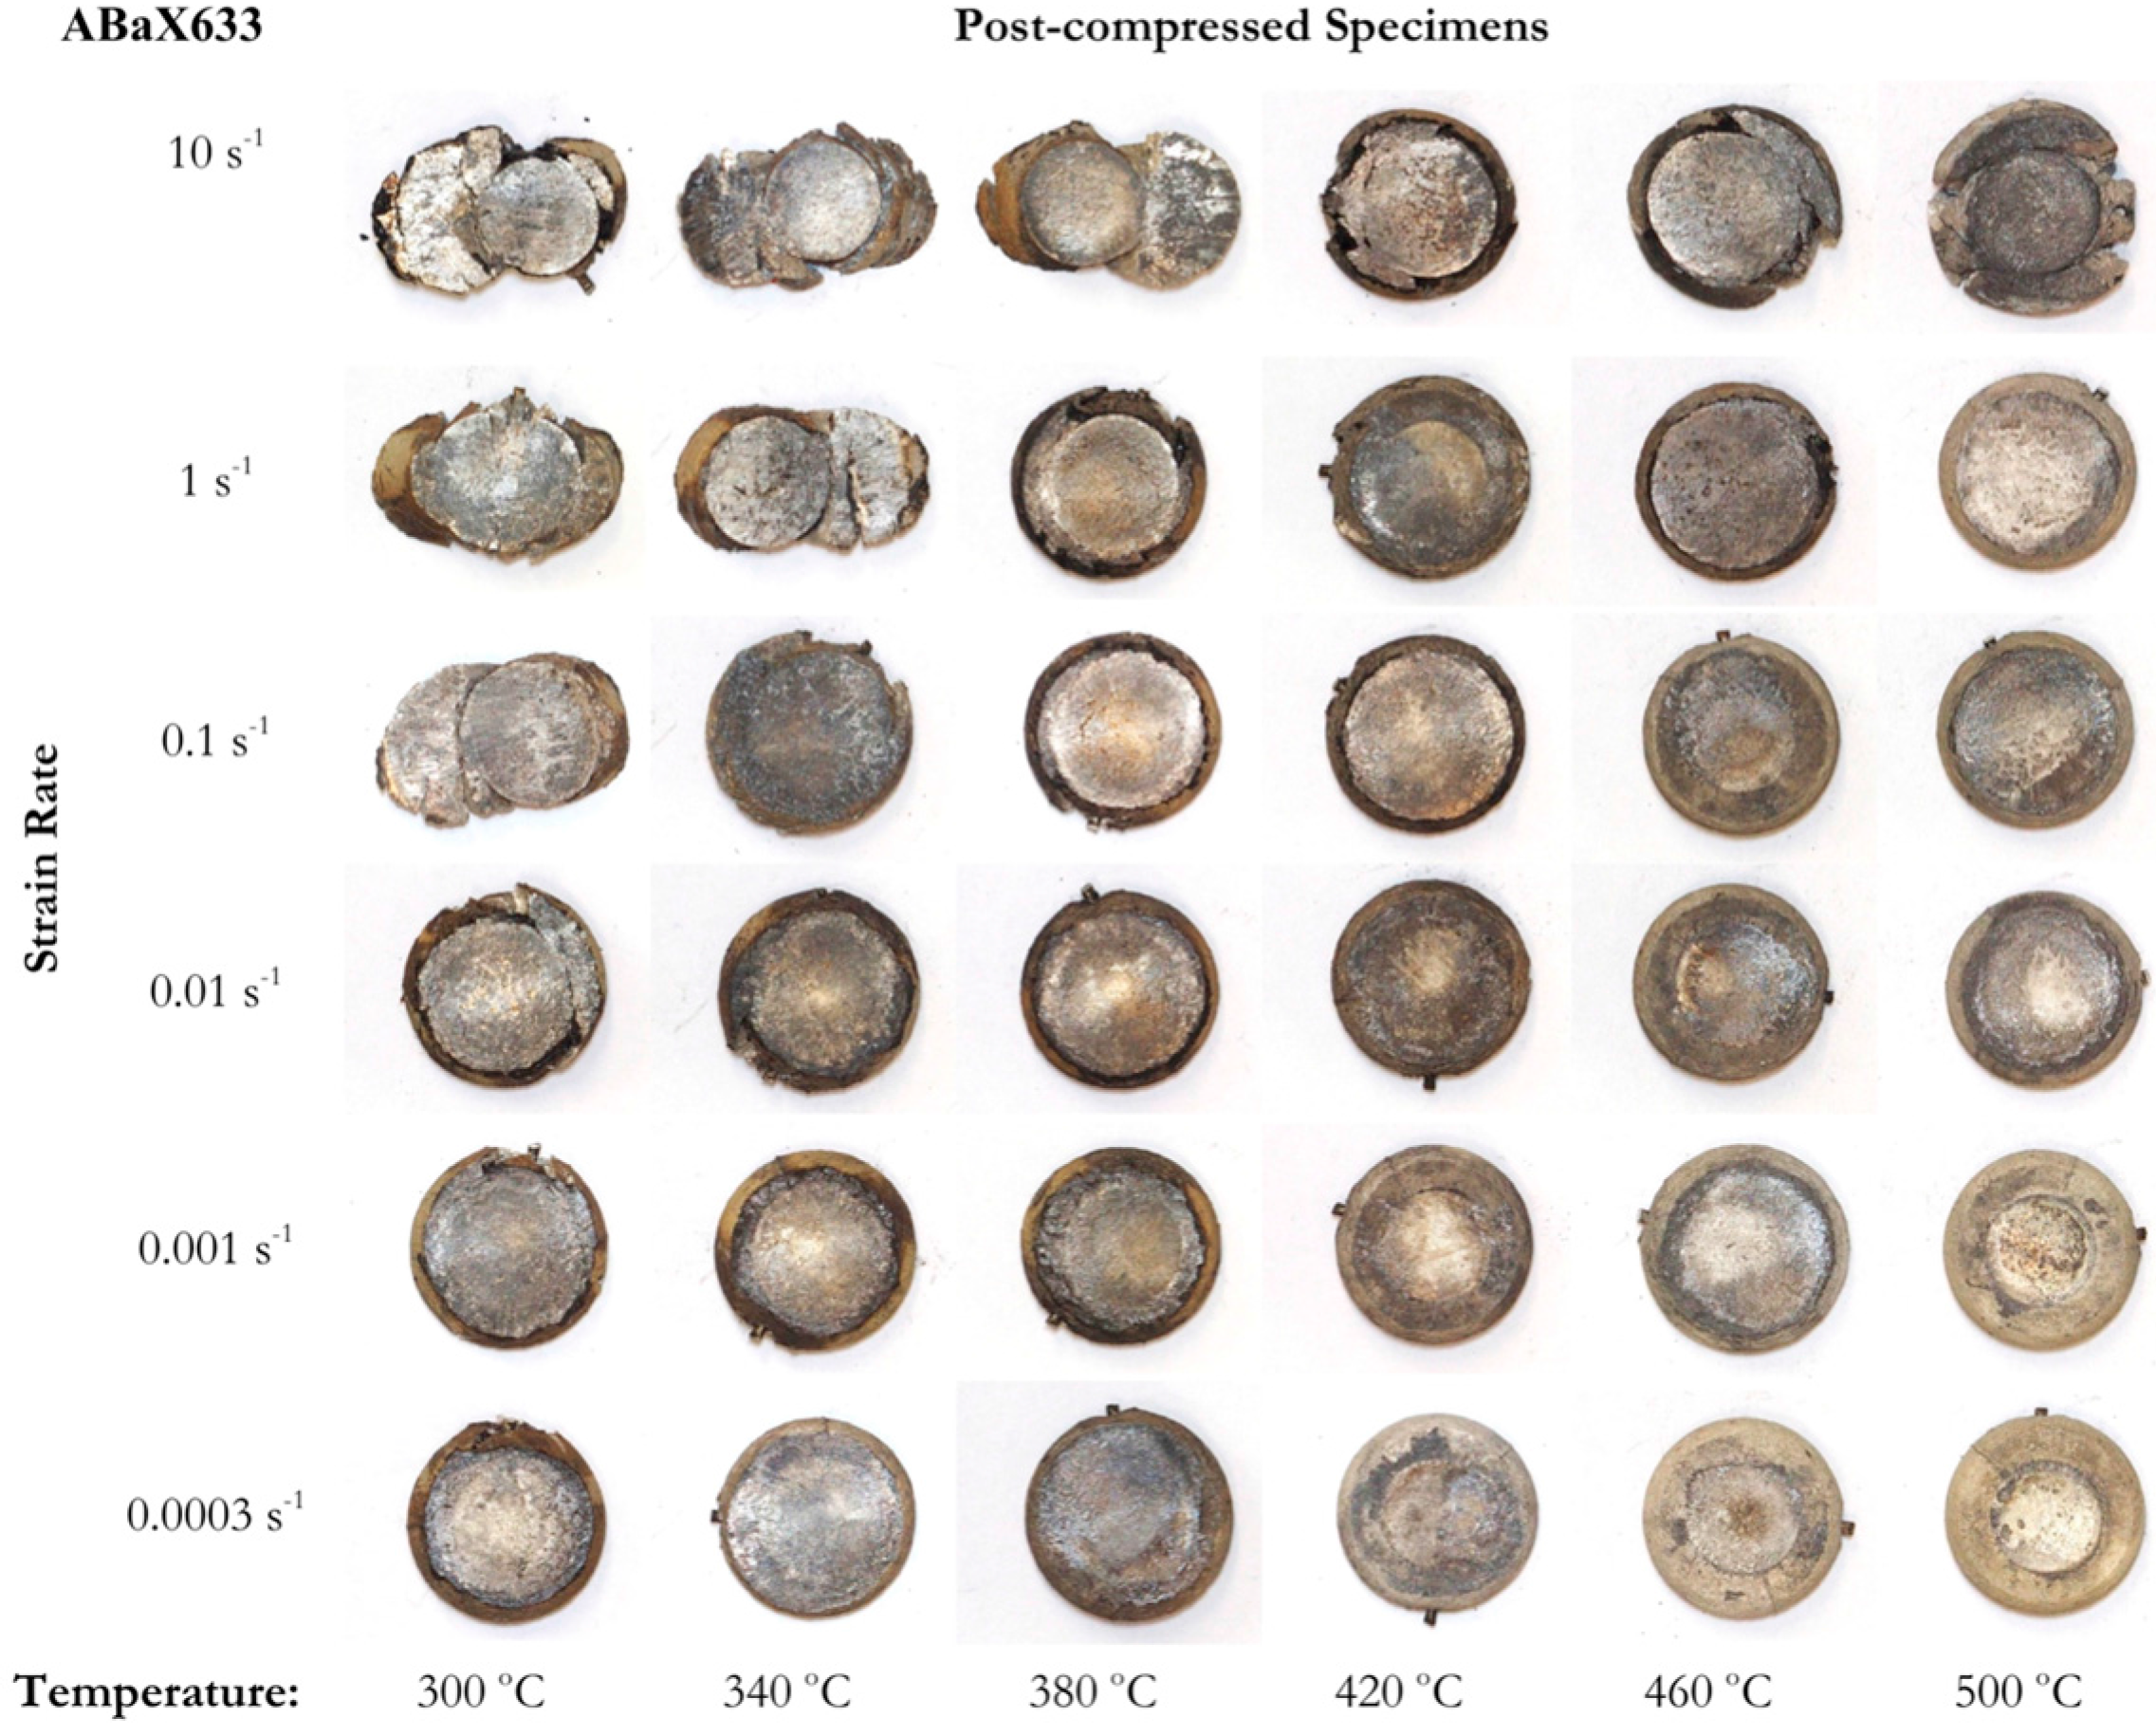
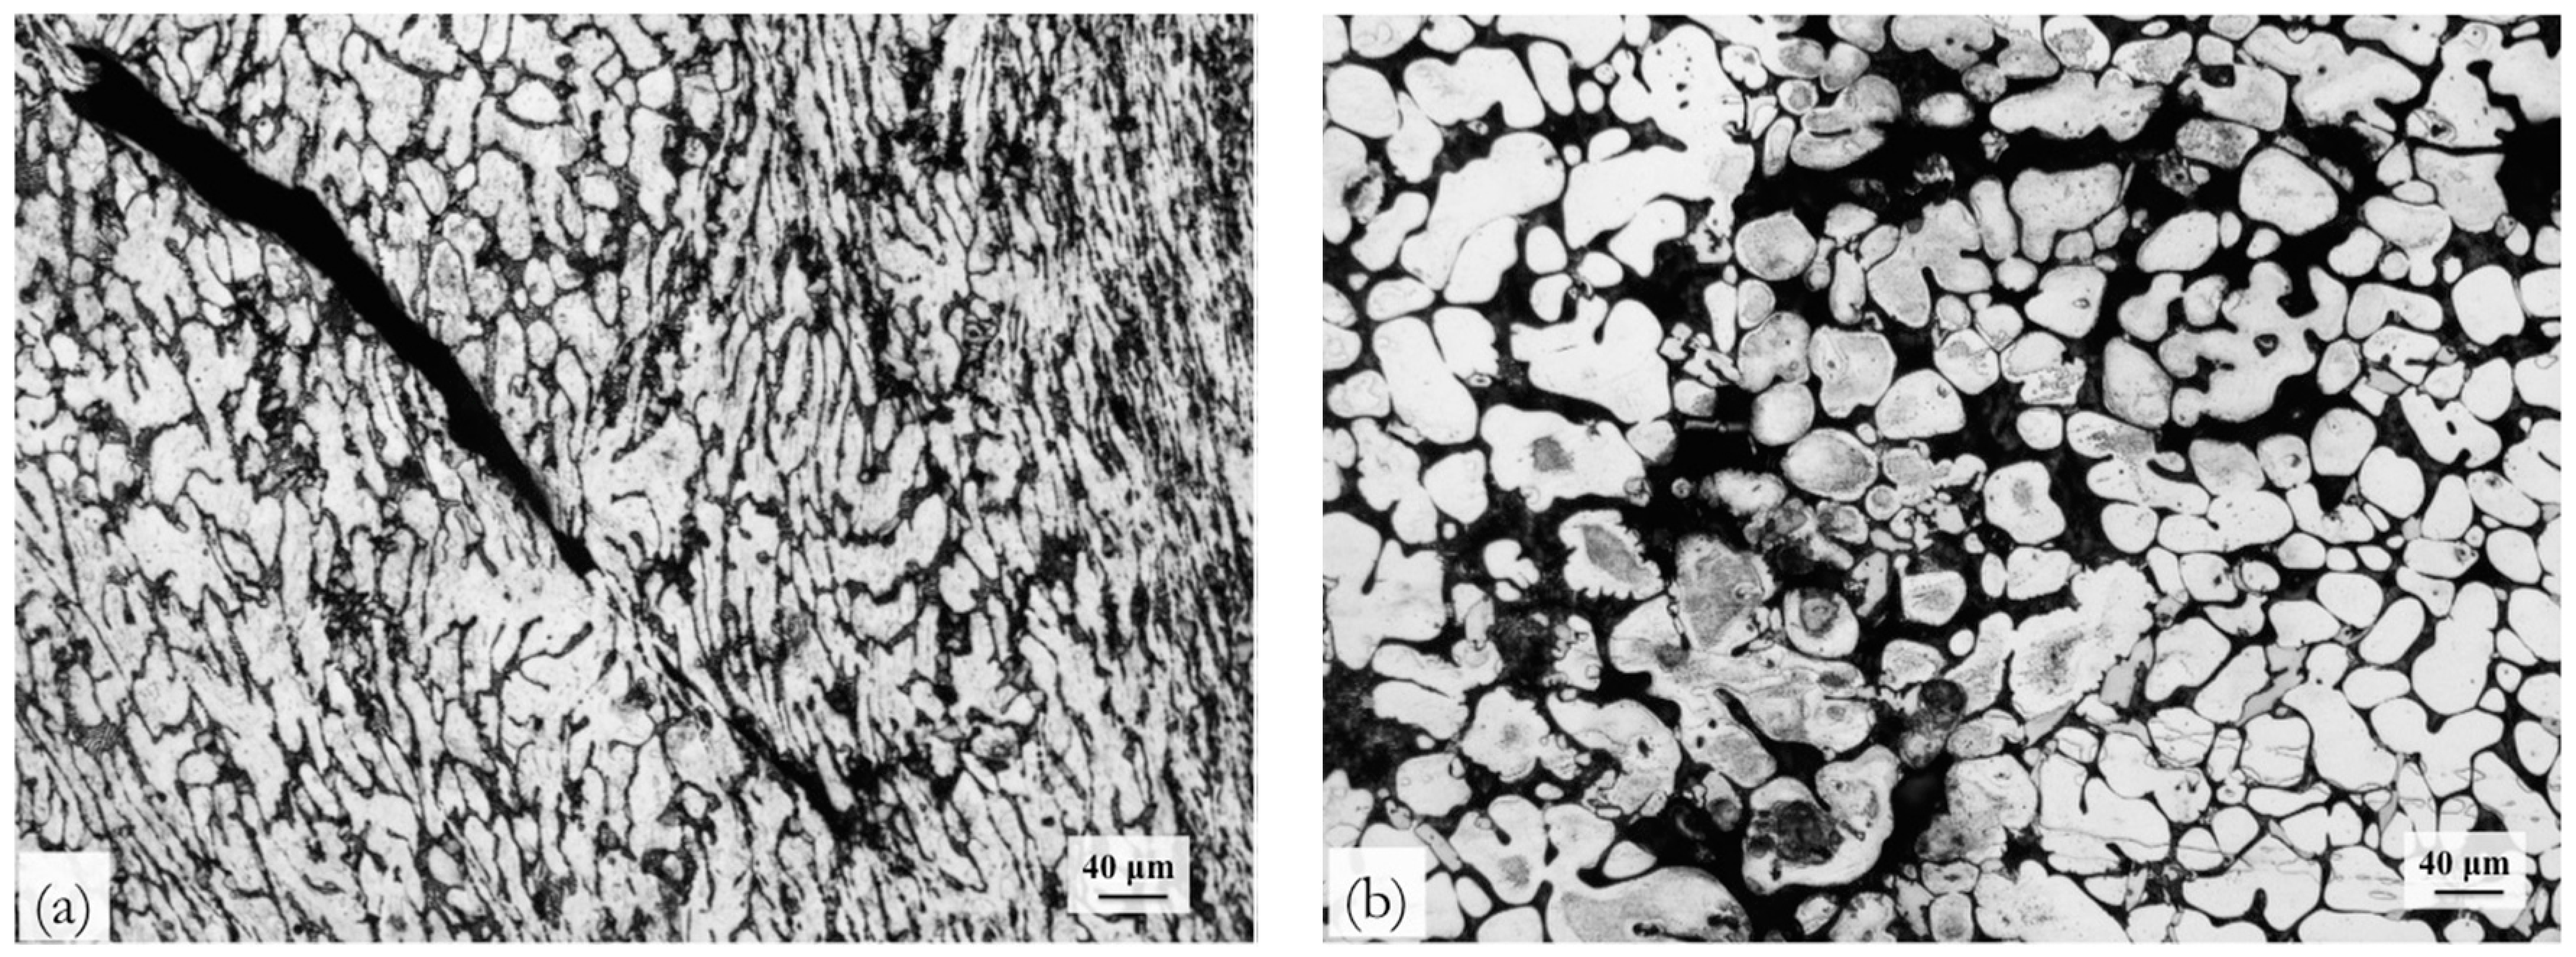
3.5. Instability Manifestation

The microstructures of ABaX633 specimens deformed in the lower and higher temperature instability regimes are shown in Figure 10a,b, respectively. At lower temperatures and higher strain rates (300 °C/10 s−1), the microstructure exhibited adiabatic shear band. Shear cracking has occurred along the band due to the high intensity of flow localization. It is in this regime, that the stress-strain curves (Figure 4a) showed oscillations caused by the formation of localized shear and welding/re-welding of the cracks along the band due to compression. The instabilities at lower strain rates and higher temperatures manifested in the form of flow localization of lower intensity. However, no cracking was observed within the localized instability bands.
In the second regime of instability that occurred at higher temperatures and strain rates, the manifestation is that of intercrystalline cracking. The microstructure of the specimen corresponding to the conditions 500 °C and 10 s−1 is shown in Figure 10b, which confirms intercrystalline cracking occurring in localized regions. Under these conditions, the material exhibits low workability, as can be seen from the specimen deformed at 500 °C/10 s−1 in Figure 5.

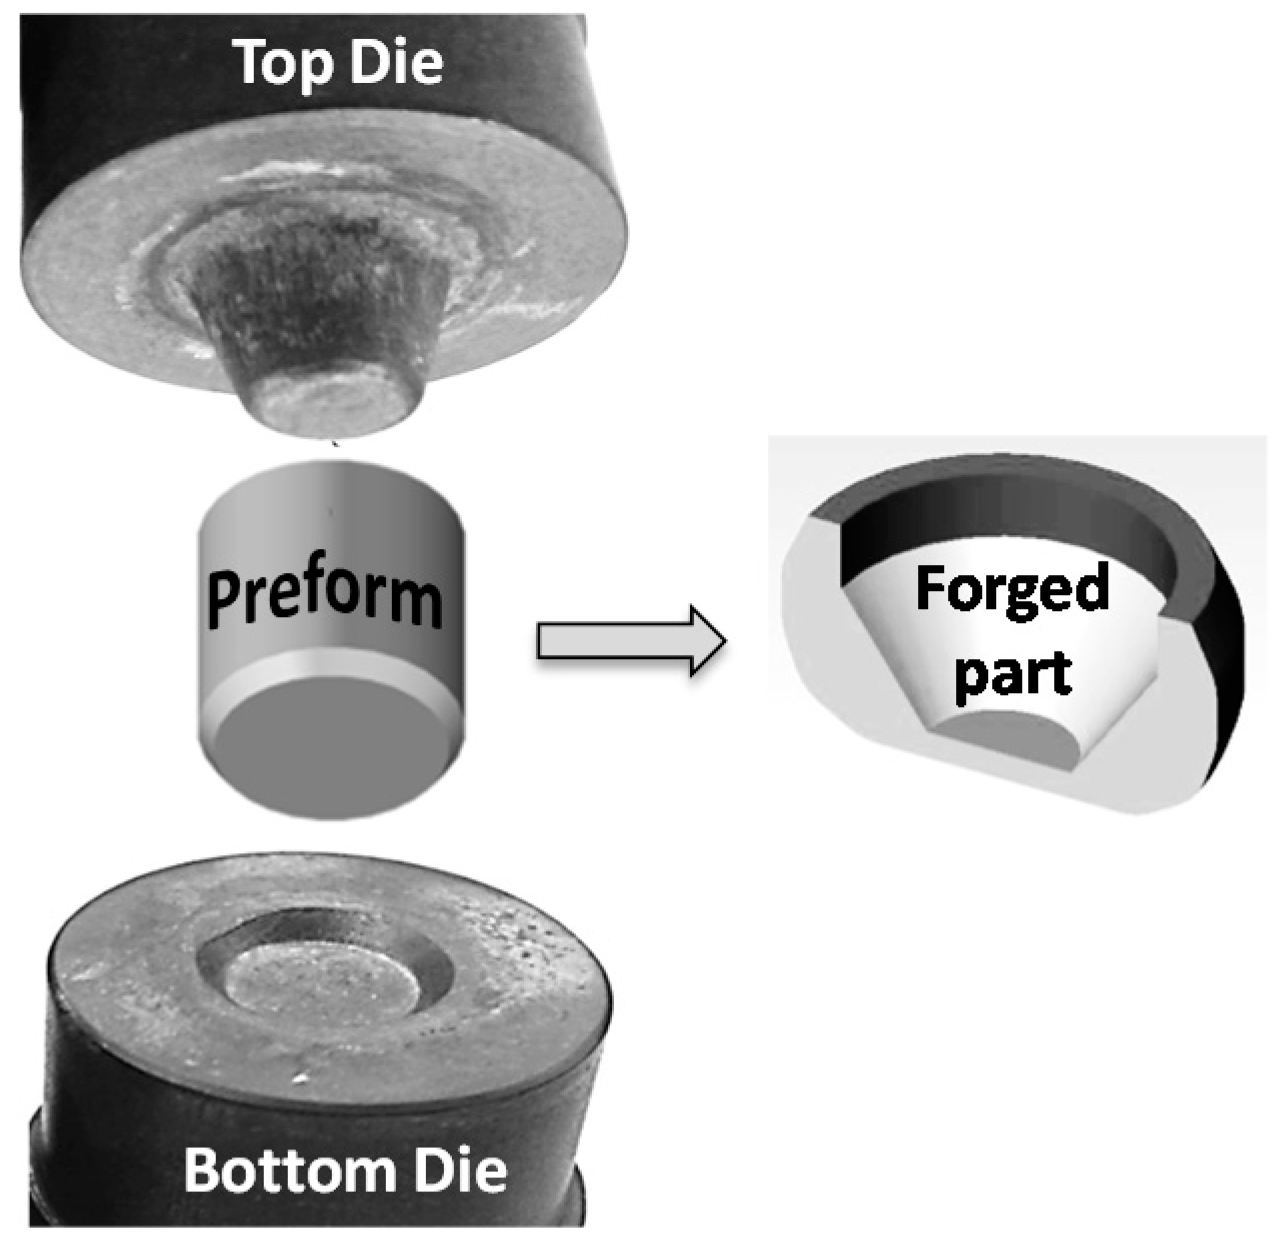
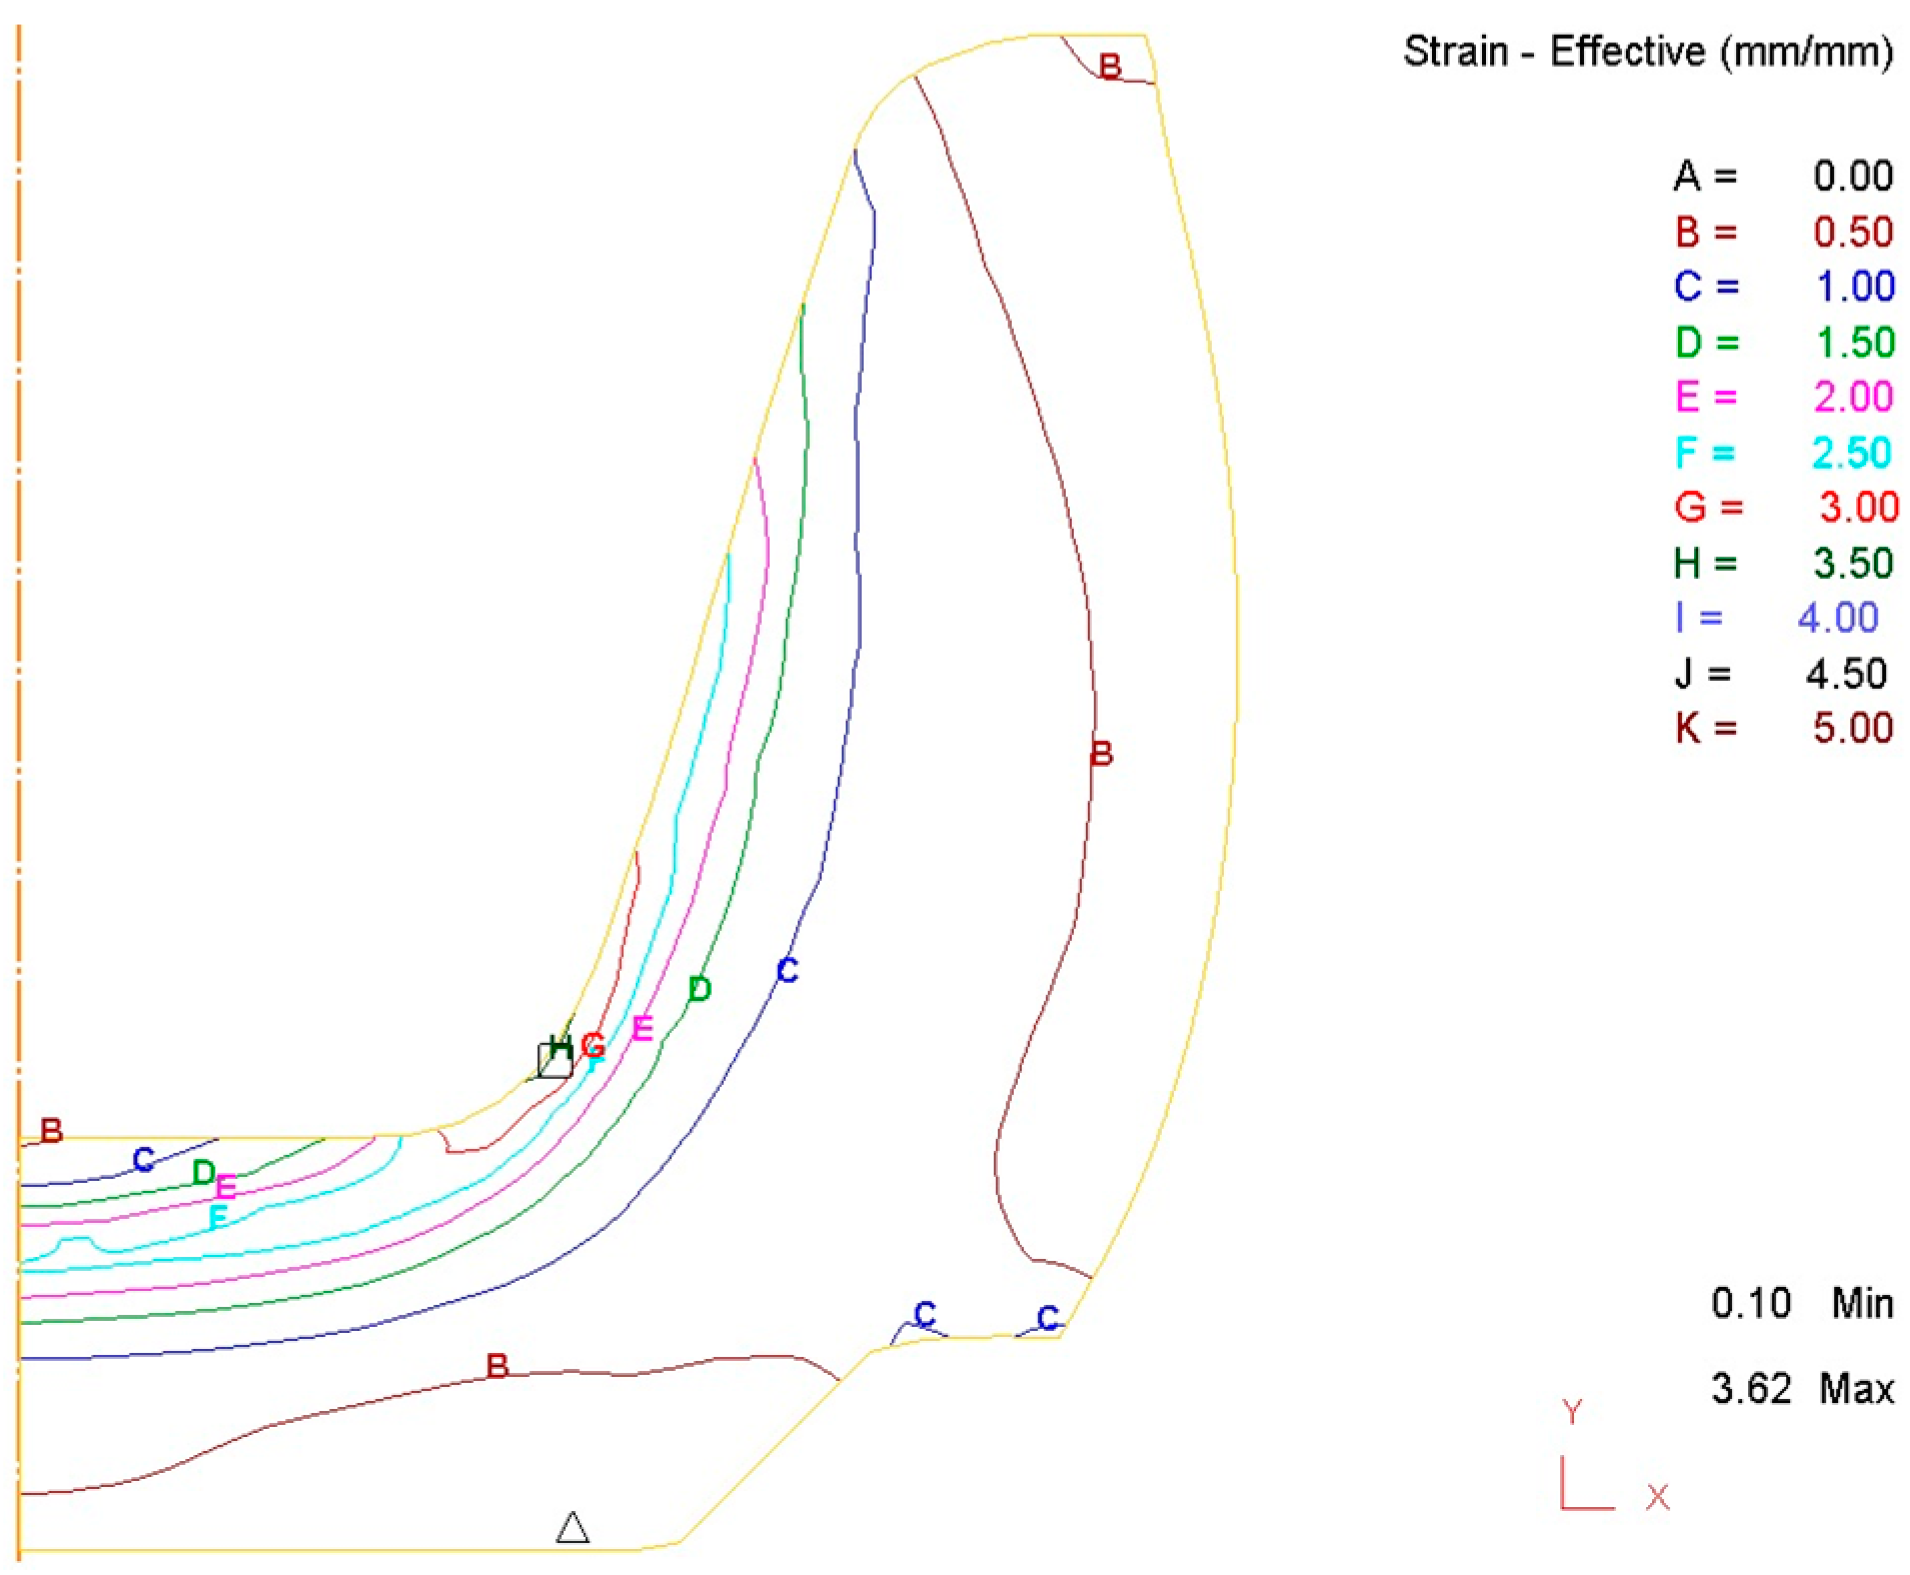
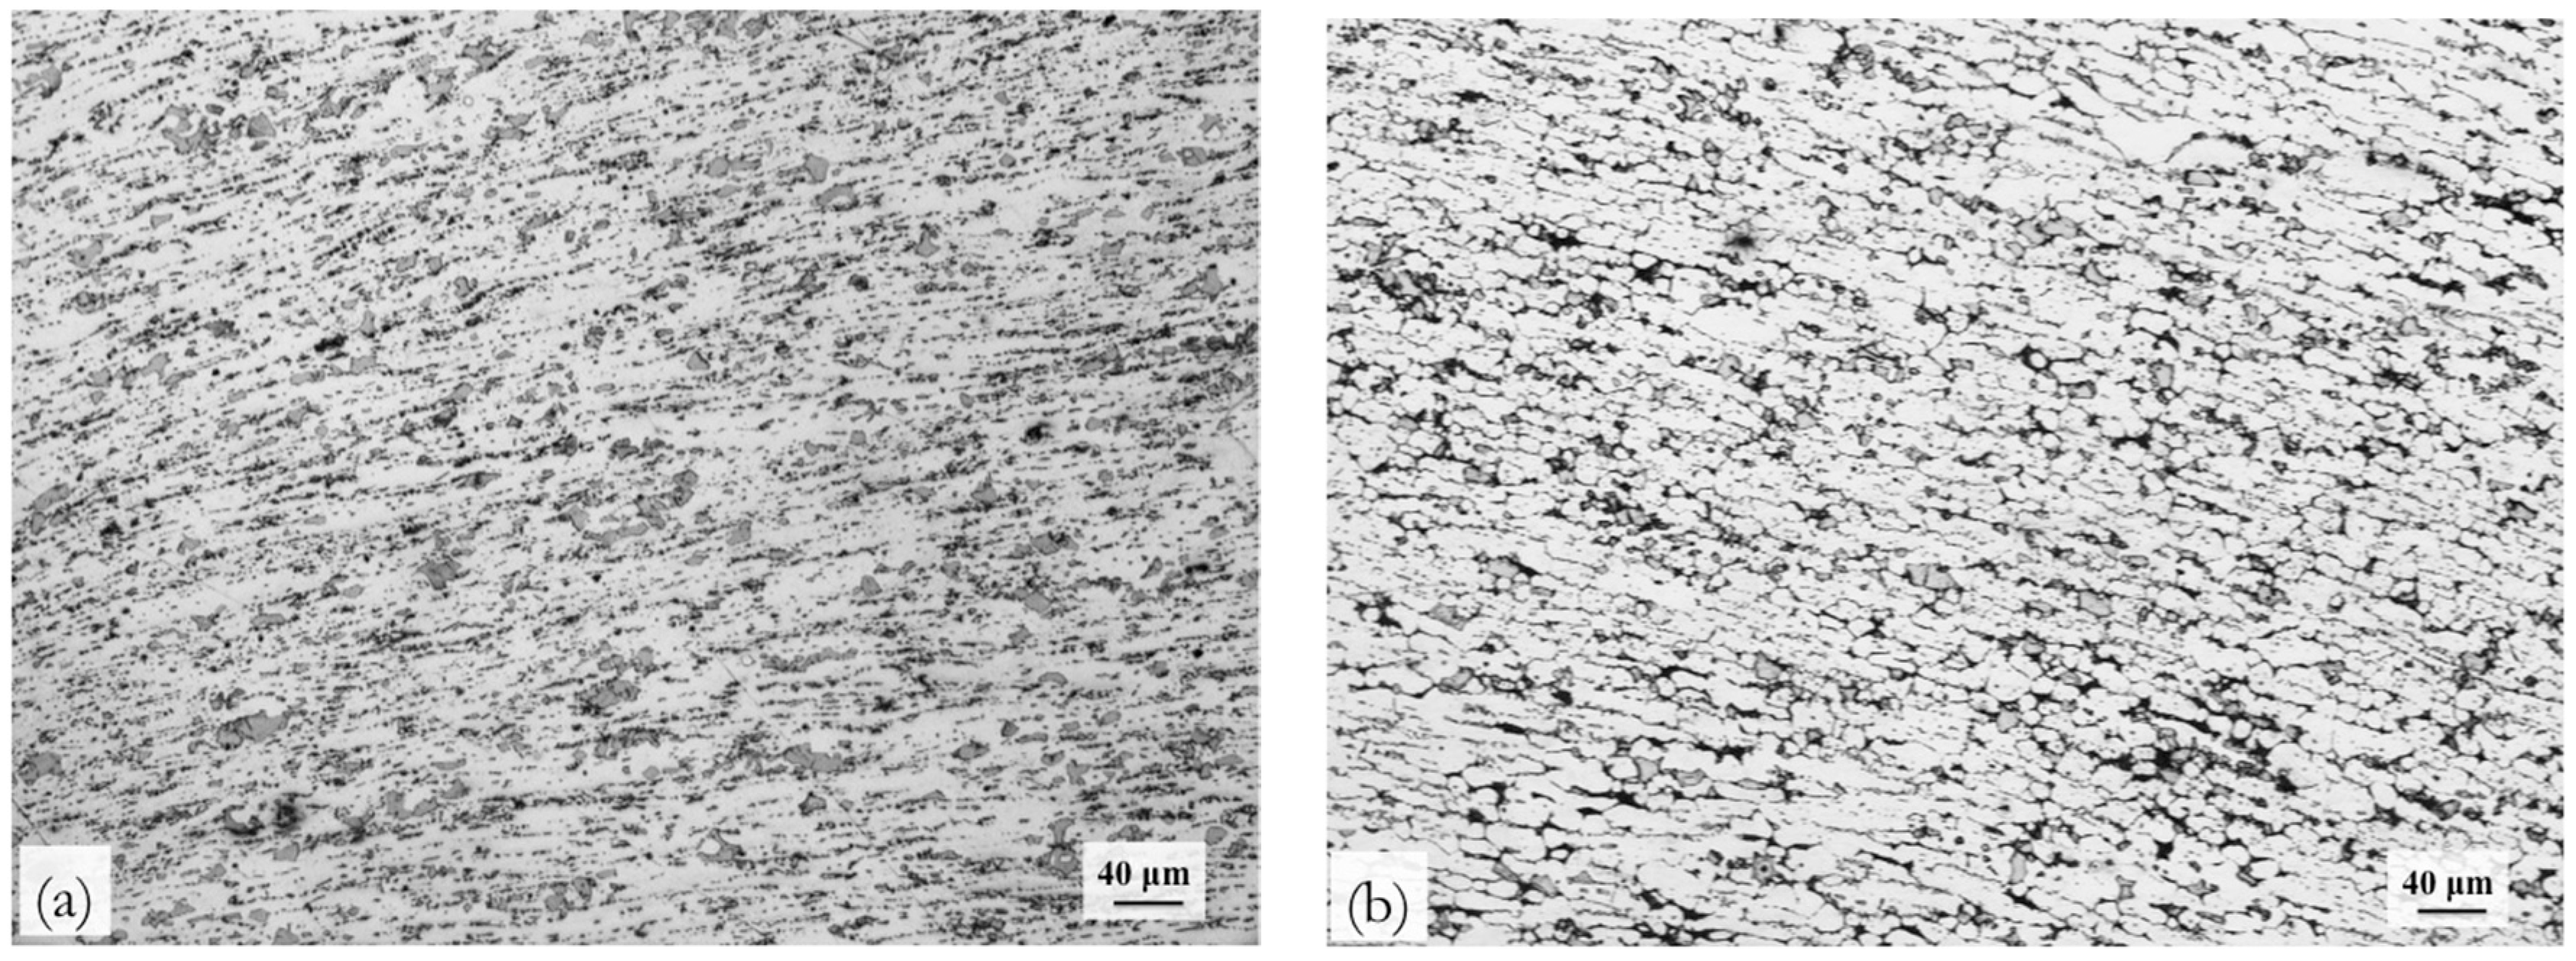
4. Validation of Processing Map with Forging

The results obtained from processing maps on the workability domains and the instability regimes are validated by forging a cylindrical preform into a rib-web (cup) shaped component, as shown in Figure 11. The chamfering on the bottom end of preform is to facilitate its accurate positioning on the bottom die. The forging was conducted using a MTS 810 servo-hydraulic machine (MTS, Minneapolis, MN, USA) using a pair of dies, as shown in the figure. An important feature of this semi-open die forging is that most of the material can flow outwards without any constraints. That is, the outer periphery of the deforming preform experiences tensile stresses during the entire forging process except for the small web portion that formed at the bottom of the component that experiences compressive stresses. Details of the overall experimental set up and procedure was given in an earlier publication [11]. The experiments were conducted at different temperatures in the range of 300 to 500 °C and at speeds of 0.01, 0.1, 1.0, and 10 mm/s−1. The specimen, the die assembly, and the loading members were heated to the test temperature by surrounding them with a split furnace.
It is necessary to estimate the strain rate variations within the forging envelope, as well as the effective strain rate in order to locate the exact processing coordinates in the processing map. For this purpose, process simulation was done using analytical modeling of the forging process. The finite element software DEFORM 2D (axisymmetric version used for isothermal conditions, Version 11.0.1, Scientific Forming Technologies Corporation, Columbus, OH, USA) equipped with a pre-processor to input material data and object definition was used for simulation [16,17]. A post-processor was used for depicting the deformed geometry, state-of-stress, velocity vectors, strain, and strain rate. Process simulations were conducted at the temperature range of 300 to 500 °C at speeds of 0.01 to 10 mm·s−1, until the stroke reached 11 in 0.1 mm increments. As an example, the effective strain distribution in the forged component at the end of the stroke is shown in Figure 12 for forging corresponding to 420 °C/0.01 mm·s−1 (Domain 1). From the simulations, the minimum and maximum effective strains range between 0.10 and 3.62, as indicated at the respective locations as ∆ and ☐, respectively. The average strain rates corresponding to the forging speeds of 0.01, 0.1, 1.0, and 10 mm·s−1 are approximately 0.001, 0.01, 0.1, and 1.0 s−1, respectively. The flow patterns are not very different for other forging conditions.
The microstructures recorded at various locations of the specimens forged at temperatures and speeds of 420 °C/0.01 mm·s−1 (Domain 1) and 500 °C/0.1 mm·s−1 (Domain 2) are shown in Figure 13a,b, respectively. These microstructures recorded in the bottom region of the cup, which has undergone maximum strain. However, the microstructure recorded in the outside rib region did not exhibit significant change when compared with the starting as-cast microstructure because the local strain is not large enough to cause DRX. The microstructures clearly showed the occurrence of DRX, and the grain size obtained in Domain 1 is finer than that in Domain 2.
The microstructures obtained in forged components conducted at conditions corresponding to the two flow instability regimes of the processing map (Figure 6), namely, 300 °C/10 mm·s−1 and 500 °C/10 mm·s−1, are shown in Figure 14a,b. The flow localization is clearly observed in the bottom, radius, and inside-wall regions. In the lower temperature instability region, intense flow localization has occurred (Figure 14a), while in the higher temperature instability region, flow localization and intercrystalline cracking is observed (Figure 14b), both in line with the predictions of the processing map. In the outside wall region, the microstructure did not exhibit much change due to low local strain values. Thus, the microstructural features of the forgings match with those that were obtained on compression specimens and completely validate the predictions of the processing map both in workability domains, as well as in the flow instability regions.

5. Conclusions

Hot deformation characteristics of ABaX633 magnesium alloy have been studied in the temperature range of 300 to 500 °C, and a strain rate range of 0.0003 to 10 s−1 by developing a processing map. The results from the map have been validated by forging of a cup-shaped component under controlled conditions. The following conclusions are drawn from this investigation:
The as-cast microstructure of ABaX633 is fine grained and consisted of intermetallic phases (Al, Mg)2Ca and Mg21Al3Ba2 at the grain boundaries.
The processing map exhibits two workability domains in the temperature and strain rate ranges of: (1) 380–475 °C and 0.0003–0.003 s−1 with a peak efficiency of 43% occurring at 430 °C/0.0003 s−1, and (2) 480–500 °C and 0.003–0.5 s−1 with a peak efficiency of 39% occurring at 500 °C and 0.01 s−1. Optimum conditions for hot working correspond to those where peak efficiency occurs in these domains.
In both of the domains, dynamic recrystallization occurs. In Domain 1, basal slip + prismatic slip causes plastic flow with climb as the recovery process. In Domain 2, the flow mechanism involves second order pyramidal slip and recovery by cross-slip.
The apparent activation energy values estimated in the above two domains (204 and 216 kJ/mol) are higher than that for lattice self-diffusion, which is attributed to the large back-stress that is caused by the intermetallic particles.
Flow instability is exhibited at lower temperatures and higher strain rates, as well as at higher temperatures and higher strain rates, which is manifested in the form of adiabatic shear band formation and intercrystalline cracking, respectively.
The predictions of the map on the workability domains as well as the instability regimes are fully validated by the forging of a rib-web (cup) shape.

Acknowledgments

This work was supported by a General Research Fund (Project #11259116) from the Research Grants Council of the Hong Kong Special Administrative Region, China.

Author Contributions

Kamineni Pitcheswara Rao and Chalasani Dharmendra have performed the experimental work, analysis of the data, and writing the paper; Yellapregada Venkata Rama Krishna Prasad has contributed on the aspects related to the processing map, microstructure, and writing the paper; Norbert Hort and Hajo Dieringa have developed the alloy and creep tests and analysis.

Conflicts of Interest

The authors declare no conflict of interest.

References

  1. Pekguleryuz, M.; Celikin, M. Creep resistance in magnesium alloys. Int. Mater. Rev. 2010, 55, 197–217. [Google Scholar] [CrossRef]
  2. Dieringa, H.; Huang, Y.; Wittke, P.; Klein, M.; Walther, F.; Dikovits, M.; Poletti, C. Compression-creep response of magnesium alloy DieMag422 containing barium compared with the commercial creep-resistant alloys AE42 and MRI230D. Mater. Sci. Eng. A 2013, 585, 430–438. [Google Scholar] [CrossRef]
  3. Dieringa, H.; Hort, N.; Kainer, K.U. Barium as alloying element for a creep resistant magnesium alloy. In Proceedings of the Magnesium: 8th International Conference on Magnesium Alloys and Their Applications, London, UK, 26–29 October 2009. [Google Scholar]
  4. Dieringa, H.; Zander, D.; Gibson, M.A. Creep behaviour under compressive stresses of calcium and barium containing Mg-Al-based die casting alloys. Mater. Sci. Forum 2013, 765, 69–73. [Google Scholar] [CrossRef]
  5. Rao, K.P.; Lam, S.W.; Hort, N.; Dieringa, H. High Temperature Deformation Behavior of a Newly Developed Mg Alloy Containing Al, Ba and Ca. In Proceedings of the 7th TSME International Conference on Mechanical Engineering, Chiang Mai, Thailand, 13–16 December 2016. [Google Scholar]
  6. Prasad, Y.V.R.K.; Rao, K.P. Processing maps and rate controlling mechanisms of hot deformation of electrolytic tough pitch copper in the temperature range 300–950°C. Mater. Sci. Eng. A 2005, 391, 141–150. [Google Scholar] [CrossRef]
  7. Rao, K.P.; Prasad, Y.V.R.K. Materials modeling and finite element simulation of isothermal forging of electrolytic copper. Mater. Des. 2011, 32, 1851–1858. [Google Scholar]
  8. Rao, K.P.; Ip, H.Y.; Suresh, K.; Prasad, Y.V.R.K.; Wu, C.M.L.; Hort, N.; Kainer, K.U. Compressive strength and hot deformation mechanisms in as-cast Mg-4Al-2Ba-2Ca (ABaX422) alloy. Philos. Mag. 2013, 93, 4364–4377. [Google Scholar] [CrossRef]
  9. Prasad, Y.V.R.K.; Rao, K.P.; Sasidhara, S. Hot Working Guide: A Compendium of Processing Maps; ASM International: Geauga, OH, USA, 2015. [Google Scholar]
  10. Prasad, Y.V.R.K.; Seshacharyulu, T. Modelling of hot deformation for microstructural control. Int. Mater. Rev. 1998, 43, 243–258. [Google Scholar] [CrossRef]
  11. Ziegler, H. Progress in Solid Mechanics; North-Holland Publishing Company: New York, NY, USA, 1963; Volume 4. [Google Scholar]
  12. Jonas, J.J.; Sellars, C.M.; Tegart, W.J.M. Strength and structure under hot working conditions. Metall. Rev. 1969, 14, 1–24. [Google Scholar]
  13. Sastry, D.H.; Prasad, Y.V.R.K.; Vasu, K.I. On the stacking fault energies of some close packed metals. Scr. Metall. 1969, 3, 927–930. [Google Scholar] [CrossRef]
  14. Frost, H.J.; Ashby, M.F. Deformation-Mechanism Maps; Oxford University Press: Oxford, UK, 1989. [Google Scholar]
  15. Morris, J.R.; Scharff, J.; Ho, K.M.; Turner, D.E.; Ye, Y.Y.; Yoo, M.H. Prediction of a {1122} hcp stacking fault using a modified generalized stacking-fault calculation. Philos. Mag. A 1997, 76, 1065–1077. [Google Scholar] [CrossRef]
  16. Kobayashi, S.; Oh, S.-I.; Altan, T. Metal Forming and the Finite-Element Method; Oxford University Press: Oxford, UK, 1989. [Google Scholar]
  17. Oh, S.-I. Finite element analysis of metal forming processes with arbitrarily shaped dies. Int. J. Mech. Sci. 1982, 24, 479–493. [Google Scholar]
Figure 1. Initial microstructure of the ABaX633 alloy in the as-cast condition: (a) Optical micrograph; (b) SEM image.
Metals 07 00513 g001
Figure 2. Creep rates at 200 °C under different compressive stresses for ABaX633 and ABaX422 alloys.
Metals 07 00513 g002
Figure 3. Ultimate compressive strength (UCS) and yield strength (YS) of ABaX633 and ABaX422 alloys.
Metals 07 00513 g003
Figure 4. True stress-true strain curves obtained for ABaX633 alloy compressed at various strain rates and at temperatures of (a) 300 °C, (b) 420 °C, and (c) 500 °C.
Metals 07 00513 g004
Figure 5. Top View of the ABaX633 alloy specimens compressed at different temperatures and strain rates.
Metals 07 00513 g005
Figure 6. Processing map for the ABaX633 alloy obtained at a true strain of 0.5. The numbers associated with the contours represent the power dissipation efficiency values in percent.
Metals 07 00513 g006
Figure 7. Optical microstructures of the ABaX633 alloy specimens deformed at (a) 420 °C/0.0003 s−1, and (b) 420°C/0.001 s−1 exhibiting DRX (Domain 1). The compression axis is vertical.
Metals 07 00513 g007
Figure 8. For ABaX633 specimens at a strain of 0.5: (a) Variation of the flow stress with strain rate; (b) Arrhenius plots showing the variation of normalized flow stress with inverse of absolute temperature.
Metals 07 00513 g008
Figure 9. Optical microstructures (the compression axis is vertical) of the ABaX633 alloy deformed at (a) 500 °C /0.01 s−1, and (b) 500 °C/0.1 s−1 (Domain 2).
Metals 07 00513 g009
Figure 10. Optical microstructures of the ABaX633 alloy deformed corresponding to instability regimes at (a) lower temperatures (300 °C/10 s−1), and (b) higher temperatures (500 °C/ 10 s−1) in the processing map. The compression axis is vertical.
Metals 07 00513 g010
Figure 11. Sketch showing the configuration of the dies used for forging the workpiece (preform) to produce a rib-web (cup) shape component.
Metals 07 00513 g011
Figure 12. Strain contours obtained in finite element simulation at the end of stroke (11 mm) obtained at temperature and speed of 420 °C/0.01 mm·s−1 (Domain 1).
Metals 07 00513 g012
Figure 13. Optical microstructures of the ABaX633 alloy forged at (a) 420 °C/0.01 mm·s−1 (correspond to Domain 1 in the processing map) and (b) 500 °C/0.1 mm·s−1 (Domain 2). Forging axis is vertical.
Metals 07 00513 g013
Figure 14. Optical microstructures of the ABaX633 alloy forged at conditions correspond to flow instability in the processing map: (a) 300 °C/10 mm·s−1 and (b) 500 °C/10 mm·s−1. Forging axis is vertical.
Metals 07 00513 g014
Table 1. The chemical composition of the ABaX633 alloy.
AlBaCaOther ElementsMg
6.392.372.740.021 Si, 0.012 Sr, 0.0013 Cu, 0.018 Fe, 0.0012 NiBalance
Table 2. Macro and micro-hardness (HV) values for ABaX422 and ABaX633 alloys.
HardnessABaX422ABaX633
Macro-hardness5165
Micro-hardness (Matrix) 5967
Micro-hardness ((Al, Mg)2Ca) 95112
Micro-hardness (Mg21Al3Ba2)166187

