Article

Mechanism of Dynamic Recrystallization and Evolution of Texture in the Hot Working Domains of the Processing Map for Mg-4Al-2Ba-2Ca Alloy

by
Kalidass Suresh
1,†,
Kamineni Pitcheswara Rao
1,*,
Yellapregada Venkata Rama Krishna Prasad
2,
Chi-Man Lawrence Wu
3,
Norbert Hort
4 and
Hajo Dieringa
4
1
Department of Mechanical and Biomedical Engineering, City University of Hong Kong, Tat Chee Avenue, Kowloon, Hong Kong
2
Independent Researcher, Bengaluru 560024, India
3
Department of Materials Science and Engineering, City University of Hong Kong, Tat Chee Avenue, Kowloon, Hong Kong
4
Magnesium Innovation Centre, Helmholtz Zentrum Geesthacht, Max-Planck-Strasse 1, Geesthacht 21502, Germany
*
Author to whom correspondence should be addressed.
Present Address: Department of Physics, Bharathiar University, Tamilnadu 641046, India
Metals 2017, 7(12), 539; https://doi.org/10.3390/met7120539
Submission received: 21 October 2017 / Revised: 14 November 2017 / Accepted: 22 November 2017 / Published: 2 December 2017
(This article belongs to the Special Issue Dynamic Recrystallization Behavior of Metallic Materials)

Abstract

:
The occurrence of dynamic recrystallization (DRX) and its effect on the evolution of texture during uniaxial compression of a creep-resistant cast Mg-4Al-2Ba-2Ca alloy in the temperature range of 260–500 °C and strain rate range of 0.0003–10 s−1 has been studied using transmission electron microscopy and electron backscatter diffraction techniques with a view to understand its mechanism. For this purpose, a processing map has been developed for this alloy, which revealed two domains of DRX in the temperature and strain rate ranges of: (1) 300–390 °C/0.0003–0.001 s−1 and (2) 400–500 °C/0.0003–0.5 s−1. In Domain 1, DRX occurs by basal slip and recovery by dislocation climb, as indicated by the presence of planar slip bands and high dislocation density leading to tilt boundary formation and a low-intensity basal texture. On the other hand, DRX in Domain 2 occurs by second order pyramidal slip and recovery by cross-slip since the microstructure revealed tangled dislocation structure with twist boundaries and randomized texture. The high volume content of intermetallic phases Mg21Al3Ba2 and (Al,Mg)2Ca eutectic phase is considered to be responsible for the observed hot deformation behavior.

1. Introduction

Magnesium alloys are of interest to automobile and aerospace industries due to their light weight. Initially, magnesium alloys have been developed for die-cast components, the most popular one being AZ91 [1,2]. Since creep resistance has been a limiting factor in their application [3], addition of rare earth elements has been attempted to develop alloys like AE42 [4] and WGZ1152 [5]. More recently, Ca addition has been found to be effective in improving the creep strength, as demonstrated in Mg-Sn-Ca alloys, the preferred one being Mg-3Sn-2Ca (TX32) [6]. In this alloy, Ca forms stable intermetallic particles, like CaMgSn [7], which cause considerable back stress for dislocation movement to enhance creep resistance [6]. With a view to better the creep resistance further, Ba addition to Mg-Al alloy has been attempted along with Ca to develop quaternary alloys, like Mg-4Al-2Ba-1Ca (ABaX421) and Mg-4Al-2Ba-2Ca (ABaX422) [8,9]. The improvement in creep resistance has been attributed to the formation of a large volume fraction of Ba containing binary and ternary intermetallic compounds, like Mg17Ba2 [10,11] and Mg21Al3Ba2 [9], in the matrix increasing the threshold stress and the eutectic phase Al2Ca [9] at the grain boundaries reducing sliding. The hot workability of the ABaX422 alloy has been investigated by developing a processing map [12] which indicates that the alloy is workable at temperatures in the range of 400–500 °C over a wide range of strain rates. Since this alloy has to be processed at temperatures higher than those used for non-Ba containing alloys, like TX32 [13], non-basal slip systems will dominate the deformation, which may cause different changes to the microstructures and textures in the hot-worked product. The aim of the present investigation is to evaluate the mechanism of dynamic recrystallization and the associated changes in the texture occurring during hot compression of the as-cast ABaX422 alloy with reference to the features exhibited by the processing map [12] and also bring out the effect of Ca + Ba addition by comparing the behavior with Ca-containing alloys, like TX32 [13]. The texture in the deformed specimens has been evaluated by electron backscatter diffraction (EBSD) analysis by obtaining pole figures, inverse pole figures, and Schmid factors and the microstructure is examined using optical microscopy, as well as transmission electron microscopy (TEM).

2. Materials and Methods

ABaX422 alloy was prepared from high-purity Mg (>99.9%), Al (99.9%), Ba (99.0%), Ca (99.5%) by melting pure metals under a protective gas cover of Ar + 3% SF6 and pouring in preheated permanent molds to obtain billets of about 100 mm diameter and 350 mm length. The composition (wt %) of the alloy was Al: 4.05, Ba: 1.82, and Ca: 1.79, and the impurity contents in ppm were Fe: 31, Cu: 4, and Ni: 1. Compression tests were conducted on cylindrical specimens of 10 mm diameter and 15 mm height fabricated from slices of the cast billet and in the temperature range of 260–500 °C in steps of 40 °C and strain rate range 0.0003–10 s−1 (6 strain rates). A computer controlled servo-hydraulic machine (M1000/RK; DARTEC, Bournemouth, UK) was used for this purpose. On the basis of flow stress data obtained at different temperatures and strain rates, a processing map was developed. Details of the experimental setup, test procedure, principles, and development of processing maps were described in earlier publications [13,14]. All specimens were compressed up to a true strain of about 1 and quenched in water. Barreling is insignificant up to about 50% deformation or a true strain of 0.7, and steady-state type of deformation is reached well before this strain level. A strain value of 0.6 was used for developing the processing map and so the effect of barreling is neglected. For metallographic examination, the deformed specimens were sectioned parallel to the compression axis and the cut surface was polished and etched with an aqueous solution containing 3 g picric acid, 20 mL acetic acid, 50 mL ethanol, and 20 mL distilled water. The initial microstructure was examined using scanning electron microscopy (SEM) (JEOL 5600; Tokyo, Japan) with energy dispersive X-ray spectroscopy (EDS; Oxford Instruments, Abingdon, UK) to produce the elemental mapping. The microstructure observation on all the deformed specimens was conducted using an optical metallurgical microscope (OMM—OLYMPUS/PMG3, Olympus Corporation, Tokyo, Japan). Selected samples were prepared for EBSD by grinding, followed by polishing using oil-based diamond paste with 9, 3, and 1 µm particle suspensions, sequentially, and finally using vibratory polishing with a colloidal alumina suspension. The texture of the selected area on the compression plane of the deformed samples was measured using EBSD on a SEM in beam control mode equipped with a NordlysF EBSD detector (Oxford Instruments, Abingdon, UK). HKL Channel 5 software (Oxford Instruments HKL, Hobro, Denmark) was used for data acquisition and analysis. Depending on the grain size, representative regions were scanned using step sizes of 2 µm or 1.5 µm (grid of 175 × 150 or 250 × 200 points) in order to obtain micro-textures and the orientation data was collected from the compression plane. EBSD post-processing software named “Mambo” (Oxford Instruments HKL, Hobro, Denmark) was used to collect the crystallographic orientation (or texture) data in the form of pole figures or inverse pole figures. Schmid factors for possible individual slip systems were calculated for the direction of the compressed stress. Deformed specimens of selected conditions were examined using a Philips CM 20 model transmission electron microscope (TEM; Philips Corporation, Amsterdam, Netherlands) operating at 200 KV. Specimens for TEM were mechanically polished to a thickness of 80–100 μm and thinned further using a twin jet electro-polishing using 585 mL methanol, 355 mL n-butyl alcohol and 60 mL perchloric acid electrolyte solution. Due to the corrosive nature of magnesium, fabricated foils were analyzed immediately after the polishing for the best results. To control the temperature, the polishing solution was surrounded by an insulated alcohol bath cooled by liquid nitrogen. Typically the voltage was adjusted to obtain the current of 12–20 mA across the specimen. Depending on the specimen, the corresponding applied voltage varied in the range of 10–50 V.

3. Results and Discussion

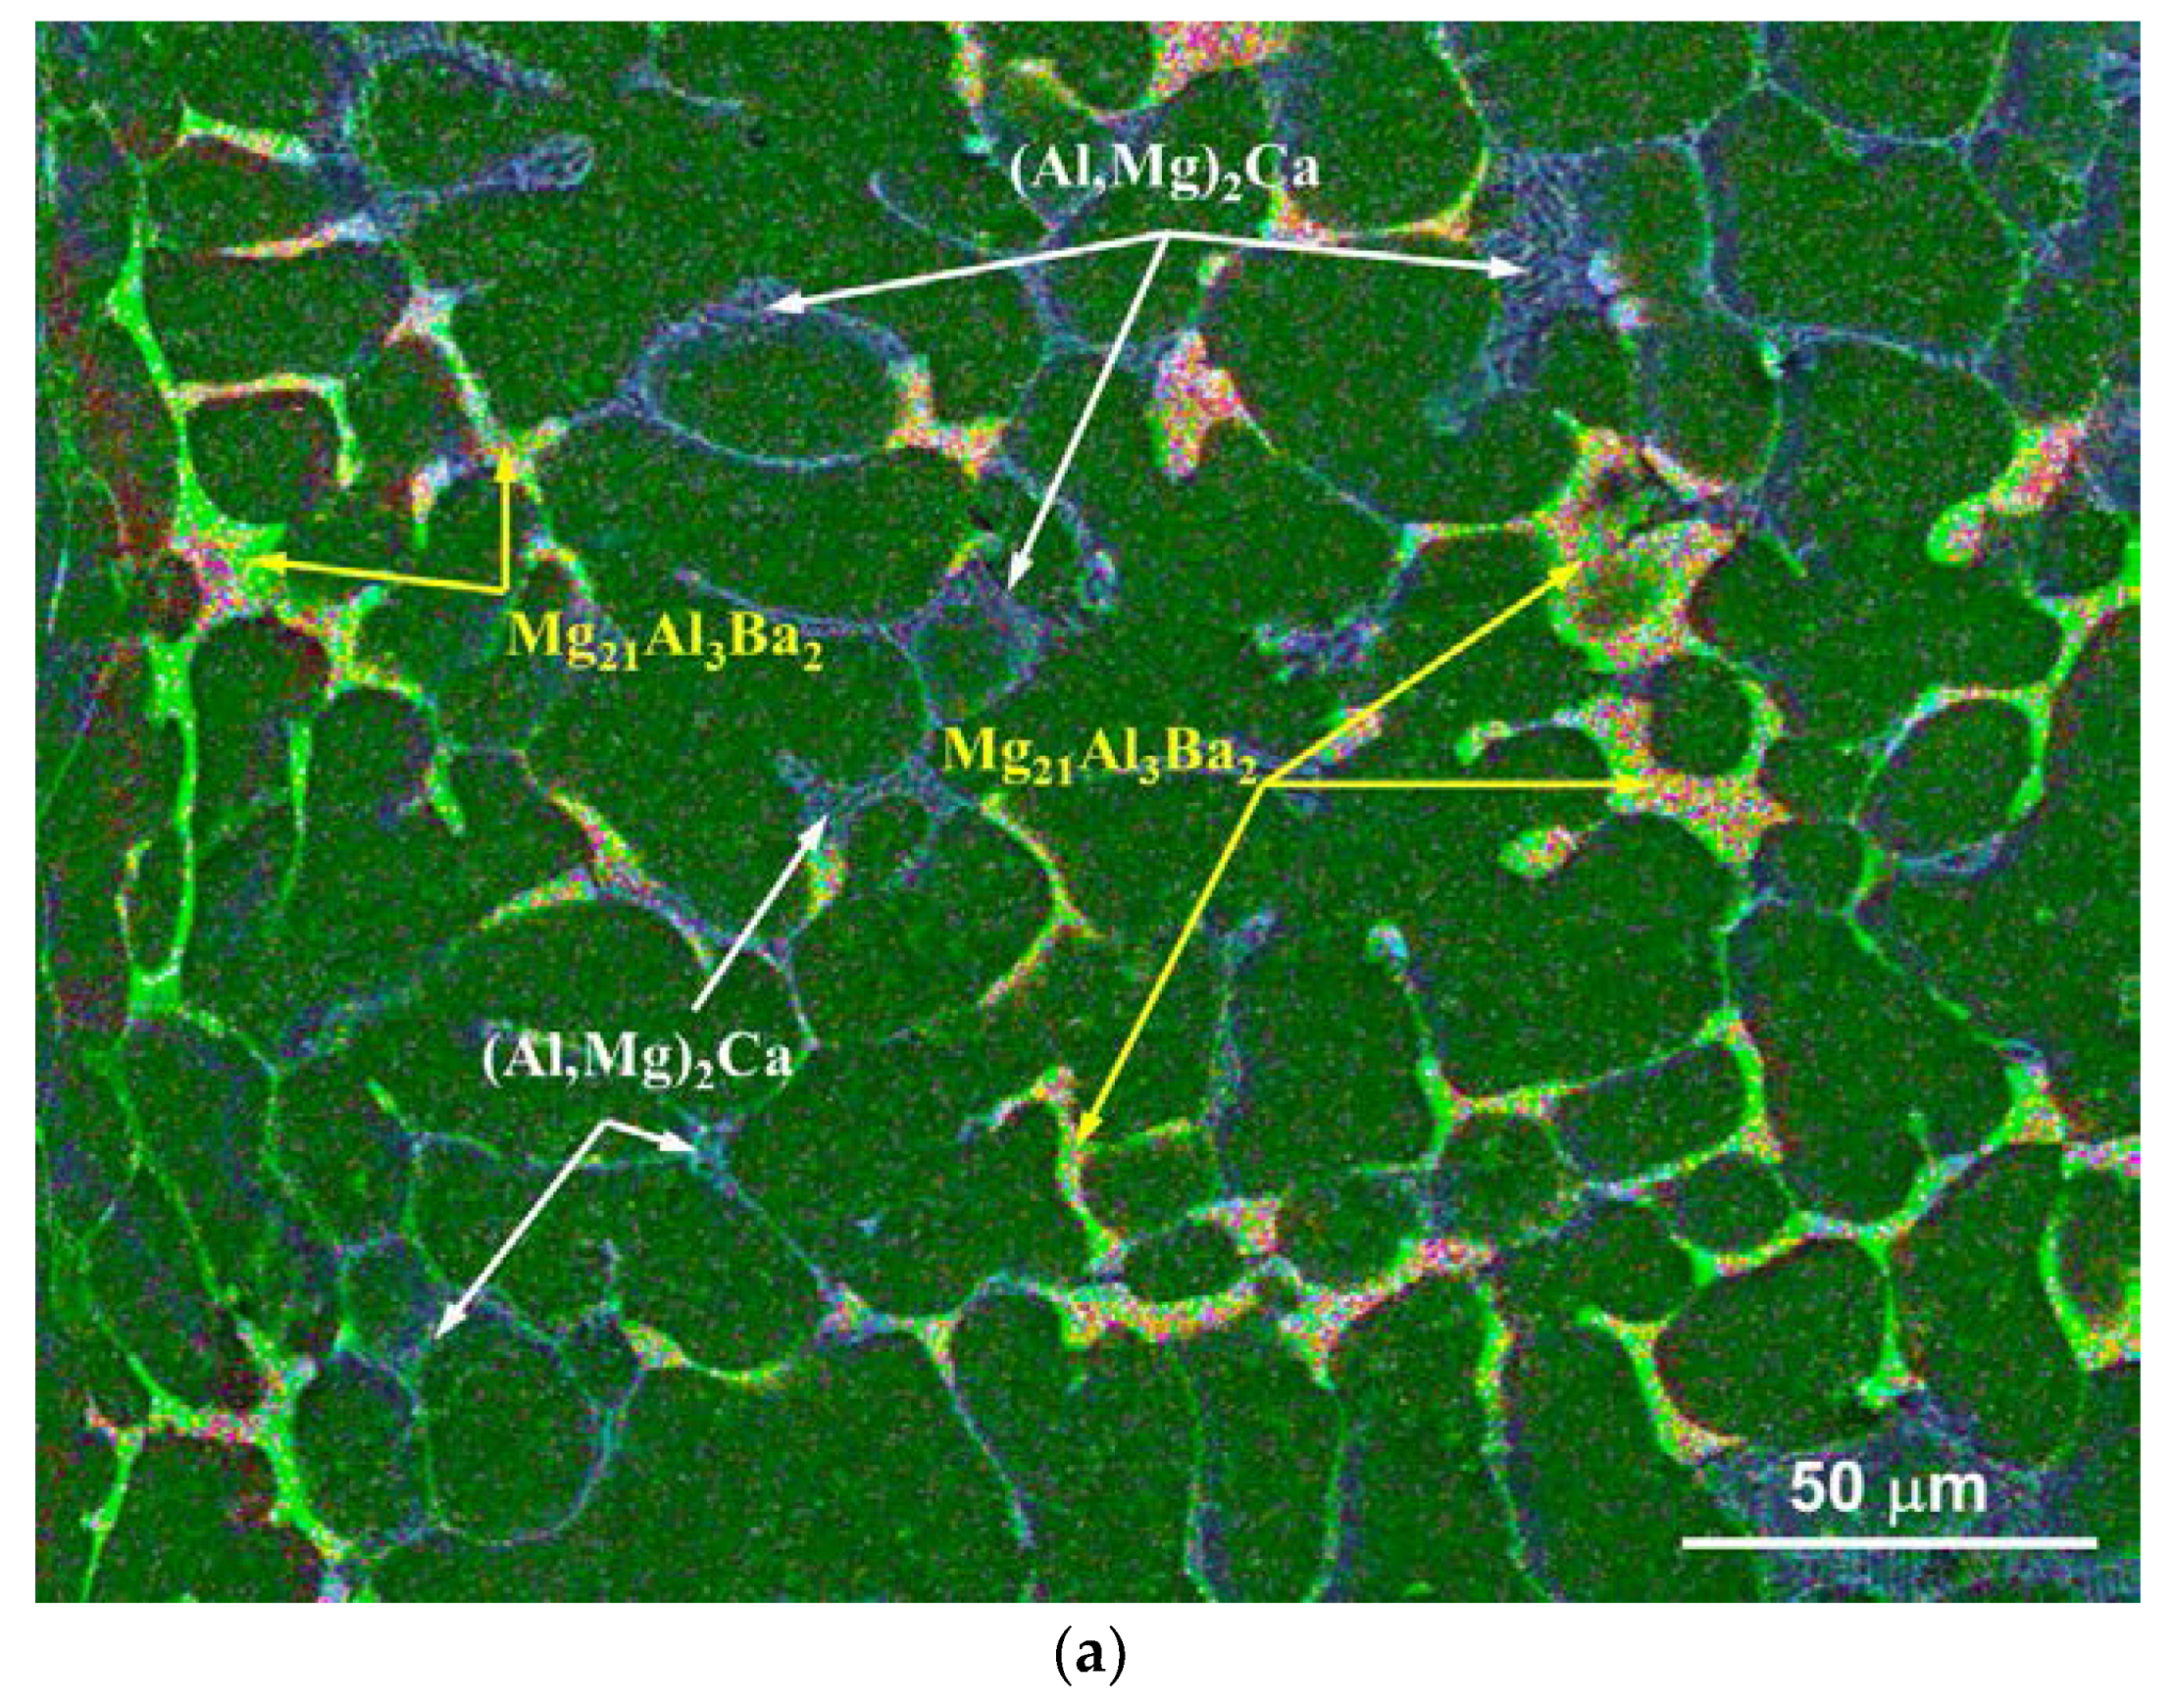
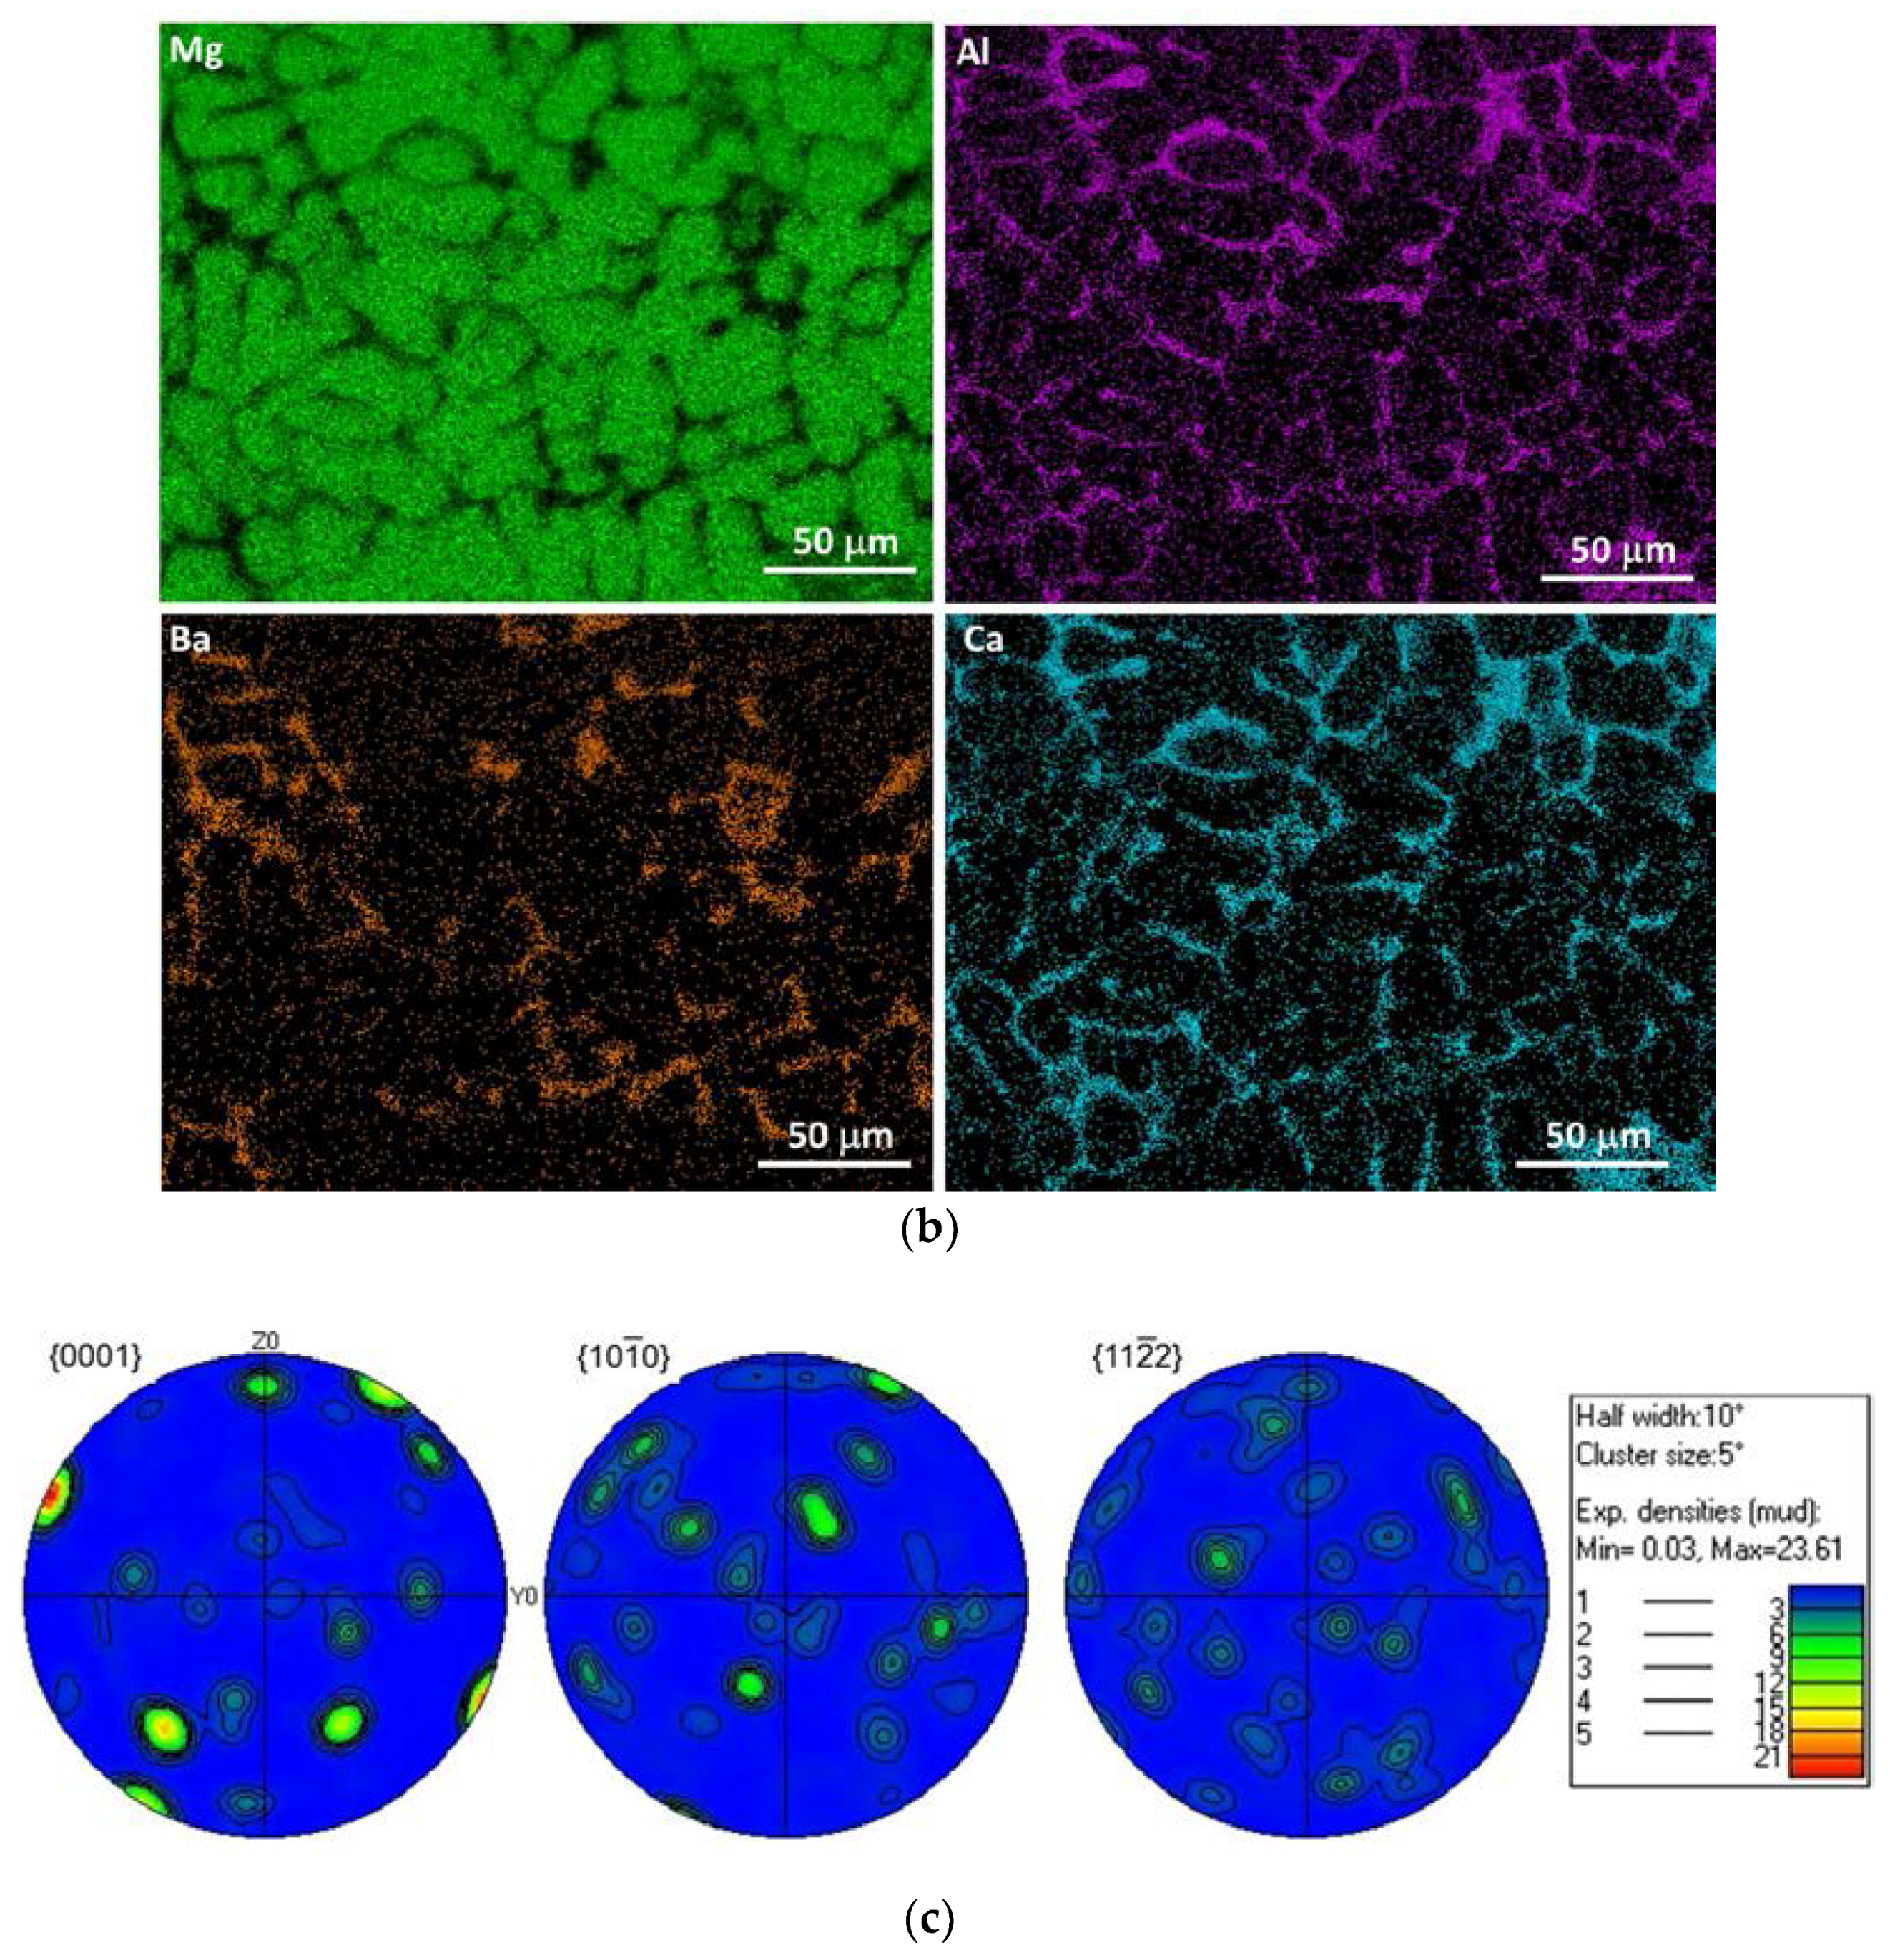
3.1. Initial State of the ABaX422 (Mg-4Al-2Ba-2Ca) Alloy

The microstructure of the starting ABaX422 alloy in its as-cast condition is shown in Figure 1a, which is a SEM-EDS map micrograph. Different colors (green, magenta, orange, and blue) were assigned to the four individual elements (as shown in Figure 1b for Mg, Al, Ba, and Ca) and combined to form a colored EDS map with a view to identify the different phases. The average grain diameter is about 25 μm, which may be considered fine grained compared with several other as-cast magnesium alloys (>200 µm) [15]. This may be attributed to a large volume fraction of intermetallic particles present in the microstructure. Two types of phases are present: (i) a eutectic phase appearing as lamellae of primary phase (Mg-Al solid solution) and Al2Ca phase (may be termed as (Al,Mg)2Ca); and (ii) a ternary phase consisting of Mg-Al-Ba. EDS revealed that the ternary phase consists of about 80–82 at % Mg, 10–12 at % Al, 6–8 at % Ba, and 1–2 at % Ca. Using XRD analysis, Dieringa et al. [9] have recently identified the ternary phase to be Mg21Al3Ba2. Figure 1b shows the pole figures for the cast the ABaX422 alloy, which exhibited near-random crystallographic texture as expected from as-cast material.

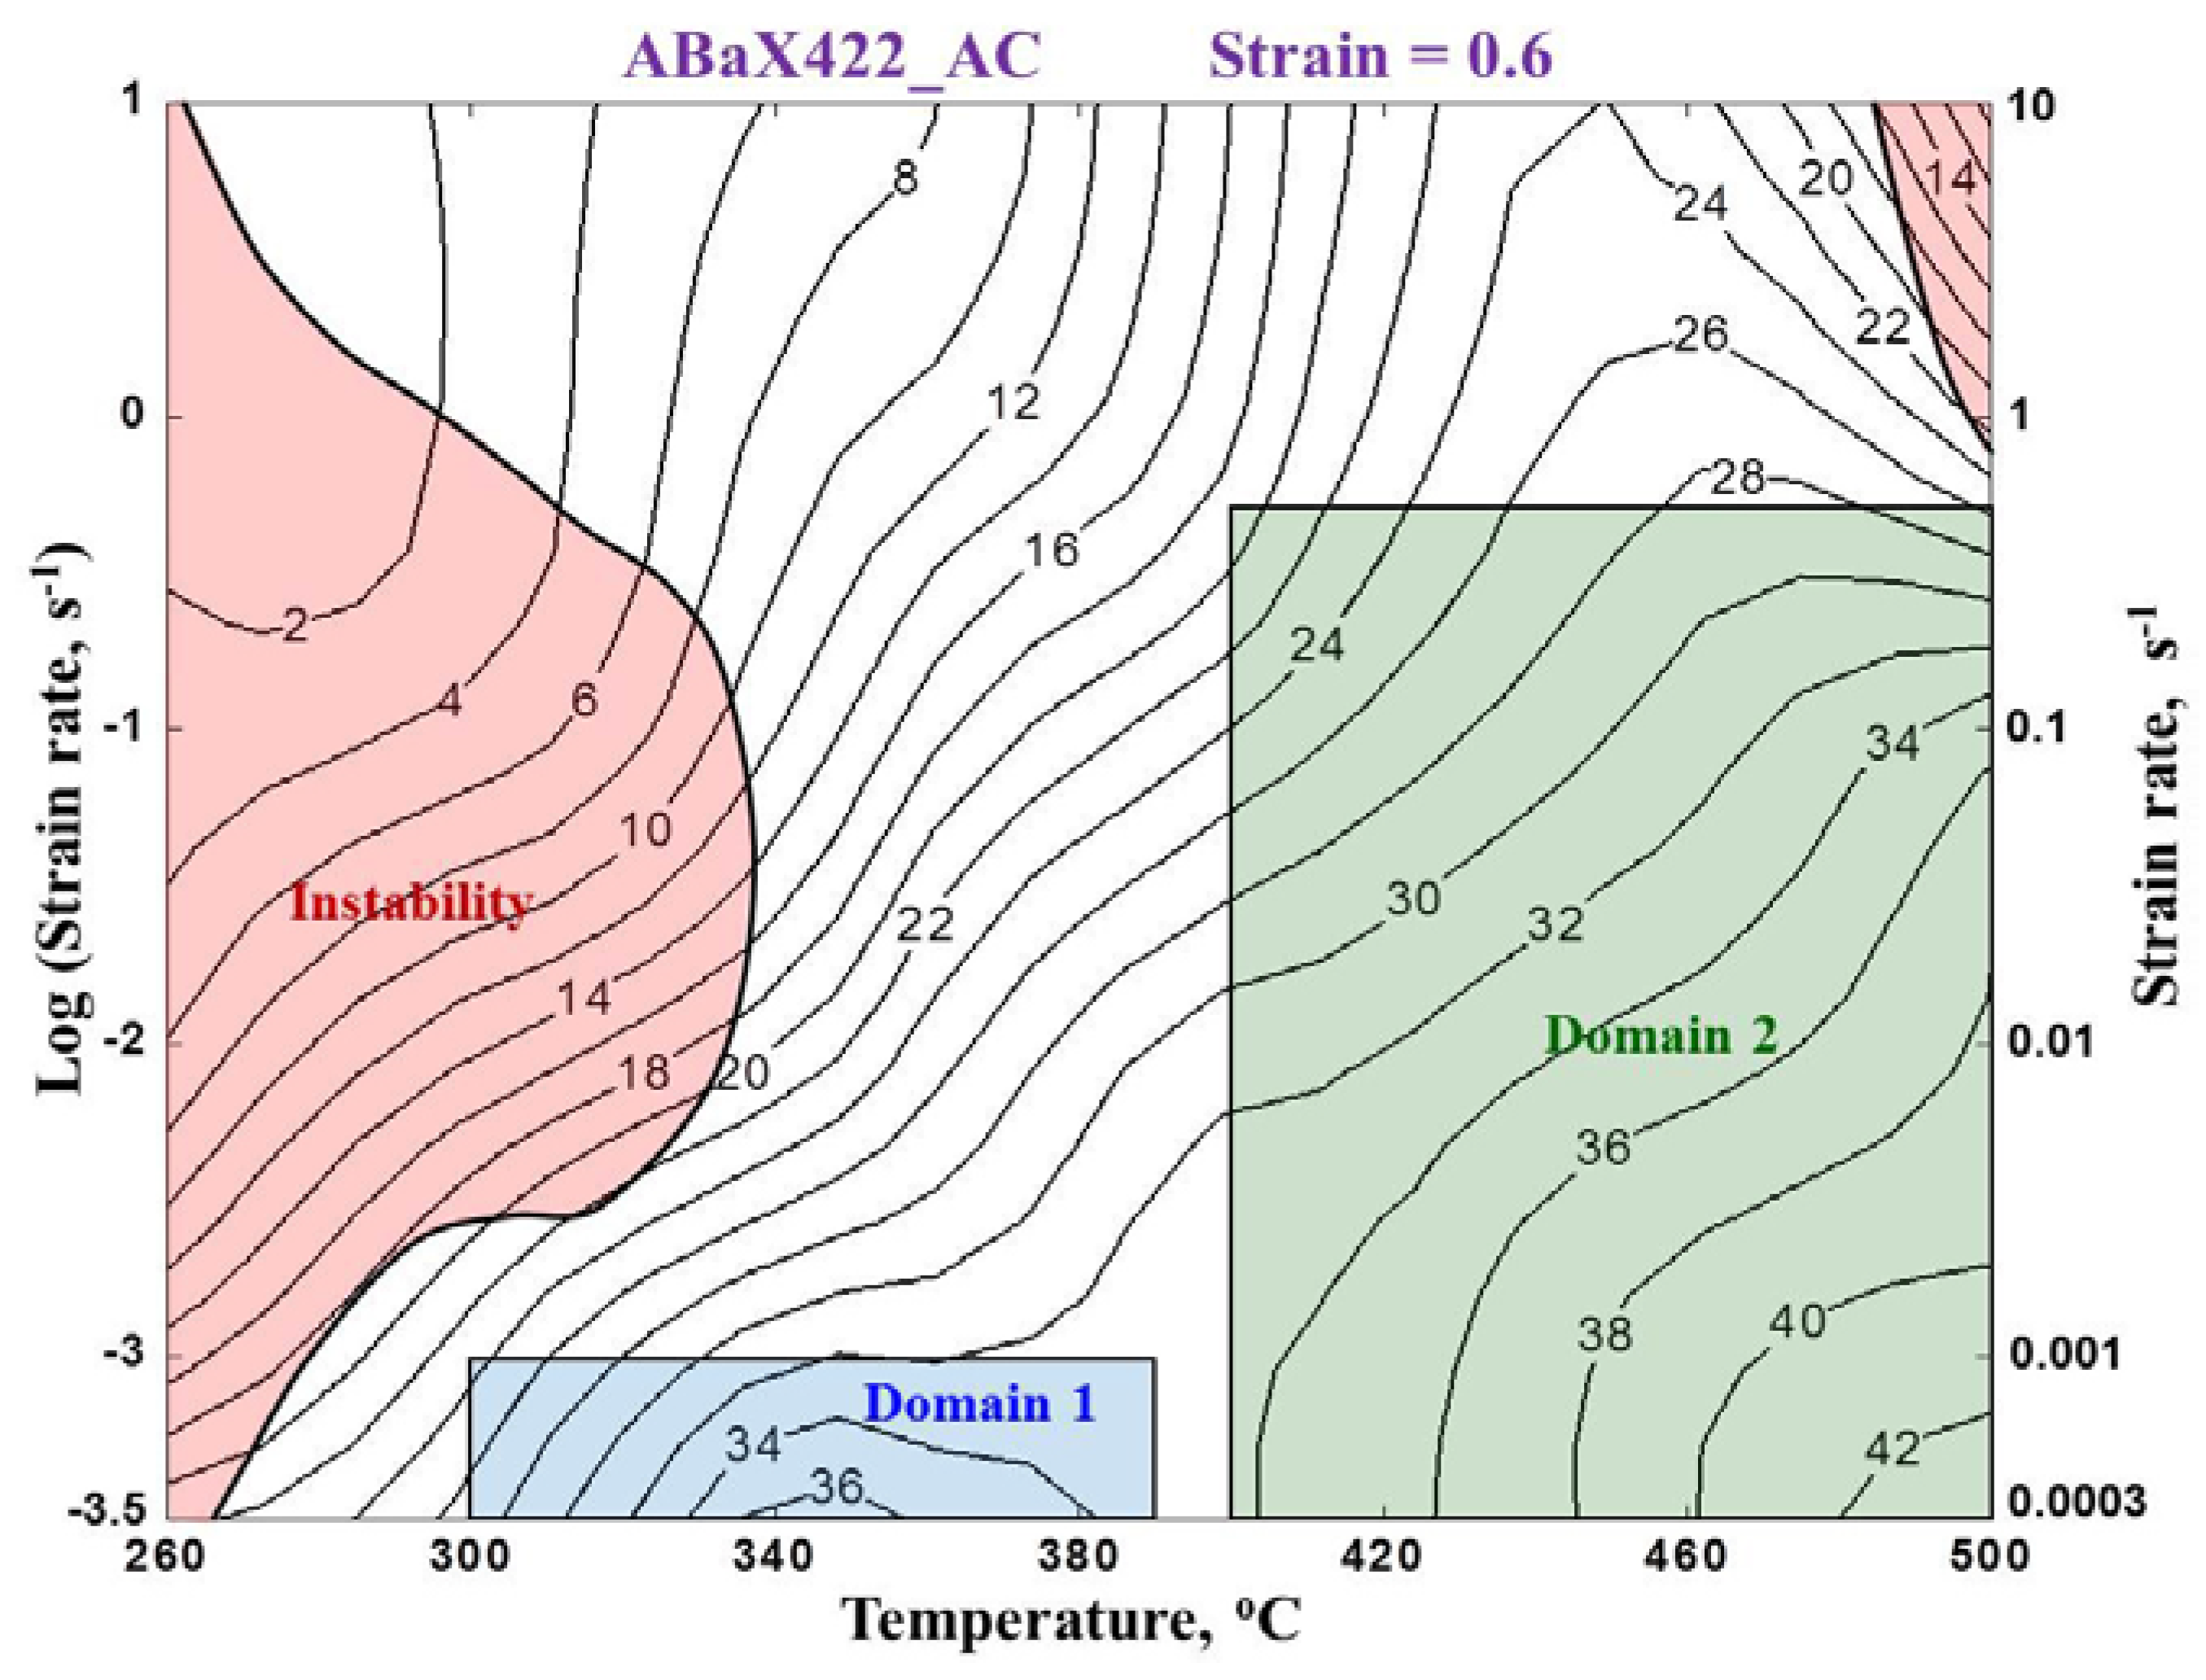
3.2. Processing Map of the ABaX422 Alloy

The processing map generated [12] on the ABaX422 alloy at a strain of 0.6 is shown in Figure 2. The map represents the hot working characteristics of the alloy in the temperature and strain rate ranges studied, which are quite wide. Even though the processing map is sensitive to the strain value in the initial stages of deformation for materials in which microstructural changes are drastic, the effect of strain becomes negligible once a steady-state type flow is reached. The value of 0.6 is chosen in the present study as the flow curves at all conditions exhibiting steady-state flow. The map consists of contours of constant efficiency of power dissipation through microstructural changes occurring during deformation expressed in percent. A simple way to look at a processing map is as follows [16,17]: The pattern in which the efficiency contours appear reveals hills and valleys in which the efficiency reaches a peak or dips to a minimum, respectively. The contour maps of the efficiency hills appear as domains with efficiency reaching a peak in the center and each of the domains represents a microstructural mechanism that may be identified through a microstructural study. When the dissipating microstructural mechanisms are different in various temperature-strain rate regions, multiple domains appear in the map. Each of the domains in the processing map represents a specific dominant mechanism (such as dynamic recrystallization, dynamic recovery, superplastic deformation, wedge cracking, void formation, intercrystalline cracking, and prior particle boundary cracking) that contributes to the power dissipation and is deterministic in the sense that kinetic laws are obeyed within the domains. Once the mechanism in each of the domains is identified, a microstructurally “safe” domain, like dynamic recrystallization or superplasticity, is selected for hot working and the hot workability will be optimum under peak efficiency conditions within the domain. In addition, a regime where the plastic flow becomes unstable due to inhomogeneous processes like adiabatic shear band formation or flow localization [18], may also be identified in the map and this regime will have to be avoided while processing the material.
The processing map reveals two domains as described below: (i) in the temperature range of 300–390 °C and strain rate range of 0.0003–0.001 s−1 with a peak efficiency of about 36% occurring at about 350 °C and 0.0003 s−1; and (ii) in the temperature range of 400–500 °C and strain rate range of 0.0003–0.5 s−1 with a peak efficiency of 44% occurring at 500 °C and 0.0003 s−1. On the basis of microstructural study and kinetic analysis, it has been concluded [12] that both the domains represent the basic process of dynamic recrystallization (DRX) although the slip systems and recovery processes involved in the DRX process are different. The process of DRX involves nucleation and grain boundary migration, the slower of which becomes the rate-controlling step [19]. In magnesium, DRX is nucleation-controlled since the grain boundary migration is a much faster process. The rate of nucleation involves the rate at which dislocations get generated and the rate of recovery by either climb or cross-slip, the former being controlled by rate of diffusion and the latter by the stacking fault energy. In magnesium, the stacking fault energy on basal slip planes is low (60–78 mJ/m2) [20] and is high on second order pyramidal planes (173 mJ/m2) [21]. Thus, in view of the non-availability of intersecting slip planes for basal slip system and lower stacking fault energy, cross-slip is not favored and recovery occurs by the climb of edge dislocations. DRX by basal slip + climb, therefore, occurs at slower strain rates. However, when deformation takes place by second order pyramidal slip as at higher temperatures, cross-slip becomes the preferred recovery process since a large number of intersecting planes are available in this system and the stacking fault energy is higher.

3.3. Domain 1 in the Processing Map of the ABaX422 Alloy

In Domain 1, which occurs at relatively lower temperatures, basal slip {0001}<11 2 ¯ 0> will be the most favored slip system since its critical resolved shear stress (CRSS) is the lowest of all slip systems. At the temperatures of this domain (300–390 °C), prismatic slip {10 1 ¯ 0}<11 2 ¯ 0> is also likely to be operative and second-order pyramidal slip to a much lesser extent. The recovery mechanism associated with basal and prismatic slip is that involving climb of edge dislocations. The microstructure of the specimen deformed under the peak conditions in Domain 1 (340 °C/0.0003 s−1) is shown in Figure 3a, which exhibits finely recrystallized grains. The black lines represent the blocky intermetallic phase present in the microstructure. Micrographs of the specimens compressed at other deformation conditions within the Domain 1 are shown in Figure 3b (300 °C/0.0003 s−1) and 3c (380 °C/0.0003 s−1), which also exhibited DRX features. Grain size of the specimen deformed at peak efficiency condition (340 °C) is larger than the specimen compressed at lower temperature (300 °C) but finer than the specimen deformed at 380 °C. TEM micrographs obtained on this specimen show planar slip with high dislocation density (Figure 4a) and polygonized sub-structure with tilt boundaries (Figure 4b) which appear as sharply defined straight boundaries [22,23]. These confirm that the deformation is essentially controlled by basal slip and recovery by dislocation climb process. The texture obtained on this specimen is shown in Figure 5a in the form of pole figures and in Figure 5b as an inverse pole figure. The texture is not very strong (about two times random as per the inverse pole figure) but confirms some basal slip activity since basal planes are rotated away from the compression axis. Basal slip activity in this domain is also revealed by the Schmid factor estimates (Figure 5c) which show that the relative frequency of basal slip occurrence is highest at the Schmid factor of about 0.45. In this condition, there are also contributions from prismatic and second-order pyramidal slip in this domain in the ratio of 25% each as revealed by the Schmid factor estimates (Figure 5c).

3.4. Domain 2 in the Processing Map of the ABaX422 Alloy

Domain 2 occurs at temperatures higher than 400 °C where second-order pyramidal slip {11 2 ¯ 2}˂11 2 ¯ 3> will be activated while basal, as well as prismatic, slip also occur. Since pyramidal slip has a large number of intersecting slip planes, cross-slip occurs extensively in this domain. The microstructure obtained on the specimen deformed under conditions of peak efficiency (500 °C/0.0003 s−1) is shown in Figure 6, which shows full DRX. TEM micrographs obtained on this specimen exhibited tangled-up dislocations (Figure 7a) which occurs when cross-slip of screw dislocations takes place during deformation. The sub-grain structure formed as a result of recovery by cross-slip consists of twist-type sub-boundaries which consist of a cross-grid of screw dislocations [22,23] as shown in the TEM micrograph (Figure 7b). These confirm that in this domain multiple slip systems operate and cross-slip is the recovery mechanism. The texture recorded in this specimen is shown in the form of pole figures and inverse pole figure in Figure 8a,b which show that the texture is nearly random, as expected from the activity of multiple slip systems and cross-slip. The Schmid factor analysis, given in Figure 8c, has confirmed the activity of basal, prismatic, as well as pyramidal slip in this domain as their relative frequencies are high at the favored Schmid factor of about 0.45. The DRX microstructure obtained at the deformation condition of 460 °C/0.01 s−1, which is away from that of peak efficiency but still in Domain 2, is shown in Figure 9, and the texture results corresponding to these deformation conditions are shown in Figure 10a–c. These are essentially similar to those obtained on specimen deformed at 500 °C/0.0003 s−1 (peak efficiency in the domain) further confirming that, in this domain, the texture is nearly random due to multiple slip activity and cross-slip.

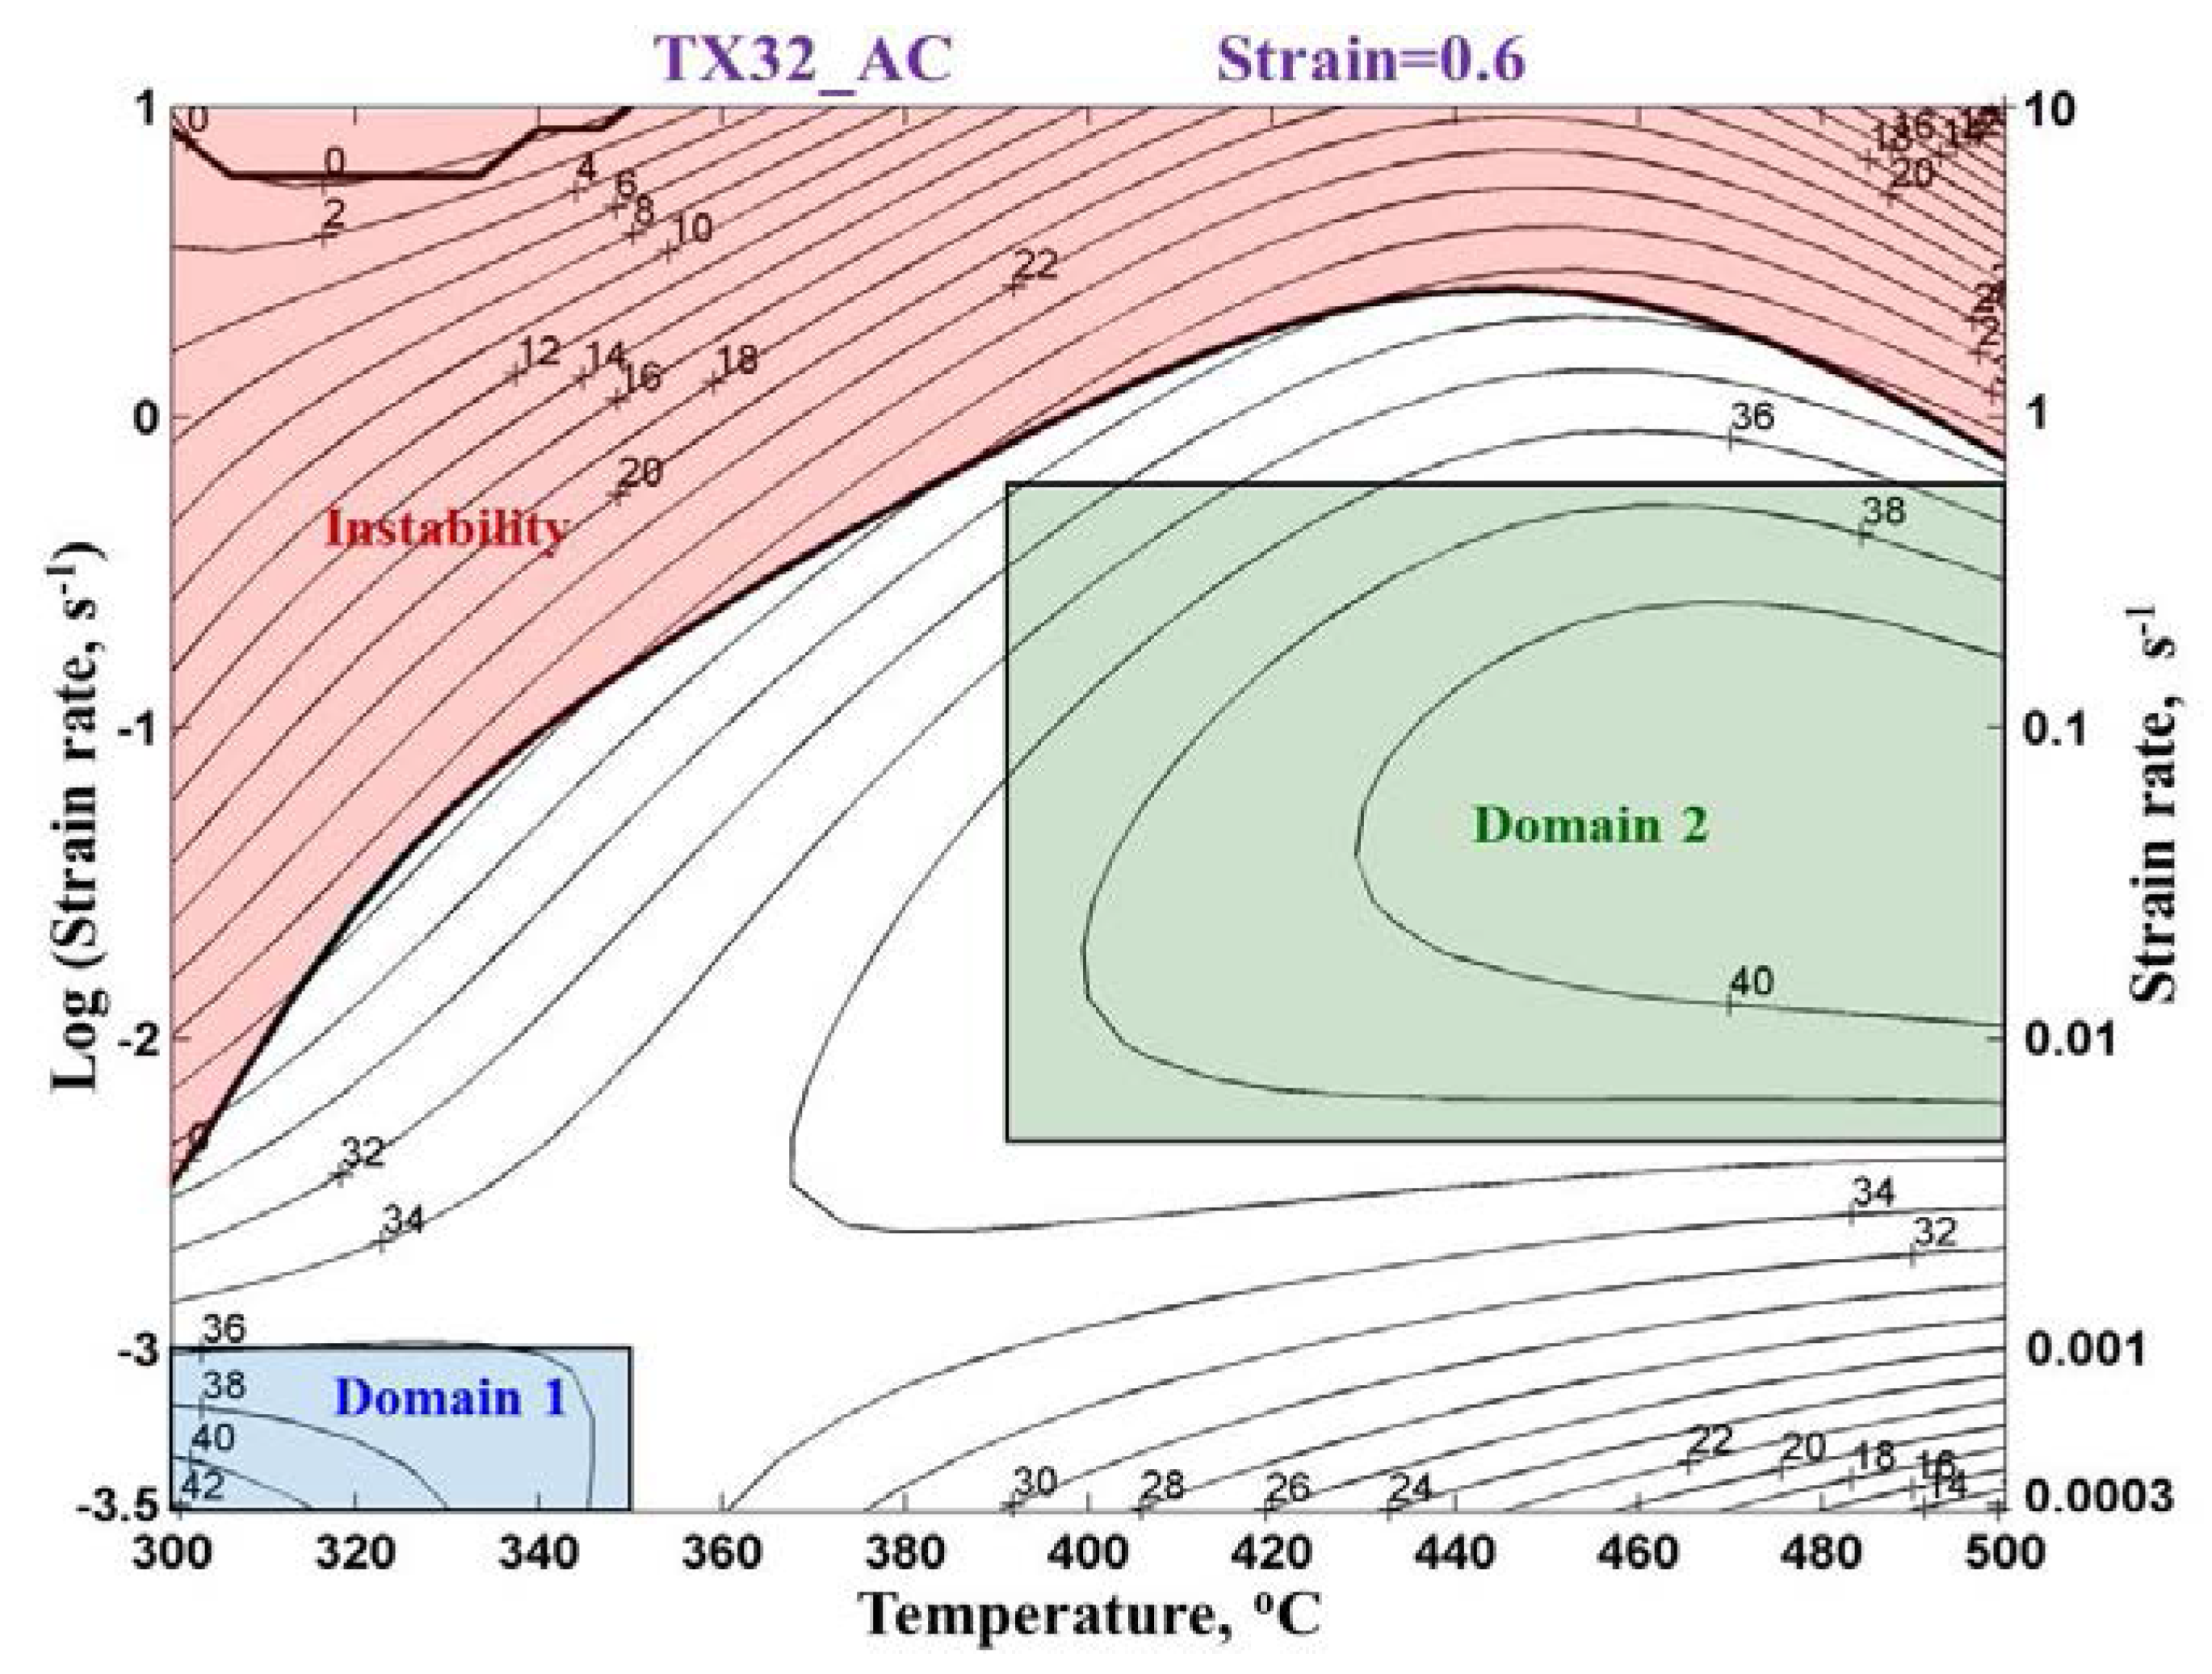
3.5. Comparison of Deformation Behavior of ABaX422 Alloy with TX32 Alloy (Mg-3Sn-2Ca)

It is interesting to compare the hot working behavior of ABaX422 alloy [11] with that of TX32 alloy [13], which does not have Ba addition. TX32 alloy has CaMgSn intermetallic phase in the matrix and Mg2Ca phase at the grain boundaries. The processing map for TX32 at a strain of 0.6 is shown in Figure 11 which has been interpreted in detail in terms of basic flow mechanisms in an earlier publication [13]. In the processing map of TX32, basal + prismatic slip occurred along with recovery by dislocation climb in Domain 1, while second-order pyramidal slip occurred in Domain 2 with cross-slip being the rate controlling mechanism [13]. The maps of ABaX422 and TX32 are similar insofar as they exhibit two domains. However, in the Ba + Ca-containing alloy, Domain 1 has moved to higher temperatures and the temperature for peak efficiency is higher by about 50 °C. On the other hand, Domain 2 has moved to higher temperatures and lower strain rates and covers a wider area of the map. The larger volume content of the intermetallic phases present in the Ba + Ca-containing alloy both at the grain boundaries and the grain interior is responsible for the shifts in the domains since they greatly enhance the back stress for the dislocation movement, requiring higher temperatures for glide. As regards their effect on the recovery mechanisms, both thermal recovery by climb and dynamic recovery by cross-slip will be slowed due to the hindrance caused by the particles and requires higher temperatures for climb, as in Domain 1 and slower strain rates for cross-slip as Domain 2. Thus, the basic slip and recovery mechanisms involved in causing DRX in the two domains remain unchanged although their kinetics are affected by the large volume content of the intermetallic phase in the Ba + Ca-containing alloy. Another interesting feature regards the texture in Domain 1, which is more intense in the TX32 alloy (about seven times the randomness) became only two times the randomness in the ABaX422 alloy. This may, again, be attributed to the increased volume content of the intermetallic phase in the Ba + Ca-containing alloy which is responsible for moving the domain to higher temperatures. The non-basal slip systems will get activated and destroy the preferred orientation. In Domain 2, however, both alloys exhibit near-random texture since the cross-slip mechanism occurs in both alloys.

4. Conclusions

The changes in microstructure and texture associated with dynamic recrystallization during hot compression of ABaX422 alloy have been studied using TEM and EBSD techniques in the two domains appearing in its processing map in the temperature and strain rate ranges: (1) 300–390 °C/0.0003–0.001 s−1; and (2) 400–500 °C/0.0003–0.5 s−1. The following conclusions are drawn from this study:
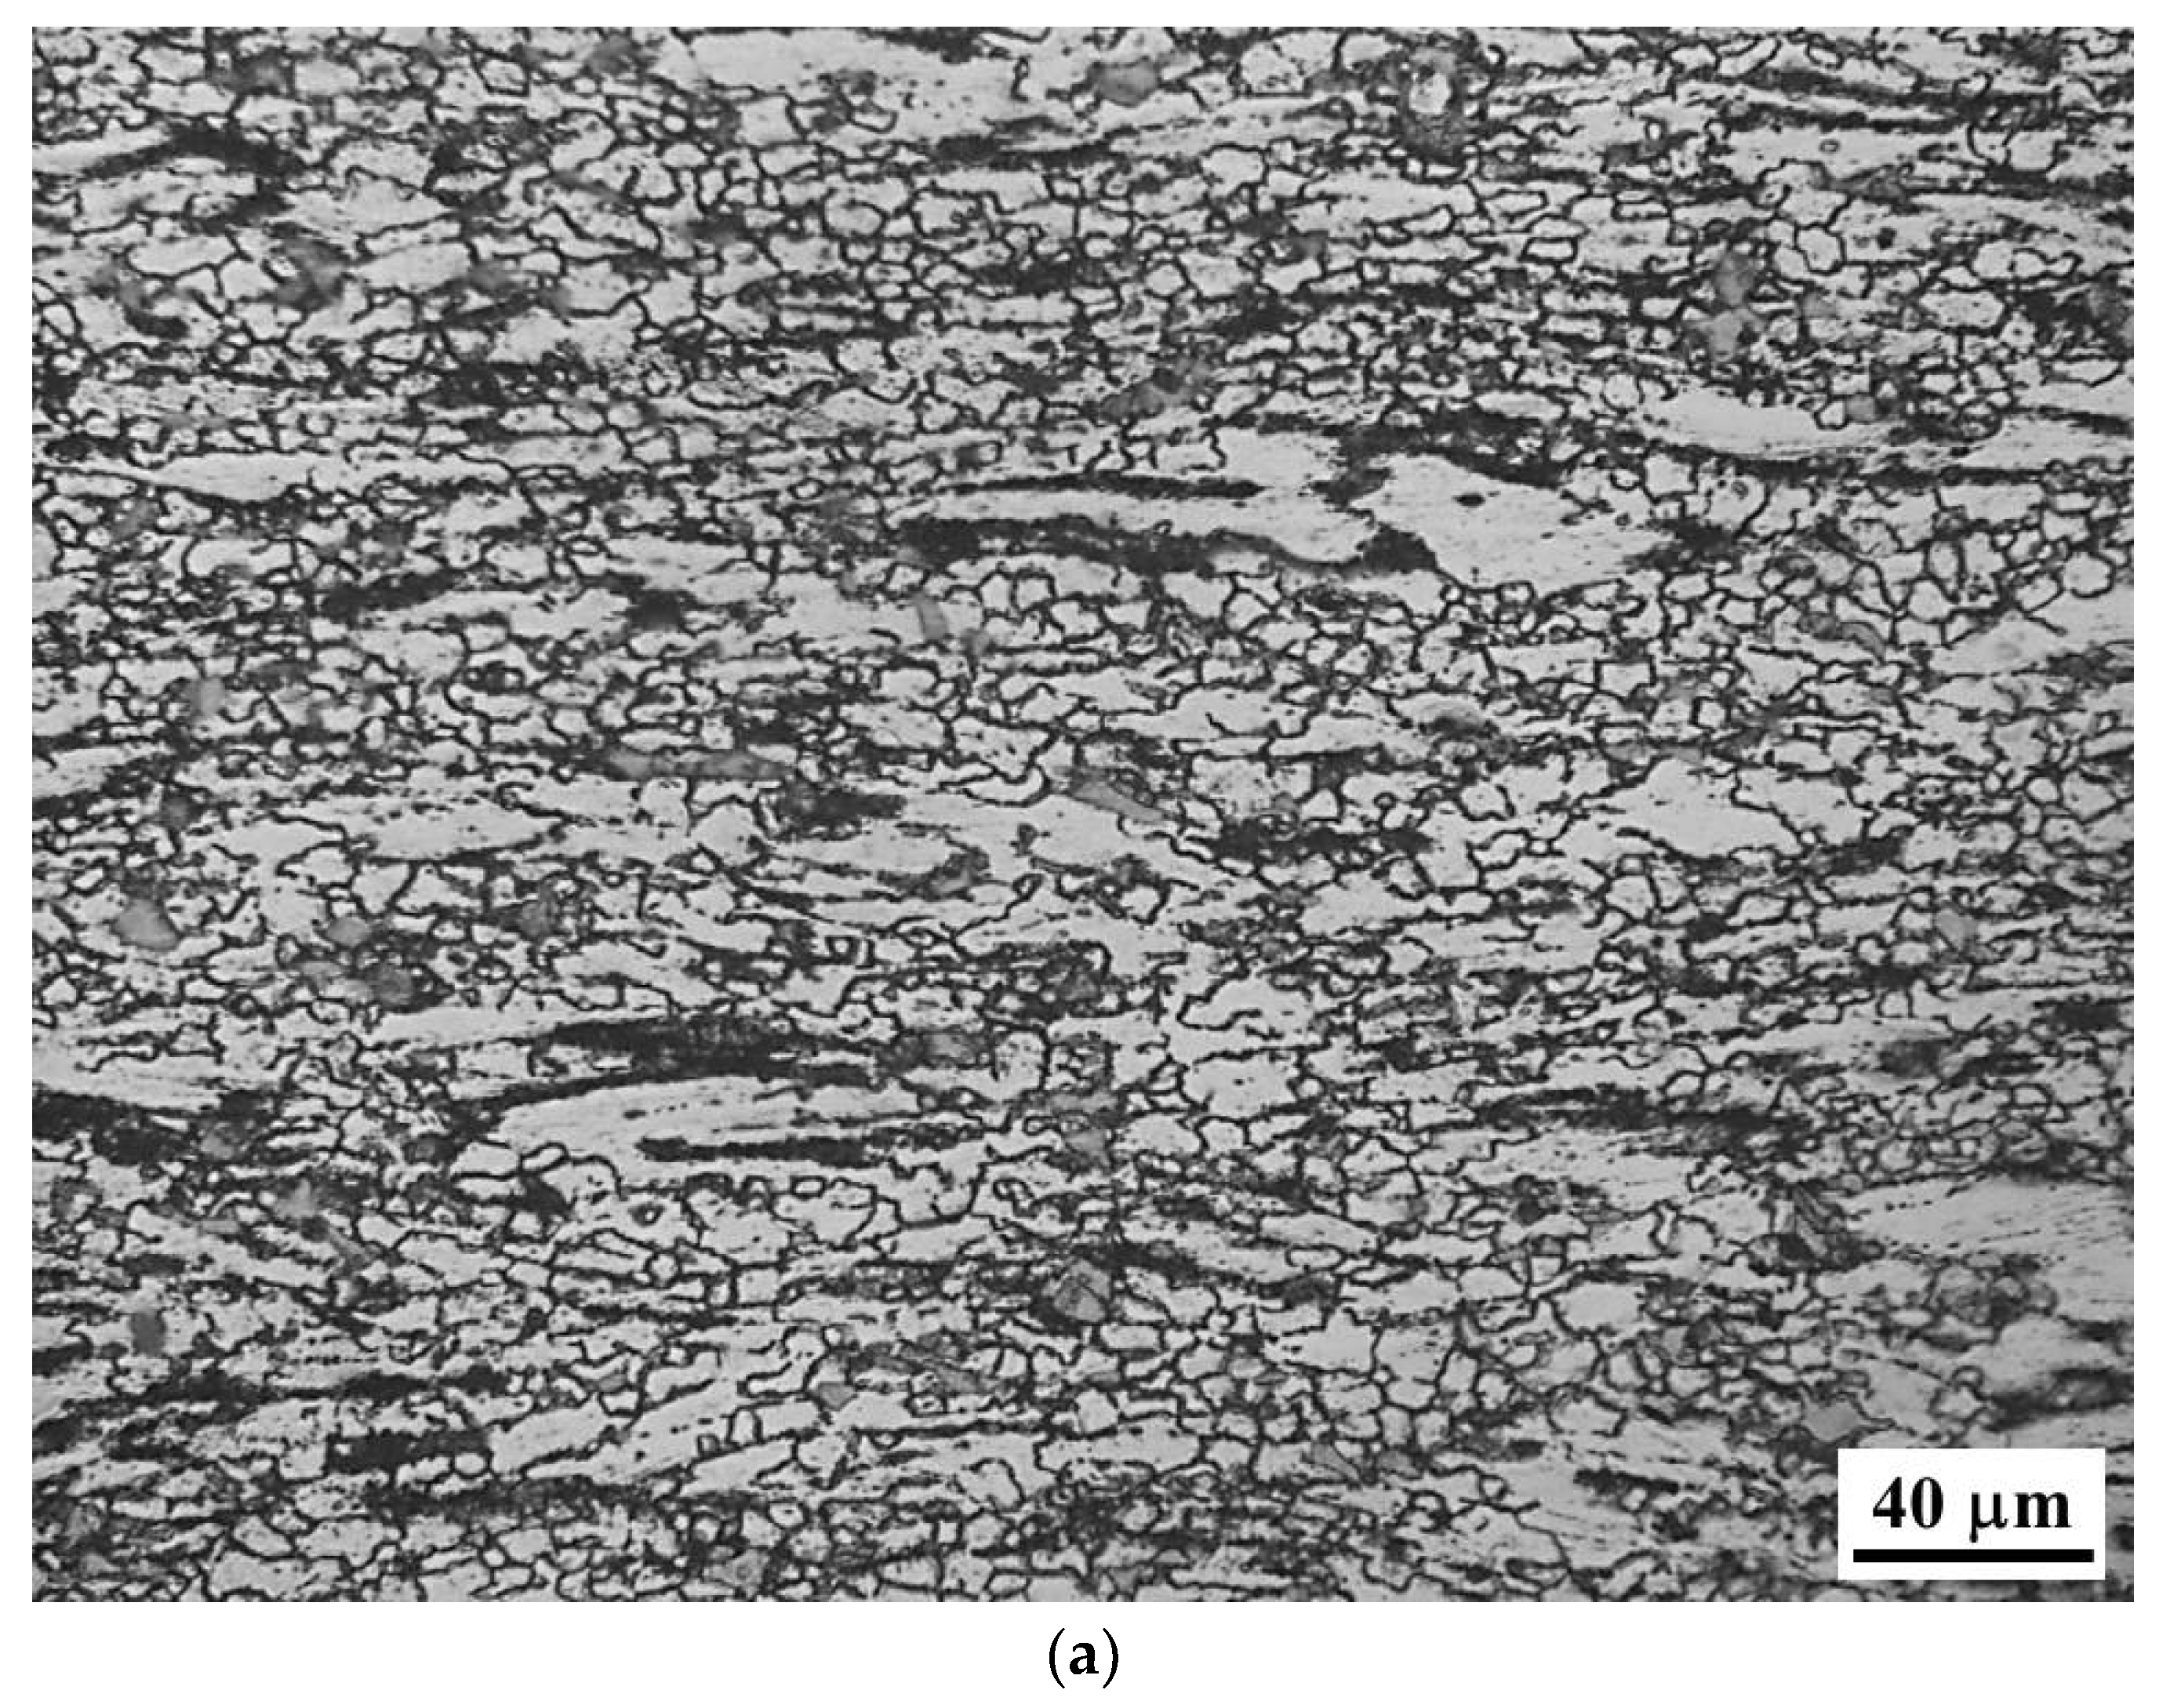
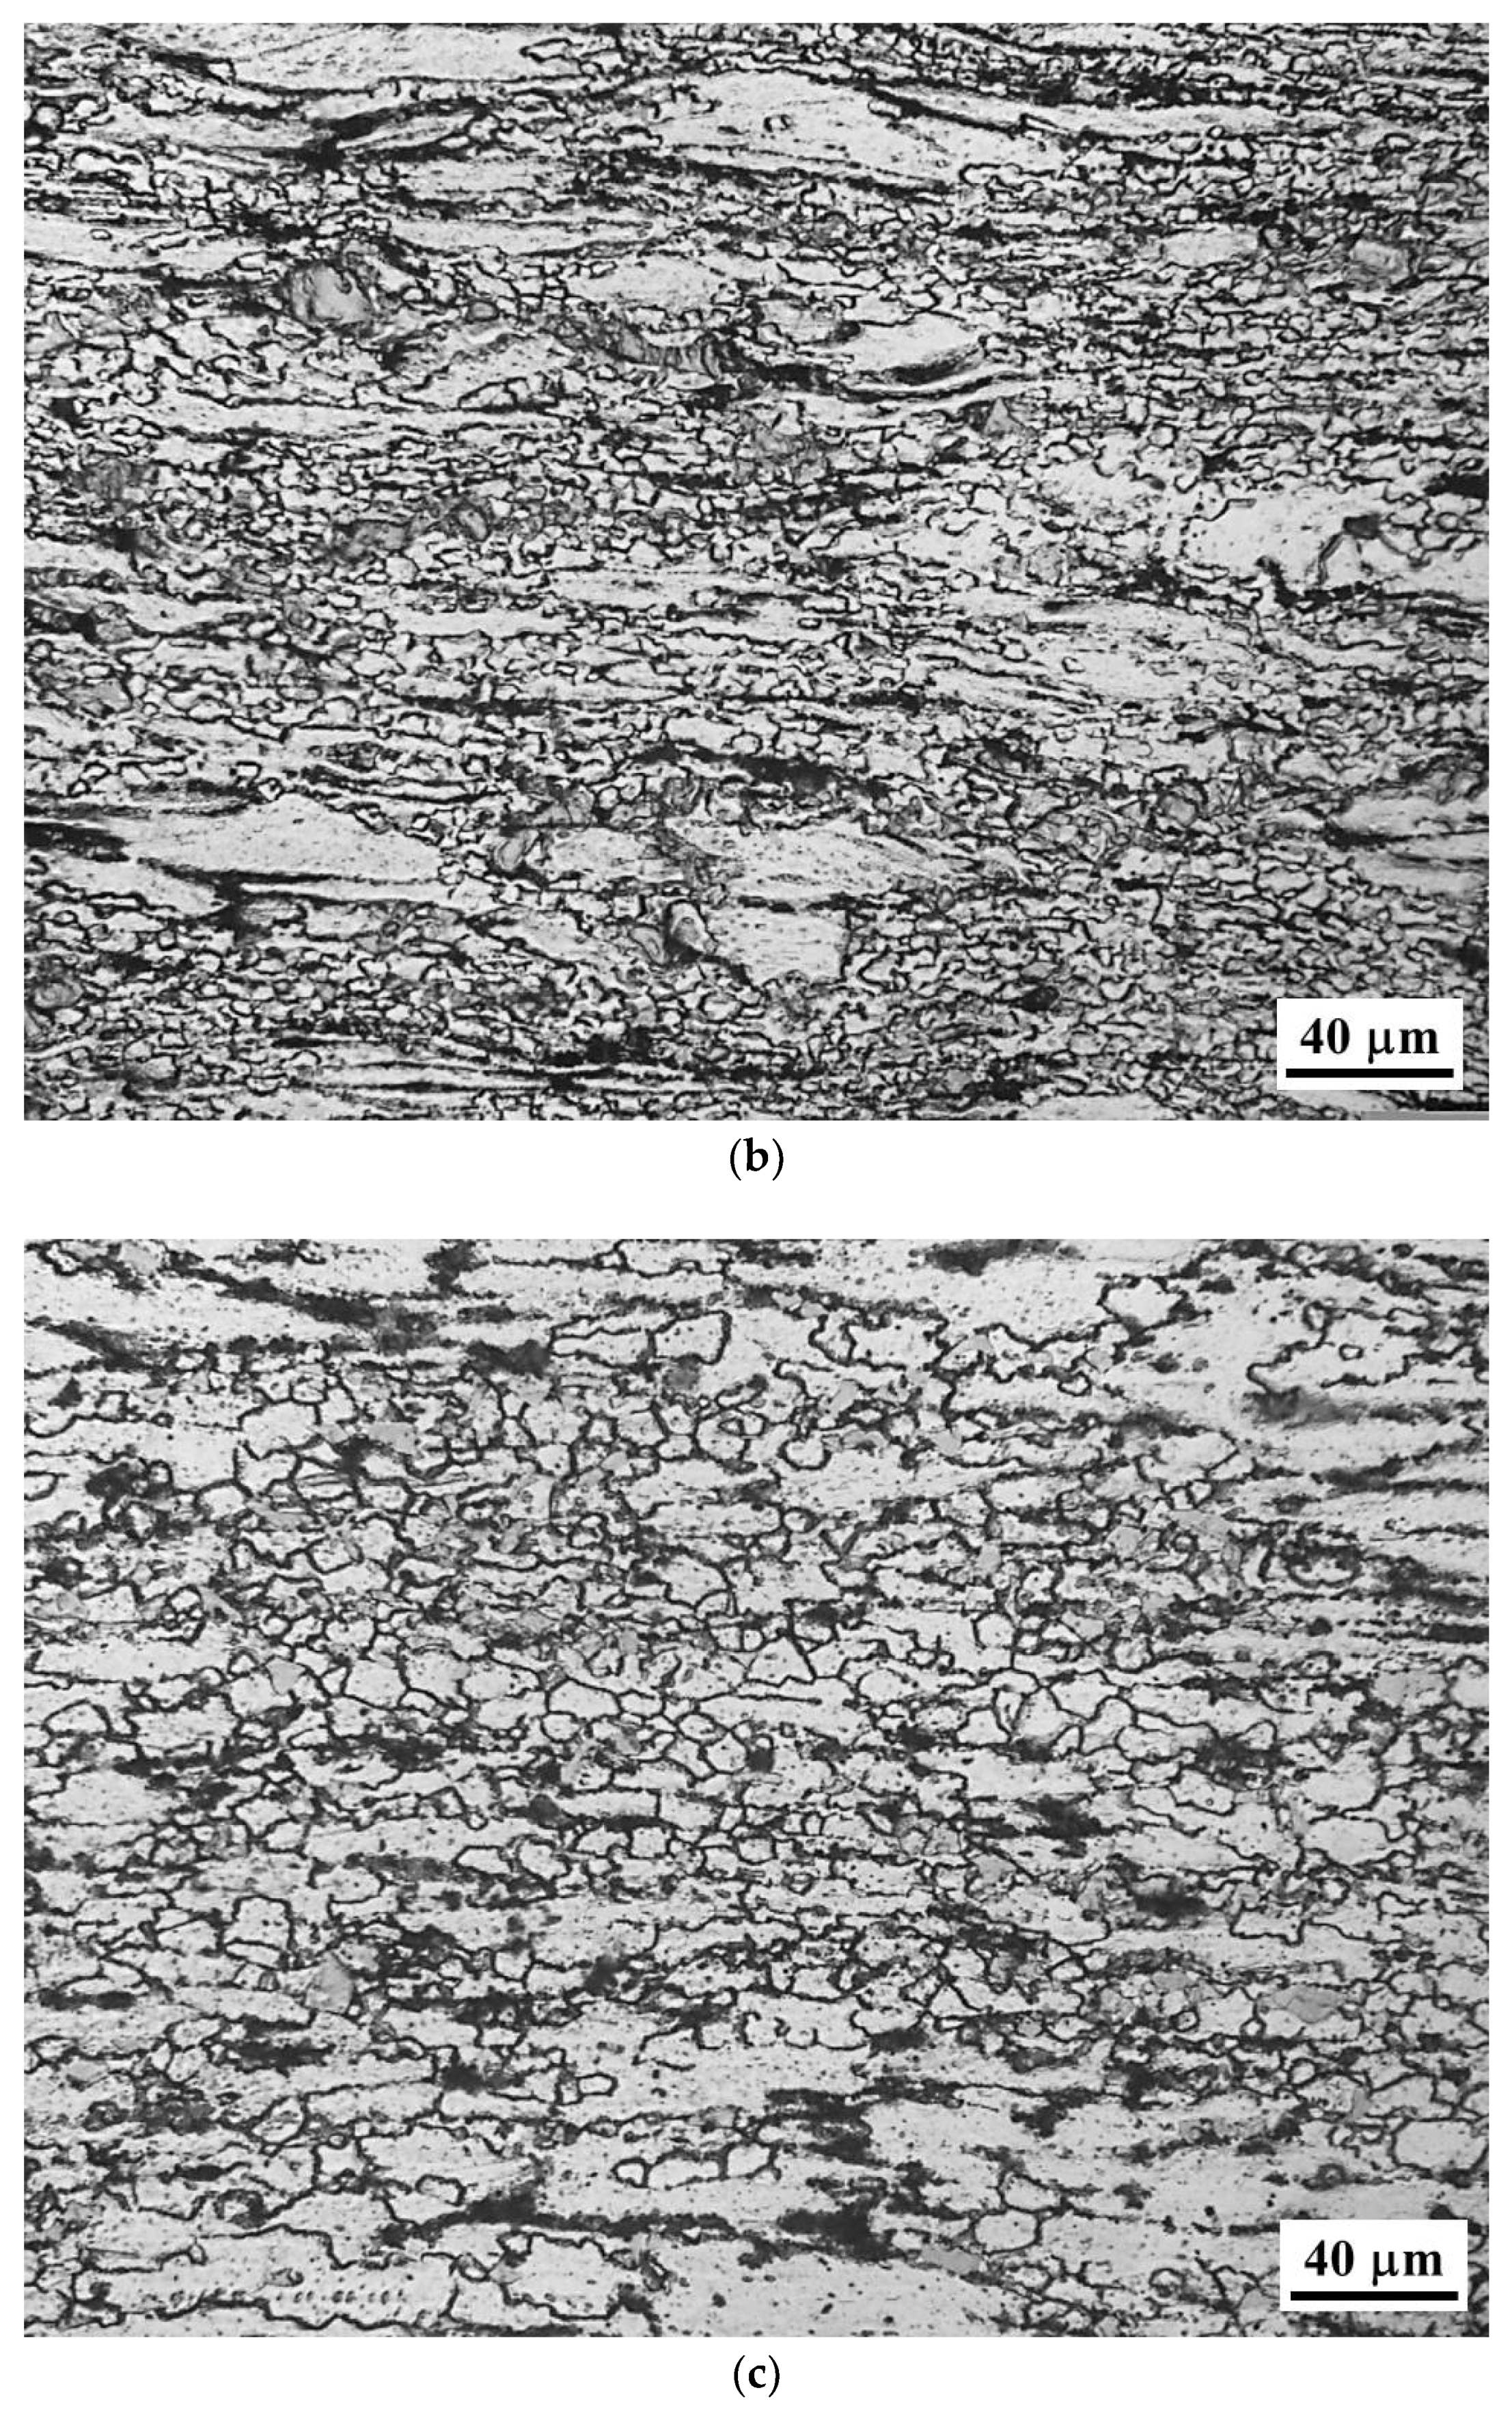
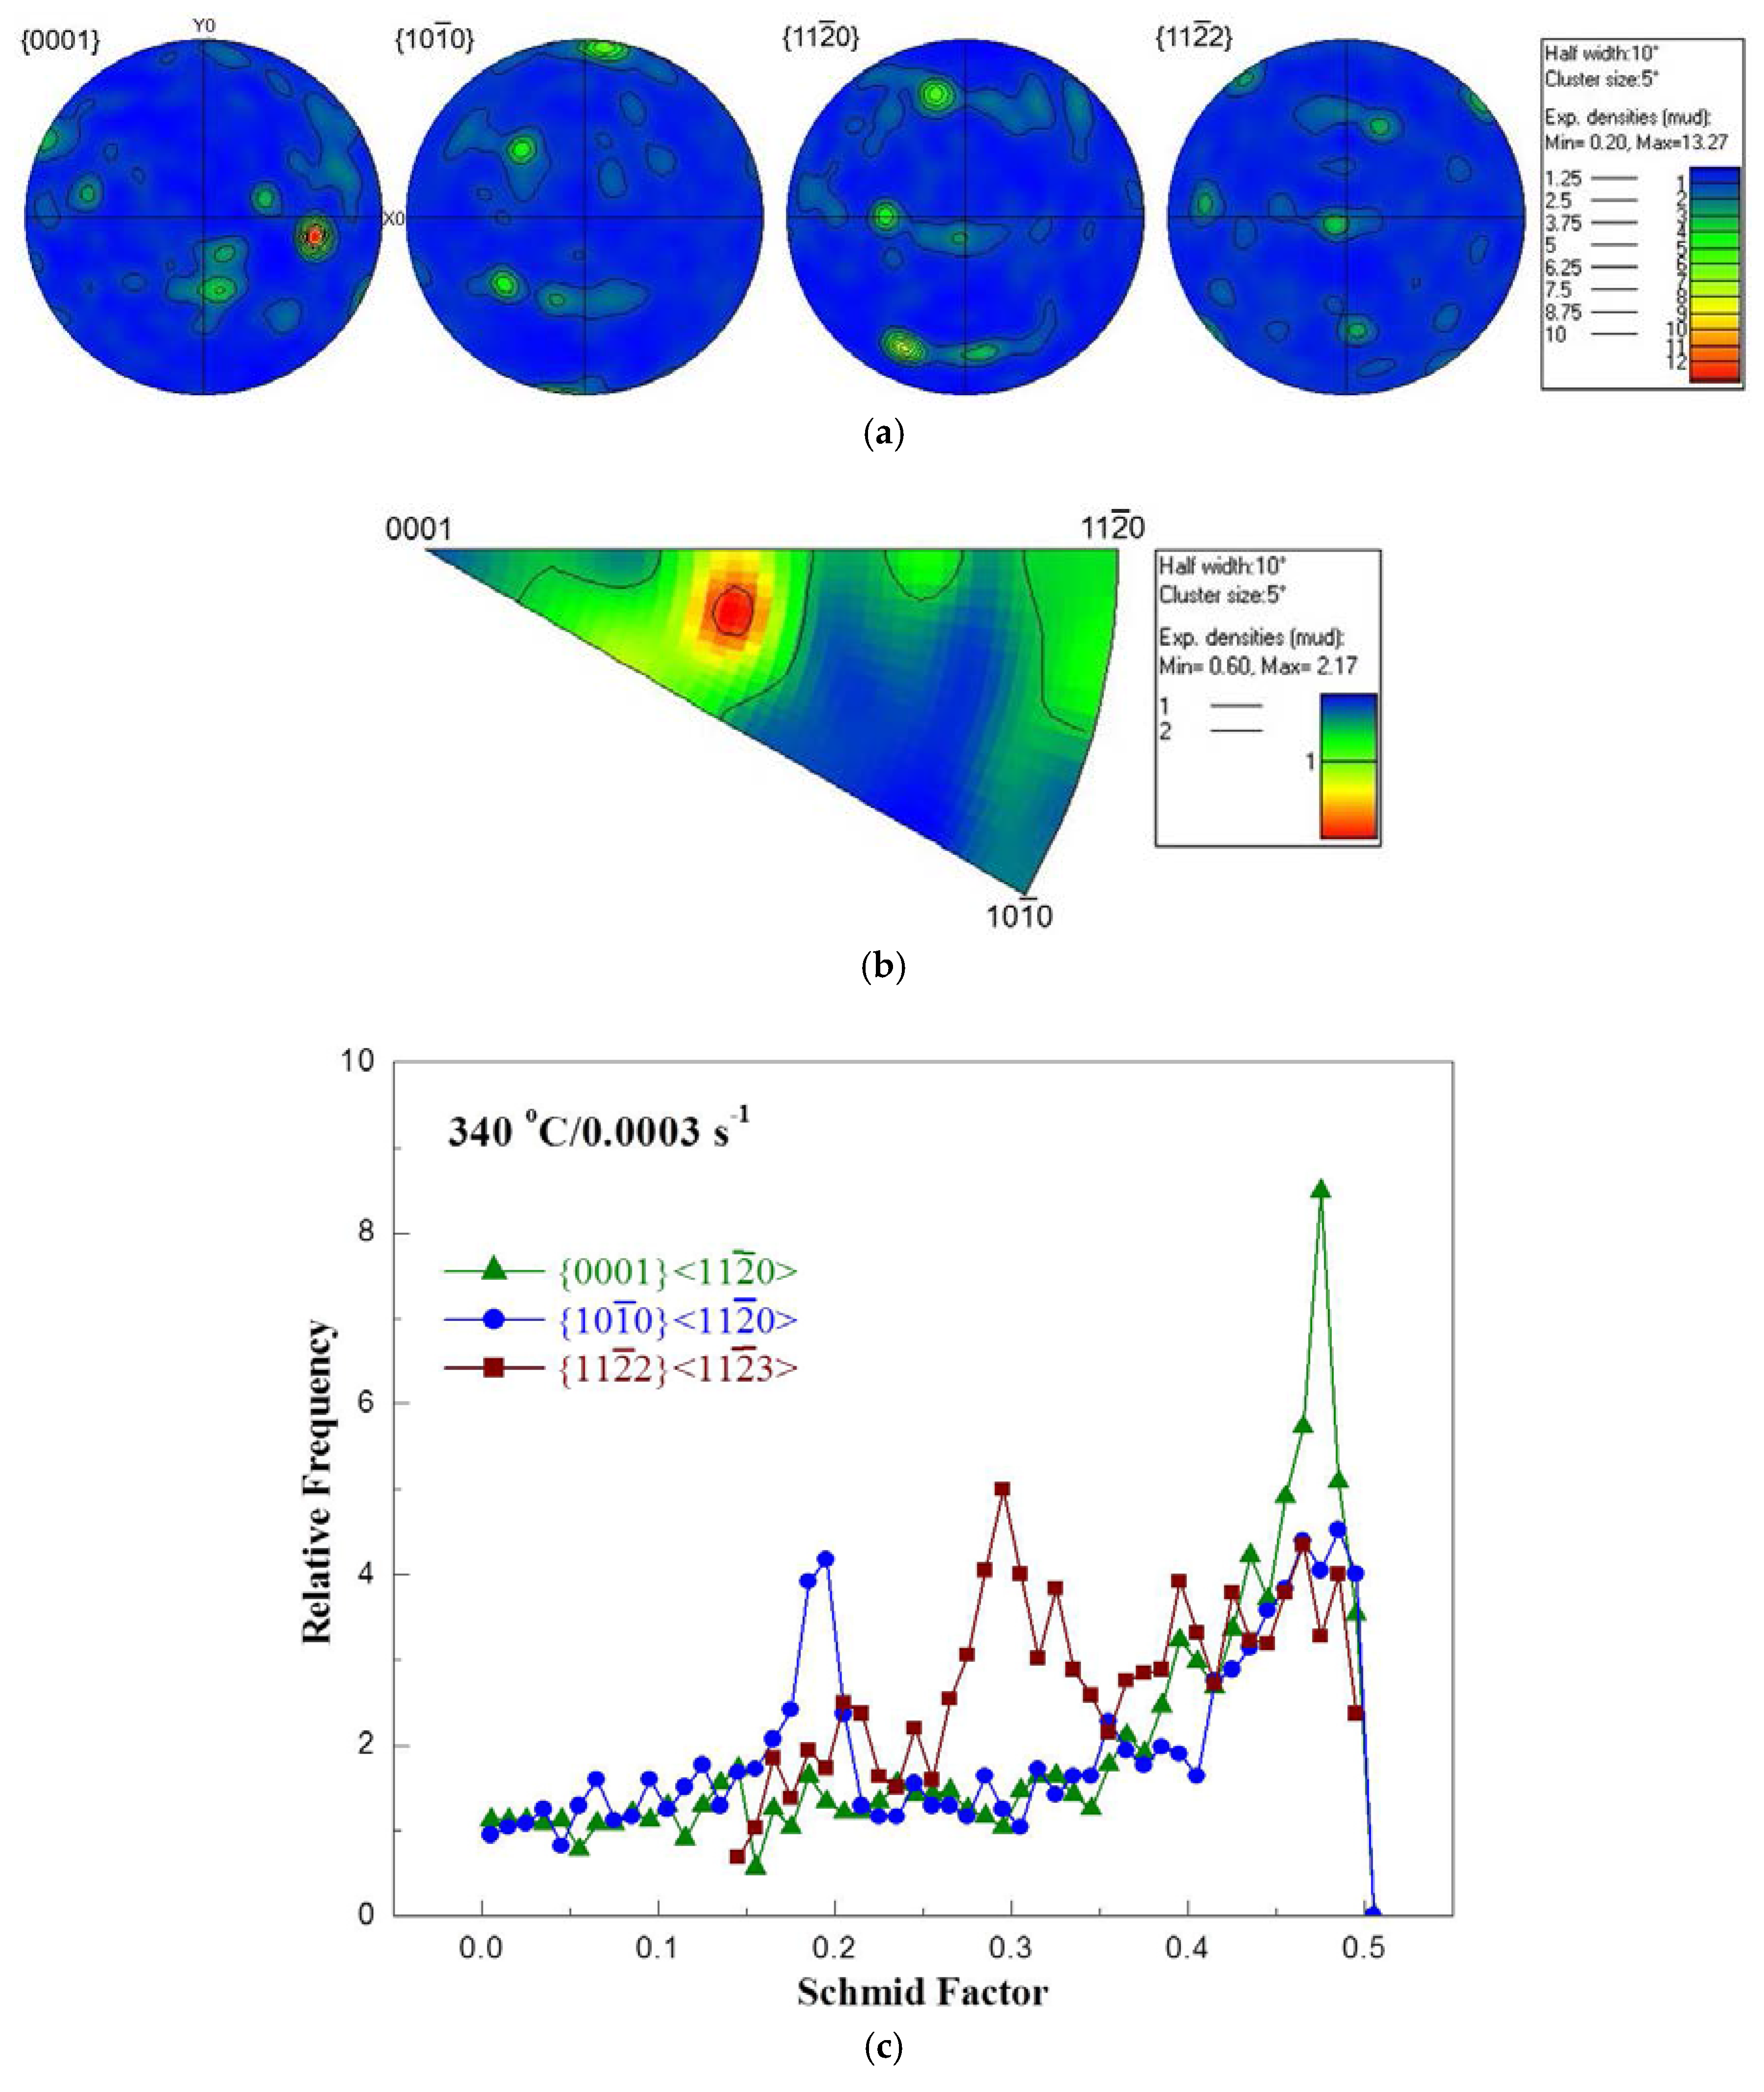
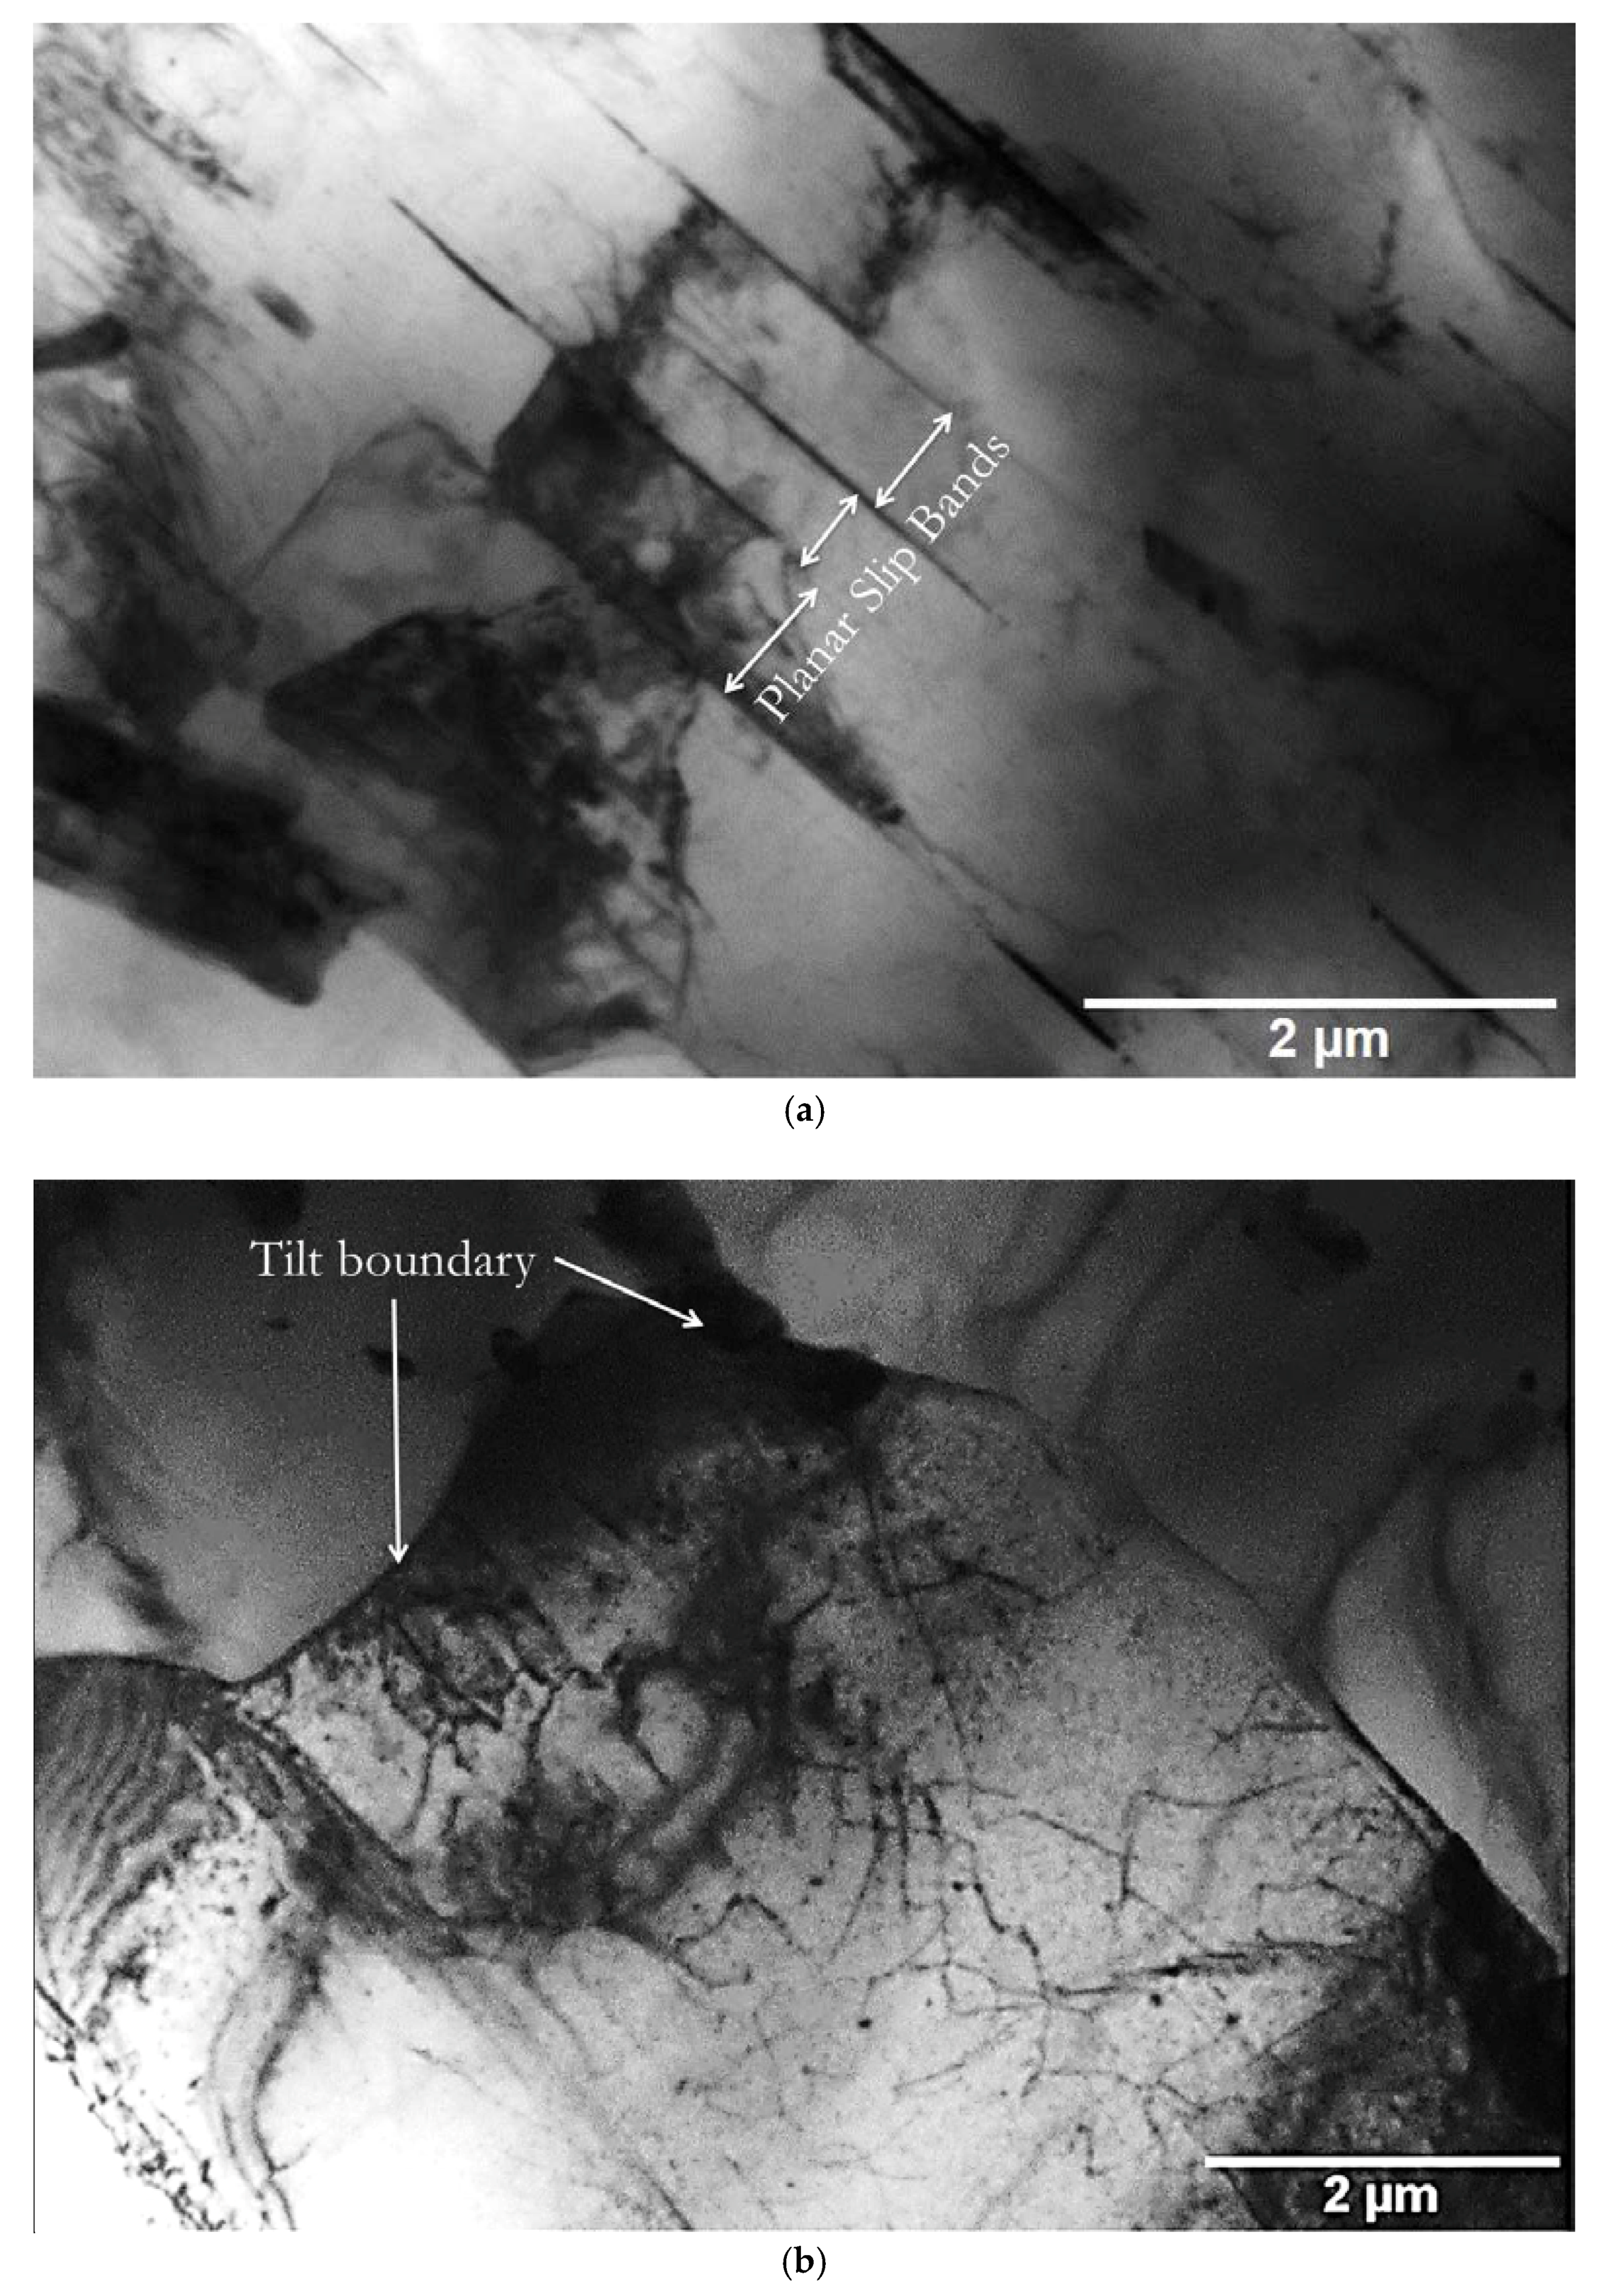
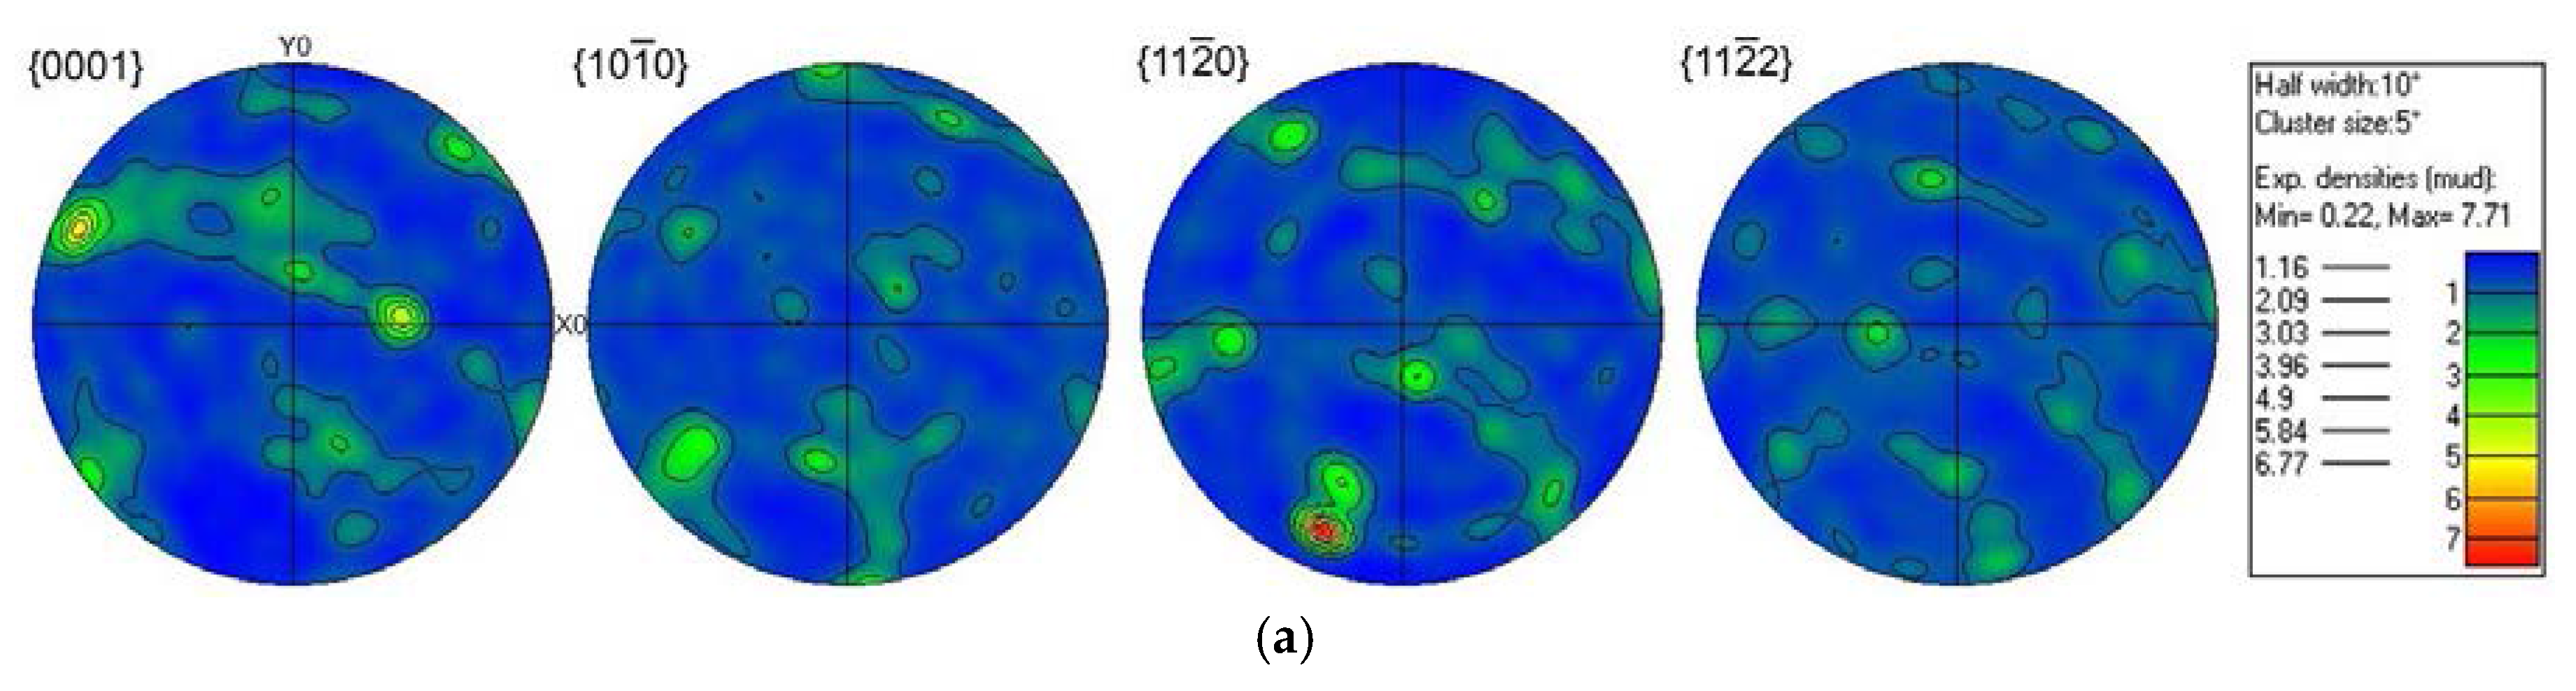
  • In Domain 1, the microstructure revealed that DRX occurs by basal slip, as indicated by the presence of planar slip bands and high dislocation density leading to tilt boundary formation and a low-intensity basal texture.
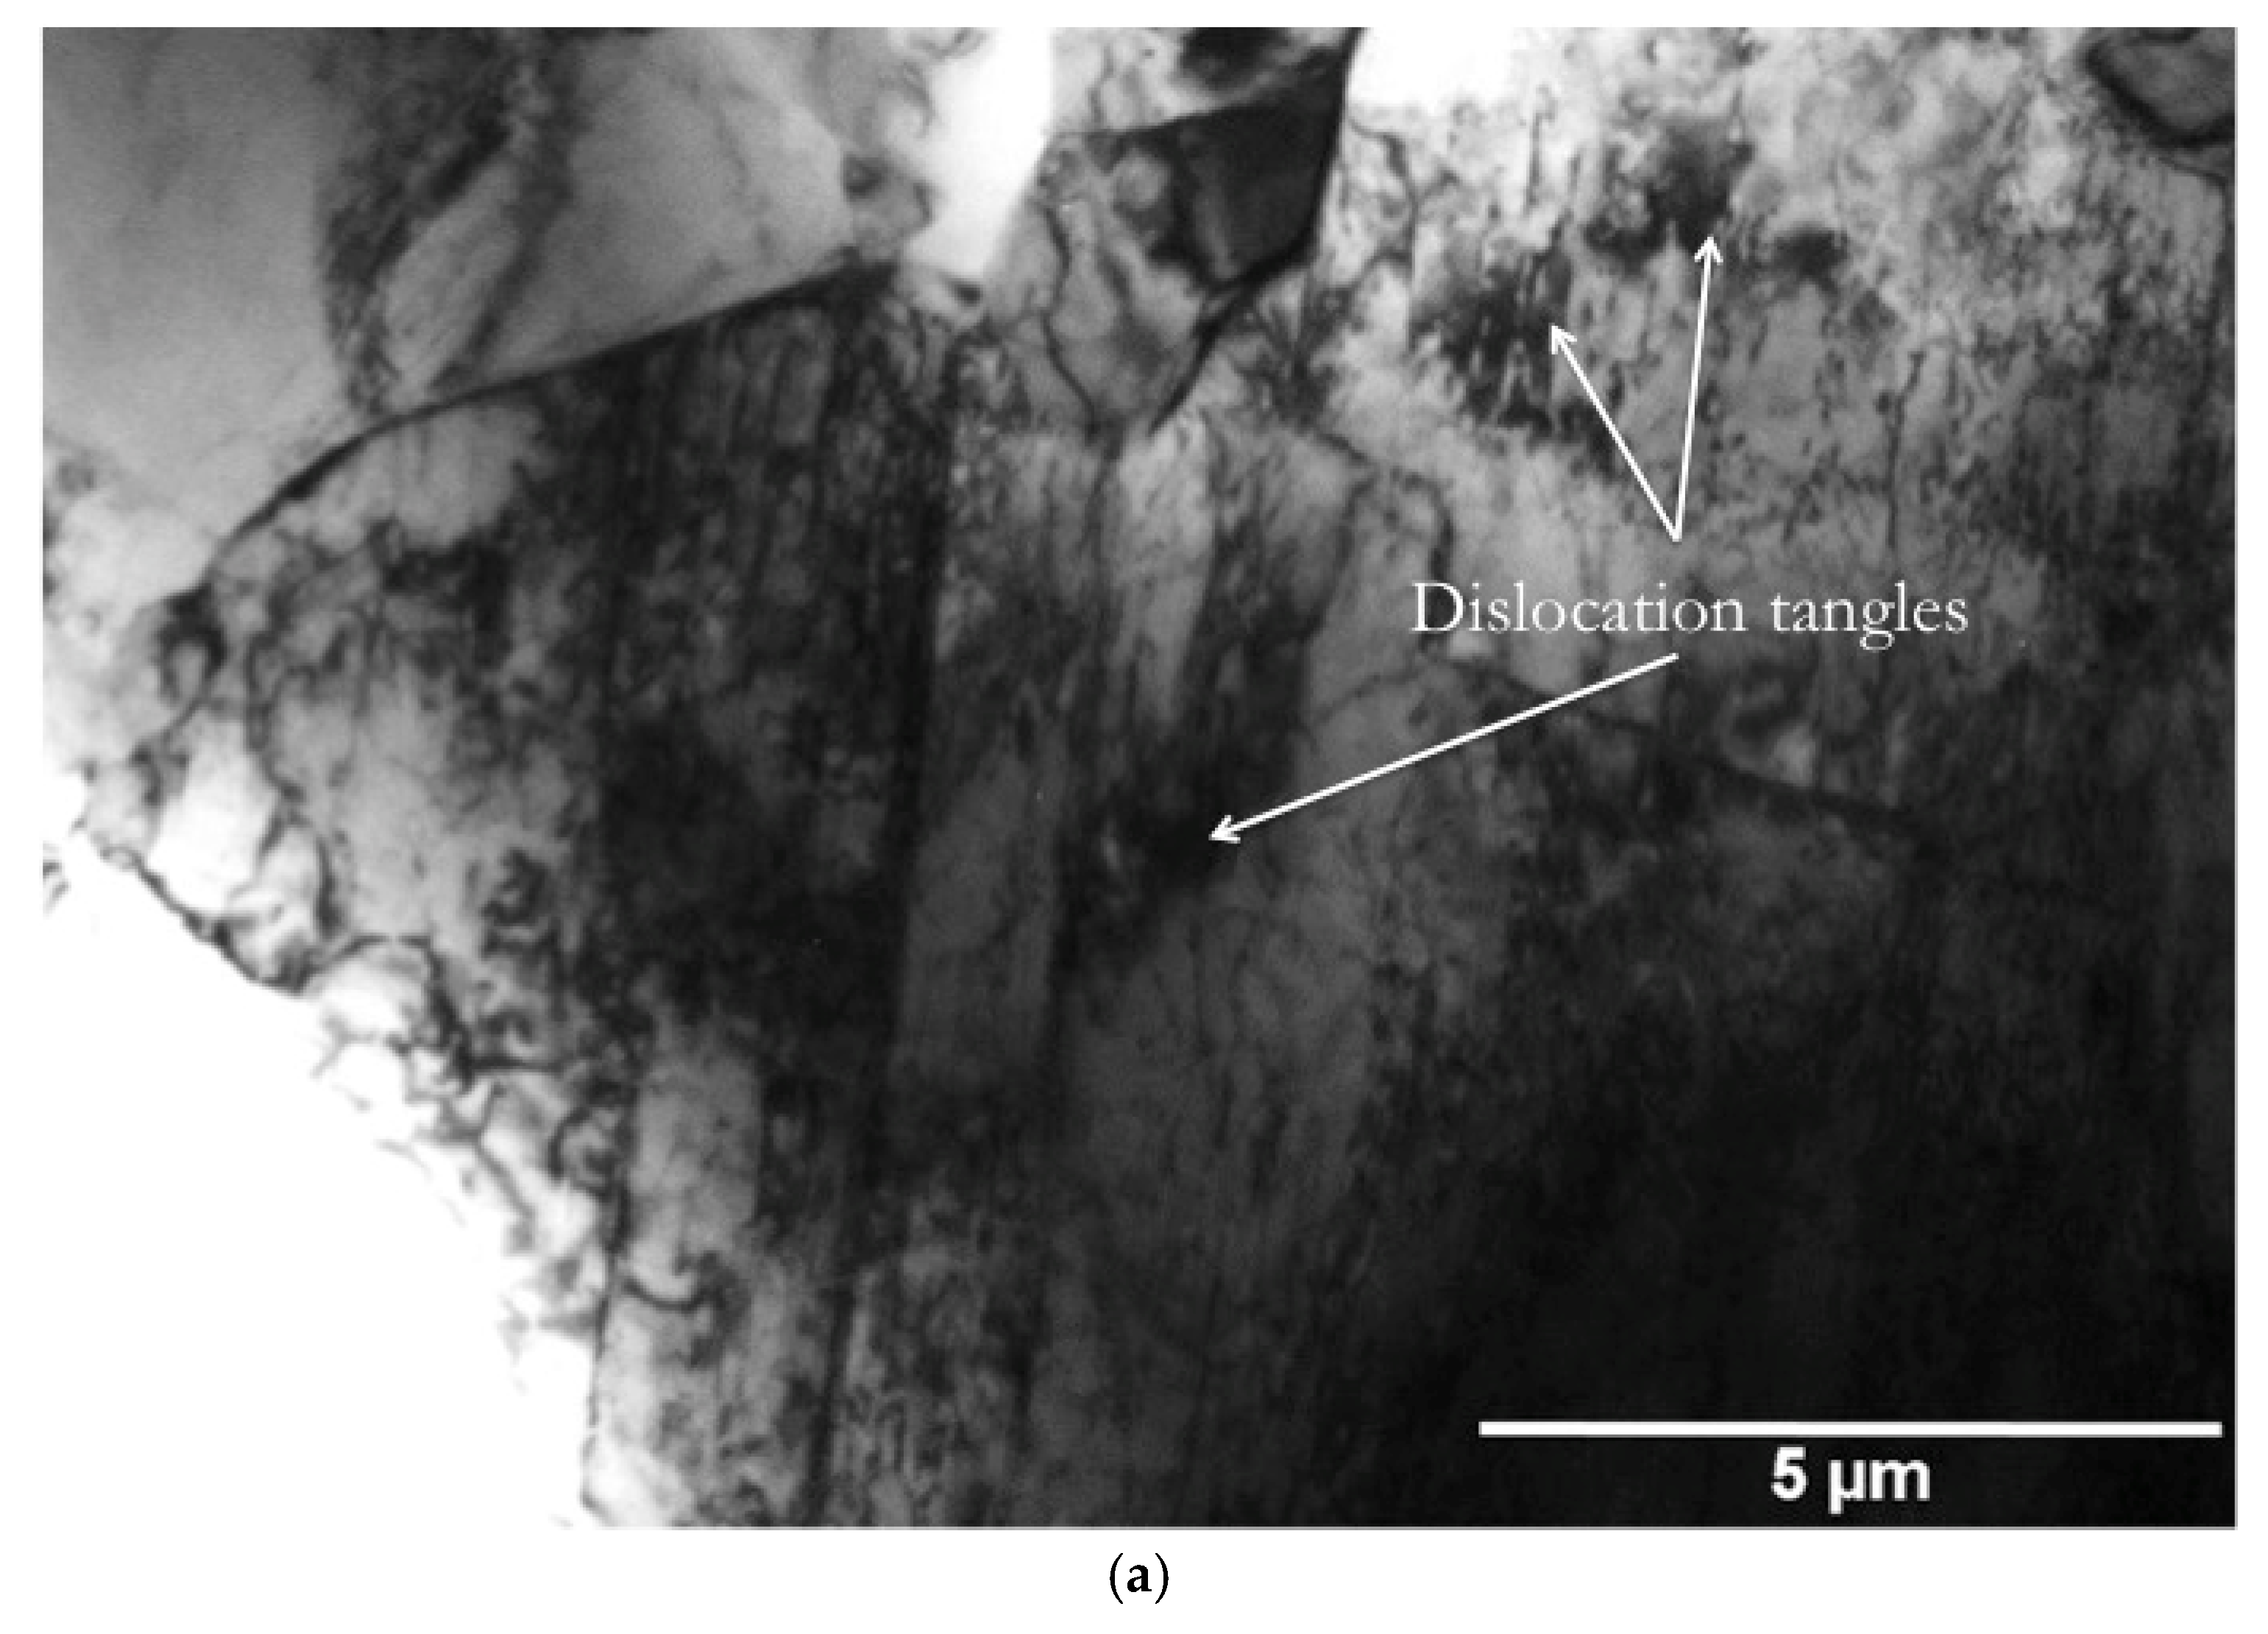
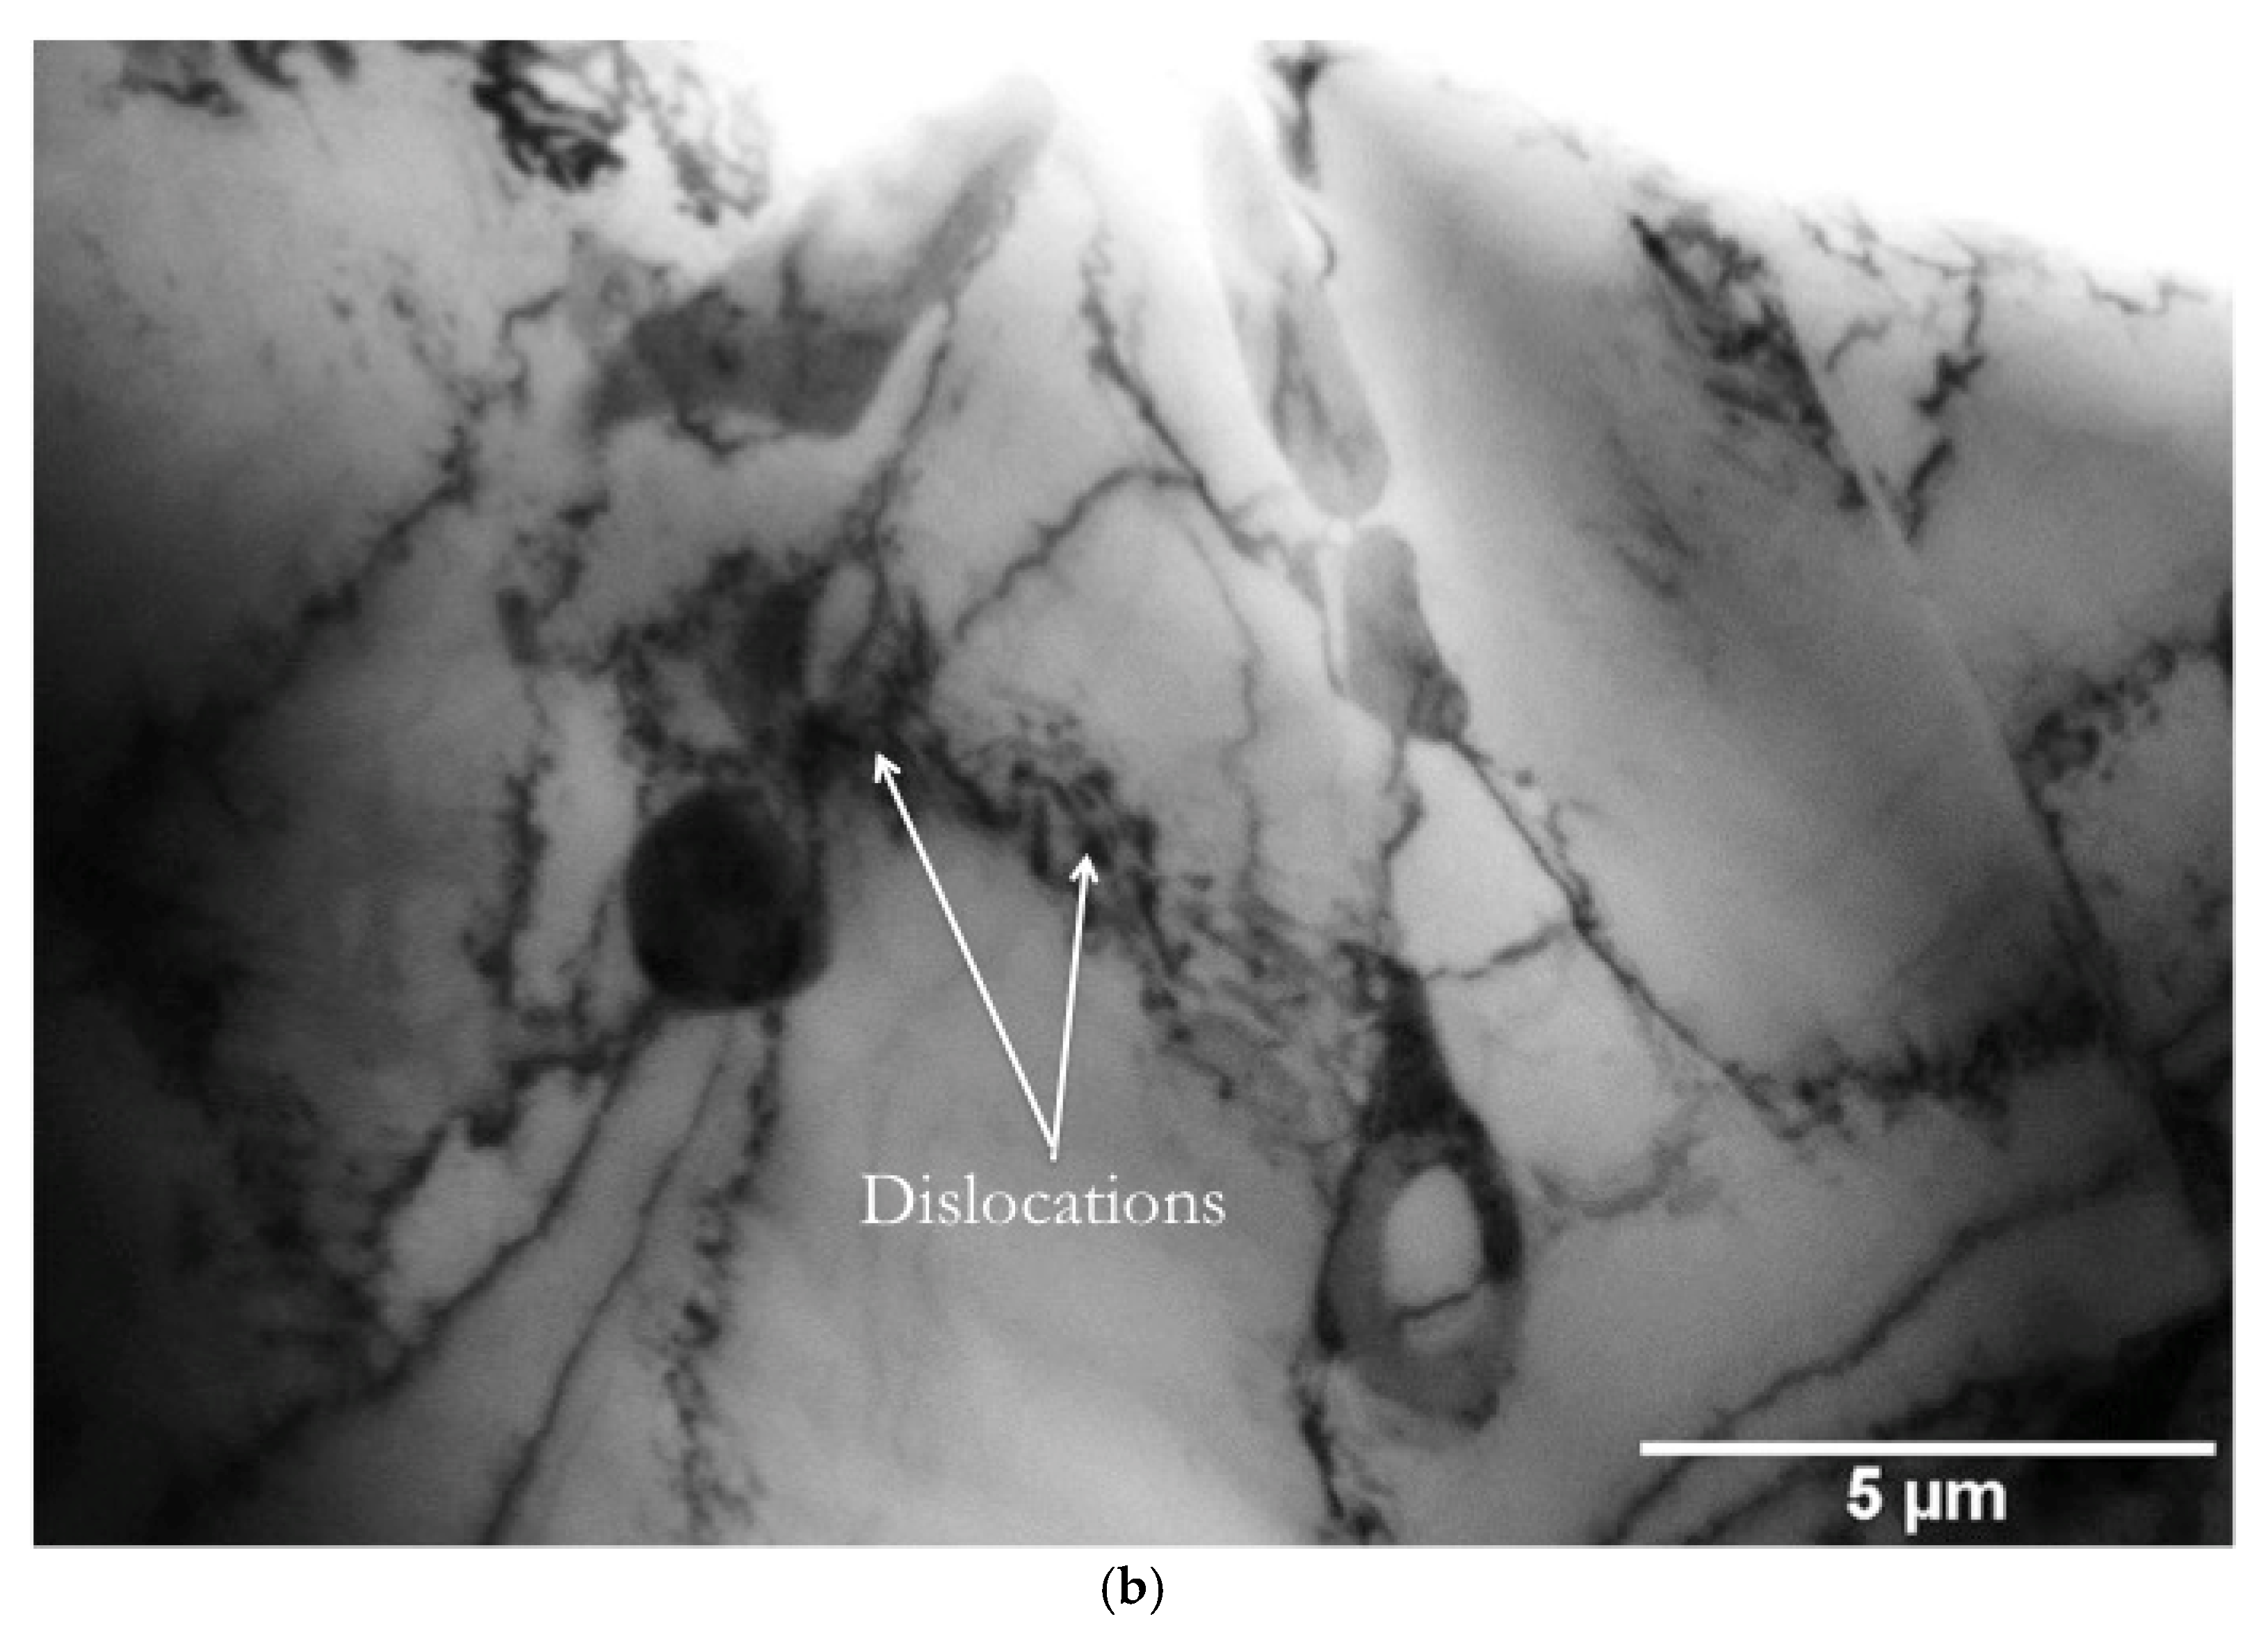
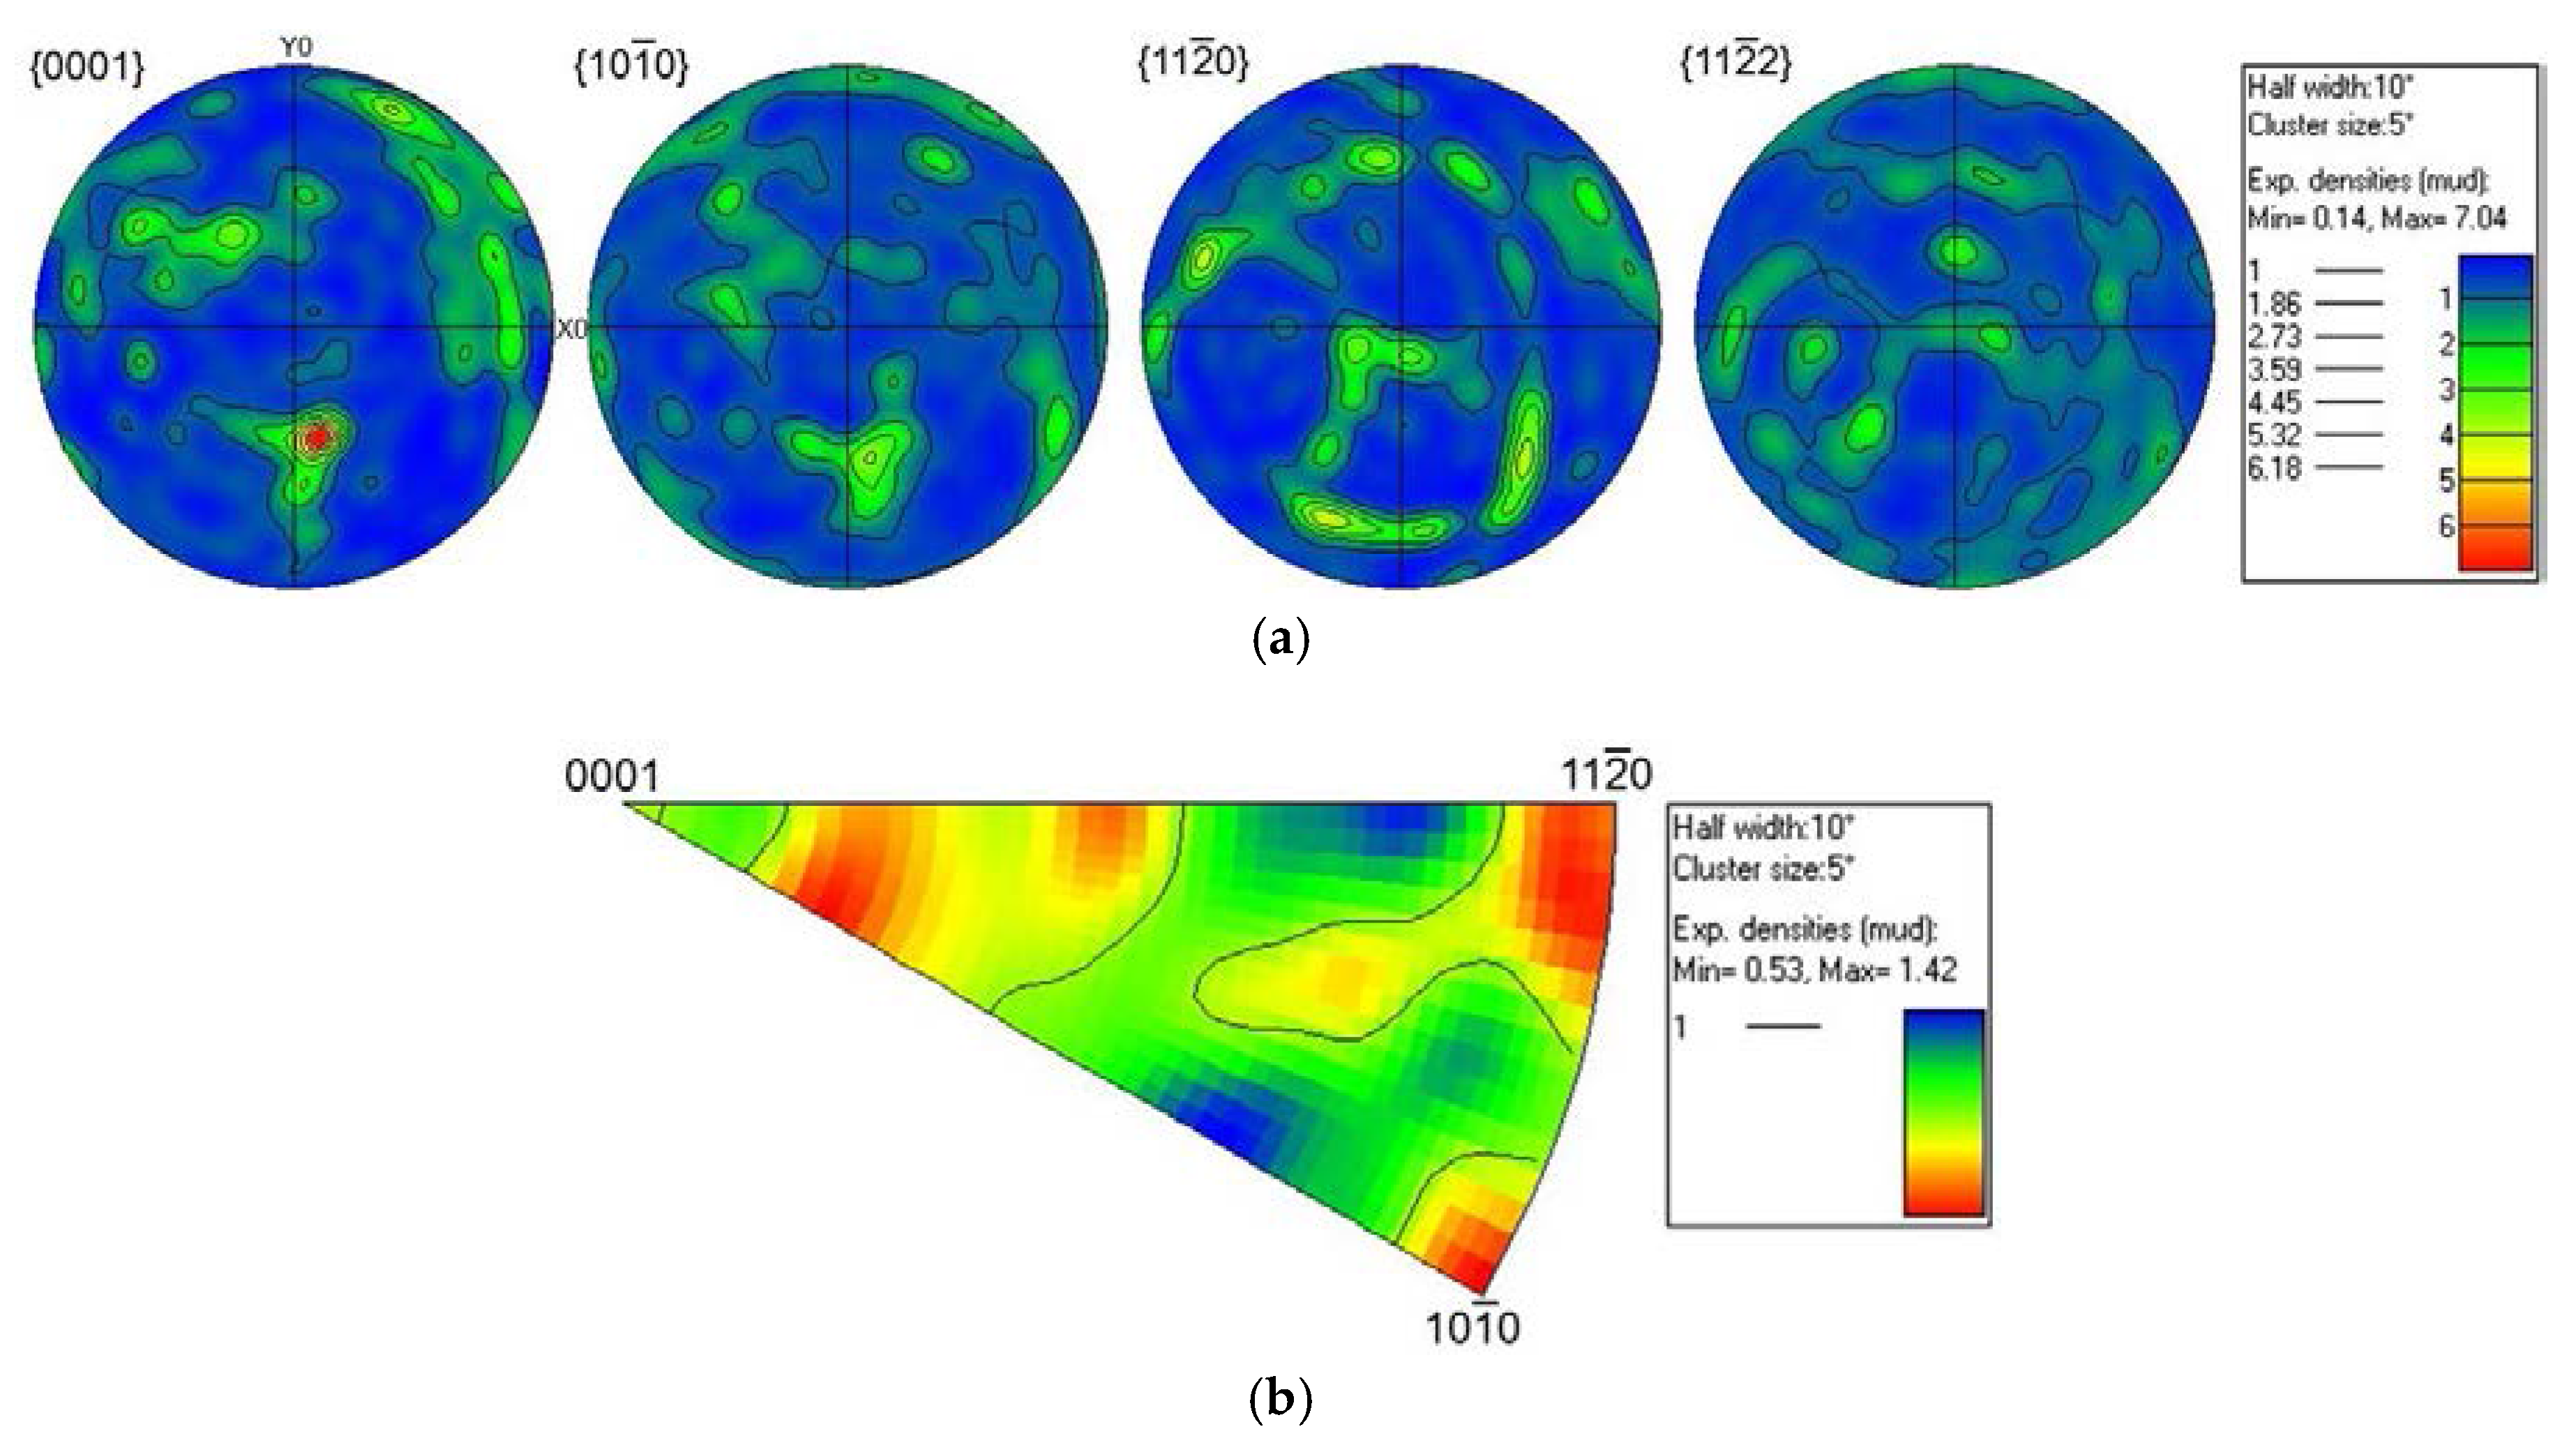
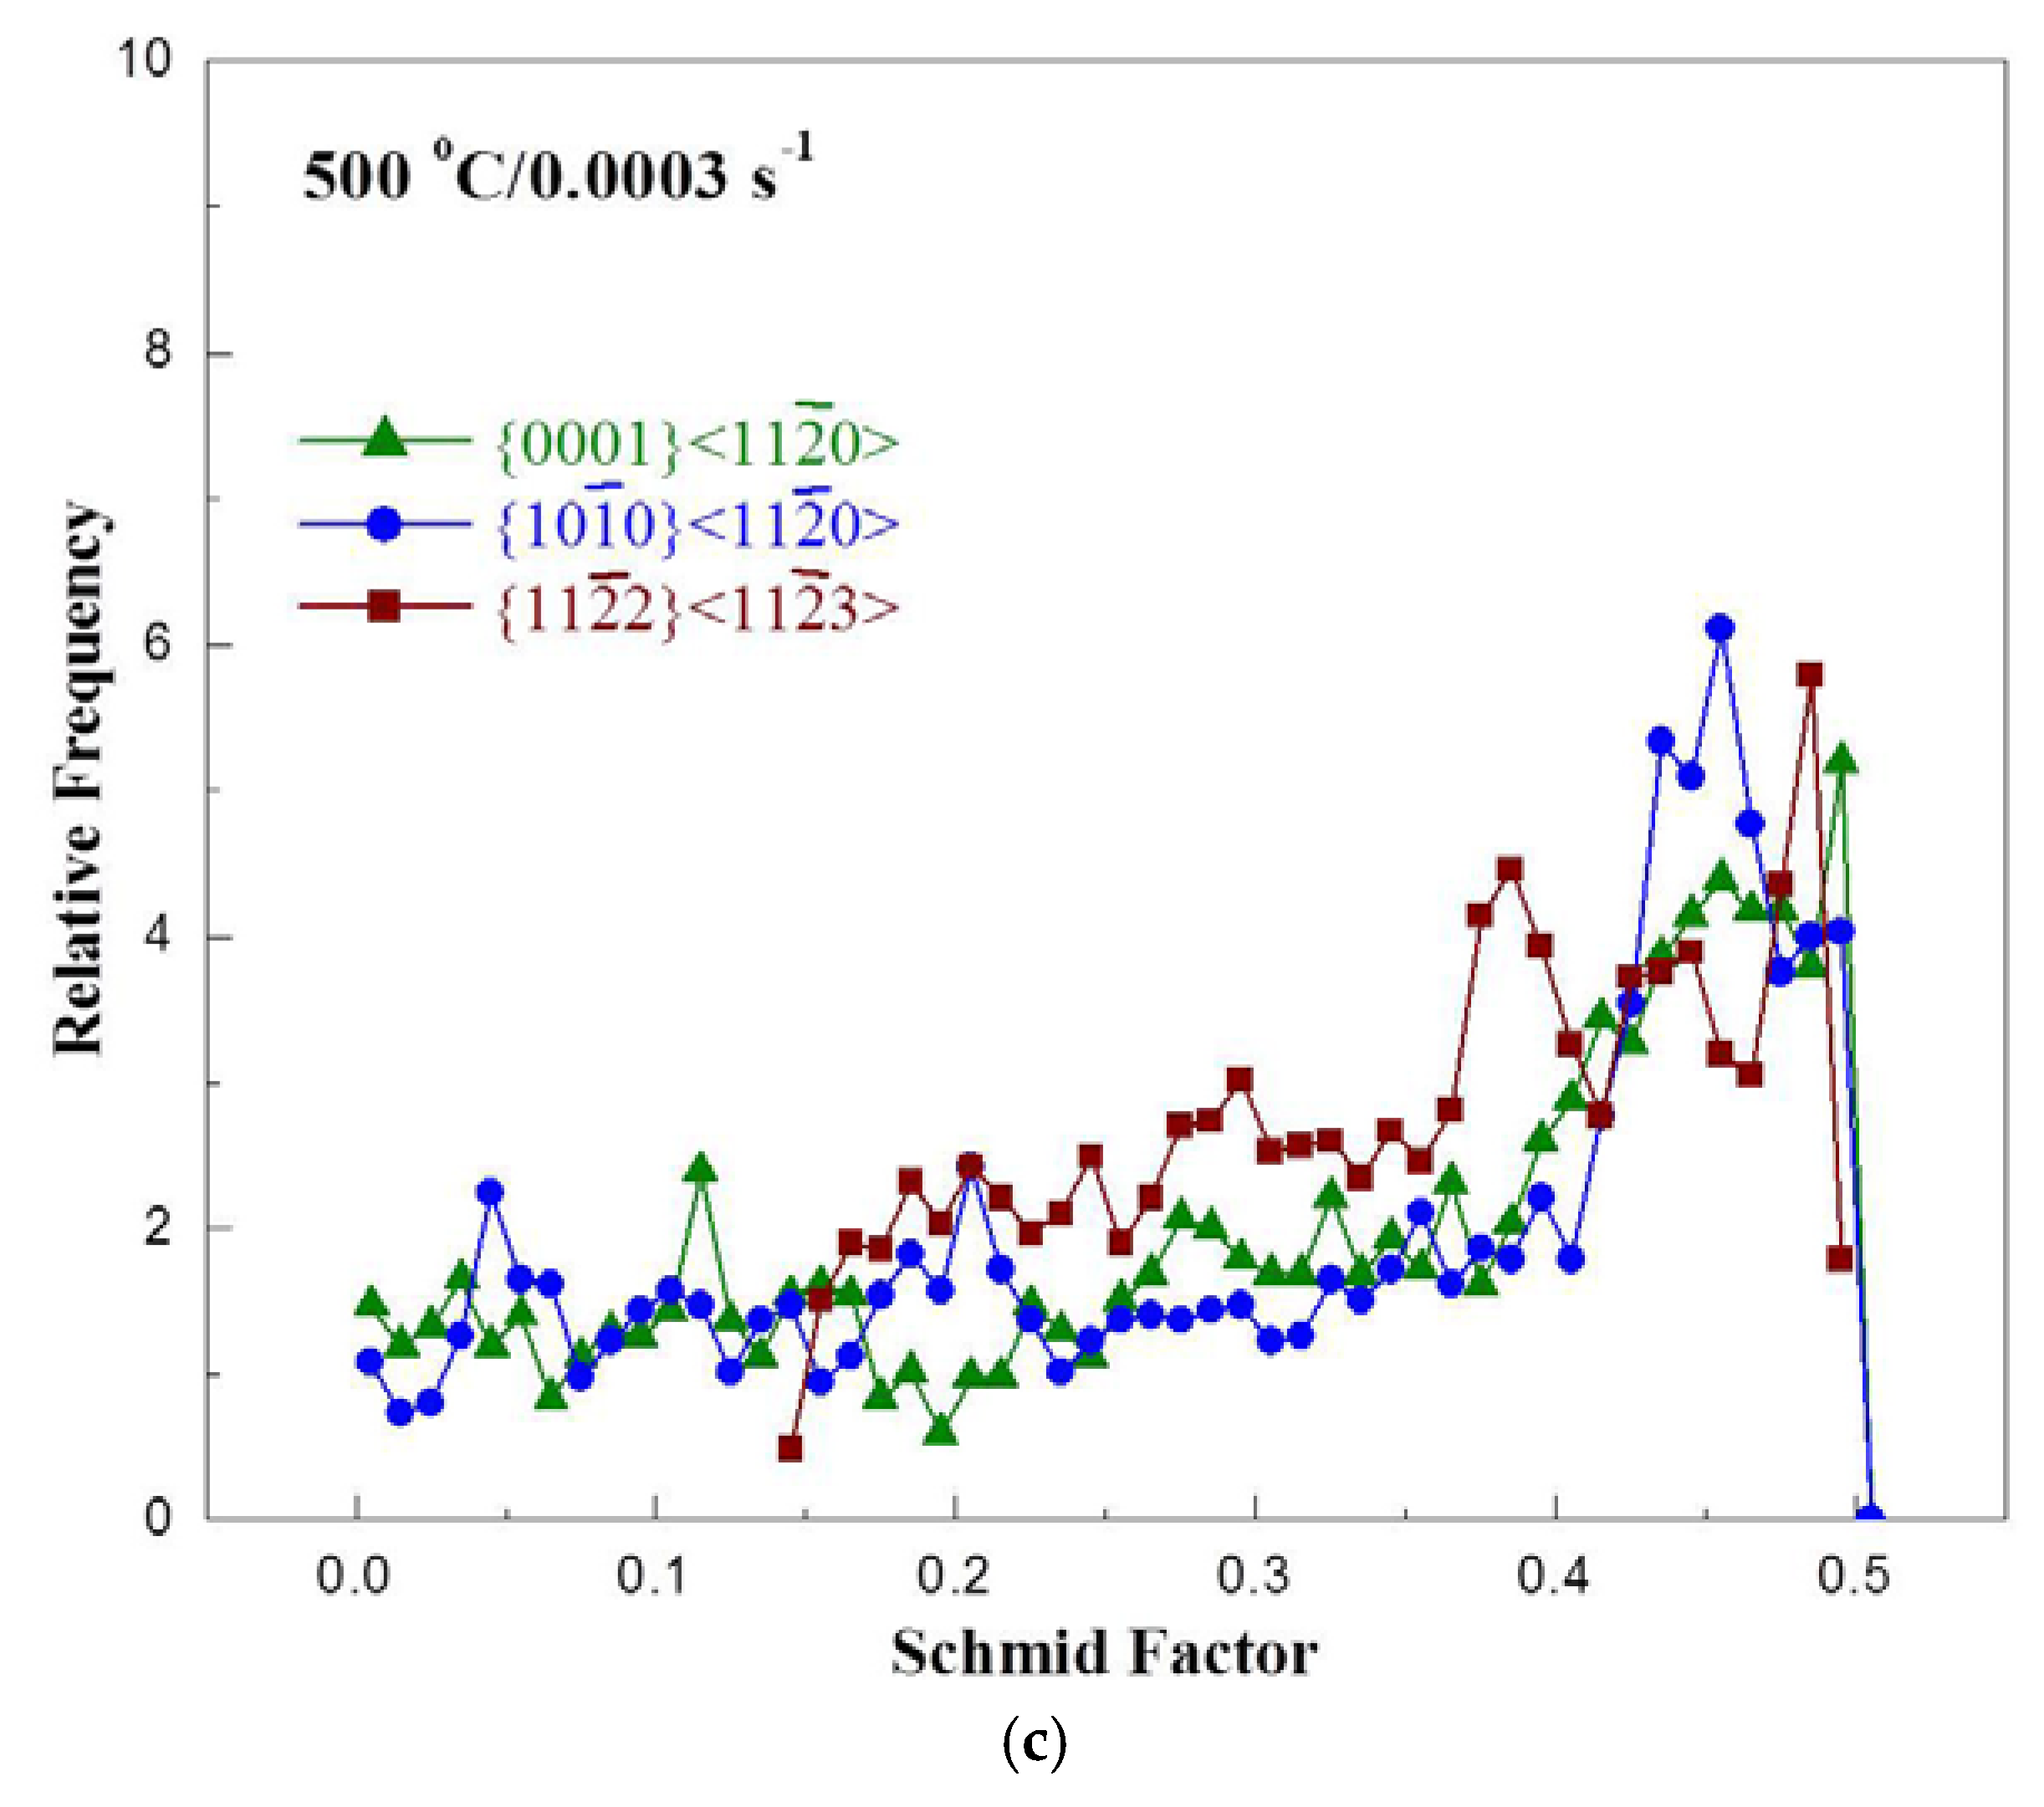
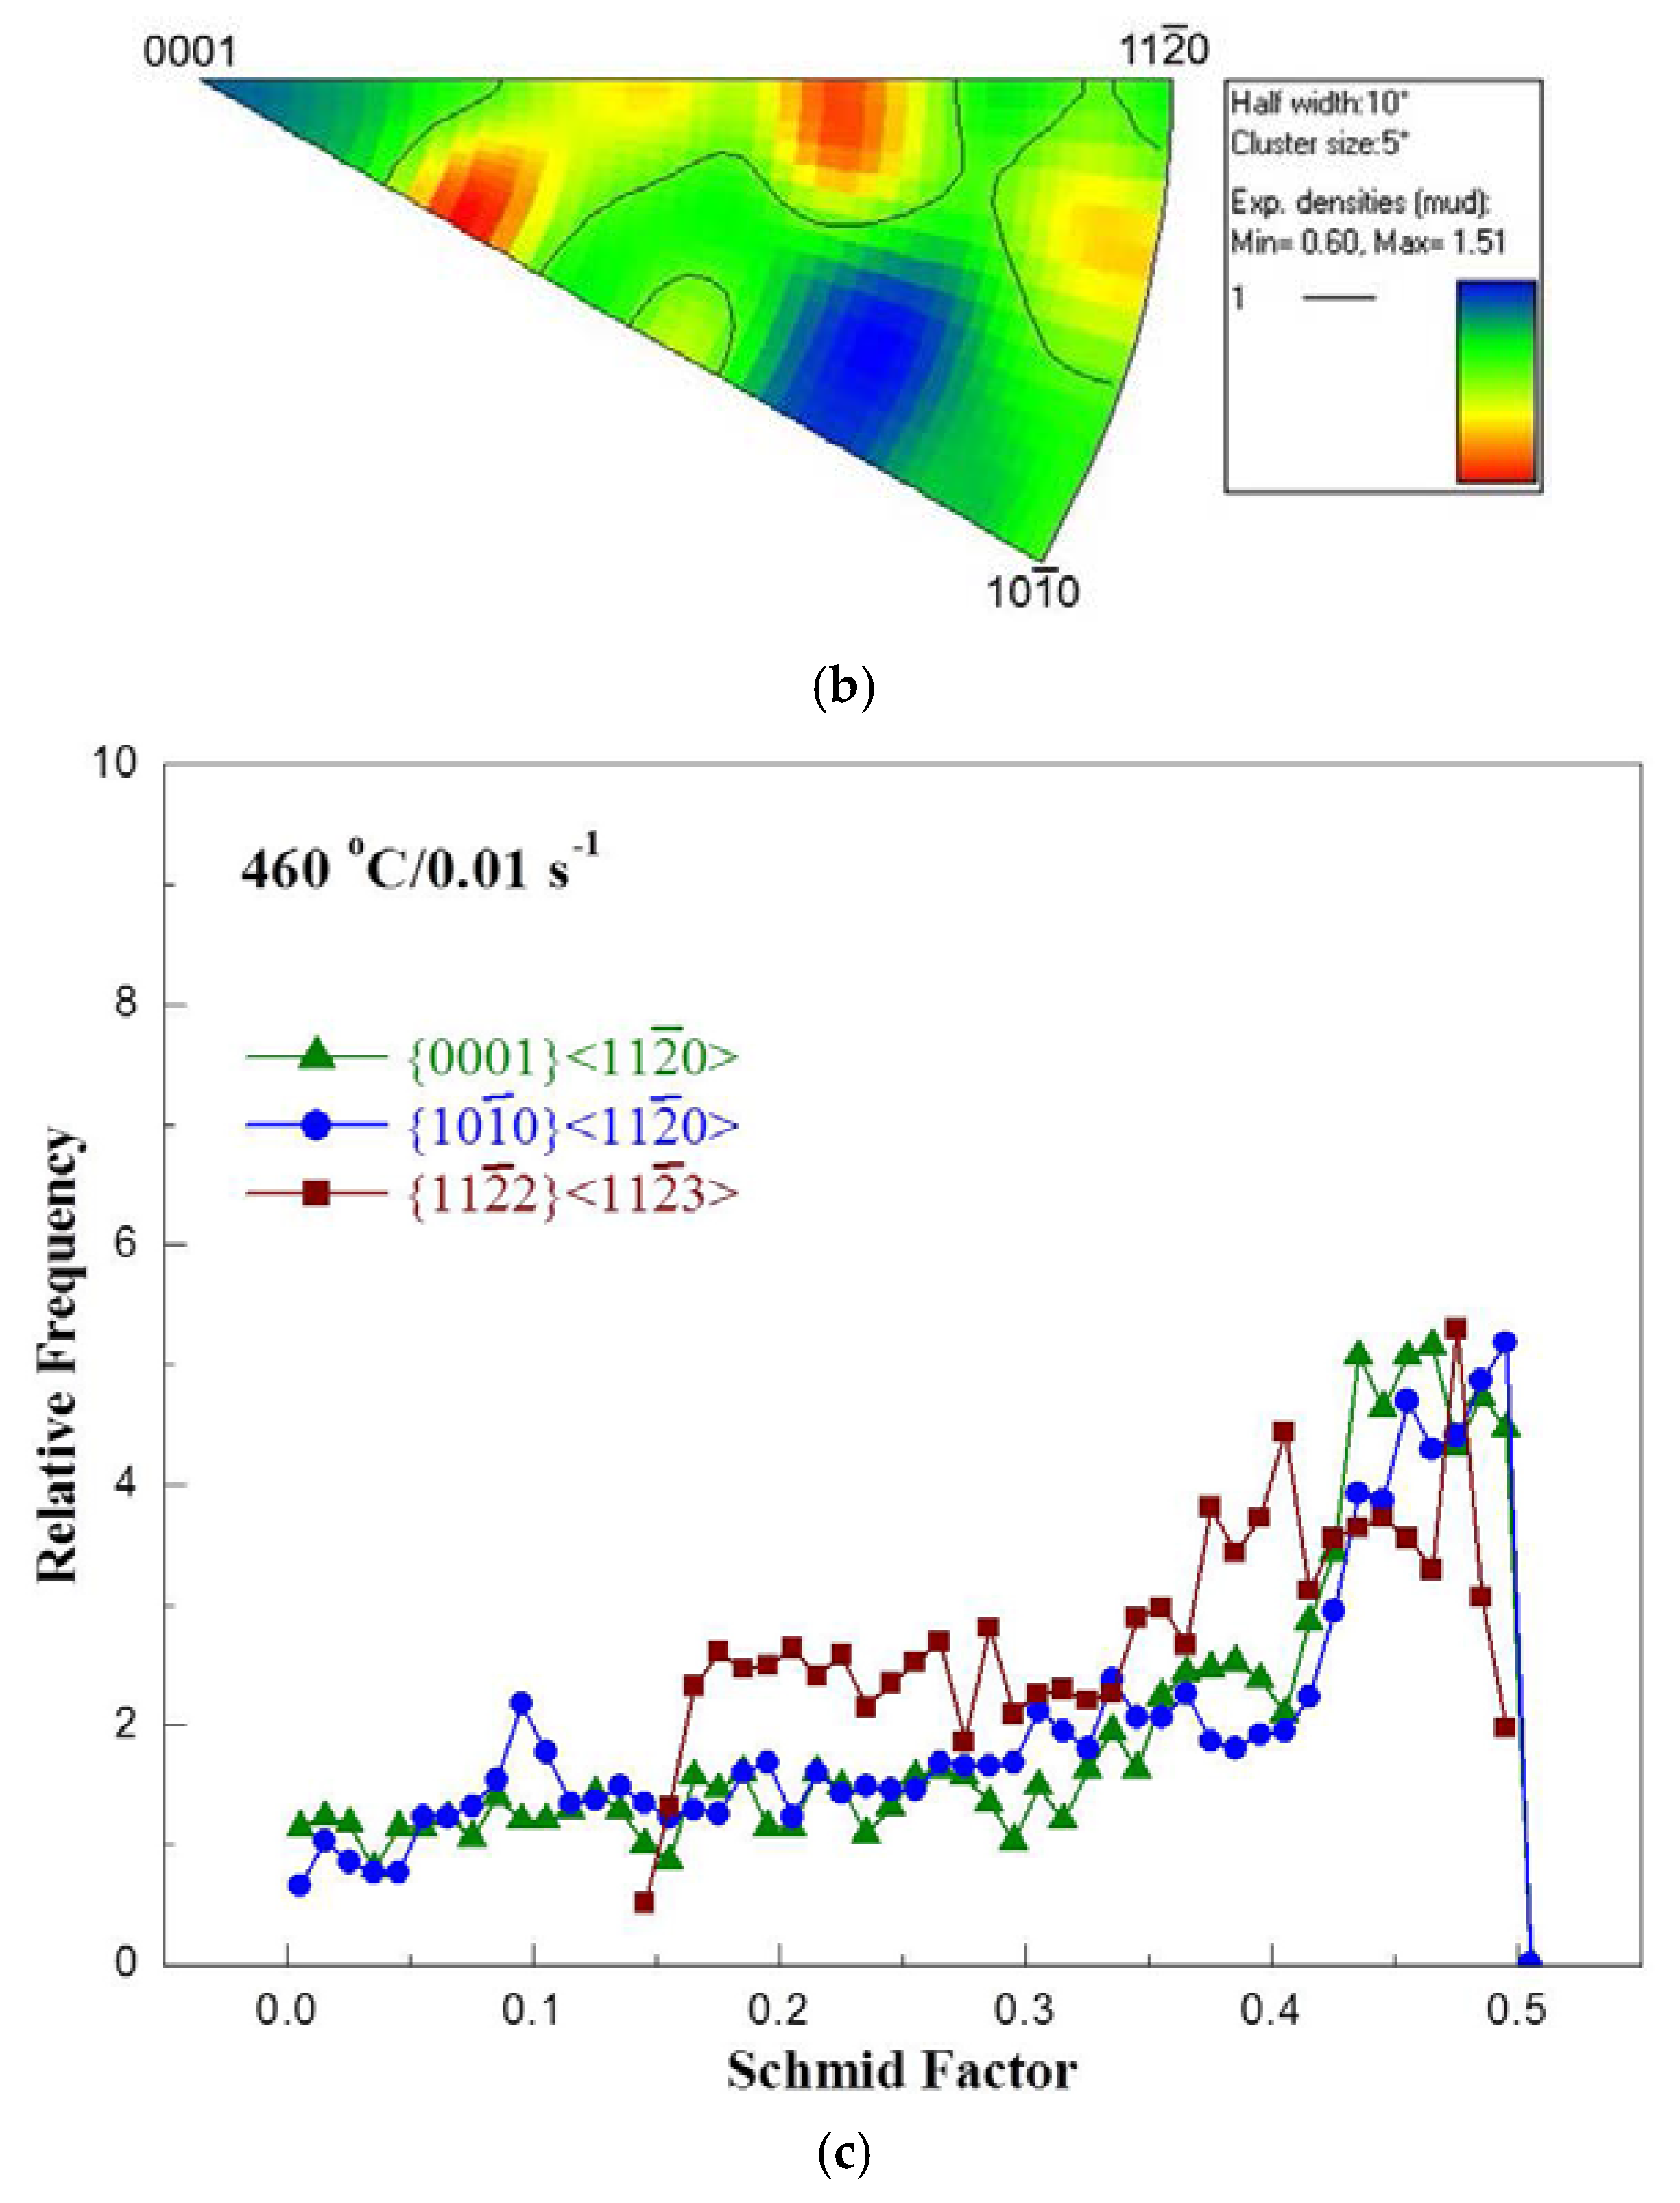
  • In Domain 2, the DRX mechanism involves second order pyramidal slip and associated cross-slip, and the microstructure revealed tangled dislocation structure with twist boundaries and a near-random texture.
  • The large volume content of intermetallic phases Mg21Al3Ba2 and (Al,Mg)2Ca eutectic phase is responsible for the above microstructural and textural changes since it causes high back stress which increases the temperature for thermal recovery by climb in Domain 1 and lowering the strain rate for cross-slip in Domain 2.

Acknowledgments

The research work has been supported by a Strategic Research Grant (No. 7002744) from the City University of Hong Kong. The authors would like to thank to Chi Hung Yuen, Chalasani Dharmendra, and Ho Ying Ip for their help in compression tests, EBSD analysis, and microstructure work, respectively.

Author Contributions

Kalidass Suresh and Kamineni Pitcheswara Rao have performed the experimental work, analysis of the data, and writing of the paper; Yellapregada Venkata Rama Krishna Prasad has contributed to the aspects related to the processing map, microstructure, and texture analysis, and writing of the paper; Chi-Man Lawrence Wu has contributed towards the TEM work; and Norbert Hort and Hajo Dieringa have developed the alloy and its initial characterization.

Conflicts of Interest

The authors declare no conflict of interest.

References

  1. Jabbari Taleghani, M.A.; Torralba, J.M. Hot deformation behavior and workability characteristics of AZ91 magnesium alloy powder compacts—A study using processing map. Mater. Sci. Eng. A 2013, 580, 142–149. [Google Scholar] [CrossRef] [Green Version]
  2. Chai, F.; Zhang, D.; Li, Y.; Zhang, W. Microstructure evolution and mechanical properties of a submerged friction-stir-processed AZ91 magnesium alloy. J. Mater. Sci. 2015, 50, 3212–3225. [Google Scholar] [CrossRef]
  3. Ai, X.; Quan, G. The recent research on properties of anti-high temperature creep of AZ91 magnesium alloy. In Magnesium Alloys—Design, Processing and Properties; Czerwinski, F., Ed.; InTech: Rijeka, Croatia, 2011; pp. 351–366. ISBN 978-953-307-520-4. [Google Scholar]
  4. Pekguleryuz, M.; Celikin, M. Creep resistance in magnesium alloys. Int. Mater. Rev. 2010, 55, 197–217. [Google Scholar] [CrossRef]
  5. Yin, D.D.; Wang, Q.D.; Boehlert, C.J.; Ding, W.J. Creep and fracture behavior of as-cast Mg-11Y-5Gd-2Zn-0.5Zr (wt %). J. Mater. Sci. 2012, 47, 6263–6275. [Google Scholar] [CrossRef]
  6. Hort, N.; Huang, Y.D.; Abu Leil, T.; Rao, K.P.; Kainer, K.U. Properties and processing of magnesium-tin-calcium alloys. Kovove Mater. 2011, 49, 163–177. [Google Scholar] [CrossRef]
  7. Dharmendra, C.; Rao, K.P.; Zhao, F.; Prasad, Y.V.R.K.; Hort, N.; Kainer, K.U. Effect of aluminum on microstructural evolution during hot deformation of TX32 magnesium alloy. J. Mater. Sci. 2014, 49, 5885–5898. [Google Scholar] [CrossRef]
  8. Dieringa, H.; Hort, N.; Kainer, K.U. Barium as alloying element for a creep resistant magnesium alloy. In Magnesium, Proceedings of the 8th International Conference on Magnesium Alloys and Their Applications, Weimar, Germany, 26–29 October 2009; Kainer, K.U., Ed.; Wiley-VCH: Weinheim, Germany, 2009; pp. 62–67. [Google Scholar]
  9. Dieringa, H.; Huang, Y.; Wittke, P.; Klein, M.; Walther, M. Compression-creep response of magnesium alloy DieMag422 containing barium compared with the commercial creep-resistant alloys AE42 and MRI230D. Mater. Sci. Eng. A 2013, 585, 430–438. [Google Scholar] [CrossRef]
  10. Nayeb-Hashemi, A.A.; Clark, J.B. The Ba-Mg (Barium-Magnesium) system. Bull. Alloy Phase Diagr. 1986, 7, 144–149. [Google Scholar] [CrossRef]
  11. Bryan, Z.L.; Hooper, R.J.; Henderson, H.B.; Manuel, M.V. Solidification pathways of alloys in the Mg-rich corner of the Mg-Al-Ba ternary system. Metall. Mater. Trans. A 2015, 46, 1689–1696. [Google Scholar] [CrossRef]
  12. Rao, K.P.; Ip, H.Y.; Suresh, K.; Prasad, Y.V.R.K.; Wu, C.M.L.; Hort, N.; Kainer, K.U. Compressive strength and hot deformation mechanisms in as-cast Mg-4Al-2Ba-2Ca (ABaX422) alloy. Philos. Mag. 2013, 93, 4364–4377. [Google Scholar] [CrossRef]
  13. Dharmendra, C.; Rao, K.P.; Prasad, Y.V.R.K.; Hort, N.; Kainer, K.U. Hot workability analysis with processing map and texture characteristics of as-cast TX32 magnesium alloy. J. Mater. Sci. 2013, 48, 5236–5246. [Google Scholar] [CrossRef]
  14. Rao, K.P.; Suresh, K.; Prasad, Y.V.R.K.; Dharmendra, C.; Hort, N.; Dieringa, H. High temperature strength and hot working technology for as-cast Mg-1Zn-1Ca (ZX11) alloy. Metals 2017, 7, 405. [Google Scholar] [CrossRef]
  15. Suresh, K.; Rao, K.P.; Prasad, Y.V.R.K.; Hort, N.; Kainer, K.U. Microstructure and mechanical properties of as-cast Mg-Sn-Ca alloys and effect of alloying elements. Trans. Nonferr. Met. Soc. China 2013, 23, 3604–3610. [Google Scholar] [CrossRef]
  16. Prasad, Y.V.R.K.; Seshacharyulu, T. Modelling of hot deformation for microstructural control. Int. Mater. Rev. 1998, 43, 243–258. [Google Scholar] [CrossRef]
  17. Prasad, Y.V.R.K. Processing maps: A status report. J. Mater. Eng. Perform. 2003, 12, 638–645. [Google Scholar] [CrossRef]
  18. Fatemi-Varzaneh, S.M.; Zarei-Hanzaki, A.; Izadi, S. Shear deformation and grain refinement during accumulative back extrusion of AZ31 magnesium alloy. J. Mater. Sci. 2011, 46, 1937–1944. [Google Scholar] [CrossRef]
  19. Ravichandran, N.; Prasad, Y.V.R.K. Characteristics of dynamic recrystallization domain in the processing map for hot working of OFHC copper. Z. Met. 1993, 34, 132–139. [Google Scholar]
  20. Sastry, D.H.; Prasad, Y.V.R.K.; Vasu, K.I. On the stacking fault energy of some close packed hexagonal metals. Scr. Metall. 1969, 3, 927–929. [Google Scholar] [CrossRef]
  21. Morris, J.S.; Scharff, J.; Ho, K.M.; Turner, D.E.; Ye, Y.Y.; Yoo, M.H. Prediction of a {11 2 ¯ 2} hcp stacking fault using a modified generalized stacking fault calculation. Philos. Mag. A 1997, 76, 165–177. [Google Scholar] [CrossRef]
  22. Thomas, G. Transmission Electron Microscopy of Metals; John Wiley: New York, NY, USA, 1962. [Google Scholar]
  23. Thomas, G.; Washburn, J. Electron Microscopy and Strength of Crystals; John Wiley: New York, NY, USA, 1963. [Google Scholar]
Figure 1. (a) SEM-EDS (SEM: Scanning Electron Microscopy; EDS: Energy Dispersive X-Ray Spectroscopy) map of the initial microstructure consisting of the ternary phase Mg21Al3Ba2 and the lamellar eutectic phase (Al,Mg)2Ca; (b) elemental image maps; and (c) texture of the as-cast ABaX422 alloy.
Metals 07 00539 g001aMetals 07 00539 g001b
Figure 2. Processing map for the ABaX422 (Mg-4Al-2Ba-2Ca) alloy obtained at a strain of 0.6. The numbers associated with the contours indicate the efficiency of the power dissipation in percent through microstructural changes occurring during deformation.
Metals 07 00539 g002
Figure 3. Optical microstructures of the ABaX422 alloy deformed at (a) 340 °C/0.0003 s−1 (peak efficiency condition); (b) 300 °C/0.0003 s−1; and (c) 380 °C/0.0003 s−1, corresponding to Domain 1.
Metals 07 00539 g003aMetals 07 00539 g003b
Figure 4. Transmission electron micrographs of specimen deformed at 340 °C/0.0003 s−1 (peak efficiency condition for Domain 1) showing (a) planar slip with high dislocation density, and (b) the polygonized sub-structure with tilt boundaries.
Metals 07 00539 g004
Figure 5. Texture measurements on specimen deformed at 340 °C/0.0003 s−1 (peak efficiency condition for Domain 1): (a) pole figures; (b) inverse pole figures; and (c) Schmid factor distribution.
Metals 07 00539 g005
Figure 6. Optical microstructure of the ABaX422 alloy deformed at 500 °C/0.0003 s−1 (peak efficiency condition for Domain 2).
Metals 07 00539 g006
Figure 7. Transmission electron micrographs of specimen deformed at 500 °C/0.0003 s−1 (peak efficiency condition for Domain 2) showing (a) tangled-up dislocations, and (b) twist-type sub-structure boundaries.
Metals 07 00539 g007aMetals 07 00539 g007b
Figure 8. Texture measurements on specimen deformed at 500 °C/0.0003 s−1 (peak efficiency condition for Domain 2): (a) pole figures; (b) inverse pole figures; and (c) Schmid factor distribution.
Metals 07 00539 g008aMetals 07 00539 g008b
Figure 9. Optical microstructure of the ABaX422 alloy deformed at 460 °C/0.01 s−1 (in Domain 2).
Metals 07 00539 g009
Figure 10. Texture measurements on specimen deformed at 460 °C/0.01 s−1 (in Domain 2): (a) pole figures; (b) inverse pole figures; and (c) Schmid factor distribution.
Metals 07 00539 g010aMetals 07 00539 g010b
Figure 11. Processing map for Mg-3Sn-2Ca (TX32) alloy obtained at a strain of 0.6. The numbers associated with the contours indicate efficiency in percent.
Metals 07 00539 g011

