Fracture Resistance of 14Cr ODS Steel Exposed to a High Temperature Gas
by
 , ,
, ,
Anna Hojna
1,* ,
,
Jan Michalicka
2,
Hynek Hadraba
3,
Fosca Di Gabriele
1,
Jan Duchon
1,
Lucia Rozumova
1 and
Roman Husak
3 1
Centrum Vyzkumu Rez s.r.o., UJV Group, Rez 130, 250 68 Husinec, Czech Republic
2
CEITEC BUT, Brno University of Technology, Purkynova 123, 616 69 Brno, Czech Republic
3
CEITEC IPM, Institute of Physics of Materials, Academy of Sciences of the Czech Republic, Zizkova 22, 616 62 Brno, Czech Republic
*
Author to whom correspondence should be addressed.
Metals 2017, 7(12), 560; https://doi.org/10.3390/met7120560
Submission received: 31 October 2017
/
Revised: 4 December 2017
/
Accepted: 8 December 2017
/
Published: 12 December 2017
(This article belongs to the Special Issue Fracture Behaviour of Innovative Materials under Different Enviromental Conditions)
Abstract
:This paper studies the impact fracture behavior of the 14%Cr Oxide Dispersion Strengthened (ODS) steel (ODM401) after high temperature exposures in helium and air in comparison to the as-received state. A steel bar was produced by mechanical alloying and hot-extrusion at 1150 °C. Further, it was cut into small specimens, which were consequently exposed to air or 99.9% helium in a furnace at 720 °C for 500 h. Impact energy transition curves are shifted towards higher temperatures after the gas exposures. The transition temperatures of the exposed states significantly increase in comparison to the as-received steel by about 40 °C in He and 60 °C in the air. Differences are discussed in terms of microstructure, surface and subsurface Scanning Electron Microscope (SEM) and Transmission Electron Microscope (TEM) observations. The embrittlement was explained as temperature and environmental effects resulting in a decrease of dislocation level, slight change of the particle composition and interface/grain boundary segregations, which consequently affected the nucleation of voids leading to the ductile fracture.
1. Introduction
Oxide dispersion strengthened (ODS) steels belong to a class of nanostructured ferritic alloys (NFA) which have been developed for high temperature application in the power industry [1,2,3]. Especially, the ferritic 14–16%Cr ODS steels are promising candidates for the usage in internal structures of nuclear reactors due to their high strength, excellent radiation, and oxidation resistance [4]. However, present NFAs show acceptable fracture toughness (i.e., higher than 100 MPa) values at lower temperatures up to 300 °C [1,5] as well as its decrease with increasing temperature. At higher temperatures, i.e., above 700 °C, the fracture resistance of NFAs is lower than the one of ferritic-martensitic (FM) steels [5]. Moreover, ductile-to-brittle transition temperature (DBTT), which is typically around −80 °C [5] in FM steels, is shifted towards higher temperatures in NFAs. In addition, there is a risk that the high-temperature aging during the long-term service might lead to the drastic changes in the material behavior.
The 14%Cr ODS steel (ODM401), the variant of MA957 alloy, is one of the ferritic ODS steels recently developed for application in fast breeder reactors [6]. The chemical composition with addition of Ti, Mo, Y, Al, and without W keeps the fracture resistance of the steel relatively high and the transition behavior relatively low in comparison to 14Cr reduced activation ODS steels containing W and without Mo [1,6,7]. Distinctive microstructure texture of ultra-fine grain materials, which stores up large internal strain, and the cohesion of boundaries decreased by segregations are key factors of the fracture mode transition shifted to the higher temperature. In addition, delamination is a part of fracture mechanism of the ODS steels [6]. Hadraba et al. [8] in his study focused on the fracture properties of the 9–18Cr–W–Ti–Y2O3 ODS steels, which have shown an extensive delamination of fracture surface and the significant modification of the impact fracture response due to the reorientation of the fracture plane towards the extrusion direction. The occurrence of delamination consumes plenty of energy and tends to enhance scatter in impact energies [7], especially in case of the crack arrested delamination, i.e., kinking of the fracture at 90° and continuing the fracture path on parallel planes [9].
In the ultra-fine grain materials the existence of a grain boundary segregation can have considerable effect as it was previously described [10] due to the fact that the volume fraction of grain boundaries is a significant part of the microstructure. In a positive sense, the segregation might contribute to the stability of the ultra-fine grain structure in a wide temperature range. On the other hand, the grain boundary cohesion is affected by the segregation of solute elements.
Exposed to the elevated temperatures, the ODS steel can undergo temper aging and, thus, partly loose the original strength and toughness, so the steel surface undergoes enhanced corrosion/oxidation/dissolution. This effect needs more experimental studies since very limited data about its behavior are available [9]. High temperature aging can influence thermal stability of nanoclusters [11]. Long-term aging (5000 h at 700 °C) of 16Cr–1.7W–0.4Ti ODS with coarse Ti-bearing precipitates (about 400 nm) shows that Y2O3 particles remain almost unchanged and Cr-rich phase segregation is hardly detected [12]. Microstructural changes of the 14Cr steel (ODM401) in response to the extremely high temperature heat treatment (1 h exposure at 1300 °C) have been observed. Especially, the growth of fine particles average size from 2 to 5 nm and a good stability of the average grain size are detected [13]. Some disagreement in aging behavior because of different manufacturing conditions is expected due to the ongoing development of these materials.
This paper studies the fracture resistance of the 14Cr ODS steel after relatively short exposure to elevated temperature gas environments. The exposure condition is selected as 720 °C in helium gas, based on the reference cooling condition of the US Dual Coolant (He and PbLi) Lead Lithium (DCLL) test blanket module concept [14] and the close to gas fast reactor (GFR) concept [15]. The second environment, the normal air, is chosen to simulate exposure to an accident situation. The effect of these conditions is further investigated by means of high resolution Transmission Electron Microscope (TEM) microscopy. Moreover, the fracture behavior is studied by means of impact testing, a preferable technique when the size and amount of available test material are limited. In this work, the fracture response of samples with and without built-up oxide layers is also examined.
2. Materials and Methods
2.1. Material
The ferritic 14Cr ODS steel (ODM401) was produced by mechanical alloying process by Dour Metal, Dour, Belgium. Commercially available atomized powders were mixed in exact proportions processed in the high energy ball mills for 24 h in a low pressure air atmosphere. The degassed powder was cold pressed to a compact pellet. Consequently, a rod of 30 mm in diameter was hot-extruded at 1150 °C from the pellet. The chemical composition of the steel is listed in Table 1. It contains results of chemical analyses: C was determined by combustion on a Leco CS844 device (Leco, Saint Joseph, MO, USA)—Heating of the sample in an atmosphere of pure oxygen and subsequent analysis of the flue gas by infrared absorption; O and N were determined by an extraction method using Horiba EMGA830 device (Horiba, Kyoto, Japan)—The melting of the sample in a graphite crucible with a helium atmosphere; the other elements using emission spectral chemical analysis.
The microstructure of the 14Cr ODS steel was studied previously, as referred elsewhere [6,9]. The as-extruded bar microstructure contained ultra-fine grains, about 0.4 µm in average, elongated with the ratio of about 1:(5–10) in the extrusion direction. Moreover, there was a small number of porosity-cavities organized into short chains (about 200 μm in length) along the extrusion direction. Y–Ti–O particles of diverse sizes were observed, average sizes of coarser and smaller particles are about 10–20 nm and 2–3 nm, respectively. The described microstructure is, thus, referred to the as-received (AR) state.
2.2. Exposure in Gas Environments
The specimens machined from the hot-extruded rod (Figure 1) were exposed to two gas environments. The exposures in the air and helium were performed at once using flow high-temperature furnace (Clasic, Revnice, Czech Republic) at 720 °C for 500 h. The input gas was 99.9% He, at 5 × 10² kPa pressure and a flow velocity of 5–10 mL/min. The furnace was sealed by a steel-carbon sealing Spiratem (Temac, Zverinek, Czech Republic). A titanium foam was inserted into the furnace to absorb the residual oxygen impurities. This state is denominated as He720. In the second exposure, the furnace was filled with laboratory air at atmospheric pressure. The state is denominated as Air720. There were 8 specimens exposed in helium and 2 × 8 specimens exposed in the air.
2.3. Specimens
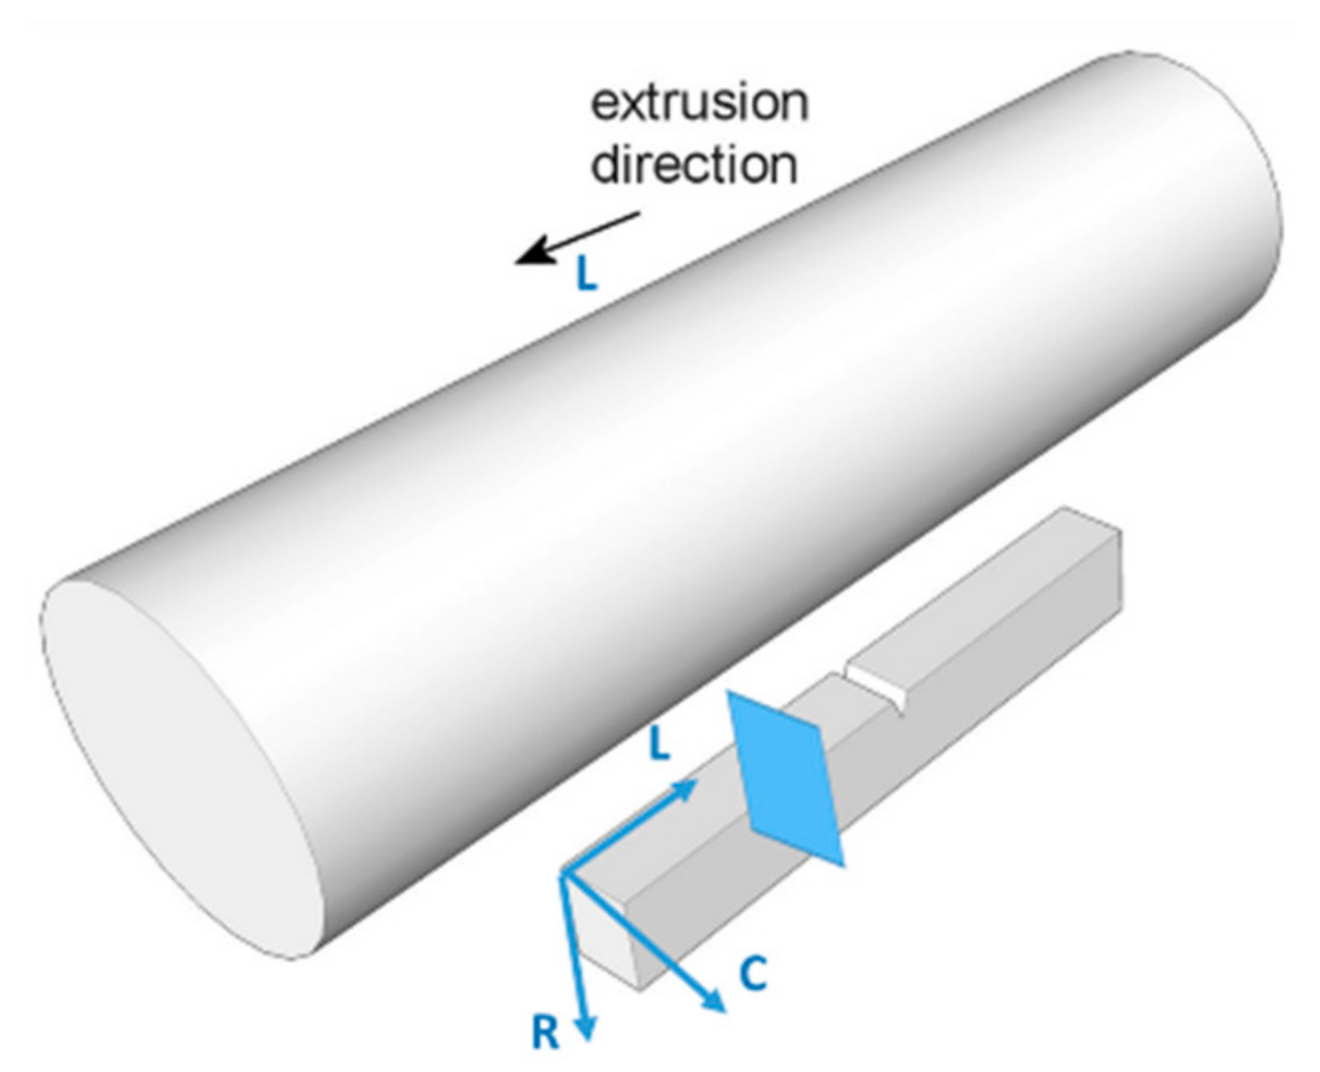
Mini Charpy (KLST) specimens (width = 4 mm, thickness = 3 mm and length = 27 mm) were machined according to the DIN 50115 standard with L–R orientation (L–R—longitudinal/length–radial crack plane) with respect to the extrusion direction L, as is show in Figure 1. The notch radius was 60 µm.
2.4. Mechanical Testing
The impact tests were conducted in the temperature range between −180 °C to +20 °C according to the standards EN 10045-1, ISO 148 and EN ISO 14556 using a B5113.303 (Zwick/Roell, Ulm, Germany) instrumented pendulum of 15 J capacity at an impact velocity of 3.85 m·s−1. Impact energy transition curves (the impact energy (J) as a function of the temperature (°C)) were reproduced from the impact energies recorded for 6–16 specimens. Ductile to Brittle Transition Temperature (DBTT) was evaluated as the midpoint between LSE (Lower Shelf Energy) value and USE (Upper Shelf Energy) value of the impact energy. Vickers hardness HV 0.01 was measured in sections of Mini Charpy (KLST) specimens using the micro-hardness tester VMHT 002V (Walter Uhl technische Mikroskopie, Asslar, Germany).
2.5. Microscopy
The TEM foils were prepared from the test specimens sectioned after the impact tests. The 3 mm TEM discs from AR were polished and electro-polished, the ones from He720 and Air720 were dimpled by dimple grinder Model 565 (Gatan, Pleasanton, CA, USA). The dimpled discs were ion (Argon) milled PIPS II Model 695 (Gatan, Pleasanton, CA, USA) for obtaining electron transparent regions.
The microstructure of the steel was observed by the means of optical microscopy, scanning electron microscopy (SEM) Lyra 3 XMH FEG/SEM (Tescan, Brno, Czech Republic) with X-Max80 EDX detector (Oxford Instruments, Abingdon, UK) and transmission electron microscopy (TEM) FEI TITAN Themis 60-300 Cubed with SUPER-X EDX detector (Thermo Fisher Scientific, Eindhoven, The Netherlands). The cavity-bubble density and the average size were determined from SEM micrographs.
3. Results
3.1. Microstructure
The microstructure of the three states of the 14Cr ODS steel was characterized by TEM, focusing on the dislocation microstructure network, grain boundary nature, solute segregation, and dispersed precipitates strengthening matrix of ultra-fine grains (Figure 2).
During TEM observations of the AR material, dislocations with density varying from one grain to another were observed. Generally, the dislocation density was low within ferritic grains, however, dislocations with high density were detected in selected areas of the material (Figure 2a,b). This observation is in agreement with the previous study [6]. In addition, features similar to martensitic phase were observed, which cannot be excluded in the 14Cr steel (Figure 2c). It was shown that the grain boundaries often have a twisted nature in AR condition (Figure 2a), which corresponds with a higher strain level in the material after the extrusion. This feature was frequently observed in the material and was an obstacle for the grain boundary solute segregation measurement along longer boundary segments in the edge-on orientation to the electron beam. Large and fine precipitates are distributed inside the grains and along the grain boundaries.
It was found that for the material under the annealing conditions, He720 and Air720, had a distribution of dislocations in the microstructure with characteristics affected by the process of annealing (Figure 2). However, the features similar to the martensitic phase are negligible and grains with high density of dislocations are rather rare. In He720 and Air720, unlike the AR condition, the grain boundaries have rather straight and untwisted nature, which might indicate a lower strain level in the annealed material. The areas inside the grains contain rather lower dislocations density.
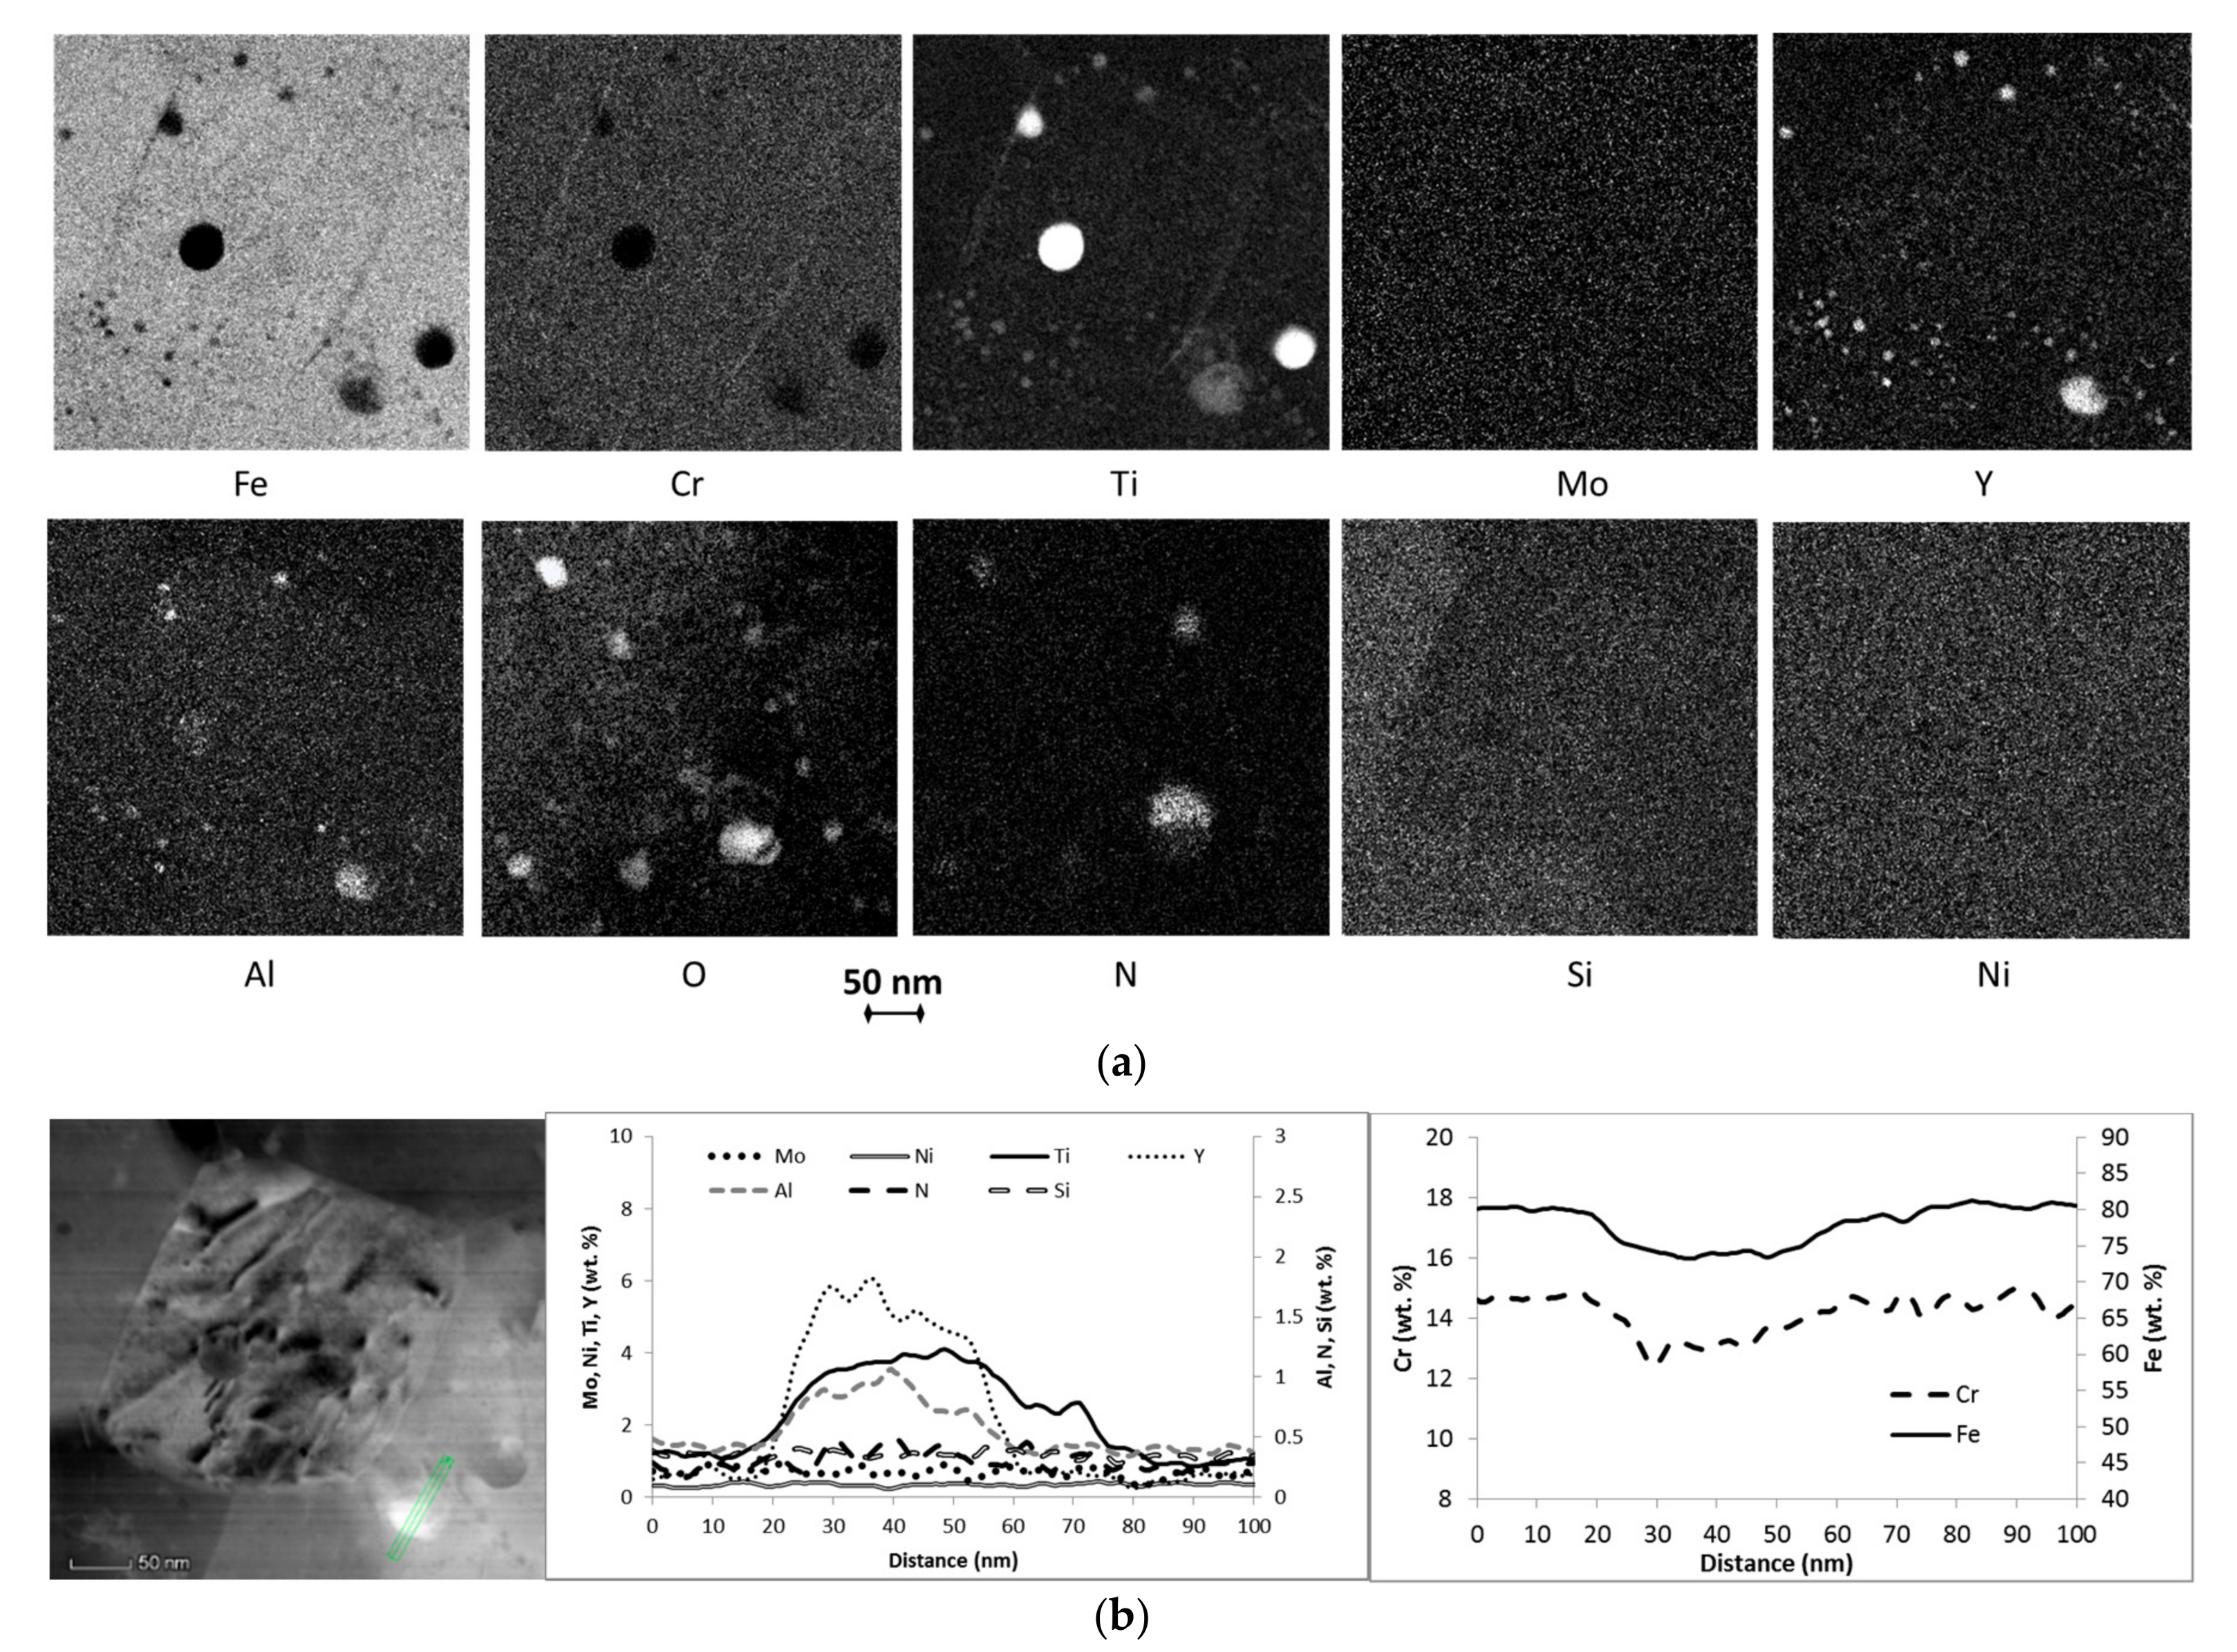
Grain boundaries segregation and a chemical composition of nano-precipitates were studied using Scanning Transmission Electron Microscope-Energy Dispersive X-ray Spectroscopy (STEM-EDX) analysis. It should be noted that solute segregation was measured only at high-angle grain boundaries. Figure 3 and Figure 4 show the analysis of AR material. Two groups of precipitates, i.e., precipitates ranging from very small, about 2 nm, to coarser ones of 10–50 nm in diameter, were observed. The EDX maps in Figure 3 highlight the variable composition and distinguish two types of fine and coarser precipitates, which are located inside the grains and at the grain boundaries of AR material. The coarser ones are enriched with Y–Ti–O–Al and less with N, and depleted with Cr–Fe, the fine ones are enriched mainly with Ti–Y–O. On the maps and EDX line scan in Figure 4, the segregation of Cr, Ti, and likely Mo and Ni at the grain boundaries is clearly visible, while no segregation of Si and Y is detected. The oxygen was not possible to be quantified from EDX analyses because of the oxidation of the foils themselves.
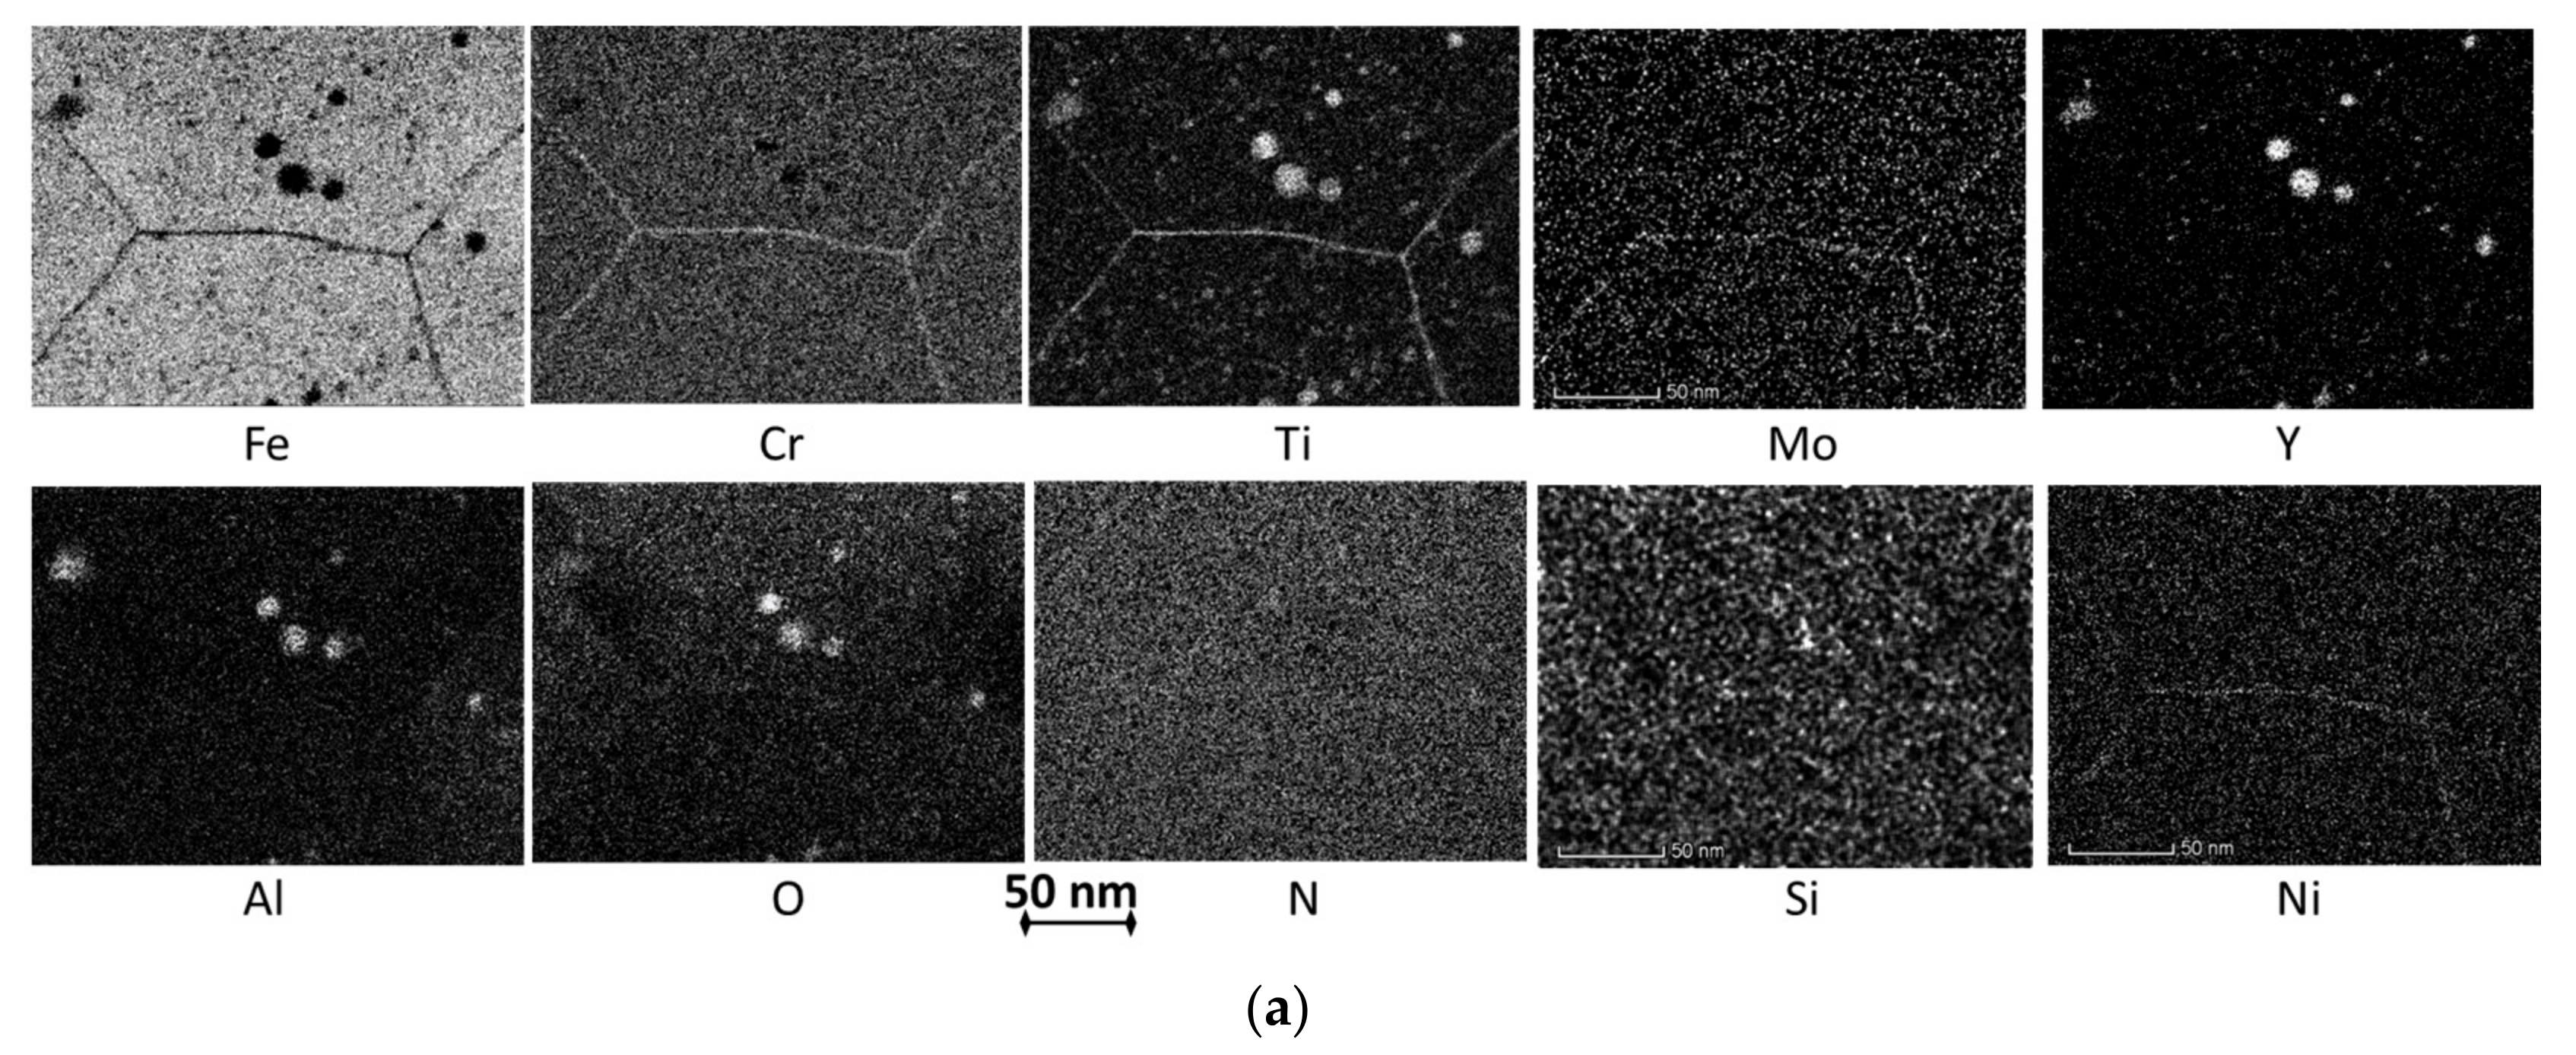
STEM-EDX maps of chemical elements determined in the He720 sample (Figure 5 and Figure 6) show the nano-precipitates of the group of coarser precipitates of about 25 nm in diameter. Ti, Cr, Ni, Mo, and very local O enrichment as well as a resulting Fe depletion at grain boundaries are shown in the maps. High resolution STEM-EDX maps of nano-precipitates and grain boundary of He720 sample (Figure 5) show chemical composition of both groups of precipitates. It can be seen, that each group has slightly different composition. The coarser particles are enriched with Al–Ti–Y–O and some N and Si, while the fine ones are enriched with Ti–Y. Figure 5 maps show the enrichment with Cr, Ti, Ni, Si, and depletion with Fe at the grain boundary. A slight increase of N and O occur on the grain boundary, but the O image might be affected by a selective oxidation of the foil.
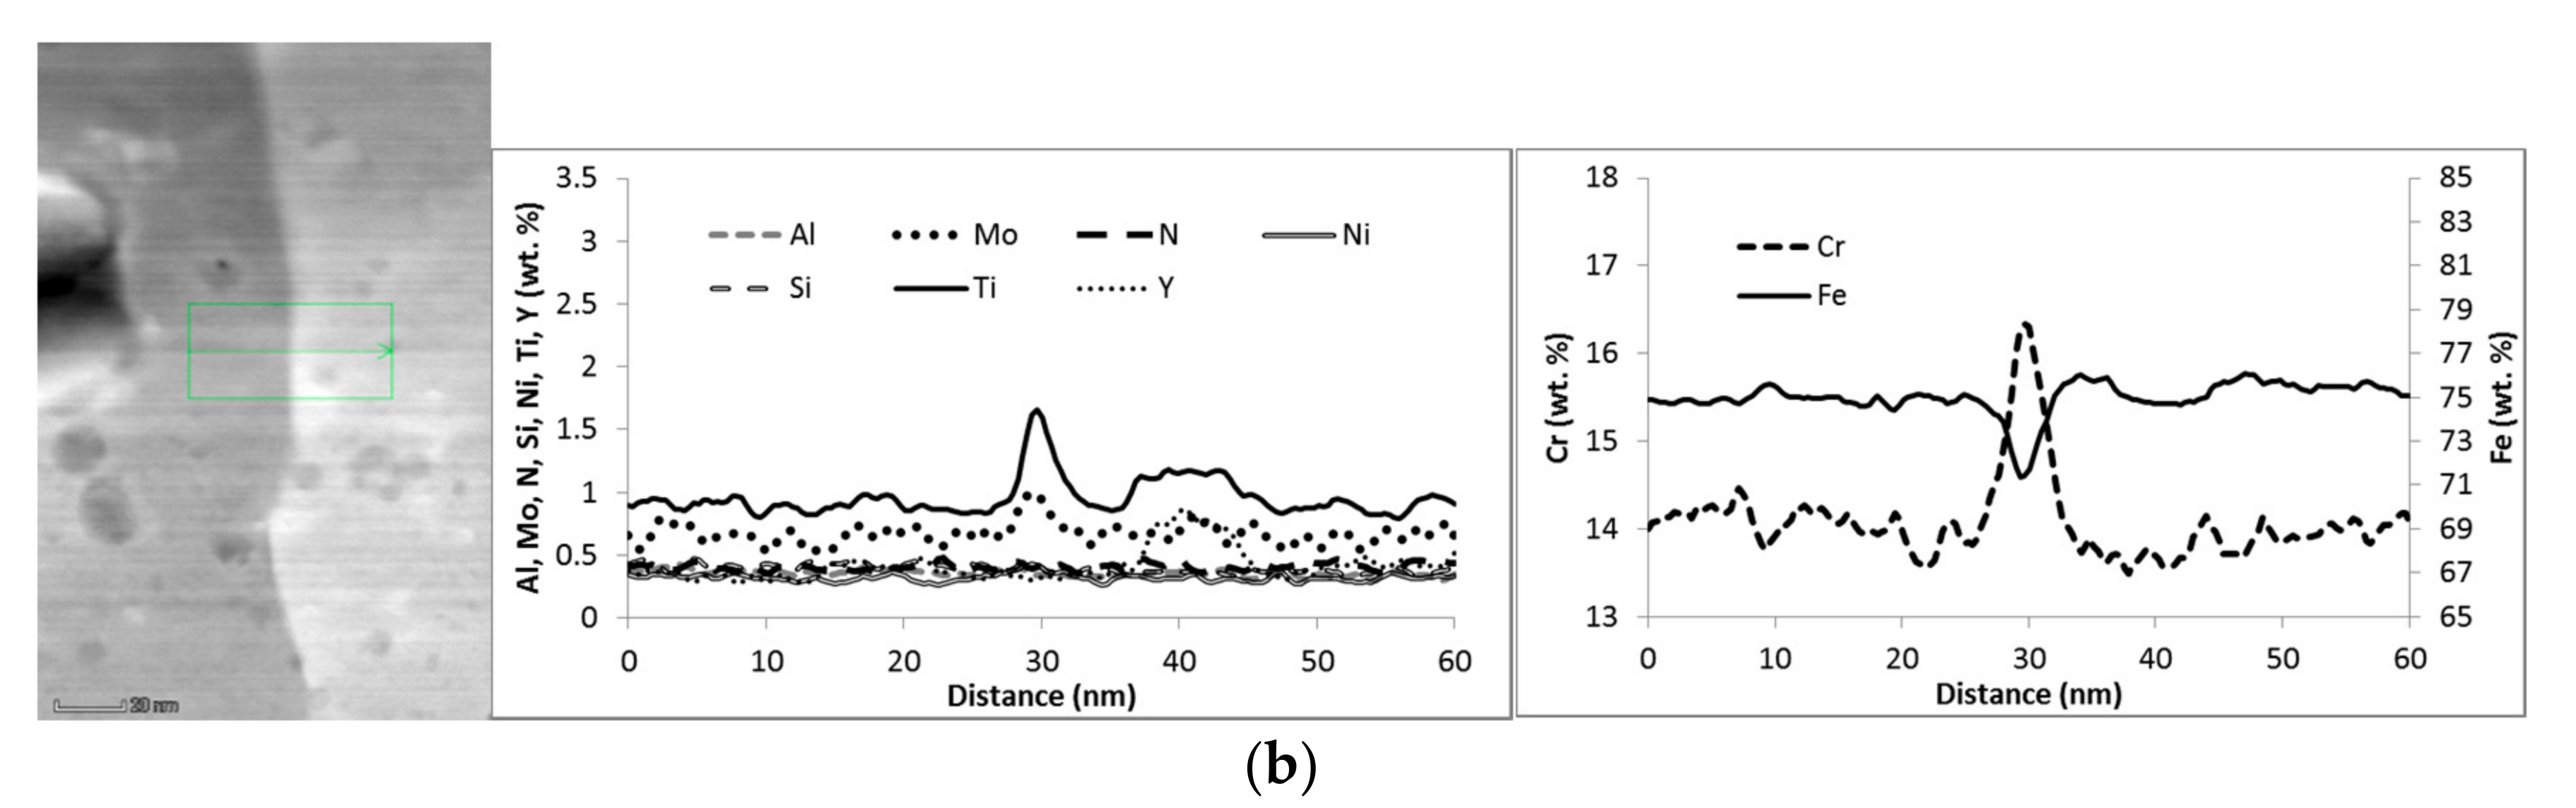
Maps, in Figure 6, show grain boundary enrichment with Cr, Ti, Ni, and slight Mo and depletion with Fe. The curve in Figure 6 represents the occurrence of the grain boundary composition at the position of 30 nm, where the lines show Cr, Ti, and Ni enrichment and depletion of Fe.
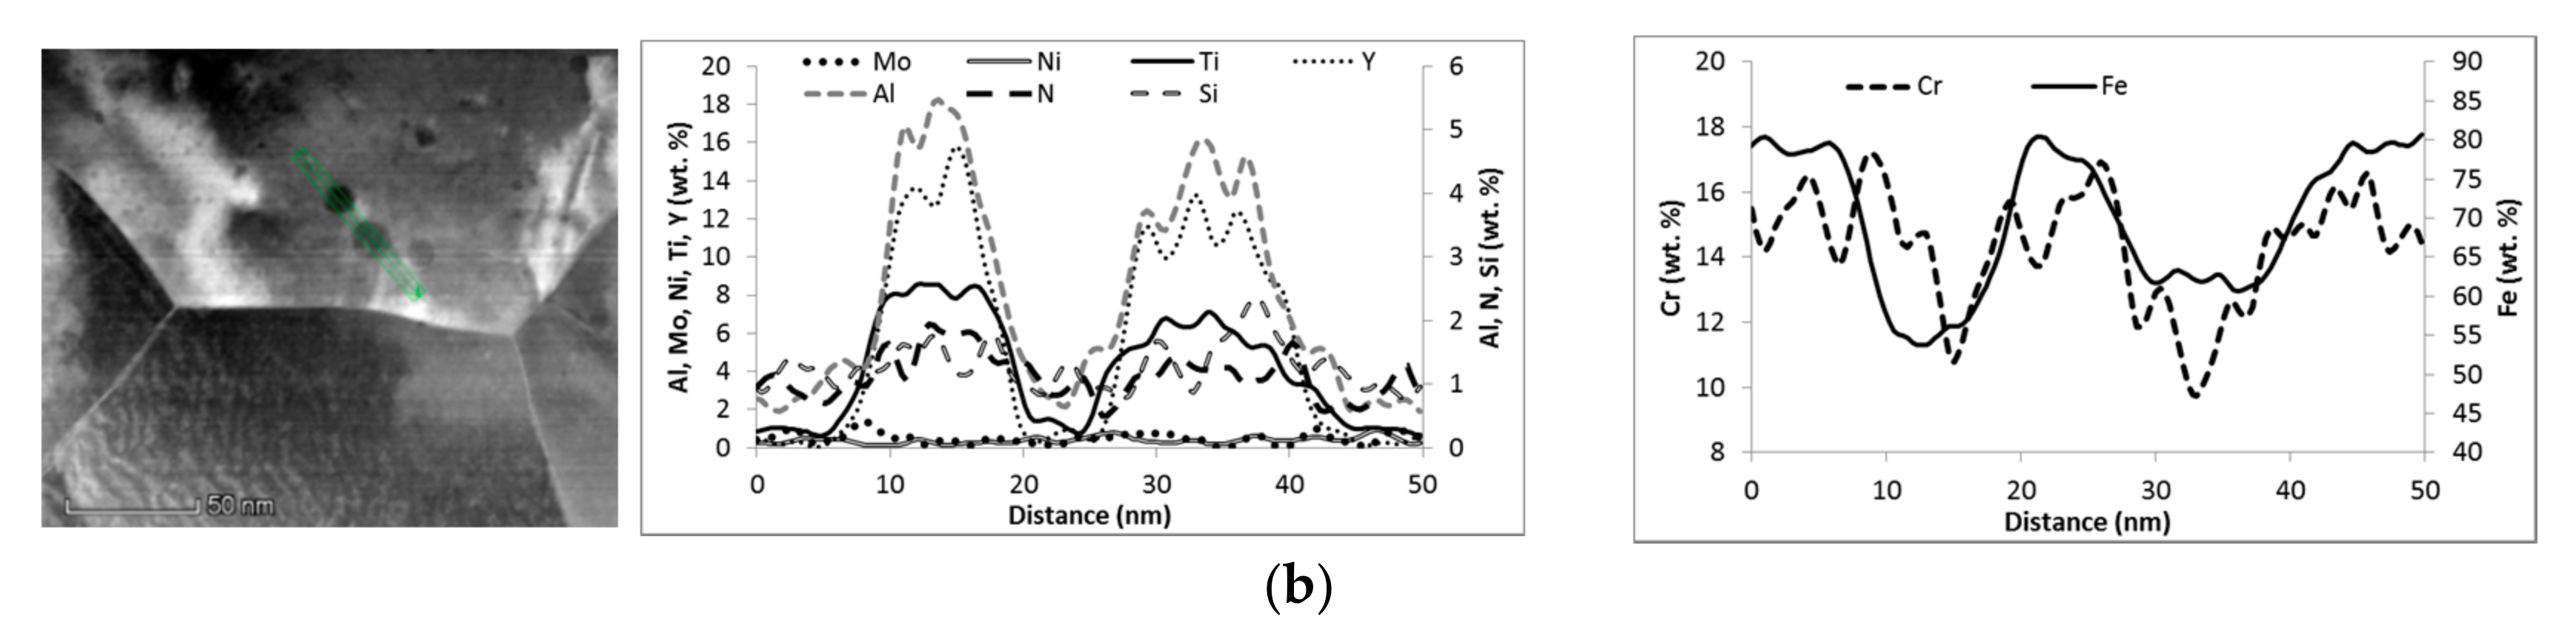
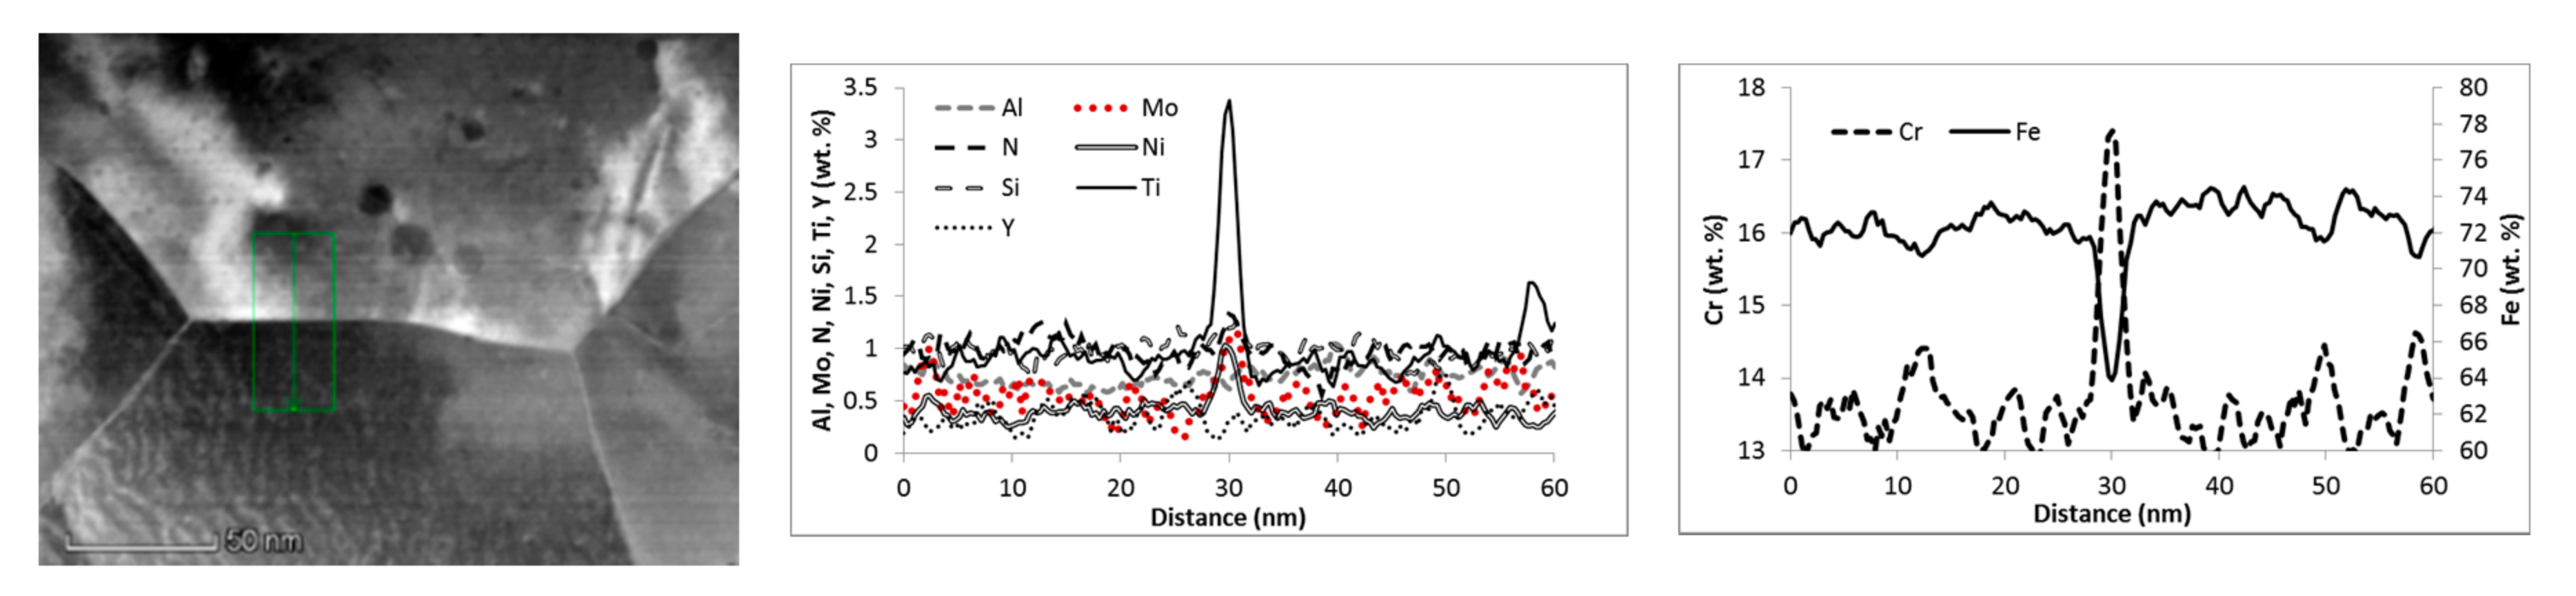
STEM-EDX maps of chemical elements determined in the Air720 sample (Figure 7 and Figure 8) also show two groups of precipitates and a grain boundaries segregation: enriched with Cr, Mo, Ni, Ti, and depleted with Fe. STEM-EDX analysis of nano-precipitates of Air720 revealed very similar observation results, as were found in He720, i.e., enrichment of the coarser particles with Ti, Y, Al, and some N and Si. The fine precipitates show enrichment with Ti, Y, and none or lower Cr depletion than the coarser ones.
The chemical composition of coarser particles and grain boundaries can be estimated from the described STEM-EDX maps and line scans. Table 2 contains the values estimated to compare two exposed states with AR material. Again, it should be noted that oxidation of foils affected these data. The data of the precipitates are rough estimations because the composition of the surrounding matrix usually affects measured composition of the precipitates. Effects of foil thickness and the precipitate size also influence the measured composition. STEM measured chemical compositions of coarse particles of He720 and Air720 are very similar, however, a higher amount of Al, N, Si, and lower one of Y is detected in comparison to AR. In both states Y is not segregated at the grain boundaries.
Average grain size values measured in the transversal direction, i.e., RC plane in Figure 1, in AR and He720 by Hojna et al. [9] are also listed in Table 2. He720 has slightly lower average grain size than AR; the one of Air720 was not measured. Cavity size and distribution were measured using sections from SEM images of the samples. No significant difference in cavities structure between AR and the gas exposed samples is observed.
3.2. Effect of High-Temperature Environment on the Surface
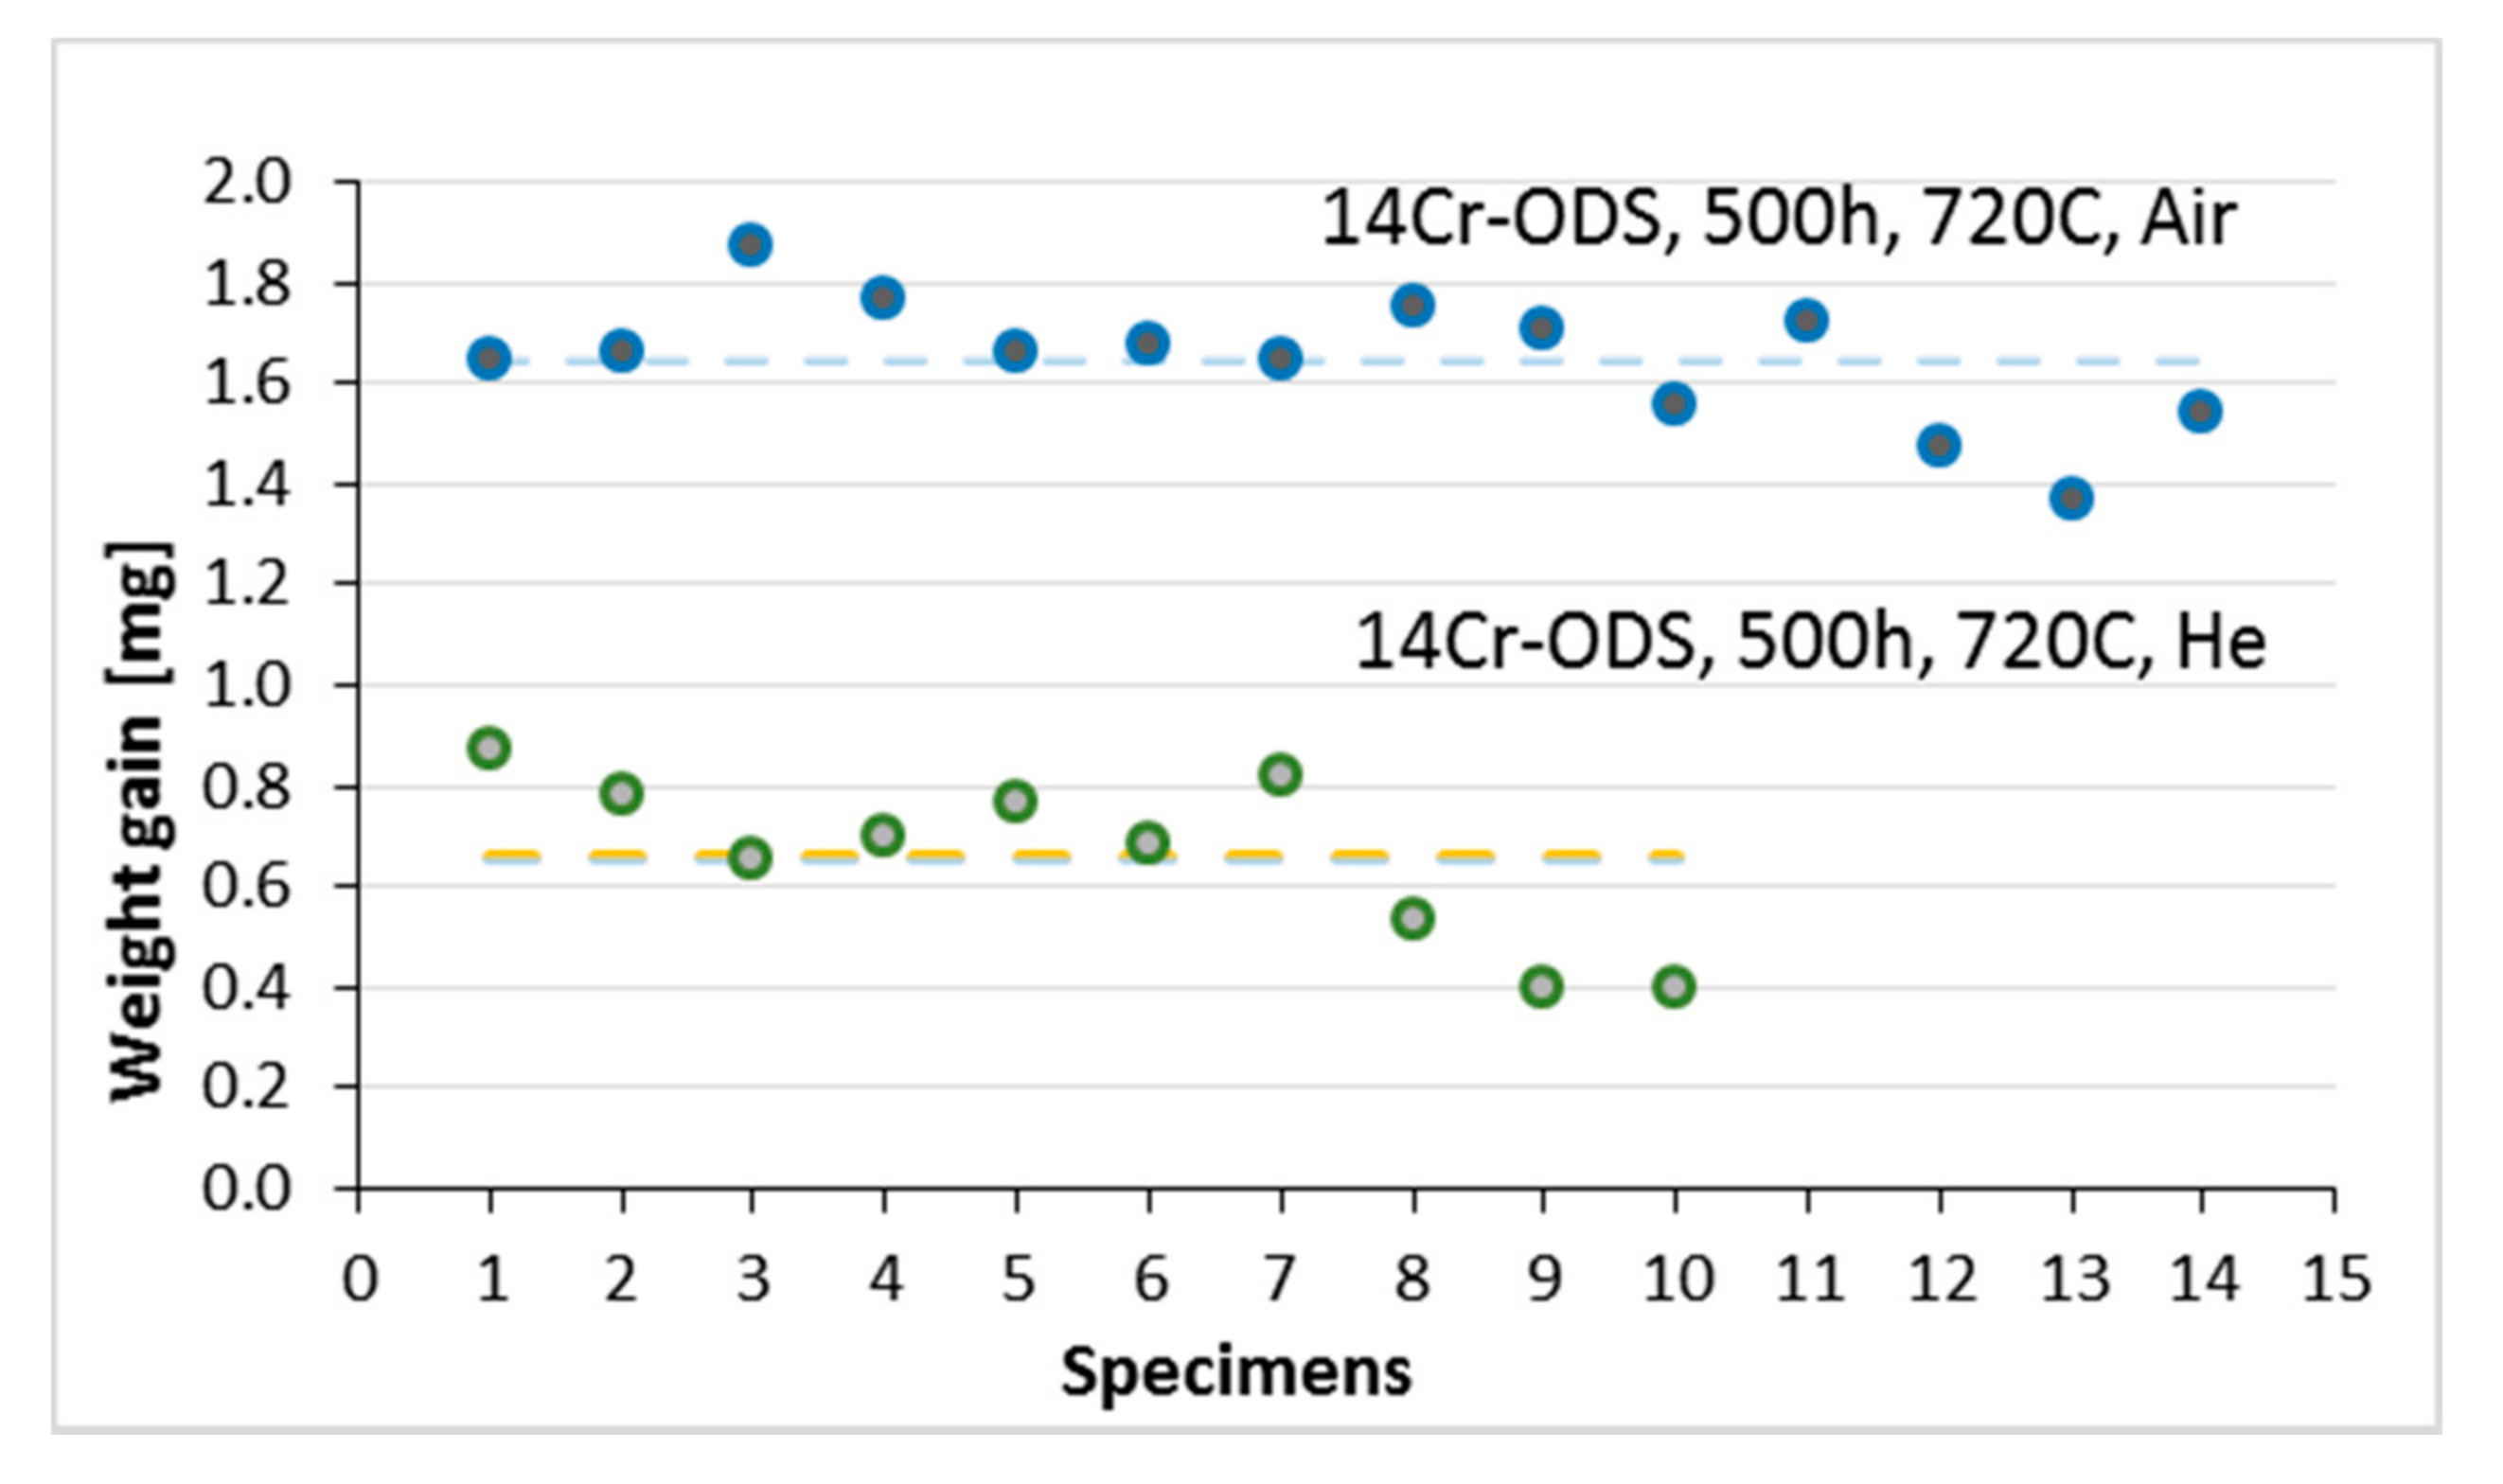
Specimens in both environments were weighed before and after the exposure at 720 °C for 500 h (Figure 9), so that the effect of the environment on the weight was observed. Moreover, specimen surfaces were covered by thin oxide layers after both exposures.
In specimens exposed in air, a higher weight gain of about 1.65 mg in average, compared to those exposed in He, with an average value of 0.66 mg, is measured. This data highlight the fact that the different oxygen content of two environments has a remarkable effect on the oxide layer thickness.
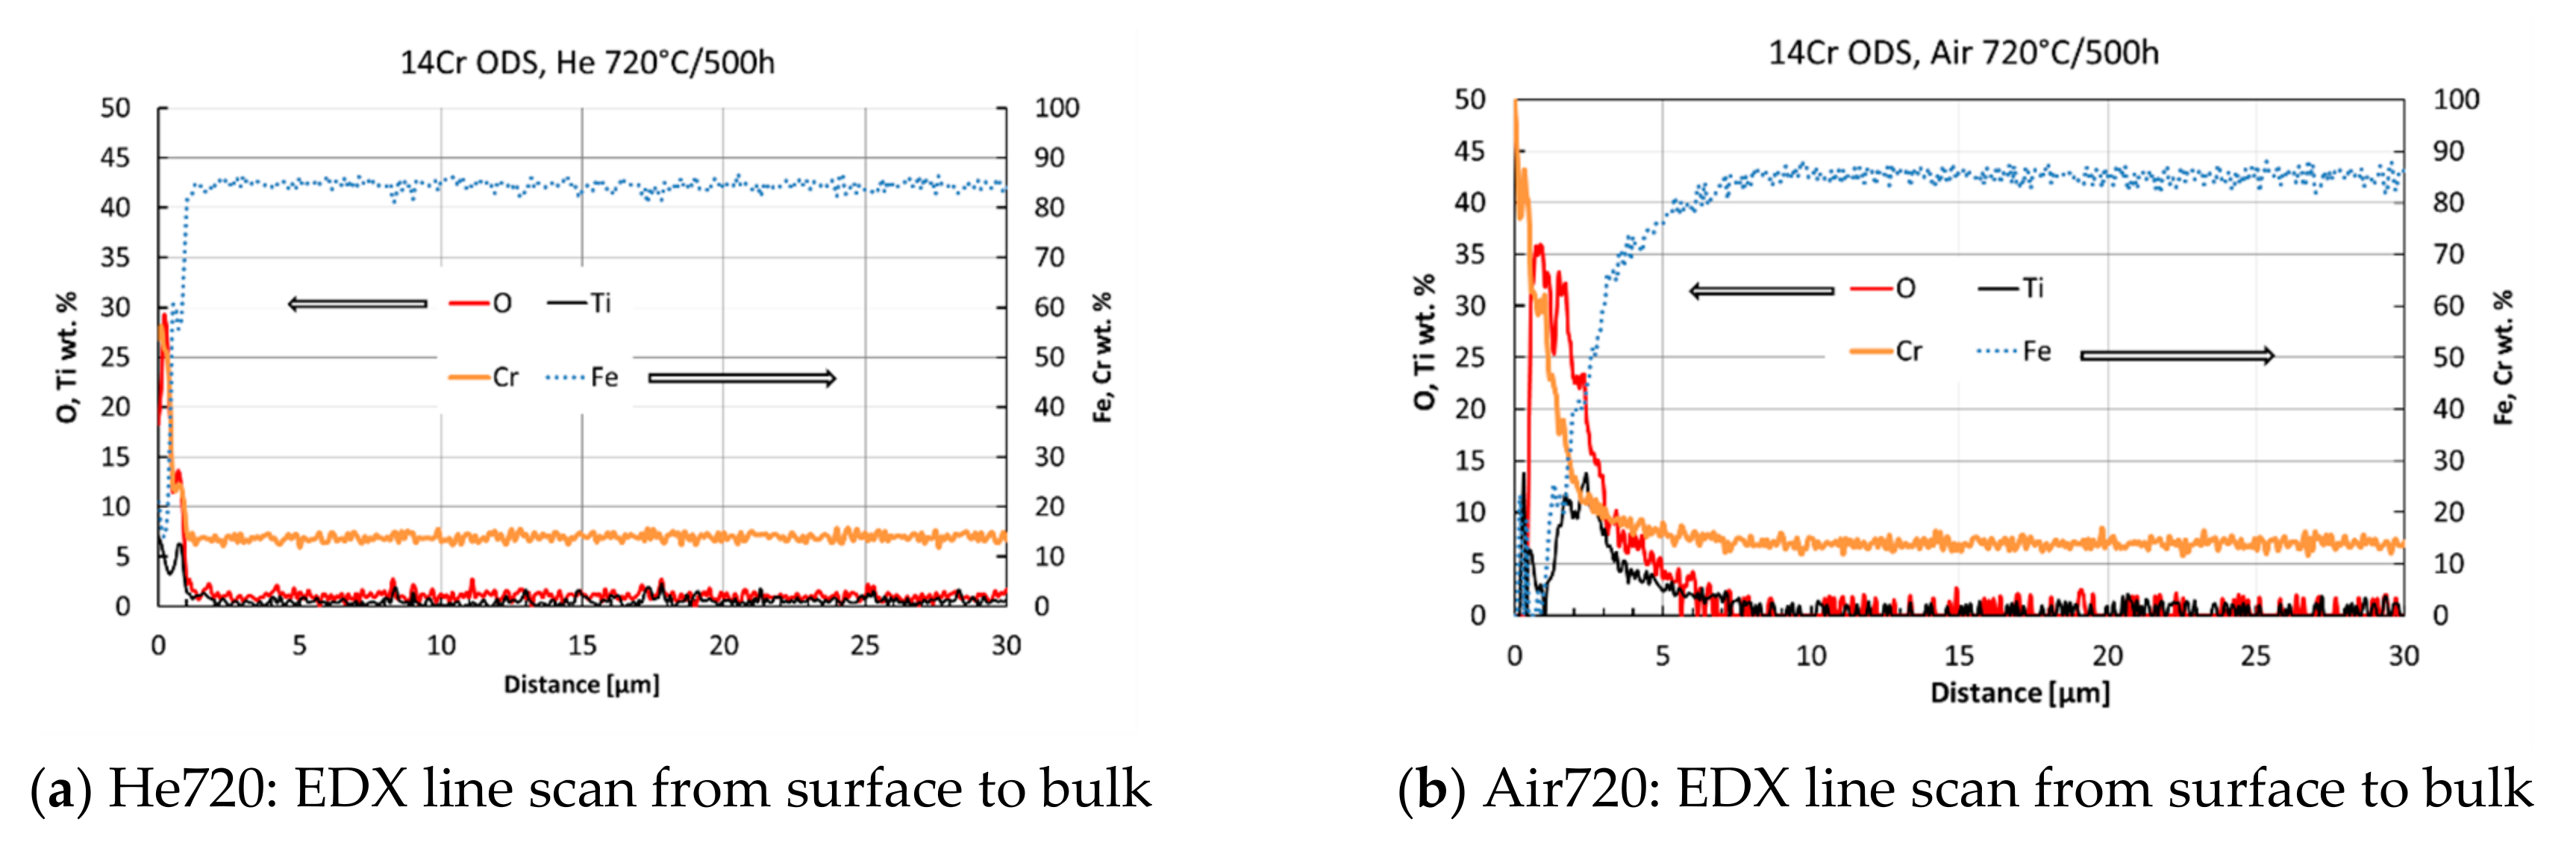
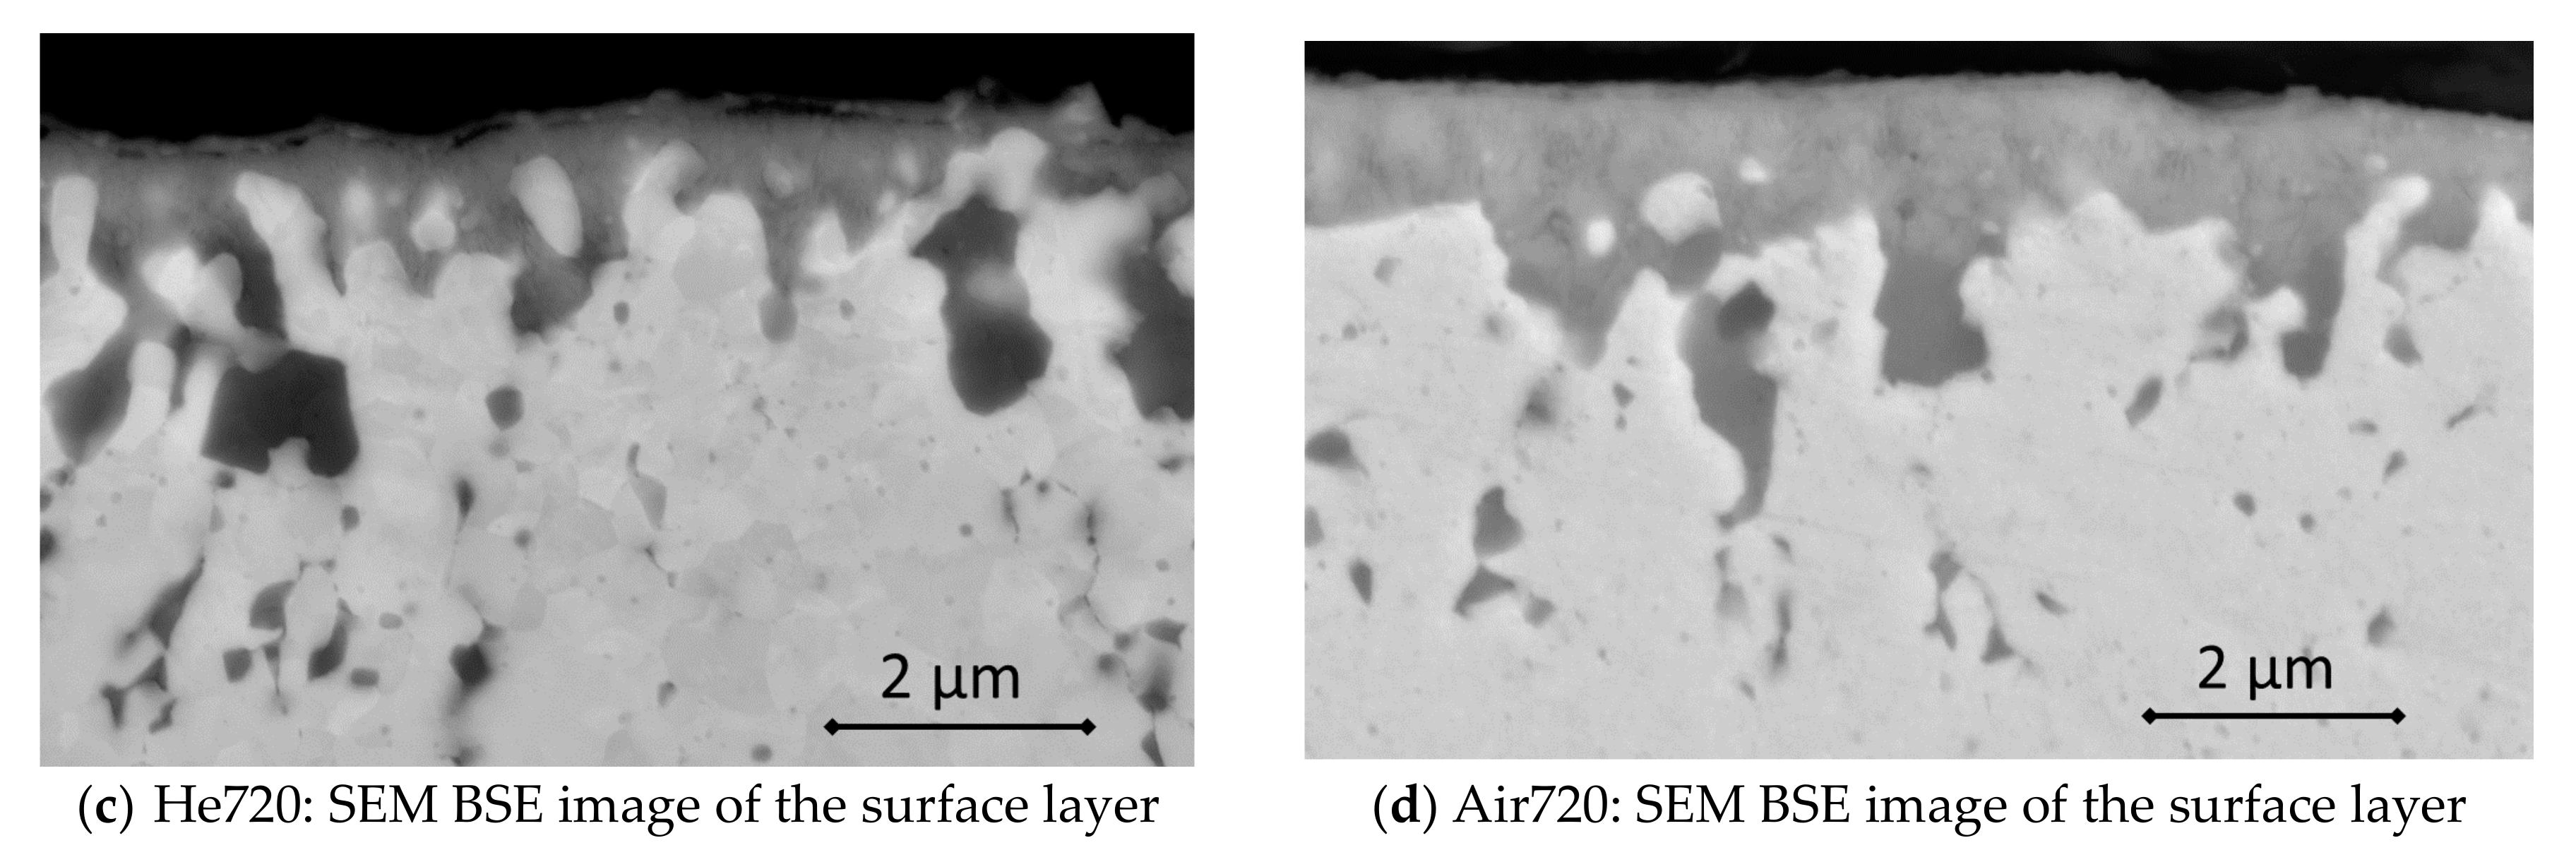
SEM observations of the cross section of the specimen show a very thin oxide scale with the non-uniform thickness ranging from 1 μm in He to 6 μm in Air, respectively, enriched with Cr, Ti, and O (as is shown by qualitative line scans in Figure 10a,b). The morphology of the oxides is characterized by an outer continuous film and internal penetration (Figure 10c,d). Detailed analyses of the oxides (line scans and EDX mapping) show that the main structure is characterized by an external Cr-rich layer, while the inner penetration is mainly Ti-rich. This oxide structure is common to both environments; however, their thicknesses are different. Although the thermodynamic stability of the oxide is not affected by the amount of oxygen, the kinetics of growth is influenced. In the He exposure, with lower oxygen content, the oxide growth is slower and the scale is thinner.
The micro-hardness profile was measured at the cross-section of the specimen after exposures and impact tests. Vickers micro-hardness (HV 0.01) values of three states show differences in the sub-surface region up to about 30 μm and stable bulk trends up to 100 μm (Figure 11). The highest micro-hardness, 430, is observed in AR steel in the subsurface region, while for He720 and Air720 a lower value of 360 is measured. The stable bulk values are similar and are within the deviation. Micro-hardness slightly increases from 380 in AR material to 410 in He720. That corresponds to a slight increase of the yield strength as is shown in Table 3.
3.3. Fracture Behavior
Impact energy data measured on the AR, He720 and Air720 small test specimens and relevant transition curves are shown in Figure 12. All impact curves exhibit ductile to brittle fracture transition behavior, so that transition temperatures (DBTT) can be determined, as is listed in Table 3. The lower shelf (LSE) and the upper shelf (USE) of the impact energy for the AR is about 0.5–2 J and 8–12 J, respectively. In most of the tests, the fracture propagation has stopped before a complete failure of the specimen.
Although larger scattering, the impact energy data obtained from two gas exposed states shows the transition curves shifted towards higher temperatures in comparison to the AR curve (Figure 12). DBTTs of the specimens are evaluated to be about −70 °C for He720 and about −50 °C for Air720 (Table 3). Whereas only four data points are used for the He720 transition curve construction. Since the transition temperature value has low accuracy, the deviation can be estimated to be about ±10 °C. On the other hand, fourteen data points are used for the Air720 curve, nevertheless, the scatter does not decrease. DBTT scatter band was defined as half of the distance between two envelop curves following the shape of the fit line on the same energy level where DBTT was determined. The both values, DBTT and the deviation were rounded to respect the high scatter. The deviation of DBTT is evaluated to be about ±10 °C as well. Moreover, the slopes of the transition curves of Air720 and He720 are similar, however, they are smoother in comparison to the slope of the AR curve. This means that the fracture mode transition occurred in a wider temperature range. To obtain the USE of He720 and Air720 more data is needed, so that the evaluation of the effect of the exposures on USE is possible.
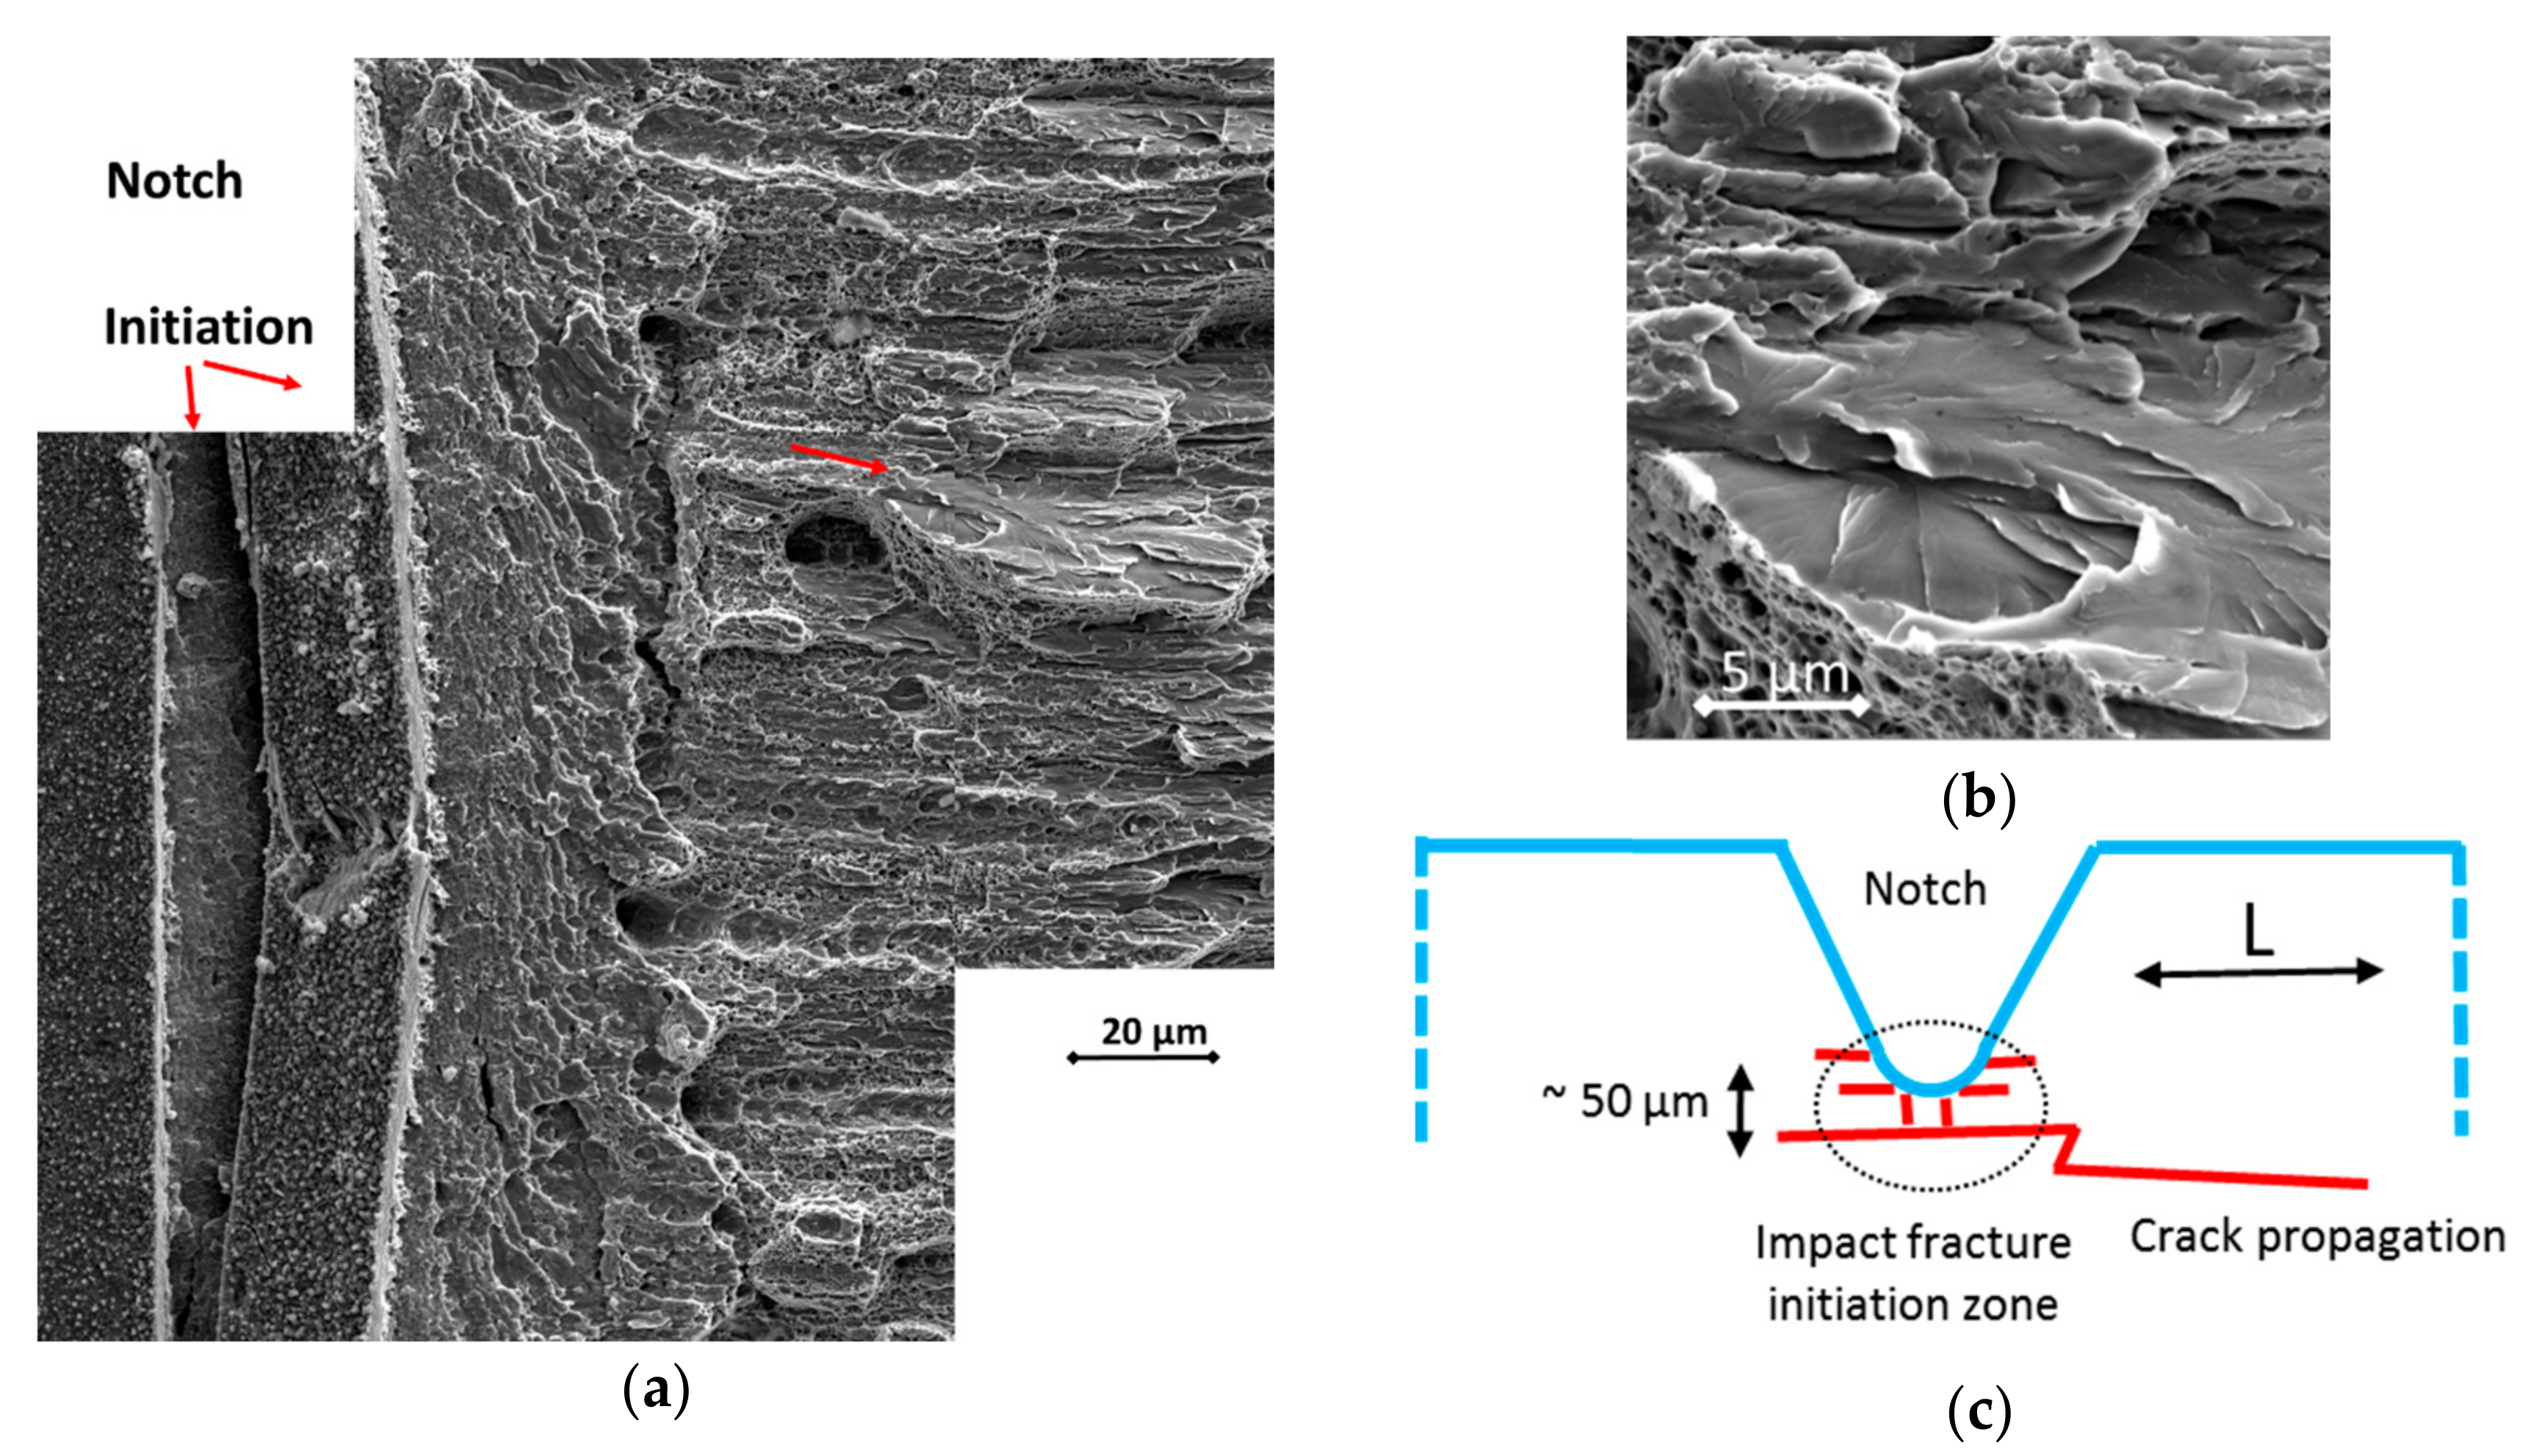
Fracture morphologies observed on specimens at three material conditions are rather complex. The impact fracture is triggered in a process zone in front of the notch. The initiation site is estimated to be about 50 µm below the notch (Figure 13). After initiation, a simultaneous propagation of cracks along several LC planes perpendicular to the impact axis in texture (L) direction occurs. This type of delamination, the crack arrested delamination, is observed in most of the tested specimens. For He720 specimens this effect is the most intensive. The second type of delamination, the crack divider delamination, is detected on one Air720 specimen tested at −40 °C with low measured impact energy of 4.4 J.
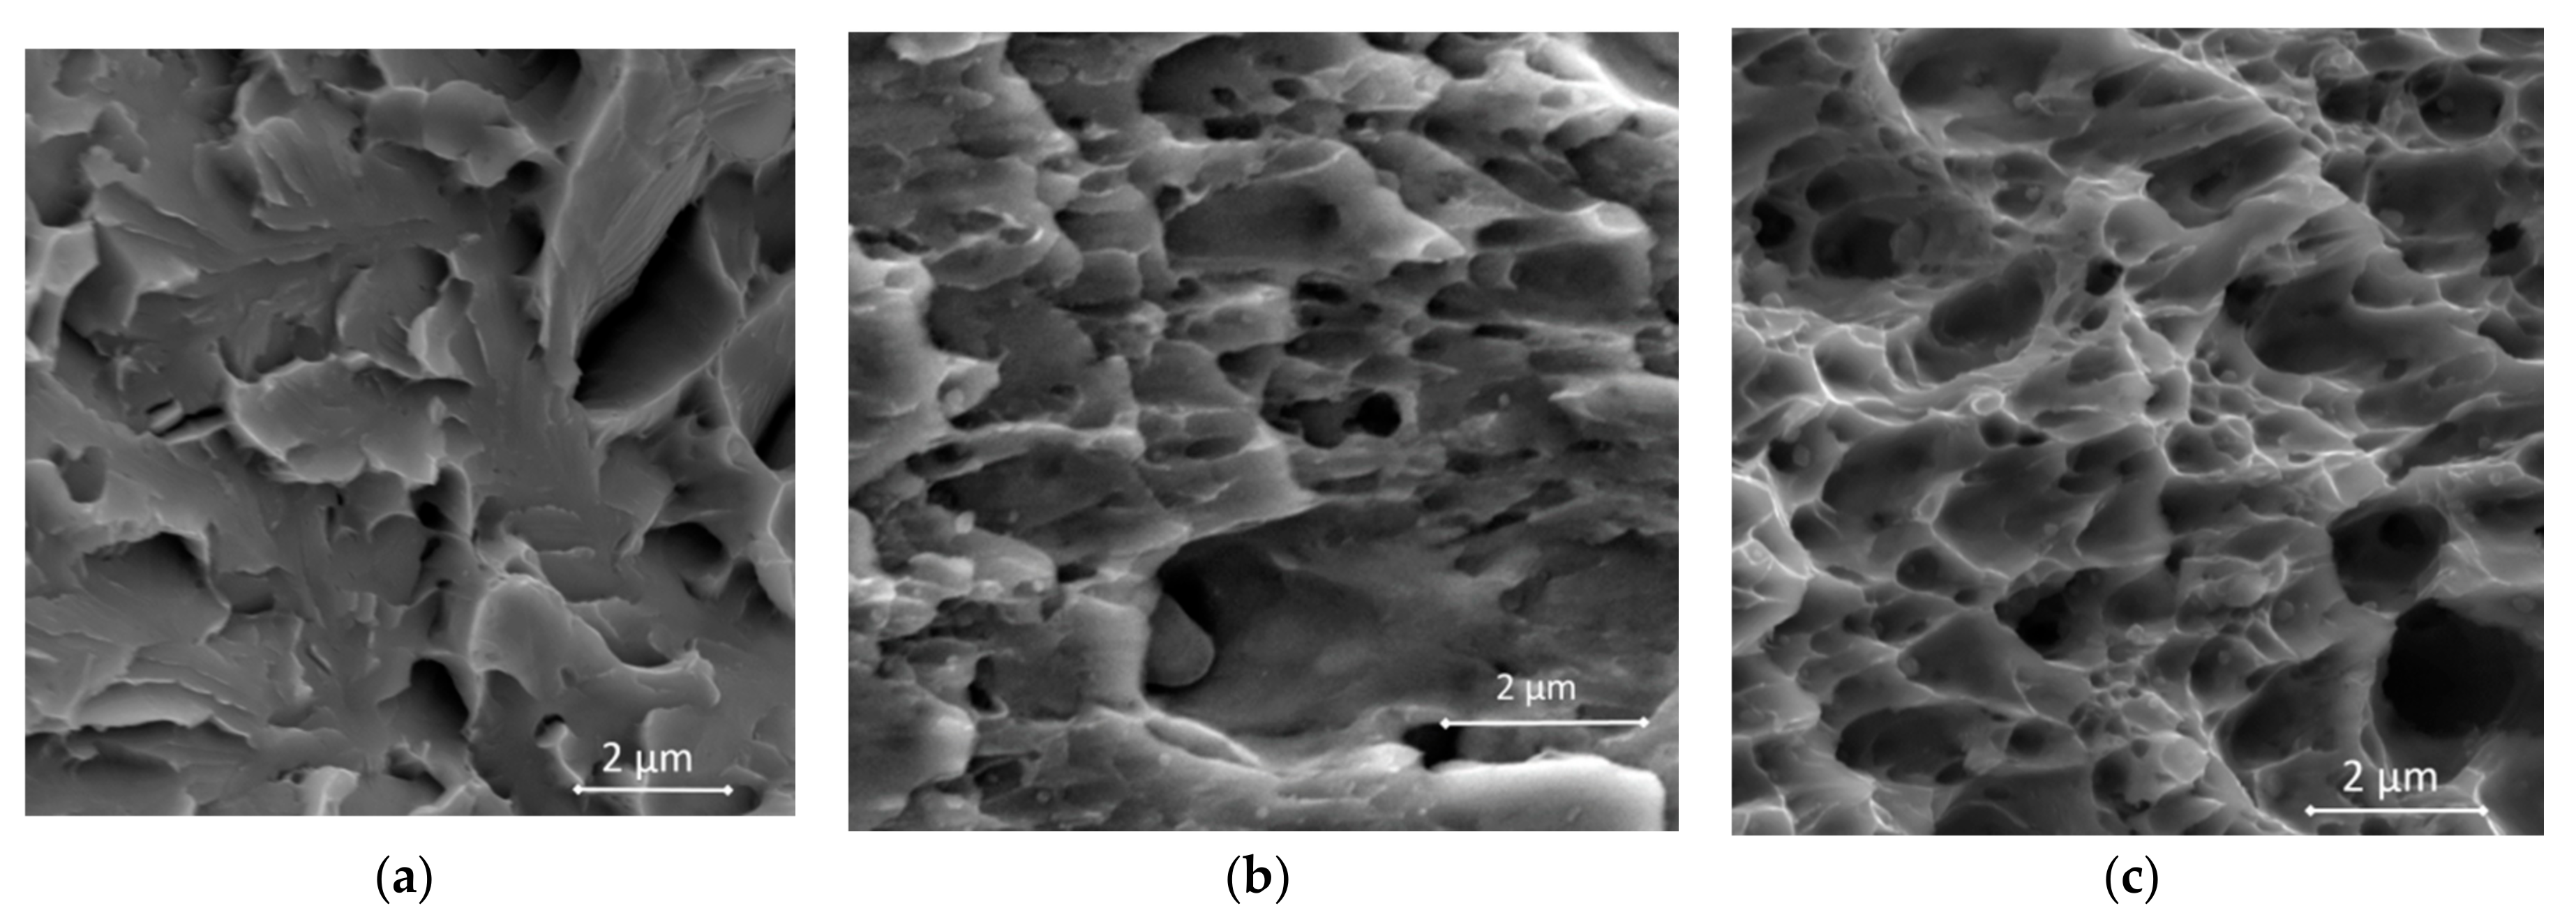
The fracture propagation mode is changed from cleavage at LSE region (Figure 14a) to ductile at the USE (Figure 14c). The LSE fracture appearance of AR has been earlier reported [6,8,9]. The fracture surface is formed by alternated cleavage areas connected by inclined areas fractured by dimple micro mechanism. The appearance of fracture surfaces of Air720 and He720 can be described by the same micro mechanisms. Within the transition region, the cleavage fracture mode is changed to ductile with increasing temperature. Ductile fracture is present on the surface of crack propagation at transition temperatures (Figure 14b). The fracture mode of all three material states is transgranular, no features indicating intergranular fracture are observed.
4. Discussion
The present work shows that a noticeable loss of the original fracture resistance is observed after exposure of 14Cr ODS steel in gas, He or air environments for 500 h at 720 °C. Furthermore, the diffusion of alloying elements (Cr, Ti), which form the oxide scale on the surface, from bulk towards the surface was observed.
In a previous paper [9], there was also found a loss of fracture resistance of the 14Cr ODS steel after isothermally aging at 650 °C for 1000 h in air; the DBTT shifted about 50 °C towards higher temperatures in comparison to AR material. The effect was explained by the contribution of a small rearrangement of the grain size distribution, resulting from an increase of the average grain size from 380 to 400 nm, and with contribution of the unquantified changes of the grain boundaries. In the case of He720, it was measured ti have a slight decrease of the average grain size, but the value had low accuracy calculated to ±150 nm. We do not consider the grain sizes of AR and He720 different owing to the large scatter. In this paper, we tried to quantify changes of the grain boundaries.
Several solute elements redistribution after the aging in gases is found using STEM EDX analysis. Ti and Al, constituents of the large particles originally present in the material, are diffused to the grain boundaries and the specimen surface. Likewise, Cr is diffused from the bulk into the surface as well as to the grain boundaries. In addition, Ni and Si, likely contaminants from production, are also diffused to the grain boundaries. Increased Si content is measured in the coarser particles and at selected grain boundaries. The presence of traces of the elements was also found in fine oxide particles with the Y2Ti2O7 pyrochlore structure of the same ODS steel, as referred elsewhere [13]. Considering the fact that these changes in chemical composition of both particle families observed in the 14Cr ODS steel influence also the particle-matrix interface, it is likely that a process of void nucleation in the particles vicinity can be affected.
The segregation of Cr, Ti, Mo, and Ni at the grain boundaries is already observed in the original bar of the as-extruded 14Cr ODS steel. The segregation of Cr, Ti, Mo, and a little amount of Ni and Si accompanied by Fe depletion at grain boundaries is detected under the Air720 and He720 gas exposed material conditions. Especially, grain boundary composition of He720 increased by 1Cr, 1Ti, 0.4Al, 0.5N, 0.6Si, 0.4Ni, and the composition of Air720 by 1.5Cr, 2Ti, 0.4Al, 0.9N, 0.8Si, 0.6Ni relatively to AR. Thus, the influence of the segregation on the grain boundary cohesion can be estimated using the data of the strengthening/embrittling energy (ΔESE,I) and the grain boundary concentrations of individual solutes [16]. For the first estimation of the effect of individual solutes, the values of ΔESE,I: −30 kJ/mol for Cr, −10 for Ni, −10 for Mo, −40 for Ti, and +20 for Si in the ferritic iron can be used. Slight segregation of Si can negatively affect the cohesion, while the segregation of Cr, Mo, Ni, and Ti can cause its increase. The Si contribution should be considered with care. Unless the effect of Si, the grain boundary strengthening effect of Cr and Ti is dominant while the effect of Mo and Ni is considered as negligible. The grain boundaries are likely not much weakened by segregations, so no intergranular fracture occurs. This is consistent with fracture surface observations.
At the USE, the impact curve gives information about the ductile fracture resistance. Due to the non-sufficient amount of data points for the proper calculation of USE of He720 and Air720, USE levels can be nothing but estimated. It is shown that the USE of two materials equals to AR within the data scatter in Figure 12. This fact is in agreement with the relationship between the level of fracture resistance at USE and the yield strength [17].
For further investigation of the root of the high strength, a model of the strengthening mechanisms can be used. In a recent study [18], a suitable model proposing the calculation equations applied to whole range of steels, including nano ODS, was described and verified. In this model, the yield strength, σy, was proposed to calculate according to the equation:
where σg, σd, σp are the strengthening contributions from the grain size (Hall-Petch relation σg~grain size−1/2), dislocation forests (σd~dislocation density1/2) and nanoparticles (σp~particle density1/2), respectively. Using the grain size data listed in Table 2 as inputs to the model equation, the ratio of He720 and AR grain size contributions can be calculated and equals to 1.03. On the other hand, using the yield strength data from Table 3 the ratio of σy of He720 and σy of AR is calculated and equals 1.03 as well. Thus, following conclusions can be made: (i) the grain size contribution dominates in strengthening of the studied ODS steel conditions (at least at room temperature, i.e., in USE region); (ii) σy is sensitive to very small changes in the ultra-fine grains average size; and (iii) the contribution of a dislocation forest and nanoparticles is negligible.
σy = σg + (σd2 + σp2)1/2,
In our opinion, the observed delamination of two types can explain the large scatter of impact energy data in the transition and upper shelf regions. This fact had been widely discussed elsewhere [7,8,9,19].
The transition of the fracture mechanism from transgranular cleavage to ductile micro-void coalescence mode with increasing temperature is typically observed in ferritic steels. Within the transition region two fracture modes coexist in the test sample. With respect to a small specimen size used in this work, the cleavage fracture appears only in the LSE temperature region. A fracture with prevailing ductile character occurs in the transition region. Thus, an explanation of the shifts of transition temperatures of He720 and Air720 should be searched within the ductile fracture mechanism.
In general, metals can prematurely fail by ductile fracture owing to void formation at second-phase particles [20]. The void nucleation and the whole ductile fracture mechanism is slightly different in the metals with ultra-fine grains, i.e., <1 µm. Void nucleation often occurs at grain boundary and preferentially at a triple junction of them [21]. Then, the voids grow and dimples form on the fracture surface, in a size coarser than the grain size. Moreover, grain boundary decohesion contributes to the enlargement of the voids in the direction of the grain texture. These characteristics are in agreement with our observation of fracture surfaces (Figure 14b,c): Most of dimples contain no particles, but rarely small particles can be seen on their bottom. Changes in chemical composition of the particles (Table 2) might affect the nucleation of voids in He720 and Air720 material conditions.
In addition, delamination of two types appears on the fracture surface indicating anisotropy of the materials. The anisotropy results from the manufacturing process. Mostly, a crack arrester delamination preferring fracture in the extrusion direction is observed in the as-received and the exposed materials in the whole range of test temperatures. This shows that the impact crack propagates much more easily in the longitudinal direction, i.e., in direction of the microstructure texture. The other type of delamination, the crack divider, appeared only once—in Air720 at −40 °C. This is a different observation than referred for 14Cr–W ODS steel extruded in the shapes of a rod or a plate [7,19]. Those results showed, that the crack divider delamination occurred often mostly in the upper part of the transition region, where a high scatter was also observed. In [19], the scatter was linked to both delamination mechanisms occurring along the extrusion direction and thus directly linked to intergranular fracture islands evidenced if cross sectioned. However, it is not clear if the intergranular fracture was brittle or ductile. In the case of Air720, the effect was observed also at the end of the transition region, but no cross section of the fracture was examined. In summary, the anisotropy of the 14Cr ODS steel extruded in the shape of a bar is significant between the L direction and the others. There is likely no difference between C and R directions, but it has to be confirmed by tensile tests in future. The anisotropy may change during long-term exposures at high temperature mainly in air. It has been shown, that the anisotropy of 14Cr–W ODS steels increases with increasing test temperature [19].
The delamination apparently increases DBTT owing to enhanced impact energy consumed for the crack propagation. Considering the occurrence of the crack arrester delamination under all three material conditions, this effect cannot explain the different DBTT shifts.
The main results can be summarized as follows: (i) changes of coarser particle chemistry and likely cohesion of the interface; (ii) decrease of dislocation network; and (iii) grain boundary twist release and segregations are observed. It implies that the most likely reason for the observed embrittlement of He720 and Air720 materials is a decrease of the level of stress or strain necessary to separate the particles from the matrix to nucleation of a void.
5. Conclusions
The impact fracture response was studied in 14Cr ODS steel in the as-received state and after two exposures in high-temperature gas environments, helium and air. Furthermore, a movement of alloying elements (Cr, Ti) forming the oxide scale on the surface from bulk towards the surface has been determined. The gas exposures resulted in embrittlement of the ODS steel; the transition temperature was shifted towards higher values by about 40 °C in He and 60 °C in air, respectively.
TEM observation revealed a decrease in dislocation density in the grains in the gas exposed materials. It was found using STEM- EDX that Cr, Ti, Mo, Al, and Ni segregate at grain boundaries of AR steels. After the gas exposures, Ti and Al, constituents of the large particles of AR are diffused to the grain boundaries and the specimen surface. Likewise, Cr is diffused from the bulk into the surface as well as to the grain boundaries.
Several reasons to explain the observed embrittlement were identified: the void nucleation process is affected by changes in the strengthening particles chemistry; segregations on the particle/matrix interface; and grain boundaries as well as in dislocation density.
Acknowledgments
This work was financially supported by the Czech Science Foundation projects GACR No. 14-25246S, the CEITEC Nano Research Infrastructure at Brno University of Technology (MEYS CR (ID LM2015041)), and the projects LQ1601 (CEITEC 2020) and LQ1603 (Research for SUSEN) with financial support from the Ministry of Education, Youth, and Sports of the Czech Republic under the National Sustainability Programme II. This work has been realized within the SUSEN Project (established in the framework of the European Regional Development Fund (ERDF) in project CZ.1.05/2.1.00/03.0108 and of the European Strategy Forum on Research Infrastructures (ESFRI) in the project CZ.02.1.01/0.0/0.0/15_008/0000293, which is financially supported by the Ministry of Education, Youth, and Sports—project LM2015093 Infrastructure SUSEN. The authors thank to Jan Berka (CVR) who made the gas exposures.
Author Contributions
Hynek Hadraba and Anna Hojna conceived and designed the experiments; Roman Husak, Lucia Rozumova performed the experiments; Jan Michalicka performed TEM analyses; Anna Hojna performed SEM fracture analyses; Jan Duchon contributed analysis tools; Anna Hojna, Fosca Di Gabriele, and Jan Michalicka wrote the paper.
Conflicts of Interest
The authors declare no conflict of interest.
Abbreviations
| List of Acronyms | |
| AR | As-Received |
| BSE | Back Scattered Electrons |
| DBTT | Ductile-to-Brittle Transition Temperature |
| DCLL | Dual Coolant Lead Lithium |
| EDX | Energy Dispersive X-ray Spectroscopy |
| FM | Ferritic-Martensitic |
| GFR | Gas Fast Reactor |
| KLST | Kleinst-Proben Specimen Type (Mini Charpy) |
| LSE | Lower Shelf Energy |
| NFA | Nanostructured Ferritic Alloys |
| ODS | Oxide Dispersion Strengthened |
| SEM | Scanning Electron Microscope |
| STEM | Scanning Transmission Electron Microscope |
| TEM | Transmission Electron Microscope |
| USE | Upper Shelf Energy |
References
- Alinger, M.J.; Odette, G.R.; Lucas, G.E. Tensile and fracture toughness properties of MA957: Implications to the development of nanocomposited ferritic alloys. J. Nucl. Mater. 2002, 307–311, 484–489. [Google Scholar] [CrossRef]
- Alamo, A.; Lambard, V.; Averty, X.; Mathon, M.H. Assessment of ODS–14%Cr ferritic alloy for high temperature applications. J. Nucl. Mater. 2004, 329–333, 333–337. [Google Scholar] [CrossRef]
- Kurtz, R.J.; Alamo, A.; Lucon, E.; Huang, Q.; Jitsukawa, S.; Kimura, A.; Klueh, R.L.; Odette, G.R.; Petersen, C.; Sokolov, M.A.; et al. Recent progress toward development of reduced activation ferritic/martensitic steels for fusion structural applications. J. Nucl. Mater. 2009, 386–388, 411–417. [Google Scholar] [CrossRef]
- Kimura, A.; Kasada, R.; Iwata, N.; Kishimoto, H.; Zhang, C.H.; Isselin, J.; Dou, P.; Lee, J.H.; Muthukumar, N.; Okuda, T.; et al. Development of Al added high-Cr ODS steels for fuel cladding of next generation nuclear systems. J. Nucl. Mater. 2011, 417, 176–179. [Google Scholar] [CrossRef]
- Byun, T.S.; Hoelzer, D.T.; Kim, J.H.; Maloy, S.A. A comparative assessment of the fracture toughness behavior of ferritic-martensitic steels and nanostructured ferritic alloys. J. Nucl. Mater. 2017, 484, 157–167. [Google Scholar] [CrossRef]
- Hadraba, H.; Kazimierzak, B.; Stratil, L.; Dlouhy, I. Microstructure and impact properties of ferritic ODS ODM401 (14%Cr-ODS of MA957 type). J. Nucl. Mater. 2011, 417, 241–244. [Google Scholar] [CrossRef]
- Rouffié, A.L.; Crépin, J.; Sennour, M.; Tanguy, B.; Pineau, A.; Hamon, D.; Wident, P.; Vincent, S.; Garat, V.; Fournier, B. Influences of process parameters and microstructure on the fracture mechanisms of ODS steels. J. Nucl. Mater. 2013, 433, 108–115. [Google Scholar] [CrossRef]
- Hadraba, H.; Fournier, B.; Stratil, L.; Malaplate, J.; Rouffié, A.-L.; Wident, P.; Ziolek, L.; Béchade, J.-L. Influence of microstructure on impact properties of 9–18%Cr ODS steels for fusion/fission applications. J. Nucl. Mater. 2011, 411, 112–118. [Google Scholar] [CrossRef]
- Hojna, A.; Di Gabriele, F.; Hadraba, H.; Husak, R.; Kubena, I.; Rozumova, L.; Bublikova, P.; Kalivodova, J.; Matejicek, J. Fracture behaviour of the 14Cr ODS steel exposed to helium and liquid lead. J. Nucl. Mater. 2017, 490, 143–154. [Google Scholar] [CrossRef]
- Lejček, P. Grain Boundary Segregation in Metals, 1st ed.; Springer Series in Material Science 136; Springer: Berlin/Heidelberg, Germany, 2010; ISBN 978-3-642-12504-1. [Google Scholar]
- Alinger, M.J.; Odette, G.R.; Hoelzer, D.T. The development and stability of Y-Ti-O nanoclusters in mechanically alloyed Fe-Cr based ferritic alloys. J. Nucl. Mater. 2004, 329–333, 382–386. [Google Scholar] [CrossRef]
- Li, S.F.; Zhou, Z.J.; Wang, P.H.; Sun, H.Y.; Wang, M.; Zhang, G.M. Long-term thermal-aging stability of a 16Cr-oxide dispersion strengthened ferritic steel at 973 K. Mater. Des. 2016, 90, 318–329. [Google Scholar] [CrossRef]
- Dawson, K.; Tatlock, G.J. Characterisation of nanosized oxides in ODM401 oxide dispersion strengthened steel. J. Nucl. Mater. 2014, 444, 252–260. [Google Scholar] [CrossRef]
- Wong, C.P.C.; Abdou, M.; Dagher, M.; Katoh, Y.; Kurtz, R.J.; Malang, S.; Marriott, E.P.; Merrill, B.J.; Messadek, K.; Morley, N.B.; et al. An overview of the US DCLL ITER-TBM program. Fusion Eng. Des. 2010, 85, 1129–1132. [Google Scholar] [CrossRef]
- Stainsby, R.; Peers, K.; Mitchell, C.; Poette, C.; Mikityuk, K.; Somers, J. Gas cooled fast reactor research in Europe. Nucl. Eng. Des. 2011, 241, 3481–3489. [Google Scholar] [CrossRef]
- Lejček, P.; Šob, M.; Paidar, V. Interfacial segregation and grain boundary embrittlement: An overview and critical assessment of experimental data and calculated results. Prog. Mater. Sci. 2017, 87, 83–139. [Google Scholar] [CrossRef]
- Anderson, T.L. Fracture Mechanics: Fundamentals and Applications, 2nd ed.; CRC Press: Boca Raton, FL, USA; Ann Arbor, MI, USA; London, UK; Tokyo, Japan, 1995. [Google Scholar]
- Chauhan, A.; Bergner, F.; Etienne, A.; Aktaa, J.; de Carlan, Y.; Heintze, C.; Litvinov, D.; Hernandez-Mayoral, M.; Onorbe, E.; Radiguet, B.; et al. Microstructure characterization and strengthening mechanisms of oxide dispersion strengthened (ODS) Fe–9%Cr and Fe–14%Cr extruded bars. J. Nucl. Mater. 2017, 495, 6–19. [Google Scholar] [CrossRef]
- Fournier, B.; Steckmeyer, A.; Rouffie, A.-L.; Malaplate, J.; Garnier, J.; Ratti, M.; Wident, P.; Ziolek, L.; Tournie, I.; Rabeau, V.; et al. Mechanical behaviour of ferritic ODS steels—Temperature dependance and anisotropy. J. Nucl. Mater. 2012, 430, 142–149. [Google Scholar] [CrossRef]
- Pineau, A.; Benzerga, A.A.; Pardoen, T. Failure of metals I: Brittle and ductile fracture. Acta Mater. 2016, 107, 424–483. [Google Scholar] [CrossRef]
- Pineau, A.; Benzerga, A.A.; Pardoen, T. Failure of metals III: Fracture and fatigue of nanostructured metallic materials. Acta Mater. 2016, 107, 508–544. [Google Scholar] [CrossRef]
Figure 1.
Test specimen in L–R (longitudinal loading–radial crack plane) orientation related to the extrusion direction (texture); the blue area marks orientation of TEM foils.
Figure 1.
Test specimen in L–R (longitudinal loading–radial crack plane) orientation related to the extrusion direction (texture); the blue area marks orientation of TEM foils.

Figure 2.
TEM bright-field images of the material in condition: (a–c) AR (As-received); (d) He720; (e,f) Air720.
Figure 2.
TEM bright-field images of the material in condition: (a–c) AR (As-received); (d) He720; (e,f) Air720.
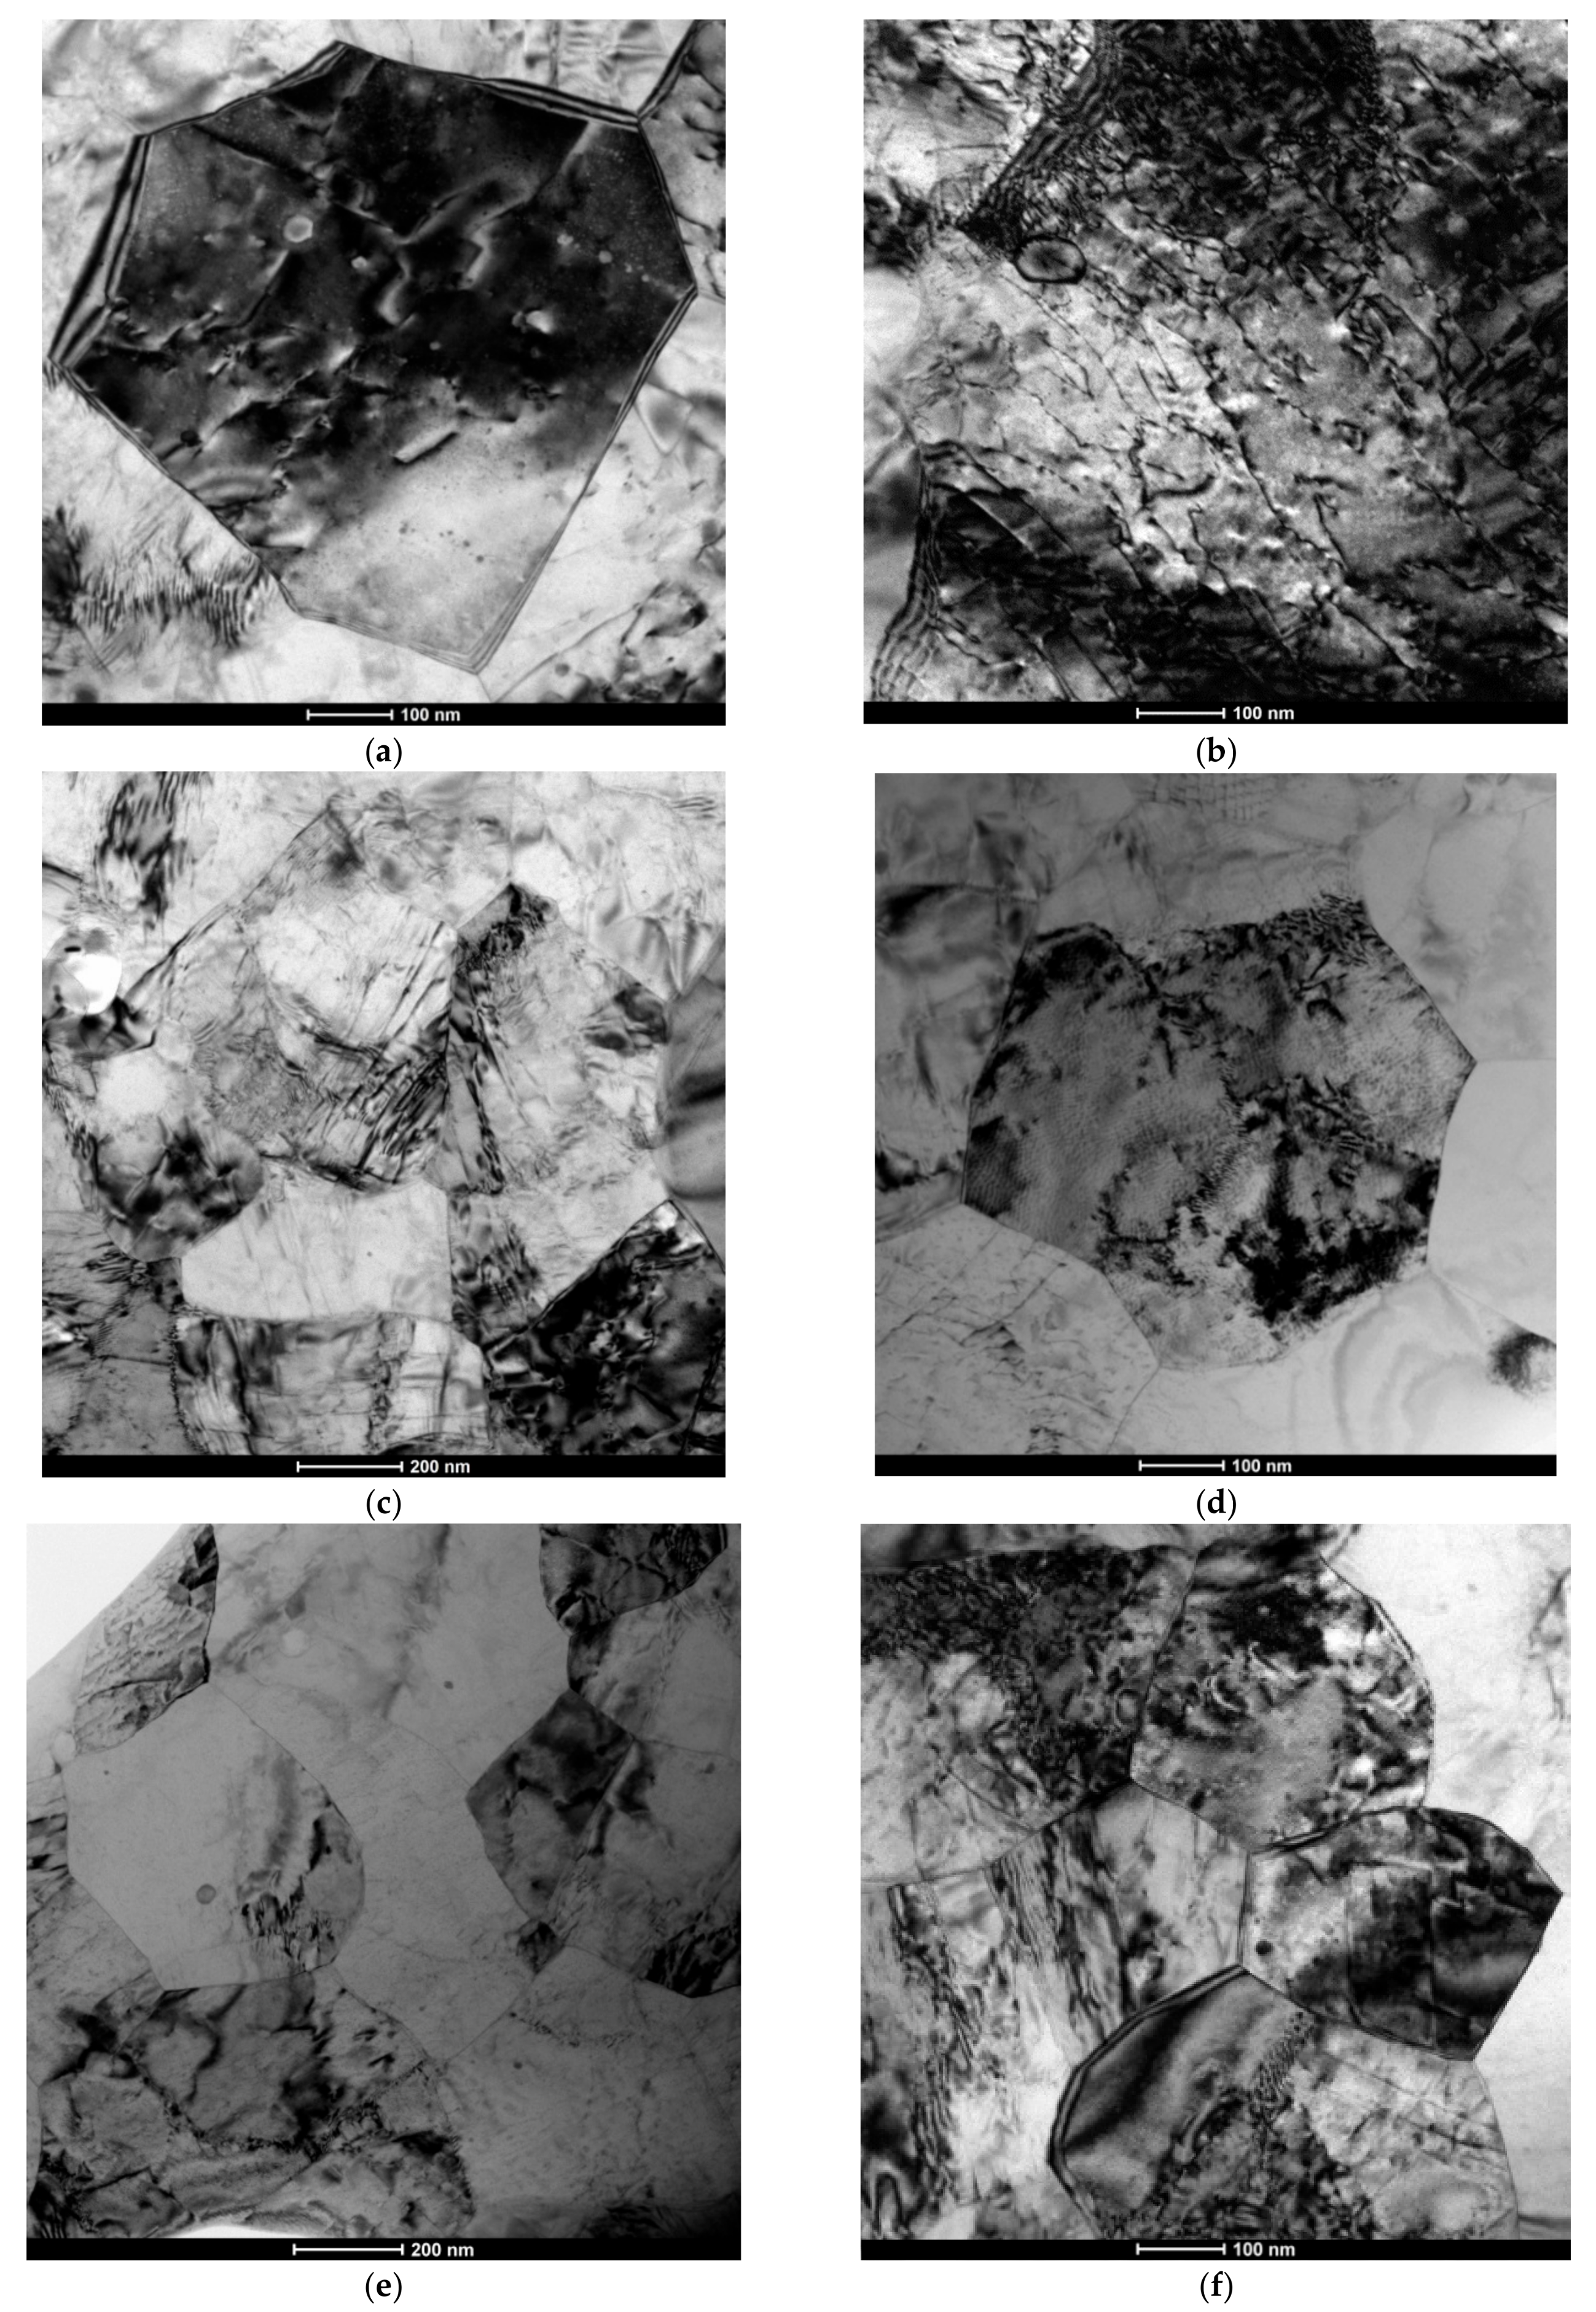
Figure 3.
STEM-EDX maps of chemical elements determined in the AR sample: (a) The maps show variable composition of fine and coarser precipitates and grain boundary segregation elements; (b) STEM-EDX line scan of the coarser precipitate at the grain boundary shows depletion of Cr and Fe and enrichment of Al, Ti, and Y in the precipitate.

Figure 4.
STEM-EDX maps and line profile of chemical composition across the grain boundary in the AR condition: (a) Maps; (b) The line shows enrichment with Cr, Ti, Mo, and slight Ni at the grain boundary.
Figure 4.
STEM-EDX maps and line profile of chemical composition across the grain boundary in the AR condition: (a) Maps; (b) The line shows enrichment with Cr, Ti, Mo, and slight Ni at the grain boundary.
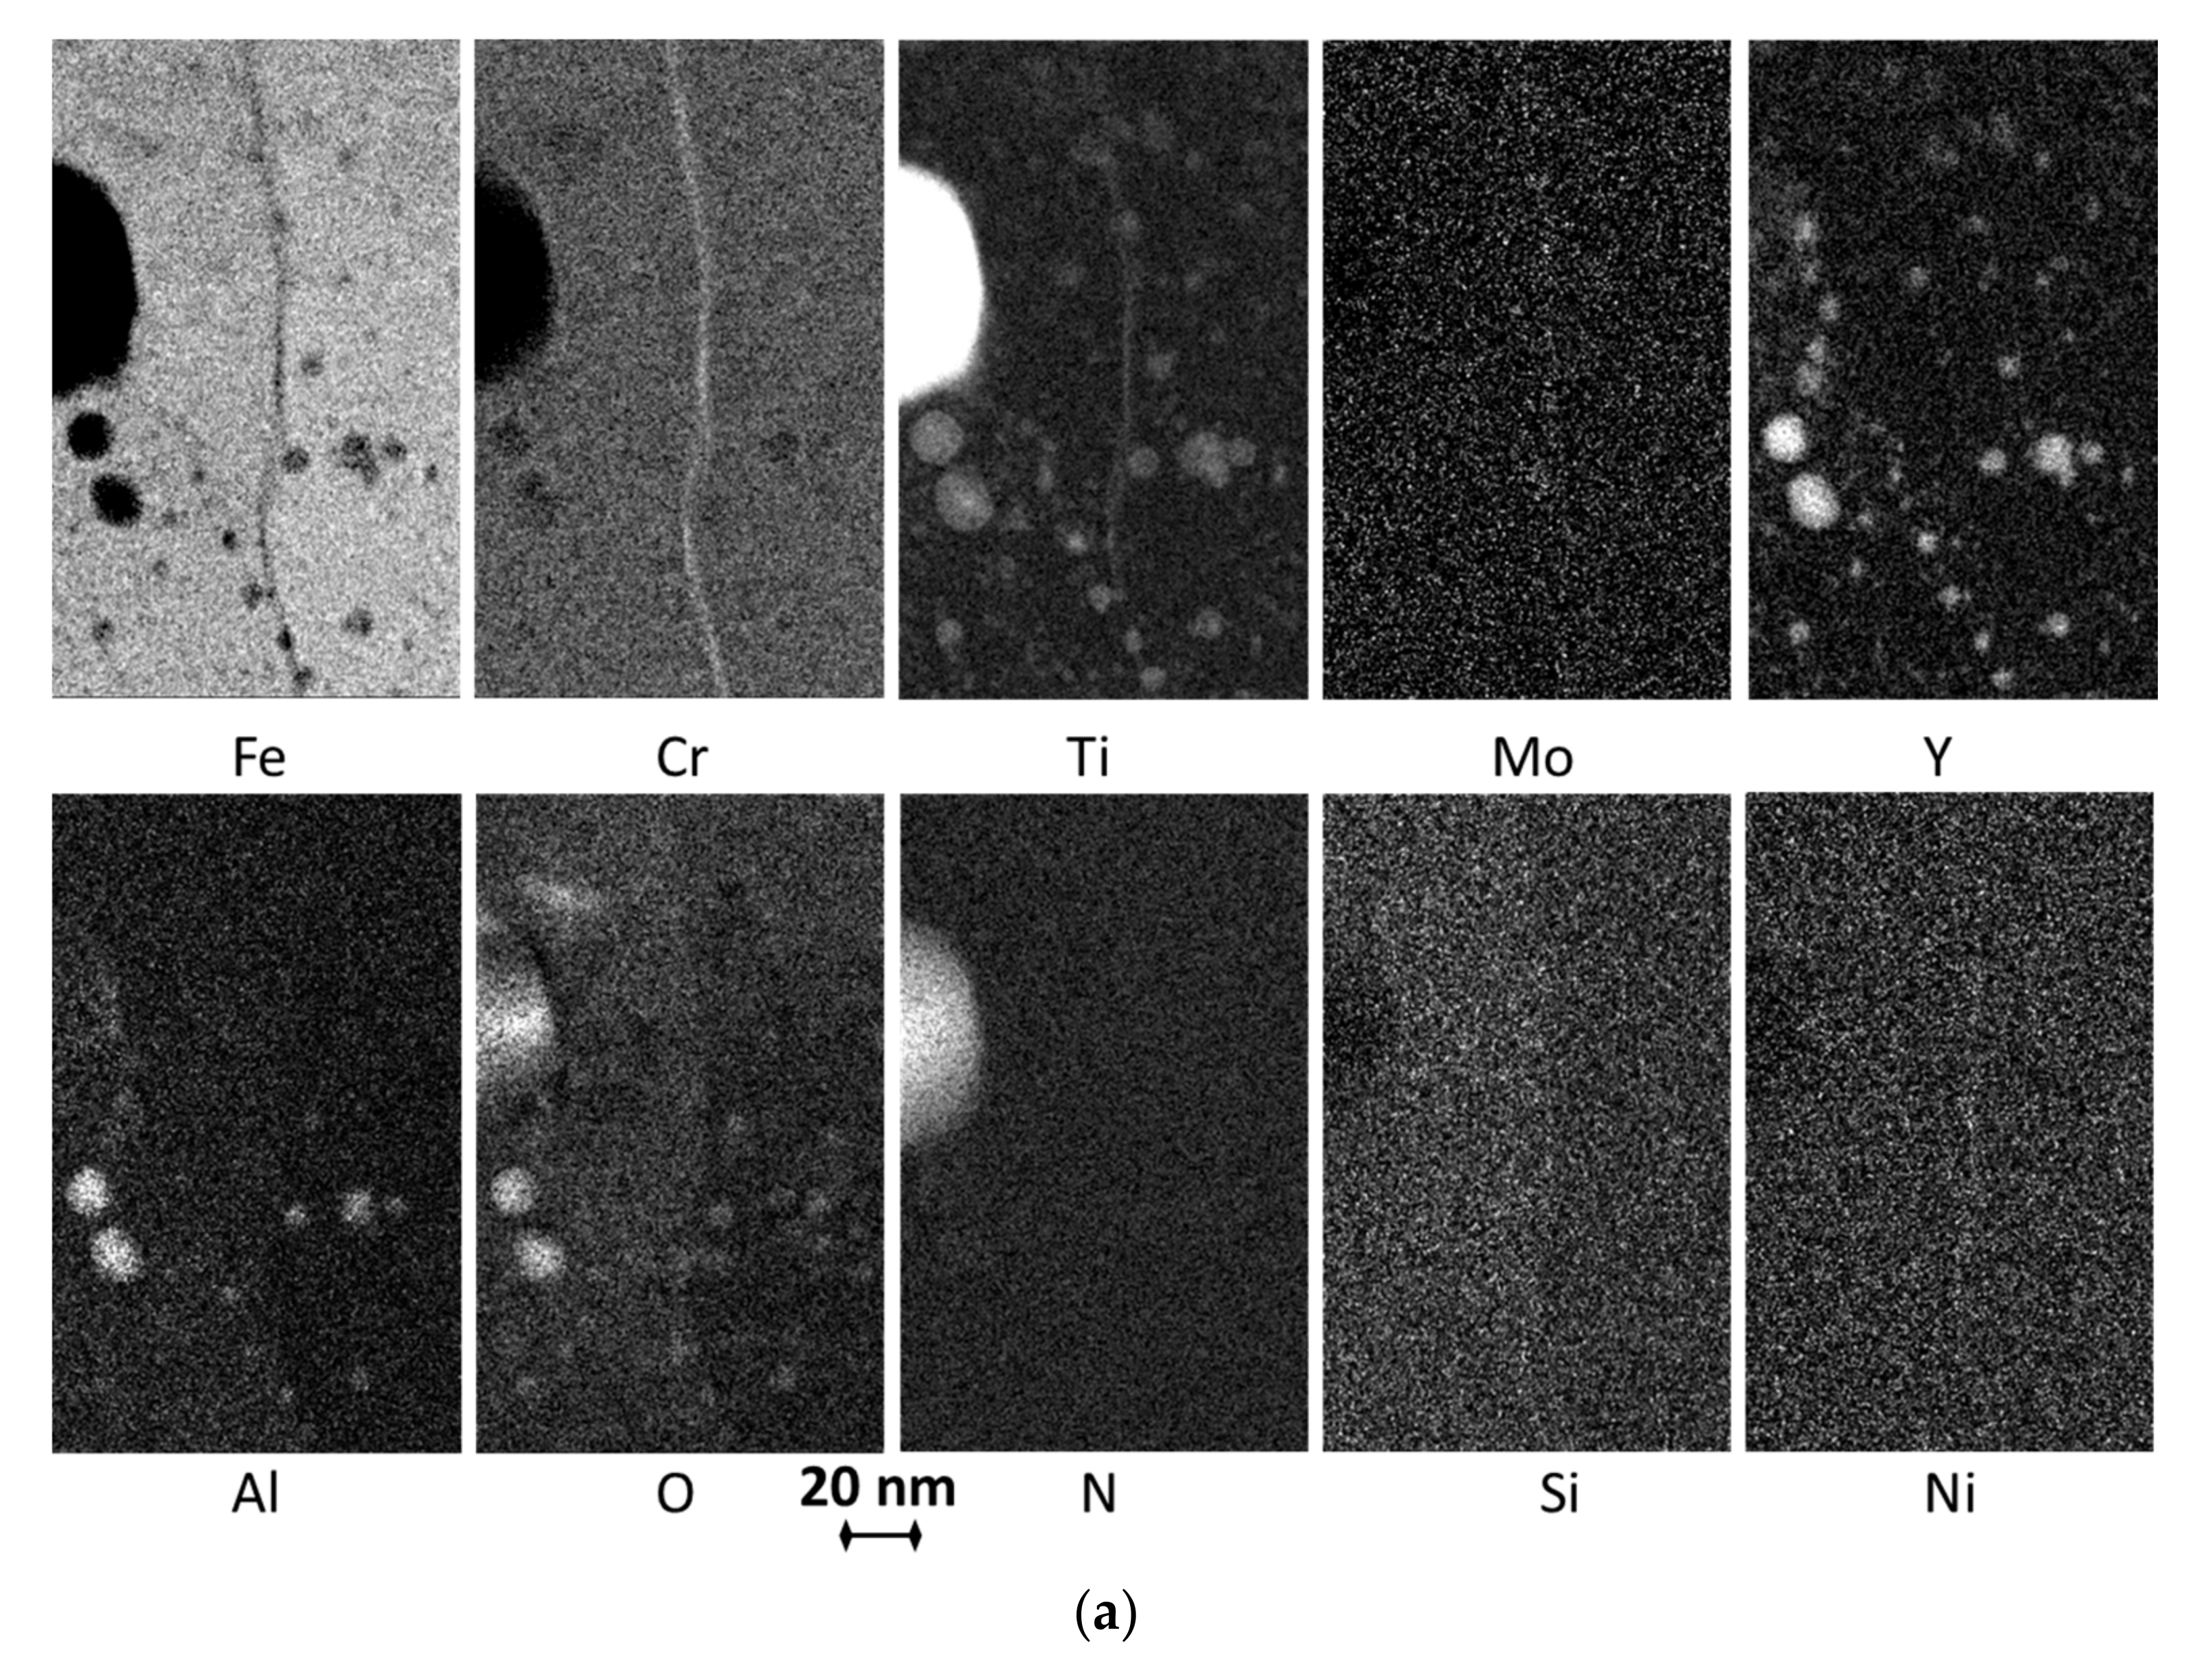

Figure 5.
STEM-EDX maps and profile of chemical composition of coarser precipitate in the He720 condition: (a) The maps show the composition of the particles and enrichment with Cr, Ti, Mo, O, N, Si, and Ni at the grain boundary; (b) The line shows enrichment with Y, Al, and Ti in the coarser particle.
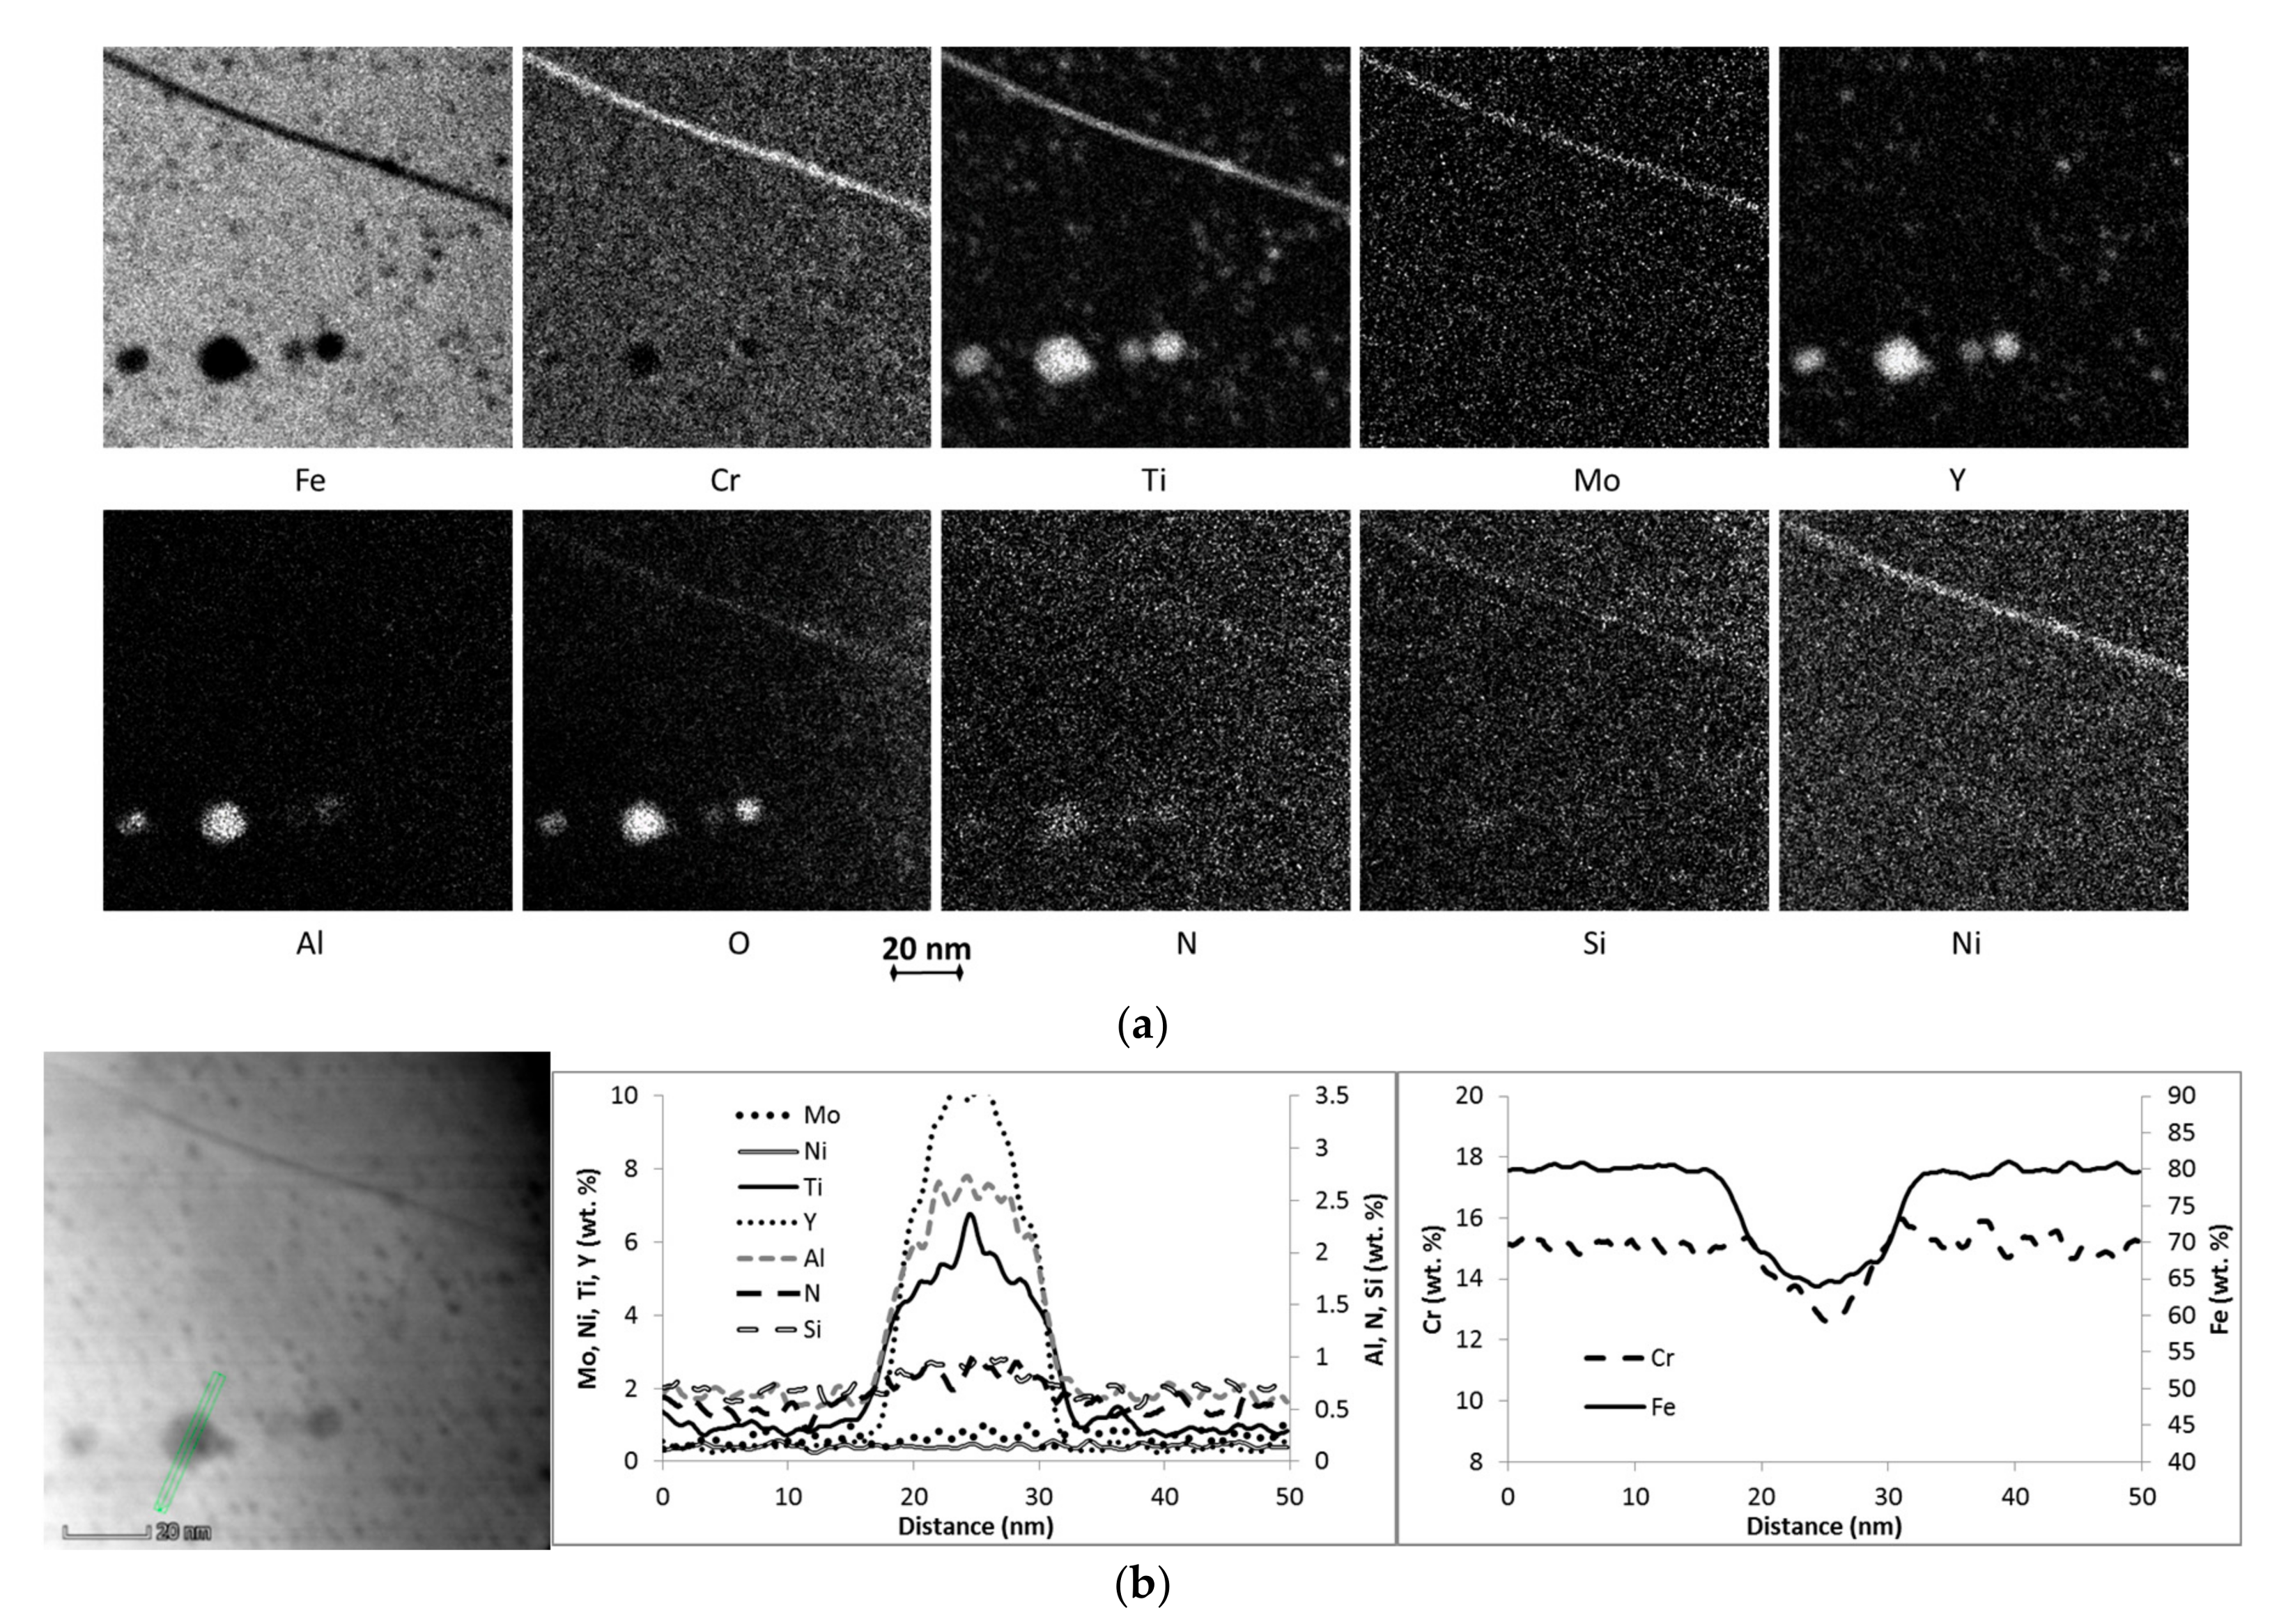
Figure 6.
STEM-EDX map and profile of chemical composition across the grain boundary in the He720 condition: (a) Maps shows enrichment with Cr, Ti, and slight Ni at the grain boundaries; (b) The line shows the high enrichment with Cr and Ti at the grain boundary.
Figure 6.
STEM-EDX map and profile of chemical composition across the grain boundary in the He720 condition: (a) Maps shows enrichment with Cr, Ti, and slight Ni at the grain boundaries; (b) The line shows the high enrichment with Cr and Ti at the grain boundary.
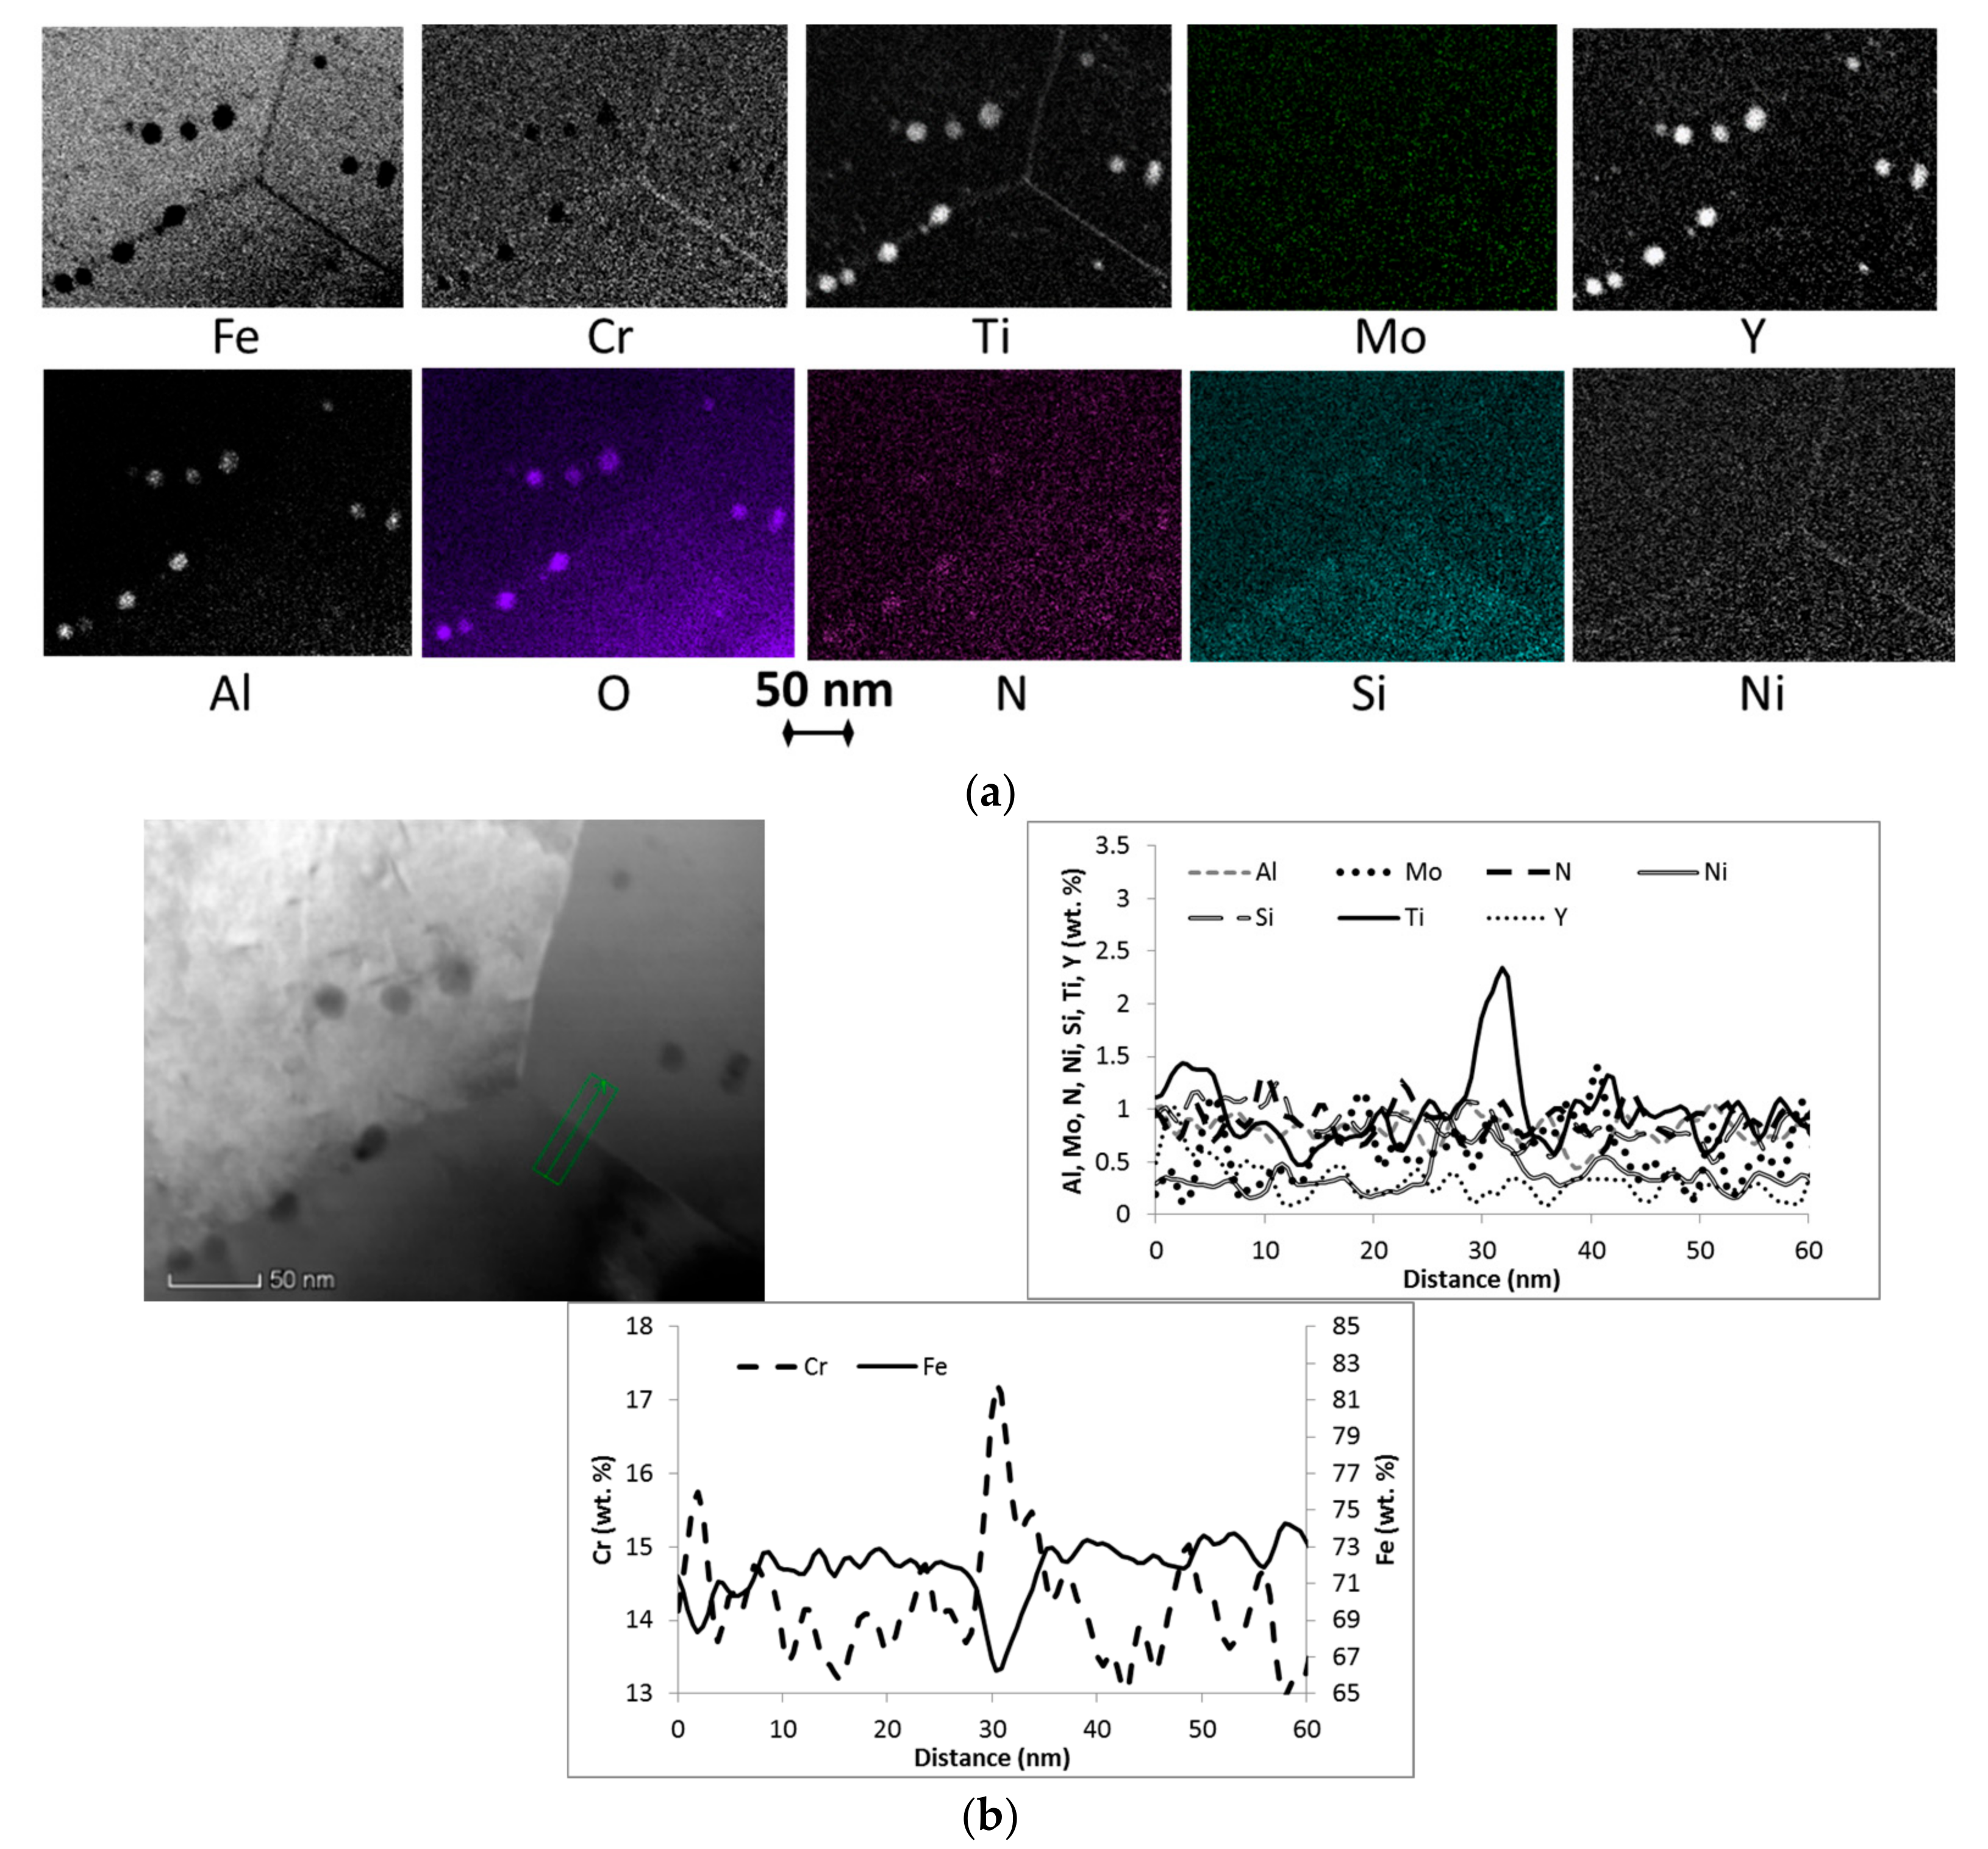
Figure 7.
STEM-EDX maps and the line scan across two coarser precipitates of Air720: (a) Maps showing enrichment of Cr, Ti, Mo, and Ni at the grain boundary; (b) The line shows enrichment of the particles with Al, Y, N, Ti, Si, and depletion by Fe, Cr.
Figure 7.
STEM-EDX maps and the line scan across two coarser precipitates of Air720: (a) Maps showing enrichment of Cr, Ti, Mo, and Ni at the grain boundary; (b) The line shows enrichment of the particles with Al, Y, N, Ti, Si, and depletion by Fe, Cr.


Figure 8.
STEM-EDX profile of chemical composition across a grain boundary in the Air720 condition. It shows distinctive enrichment with Ti, Cr, and slight with Mo and Ni at the grain boundary.
Figure 8.
STEM-EDX profile of chemical composition across a grain boundary in the Air720 condition. It shows distinctive enrichment with Ti, Cr, and slight with Mo and Ni at the grain boundary.

Figure 9.
Specimen weight gain after exposure for 500 h at 720 °C in air (blue dots) and helium (green dots). The dotted lines highlight the average value.
Figure 9.
Specimen weight gain after exposure for 500 h at 720 °C in air (blue dots) and helium (green dots). The dotted lines highlight the average value.

Figure 10.
SEM-EDX line scans and BSE micrographs of the surface after the exposures at 720 °C for 500 h in: (a,c) Helium; (b,d) air.
Figure 10.
SEM-EDX line scans and BSE micrographs of the surface after the exposures at 720 °C for 500 h in: (a,c) Helium; (b,d) air.


Figure 11.
Vickers micro-hardness profiles in the sub-surface region; comparison of AR, Air720, and He720 including the standard 5% deviation.
Figure 11.
Vickers micro-hardness profiles in the sub-surface region; comparison of AR, Air720, and He720 including the standard 5% deviation.
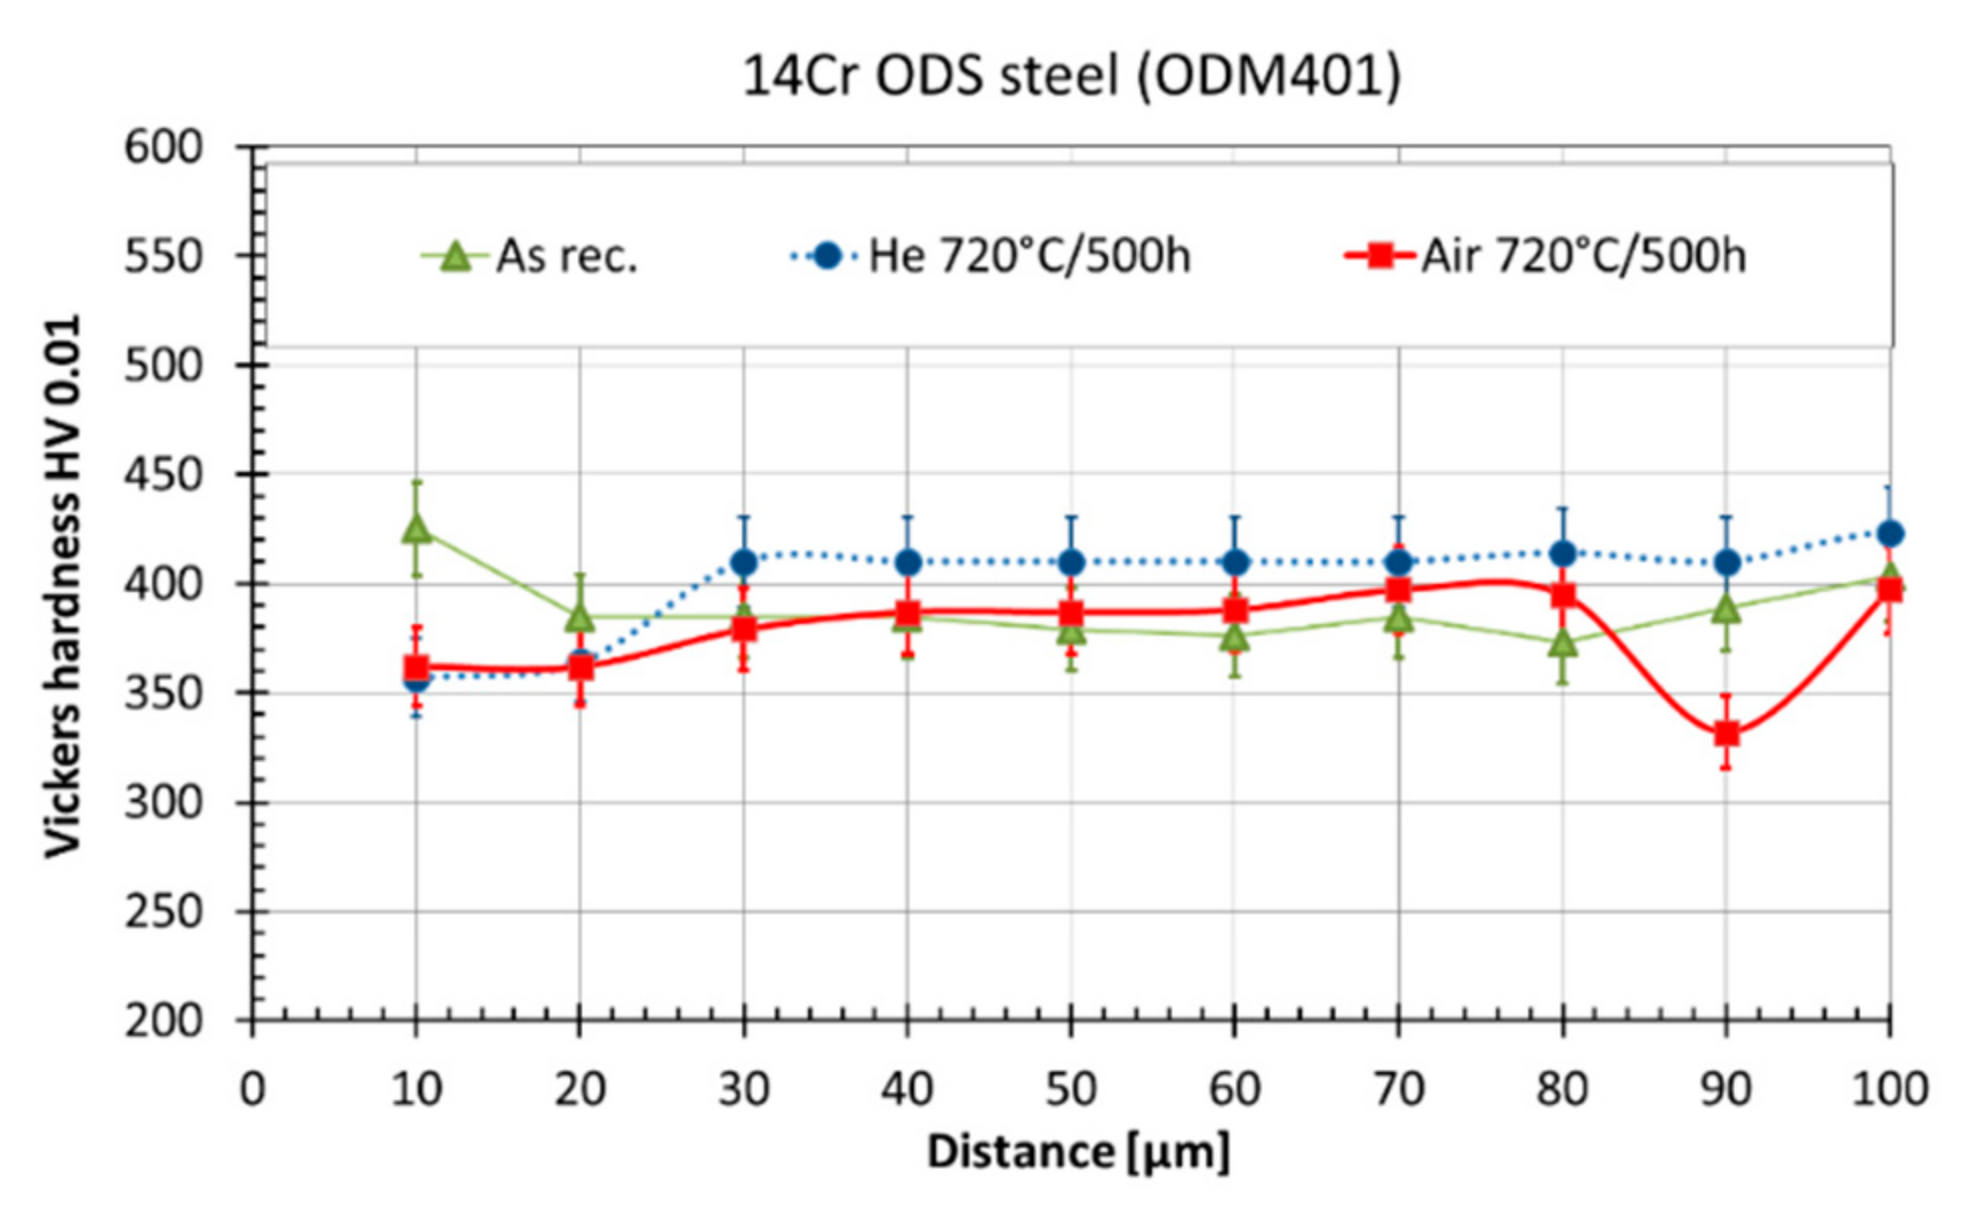
Figure 12.
The dependence of the impact energy on the temperature for three 14Cr ODS steel conditions measured using Mini Charpy (KLST) specimens.
Figure 12.
The dependence of the impact energy on the temperature for three 14Cr ODS steel conditions measured using Mini Charpy (KLST) specimens.
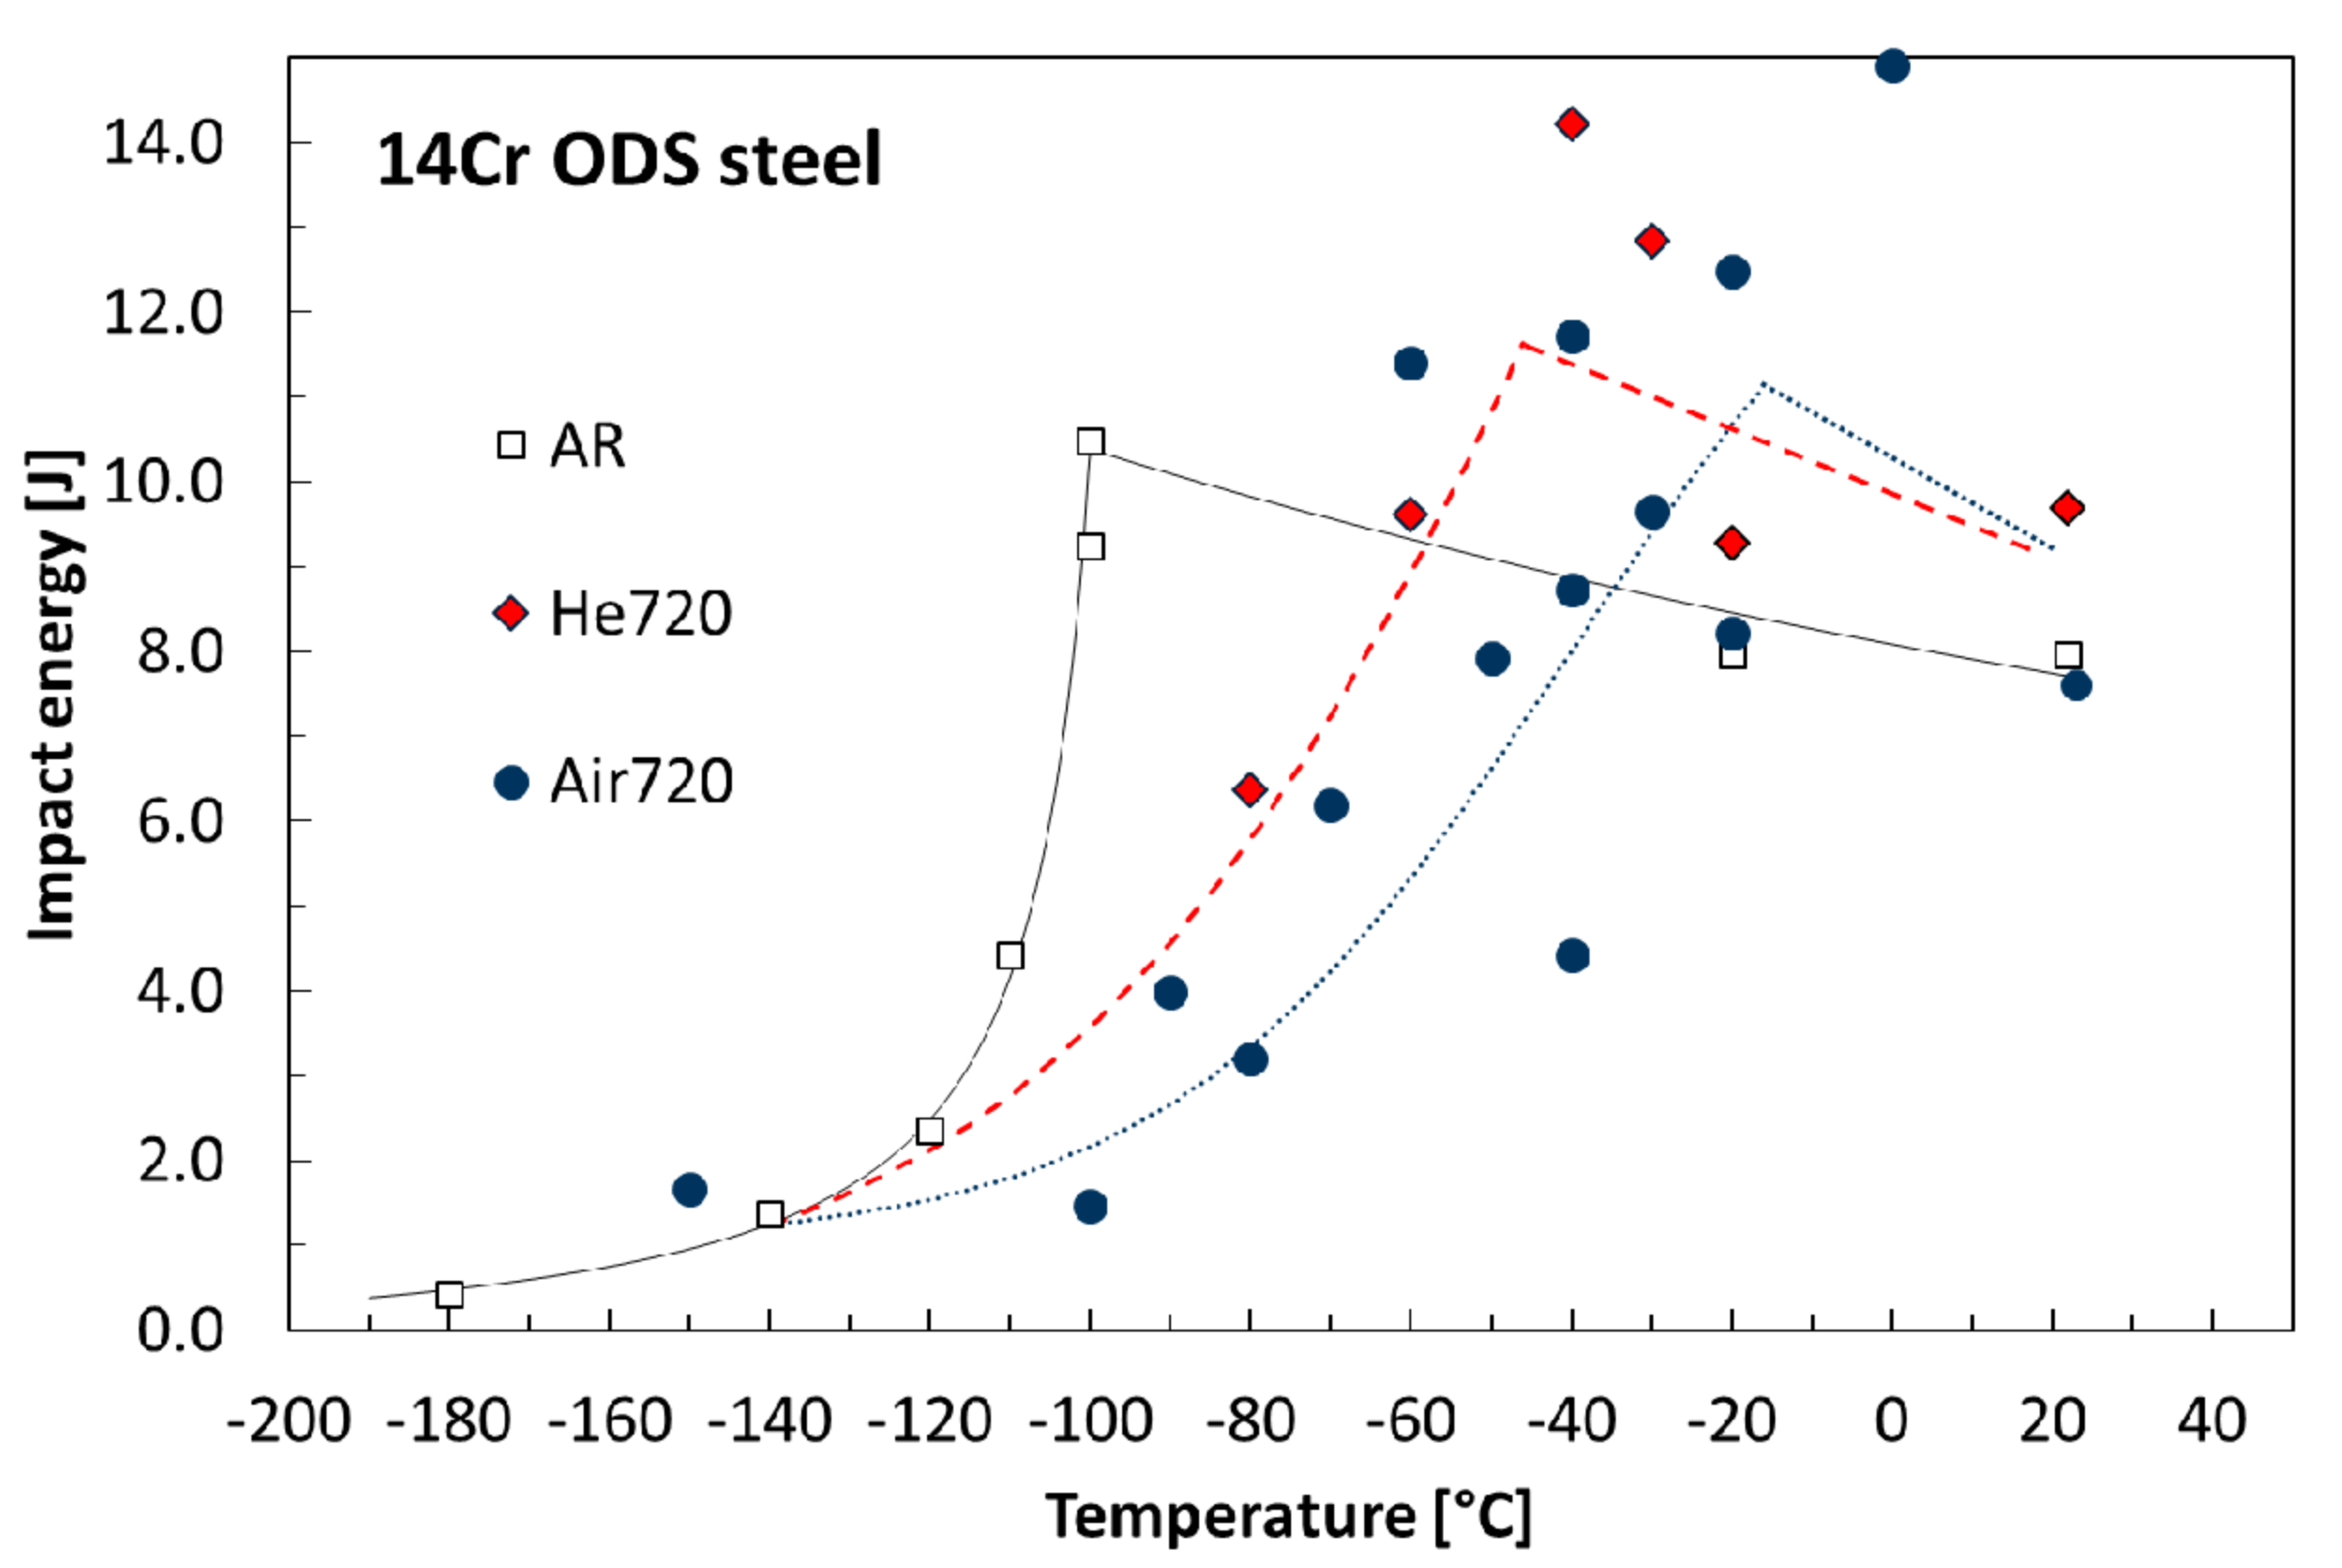
Figure 13.
Air720, impact fracture at −100 °C: (a) Fracture initiation zone; (b) Detail of cleavage facet from (a); (c) Schematic of preferential orientation of initiated cracks in the impact fracture zone.
Figure 13.
Air720, impact fracture at −100 °C: (a) Fracture initiation zone; (b) Detail of cleavage facet from (a); (c) Schematic of preferential orientation of initiated cracks in the impact fracture zone.

Figure 14.
Detail fracture appearance: (a) cleavage in LSE region (Air720, −150 °C); (b) ductile fracture in transition region (Air720, −30 °C); (c) ductile dimples in USE (He720, 23 °C).
Figure 14.
Detail fracture appearance: (a) cleavage in LSE region (Air720, −150 °C); (b) ductile fracture in transition region (Air720, −30 °C); (c) ductile dimples in USE (He720, 23 °C).


Table 1.
Chemical composition of the 14Cr ODS steel in weight percent.
| Element | Fe | C | Cr | Ti | Mo | Y2O3 | Y | Al | O | N | Si | Ar | Ni |
|---|---|---|---|---|---|---|---|---|---|---|---|---|---|
| 14Cr ODS bar 1 | bal. | 0.024 | 13.6 | 0.85 | 0.29 | 0.25 | - | 0.06 | 0.182 | 0.048 | - | - | - |
| AR TEM-EDX 2 | 74.8 | n.a. | 14.15 | 0.93 | 0.55 | n.a. | 0.35 | 0.37 | n.a. 3 | 0.43 | 0.47 | 0.37 | 0.32 |
1 Results of chemical analyses. 2 Data of STEM-EDX analysis of the AR TEM foil. 3 O was not included because TEM foils quickly oxidized and did not avoid some oxidation during transport.
Table 2.
Characteristics of the 14Cr ODS steel microstructure.
| Material Condition | Average Grain Size, nm | Cavity Density/Average Size, %/µm | Composition 1 of Particles >10 nm, wt. % | Grain Boundary Local Chemistry 1, wt. % |
|---|---|---|---|---|
| AR | 380 ± 140 | 0.3%/1.2 ± 0.3 | ~75Fe, 6-27Y 2, 8-13Cr, 3-14Ti, 1.5-2.5Al, 0.3Si, 0.5-1N, 0.4Ni | ~71Fe, 16Cr, 1.5Ti, 1Mo, 0.4Al, 0.4N, 0.4Si,0.4Y, 0.4Ni |
| Air720 | n.a. | 0.2%/1.5 ± 0.4 | ~55Fe, 8-16Y 2, 10-12Cr, 4-8Ti, 1-5Al, 1.2-2.3Si, 1-2N, 0.4-0.6Ni | ~64Fe, 17.5Cr, 3.4Ti, 1.2Mo, 0.8Al, 1.3N, 1.2Si, 0.3-0.4Y, 1Ni |
| He720 | 360 ± 150 | 0.2%/1.7 ± 0.4 | ~65Fe, 7-21Y, 8-12Cr, 5-15Ti, 1.5-5Al, 1Si, 1-2N, 0.4Ni | ~66Fe, 17Cr, 2.3Ti, 0.8Mo, 0.8-1Al, 0.9N, 1Si, 0.3Y, 0.6-0.8Ni |
1 The numbers are rough estimates because are taken from 1 to 3 locations that may not represent the whole sample; Oxygen was excluded from the analyses. 2 In AR and Air720, rare occurred coarse Ti particles (about 50 nm) without Y.
Table 3.
Characteristic mechanical behavior parameters measured for the ODS steel.
| Material Condition | Rp0.2 (20 °C), MPa | Rm (20 °C), MPa | Rfr (20 °C), MPa | HV 0.01 50 µm below Surface | DBTT 1, °C |
|---|---|---|---|---|---|
| AR | 1005 | 1136 | 760 | 380 ± 20 | −106 ± 5 |
| Air720 | n.a. | n.a. | n.a. | 390 ± 20 | −50 ± 10 |
| He720 | 1031 | 1147 | 749 | 410 ± 20 | −70 ± 10 |
1 DBTT are evaluated from Mini Charpy (KLST) specimens.
© 2017 by the authors. Licensee MDPI, Basel, Switzerland. This article is an open access article distributed under the terms and conditions of the Creative Commons Attribution (CC BY) license (http://creativecommons.org/licenses/by/4.0/).
Share and Cite
MDPI and ACS Style
Hojna, A.; Michalicka, J.; Hadraba, H.; Di Gabriele, F.; Duchon, J.; Rozumova, L.; Husak, R. Fracture Resistance of 14Cr ODS Steel Exposed to a High Temperature Gas. Metals 2017, 7, 560. https://doi.org/10.3390/met7120560
AMA Style
Hojna A, Michalicka J, Hadraba H, Di Gabriele F, Duchon J, Rozumova L, Husak R. Fracture Resistance of 14Cr ODS Steel Exposed to a High Temperature Gas. Metals. 2017; 7(12):560. https://doi.org/10.3390/met7120560
Chicago/Turabian StyleHojna, Anna, Jan Michalicka, Hynek Hadraba, Fosca Di Gabriele, Jan Duchon, Lucia Rozumova, and Roman Husak. 2017. "Fracture Resistance of 14Cr ODS Steel Exposed to a High Temperature Gas" Metals 7, no. 12: 560. https://doi.org/10.3390/met7120560
Note that from the first issue of 2016, this journal uses article numbers instead of page numbers. See further details here.