
Nanoporous Microtubes via Oxidation and Reduction of Cu–Ni Commercial Wires


Abstract
:1. Introduction
2. Materials and Methods
3. Results
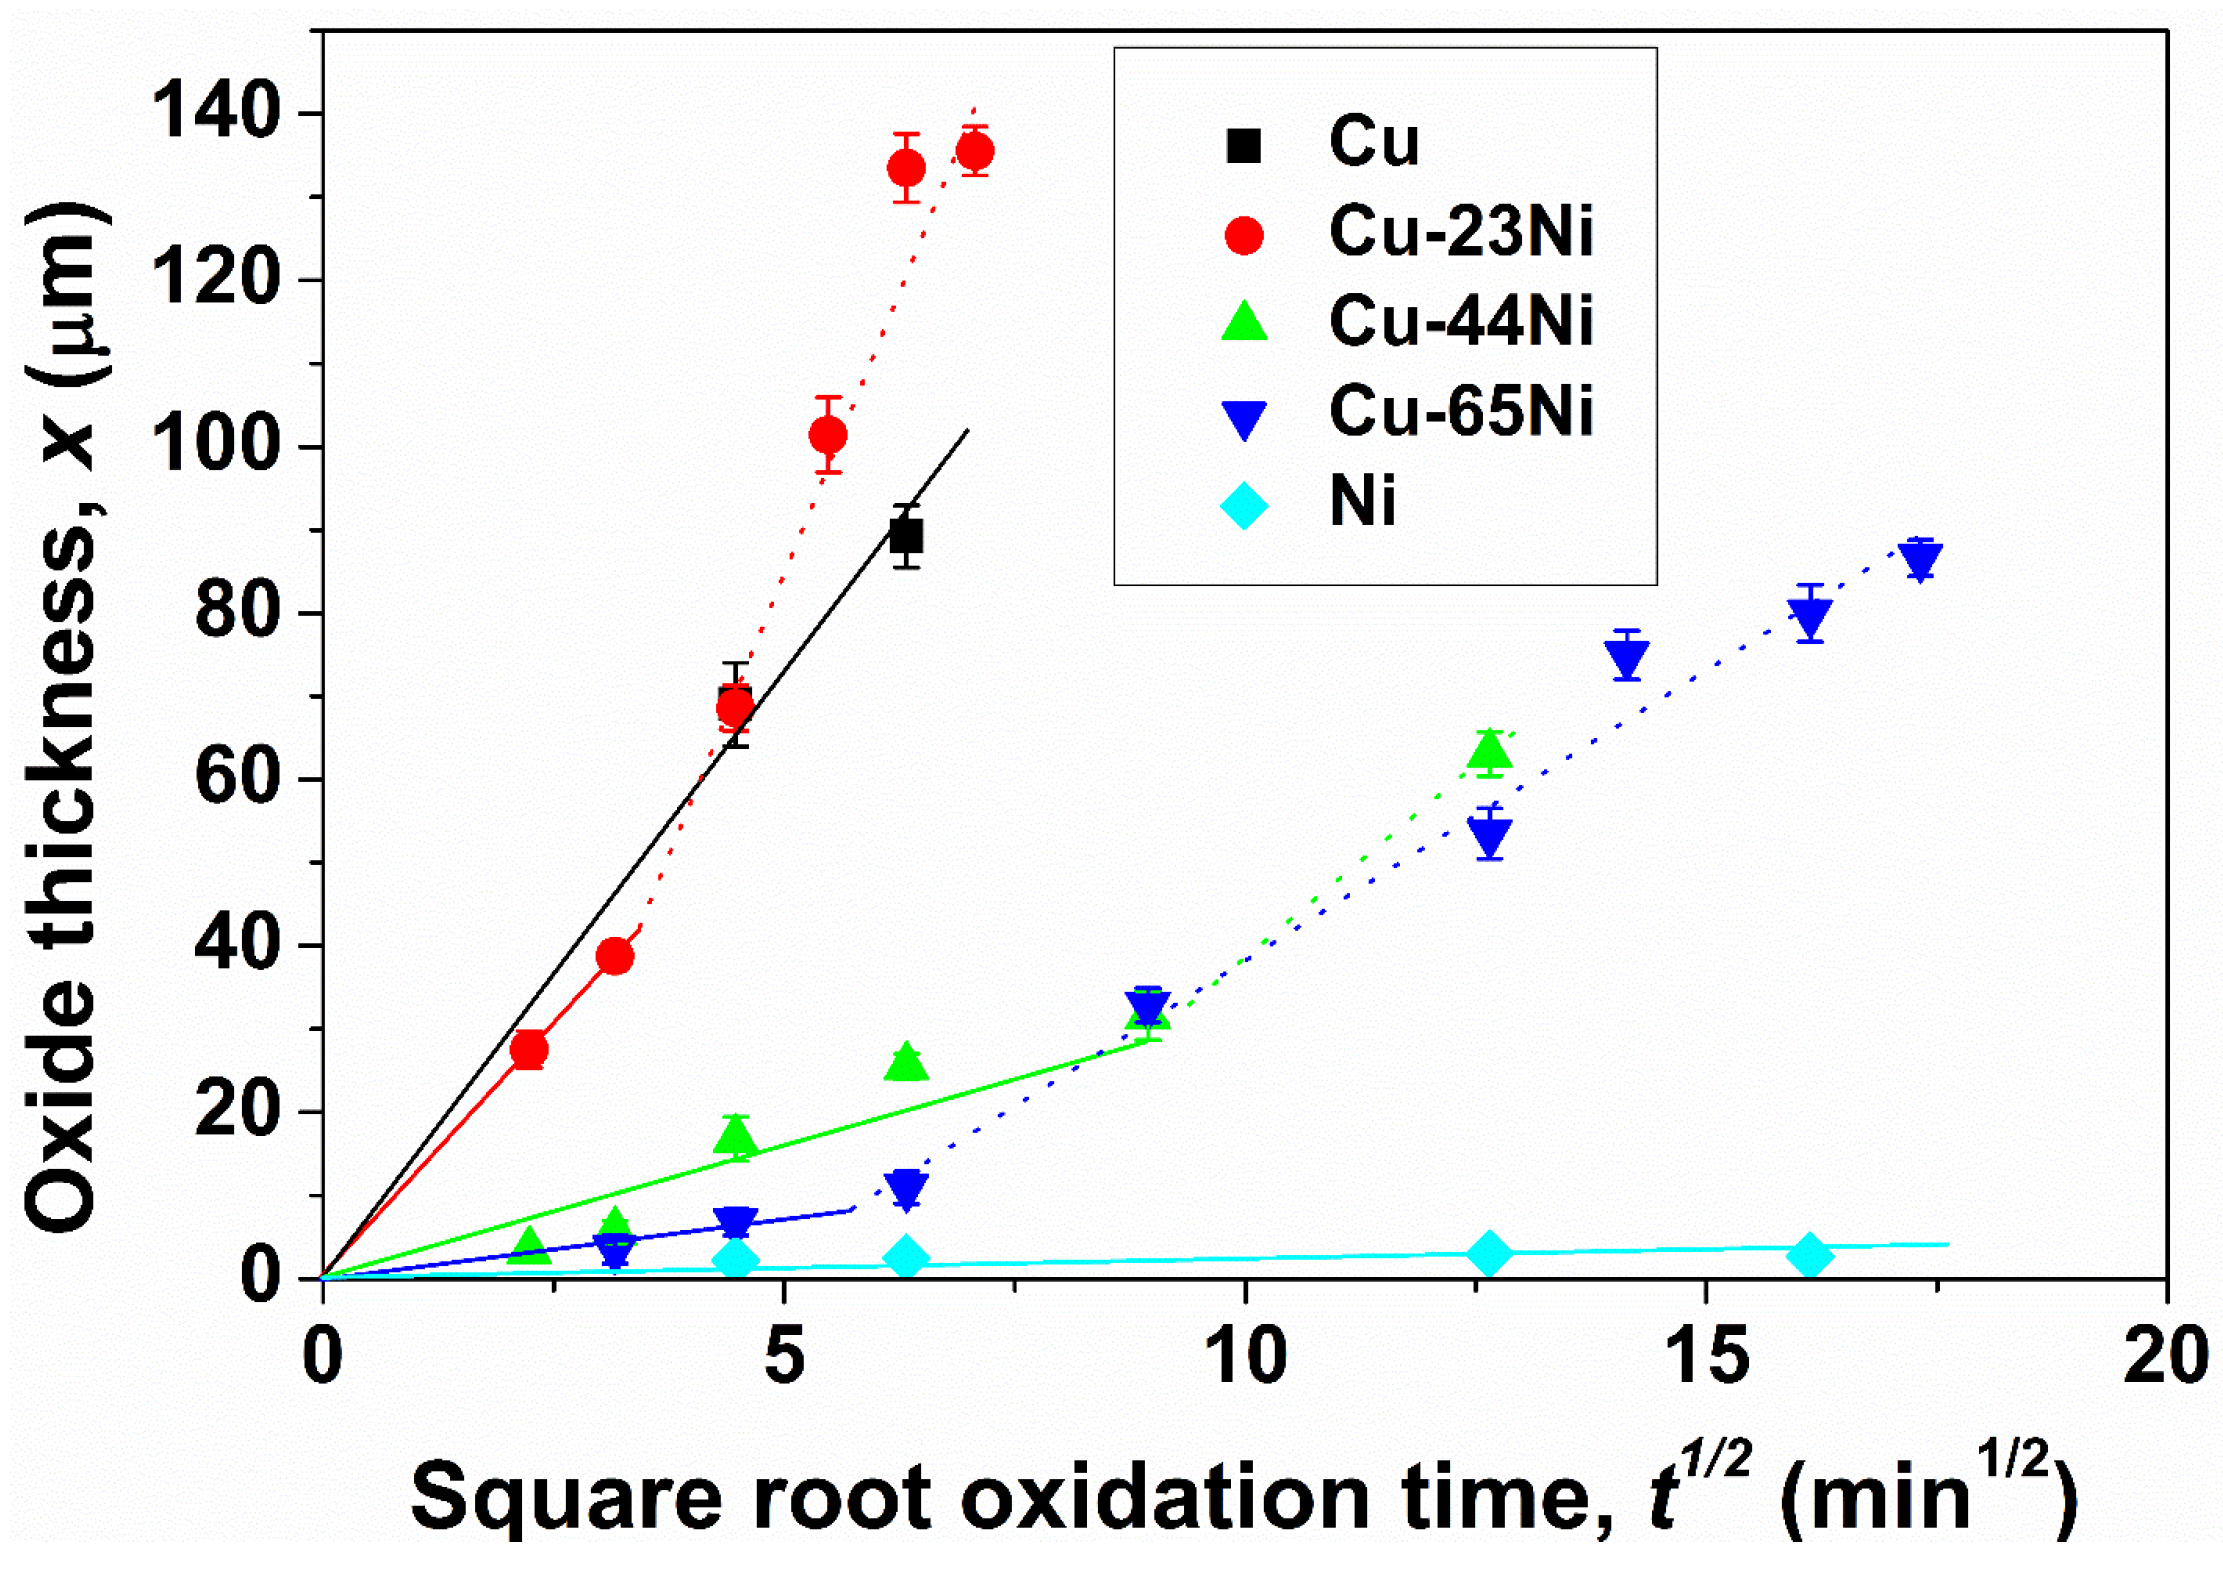
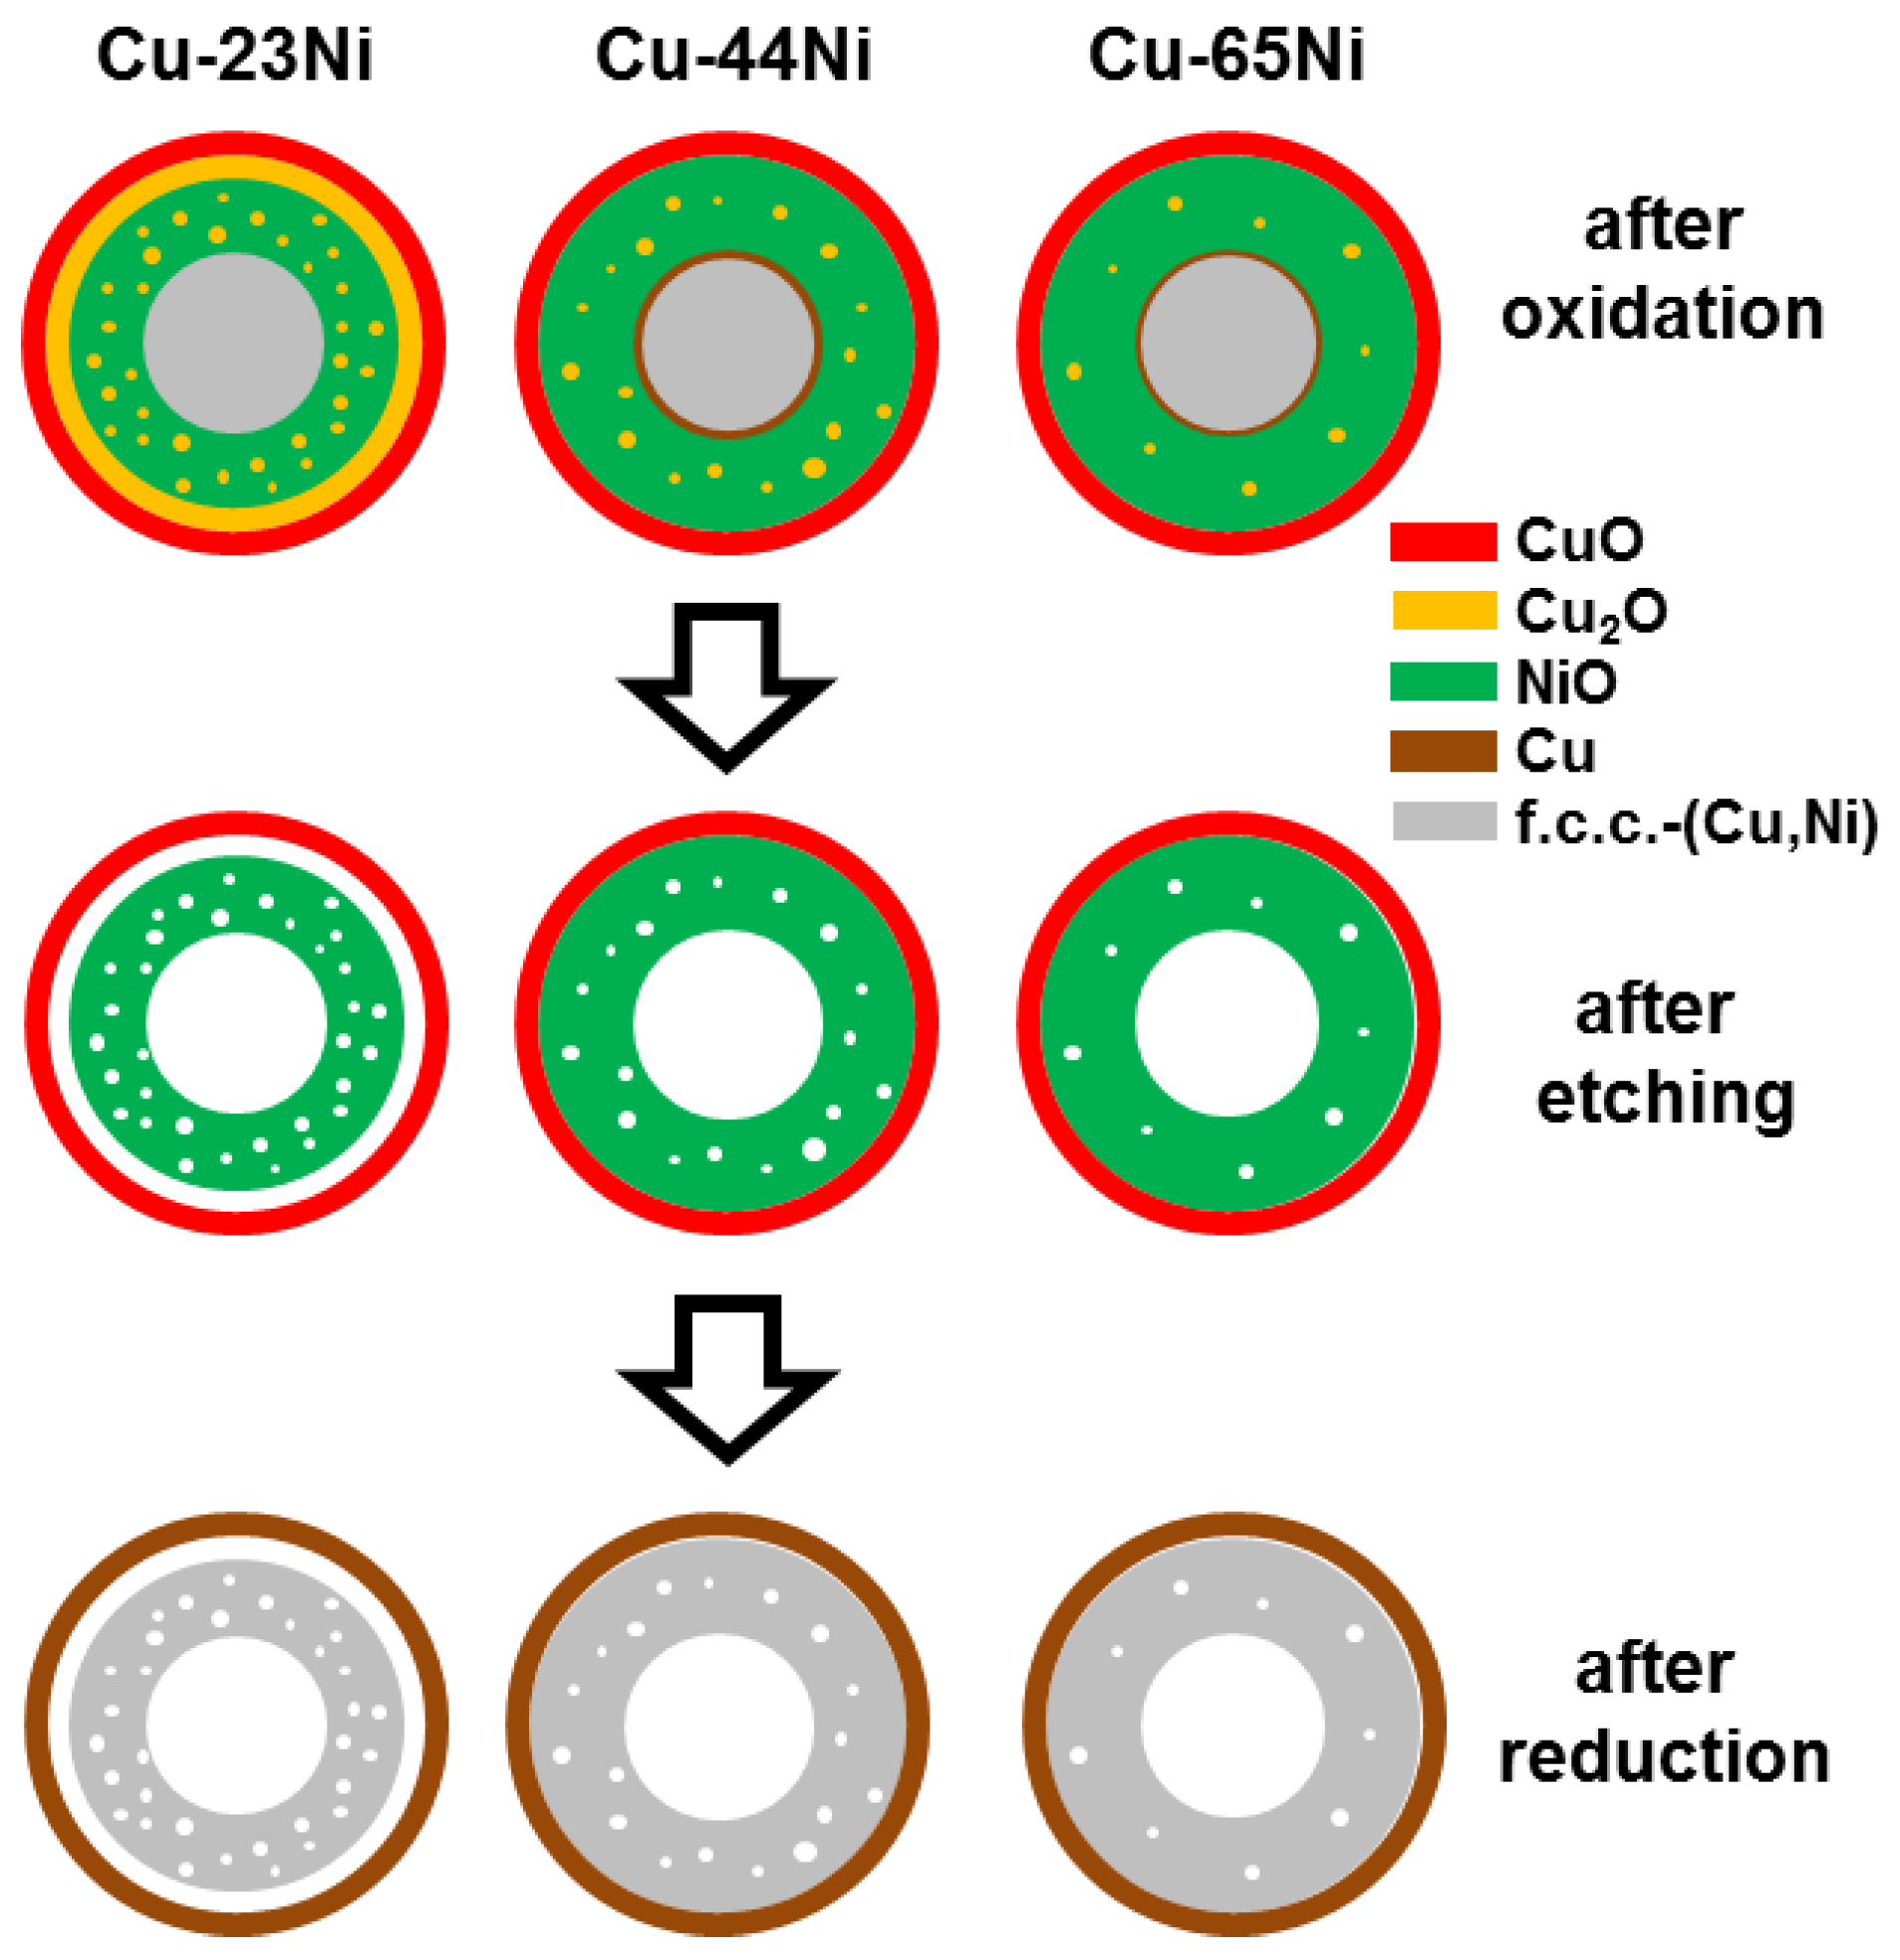
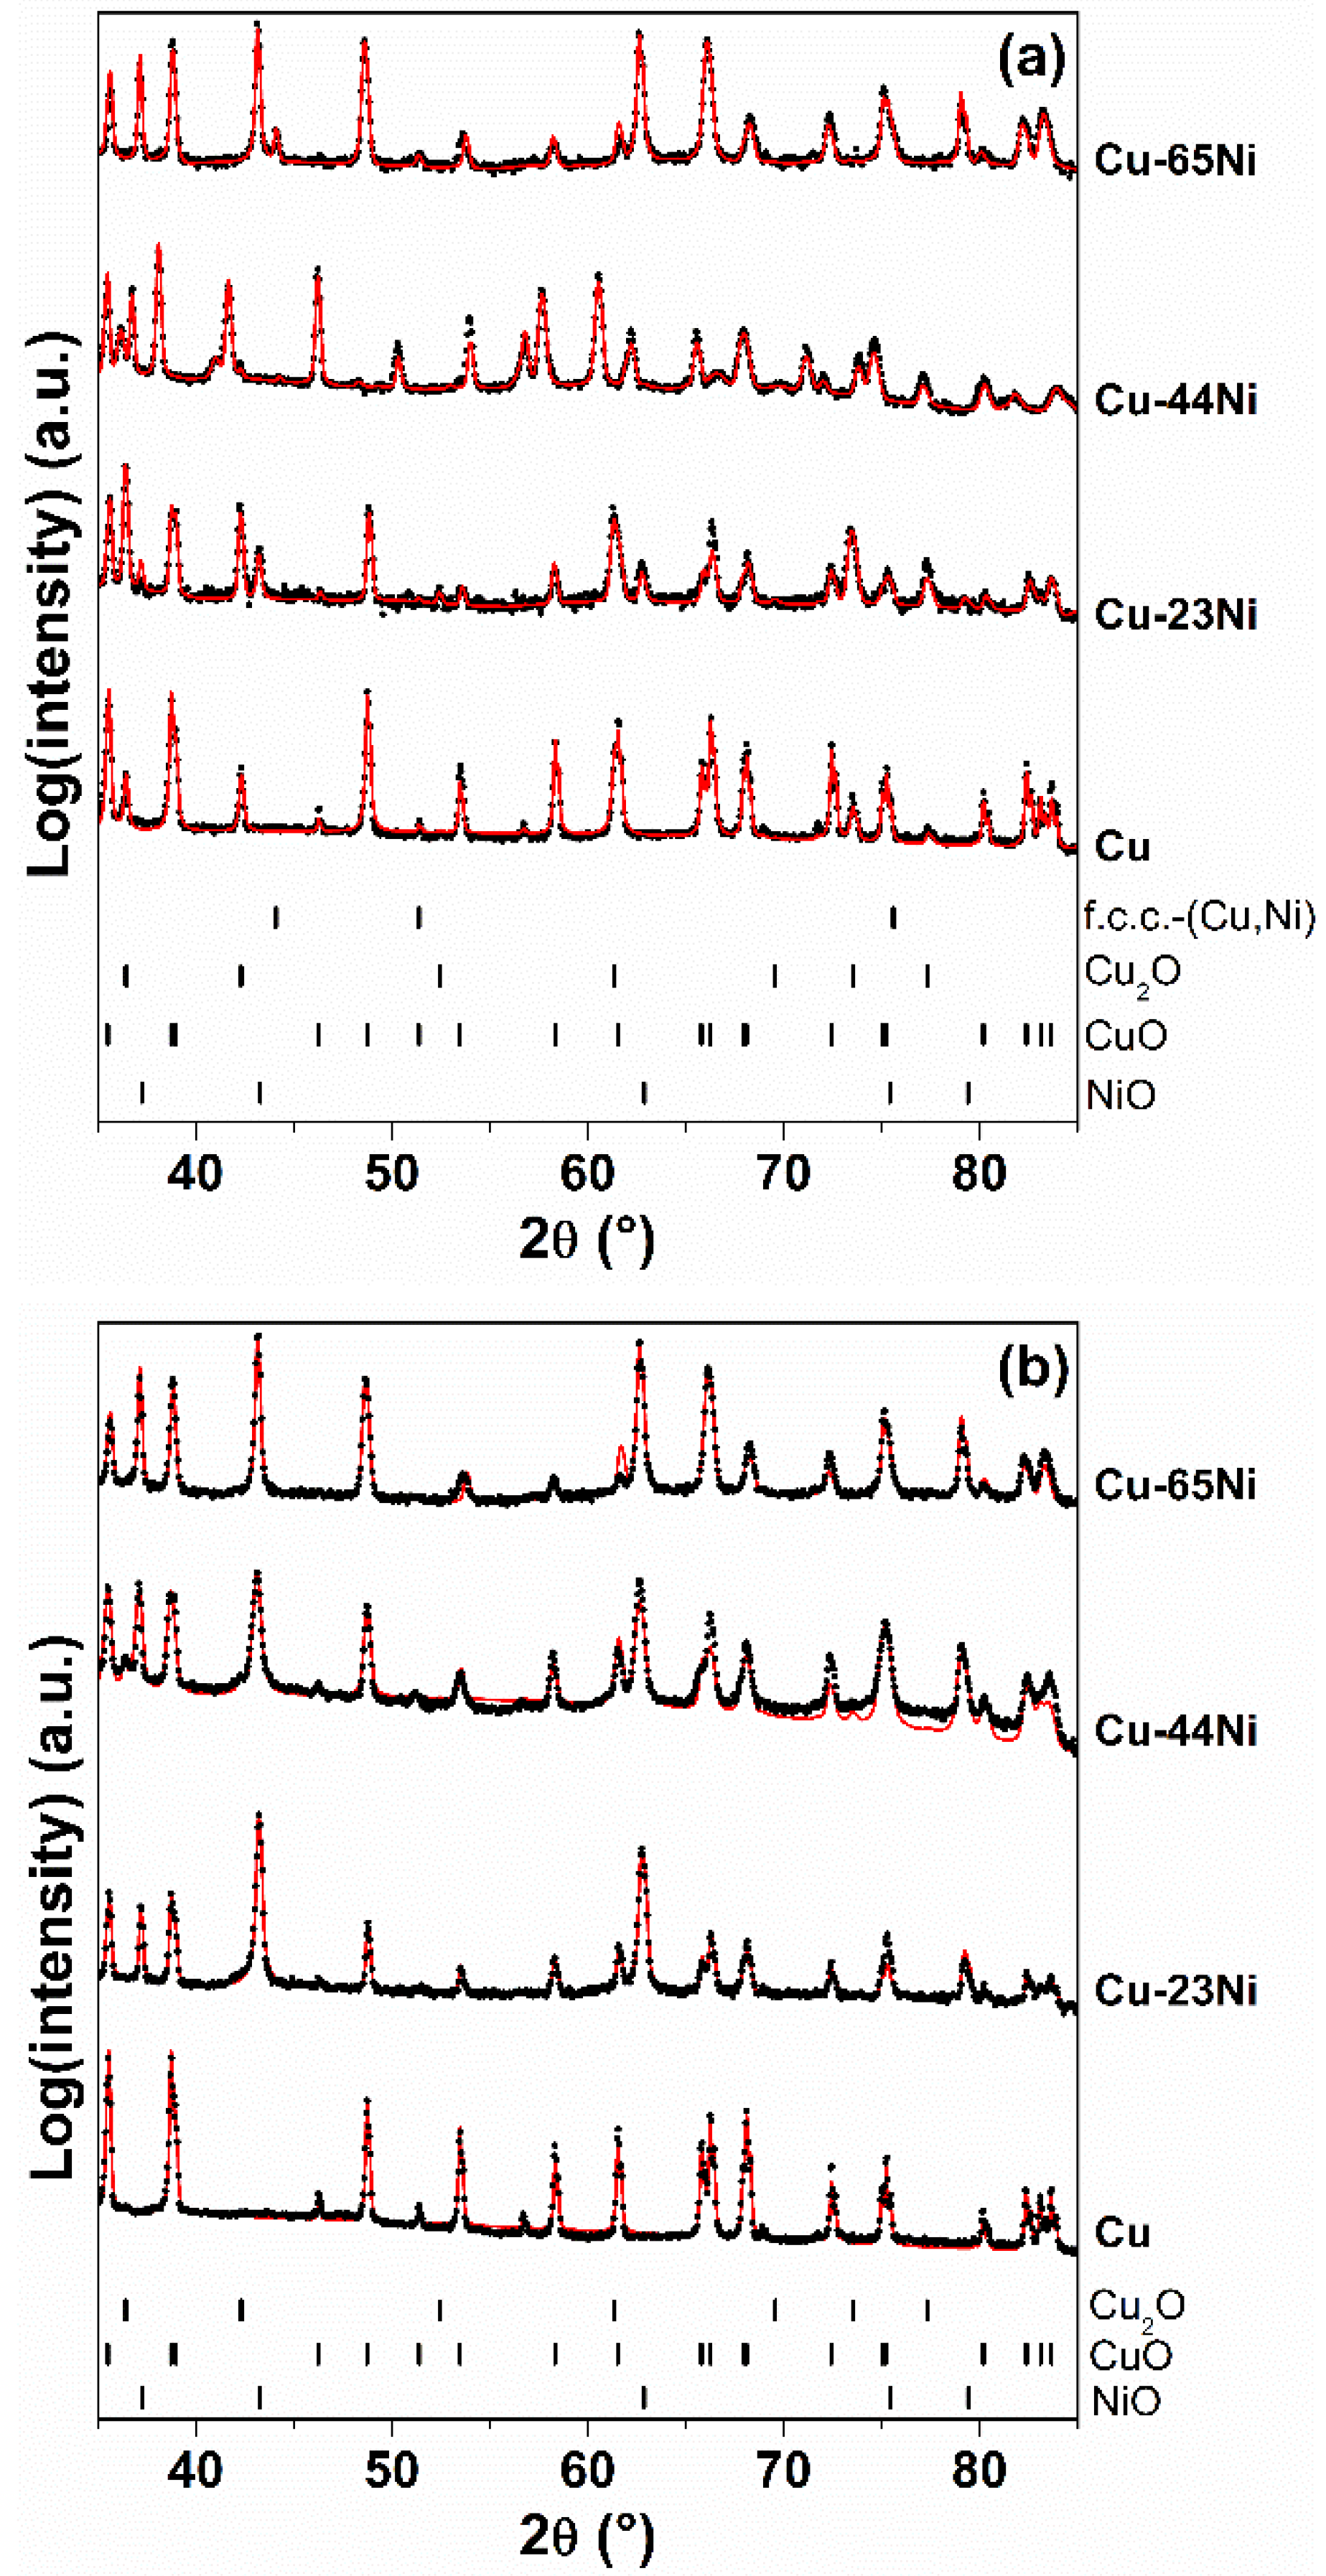
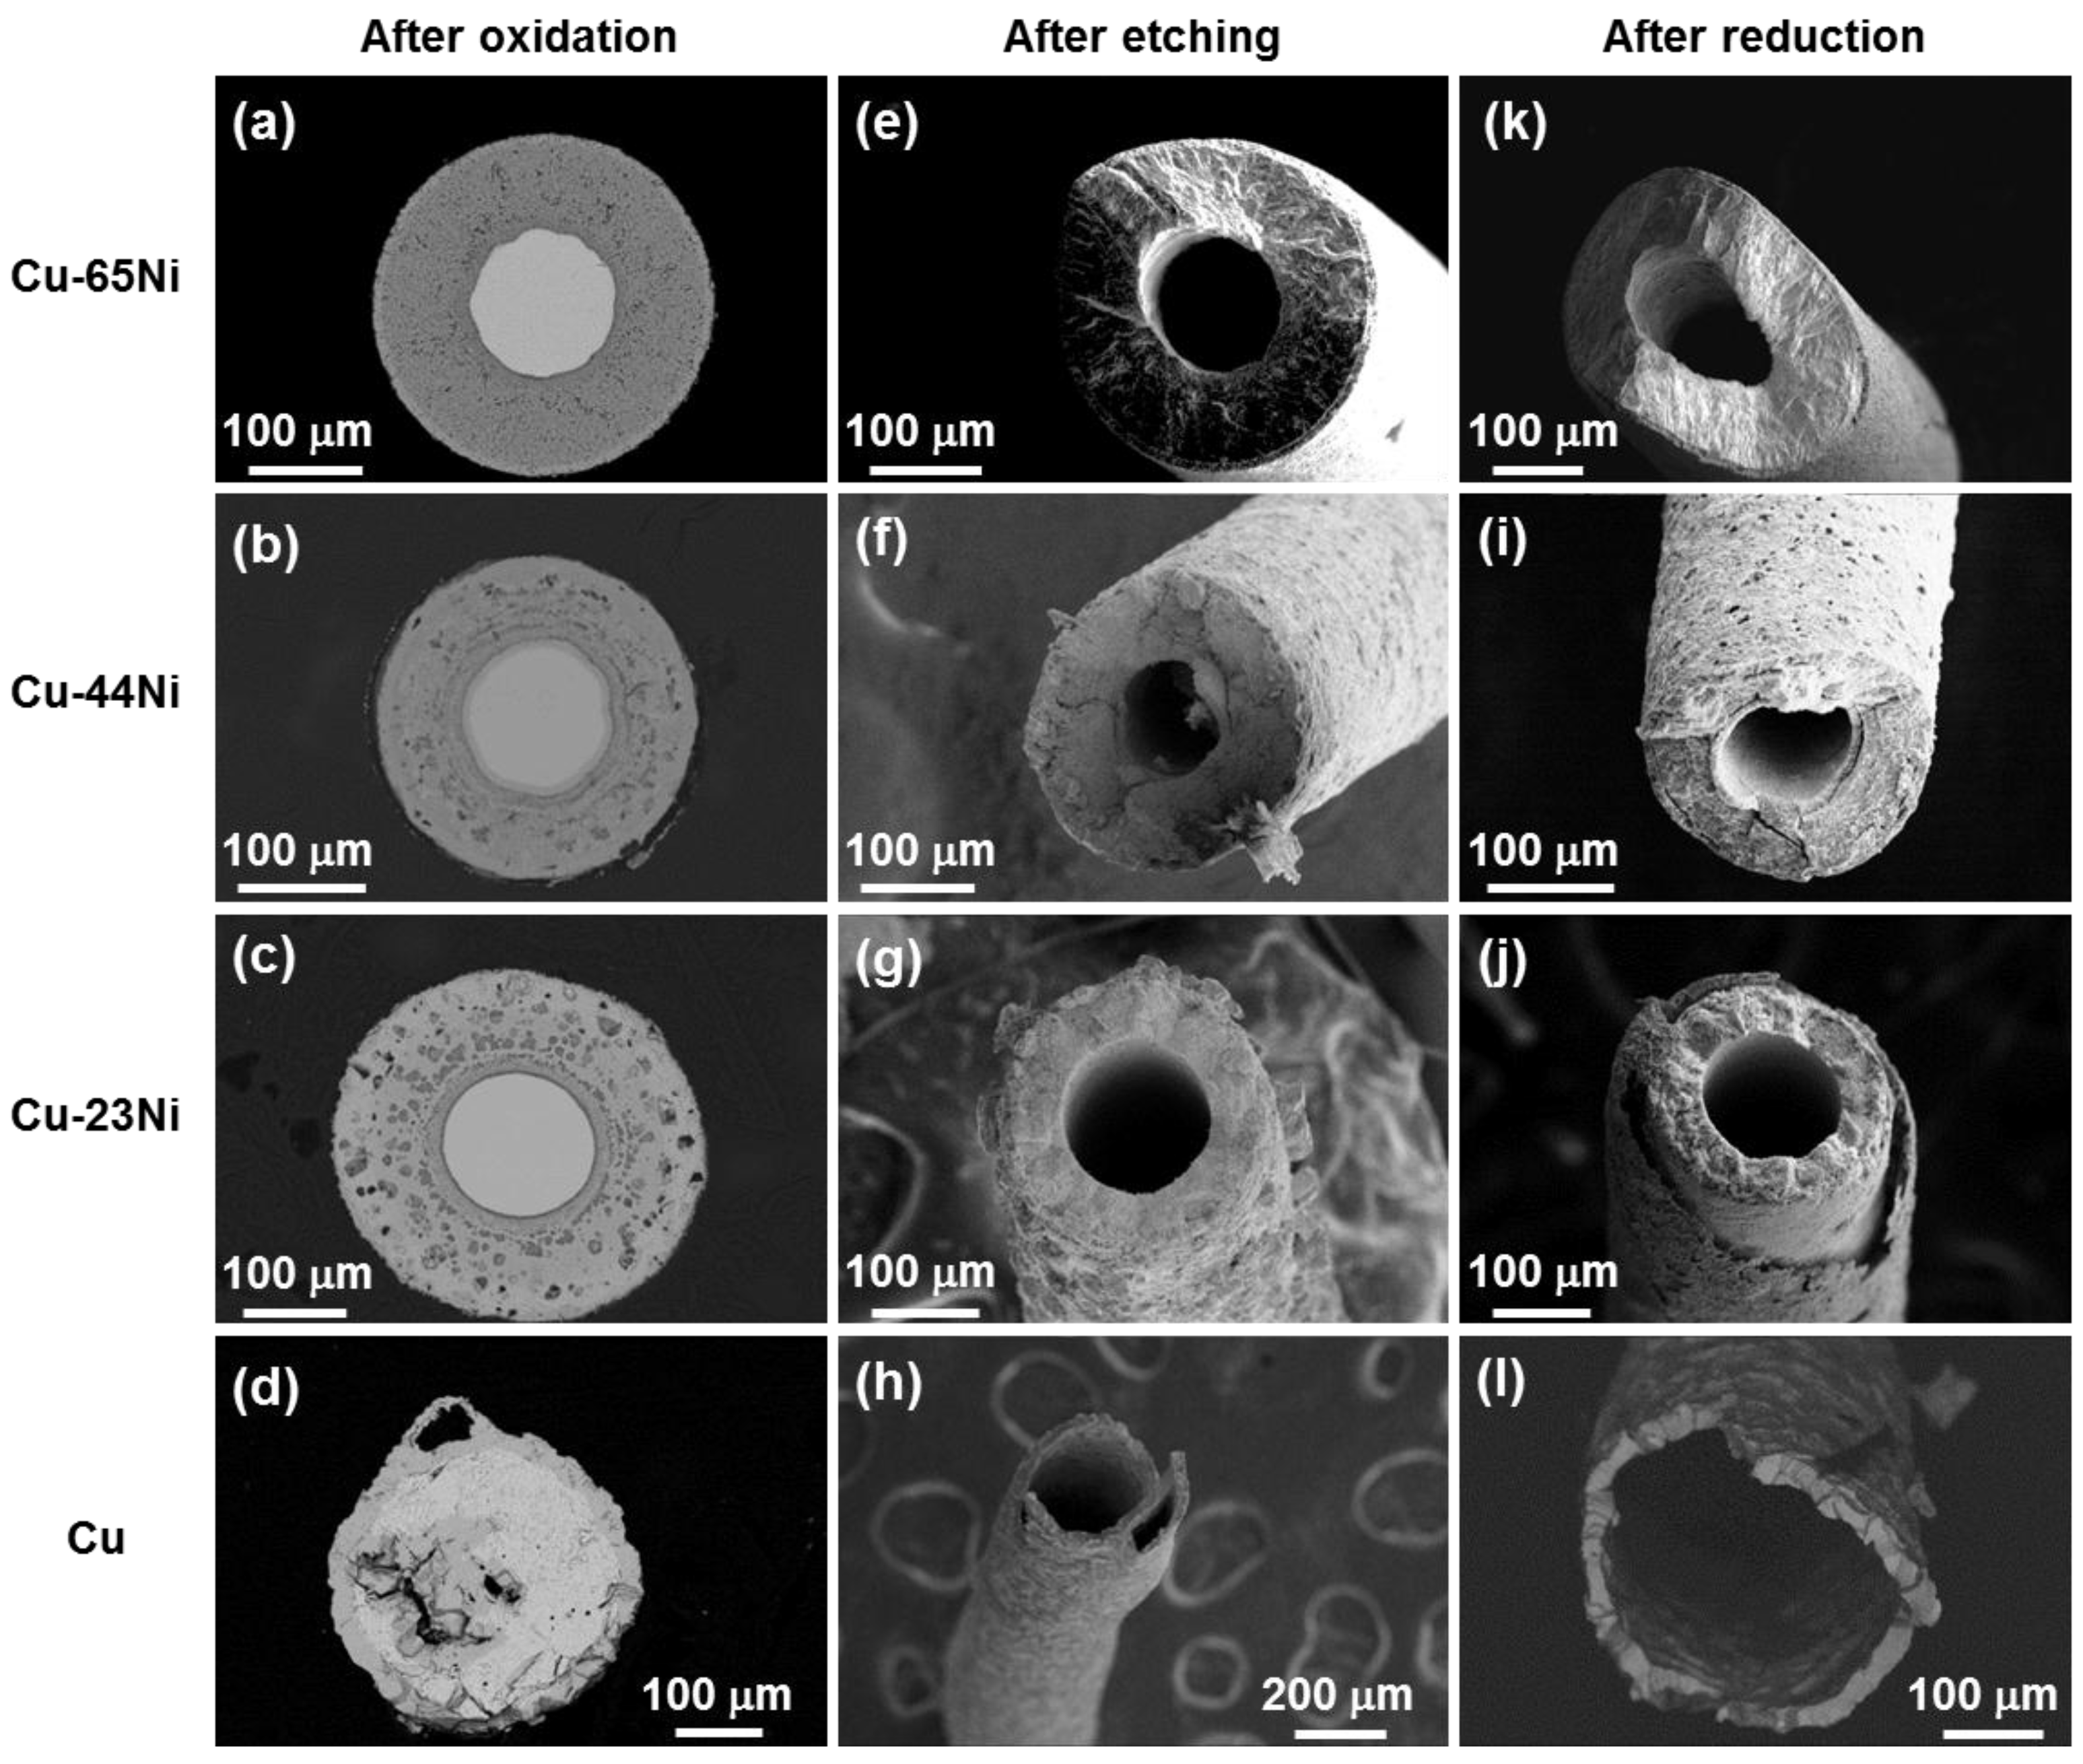
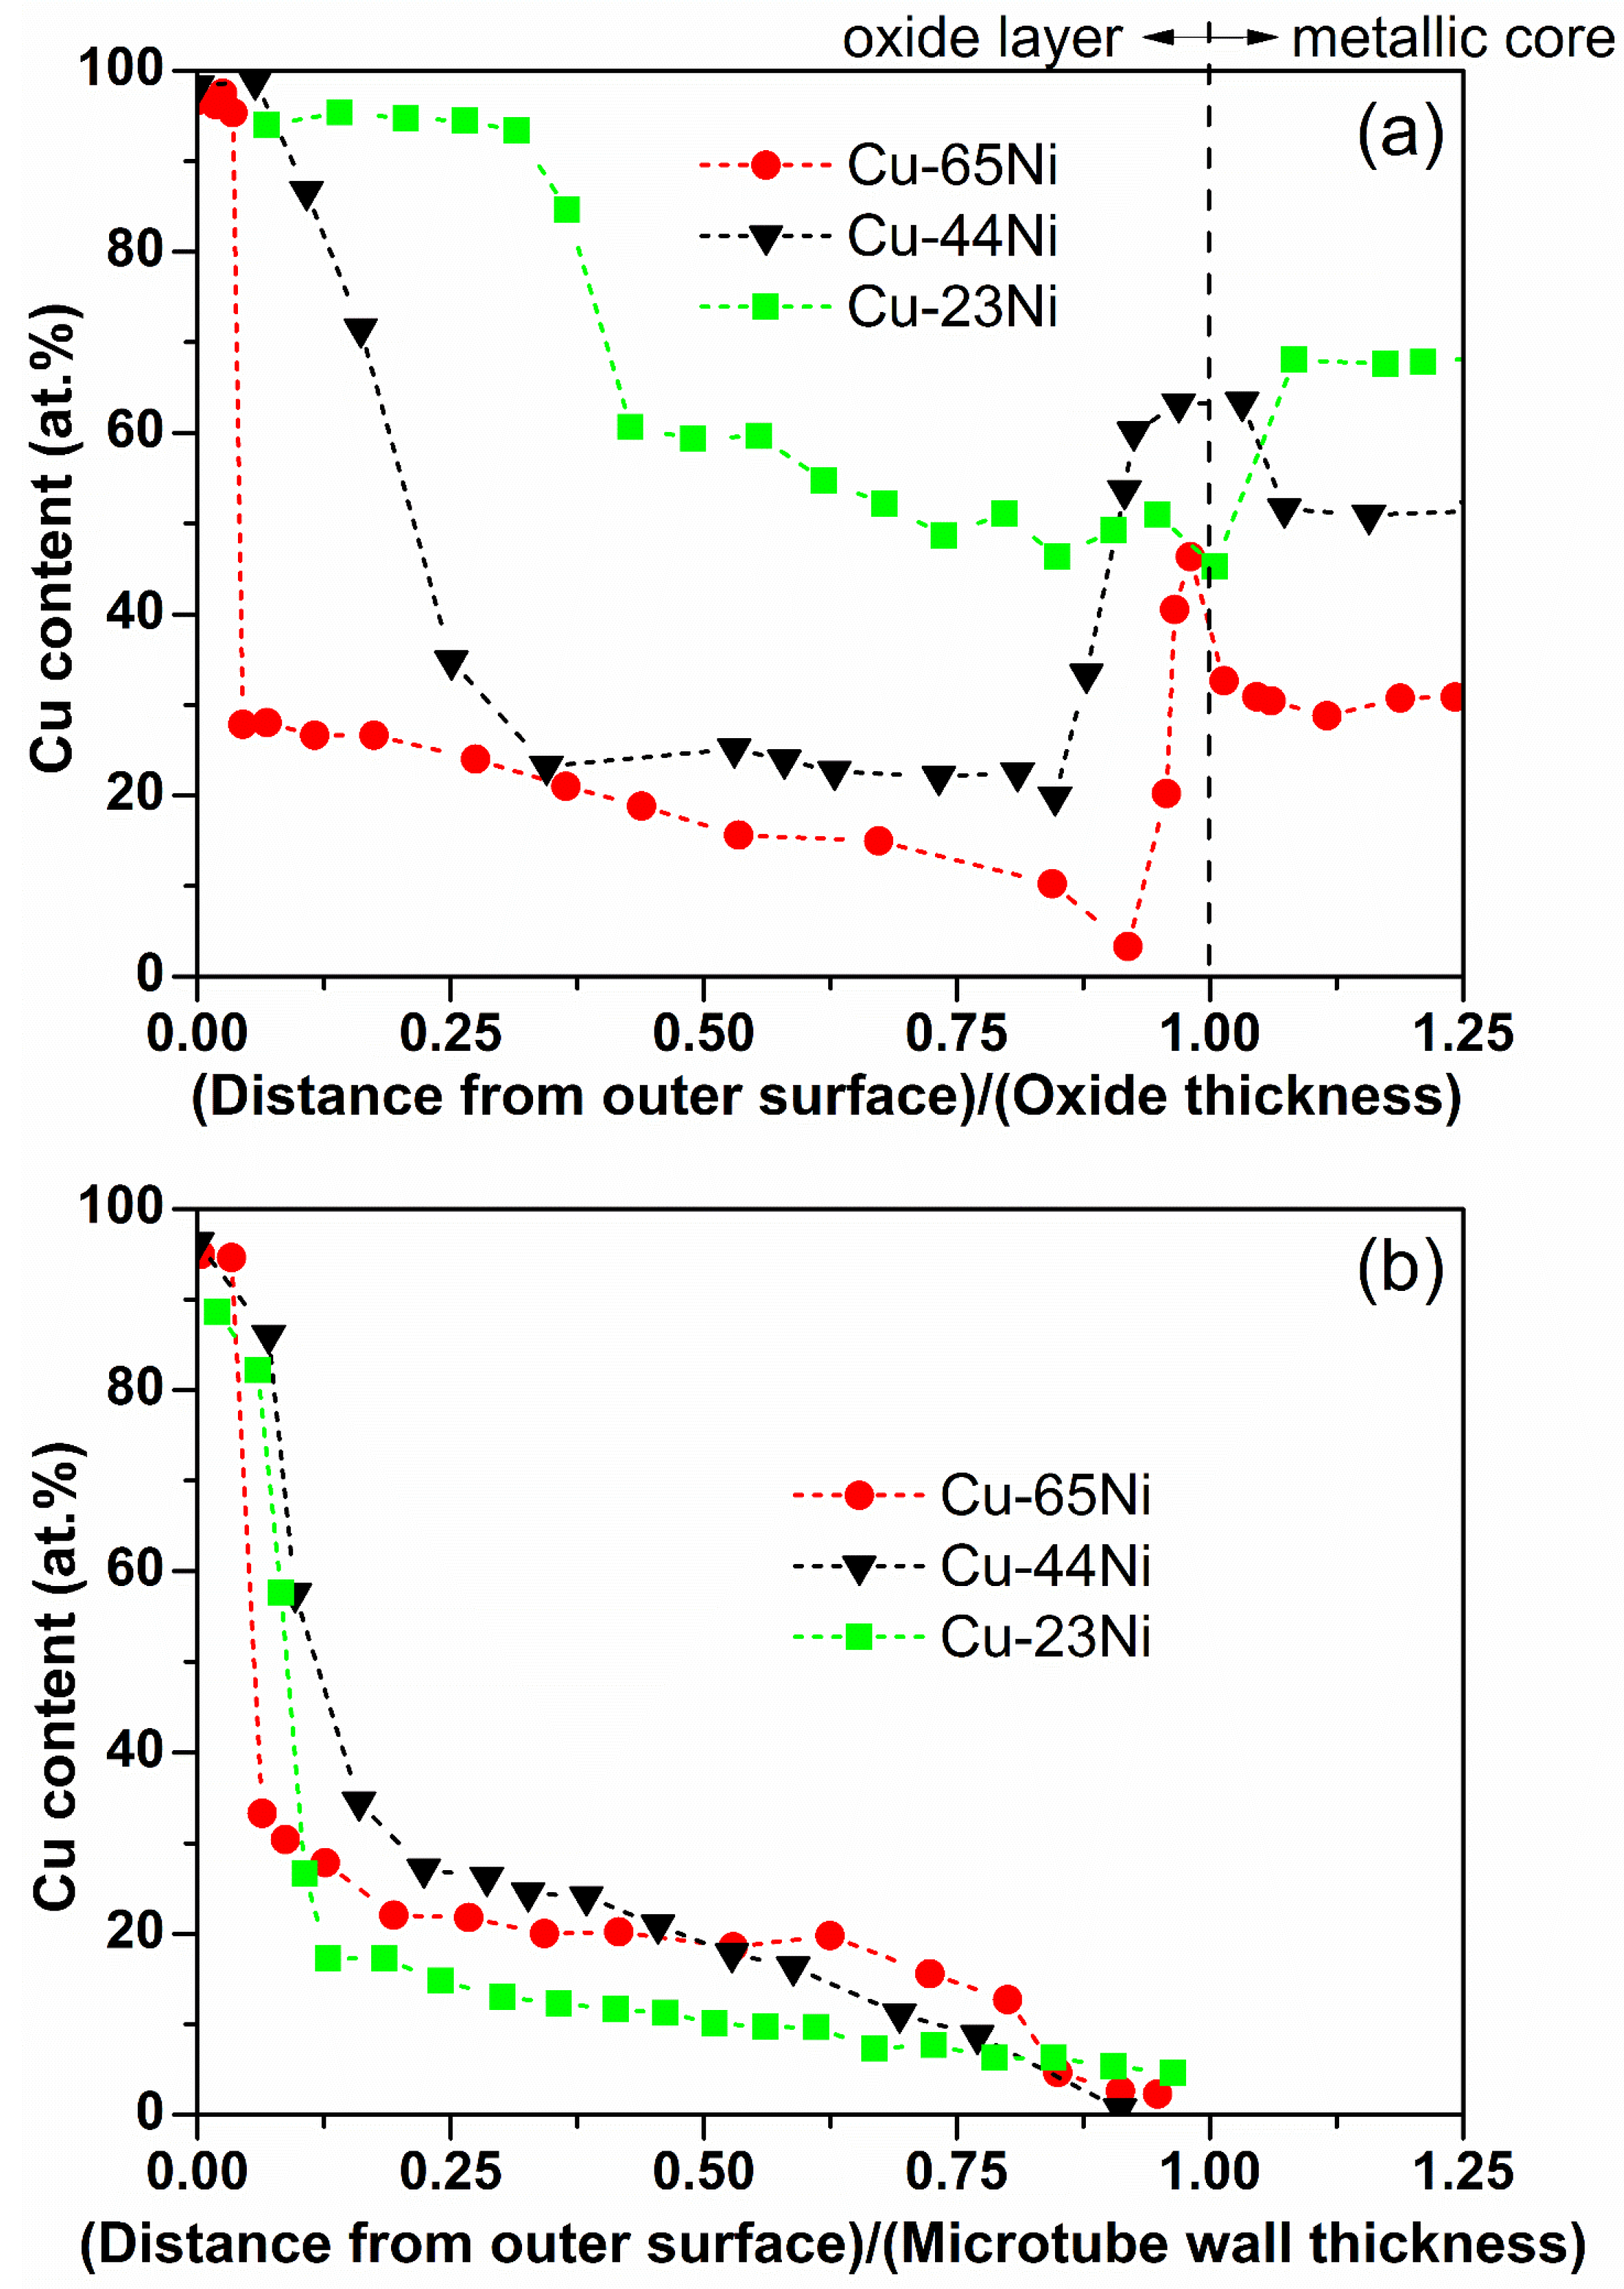
3.1. Oxidation
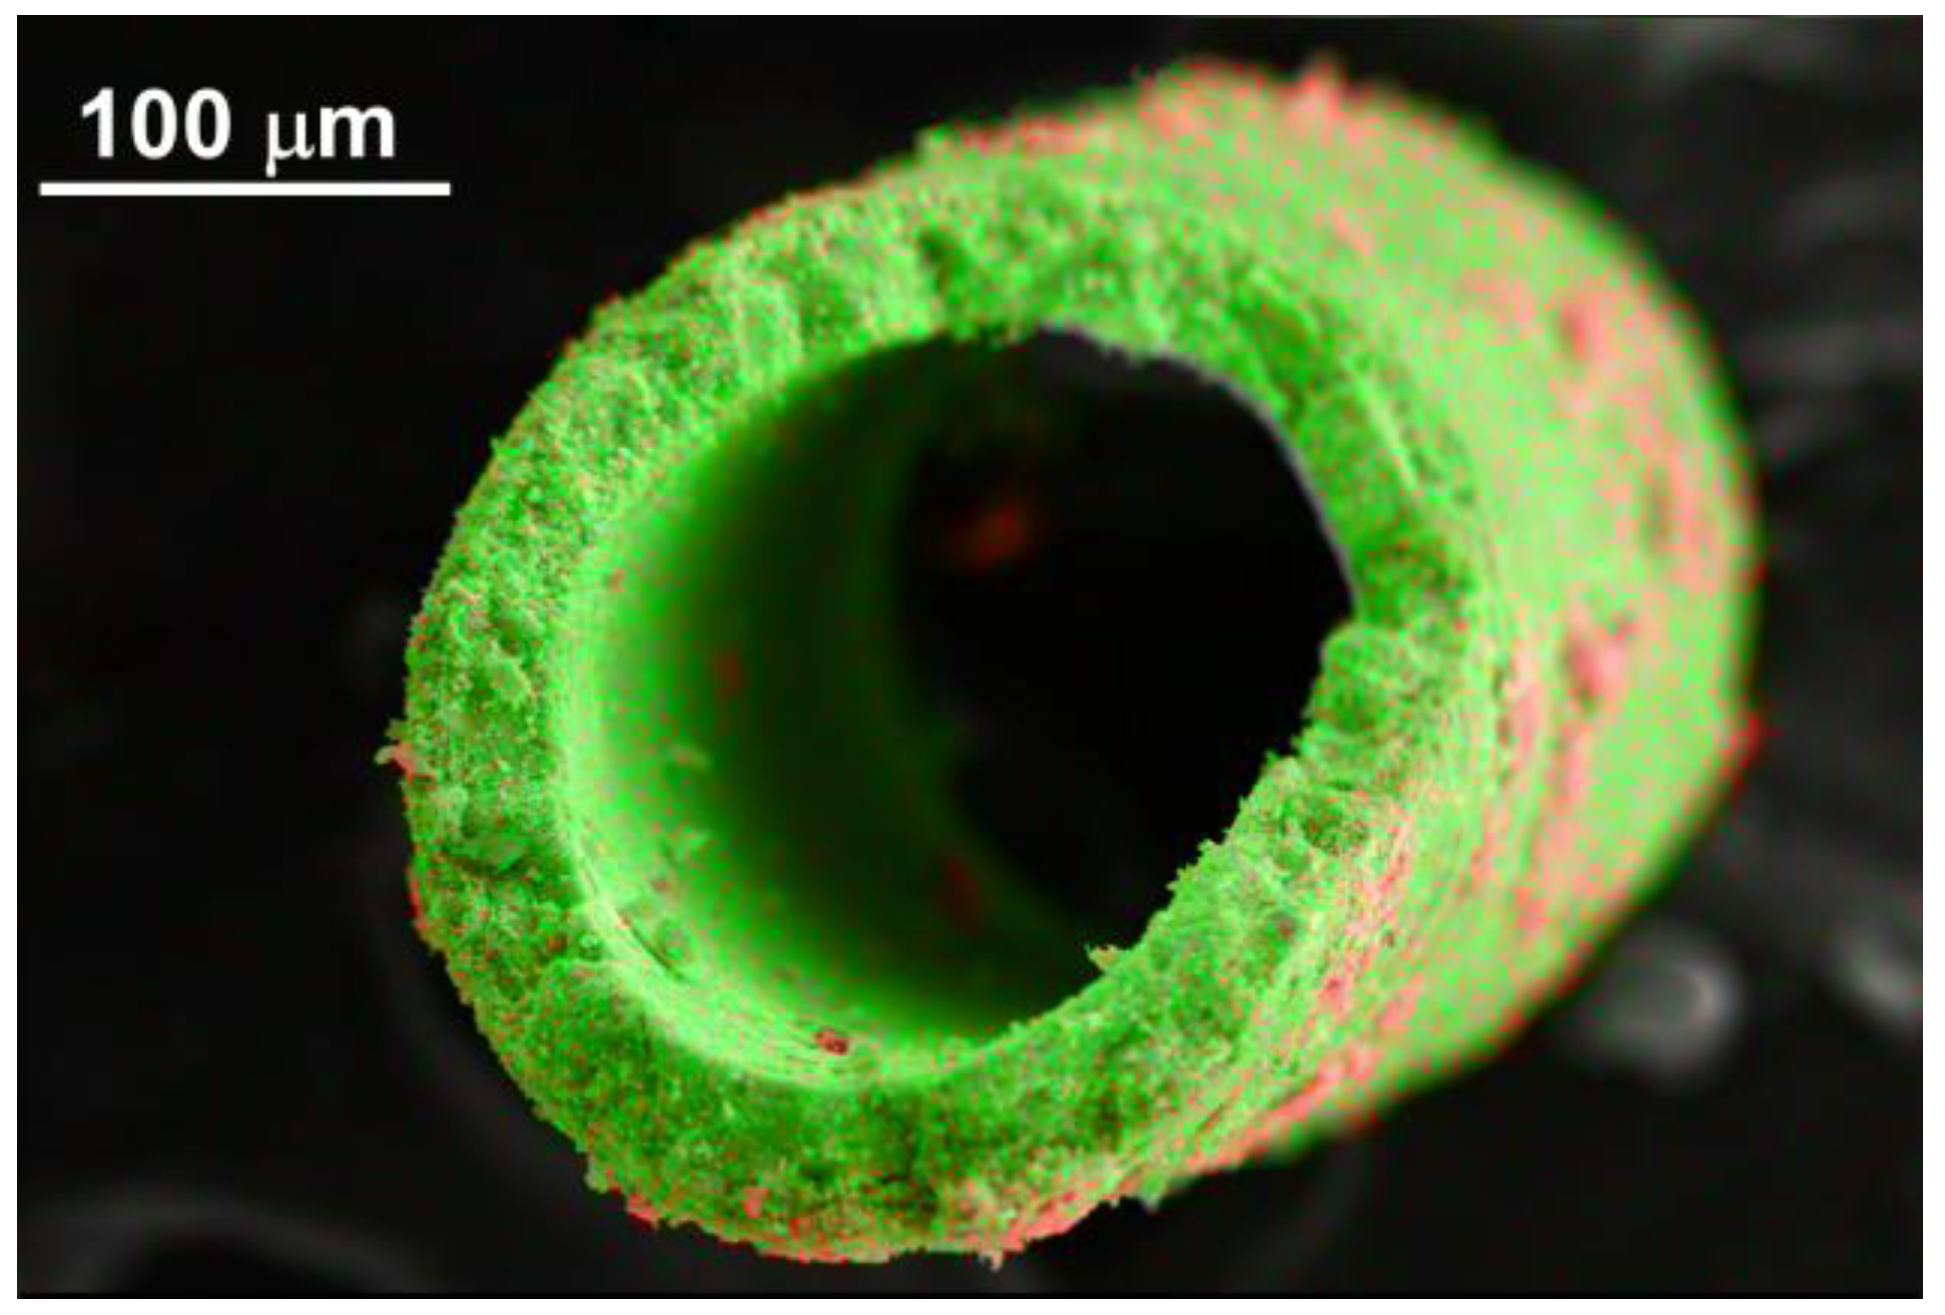
3.2. Etching
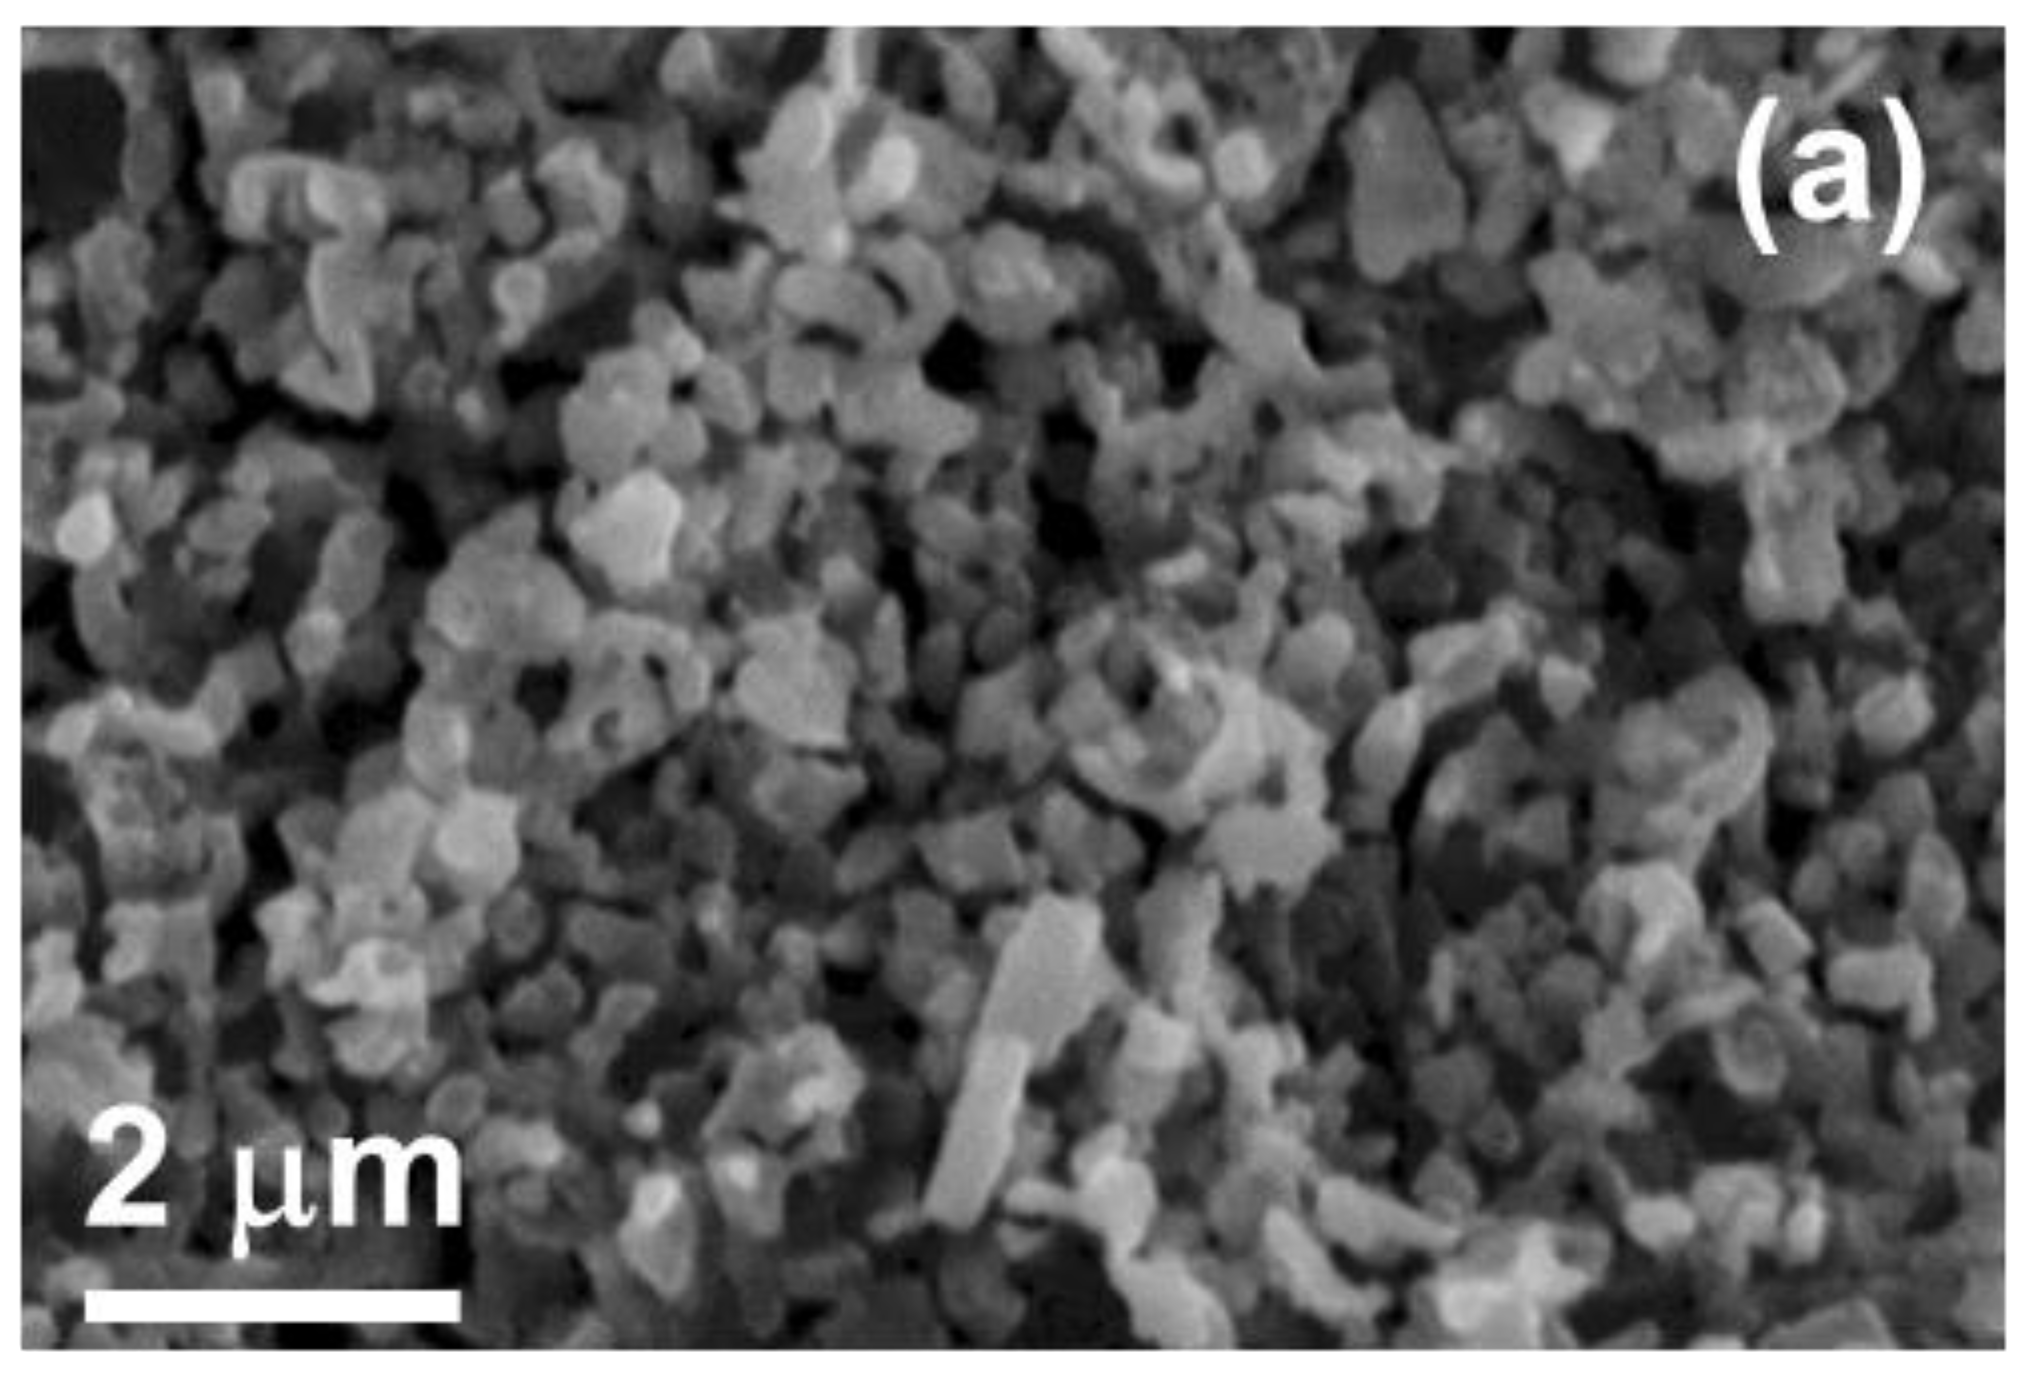
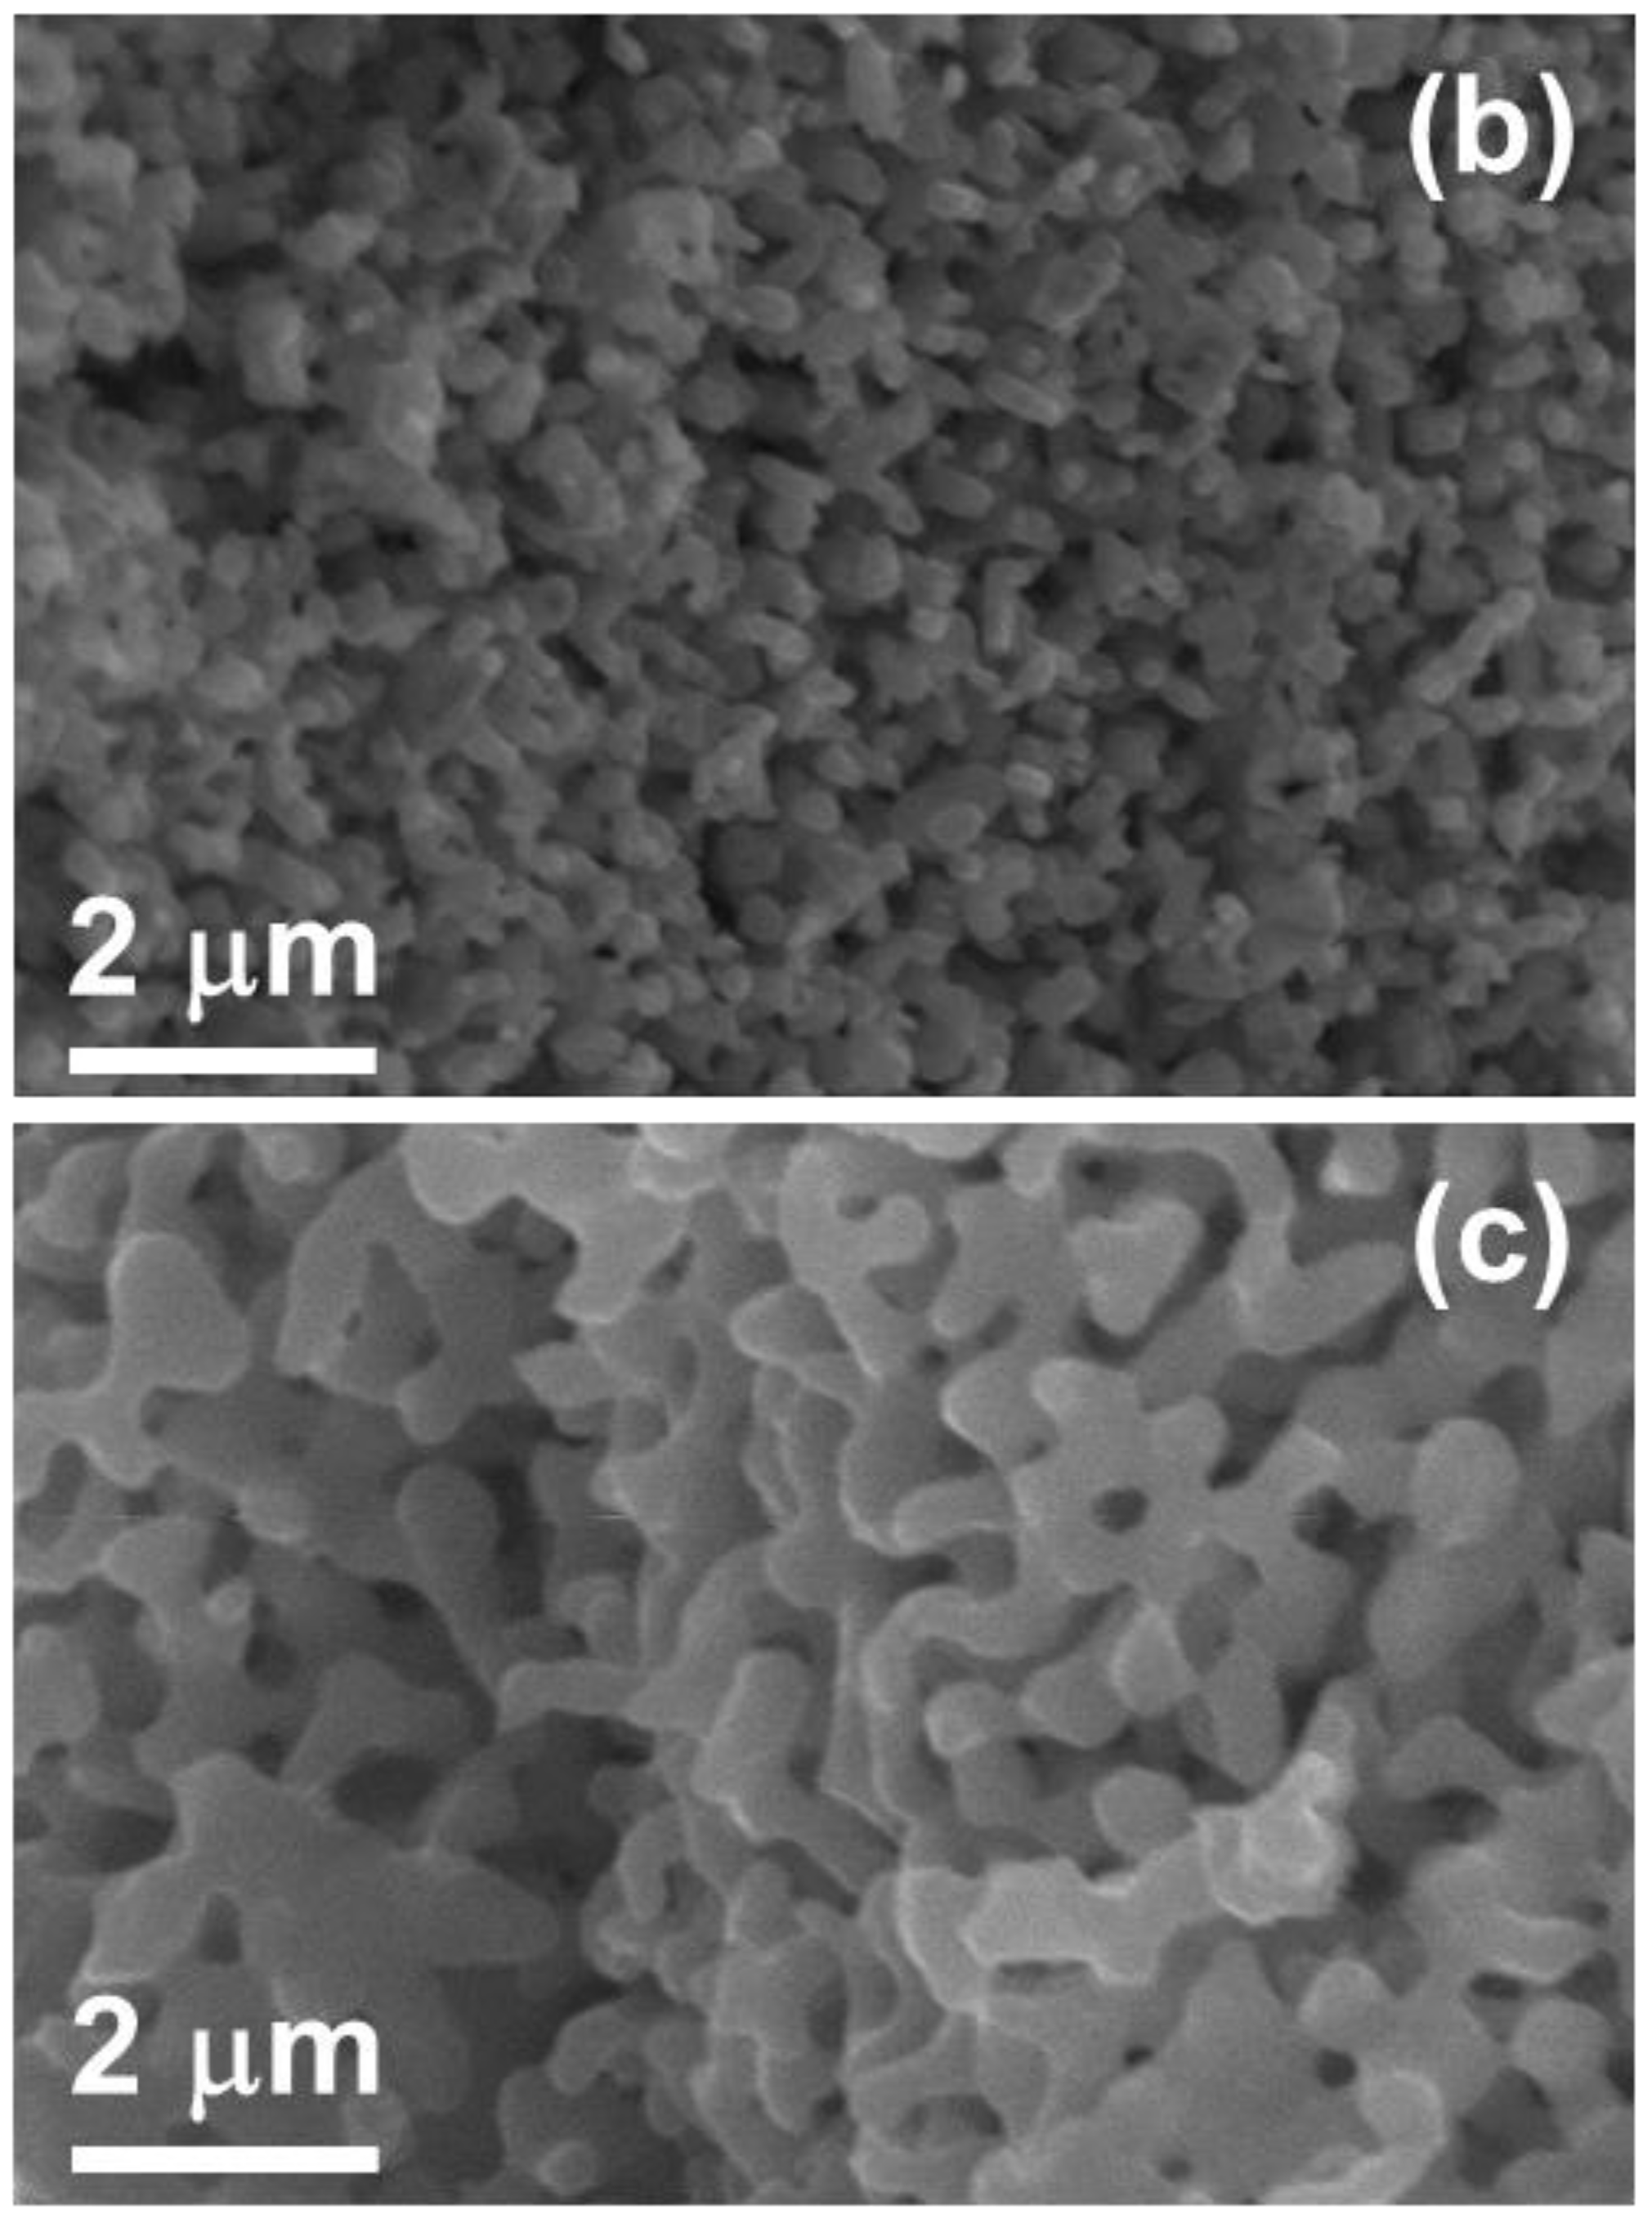
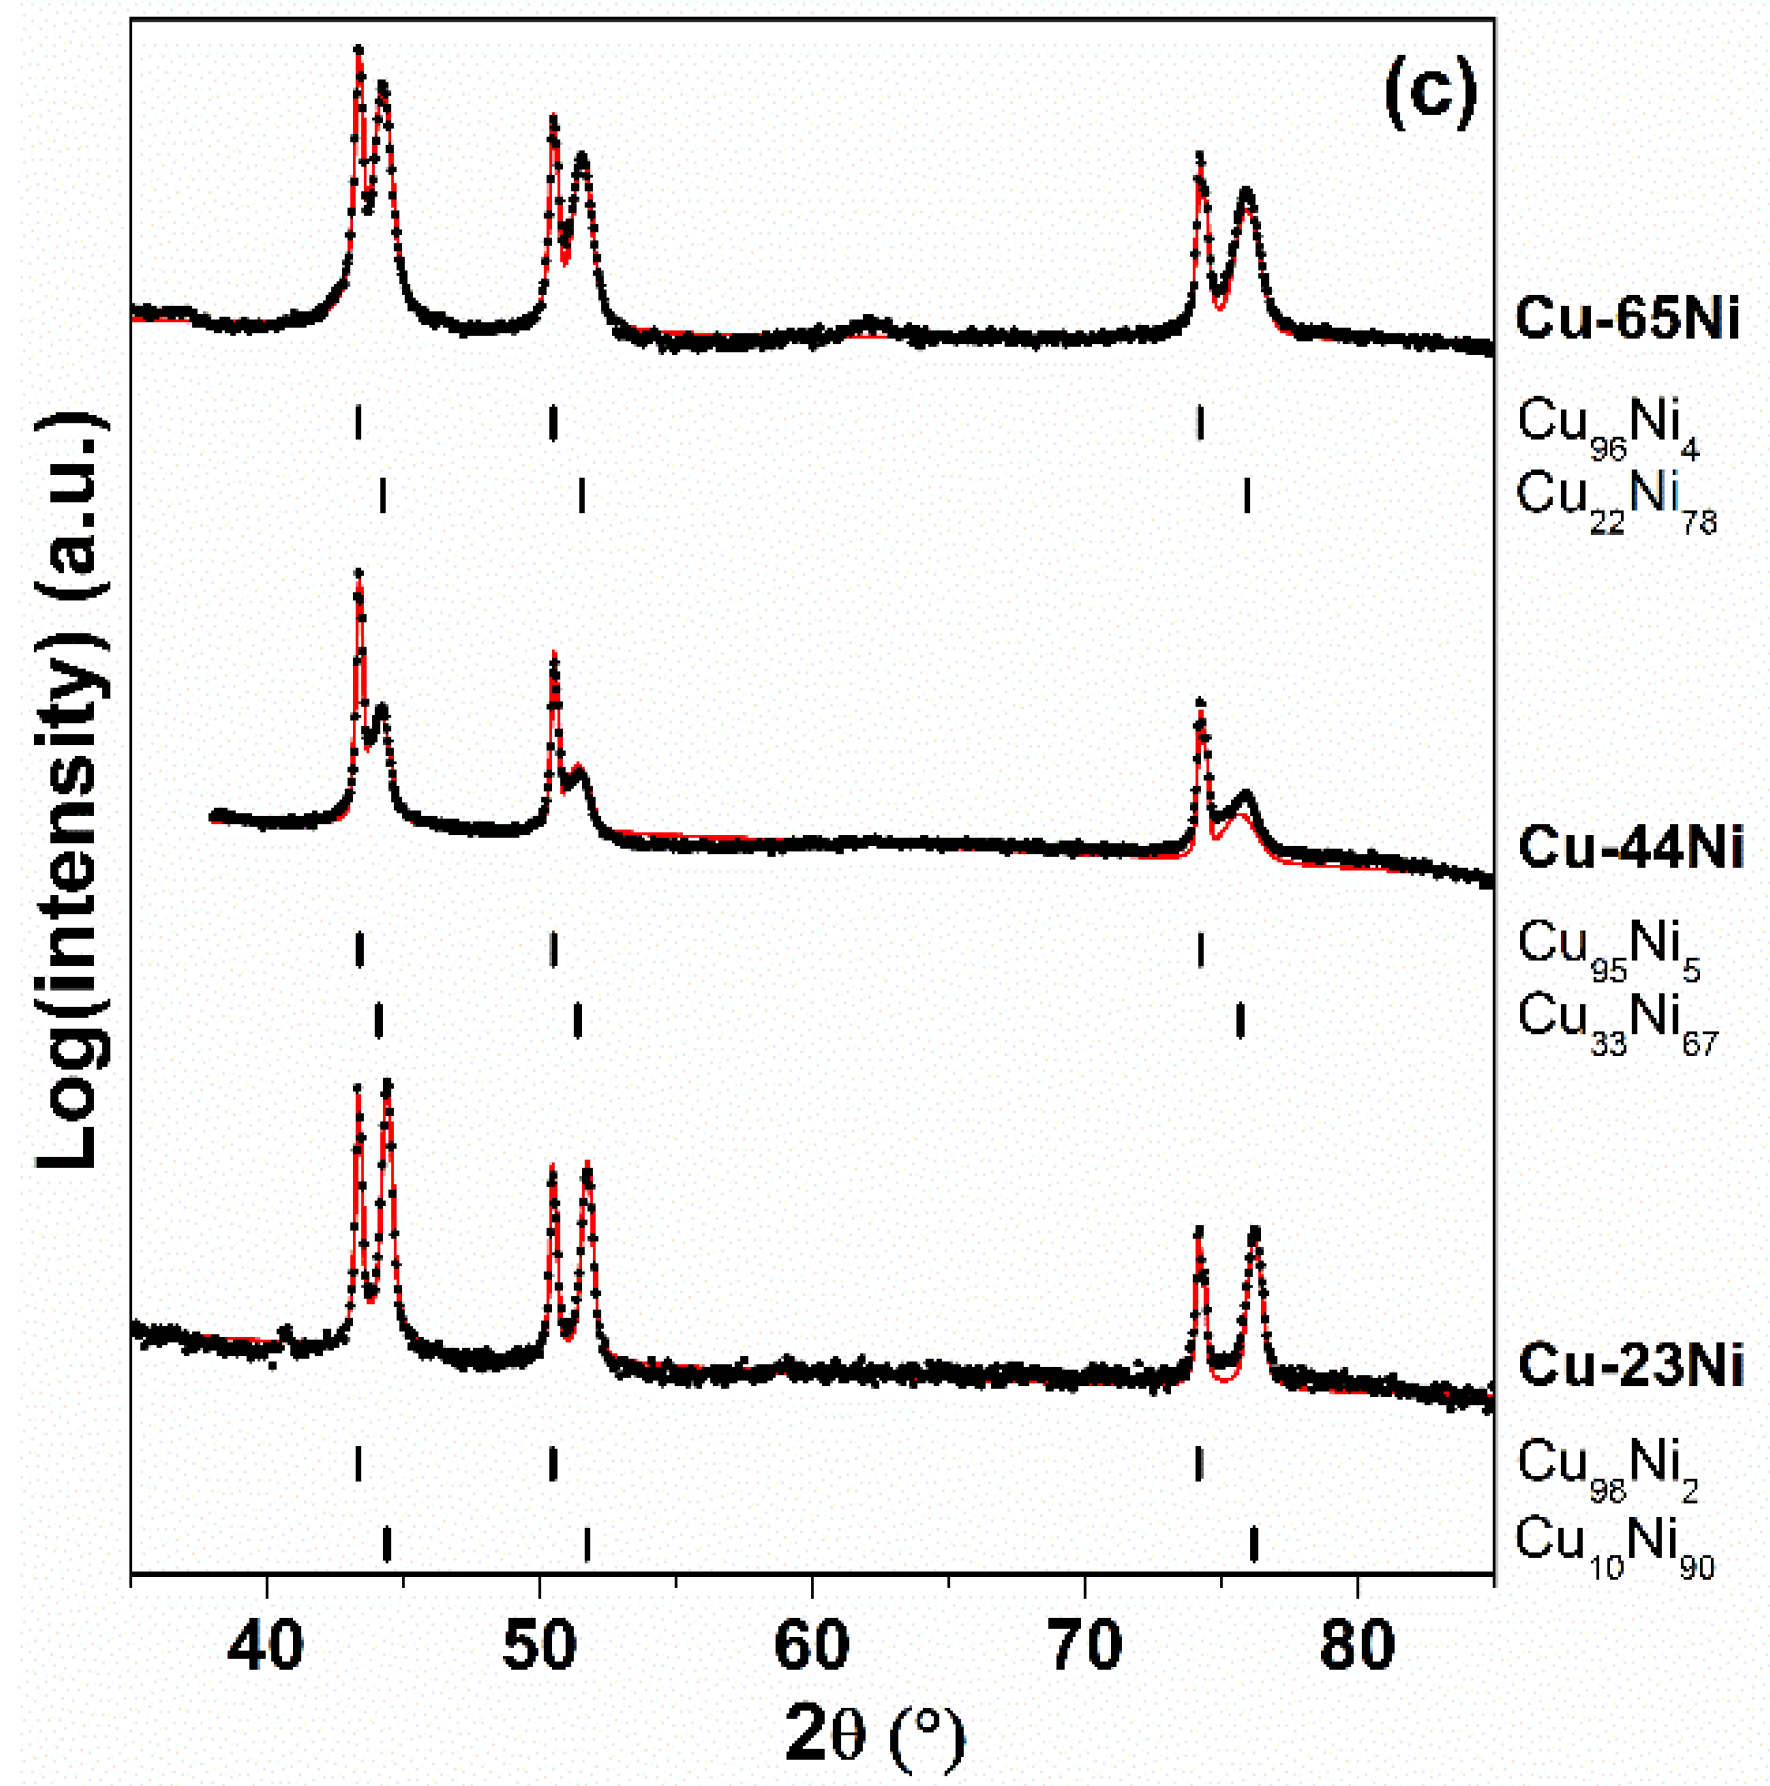
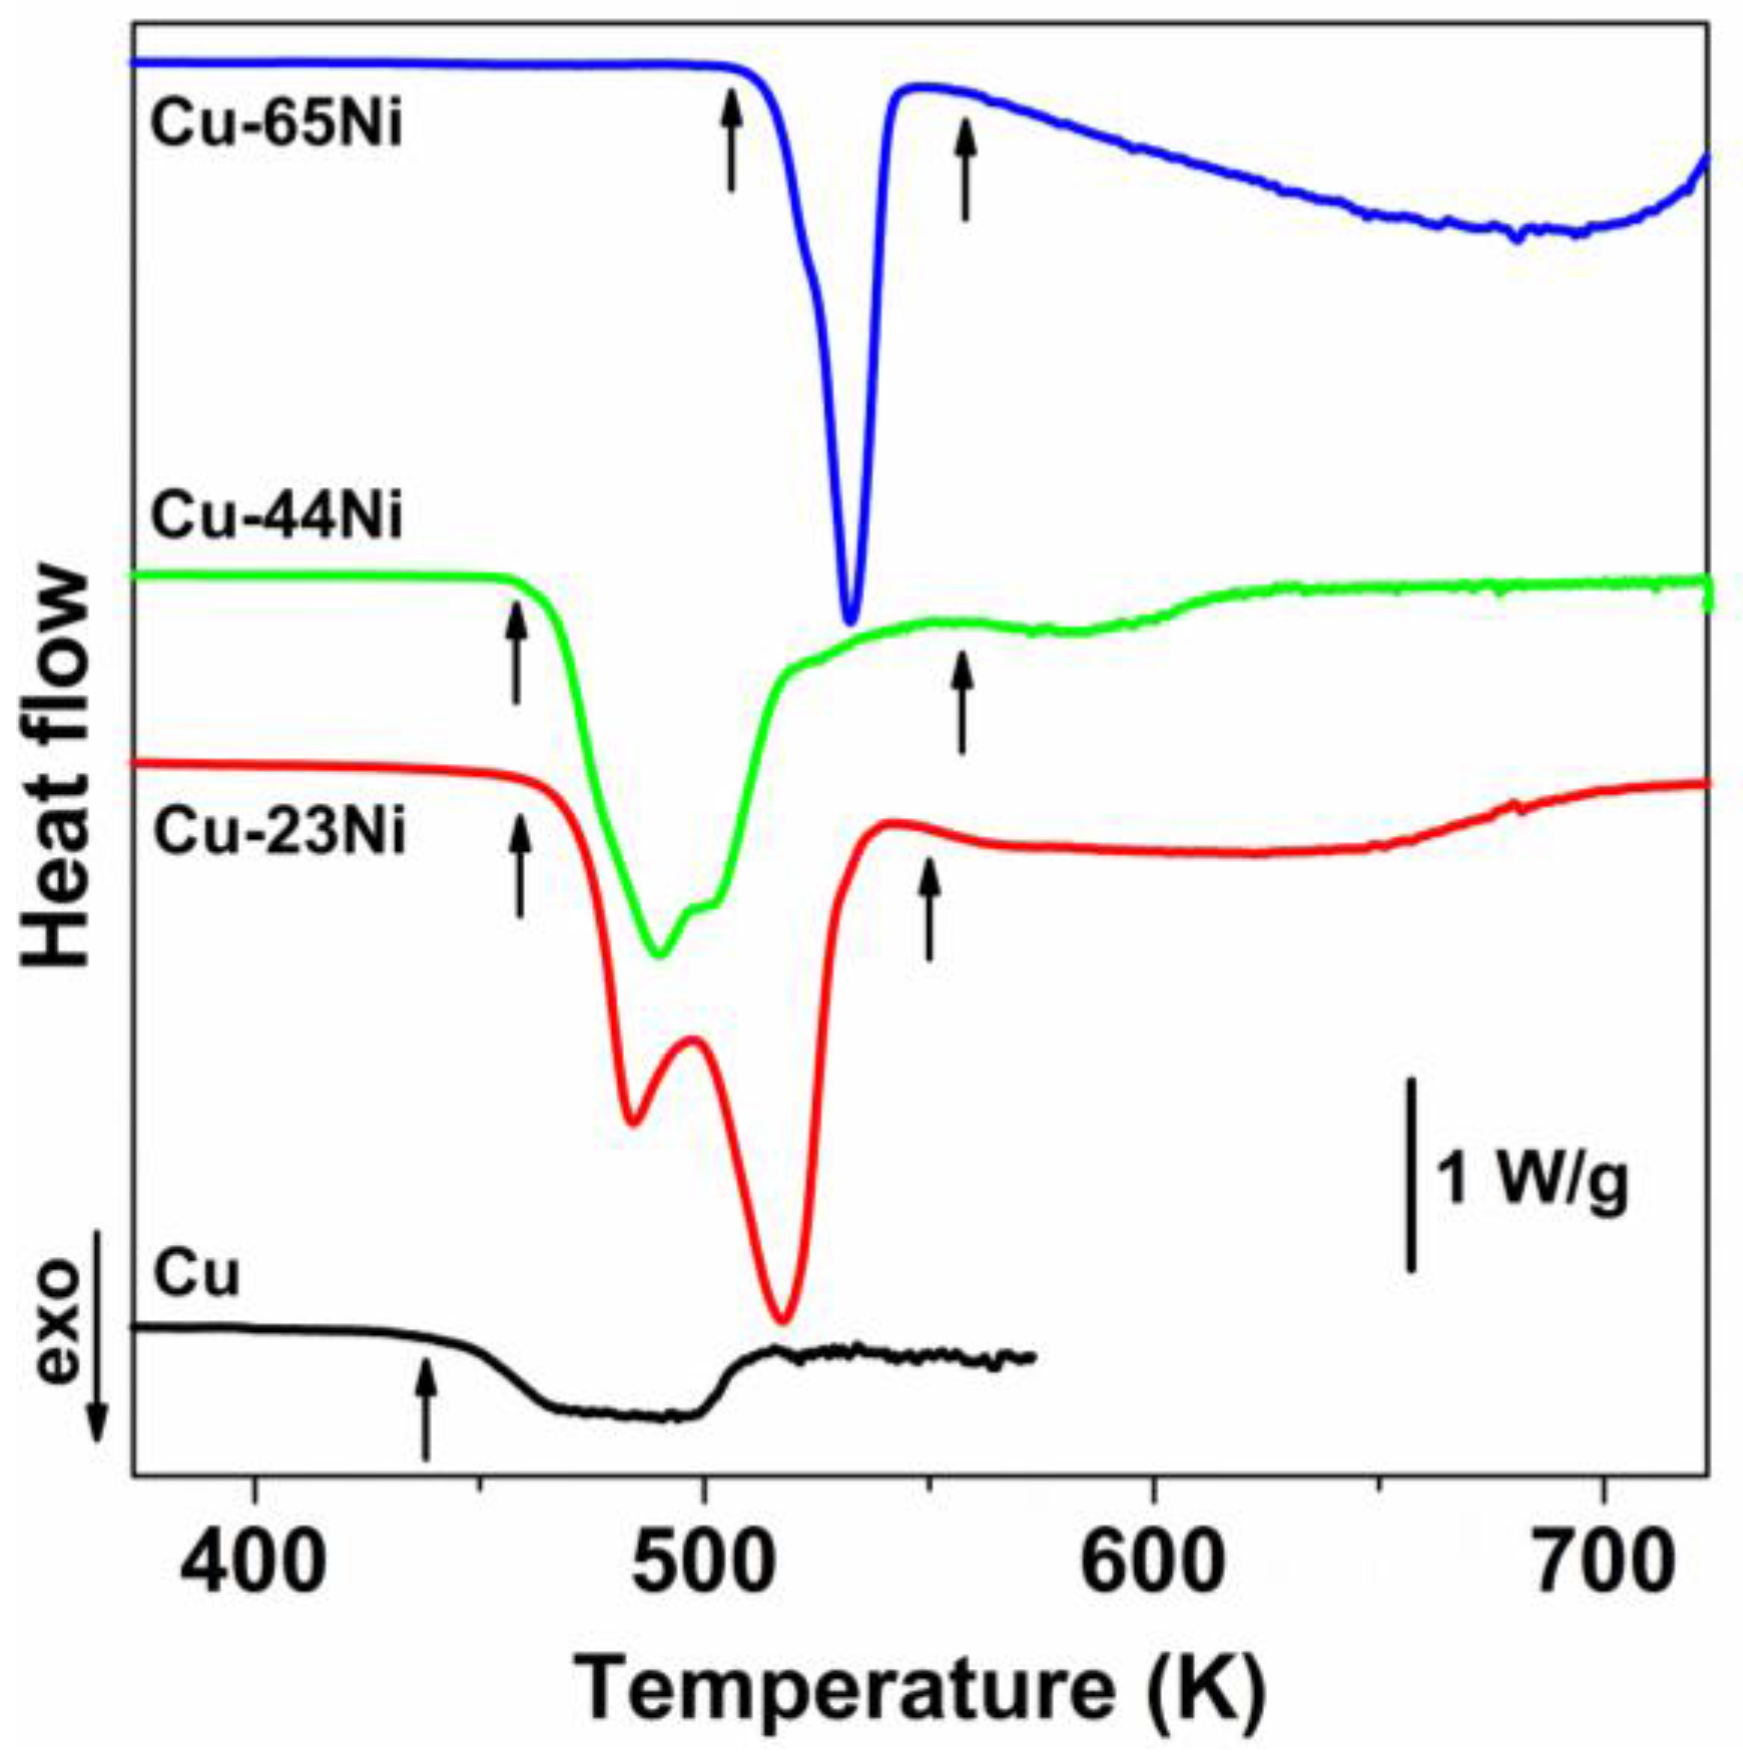
3.3. Reduction
4. Discussion
5. Conclusions
Author Contributions
Conflicts of Interest
References
- Ye, Y.; Geng, B. Magnetic Nanotubes: Synthesis, Properties, and Applications. Crit. Rev. Solid State Mater. Sci. 2012, 37, 75–93. [Google Scholar] [CrossRef]
- Chatzipirpiridis, G.; Ergeneman, O.; Pokki, J.; Ullrich, F.; Fusco, S.; Ortega, J.A.; Sivaraman, K.M.; Nelson, B.J.; Pané, S. Electroforming of implantable tubular magnetic microrobots for wireless ophthalmologic applications. Adv. Healthc. Mater. 2015, 4, 209–214. [Google Scholar] [CrossRef] [PubMed]
- Chatzipirpiridis, G.; Avilla, E.; Ergeneman, O.; Nelson, B.J.; Pané, S. Electroforming of magnetic microtubes for microrobotic applications. IEEE Trans. Magn. 2014, 50, 5400403. [Google Scholar] [CrossRef]
- Sui, Y.C.; Skomski, R.; Sorge, K.D.; Sellmyer, D.J. Nanotube magnetism. Appl. Phys. Lett. 2004, 84, 1525–1527. [Google Scholar] [CrossRef]
- Zhou, H.; Zhang, Z.; Jiang, C.; Guan, G.; Zhang, K.; Mei, Q.; Liu, R.; Wang, S. Trinitrotoluene explosive lights up ultrahigh Raman scattering of nonresonant molecule on a top-closed silver nanotube array. Anal. Chem. 2011, 83, 6913–6917. [Google Scholar] [CrossRef] [PubMed]
- Sanchez-Castillo, M.A.; Couto, C.; Kim, W.B.; Dumesic, J.A. Gold-Nanotube Membranes for the Oxidation of CO at Gas–Water Interfaces. Angew. Chem. Int. Edit. 2004, 43, 1140–1142. [Google Scholar] [CrossRef] [PubMed]
- Rao, C.N.R.; Govindaraj, A. Synthesis of Inorganic Nanotubes. Adv. Mater. 2009, 21, 4208–4233. [Google Scholar] [CrossRef]
- Cao, G.; Liu, D. Template-based synthesis of nanorod, nanowire, and nanotube arrays. Adv. Colloid Interface Sci. 2008, 136, 45–64. [Google Scholar] [CrossRef] [PubMed]
- Kijima, T. Introduction to inorganic and metallic nanotubes. In Inorganic and Metallic Nanotubular Materials: Recent Technologies and Applications; Topics in Applied Physics; Kijima, T., Ed.; Springer: Berlin/Heidelberg, Germany, 2010; Volume 117, pp. 1–16. [Google Scholar]
- Pia, G.; Delogu, F. Mechanical Properties of Nanoporous Au: From Empirical Evidence to Phenomenological Modeling. Metals 2015, 5, 1665–1694. [Google Scholar] [CrossRef] [Green Version]
- Qin, J.; Chen, Q.; Yang, C.; Huang, Y. Research process on property and application of metal porous materials. J. Alloy. Compd. 2016, 654, 39–44. [Google Scholar] [CrossRef]
- Qiu, G.; Xiao, J.; Zhu, J. Research history, classification and applications of metal porous metals. J. Metal. Int. 2013, 18, 70–73. [Google Scholar]
- Hereijgers, J.; Desmet, G.; Breugelmans, T.; de Malsche, W. Strategies to integrate porous layers in microfluidic devices. Microelectron. Eng. 2015, 132, 1–13. [Google Scholar] [CrossRef]
- Wu, S.; Liu, X.; Yeung, K.W.K.; Liu, C.; Yang, X. Biomimetic porous scaffolds for bone tissue engineering. Mater. Sci. Eng. R 2014, 80, 1–36. [Google Scholar] [CrossRef]
- Zhang, J.; Baró, M.D.; Pellicer, E.; Sort, J. Electrodeposition of magnetic, superhydrophobic, non-stick, two-phase Cu-Ni foam films and their enhanced performance for hydrogen evolution reaction in alkaline water media. Nanoscale 2014, 6, 12490–12499. [Google Scholar] [CrossRef] [PubMed]
- Scaglione, F.; Paschalidou, E.M.; Rizzi, P.; Bordiga, S.; Battezzati, L. Nanoporous gold obtained from a metallic glass precursor used as substrate for surface-enhanced Raman scattering. Philos. Mag. Lett. 2015, 95, 474–482. [Google Scholar] [CrossRef]
- Brumlik, C.J.; Martin, C.R. Template synthesis of metal microtubules. J. Am. Chem. Soc. 1991, 113, 3174–3175. [Google Scholar] [CrossRef]
- Lelea, D.; Nishio, S.; Takano, K. The experimental research on microtube heat transfer and fluid flow of distilled water. Int. J. Heat Mass Transf. 2004, 47, 2817–2830. [Google Scholar] [CrossRef]
- Mondal, S.; De, S. Effects of non-Newtonian power law rheology on mass transport of a neutral solute for electro-osmotic flow in a porous microtube. Biomicrofluidics 2013, 7, 044113. [Google Scholar] [CrossRef] [PubMed]
- Du, H.; Lu, D.; Qi, J.; Shen, Y.; Yin, L.; Wang, Y.; Zheng, Z.; Xiong, T.J. Heat dissipation performance of porous copper with elongated cylindrical pores. Mater. Sci. Technol. 2014, 30, 934–938. [Google Scholar] [CrossRef]
- Toberer, E.S.; Seshadri, R. Template-free routes to porous inorganic materials. Chem. Commun. 2006, 30, 3159–3165. [Google Scholar] [CrossRef] [PubMed]
- Shoemaker, D.P.; Corr, S.A.; Seshadri, R. Porosity through reduction in metal oxides. Mater. Res. Soc. Symp. Proc. 2008, 1148, 106–113. [Google Scholar] [CrossRef]
- Marano, E.F.; Lussana, D.; Castellero, A.; Baricco, M. Nanoporous Microtubes obtained from a Cu-Ni Metallic Wire. Met. Mater. Int. 2016, 22, 305–310. [Google Scholar] [CrossRef]
- Thermo-Calc Software. Available online: www.thermocalc.com (accessed on 30 September 2016).
- Material Analysis Using Diffraction. Available online: http://maud.radiographema.com (accessed on 15 September 2016).
- Pilling, N.B.; Bedworth, R.E. Oxidation of Copper-Nickel Alloys at High Temperatures. Ind. Eng. Chem. 1925, 17, 372–376. [Google Scholar] [CrossRef]
- Sartell, J.A.; Bendel, S.; Johnston, T.L.; Li, C.H. The effect of oxide recrystallization on the oxidation kinetics of a 62:38 copper-nickel alloy. Trans. Am. Soc. Met. 1958, 50, 1047–1062. [Google Scholar]
- Sartell, J.A.; Li, C.H. The oxidation of high-purity copper-nickel alloys. Trans. Am. Soc. Met. 1962, 55, 158–168. [Google Scholar]
- Wagner, C.J. Theoretical analysis of the diffusion processes determining the oxidation rate of alloys. Electrochem. Soc. 1952, 99, 369–380. [Google Scholar] [CrossRef]
- Whittle, D.P.; Wood, G.C. Two-phase scale formation on Cu-Ni alloys. Corros. Sci. 1968, 8, 298–308. [Google Scholar] [CrossRef]
- MacDougall, B.; Cohen, M.J. Anodic Oxidation of Nickel in Neutral Sulfate Solution. Electrochem. Soc. 1974, 121, 1152–1159. [Google Scholar] [CrossRef]
- Schmahl, N.G.; Barthel, J.; Eikerling, G.F. Röntgenographische Untersuchungen an den Systemen MgO−CuO und NiO−CuO. Z. Anorg. Allg. Chem. 1964, 332, 230–237. [Google Scholar] [CrossRef]
- Eric, H.; Timuçin, M. Equilibrium relations in the system nickel oxide-copper oxide. Metall. Trans. B 1979, 10, 561–563. [Google Scholar] [CrossRef]
- Cao, Z.-Q.; Niu, Y.; Gesmundo, F. Air oxidation of Cu-50Ni and Cu-70Ni alloys at 800 °C. Trans. Nonferr. Met. Soc. China 2001, 11, 499–502. [Google Scholar]
- Smigelskas, A.D.; Kirkendall, E.O. Zinc diffusion in alpha brass. Trans. AIME 1947, 171, 130–142. [Google Scholar]
- Weissmüller, J.; Newman, R.C.; Jin, H.-J.; Hodge, A.M.; Kysar, J.W. Nanoporous Metals by Alloy Corrosion: Formation and Mechanical Properties. MRS Bull. 2009, 34, 577–586. [Google Scholar] [CrossRef]
- Newman, R.C.; Corcoran, S.G.; Erlebacher, J.; Aziz, M.J.; Sieradzki, K. Alloy corrosion. MRS Bull. 1999, 24, 24–28. [Google Scholar] [CrossRef]


| Sample | Kp′ (g2·cm−4·s−1) | Kp′′ (g2·cm−4·s−1) |
|---|---|---|
| Ni | 1.62 × 10⁻⁹ | n.a. |
| Cu-65Ni | 3.32 × 10⁻⁸ | 6.40 × 10⁻⁷ |
| Cu-44Ni | 1.64 × 10⁻⁷ | - |
| Cu-23Ni | 2.00 × 10⁻⁶ | 9.56 × 10⁻⁶ |
| Cu | 2.83 × 10⁻⁶ | n.a. |
| Sample | Process Step | Quantitative Phase Analysis (wt. %) | Lattice Parameters |
|---|---|---|---|
| Cu-65Ni | Oxidation (300 min) | CuO: 42% | a = 0.47045 nm, b = 0.34077 nm, c = 0.51340 nm, β = 99.6° |
| NiO: 47% | a = 0.41923 nm | ||
| f.c.c.-(Cu,Ni): 11% | a = 0.35565 nm | ||
| Etching | CuO: 29% | a = 0.47043 nm, b = 0.34047 nm, c = 0.51234 nm, β = 99.6° | |
| NiO: 71% | a = 0.41914 nm | ||
| Reduction | f.c.c.-(Cu rich): 37% | a = 0.36108 nm | |
| f.c.c.-(Ni rich): 63% | a = 0.35436 nm | ||
| Cu-44Ni | Oxidation (160 min) | Cu2O: 7% | a = 0.42696 nm |
| CuO: 58% | a = 0.46980 nm, b = 0.34110 nm, c = 0.51332 nm, β = 99.4° | ||
| NiO: 35% | a = 0.41920 nm | ||
| Etching | Cu2O: 3% | a = 0.42696 nm | |
| CuO: 43% | a = 0.46884 nm, b = 0.34202 nm, c = 0.51307 nm, β = 99.4° | ||
| NiO: 54% | a = 0.41913 nm | ||
| Reduction | f.c.c.-(Cu rich): 52% | a = 0.36102 nm | |
| f.c.c.-(Ni rich): 48% | a = 0.35538 nm | ||
| Cu-23Ni | Oxidation (30 min) | Cu2O: 43% | a = 0.42722 nm |
| CuO: 48% | a = 0.46824 nm, b = 0.34181 nm, c = 0.51274 nm, β = 99.4° | ||
| NiO: 9% | a = 0.41841 nm | ||
| Etching | CuO: 25% | a = 0.46846 nm, b = 0.34214 nm, c = 0.51289 nm, β = 99.5° | |
| NiO: 75% | a = 0.41839 nm | ||
| Reduction | f.c.c.-(Cu rich): 31% | a = 0.36131 nm | |
| f.c.c.-(Ni rich): 69% | a = 0.35328 nm | ||
| Cu | Oxidation (1440 min) | Cu2O: 8% | a = 0.42685 nm |
| CuO: 92% | a = 0.46835 nm, b = 0.34235 nm, c = 0.51293 nm, β = 99.5° | ||
| Etching | CuO: 100% | a = 0.46848 nm, b = 0.34390 nm, c = 0.51308 nm, β = 99.5° |
© 2017 by the authors. Licensee MDPI, Basel, Switzerland. This article is an open access article distributed under the terms and conditions of the Creative Commons Attribution (CC BY) license ( http://creativecommons.org/licenses/by/4.0/).
Share and Cite
Marano, E.F.; Castellero, A.; Baricco, M. Nanoporous Microtubes via Oxidation and Reduction of Cu–Ni Commercial Wires. Metals 2017, 7, 46. https://doi.org/10.3390/met7020046
Marano EF, Castellero A, Baricco M. Nanoporous Microtubes via Oxidation and Reduction of Cu–Ni Commercial Wires. Metals. 2017; 7(2):46. https://doi.org/10.3390/met7020046
Chicago/Turabian StyleMarano, Emanuele Francesco, Alberto Castellero, and Marcello Baricco. 2017. "Nanoporous Microtubes via Oxidation and Reduction of Cu–Ni Commercial Wires" Metals 7, no. 2: 46. https://doi.org/10.3390/met7020046