
Hot Deformation Behavior of As-Cast 30Cr2Ni4MoV Steel Using Processing Maps

1
Department of Mechanical Engineering, Tsinghua University, Beijing 100084, China
2
Key Laboratory for Advanced Materials Processing Technology of Ministry of Education, Tsinghua University, Beijing 100084, China
*
Author to whom correspondence should be addressed.
Metals 2017, 7(2), 50; https://doi.org/10.3390/met7020050
Submission received: 5 December 2016
/
Revised: 18 January 2017
/
Accepted: 19 January 2017
/
Published: 9 February 2017
(This article belongs to the Special Issue Advances in Plastic Forming of Metals)
Abstract
:The hot deformation behavior of as-cast 30Cr2Ni4MoV steel was characterized using processing maps in the temperature range 850 to 1200 °C and strain rate range 0.01 to 10 s−1. Based on the obtained flow curves, the power dissipation maps at different strains were developed and the effect of the strain on the efficiency of power dissipation was discussed in detail. The processing maps at different strains were obtained by superimposing the instability maps on the power dissipation maps. According to the processing map and the metallographic observation, the optimum domain of hot deformation was in the temperature range of 950–1200 °C and strain rate range of 0.03–0.5 s−1, with a peak efficiency of 0.41 at 1100 °C and 0.25 s−1 which were the optimum hot working parameters.
1. Introduction
In order to evaluate the explicit microstructural response of the material to the processing parameters, which include strain rate, deformation temperature and true strain, and to solve the problems related to workability and microstructural control in materials during hot deformation, the processing map was developed in 1984 based on the dynamic materials modeling (DMM) by Prasad [1]. Based on the processing maps generated using data of flow stress as a function of temperature and strain rate over a wide range, several domains safe for processing and regimes of flow instabilities and cracking can be identified [2]. With the information obtained from the processing map, the guideline for optimizing hot processing parameters can be determined, and the damage processes and instability processed can be avoided. The processing maps have been widely investigated in the production of titanium alloys [3], magnesium alloys [4,5], aluminium alloys [6], nickel alloys [7] and steels [8,9].
30Cr2Ni4MoV steel has attracted extensive attention for its good properties in terms of strength, toughness and wear resistance, and has been widely used in the production of an ultra-super-critical power cycle generator. In recent years, much research has been carried out to characterize the hot working behavior of 30Cr2Ni4MoV steel. Chen et al. evaluated the effects of the strain rate, temperature and initial grain size on the behavior of dynamic recrystallization (DRX) and meta-dynamic recrystallization (mDRX) [10,11]. Liu et al. investigated the microstructure evolution of 30Cr2Ni4MoV steel during multi-pass hot deformation under different deformation conditions [12].
In this study, the hot compression tests of 30Cr2Ni4MoV steel were carried out at the temperatures from 850 to 1200 °C and strain rates from 0.01 to 10 s−1 on a Gleeble-1500 thermo-simulation machine. Based on the experimental flow stress, the processing maps were developed at different strains. Finally, the optimum hot formation processing parameters for 30Cr2Ni4MoV steel were obtained.
2. Experimental Procedure
2.1. Hot Deformation Tests
The composition of the 30Cr2Ni4MoV steel used in this research, which was directly sampled from 600 t ingot, with a composition of 0.28C-0.02Mn-0.01Si-0.003P-0.003S-1.72Cr-0.41Mo-3.63Ni-0.11V-(bal.)Fe, and all values given in wt %. The steel was machined into cylindrical specimens which were 12 mm in height and 8 mm in diameter. One-hit isothermal compression tests were performed on a Gleeble-1500 thermal mechanical simulation tester (Dynamic Systems Inc., Poestenkill, NY, USA) in Tsinghua University. In order to reduce frictional effects during compression and avoid the sticking problem in quenching, the Ta pieces with a thickness of 0.5 mm were positioned between the anvils and the specimens. The specimens were firstly preheated at 1200 °C for 5 min to obtain the same initial grain size and homogeneous microstructure before compression [13]. After the structure uniformity, they were then cooled to the test deformation temperature at 10 °C/s and held for 1 min prior to deformation for the purpose of temperature gradient elimination. Deformation temperature ranging from 850 °C to 1200 °C in increments of 50 °C were chosen for these compression tests. A deformation of strain was applied at strain rates ranging from 0.01 s−1 to 10 s−1, which was followed by water quenching to preserve the deformed austenite microstructure for metallographic observation. The polished surfaces were etched using a saturation picric acid for 7 min water bath heating at 70 °C. All optical micrographs were obtained from the center of the longitudinal sections of the specimens and the original grain size after soaking at 1200 °C for 5 min was 266.1 μm.
2.2. Processing Map Establishment
The processing map is generated using data of flow stress as a function of temperature and strain rate over a wide range obtained from the hot compression test based on the theory of DMM [1,2,14,15]. According to the DMM, the workpiece essentially dissipates power during hot deformation, which may be represented as a sum of two complementary parts: G and J [1,2]. The G represents the power dissipated by plastic deformation, most of which is converted into viscoplastic heat and the rest is stored as defect power. By contrast, the J is the energy related to microstructure changing such as dynamic recovery (DRV) and DRX. The power partitioning of the two parts above is decided by the strain rate sensitivity (m) and the power dissipation through microstructure changes can be represented by a non-dimensional parameter, the efficiency of power dissipation (η), which is defined as:
where the strain rate sensitivity (m) can be calculated by the following equation:
where σ is the flow stress and is the strain rate. The power dissipation map, where the various domains may be correlated with specific microstructural mechanisms, can be obtained based on the variation of η with temperature and strain rate. The value of the efficiency of dissipation in low stacking fault energy metals is about 0.3–0.5 for the DRX and 0.15–0.25 for the DRV [2].
The continuum instability criterion based on the extremum principle of irreversible thermodynamic is used as follows [16]:
The parameter can be plotted as a contour map in a frame of temperature and strain rate, and flow instabilities are predicted to occur when is negative. Such a plot is called an instability map that can be superimposed on the power dissipation map to obtain a processing map.
3. Results and Discussion
3.1. Flow Curve Behavior
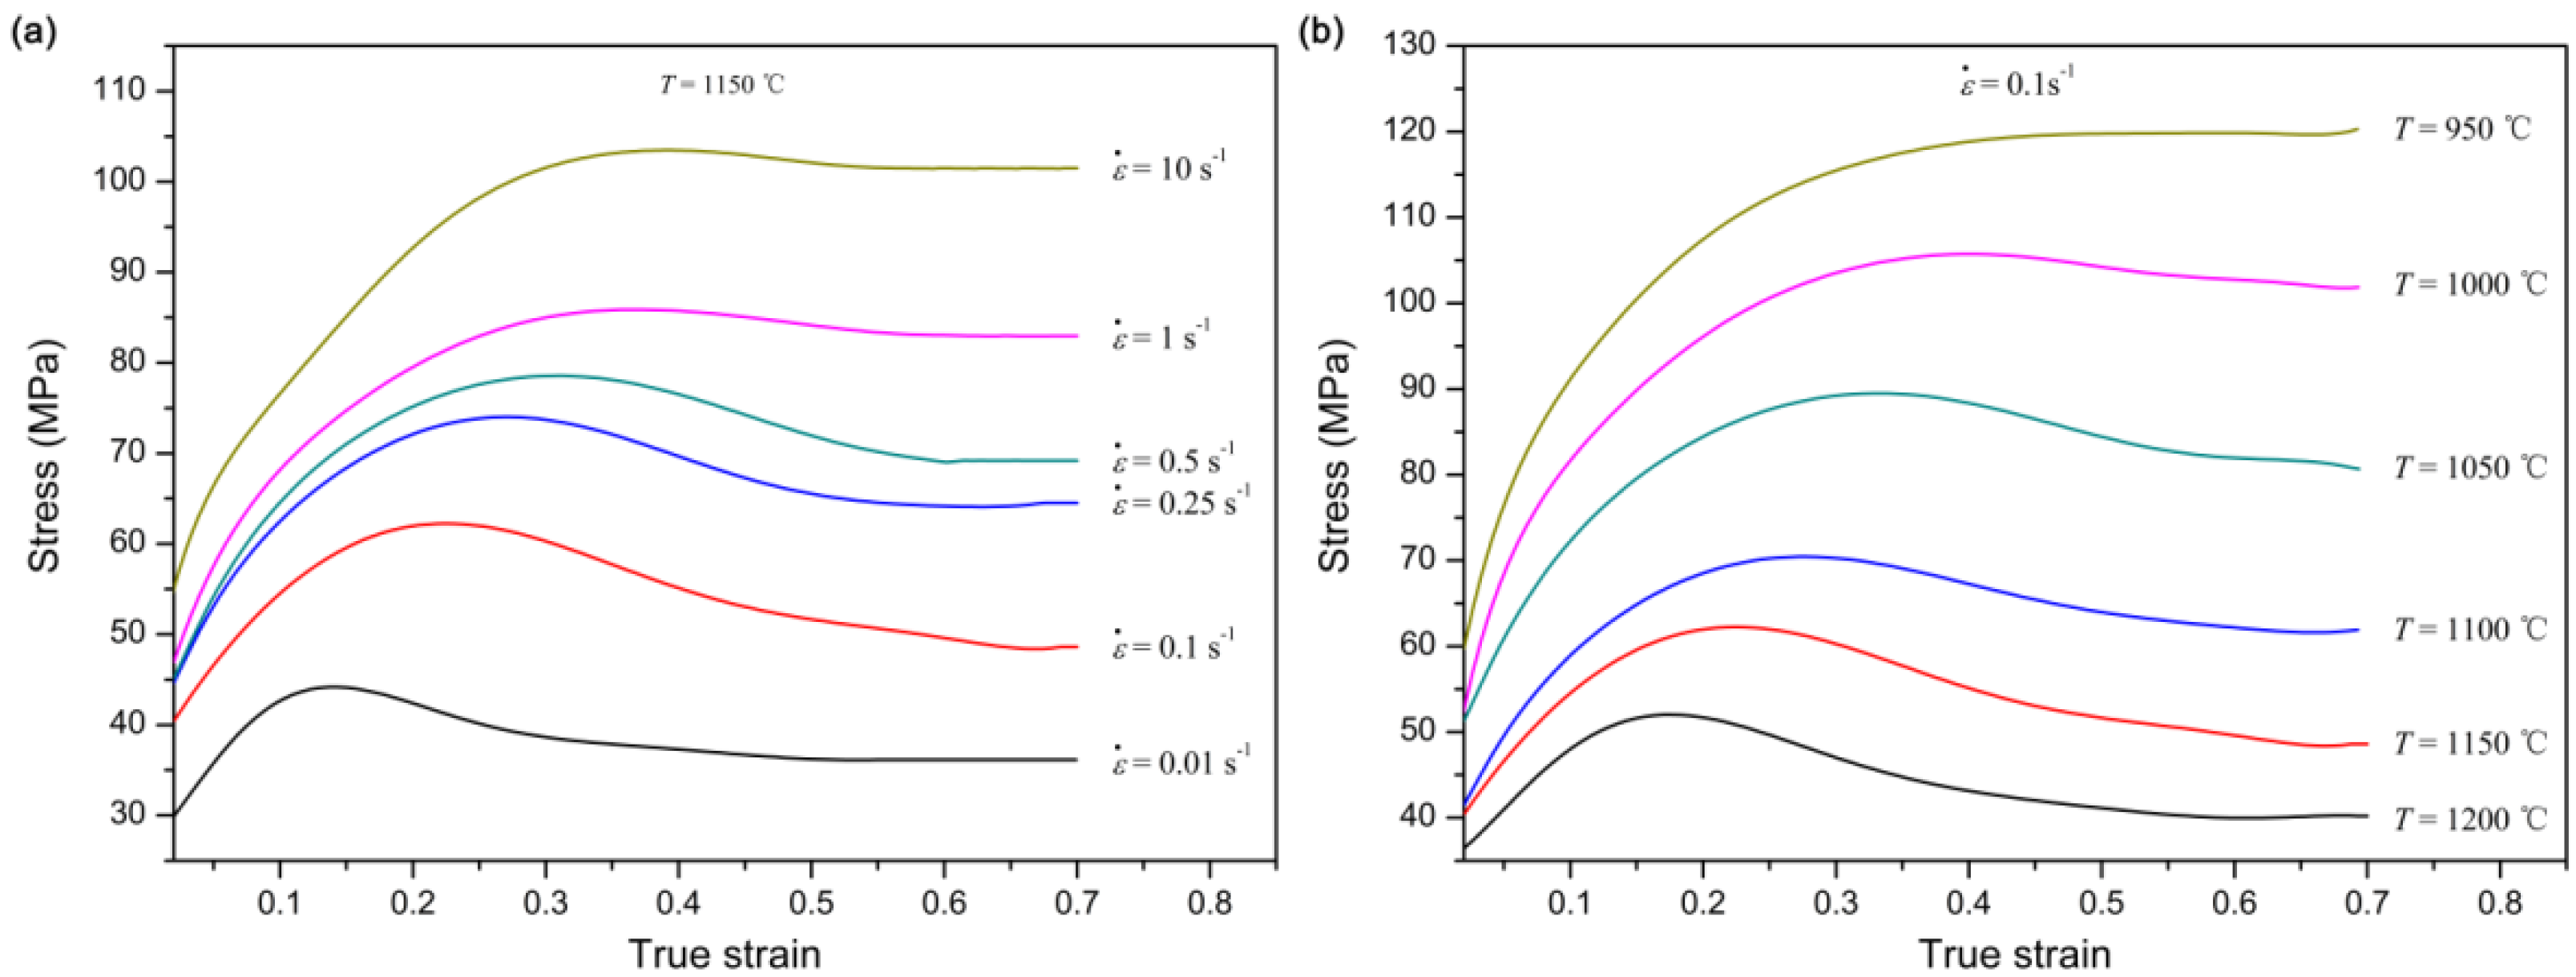
Figure 1 shows the typical flow curves obtained at different deformation temperatures and strain rates. All the flow curves are fitted with a 7th order or higher polynomial and smoothed from the yield strain, which is identified on the flow curve in terms of a 2% offset in the total strain [17]. It is found that the temperature and the strain rate have significant effects on the flow behavior and the stress increases with increasing strain rate (Figure 1a), while it is decreased with the increasing temperature (Figure 1b). According to the shape of the flow curves, they can be divided into two categories: (1) a progressive stress increasing with the increasing strain that reveals a DRV mechanism for the deformation process, such as 950 °C and 0.1 s−1; (2) the stress increases with the increasing strain to a peak and then decreases with further increasing strain until a steady stress is attained, which results from the occurrence of the DRX, such as 1200 °C and 0.1 s−1.
When the metals are subjected to plastic deformation at elevated temperature, the flow behavior is determined by the competition between dynamic softening and work hardening. At the initial stage of the deformation, the work hardening that resulted from the dislocation density increasing dominates the process which leads to a gradual increase of the stress. When the sample is deformed at a high temperature and low strain rate, as the deformation proceeded, the stress increases to a peak stress and a low work hardening rate, which resulted from the occurrence of DRX. Then, the softening due to DRX dominates the process, which results in a decrease of the stress until a steady stress is reached. By contrast, when the temperature is lower than 950 °C and the strain rate is higher than 0.1 s−1, the softening caused by DRV cannot completely counteract the work hardening. Consequently, the stress progressively increases with the increasing strain.
The flow stress data obtained at different temperatures, strain rates, and strain are shown in Table 1, which is the input to the processing map establishment.
3.2. Processing Map Establishment
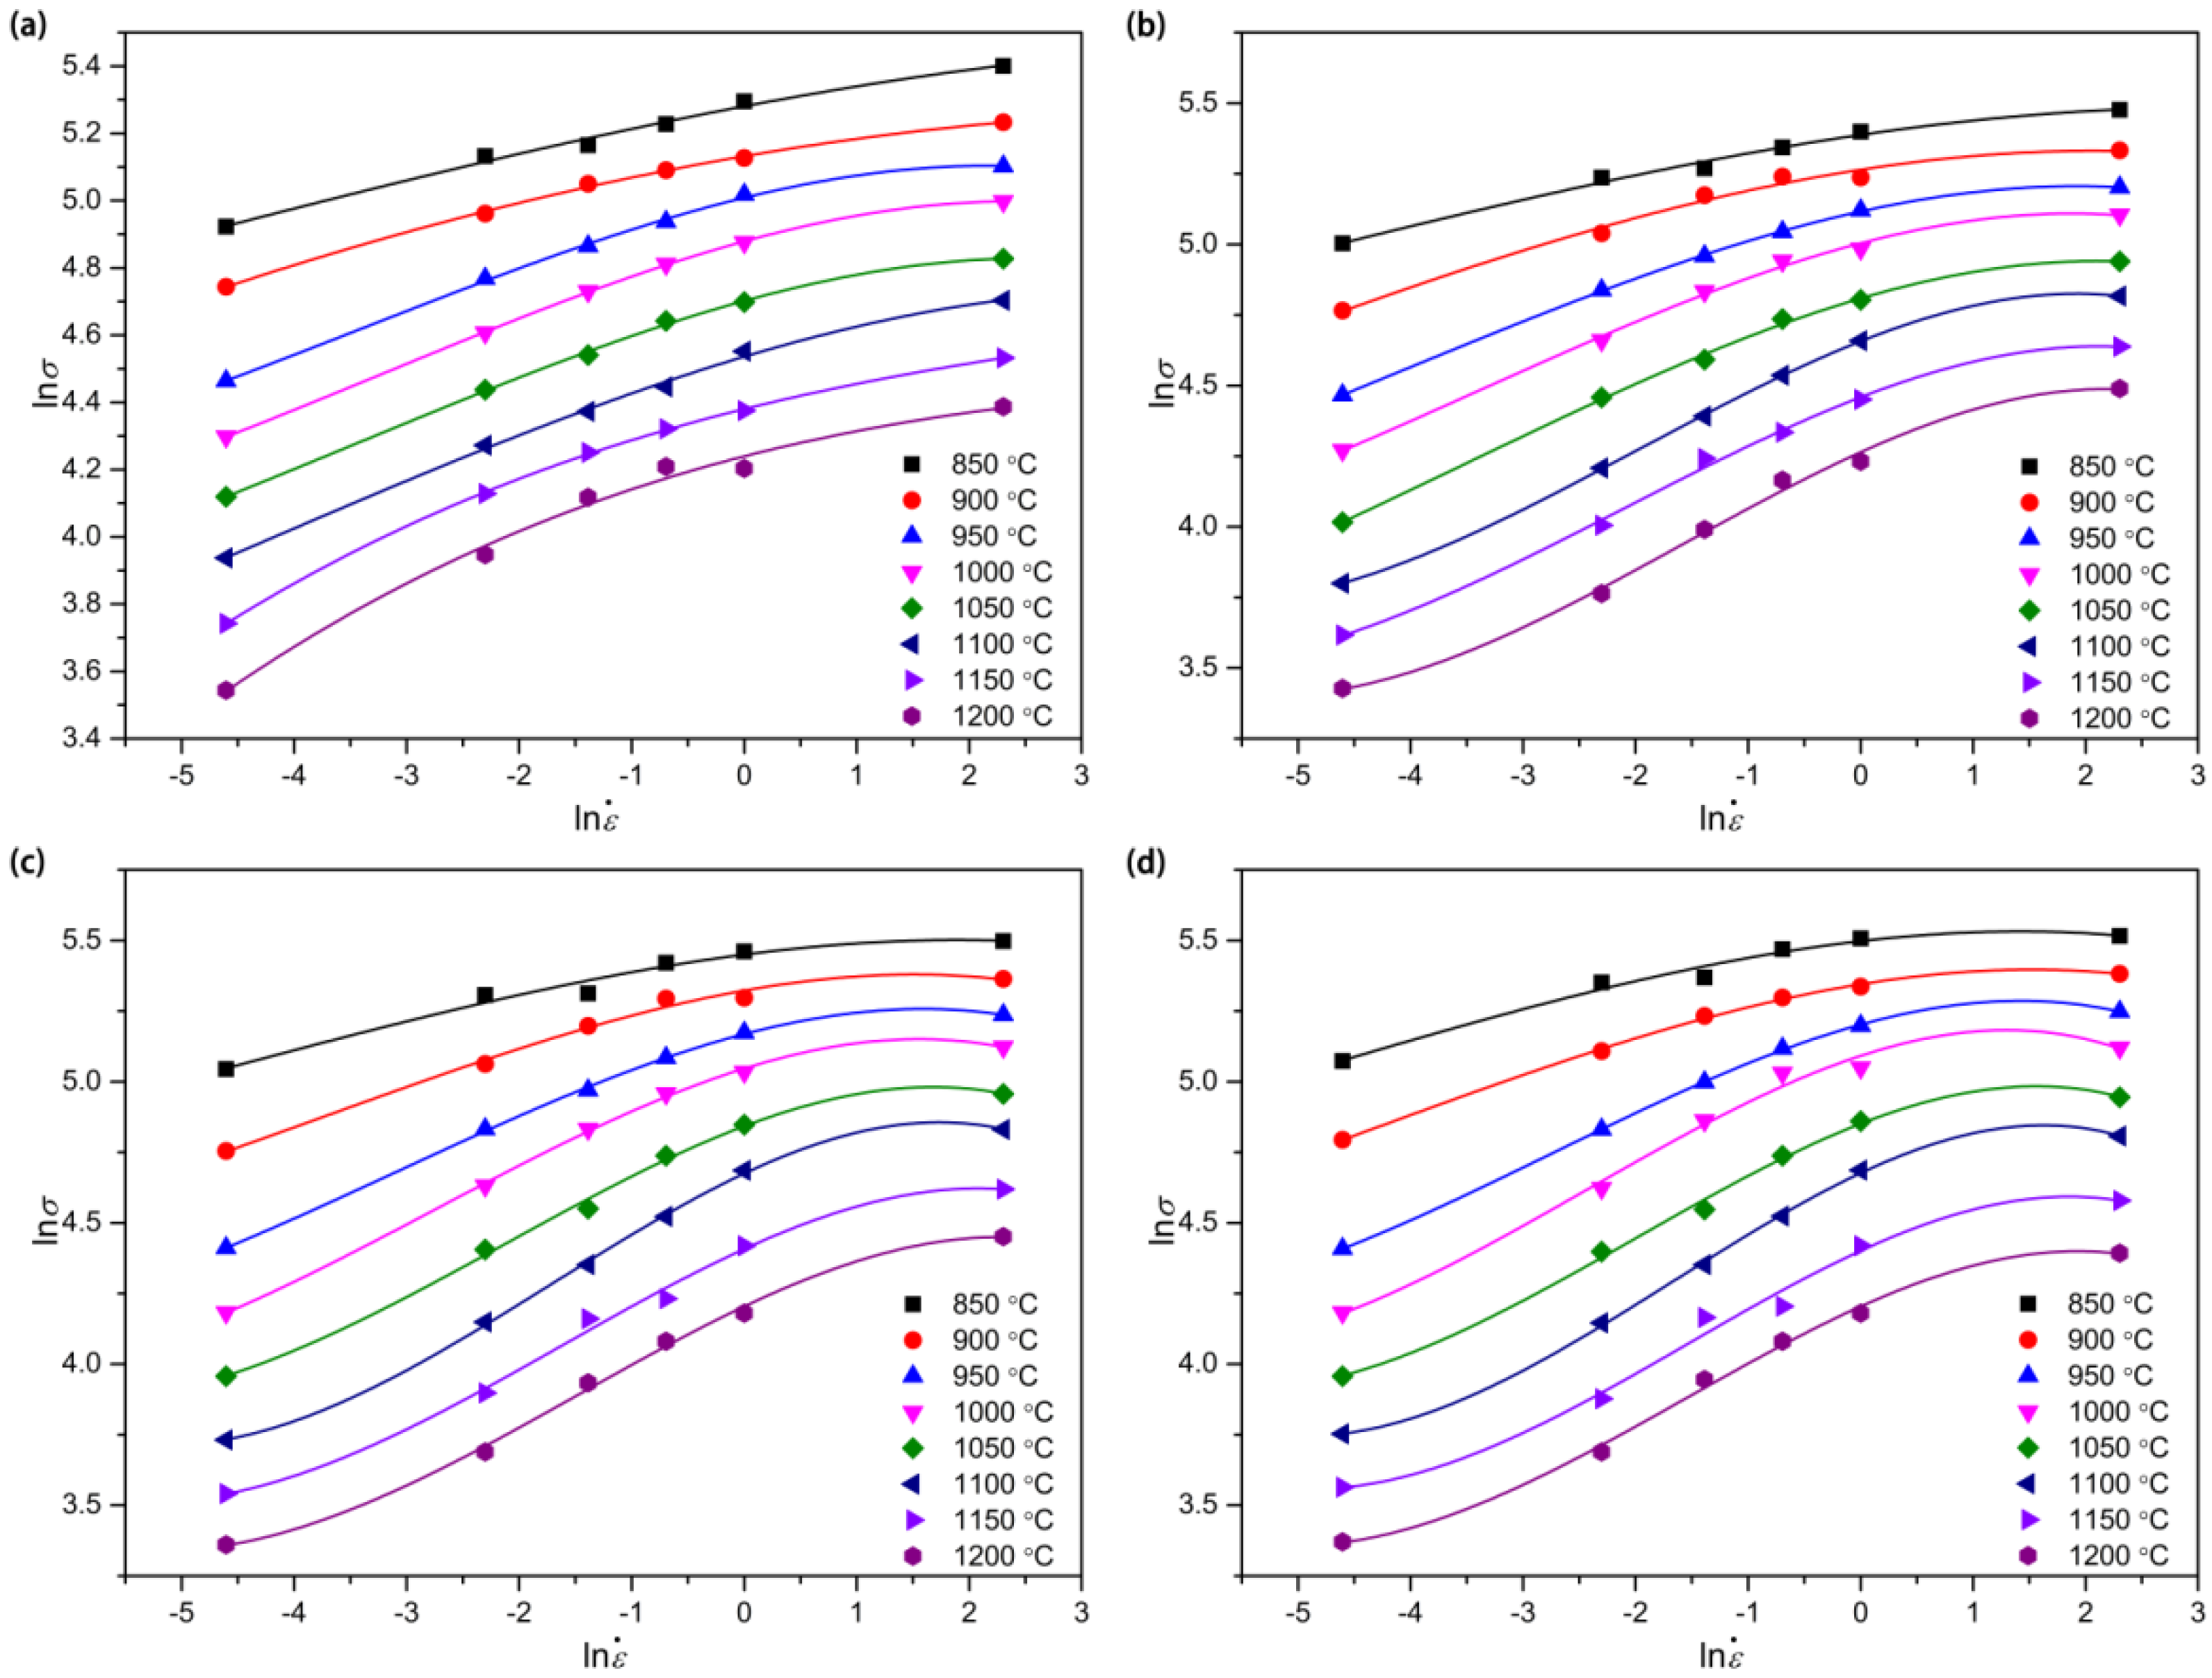
The flow stress data as a function of temperature, strain rate and strain can be obtained from the fitted and smoothed flow curves at strains of 0.2, 0.4, 0.6 and 0.7. According to Equation (2), the strain rate sensitivity parameter m can be obtained by plotting the versus and then differentiating the third-order polynomial fitted curve (Figure 2). Once the values of m at different deformation conditions are determined, the values of η under strain of 0.2, 0.4, 0.6 and 0.7 can be calculated with the aid of Equation (1) and then the parameter can be obtained by Equation (3). Finally, the power dissipation map at different strains can be constructed based on the values of η as a function of temperature and strain rate, as well as the processing map by means of superimposition of the instability map on the power dissipation map.
3.3. Variation of the Values of m
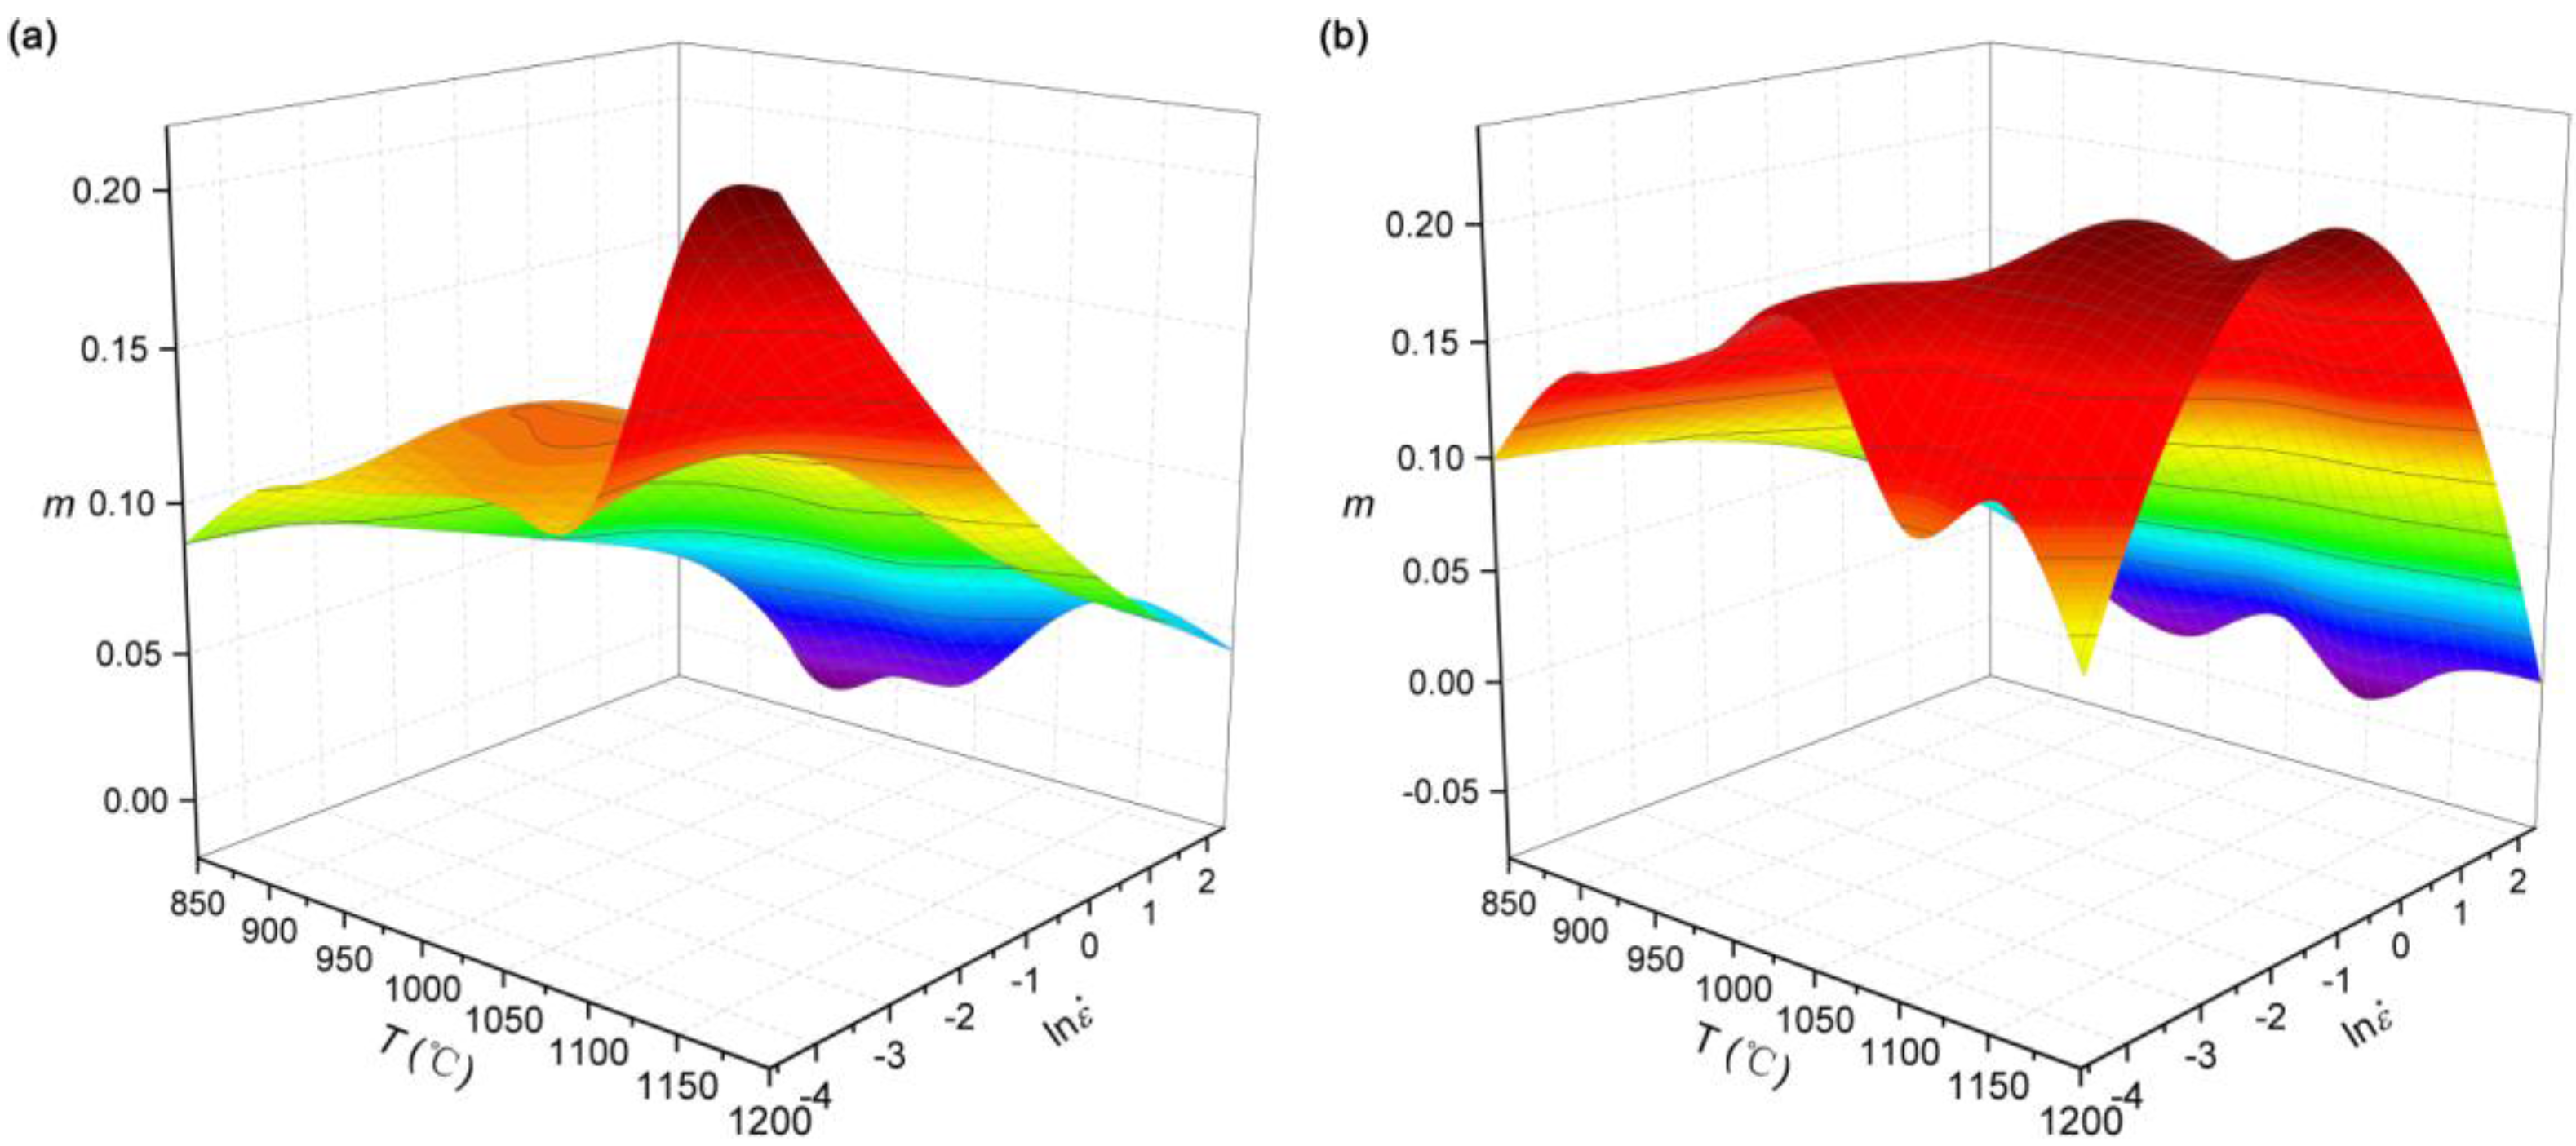
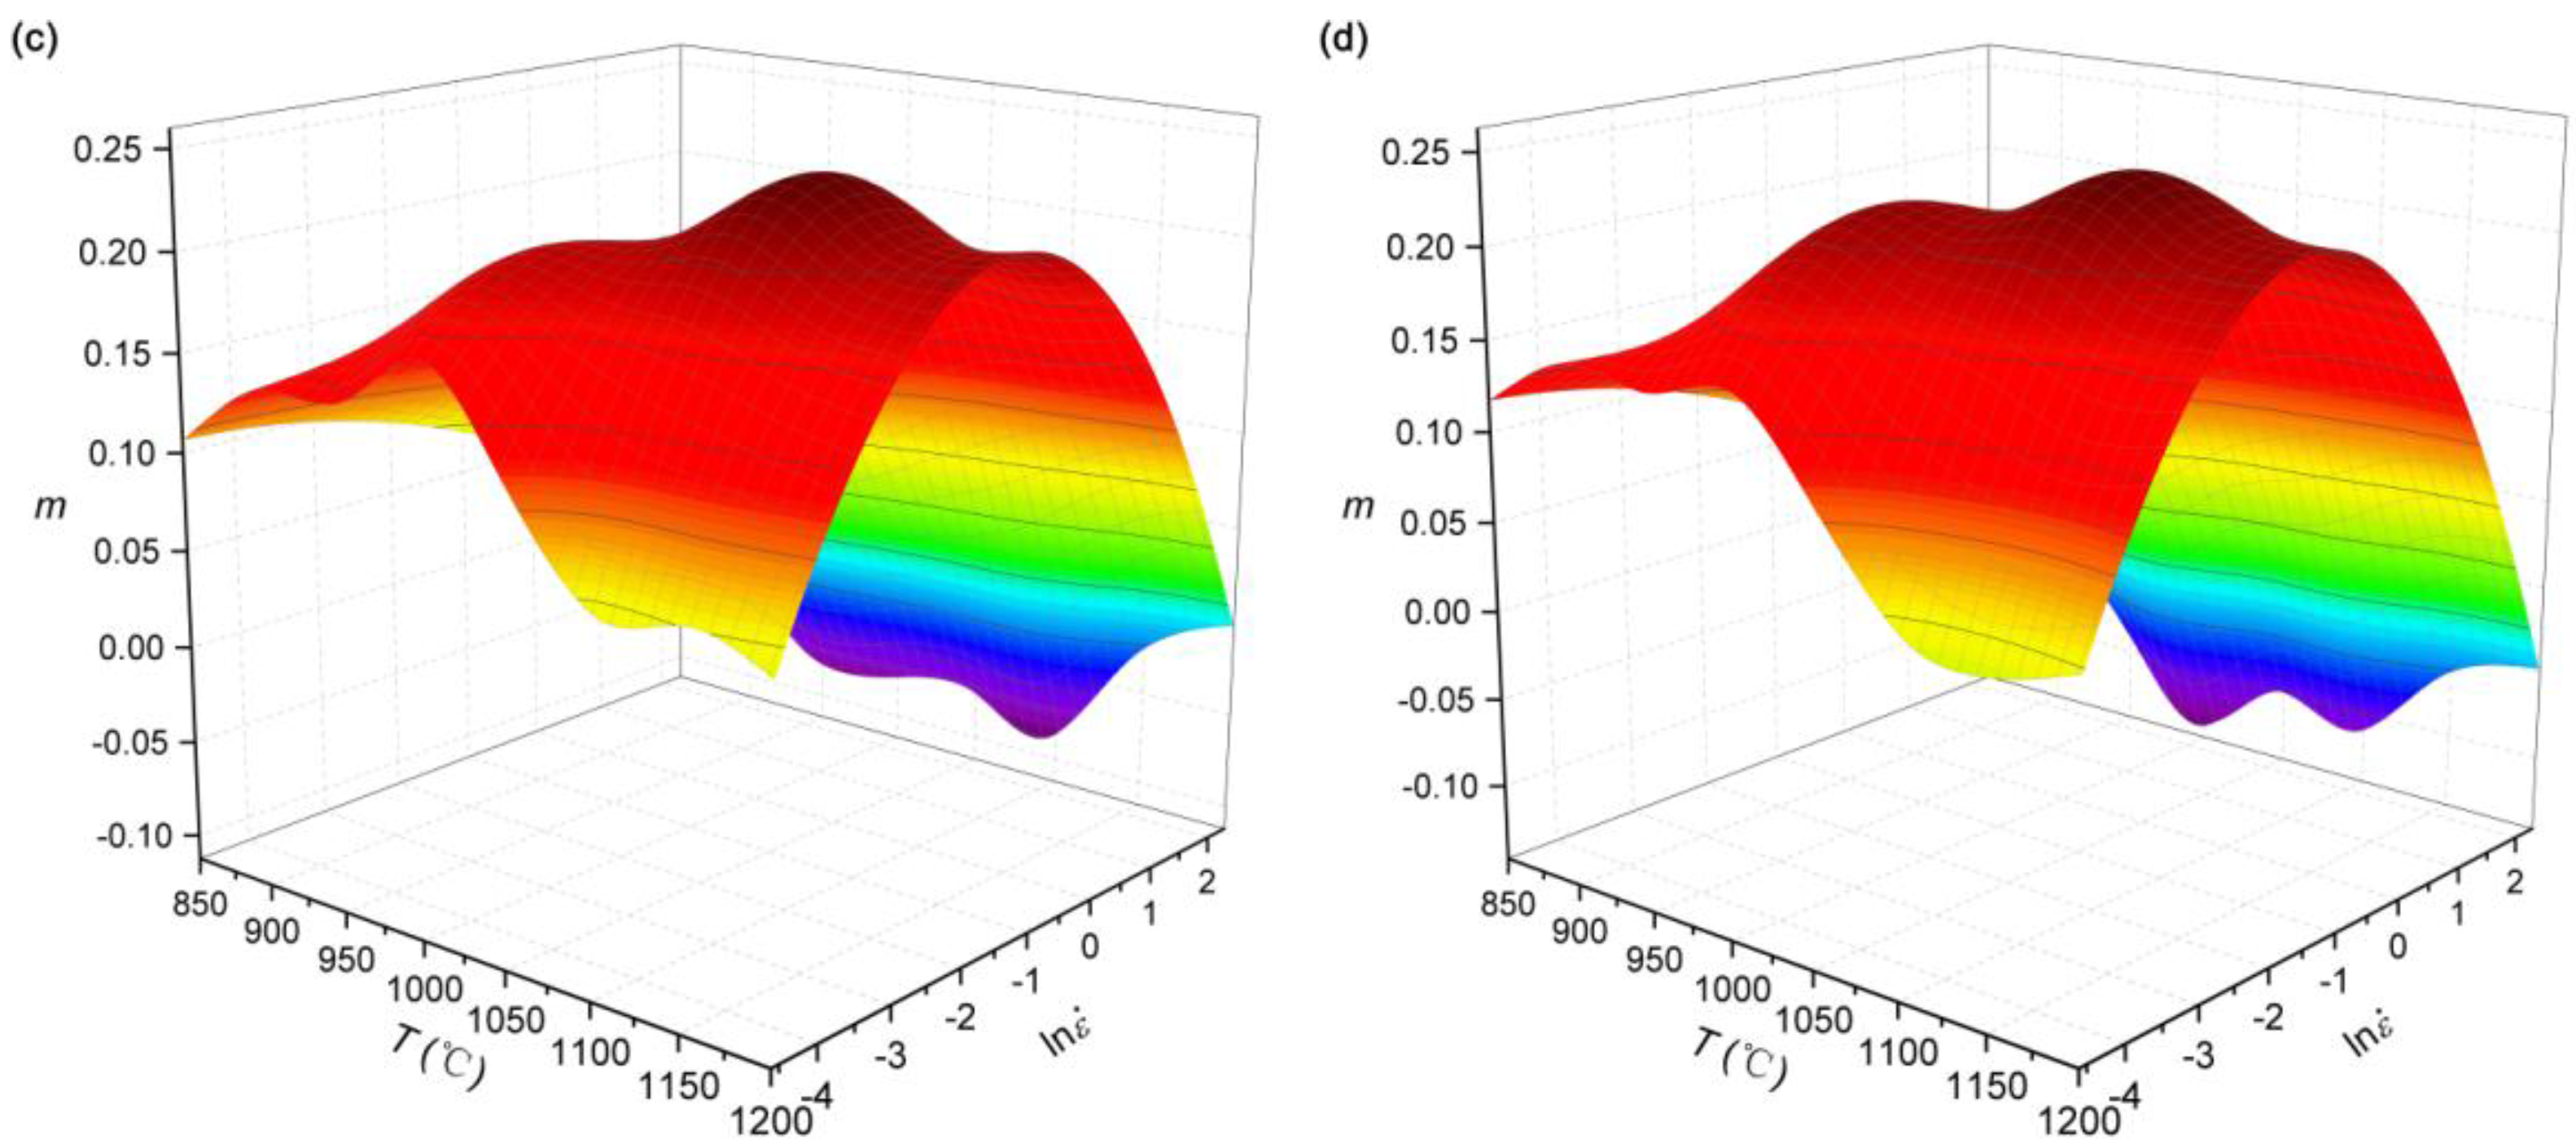
As described in Equations (1) and (3), the values of η and are related with the values of m under different deformation conditions. In order to describe the variation of m with deformation temperature and strain rate, the 3D surfaces at strains of 0.2, 0.4, 0.6 and 0.7 are plotted as shown in Figure 3. It is found that the values of m vary irregularly with deformation temperature and strain rate, which is in agreement with the previous report [18]. However, the negative values of m can be observed at some regions, such as 1000 °C and 10 s−1 shown in Figure 3d. As pointed out previously [18], the negative m-values are usually a result from the occurrence of deformation twinning, shear band formation, dynamic strain aging or initiation and growth of micro-cracks that can lead to instabilities.
3.4. Power Dissipation Map
3.4.1. Effect of the Strain on the Efficiency of Power Dissipation (η)
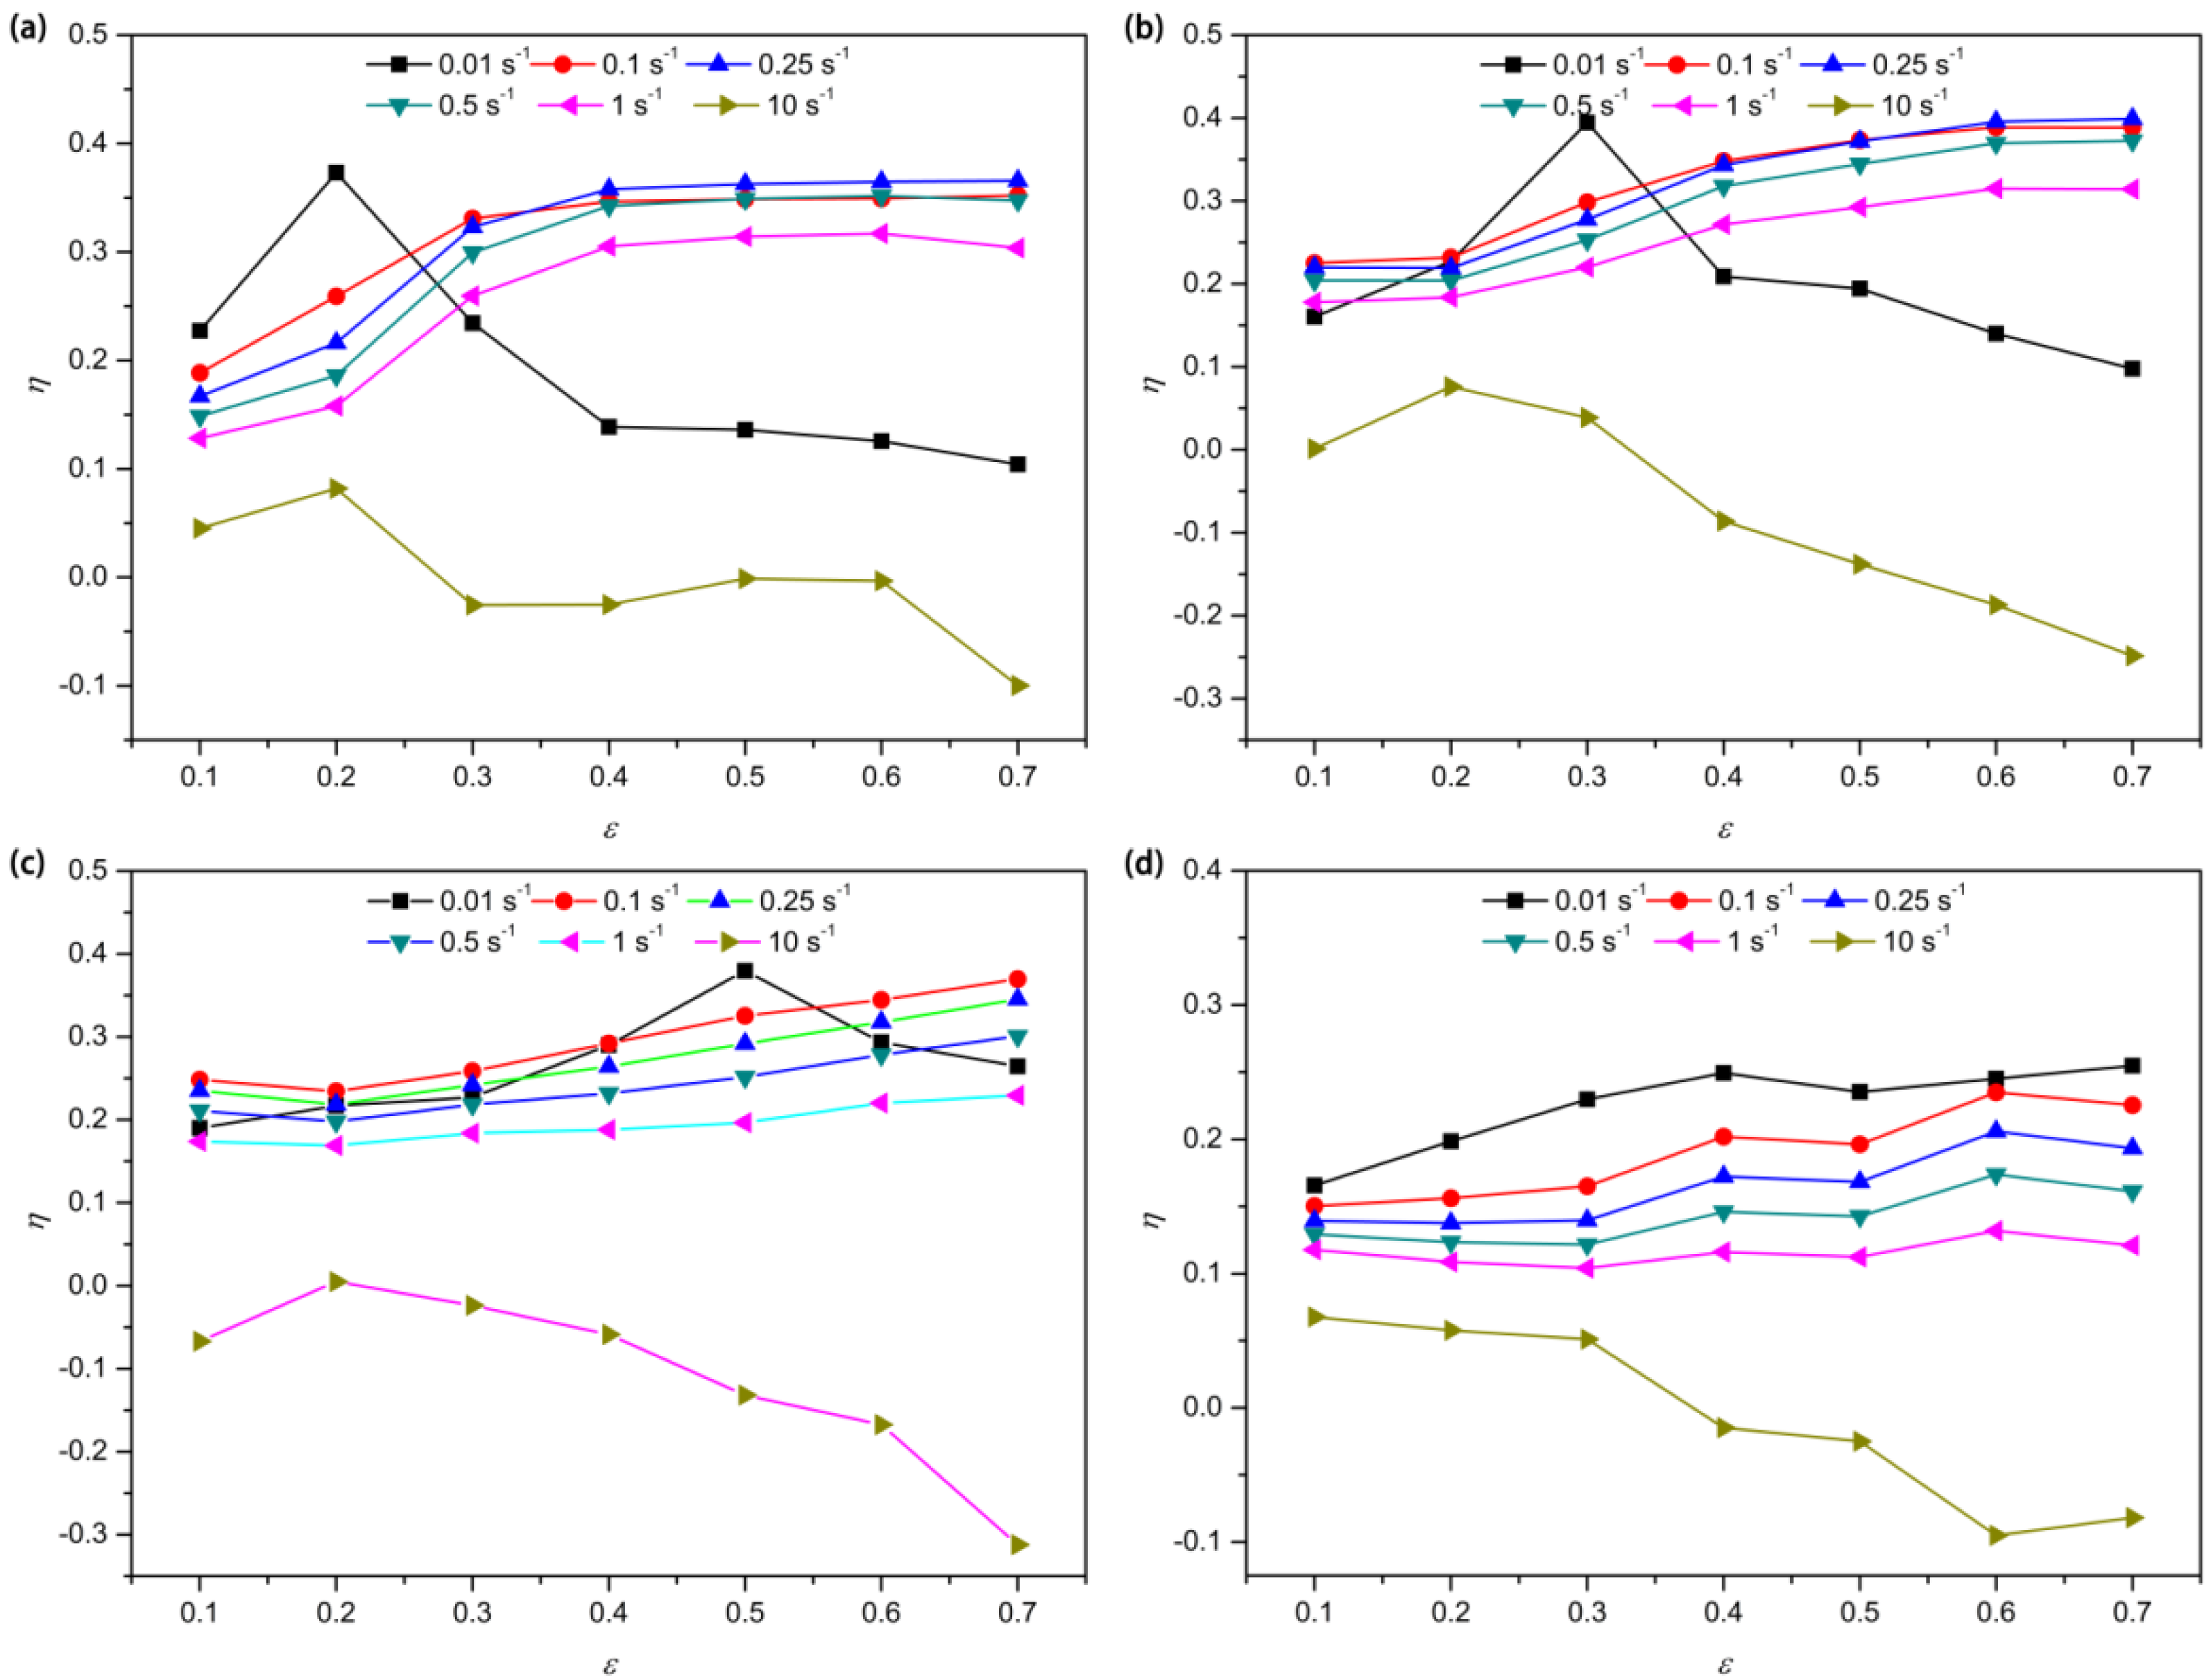
Figure 4 shows the dependence of the efficiency of power dissipation on the strain of the 30Cr2Ni4MoV steel under different temperatures and strain rates. It is found that the efficiency of power dissipation is sensitive to the deformation conditions. When the deformation temperatures are 1200 °C (Figure 4a), 1100 °C (Figure 4b) and 1000 °C (Figure 4c), the variation of η with deformation conditions can be divided into three categories:
- (1)
- The values of η at the strain rate of 0.01 s−1 increase with the increasing strain to a peak and then decrease with further increasing strain. The phenomenon is related to the microstructure evolution during the deformation. At the beginning, the values of η increase to a peak, which means the completion of the DRX. Then, the growth of the recrystallized grains leads to the decrease of the η values. However, it should be pointed out that the values of η increase with the increasing strain, and no peak appears when the deformation temperature is 950 °C, which is a result of the absence of the DRX.
- (2)
- The values of η at the strain rates range of 0.1–1 s−1 increase with increasing strain. This is attributed to the increase of the volume of the DRX. However, when the steel is deformed at 1000 °C with strain rates of 1 and 10 s−1, the maximum values of η is less than 0.3, which means that DRV takes place during deformation.
- (3)
- The values of η at the strain rate of 10 s−1 decrease with the increasing strain. The occurrence of the unstable flow bands is responsible for the decrease of the power dissipation efficiency.
However, when the deformation temperature is 900 °C (Figure 4d), the values of η are less than 0.3 and change very little at the strain rates range of 0.01–1 s−1. This is because it is difficult for DRX to take place at 900 °C, and the DRV is the main softening mechanism. When the strain rate is 10 s−1, the values of η decrease with the increasing stain, which results from the occurrence of the flow localization [19].
3.4.2. Processing Map Analysis and Microstructure Evolution
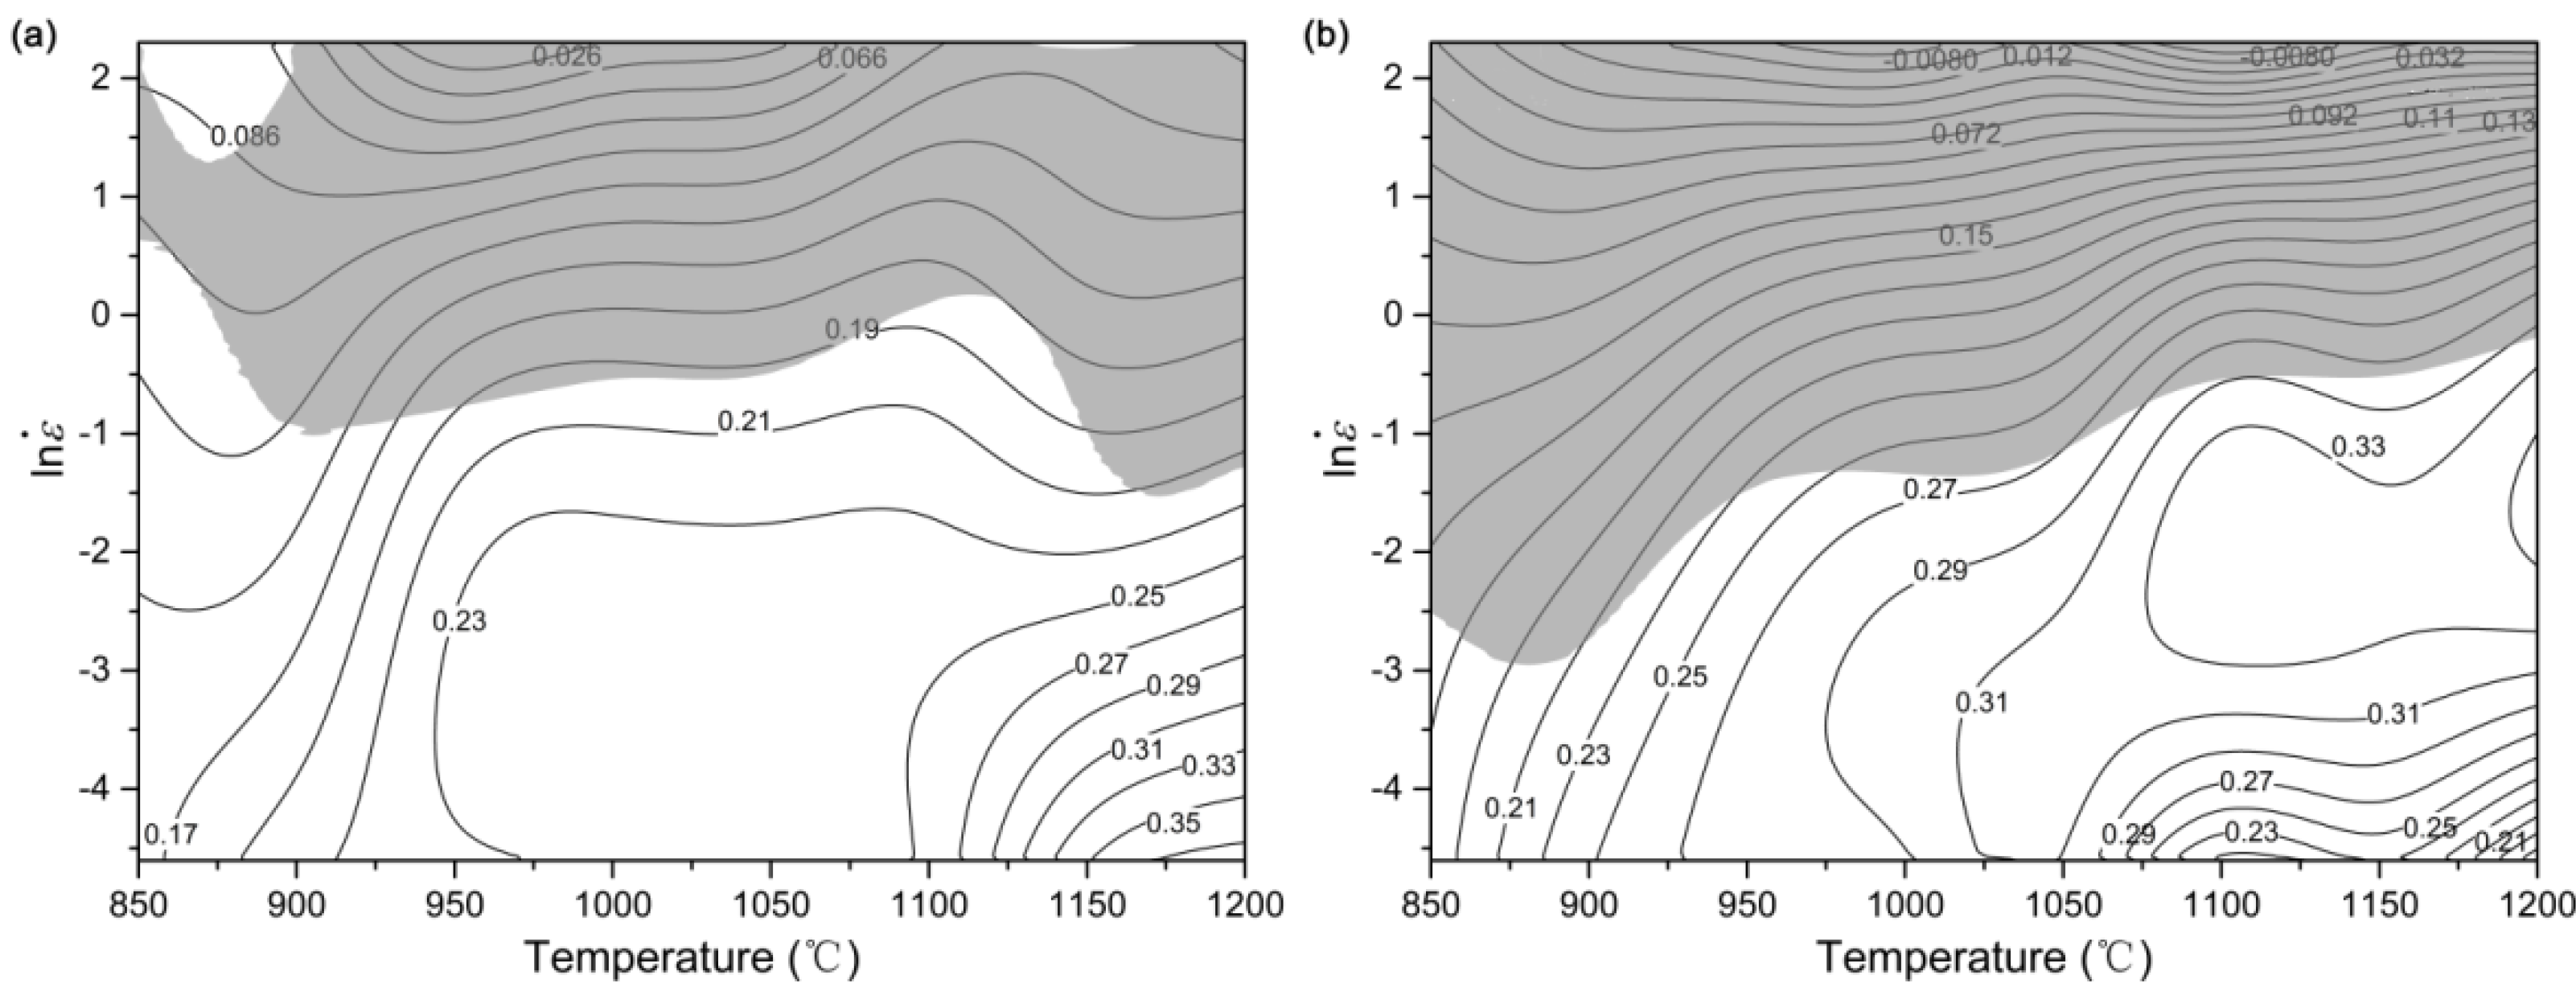
Figure 5 shows the processing maps of the 30Cr2Ni4MoV steel, which are obtained by superimposing the instability maps on the power dissipation efficiency maps, at temperatures in the range of 850–1200 °C and strain rates in the range of 0.01–10 s−1 when the strains are reached 0.2, 0.4, 0.6 and 0.7, respectively. The contours represent constant efficiency and the shade areas denote the unsafe domains obtained according to Equation (3). A comparison between Figure 5a,b reveals that the unsafe domain increases with the increase of strain. However, the map is not significantly affected by strain when the strain is larger than 0.4.
In the instability domain defined by Equation (3), the occurrence of flow localization, adiabatic shear bands and dynamic ageing affect the formability of the material during shaping and degrade the mechanical properties of the product [1,2]. By contrast, in the “safe” regime, the DRX and DRV occur and result in the microstructure evolution during deformation. The processing map of the 30Cr2Ni4MoV steel developed at the strain of 0.7 (Figure 5d) is divided into four domains marked as A, B, C and D, respectively. These domains are interpreted based on the above considerations and validated with the help of the microstructural examination.
Domain A occurs at the temperature range of 1050–1200 °C and the strain rate range of 0.01–0.03 s−1. As shown in Figure 4a,b and Figure 5a–d, the values of η in this domain increase firstly and then decrease with increasing strain, such as 1200 °C and 0.01 s−1. Figure 6a–c shows the optical microstructure of the samples compressed at 1200 °C and 0.01 s−1 with strains of 0.3, 0.5 and 0.7, respectively. The average grain sizes are 73, 82 and 101 μm, respectively. Therefore, the decrease of the values of η results from the growth of the recrystallized grains, which can be attributed to the enhanced mobility of grain boundaries under high temperature and low strain rate. In order to prevent the coarse grain structure, domain A is not recommended as a feasible deformation zone.
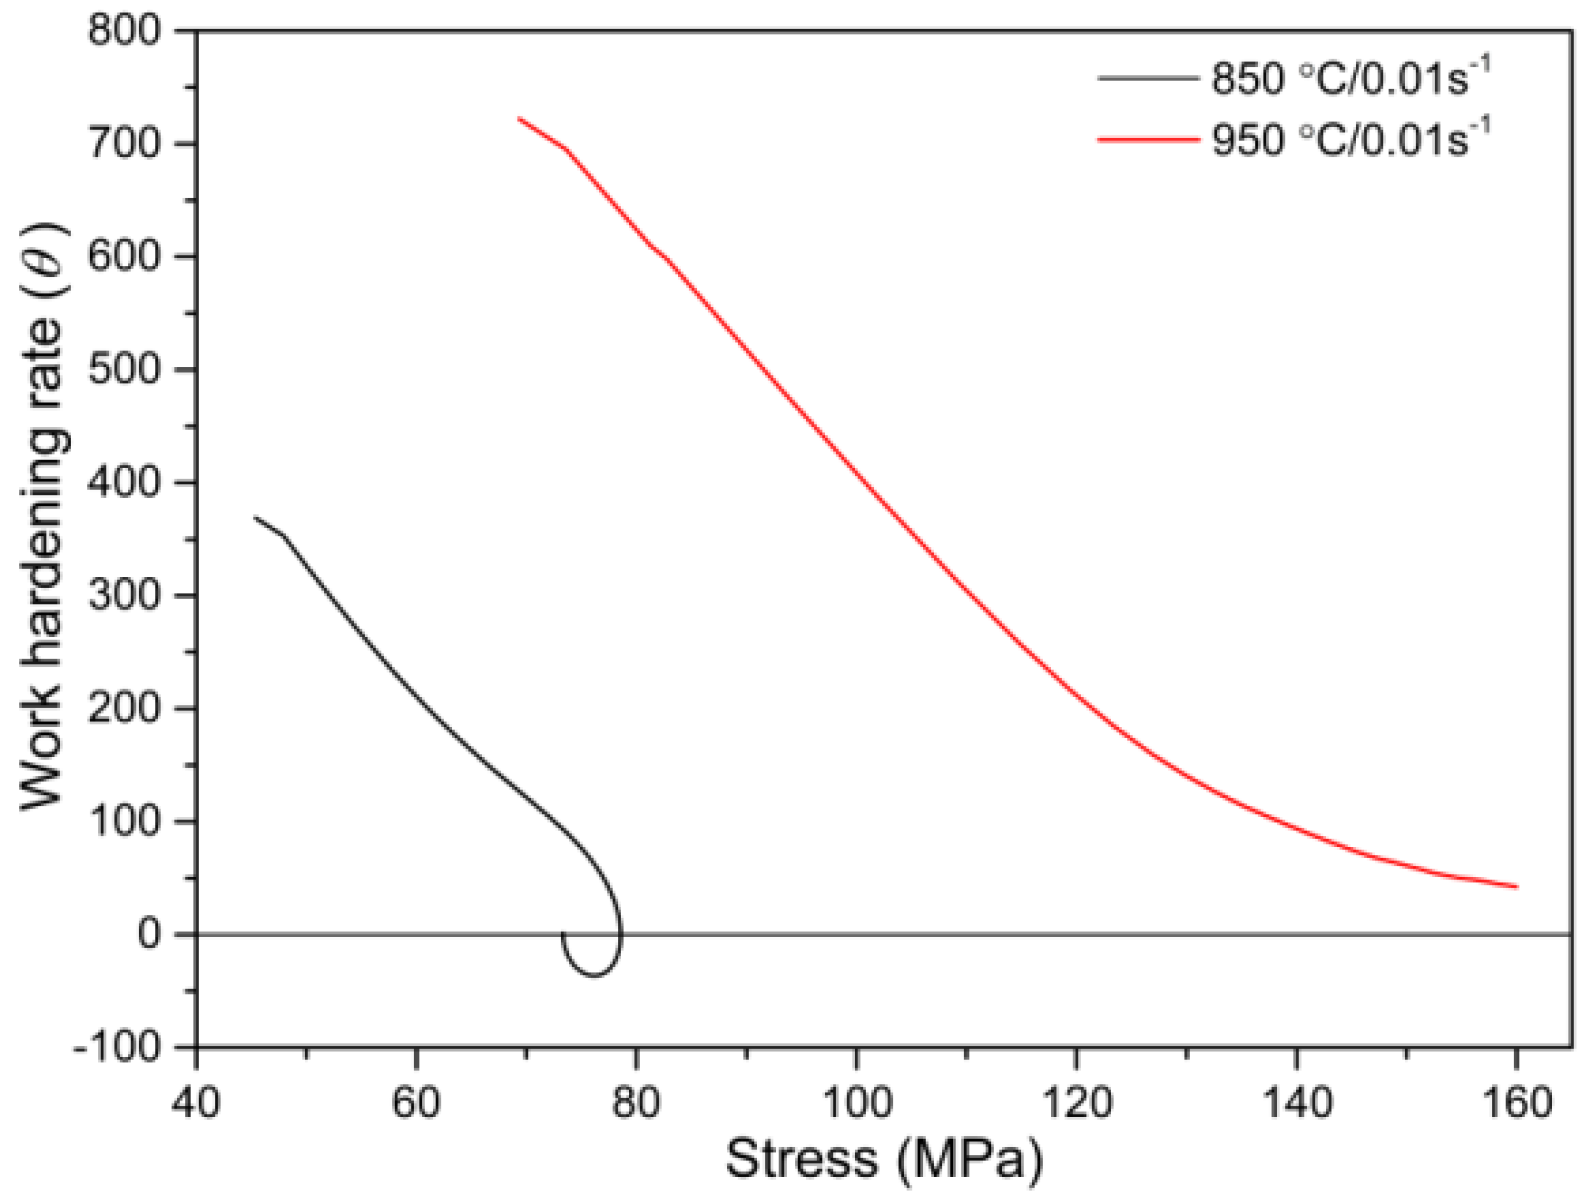
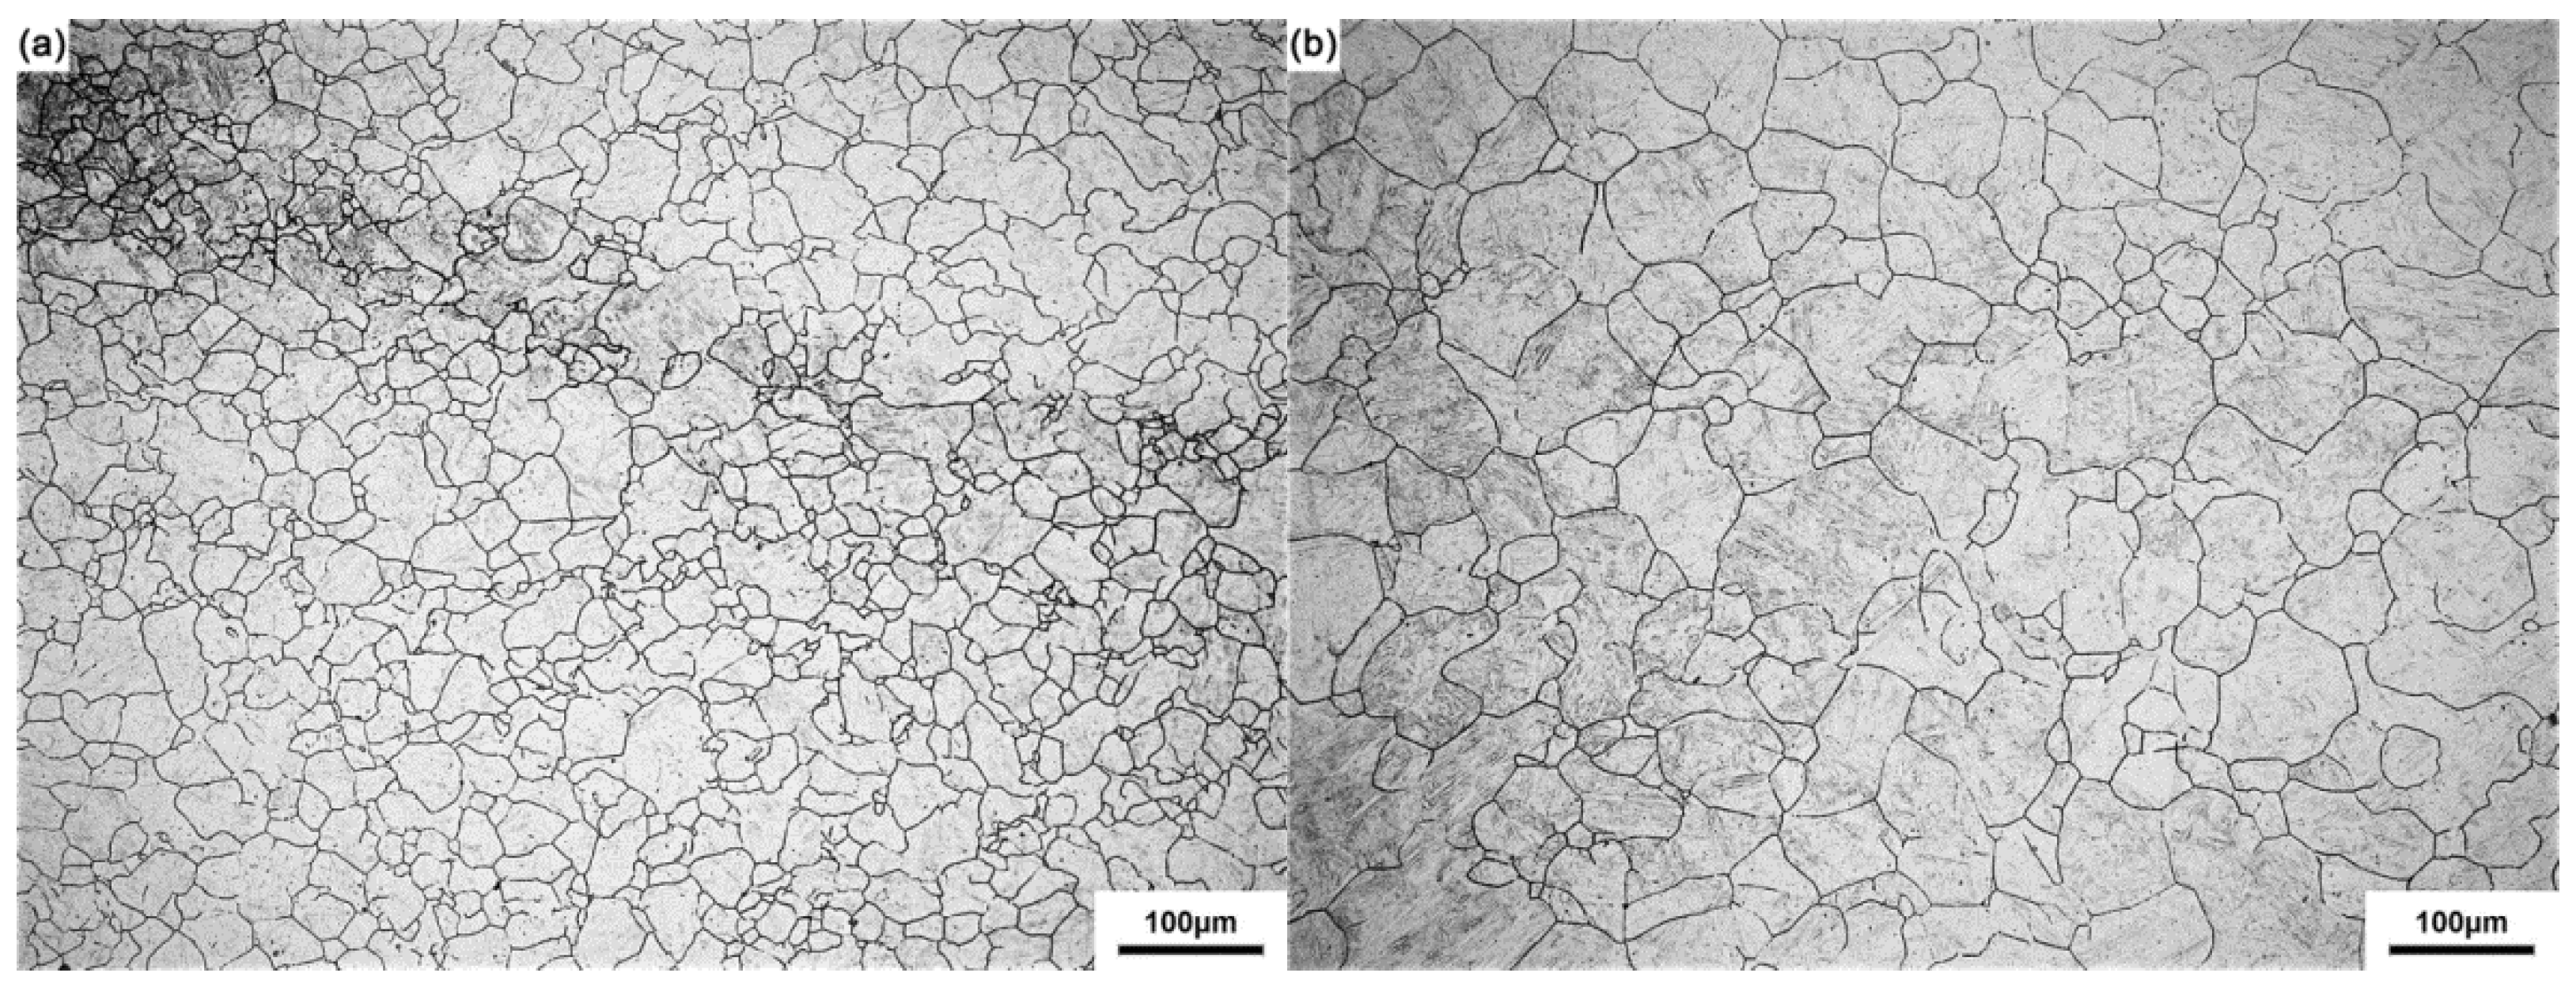
Domain B occurs at the temperature range of 900–1000 °C and the strain rate range of 0.01–0.03 s−1. The values of η in this domain are less than 0.3, and this domain is a stability area. The optical micrographs of the samples deformed at the conditions of 850 °C/0.01 s−1 and 950 °C/0.01 s−1 are given in Figure 7a,b, respectively. The microstructure obtained at the conditions of 850 °C/0.01 s−1 represents the dynamic recovery followed by static recrystallization [20]. Similar microstructures are also interpreted to represent the DRX process [21]. When the deformation condition is 950 °C/0.01 s−1, the typical “necklace structure” suggested that the DRX could be the primary mechanism during compression. It should be pointed out that the annealing twins play an important role during the nucleation and subsequent growth of recrystallized growth as shown in Figure 7a. For the 30Cr2Ni4MoV steel under consideration in this study, the DRV hardly takes place due to its low stacking fault energy. Therefore, the domains with relative low values of η less than 0.3 do not necessarily indicate the absence of the occurrence of DRX. The dependence of the work hardening rate on the stress under the above deformation conditions are shown in Figure 8. It is found that the work hardening rate is linearly related to the stress when the deformation condition is 850 °C/0.01 s−1. However, when the deformation condition is 950 °C/0.01 s−1, the plot is a typical curve that indicates the occurrence of the DRX. Such plots confirm that the DRV takes place when the deformation condition is 850 °C/0.01 s−1 and the DRX dominates the deformation process when the deformation condition is 950 °C/0.01 s−1. On account of the partial DRX and necklace structure, domain B is not the recommended zone for deformation.
Domain C is the instability region with the values of η lower than 0.3. The microstructures of the samples deformed at 850 °C with strain rates of 0.1, 1 and 10 s−1 are given in Figure 9a–c, respectively. All of the microstructures exhibit flow bands that manifest the occurrence of flow instability. This is attributed to the uneven temperature distribution, which results from the limited time for the heat transfer under high strain rate in the deformed specimen. The deformation preferably takes place in the part with high temperature, and the flow localization band and inhomogeneous microstructure appear. Furthermore, the intensity of the bands increases with an increase in strain rate. Additionally, it is observed that these bands are preferential sites for the nucleation of DRX. The flow bands and the partial DRX structure degrade the properties of the product. Hence, this domain where the flow instability occurs is to be avoided during the forming of 30Cr2Ni4MoV steel.
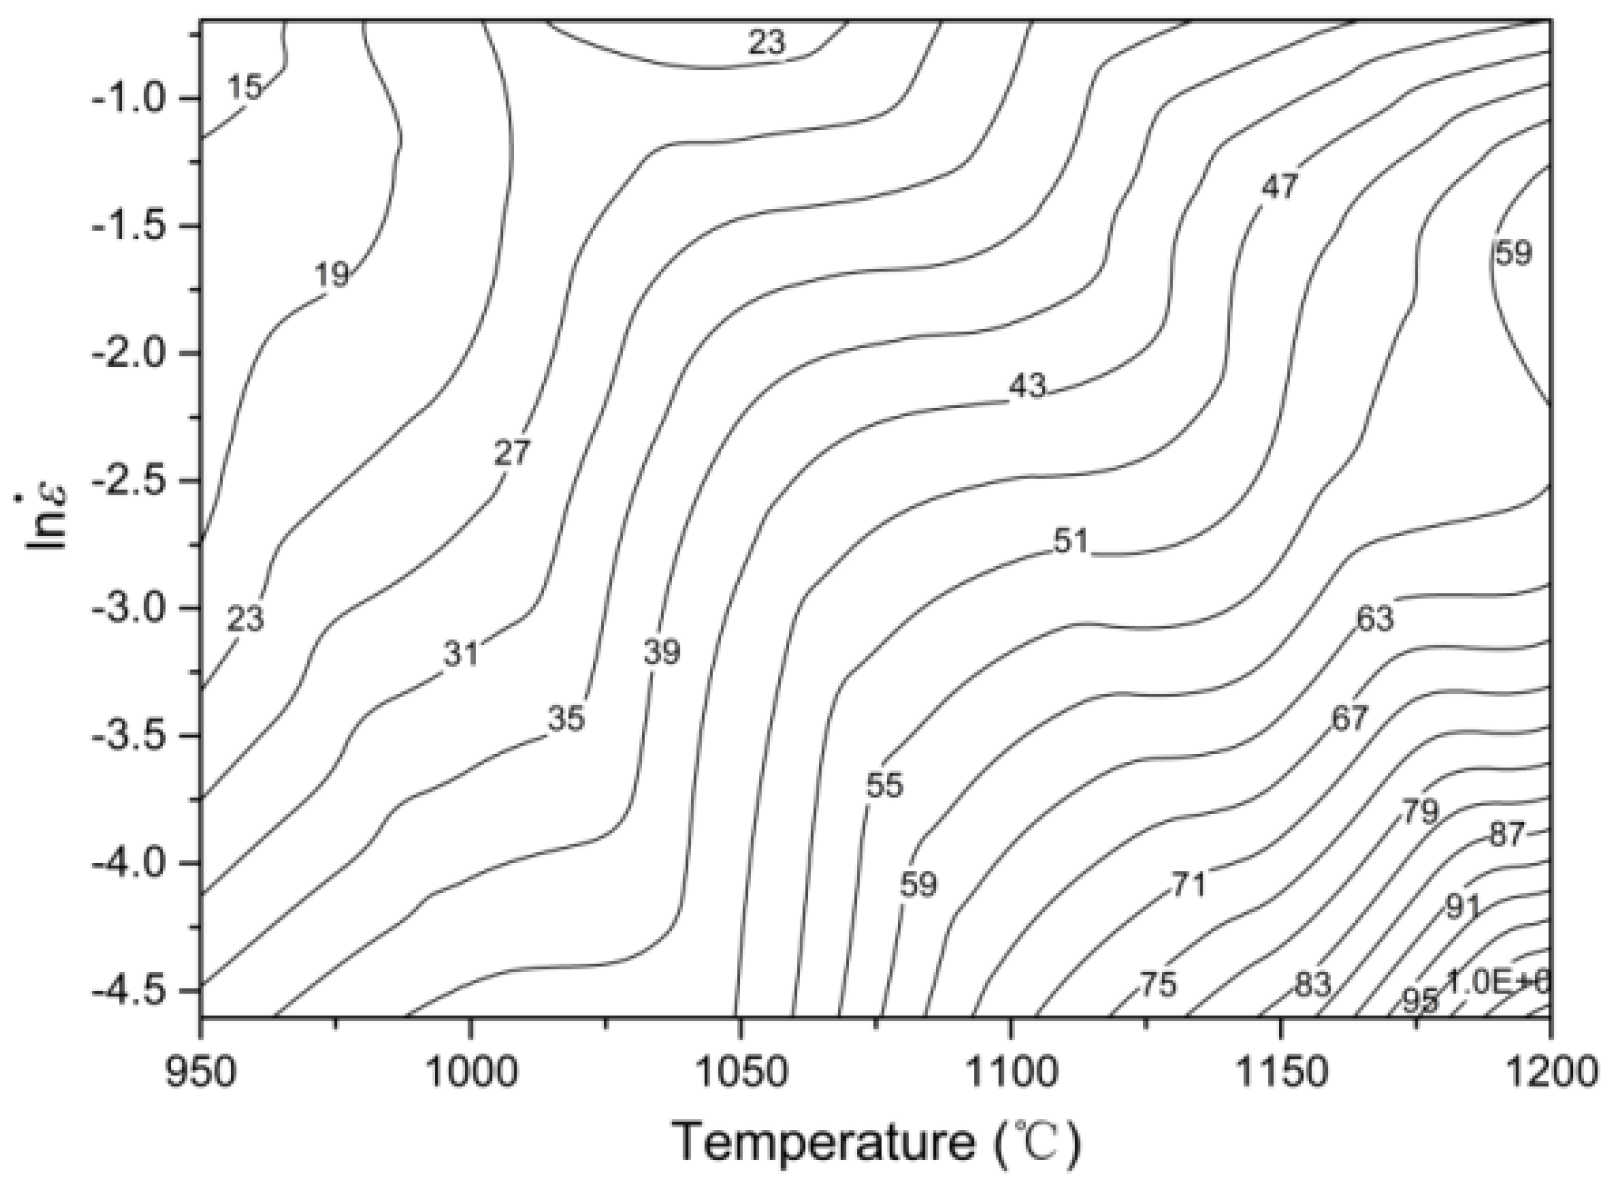
Domain D takes place at the temperature range of 950–1200 °C and the strain rate range of 0.03–0.5 s−1. As the strain increases, the values of η in this domain increase and the peak value of η is 0.41. The microstructures of specimens deformed at strain rates of 0.1 and 0.25 s−1 are shown in Figure 10. It is found that all of these microstructures exhibit the typical recrystallized grain microstructure with a more refined grain size than that in the initial sample. The effect of the temperature on the grain size is shown in Figure 10a–c, and the influence of the strain rate is shown in Figure 10b,d. It is clear that as the temperature increases, the recrystallized grain size increases. This is attributed to the fact that higher temperature can provide more energy for the grain growth. When the strain rate is increased, the recrystallized grain size decreases. This is associated with the increasing rate of nucleation of recrystallization and decreasing time for the recrystallized grain growth, which both result from the increasing strain rate. In this domain, the variation of the recrystallized grain size with strain rate and temperature is shown in Figure 11. Based on the variation of η and the microstructure examination in this domain, it can be confirmed that the optimized process parameter for hot deformation of 30Cr2Ni4MoV steel is 1100 °C and 0.25 s−1, for which the recrystallized grain size is 35 μm.
4. Conclusions
The hot deformation behavior of as-cast 30Cr2Ni4MoV steel has been studied in the temperature range 850 to 1200 °C and strain rate range 0.01 to 10 s−1 with a view toward optimizing the workability and controlling the microstructure. Processing maps under different strains have been developed for this purpose. The following conclusions are drawn:
- (1)
- The strain rate sensitivity varies irregularly with deformation temperature and strain rate, and negative values of strain rate sensitivity can be observed.
- (2)
- When the DRX and DRV take place, the value of the efficiency of power dissipation increases with the increasing strain. By contrast, the value of the efficiency of power dissipation decreases with the increasing strain when the flow localization occurs.
- (3)
- The optimum domain for hot deformation is in the temperature range of 950–1200 °C and strain rate range of 0.03–0.5 s−1 with a peak efficiency of 0.41 at 1100 °C and 0.25 s−1.
Acknowledgments
The authors gratefully acknowledge financial support from National Basic Research Program of China (2011CB012903).
Author Contributions
Peng Zhou conceived, designed and performed the experiments. Peng Zhou analyzed the data and wrote the paper. Qingxian Ma and Jianbin Luo contributed with advice on method of analysis.
Conflicts of Interest
The authors declare no conflict of interest.
References
- Prasad, Y.V.R.K.; Gegel, H.L.; Doraivelu, S.M.; Malas, J.C.; Morgan, J.T.; Lark, K.A.; Barker, D.R. Modeling of dynamic materials behavior in hot deformation: Forging of Ti-6242. Metall. Trans. A 1984, 15, 1883–1892. [Google Scholar] [CrossRef]
- Prasad, Y.V.R.K. Processing maps: A status report. J. Mater. Eng. Perform. 2003, 12, 638–645. [Google Scholar] [CrossRef]
- Sun, Y.; Hu, L.X.; Ren, J.S. Investigation on the hot deformation behavior of powder metallurgy TiAl-based alloy using 3D processing map. Mater. Charact. 2015, 100, 163–169. [Google Scholar] [CrossRef]
- Roostaei, M.; Parsa, M.H.; Mahmudi, R.; Mirzadeh, H. Hot compression behavior of GZ31 magnesium alloy. J. Alloy. Compd. 2015, 631, 1–6. [Google Scholar] [CrossRef]
- Wu, H.Y.; Yang, J.C.; Zhu, F.J.; Wu, C.T. Hot compressive flow stress modeling of homogenized AZ61 Mg alloy using strain-dependent constitutive equations. Mater. Sci. Eng. A 2013, 574, 17–24. [Google Scholar] [CrossRef]
- Chen, L.; Zhao, G.; Yu, J. Hot deformation behavior and constitutive modeling of homogenized 6026 aluminum alloy. Mater. Des. 2015, 74, 25–35. [Google Scholar] [CrossRef]
- Wu, K.; Liu, G.; Hu, B.; Li, F.; Zhang, Y.; Tao, Y. Characterization of hot deformation behavior of a new Ni–Cr–Co based P/M superalloy. Mater. Charact. 2010, 61, 330–340. [Google Scholar] [CrossRef]
- Akbari, Z.; Mirzadeh, H.; Cabrera, J.M. A simple constitutive model for predicting flow stress of medium carbon microalloyed steel during hot deformation. Mater. Des. 2015, 77, 126–131. [Google Scholar] [CrossRef] [Green Version]
- Badjena, S.K. Dynamic recrystallization behavior of vanadium micro-alloyed forging medium carbon steel. ISIJ Int. 2014, 54, 650–656. [Google Scholar] [CrossRef]
- Chen, F.; Cui, Z.S.; Sui, D.S.; Fu, B. Recrystallization of 30Cr2Ni4MoV ultra-super-critical rotor steel during hot deformation. Part Ш: Metadynamic recrystallization. Mater. Sci. Eng. A 2012, 540, 46–54. [Google Scholar] [CrossRef]
- Chen, F.; Cui, Z.S.; Chen, S.J. Recrystallization of 30Cr2Ni4MoV ultra-super-critical rotor steel during hot deformation. Part I: Dynamic recrystallization. Mater. Sci. Eng. A 2011, 528, 5073–5080. [Google Scholar] [CrossRef]
- Liu, X. Research on the Plastic Forming and Quality Control of Low-Pressure Rotor of Nuclear Steam Turbine. Ph.D. Thesis, Tsinghua University, Beijing, China, March 2010. [Google Scholar]
- Chen, R.K. Study on Heat Treatment for Low Pressure Rotors of 30Cr2Ni4MoV Steel. Ph.D. Thesis, Shanghai Jiao Tong University, Shanghai, China, March 2012. [Google Scholar]
- Kutumarao, V.V.; Rajagopalachary, T. Recent developments in modeling the hot working behavior of metallic materials. Bull. Mater. Sci. 1996, 19, 677–698. [Google Scholar] [CrossRef]
- Murty, S.V.S.N.; Nageswara Rao, B.; Kashyap, B.P. Instability criteria for hot deformation of materials. Int. Mater. Rev. 2000, 45, 15–26. [Google Scholar] [CrossRef]
- Prasad, Y.V.R.K.; Rao, K.P.; Sasidhara, S. Hot Working Guide: A Compendium of Processing Maps, 2nd ed.; ASM International: Materials Park, OH, USA, 1997; pp. 25–157. [Google Scholar]
- Jonas, J.J.; Quelennec, X.; Jiang, L.; Martin, E. The Avrami kinetics of dynamic recrystallization. Acta Mater. 2009, 57, 2748–2756. [Google Scholar] [CrossRef]
- Cai, Z.W.; Chen, F.X.; Ma, F.J.; Guo, J.Q. Dynamic recrystallization behavior and hot workability of AZ41M magnesium alloy during hot deformation. J. Alloy. Compd. 2016, 670, 55–63. [Google Scholar] [CrossRef]
- Lin, Y.C.; Liu, G. Effects of strain on the workability of a high strength low alloy steel in hot compression. Mater. Sci. Eng. A 2009, 523, 139–144. [Google Scholar] [CrossRef]
- Venugopal, S.; Mannan, S.L.; Prasad, Y.V.R.K. Optimization of hot workability in stainless steel-type AISI 304L using processing maps. Metall. Mater. Trans. A 1992, 23, 3093–3103. [Google Scholar] [CrossRef]
- Roberts, W.; Boden, H.; Ahlblom, B. Dynamic recrystallization kinetics. Metal Sci. 2013, 13, 195–205. [Google Scholar] [CrossRef]
Figure 1.
Typical fitted and smoothed experiment flow curves under different deformation conditions: (a) T = 1150 °C; (b)
Figure 1.
Typical fitted and smoothed experiment flow curves under different deformation conditions: (a) T = 1150 °C; (b)
Figure 2.
Polynomial fitted curves of lnσ versus at strains of (a) 0.2; (b) 0.4; (c) 0.6; and (d) 0.7.
Figure 2.
Polynomial fitted curves of lnσ versus at strains of (a) 0.2; (b) 0.4; (c) 0.6; and (d) 0.7.

Figure 3.
The 3D surfaces of m-value versus strain rate and temperature at true strains of (a) 0.2; (b) 0.4; (c) 0.6; and (d) 0.7.
Figure 3.
The 3D surfaces of m-value versus strain rate and temperature at true strains of (a) 0.2; (b) 0.4; (c) 0.6; and (d) 0.7.


Figure 4.
Effects of strain on the efficiency of power dissipation of the 30Cr2Ni4MoV steel at temperatures of (a) 1200 °C; (b) 1100 °C; (c) 1000 °C; and (d) 900 °C.
Figure 4.
Effects of strain on the efficiency of power dissipation of the 30Cr2Ni4MoV steel at temperatures of (a) 1200 °C; (b) 1100 °C; (c) 1000 °C; and (d) 900 °C.

Figure 5.
Processing maps of 30Cr2Ni4MoV steel at strains of (a) 0.2; (b) 0.4; (c) 0.6; and (d) 0.7.
Figure 5.
Processing maps of 30Cr2Ni4MoV steel at strains of (a) 0.2; (b) 0.4; (c) 0.6; and (d) 0.7.

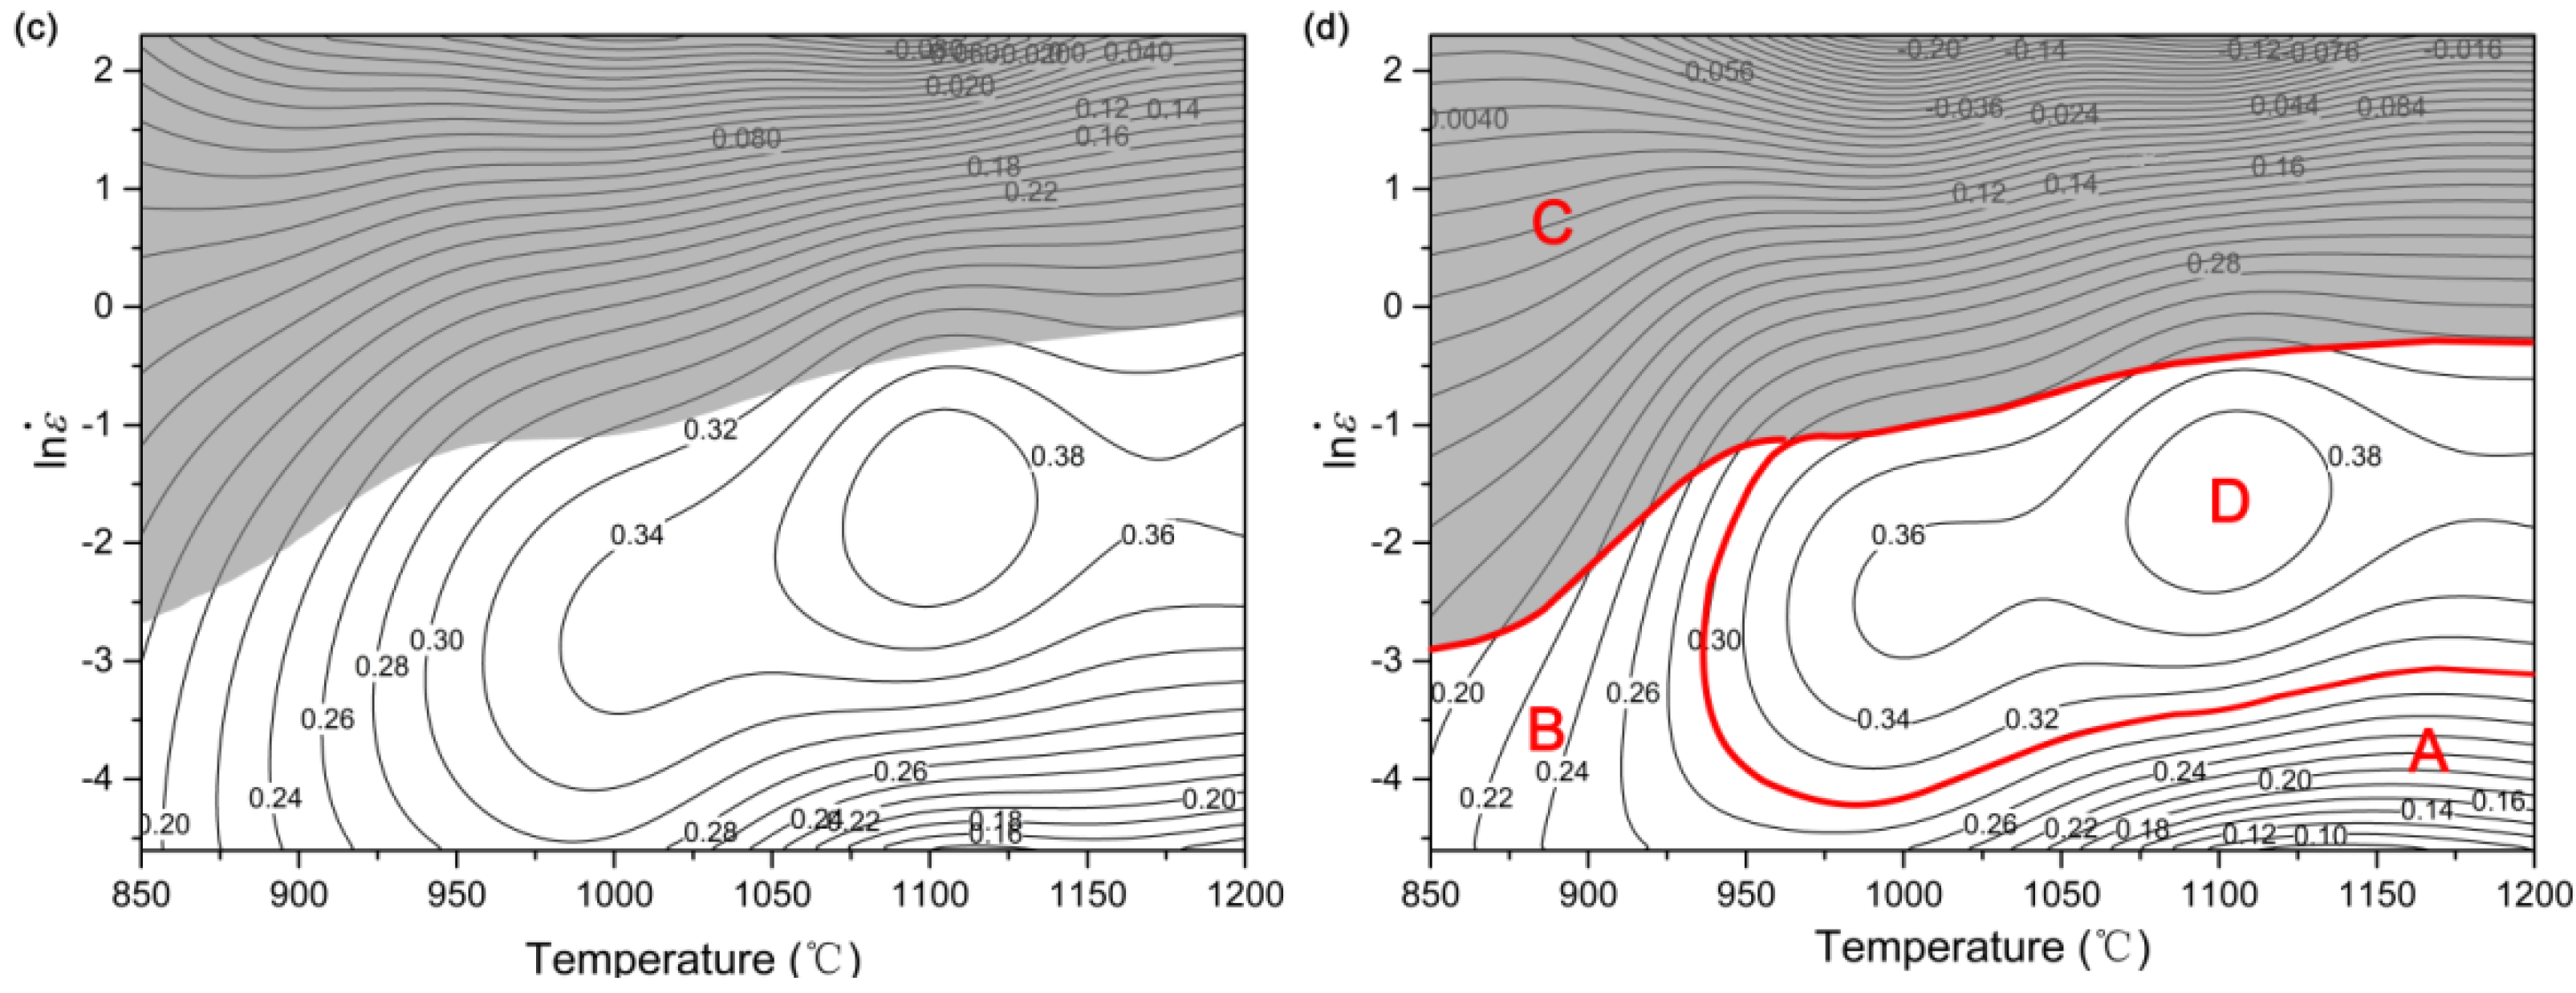
Figure 6.
The optical microstructure of the 30Cr2Ni4MoV steel deformed at 1200 °C and 0.01 s−1 to strains of (a) 0.3; (b) 0.5; and (c) 0.7.
Figure 6.
The optical microstructure of the 30Cr2Ni4MoV steel deformed at 1200 °C and 0.01 s−1 to strains of (a) 0.3; (b) 0.5; and (c) 0.7.
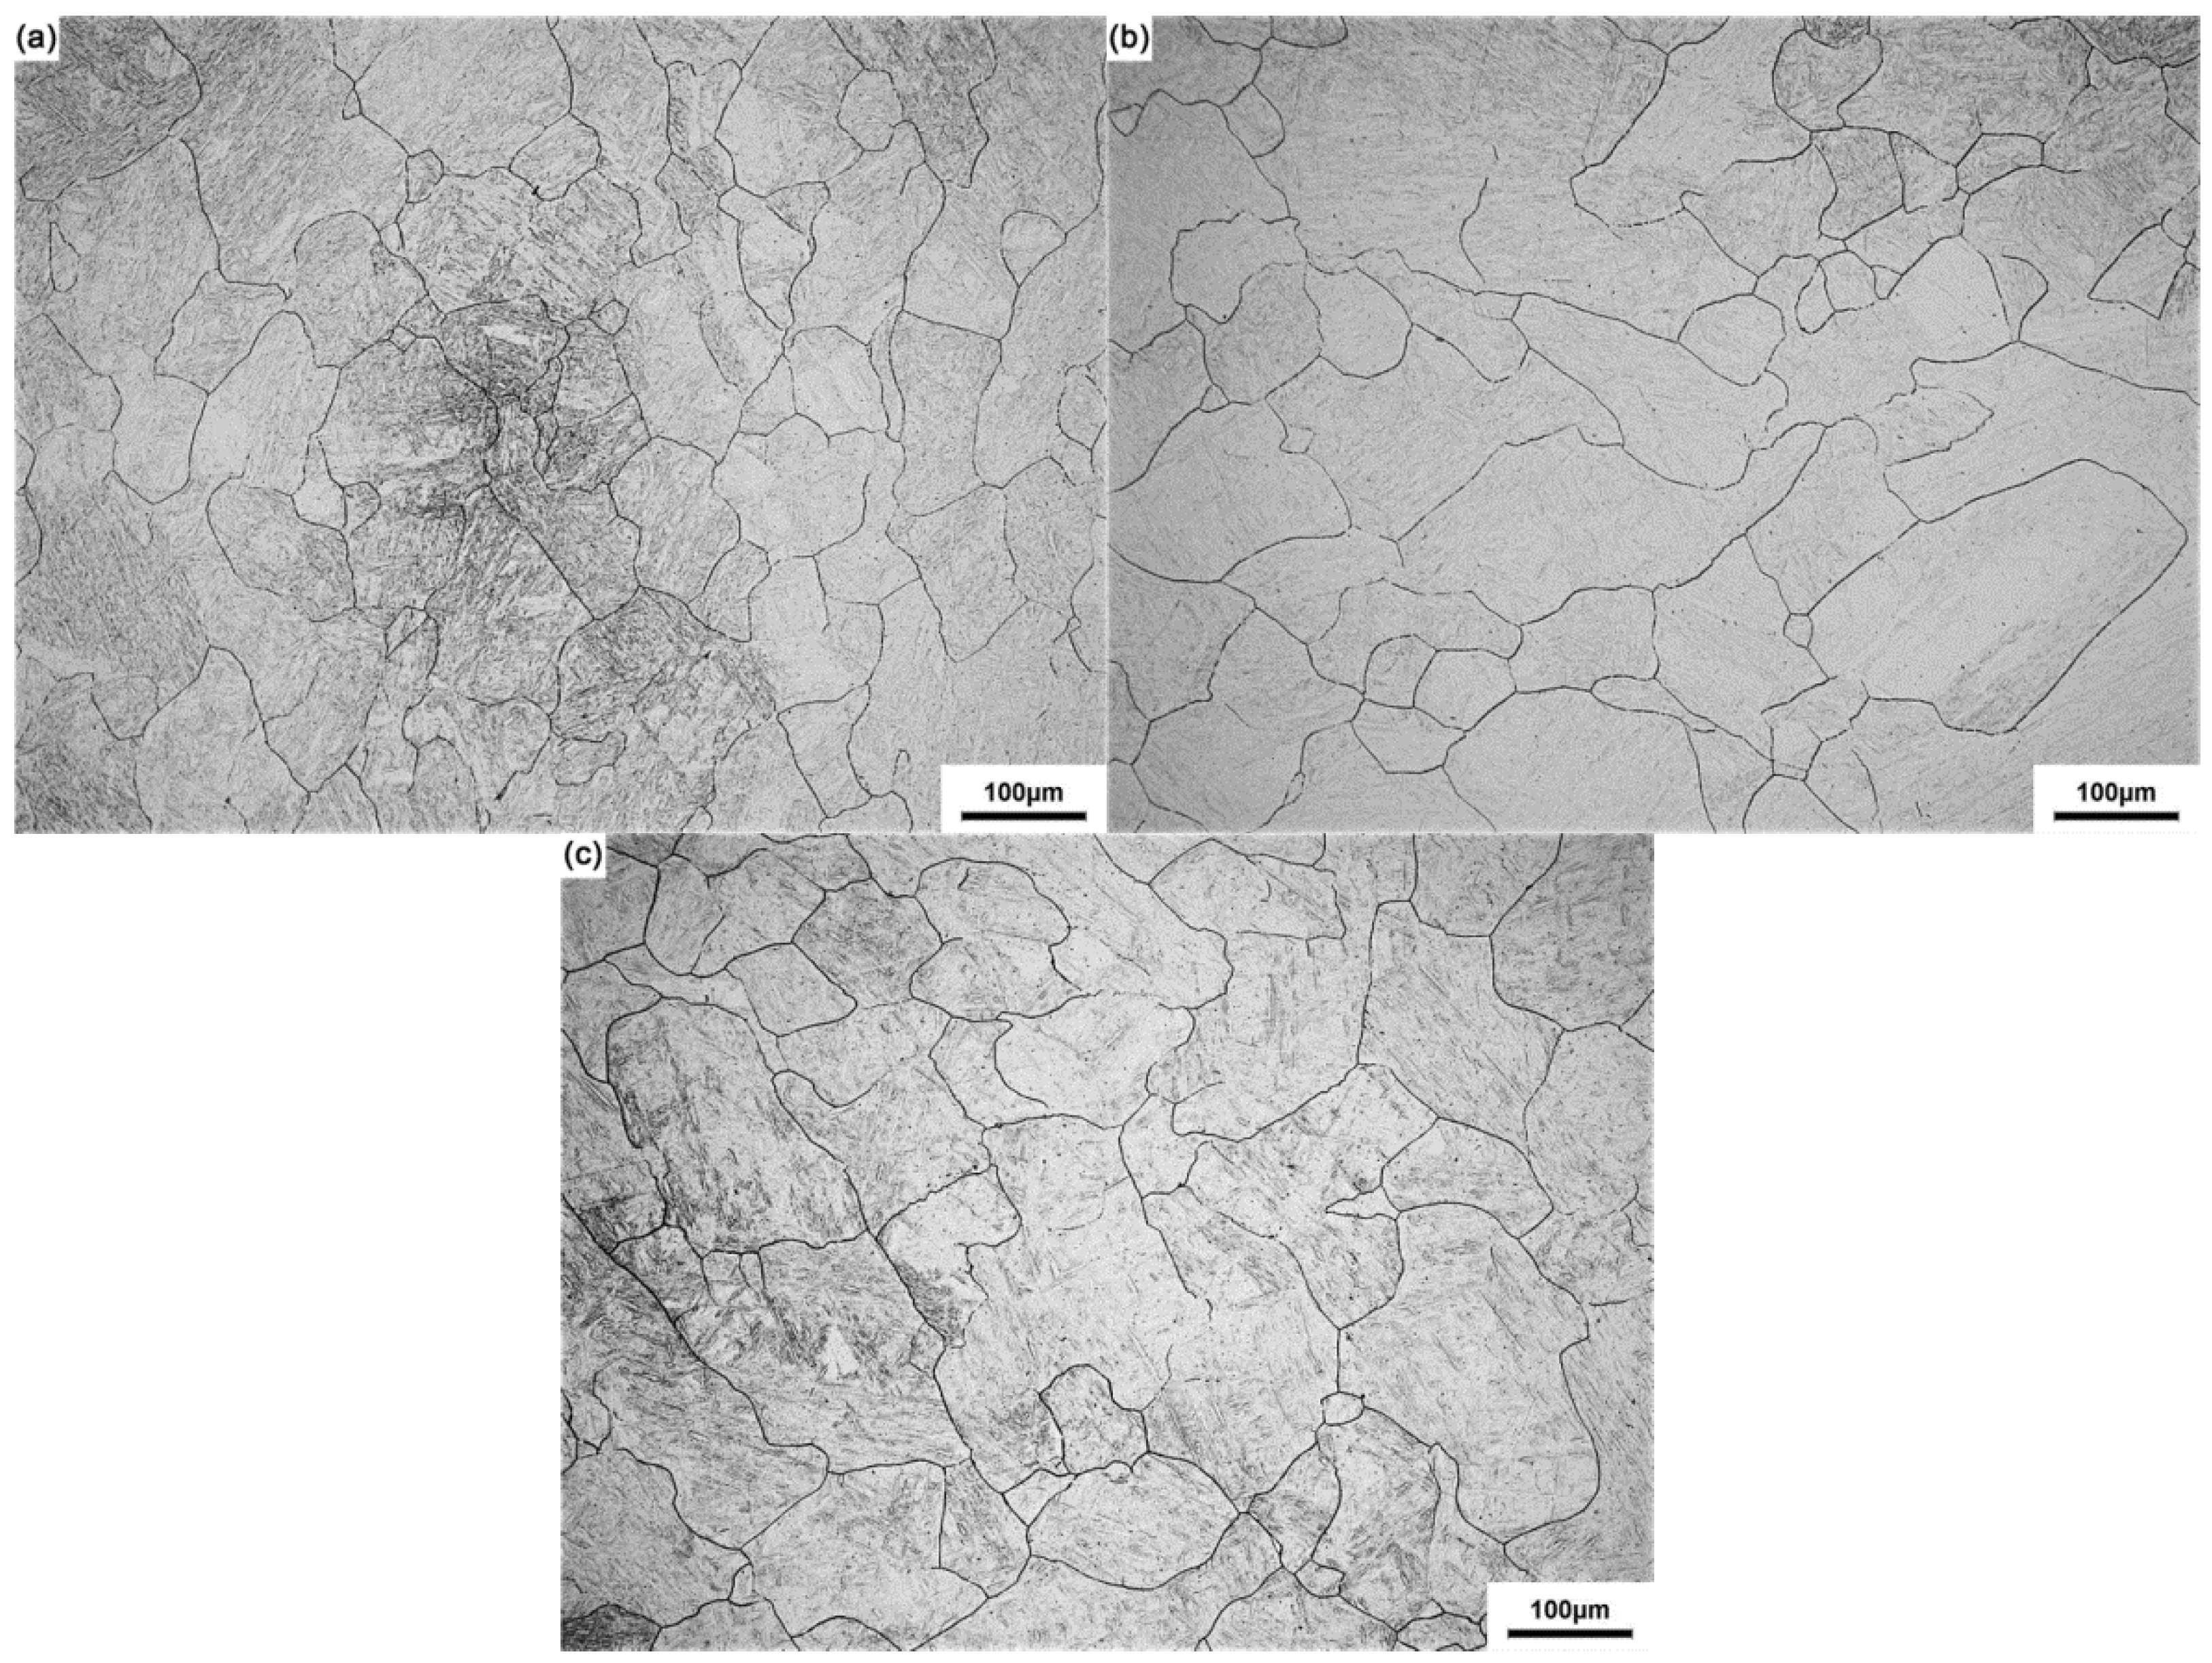
Figure 7.
The microstructure of the deformed 30Cr2Ni4MoV steel to a strain of 0.7 at different conditions: (a) 850 °C/0.01 s−1 and (b) 950 °C/0.01 s−1.
Figure 7.
The microstructure of the deformed 30Cr2Ni4MoV steel to a strain of 0.7 at different conditions: (a) 850 °C/0.01 s−1 and (b) 950 °C/0.01 s−1.
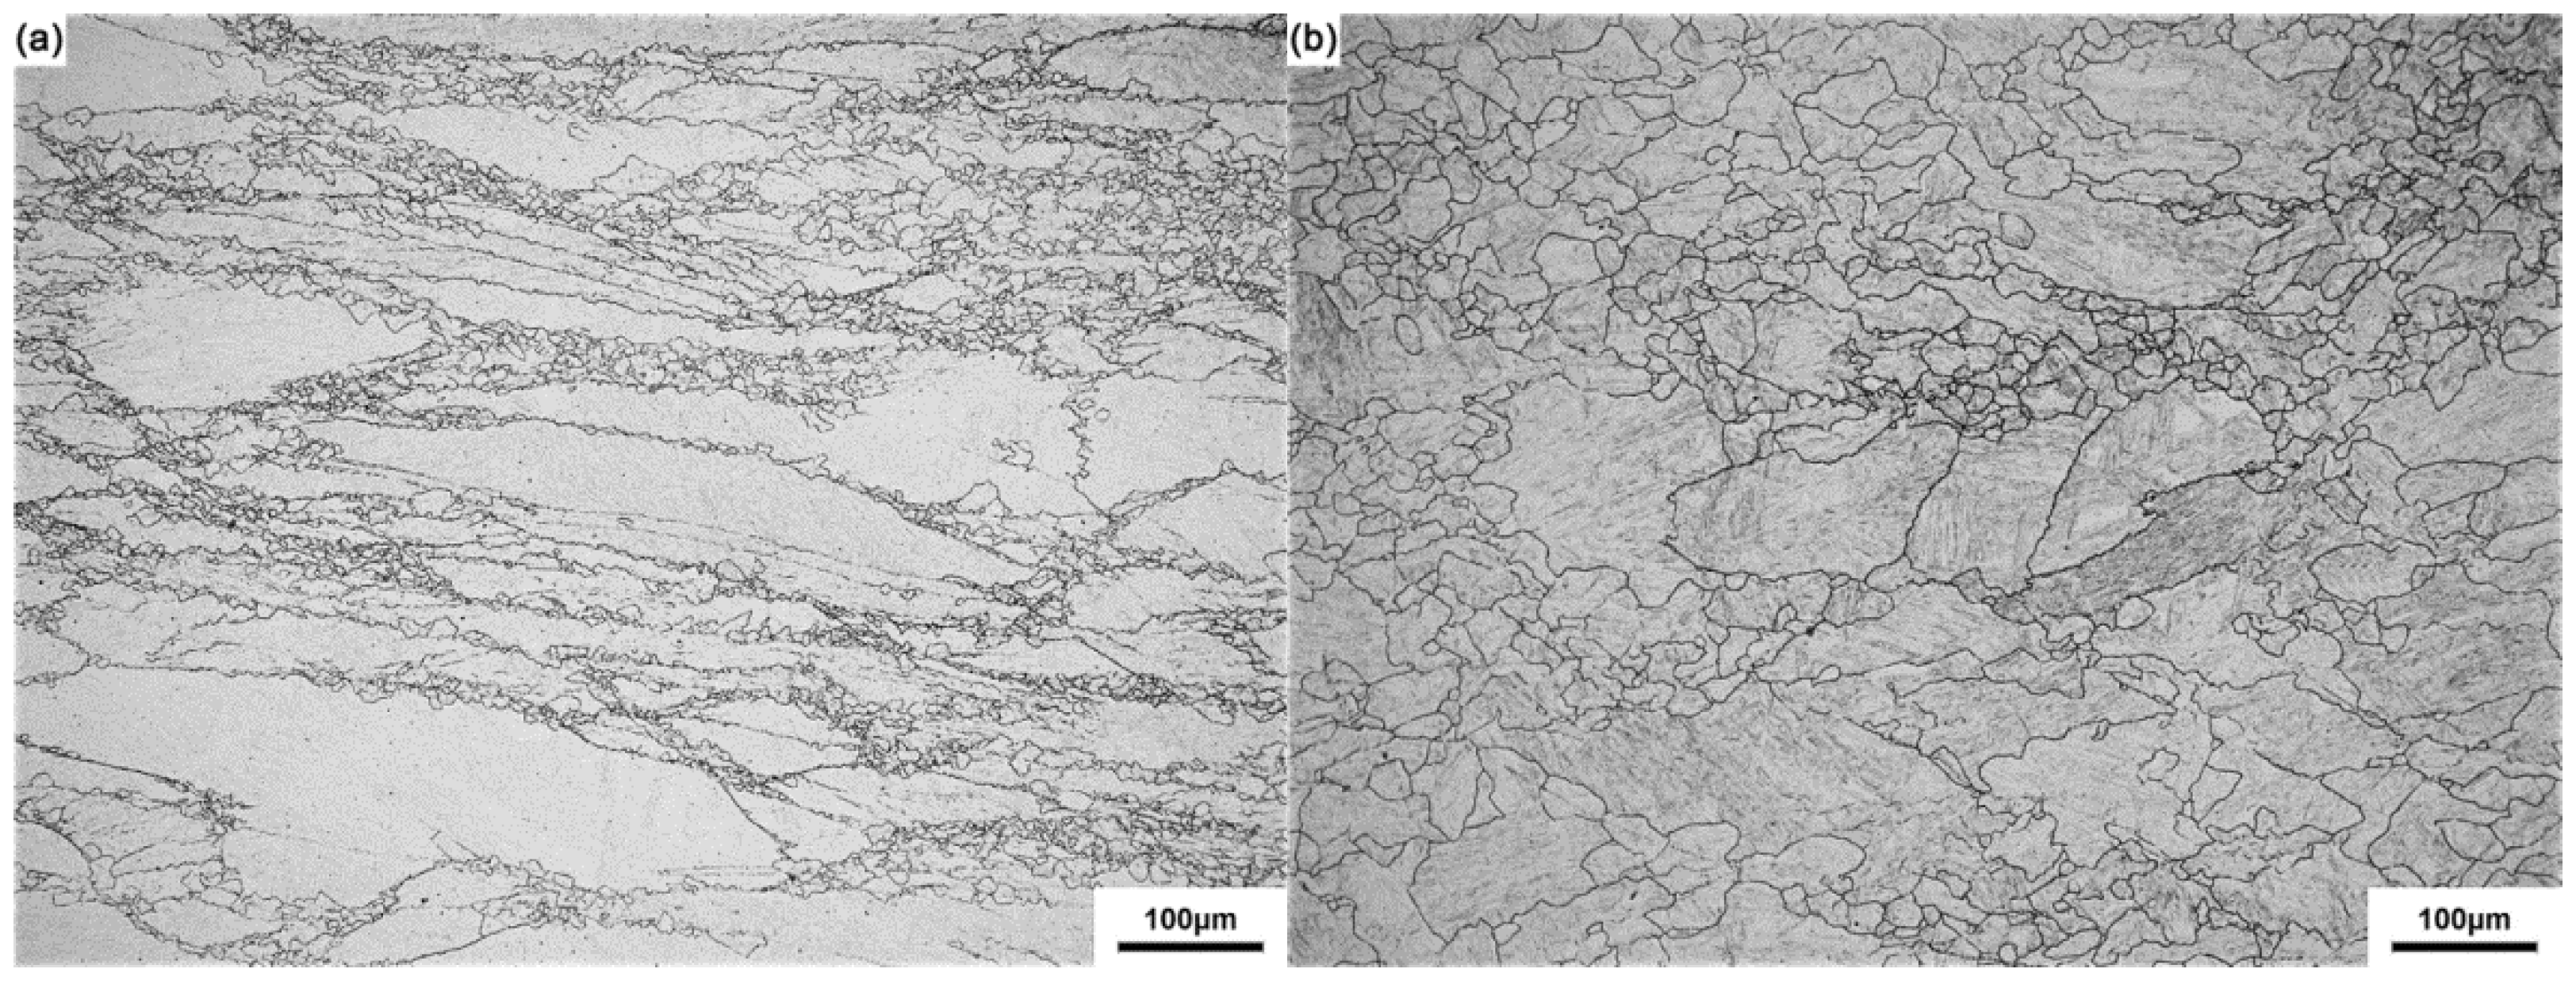
Figure 8.
The dependence of work hardening rate on the stress at 0.01 s−1 and at different temperatures (850 °C and 950 °C).
Figure 8.
The dependence of work hardening rate on the stress at 0.01 s−1 and at different temperatures (850 °C and 950 °C).

Figure 9.
The microstructure of the deformed 30Cr2Ni4MoV steel to a strain of 0.7 at 850 °C and at different strain rates: (a) 0. 1 s−1; (b) 1 s−1 and (c) 10 s−1.
Figure 9.
The microstructure of the deformed 30Cr2Ni4MoV steel to a strain of 0.7 at 850 °C and at different strain rates: (a) 0. 1 s−1; (b) 1 s−1 and (c) 10 s−1.
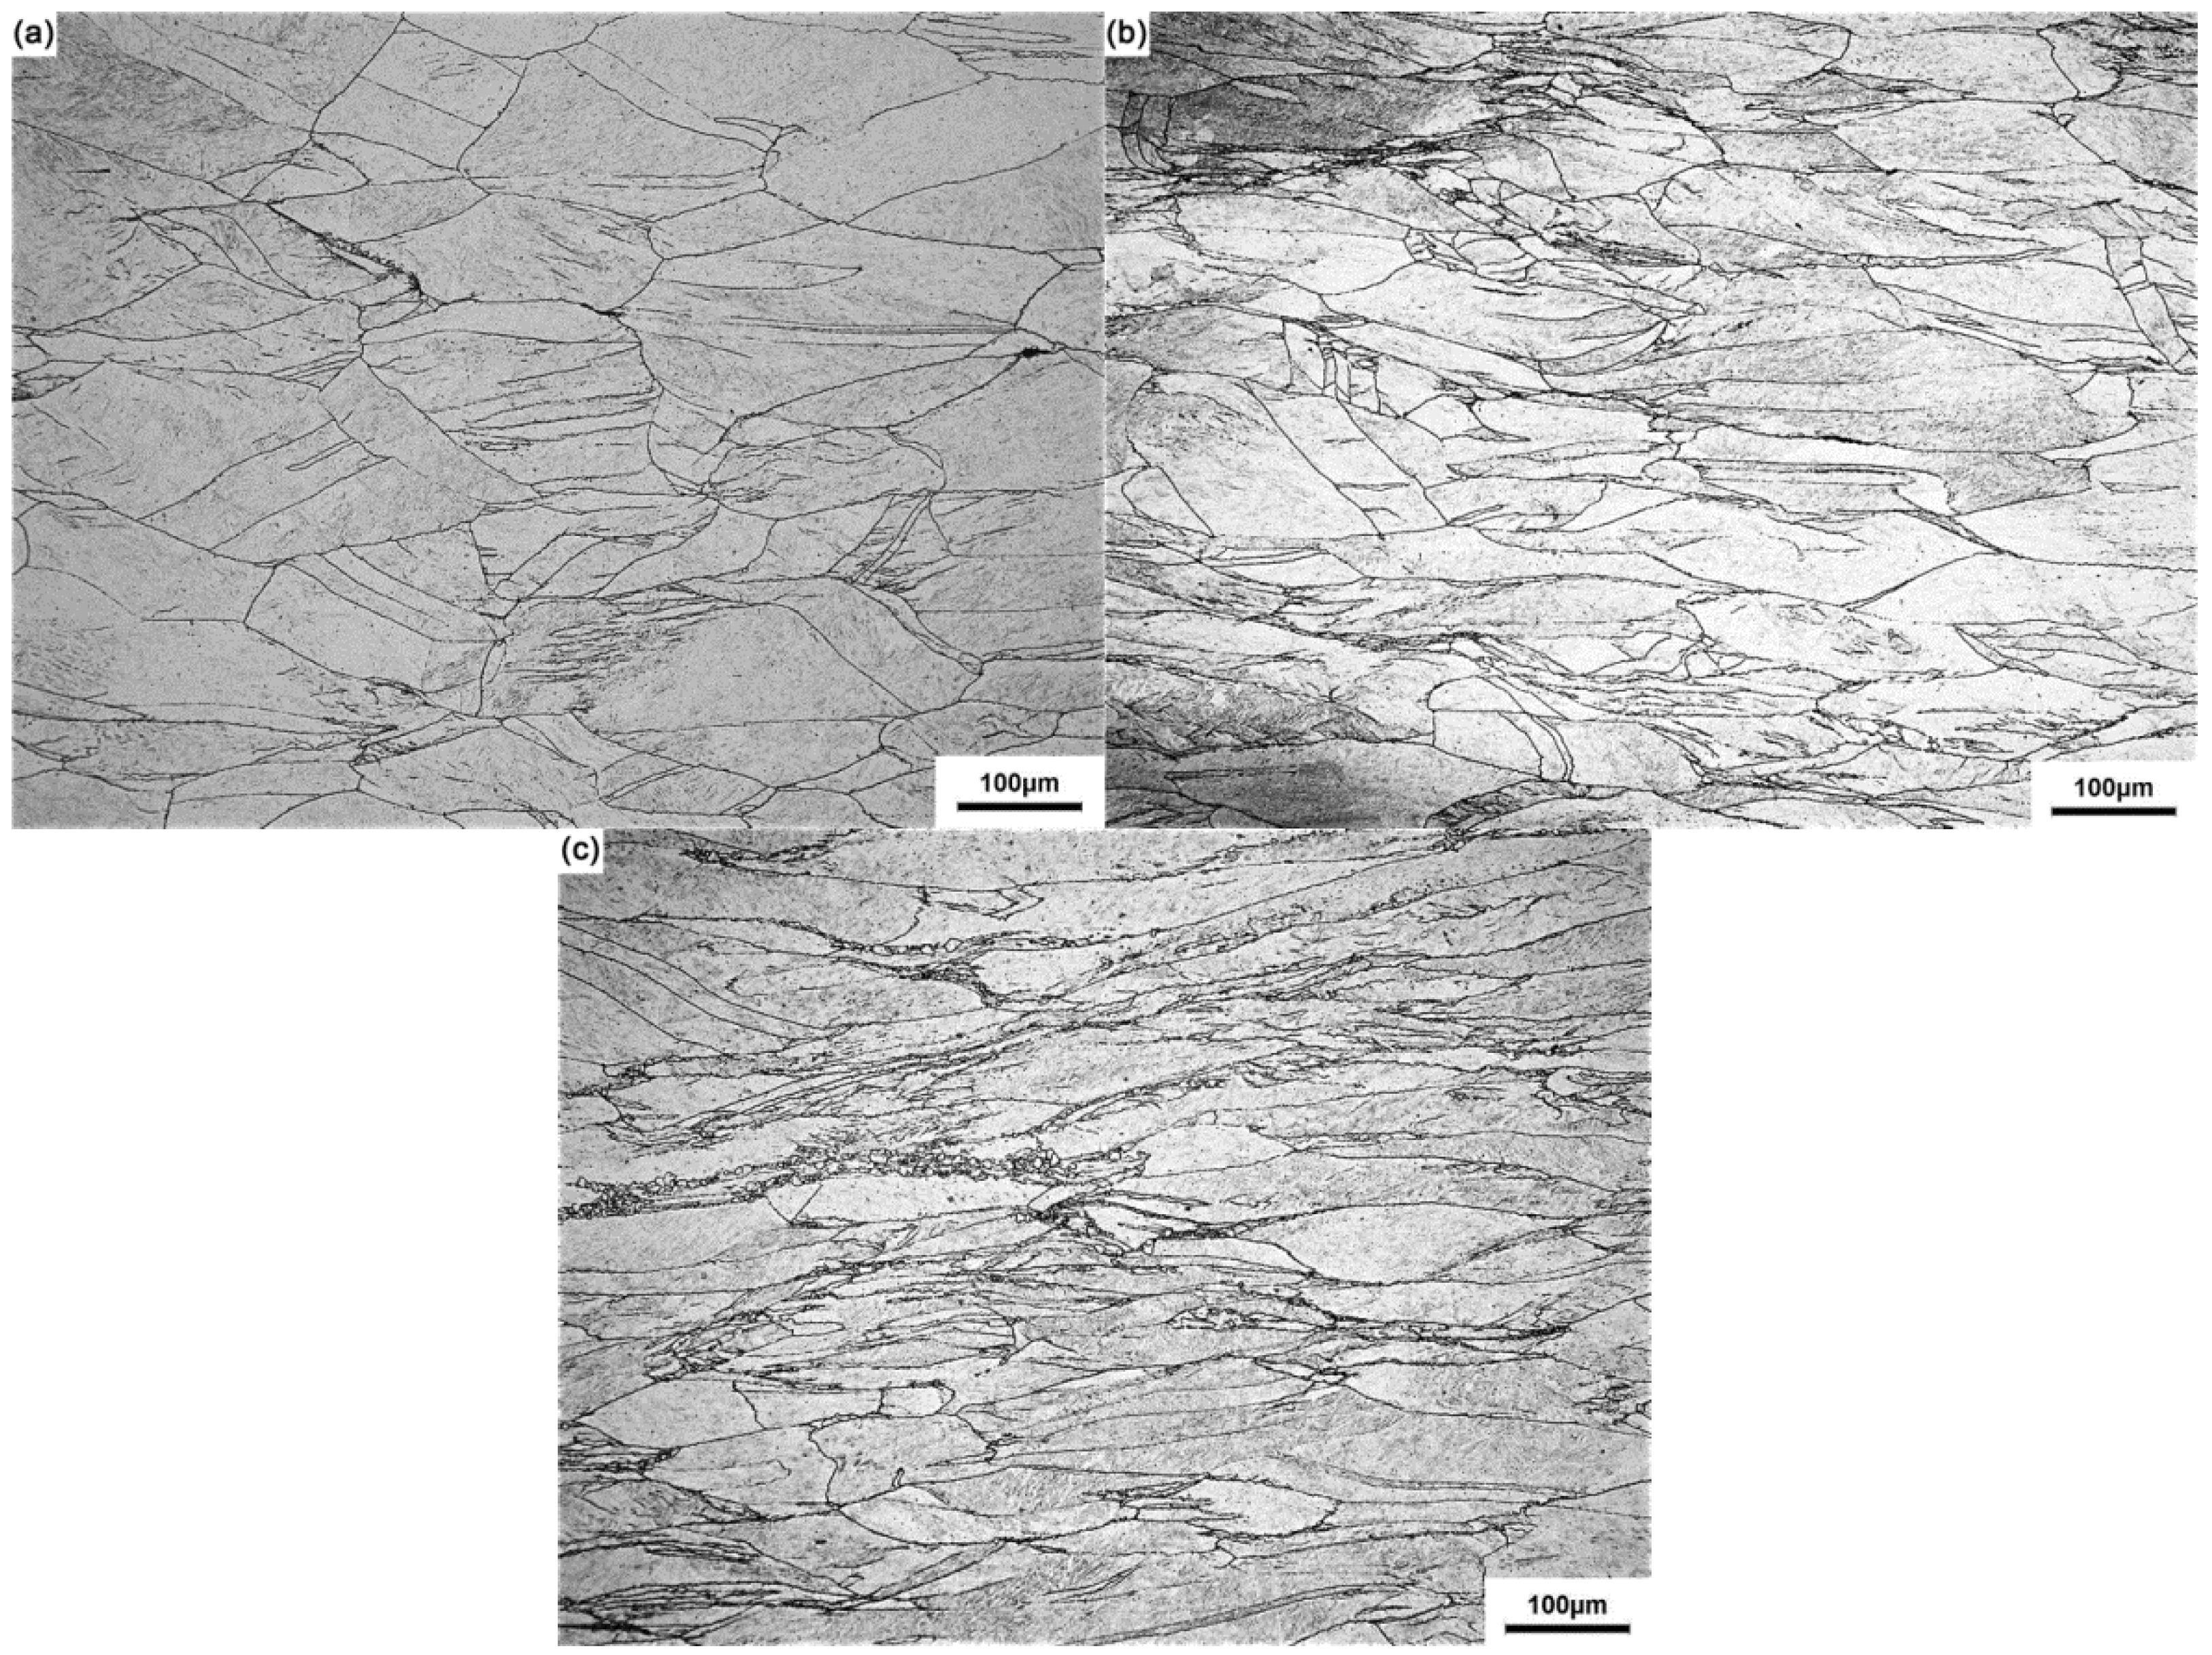
Figure 10.
The microstructure of the deformed 30Cr2Ni4MoV steel to a strain of 0.7 at: (a) 1000 °C/0.1 s−1; (b) 1100 °C/0.1 s−1; (c) 1200 °C/0.1 s−1; and (d) 1100 °C/0.25 s−1.
Figure 10.
The microstructure of the deformed 30Cr2Ni4MoV steel to a strain of 0.7 at: (a) 1000 °C/0.1 s−1; (b) 1100 °C/0.1 s−1; (c) 1200 °C/0.1 s−1; and (d) 1100 °C/0.25 s−1.

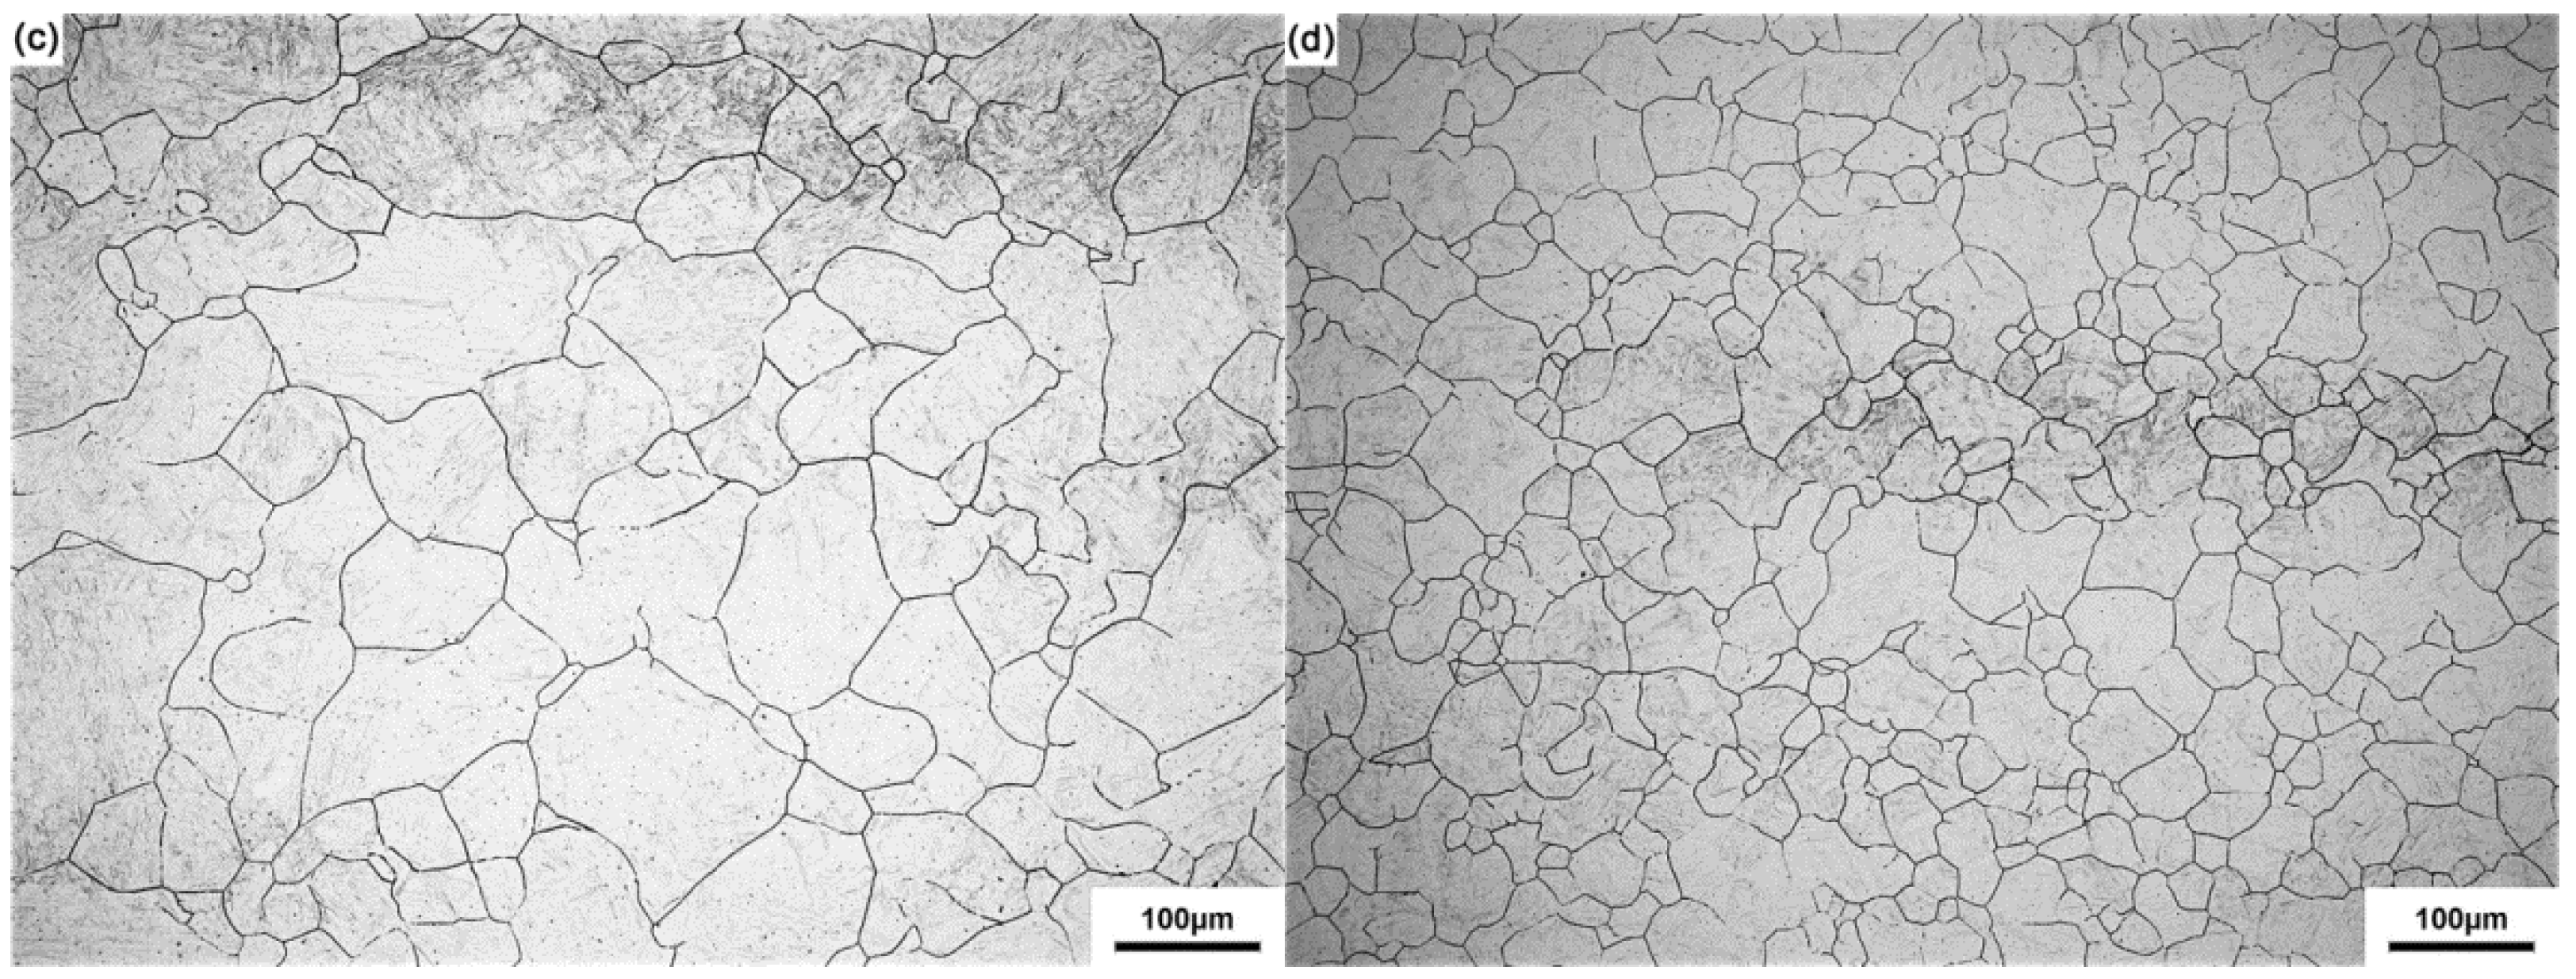
Figure 11.
Contour map representing isograin size contours (marked as μm) of the deformed samples of 30Cr2Ni4MoV steel.
Figure 11.
Contour map representing isograin size contours (marked as μm) of the deformed samples of 30Cr2Ni4MoV steel.

Table 1.
Flow stress values (in MPa) of 25CrMo4 at different strain rates and temperatures for various strains.
| Strain | Strain Rate (s−1) | Temperature (°C) | |||||||
|---|---|---|---|---|---|---|---|---|---|
| 850 | 900 | 950 | 1000 | 1050 | 1100 | 1150 | 1200 | ||
| 0.1 | 0.01 | 119.2 | 98.5 | 77.4 | 63.4 | 55.1 | 47.7 | 43.8 | 37.4 |
| 0.1 | 145.6 | 119.8 | 96.2 | 86.0 | 72.5 | 62.1 | 54.6 | 47.8 | |
| 0.25 | 149.4 | 129.7 | 108.2 | 95.1 | 78.1 | 68.9 | 62.9 | 54.5 | |
| 0.5 | 157.4 | 135.4 | 119.9 | 108.8 | 89.9 | 75.6 | 64.8 | 58.3 | |
| 1 | 166.9 | 141.9 | 127.9 | 113.0 | 93.2 | 81.3 | 68.7 | 58.0 | |
| 10 | 188.4 | 159.2 | 140.4 | 124.7 | 103.8 | 92.0 | 76.8 | 66.7 | |
| 0.2 | 0.01 | 137.4 | 114.9 | 86.8 | 73.6 | 61.5 | 51.3 | 42.2 | 34.6 |
| 0.1 | 169.4 | 142.8 | 117.7 | 100.2 | 84.6 | 71.7 | 62.1 | 51.8 | |
| 0.25 | 175.0 | 156.0 | 129.6 | 113.3 | 93.8 | 79.3 | 70.2 | 61.4 | |
| 0.5 | 186.4 | 162.5 | 139.4 | 122.9 | 103.8 | 85.3 | 75.3 | 67.3 | |
| 1 | 199.4 | 168.5 | 151.1 | 131.1 | 109.8 | 94.8 | 79.5 | 66.9 | |
| 10 | 221.5 | 187.4 | 164.4 | 148.1 | 124.9 | 110.3 | 93.0 | 80.4 | |
| 0.3 | 0.01 | 146.3 | 121.5 | 94.6 | 76.2 | 59.4 | 47.2 | 38.8 | 32.3 |
| 0.1 | 181.9 | 153.9 | 125.3 | 104.5 | 87.6 | 71.5 | 60.1 | 46.7 | |
| 0.25 | 188.4 | 170.9 | 139.3 | 122.2 | 97.5 | 83.0 | 73.6 | 59.1 | |
| 0.5 | 201.7 | 178.8 | 149.4 | 134.5 | 111.2 | 91.6 | 78.6 | 68.3 | |
| 1 | 213.6 | 181.3 | 161.3 | 140.6 | 118.0 | 102.4 | 85.1 | 70.4 | |
| 10 | 236.3 | 202.3 | 178.0 | 160.8 | 136.6 | 120.9 | 101.5 | 88.1 | |
| 0.4 | 0.01 | 148.9 | 117.4 | 87.0 | 71.6 | 55.5 | 44.7 | 37.2 | 30.8 |
| 0.1 | 187.9 | 154.4 | 126.3 | 105.7 | 86.4 | 67.2 | 54.9 | 43.1 | |
| 0.25 | 194.3 | 176.6 | 142.4 | 125.7 | 98.7 | 80.8 | 69.5 | 54.1 | |
| 0.5 | 209.1 | 188.7 | 155.2 | 140.0 | 113.9 | 93.4 | 76.3 | 64.4 | |
| 1 | 221.2 | 188.1 | 167.4 | 146.1 | 122.0 | 105.5 | 85.7 | 68.8 | |
| 10 | 238.9 | 207.0 | 181.6 | 164.8 | 139.7 | 123.6 | 103.4 | 89.1 | |
| 0.5 | 0.01 | 151.8 | 121.8 | 87.5 | 67.1 | 53.7 | 42.1 | 34.9 | 29.2 |
| 0.1 | 194.0 | 160.0 | 123.6 | 104.2 | 84.4 | 65.2 | 51.6 | 41.0 | |
| 0.25 | 197.1 | 178.2 | 142.3 | 127.0 | 96.3 | 77.5 | 65.5 | 51.5 | |
| 0.5 | 217.0 | 190.8 | 159.1 | 143.6 | 114.2 | 92.5 | 72.0 | 60.7 | |
| 1 | 227.9 | 194.0 | 172.7 | 149.1 | 124.5 | 106.6 | 84.0 | 66.4 | |
| 10 | 239.8 | 209.1 | 183.0 | 164.4 | 139.5 | 123.2 | 102.0 | 87.0 | |
| 0.6 | 0.01 | 155.2 | 116.1 | 82.4 | 65.5 | 52.3 | 41.8 | 34.5 | 28.8 |
| 0.1 | 201.7 | 158.0 | 125.5 | 102.7 | 81.9 | 63.4 | 49.3 | 40.0 | |
| 0.25 | 202.9 | 180.8 | 144.1 | 125.5 | 94.7 | 77.6 | 64.1 | 51.1 | |
| 0.5 | 226.1 | 199.2 | 161.6 | 142.3 | 114.2 | 92.1 | 68.8 | 59.2 | |
| 1 | 235.3 | 199.7 | 176.5 | 153.6 | 127.4 | 108.4 | 83.0 | 65.4 | |
| 10 | 244.0 | 213.5 | 187.9 | 167.8 | 142.1 | 125.3 | 101.4 | 85.8 | |
| 0.7 | 0.01 | 159.7 | 120.8 | 82.1 | 65.5 | 52.3 | 42.6 | 35.3 | 29.1 |
| 0.1 | 210.8 | 165.4 | 125.3 | 101.8 | 81.3 | 63.2 | 48.3 | 40.0 | |
| 0.25 | 214.6 | 187.2 | 148.2 | 129.3 | 94.4 | 77.6 | 64.4 | 51.7 | |
| 0.5 | 237.3 | 199.9 | 167.0 | 153.0 | 114.2 | 92.2 | 67.0 | 59.2 | |
| 1 | 246.5 | 207.8 | 181.0 | 156.0 | 129.0 | 108.5 | 83.0 | 65.4 | |
| 10 | 248.5 | 217.5 | 190.2 | 167.3 | 140.5 | 122.4 | 97.4 | 80.9 | |
© 2017 by the authors. Licensee MDPI, Basel, Switzerland. This article is an open access article distributed under the terms and conditions of the Creative Commons Attribution (CC BY) license ( http://creativecommons.org/licenses/by/4.0/).
Share and Cite
MDPI and ACS Style
Zhou, P.; Ma, Q.; Luo, J. Hot Deformation Behavior of As-Cast 30Cr2Ni4MoV Steel Using Processing Maps. Metals 2017, 7, 50. https://doi.org/10.3390/met7020050
AMA Style
Zhou P, Ma Q, Luo J. Hot Deformation Behavior of As-Cast 30Cr2Ni4MoV Steel Using Processing Maps. Metals. 2017; 7(2):50. https://doi.org/10.3390/met7020050
Chicago/Turabian StyleZhou, Peng, Qingxian Ma, and Jianbin Luo. 2017. "Hot Deformation Behavior of As-Cast 30Cr2Ni4MoV Steel Using Processing Maps" Metals 7, no. 2: 50. https://doi.org/10.3390/met7020050
Note that from the first issue of 2016, this journal uses article numbers instead of page numbers. See further details here.