Article

Evaluating Strengthening and Impact Toughness Mechanisms for Ferritic and Bainitic Microstructures in Nb, Nb-Mo and Ti-Mo Microalloyed Steels

CEIT and TECNUN, University of Navarra, 20018 San Sebastian, Basque Country, Spain
*
Author to whom correspondence should be addressed.
Metals 2017, 7(2), 65; https://doi.org/10.3390/met7020065
Submission received: 10 February 2017 / Revised: 17 February 2017 / Accepted: 17 February 2017 / Published: 22 February 2017
(This article belongs to the Special Issue Bainite and Martensite: Developments and Challenges)

Abstract

:
Low carbon microalloyed steels show interesting commercial possibilities by combining different “micro”-alloying elements when high strength and low temperature toughness properties are required. Depending on the elements chosen for the chemistry design, the mechanisms controlling the strengths and toughness may differ. In this paper, a detailed characterization of the microstructural features of three different microalloyed steels, Nb, Nb-Mo and Ti-Mo, is described using mainly the electron backscattered diffraction technique (EBSD) as well as transmission electron microscopy (TEM). The contribution of different strengthening mechanisms to yield strength and impact toughness is evaluated, and its relative weight is computed for different coiling temperatures. Grain refinement is shown to be the most effective mechanism for controlling both mechanical properties. As yield strength increases, the relative contribution of precipitation strengthening increases, and this factor is especially important in the Ti-Mo microalloyed steel where different combinations of interphase and random precipitation are detected depending on the coiling temperature. In addition to average grain size values, microstructural heterogeneity is considered in order to propose a new equation for predicting ductile–brittle transition temperature (DBTT). This equation considers the wide range of microstructures analyzed as well as the increase in the transition temperature related to precipitation strengthening.

1. Introduction

High Strength Low Alloy (HSLA) steels are widely used in the fabrication of beams, storage tanks, oil and gas pipelines, etc. In these applications, a balance between strength, toughness, weldability and cost is needed [1]. The careful design of the chemical composition of the steel in conjunction with an appropriate thermomechanical schedule can produce a wide variety of microstructures, from classical ferrite-pearlite combinations to more advanced non-polygonal/bainitic phases with an optimum balance of mechanical properties.
In this context, HSLA steels show a lower carbon content, which improves weldability and formability, but the lower mechanical properties that result from lower C contents can be counterbalanced by the addition of alloying elements such as Nb, Mo and Ti and an appropriate thermomechanical process. Each one of these elements affects different mechanisms. On one hand, many studies agree that Nb is able to induce strain accumulation in the austenite prior to transformation, providing significant microstructural refinement [2]. Mo, in addition to having a solute drag effect on the static recrystallization kinetics, enhances the formation of complex non-polygonal transformation products [3,4]. These strategies pursue finer final microstructures, which would result in better combinations of strength and toughness. On the other hand, steels microalloyed with Ti and Mo have an interesting combination of high strength and good formability because of the wide dispersion of nanometric sized titanium carbides within a fine matrix [5].
This study analyzes the relationship between microstructure and mechanical properties in three different microalloyed steels. Relevant microstructural features such as grain size refinement and fine precipitation can be controlled by the coiling temperature after hot rolling. Therefore, the potential of different strengthening mechanisms needs to be further explored in order to find the relationship between microstructure, process parameters (coiling temperature) and mechanical properties such as tensile and toughness properties. For that purpose, tensile and Charpy tests were performed for all the conditions. The contribution of the different strengthening mechanisms, such as grain size refinement, secondary phases, precipitation hardening, solid solution and dislocation strengthening have been calculated. A model that is able to predict the yield strength and impact transition temperature depending on the applied thermomechanical schedule and the chemical composition is described. The model is valid for the whole range of microstructures (ferritic and bainitic) and chemical compositions. The equation proposed for predicting the ductile–brittle transition temperatures (DBTT) also takes into account the influence of microstructural heterogeneity and secondary hard phases.

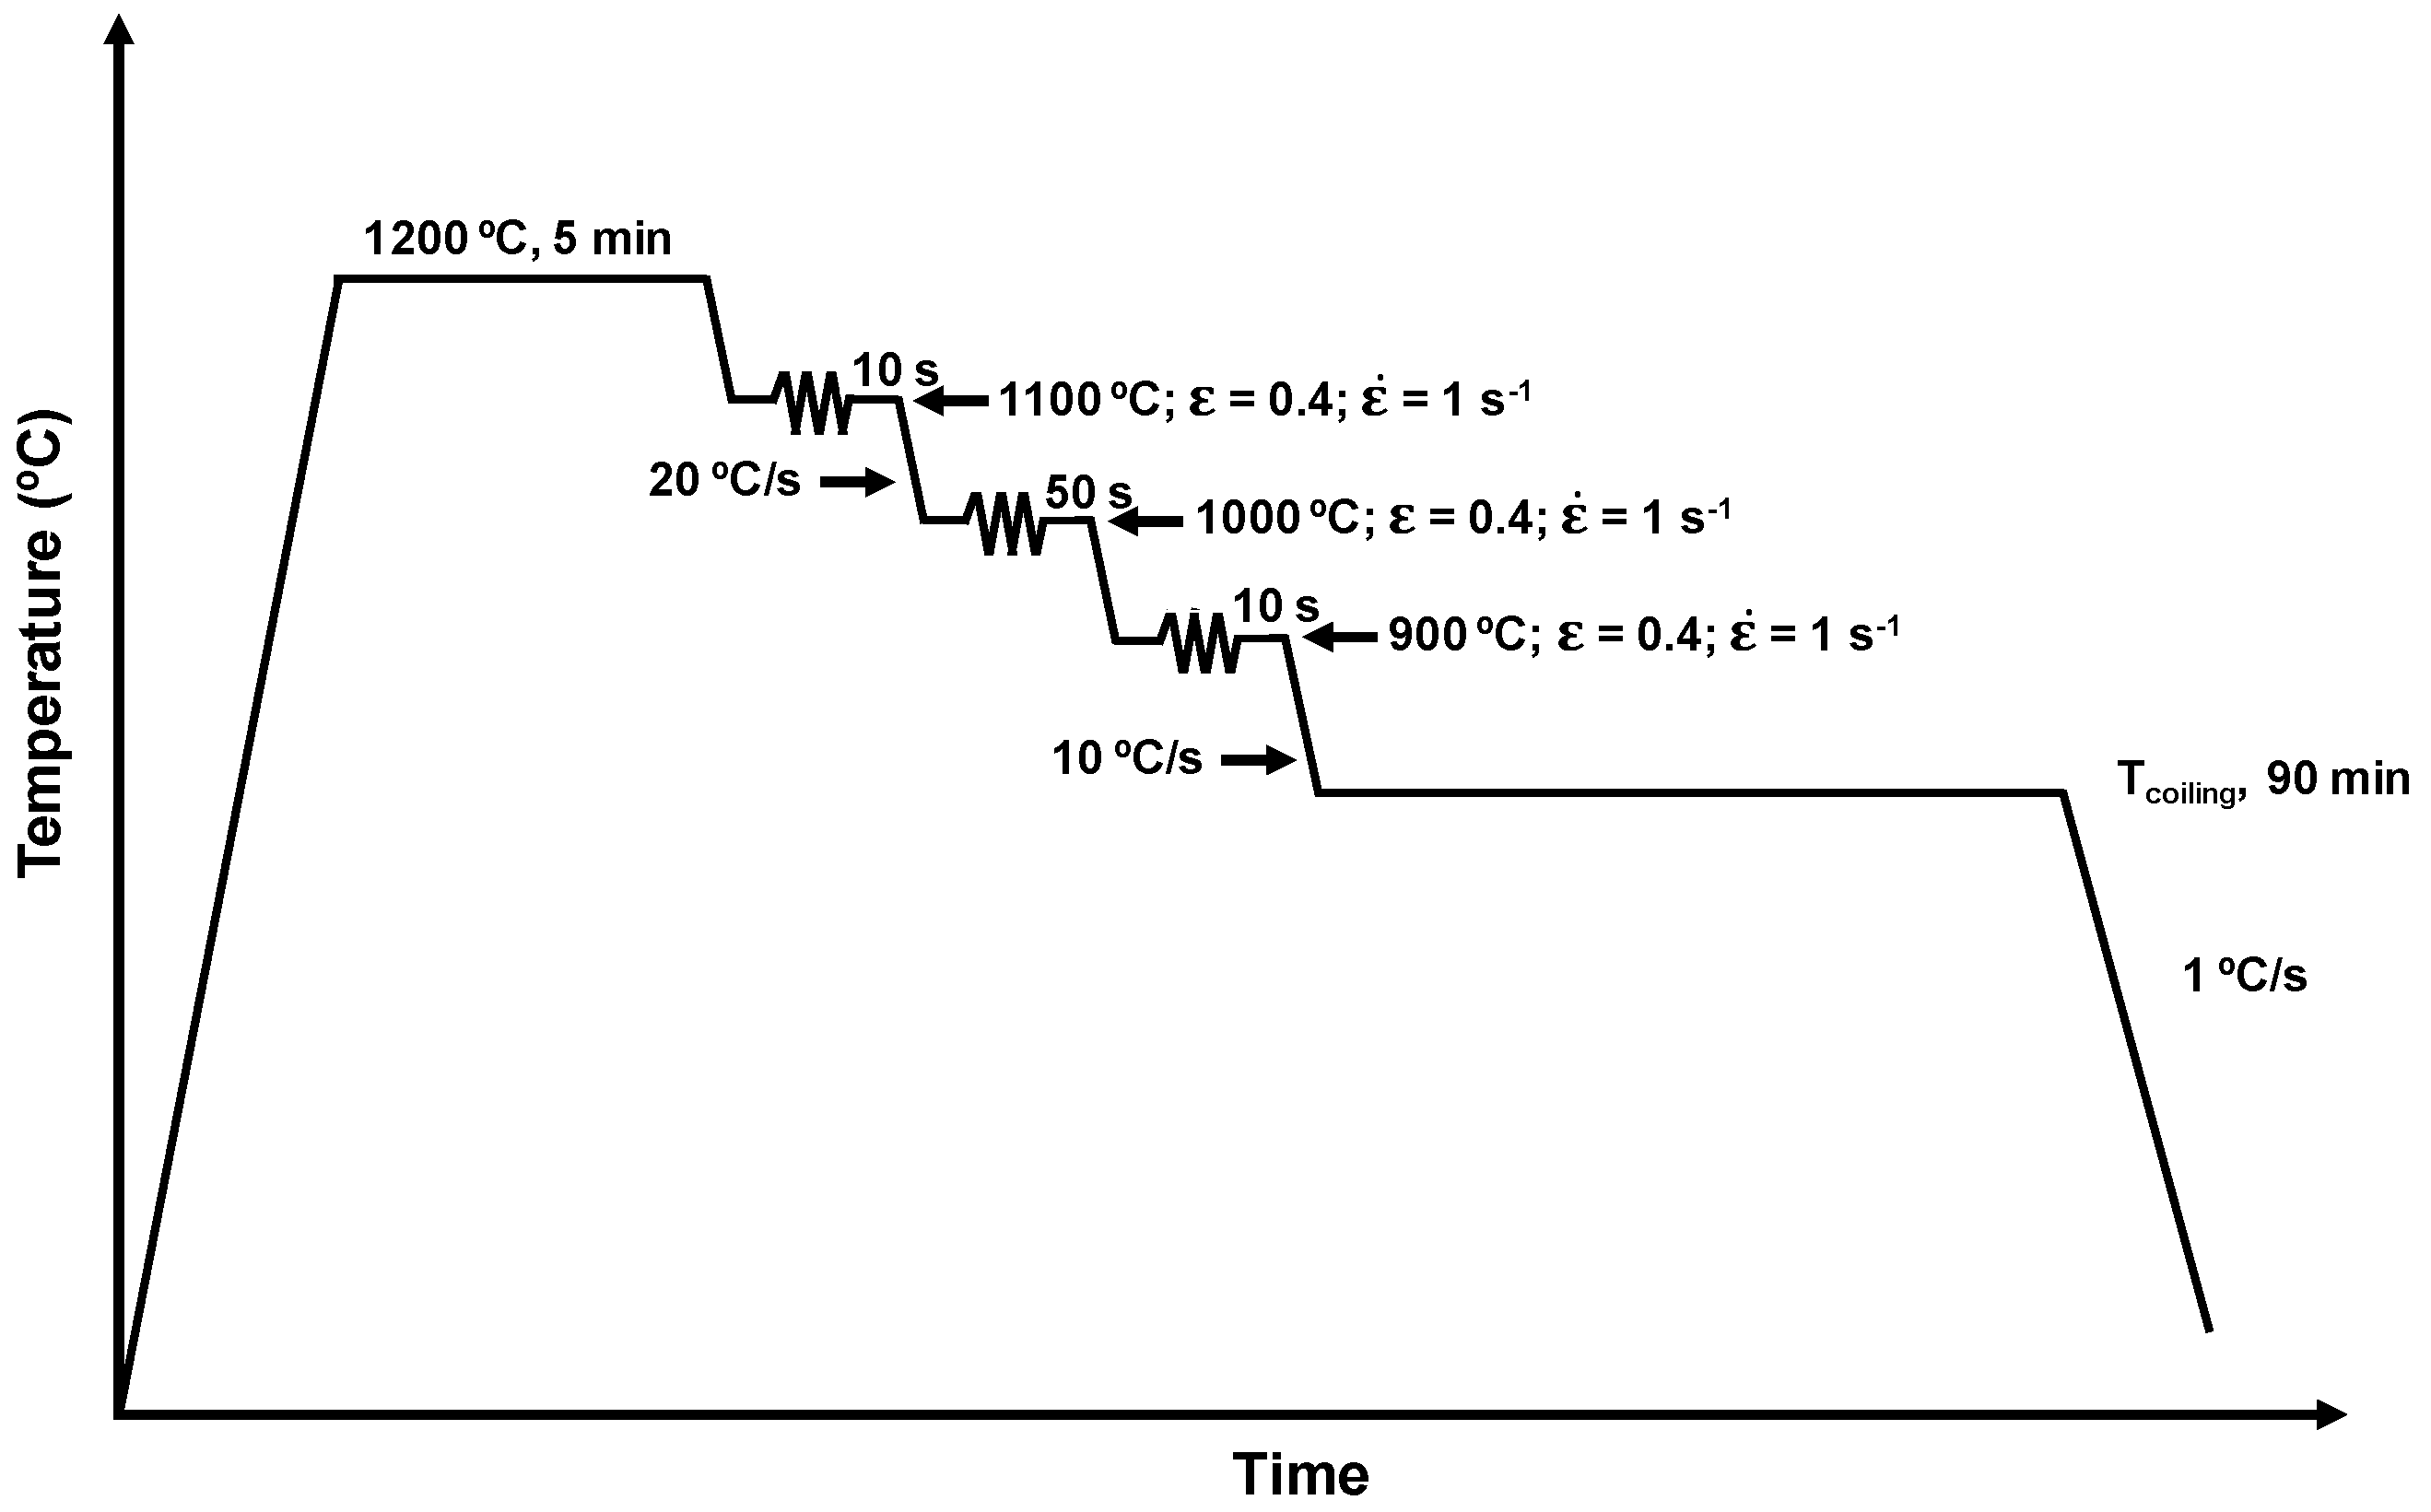
2. Materials and Methods

In the present study, three low carbon Nb, NbMo and TiMo microalloyed steels are selected. Their chemical composition is listed in Table 1.
Plane strain compression tests were performed at different simulated coiling temperatures (Tcoiling, °C) following the thermomechanical schedule represented in Figure 1. The plane compression specimens were reheated at 1200 °C for 5 min, followed by a multipass deformation sequence. The first two deformations (ε = 0.4) at 1100 and 1000 °C were designed in order to ensure fine recrystallized austenite. Then, the specimens were deformed at 900 °C, below the non-recrystallized temperature, to obtain a deformed austenite prior to transformation. After the last deformation, the samples were cooled down at 10 °C/s to three different coiling temperatures (700, 600 and 500 °C), where the specimens were maintained for 90 min to simulate the coiling process. Finally, the samples were cooled down slowly (1 °C/s) to room temperature.
The strain distributes heterogeneously through the section of the plane strain compression specimen, as a result of friction and specimen/tool geometry. Therefore, the specimens used for the microstructural and mechanical (tensile and Charpy specimens) characterization were obtained from the central part of the plane strain compression specimens in order to minimize strain gradients. The microstructures were characterized after etching in 2% Nital via different characterization techniques: optical microscopy (OM, LEICA DMI5000 M, Leica Microsystems, Wetzlar, Germany) and field-emission gun scanning electron microscopy (FEGSEM, JEOL JSM-7000F, JEOL Ltd., Tokyo, Japan). In order to quantify the crystallographic features, electron backscattered diffraction (EBSD) scans were performed for all samples. For that purpose, the samples were polished to 1 µm, followed by a polish with colloidal silica. Orientation imaging microscopy was carried out on the Philips XL 30CP SEM with W-filament, using TSL (TexSEM Laboratories, Salt Lake City, UT, USA) equipment. Different scan step sizes were used depending on the resolution needed, varying from 0.1 µm for high resolution scans to 0.4 µm for unit size measurements. The total scanned area was about 200 × 200 µm2. The study of the precipitation was performed using a transmission electron microscope (TEM, JEOL 2100, JEOL Ltd., Tokyo, Japan) with a voltage of 200 kV and a LaB6 thermionic filament. Carbon extraction replicas and electropolished thin foils were used for this purpose.
Cylindrical tensile specimens with a gauge length of 17 mm and a diameter of 4 mm were machined from the plane strain compression samples. The tensile tests were performed at room temperature and with a strain rate of 10−3 s−1 on an Instron testing machine (Instron, Grove City, PA, USA) under strain control. The 0.2% proof stress and the ultimate tensile strength were determined as the mean value of two tests for each condition. Additionally, Charpy sub-size specimens (~4 × 10 × 55 mm3) were machined and Charpy tests were performed (within an interval between −120 °C and 20 °C) in a Tinius Olsen Model Impact 104 pendulum impact tester with maximum capacity of 410 J. Specimens with a thickness of 4 mm are within the range of applicability of the proportionality rule [6]:
K v 10 = 10 B K v B
where Kv10 and KvB are the impact energy for specimens that are 10 mm or B mm thick, respectively. The impact transition curves that are determined consider the modified hyperbolic tangent fitting algorithm proposed by Wallin [7]. Based on these curves, the temperature at which the sample shows a 50% ductile–brittle appearance transition temperature (DBTT) was calculated.

3. Results and Discussion

With the aim of obtaining a further understanding of the connection between chemical composition, coiling temperature, microstructure and mechanical properties, a detailed microstructural and mechanical property characterization was carried out. In the following sections, the evaluation of the influence of composition and coiling temperature on strength and toughness properties and the microstructural characterization results are described.

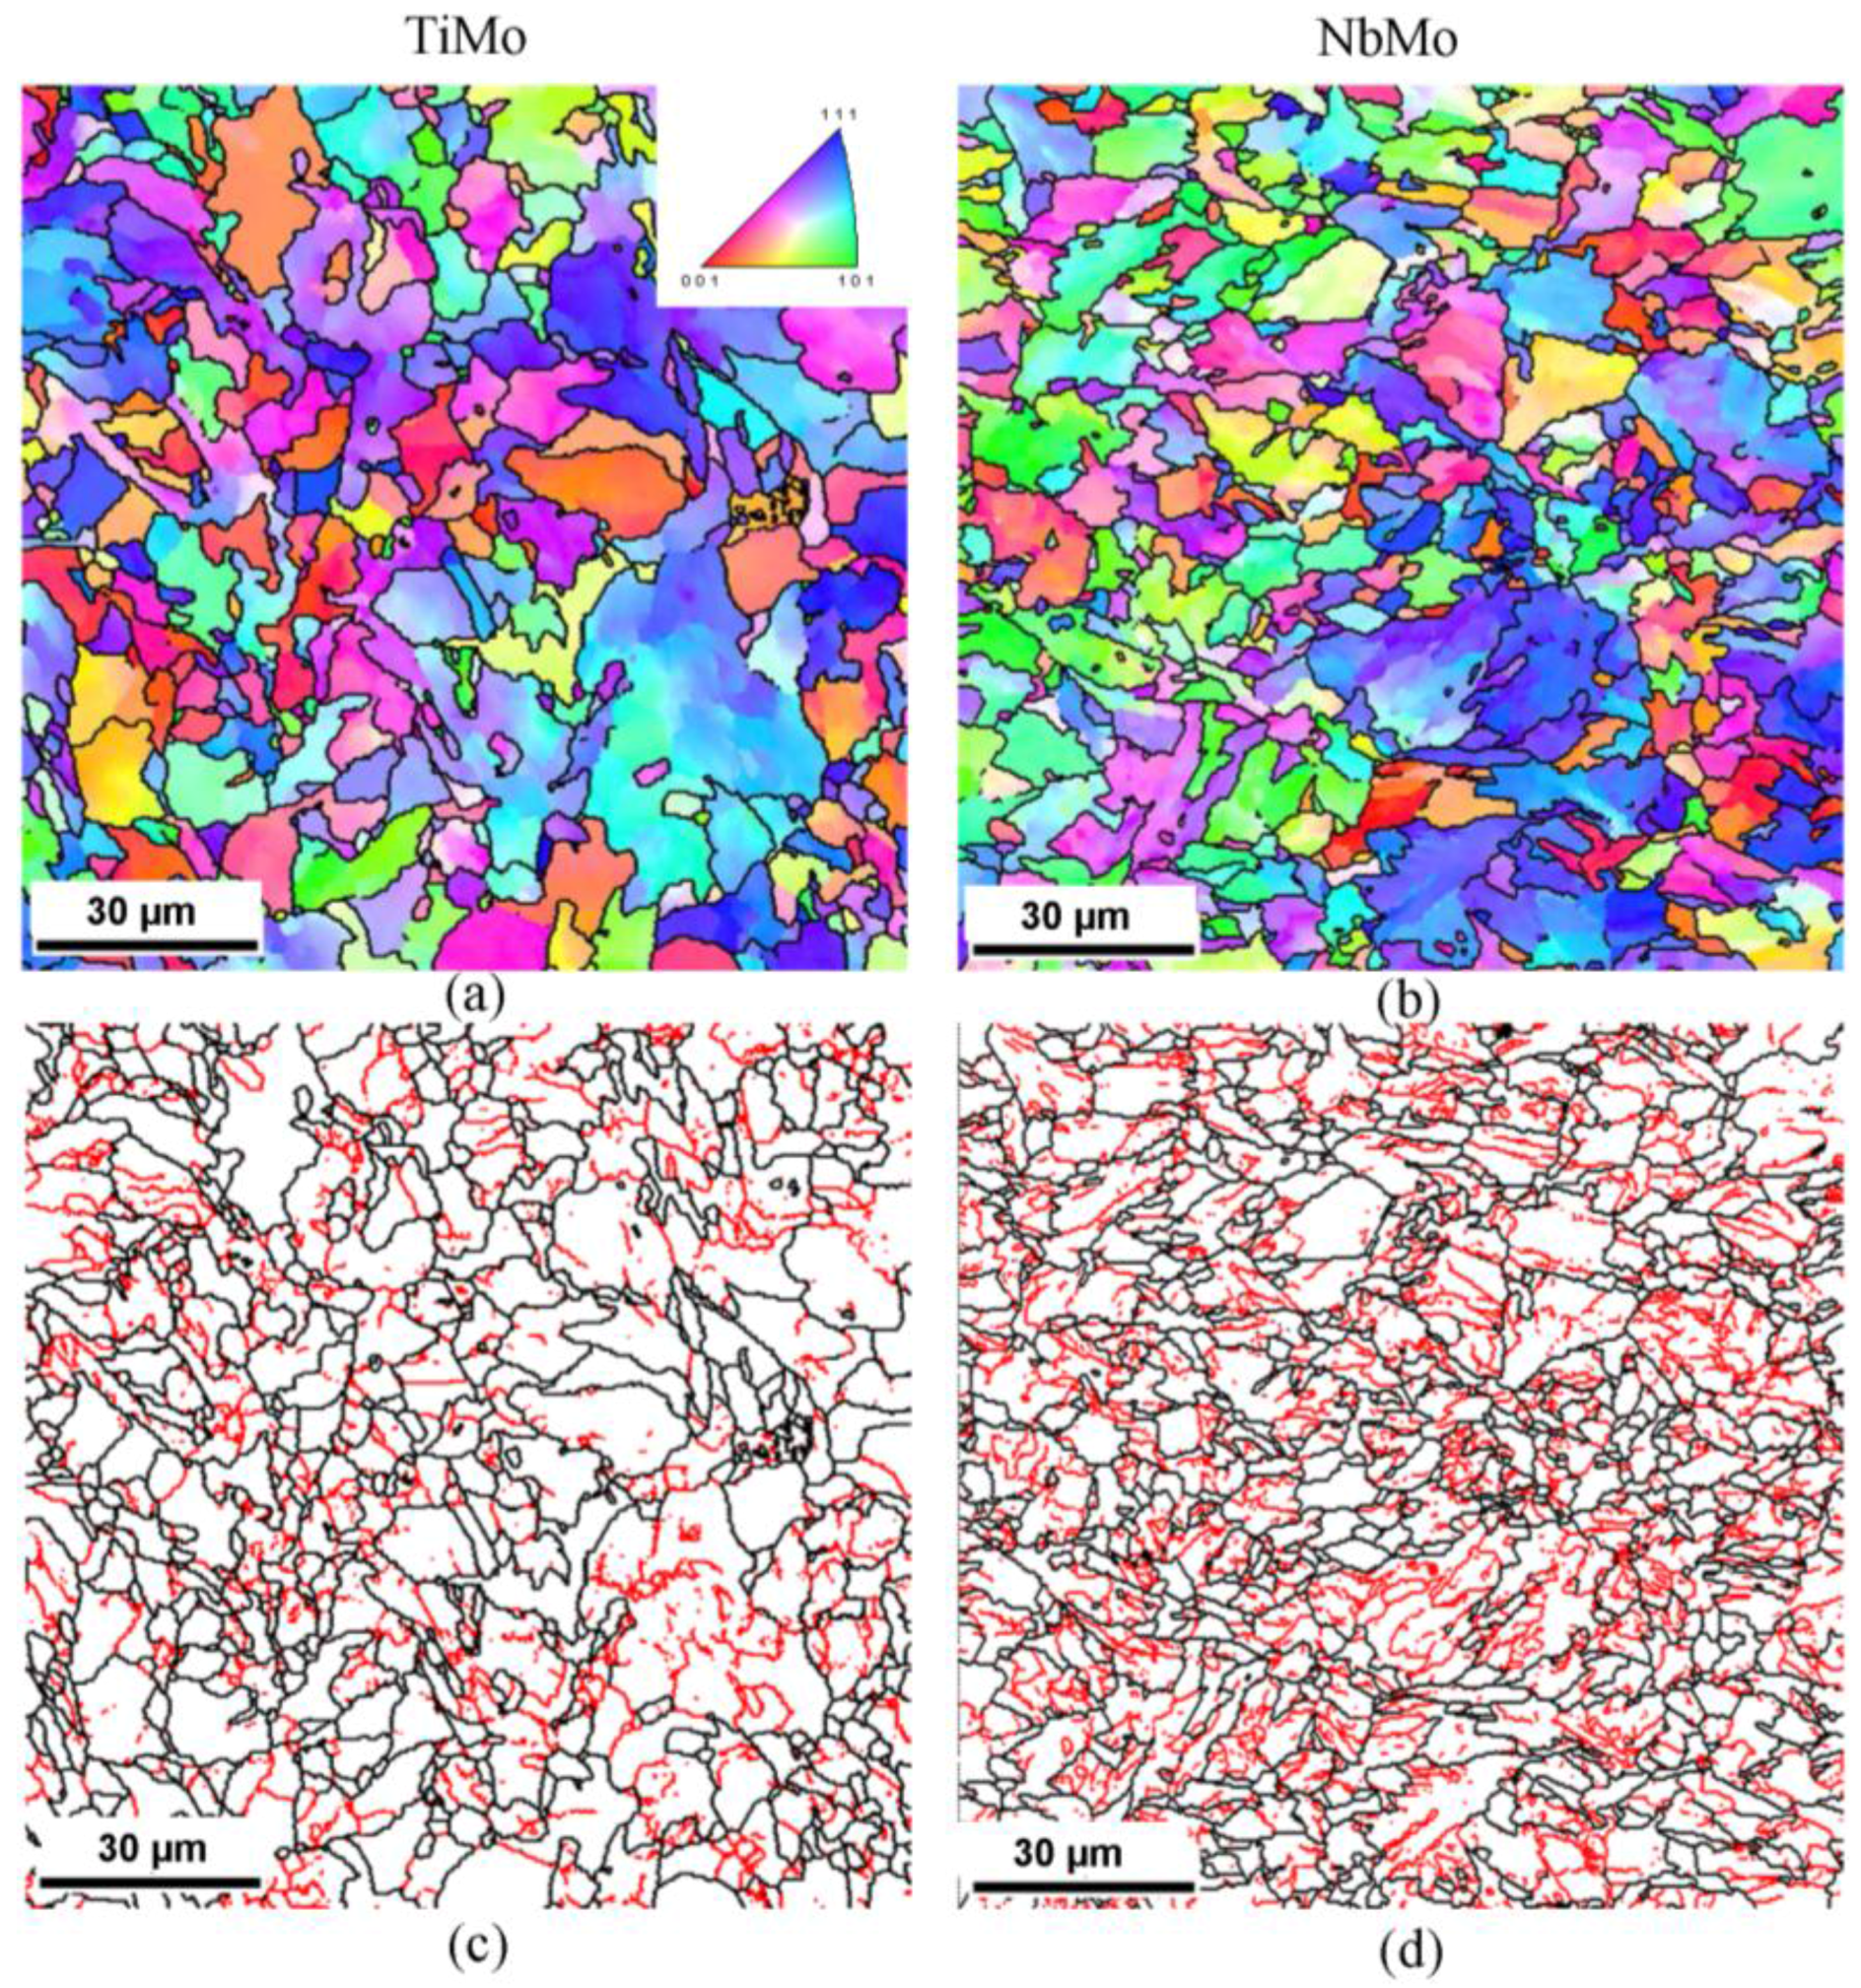
3.1. Microstructural Characterization

Both the tensile and toughness properties are controlled by different mechanisms such as solid solution hardening, microstructural refinement, dislocation hardening, precipitation hardening and secondary phases. With the aim of better understanding the role of those strengthening mechanisms in the yield strength and toughness, a deep microstructural analysis was carried out. In the subsequent sections, the results of this analysis are shown.

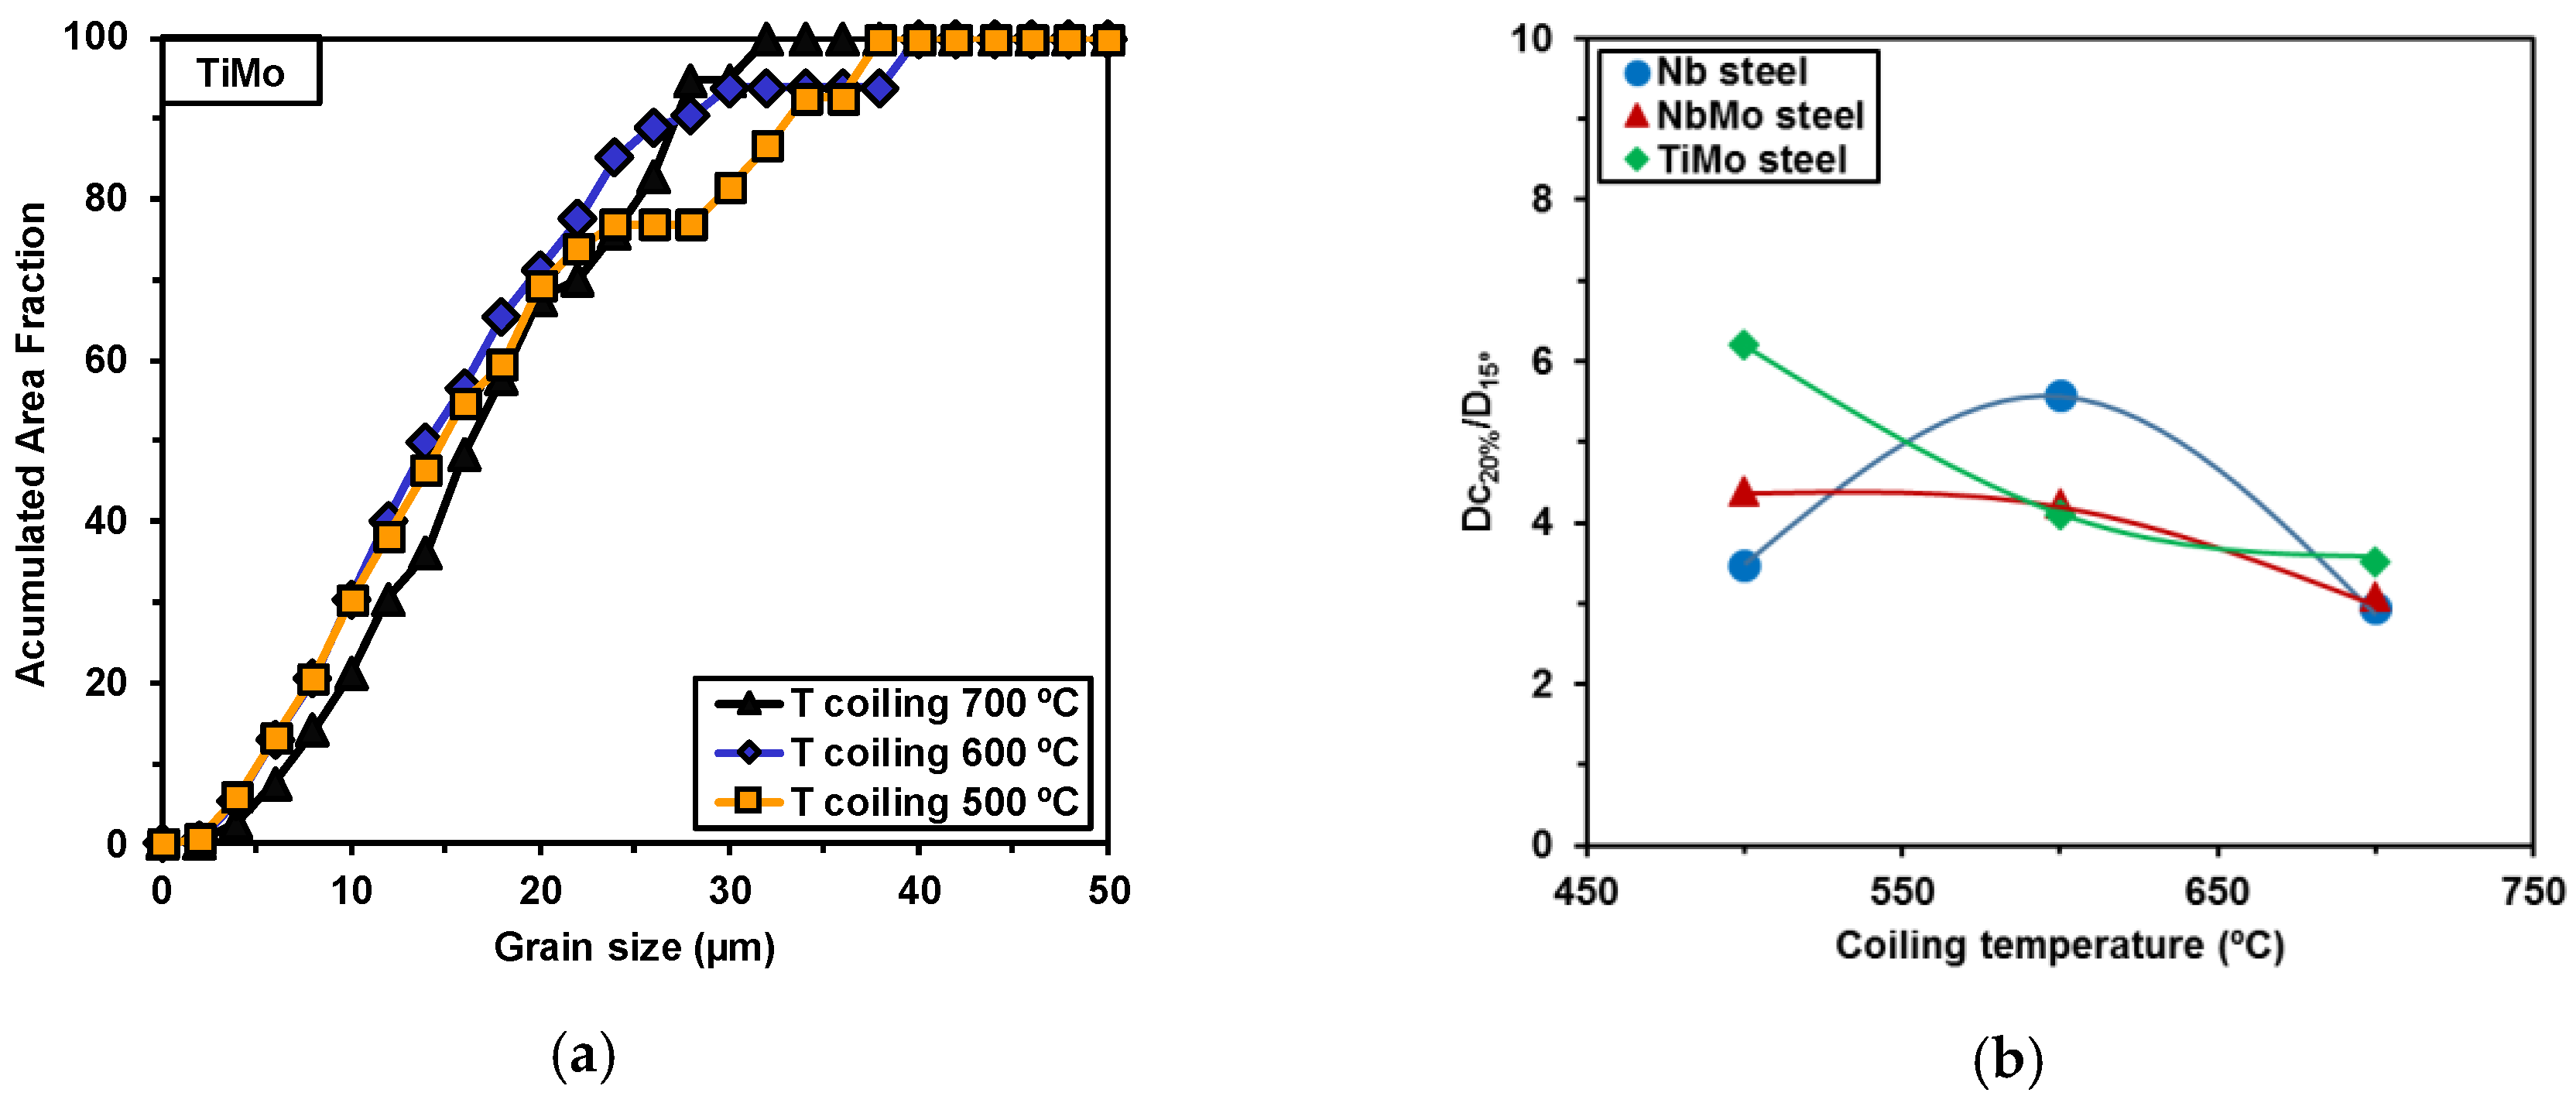
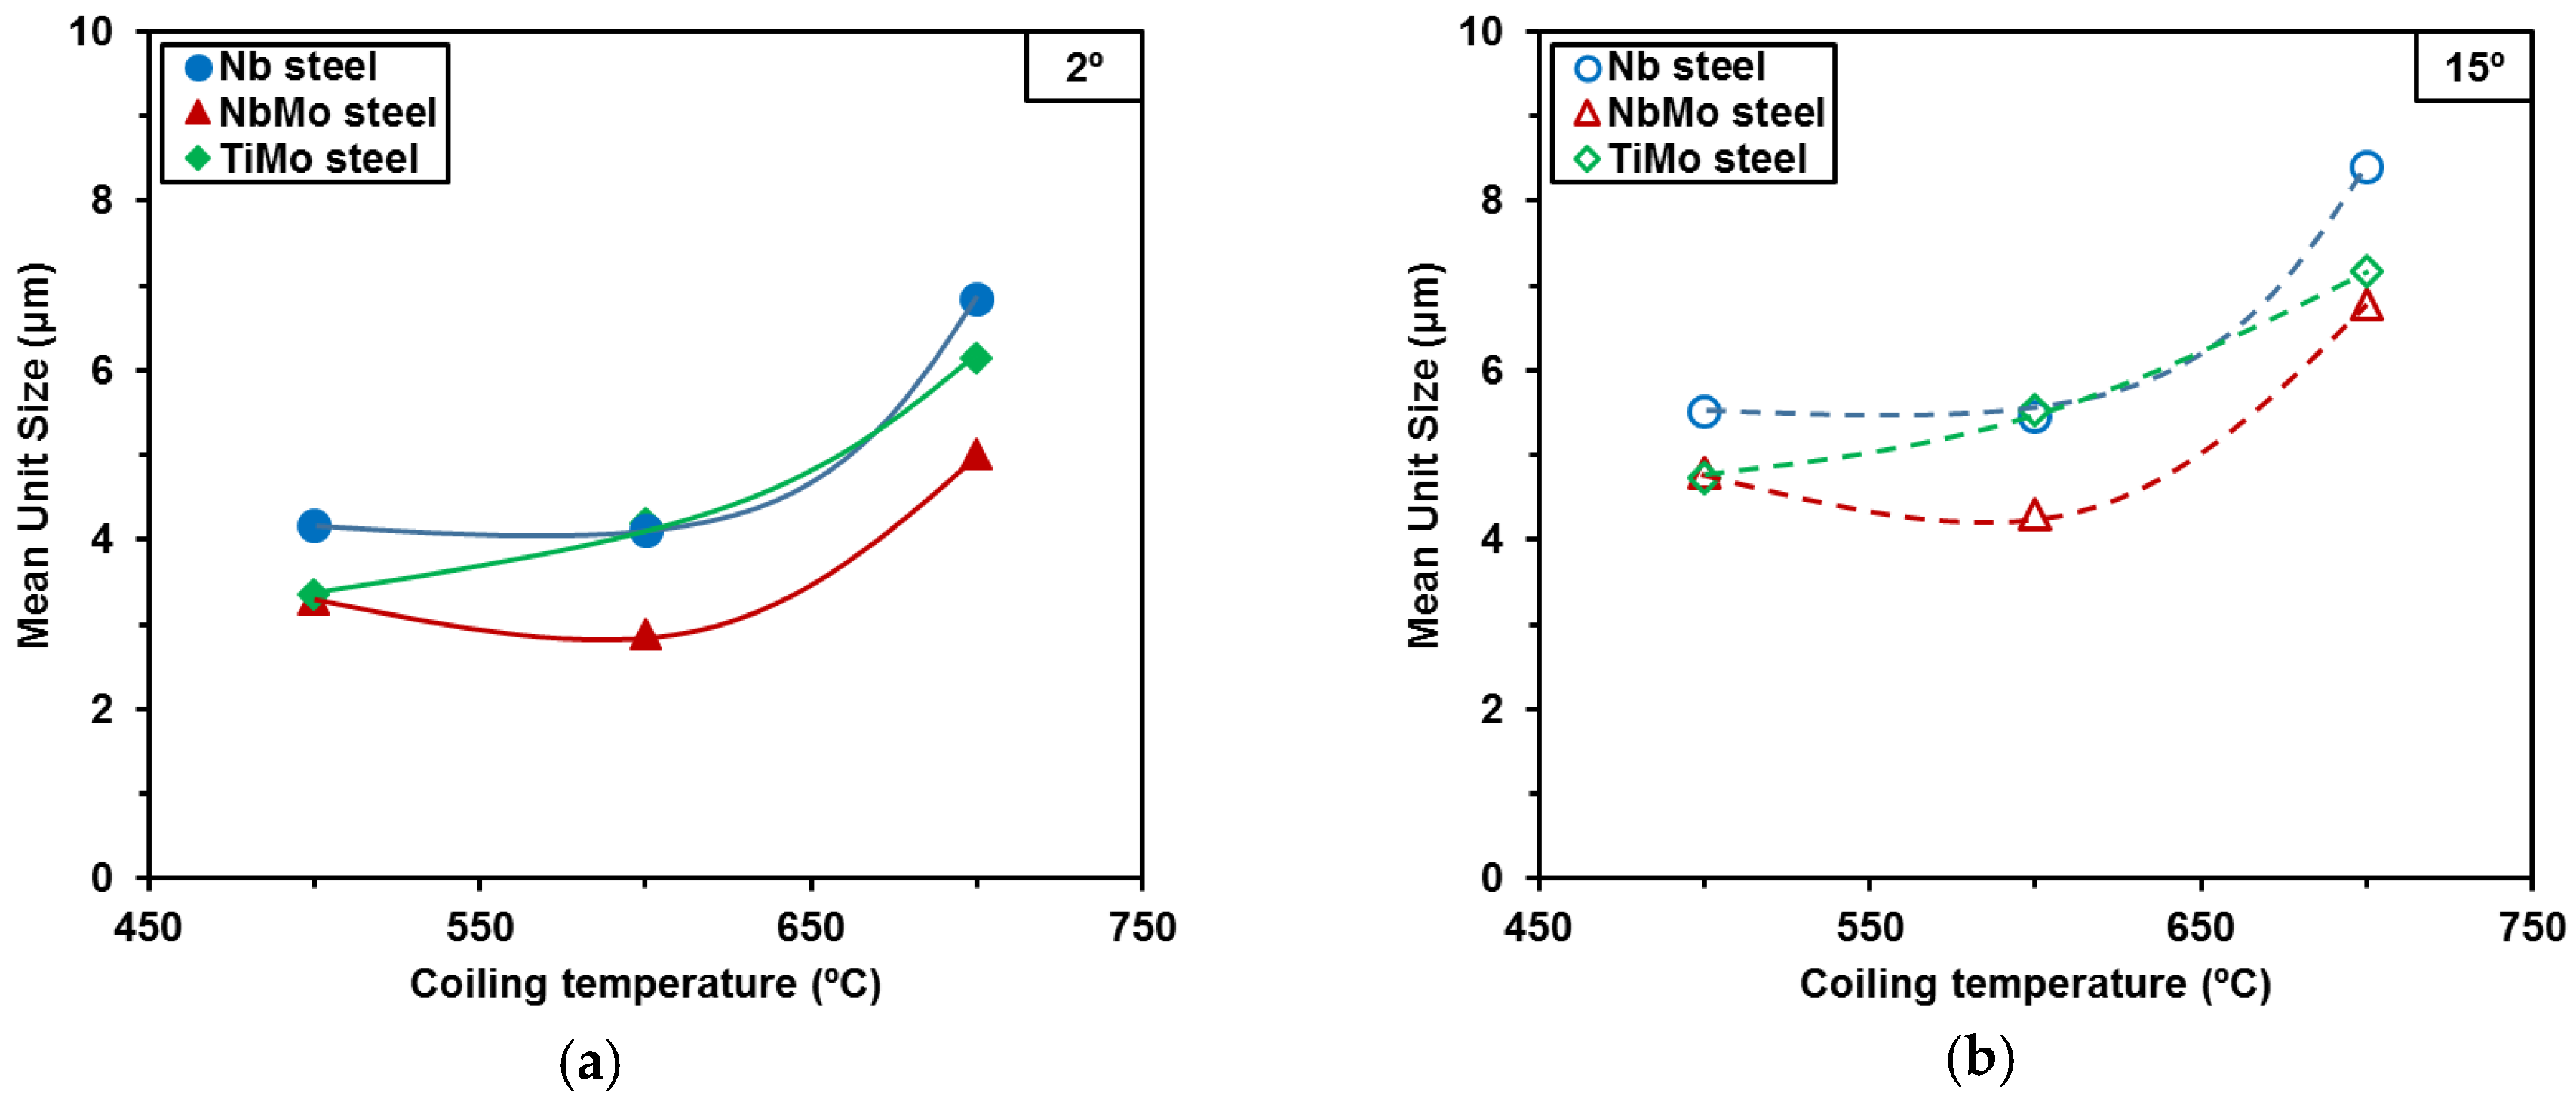
3.1.1. Microstructural Features, Unit Sizes and Homogeneity

The microstructures of the specimens obtained for the different coiling temperatures and composition were analyzed by optical (OM) and scanning electron microscopy (SEM) and the electron backscattering diffraction (EBSD) technique. Different transformation products can be distinguished depending on the chemical composition and the coiling temperature. In this article, the Iron and Steel Institute of Japan (ISIJ) Bainite Committee notation is adopted [2,8].
With regard to the Nb steel, when the highest coiling temperature of 700 °C is applied, a combination of Polygonal Ferrite (PF) and Pearlite (P) is observed. As the coiling temperature decreases, the mean size of the microstructure decreases, but no special change in microstructure was observed beyond the lack of pearlite at the coiling temperatures below 700 °C. On the other hand, in the NbMo and TiMo steels a microstructure composed of Polygonal Ferrite (PF), Pearlite (P) and Martensite/Austenite (MA) islands was obtained for the 700 °C coiling temperature. Reducing the coiling temperature leads to the formation of finer and more bainitic microstructures that are composed of PF, Quasipolygonal Bainite (QB), Granular Bainite (GB) and a small amount of MA islands, while in the NbMo steel the microstructure is composed of QB and GB and a higher fraction of MA islands. Conversely, at the lowest coiling temperature of 500 °C, a finer microstructure of QB and GB units is formed, and there is no trace of MA regions being retained between transformed phases in the NbMo and TiMo steels.
In addition to the qualitative microstructural analysis done by OM and SEM, an additional analysis using the EBSD technique was carried out due to the complexity of the analyzed microstructures. Low and high angle misorientation unit sizes were quantified, considering 2° and 15° misorientation criteria, respectively. As an example, Figure 2 shows Inverse Pole Figure maps (IPF) (Figure 2a,b) and grain boundary maps (Figure 2c,d) corresponding to the TiMo steel (Figure 2a,c) and the NbMo steel (Figure 2b,d) for a coiling temperature of 600 °C. The NbMo steel shows a finer microstructure when compared to the TiMo steel. Furthermore, a higher fraction of low angle boundaries (marked in red in Figure 2d) is noticed in the NbMo steel, reflecting the formation of more bainitic microstructures when Nb is added.
In Figure 3a,b, the mean unit sizes for low (2°, D) and high (15°, D15°) angle misorientation criteria are plotted. For both misorientation criteria, the mean unit size decreases as the coiling temperature decreases, and the Nb steel systematically presents the coarsest microstructure. On the other hand, the NbMo steel shows the smallest mean unit size for all coiling temperatures, the TiMo steel unit sizes being between the other two steels in all cases. Regarding the high angle criterion (Figure 3b), in the Nb and NbMo steels, there is an important decrease when the coiling temperature decreases from 700 to 600 °C. For example, in the NbMo steel, the mean unit size of the high angle criterion decreases from 6.8 to 4.4 µm. However, D15° remains approximately constant at lower coiling temperatures (4.4 µm for the coiling temperature (CT) of 600 °C and 4.8 µm for a CT of 500 °C). Although the same trend is observed for the Nb steel, slightly bigger unit sizes are attained. In contrast, in the TiMo steel, the decrease is more progressive. This effect can be explained by a more gradual modification of the microstructure in the TiMo steel from ferritic to bainitic microstructures. Similar trends are also observed for the low angle boundary unit sizes (Figure 3a).
In addition to mean size values, microstructural homogeneity is essential for toughness properties. In Figure 4a, unit size distributions are plotted taking into account the high angle misorientation criterion for the TiMo microalloyed steel and different coiling temperatures. A significant influence of coiling temperature is observable, where the distribution becomes more heterogeneous as the coiling temperature decreases (the wider tail of the distribution). Therefore, in order to quantify the effect of microstructural heterogeneity on ductile–brittle transition, a parameter that is able to evaluate the relevance of coarse grain fraction is required. A useful parameter for evaluating the length of the tail of a distribution is the relationship between the critical grain size known as Dc20%—which corresponds to the cutoff unit size at 80% area fraction in a grain size distribution—and the mean unit size, D15°. The resulting parameter is defined as Dc20%/D15°. Figure 4b shows the variation of the Dc20%/D15° parameter with coiling temperature. As a general trend, a progressive increase of the parameter as the coiling temperature is decreased is observed. This fact is related to the development of more non-polygonal or bainitic microstructural features as the coiling temperature decreases. This trend was previously reported both for coiling simulations as well as for continuously cooled samples [2,9].

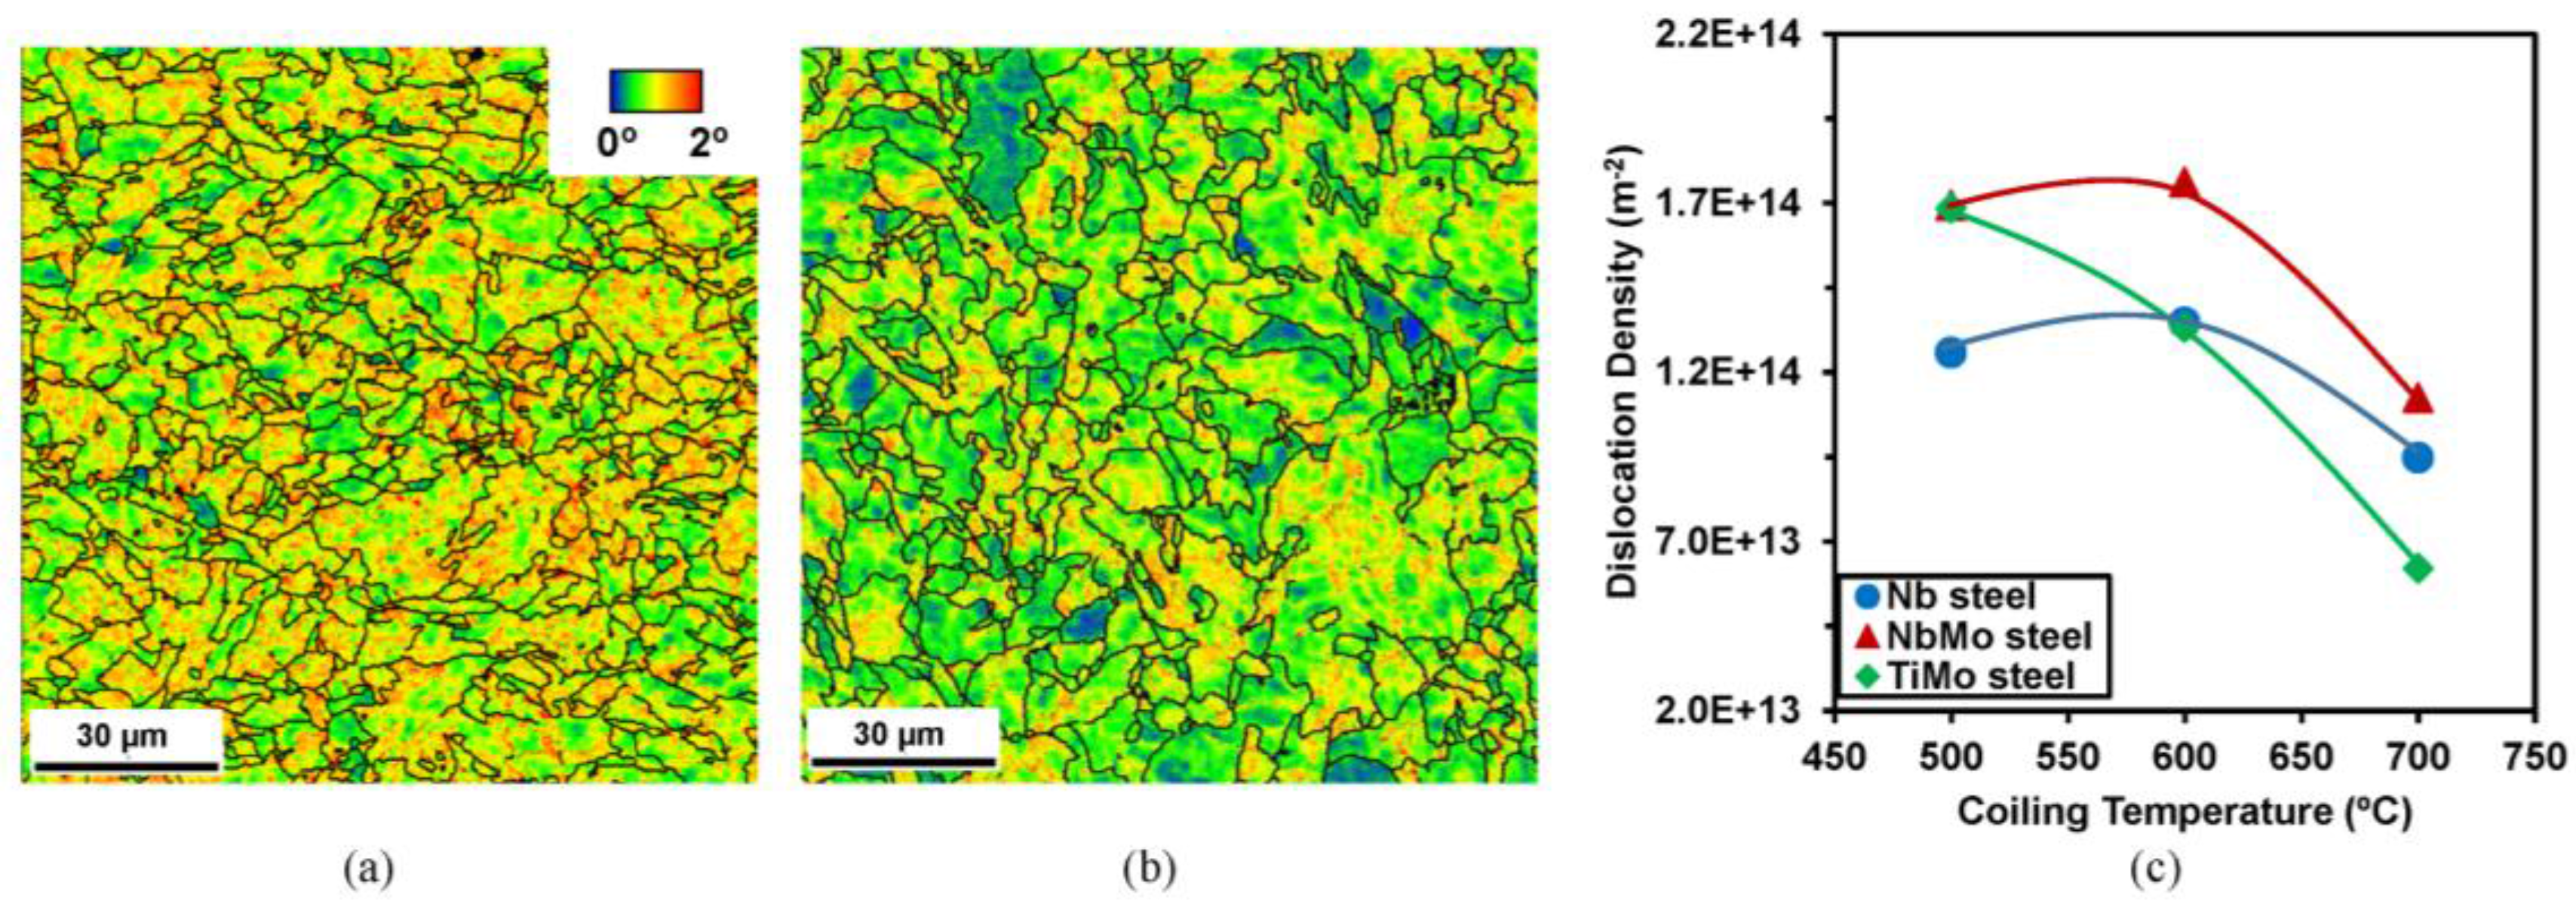
3.1.2. Dislocation Density

In addition to quantifying unit sizes, strengthening due to dislocation networks has to be considered, as the progressive modification from ferritic to bainitic microstructures is relevant when coiling temperatures decrease. The dislocation density has been inferred using the Kernel Average Misorientation (KAM) parameter measured using EBSD. KAM reflects the local misorientation gradients within a given region. For that purpose, the approach proposed by Kubin and Mortensen is adopted (see Equation (2)) [10].
ρ = 2 K A M b u
where b is the Burgers vector and u is the length related to the Kernel. The KAM for ϑ < 2° and the second neighbor distance have been predefined to calculate the parameter. In the current work, the length associated with the Kernel parameter (u) is 1.86 times the step size. With the aim of minimizing the frequent overestimation of the Kernel as determined by means of conventional EBSD, the measurements have been corrected using a recently proposed correlation between high-resolution EBSD and conventional EBSD for ferritic structures [11]. In Figure 5a,b, Kernel maps obtained after coiling at 600 °C are shown, for the TiMo and NbMo steel, respectively. Looking at the maps, higher KAM values are clearly observed in the NbMo steel than in the TiMo steel. KAM values of 0.97° and 0.76° are measured, for NbMo and TiMo steels, respectively, and resulting in dislocation densities of 1.76 × 10¹⁴ m−2 and 1.33 × 10¹⁴ m−2. The formation of more bainitic phases in the NbMo steel results in this higher dislocation density. In Figure 5c, dislocation density values are plotted as a function of coiling temperature for all the steels studied. Dislocation density values vary from 6.20 × 10¹³ m−2 to 1.76 × 10¹⁴ m−2 depending on the chemical composition and coiling condition.
In the Nb steel, no considerable change is noticed for dislocation density, with approximately similar dislocation density values being measured in the entire range of coiling temperatures (increasing from 9.47 × 10¹³ m−2 to 1.34 × 10¹⁴ m−2 as the coiling temperature decreases from 700 to 600 °C). In the two steels containing Mo, a different trend is observable, where a more significant increment in dislocation density is detected as the coiling temperature decreases. For the TiMo steel, dislocation density increases progressively from 6.20 × 10¹³ m−2 to 1.68 × 10¹⁴ m−2 when the coiling temperature is decreased from 700 to 500 °C. The trends shown in Figure 5c confirm the formation of more bainitic phases characterized by the highest dislocation densities in the NbMo steel. The dislocation densities reported in the literature for different microstructures differ considerably. For ferritic phases, a wide range of dislocation density values have been proposed, from very low dislocation density of 1012 m−2 [12] to a higher ρ of 2.5 × 10¹⁴ m−2 [13]. In the present study, the microstructures observed after a coiling at 700 °C contain secondary phases (MA microconstituent and pearlite) apart from polygonal ferrite. Given that higher KAM values are measured close to those hard phases, higher dislocation density values are estimated compared to purely ferritic microstructures. In terms of the dislocation densities reported for bainitic microstructures, the measurements shown in the present study are within the range reported by other authors [14,15].

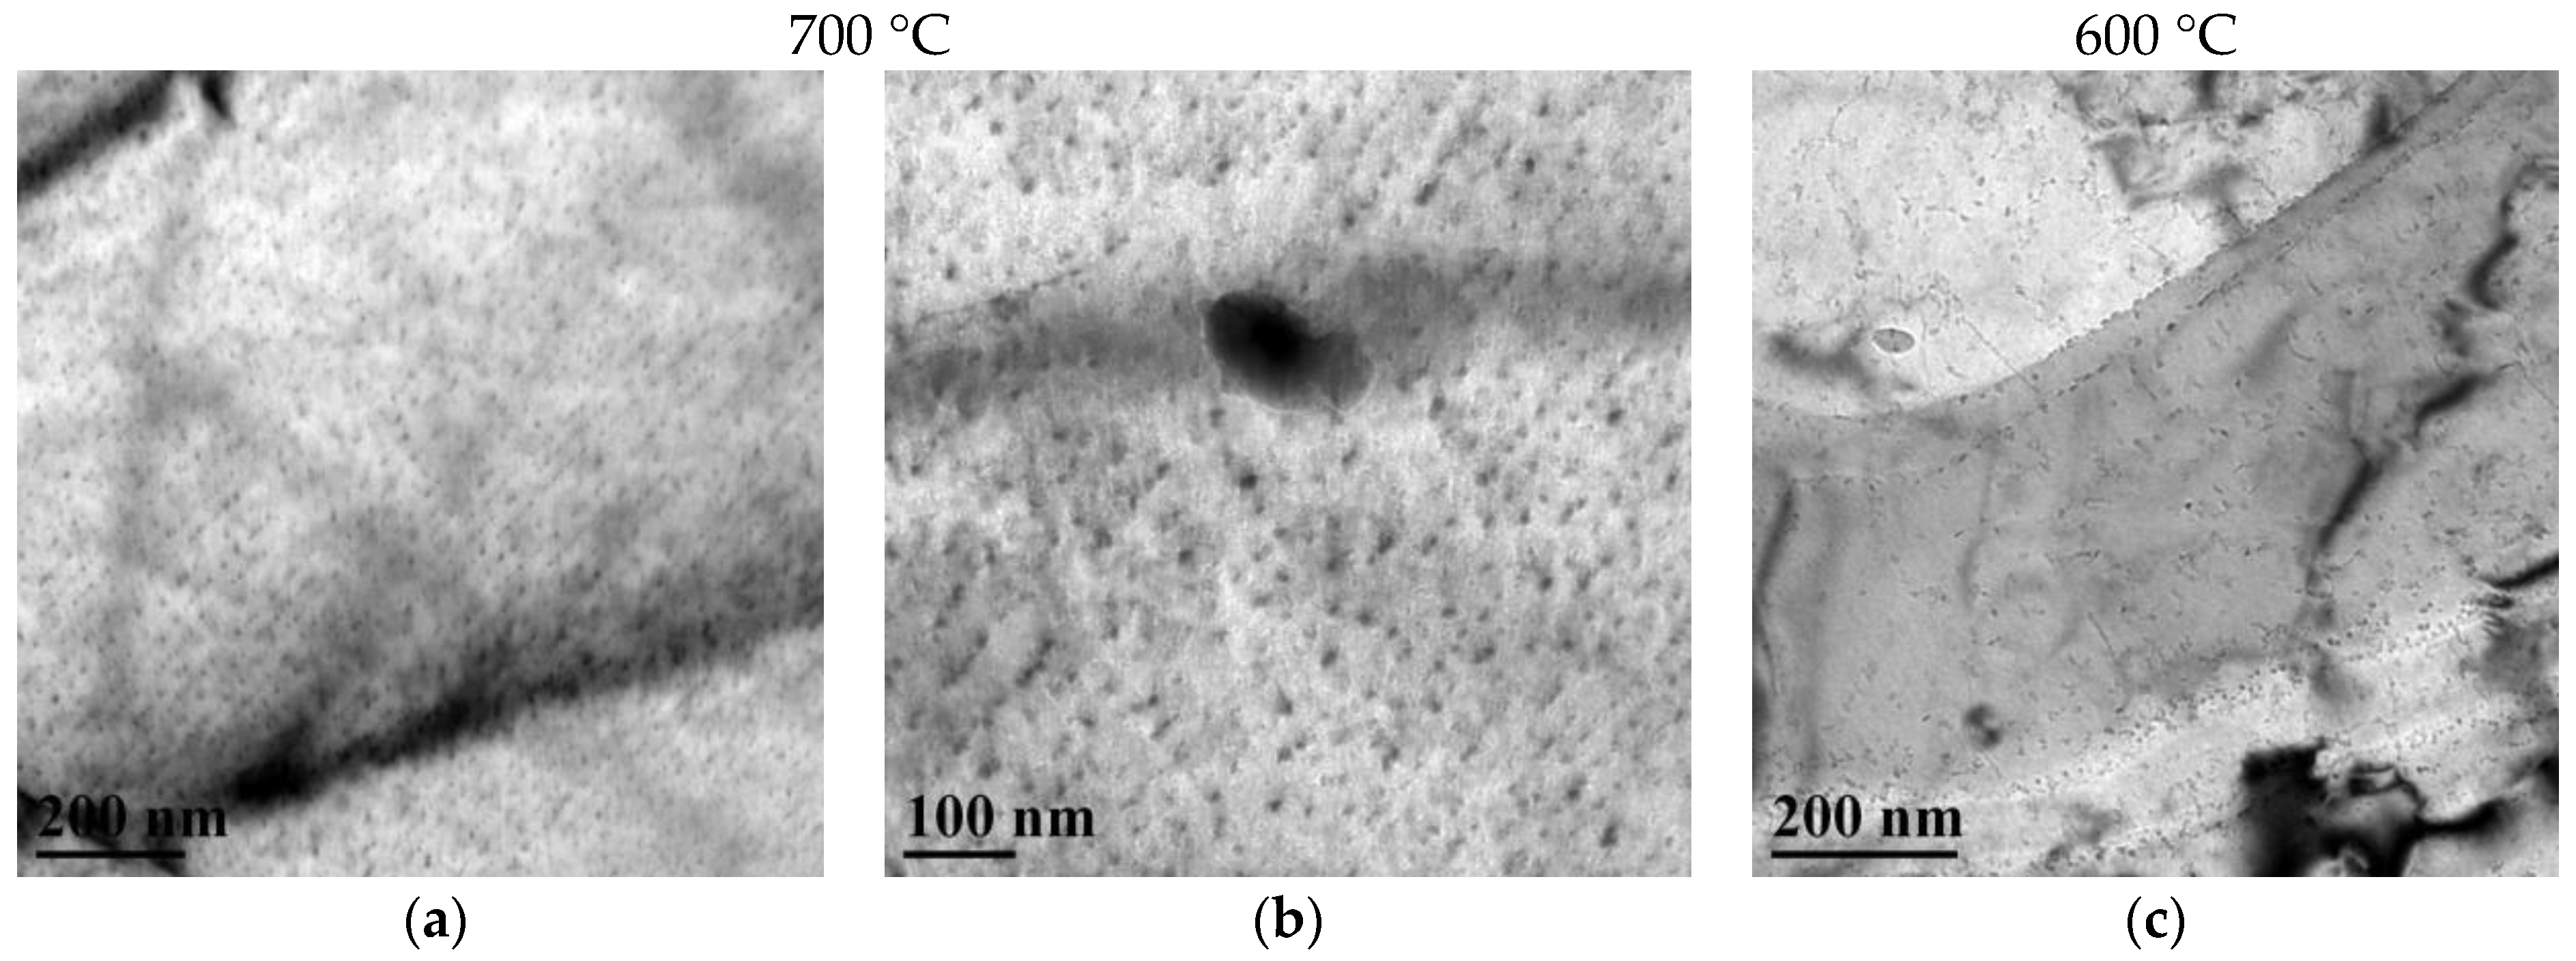
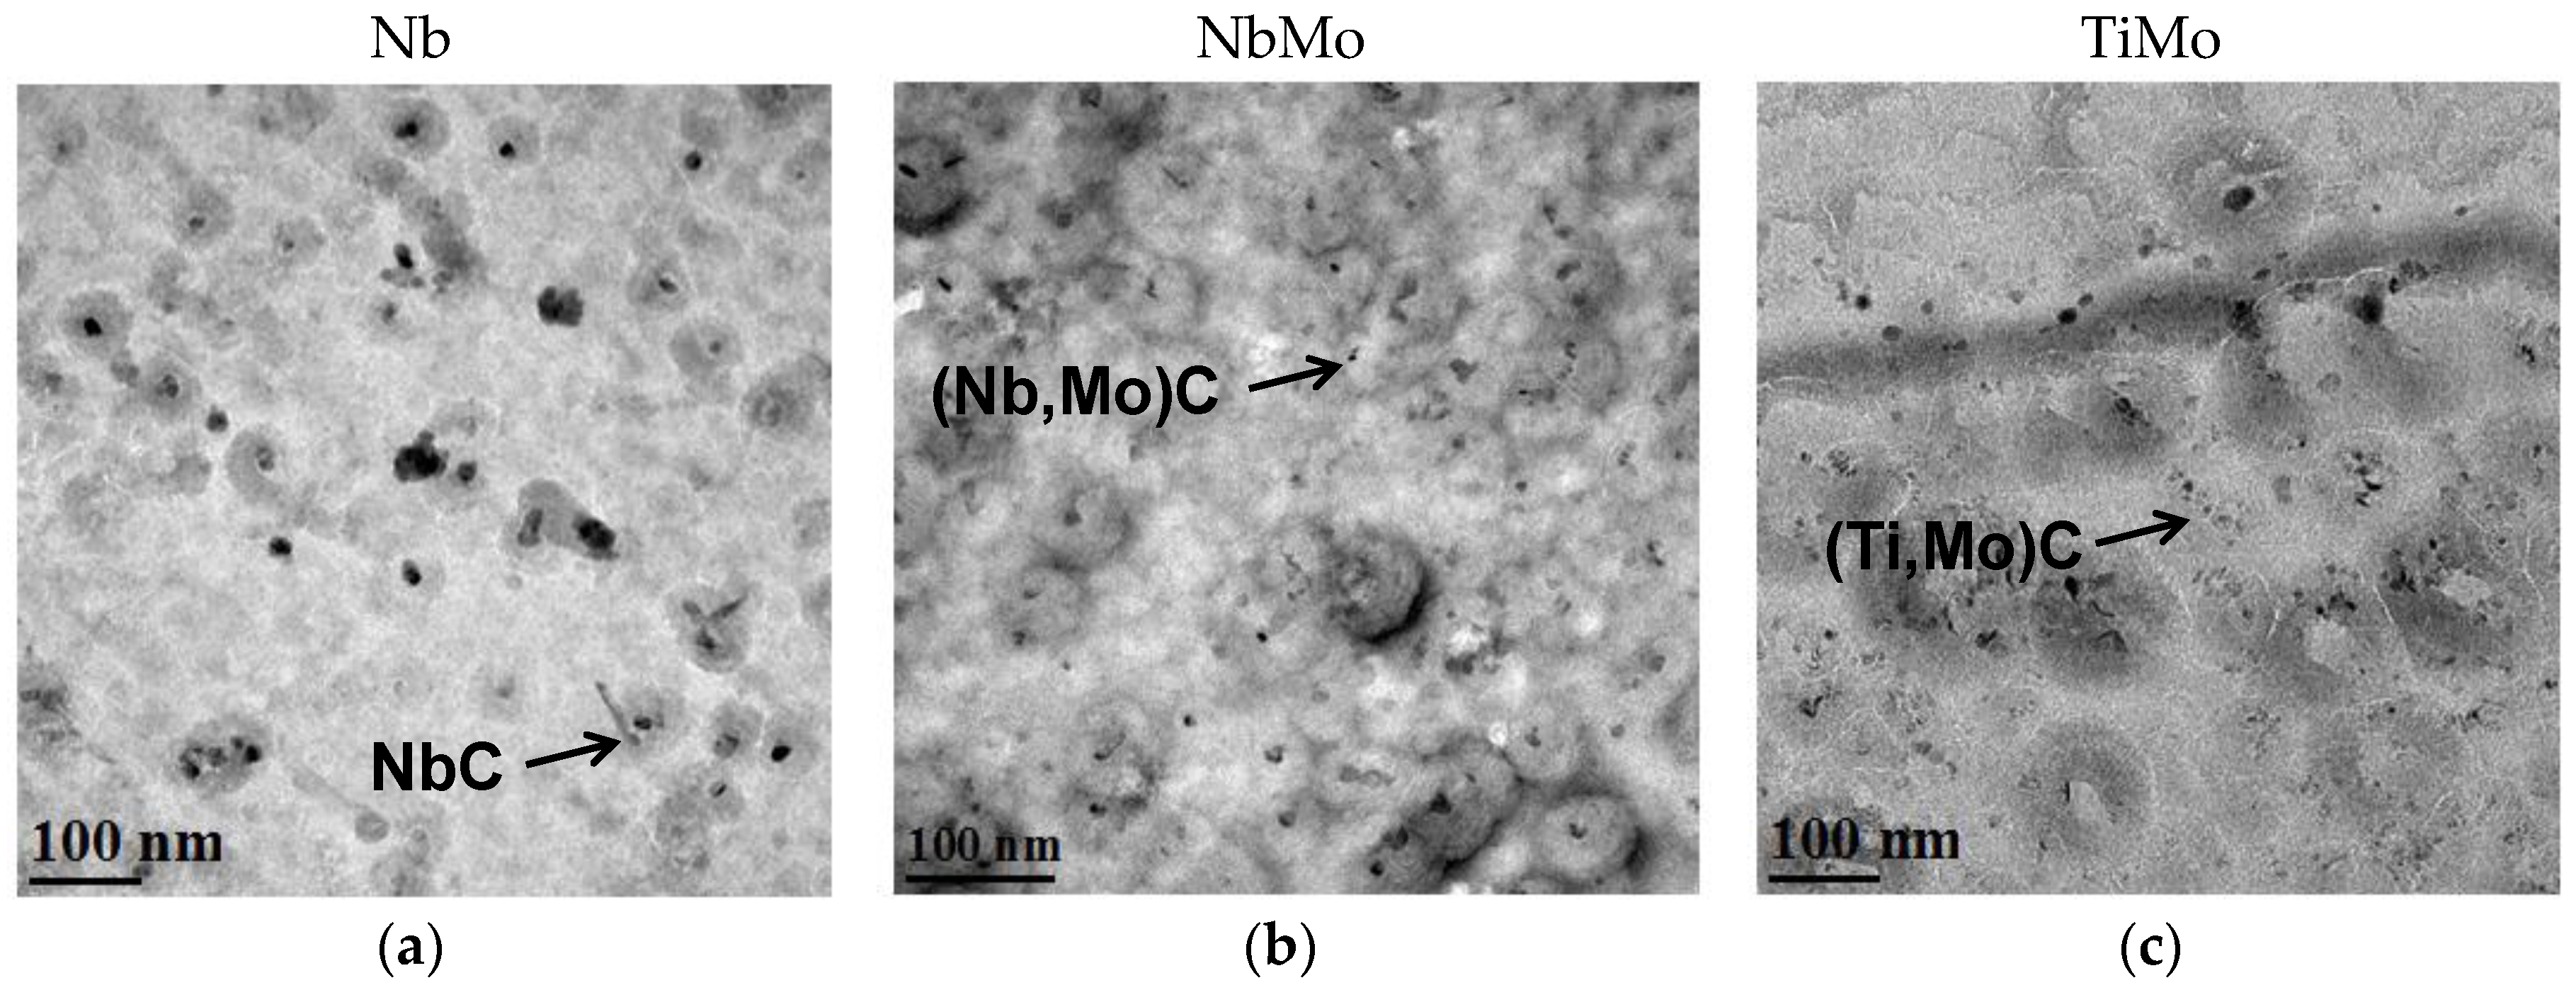
3.1.3. Precipitation

In order to evaluate how the different microalloying elements affect precipitation strengthening, a semi-quantitative analysis was performed. First, a preliminary study of fine precipitates was carried out on carbon extraction replicas, and the average precipitate size was measured in selected coiling temperatures and steels. The quantification was limited to particles smaller than 10 nm, which are considered effective for contributing to hardening. Figure 6a–c illustrates differences in precipitation after a coiling temperature of 700 °C in the Nb, NbMo and TiMo steels. Regarding the influence of microalloying elements on the precipitate density, the micrographs shown in Figure 6 suggest that the chemical composition strongly modifies the density of fine precipitates. Higher precipitate densities are achieved in the steels containing Mo (NbMo and TiMo). Furthermore, the addition of Mo leads to a refinement of the precipitates. Precipitate diameter decreases from 6.2 to 3.6 nm, for Nb and NbMo steel, respectively. These data are in line with previously reported results [9]. Several works reported that precipitates formed in ferrite became finer and denser as higher Mo contents are added [16]. The higher volume fraction of precipitates can be explained by the decrease in the driving force of carbide nucleation caused by Mo addition, as well as the increase in the density of nucleation sites. Wada and Pehlke [17] observed that Mo decreases both the driving force of precipitates and the diffusivity of the carbide-forming species. Akben [18] also confirmed that the addition of Mo can retard the precipitation of carbides. In reference to the effect of coiling temperature, Lee et al. [16] reported that the higher density of carbides is achieved as the coiling temperature decreases, since the high density of dislocations generated by the bainitic transformation could serve as nucleation sites for precipitates. Additionally, Isasti et al. [9] observed that the intermediate coiling temperature of 550 °C maximizes the strengthening effect of precipitation, due to the presence of a higher precipitate concentration. However, the authors reported that at lower coiling temperatures (450 °C) a less effective precipitation occurs.
With regard to the precipitation observed after coiling at 700 °C in the TiMo microalloyed steel (see Figure 6c), very fine Ti- and Mo-containing precipitates are detected in the extraction replicas. Moreover, it is clear that a higher fraction of fine precipitates is formed in TiMo steel. It is reported that the considerable strengthening effect observed in TiMo microalloyed steel is attributed to a superior coarsening resistance of the (Ti, Mo)C carbide as compared to other carbides such as TiC and (Ti, Nb)C [19,20]. Although carbon extraction replicas are suitable for measuring precipitate size distributions and the microanalysis of the precipitates, this method presents limitations for evaluating the distribution and volume fraction of precipitates. Therefore, characterization was completed by means of thin foils. TEM micrographs shown in Figure 7a,b indicate that interphase precipitation occurs after coiling at 700 °C in the TiMo steel. The size of precipitates is in the range of 2–10 nm. This precipitation is characterized by the formation of particles that form repeatedly in the austenite/ferrite interphase as the transformation front moves through the austenite. As shown in Figure 7a,b, these precipitates are arranged in sheets parallel to the instantaneous position of the austenite/ferrite interphase and the resulting microstructure is formed by numerous sheets of precipitates with a given spacing. A microanalysis of these fine precipitates indicates that they are Ti-enriched carbides with some residual Mo presence.
Differences in precipitation are observed depending on the coiling temperature. In the TEM micrographs presented in Figure 7, it is clear that the distribution of the precipitates varies as the coiling temperature decreases. When the highest coiling temperature is applied, interphase precipitation is detected, while at the intermediate coiling temperature of 600 °C a mixture between aligned precipitates and random precipitates is observed. Moreover, TiC rows are formed on the grain boundary. Chen [21] reported that compared with other ferrites, such as polygonal ferrite and massive ferrite, quasi-polygonal bainite has a relatively low yield ratio and high strain-hardening rates. The combination of quasi-polygonal bainite and dispersed nanoscale precipitates provided a favorable strengthening effect. Several studies support the fact that both interphase precipitation carbides and randomly precipitated carbides can coexist in the same specimen under various thermomechanical conditions [19,22]. After analyzing different precipitation times, Tamako et al. noticed that the ratio of randomly precipitated carbides to interphase precipitation carbides is no less than 0.8 when the steel sheet is isothermally held at 500 °C to 600 °C [23]. The differences between interphase and random precipitation have also been investigated by in-situ nanomechanical testers, evaluating the influence of both types of precipitation on the dislocation movement in ferrite grains and on nanomechanical properties [24]. A study carried out by Mukherjee et al. [25] also revealed the coexistence of nanoclusters and precipitate particles. They determined that a bimodal distribution of larger (8–10 nm) precipitates coexisted with smaller nanoclusters (3 nm) within the interphase sheets/rows.

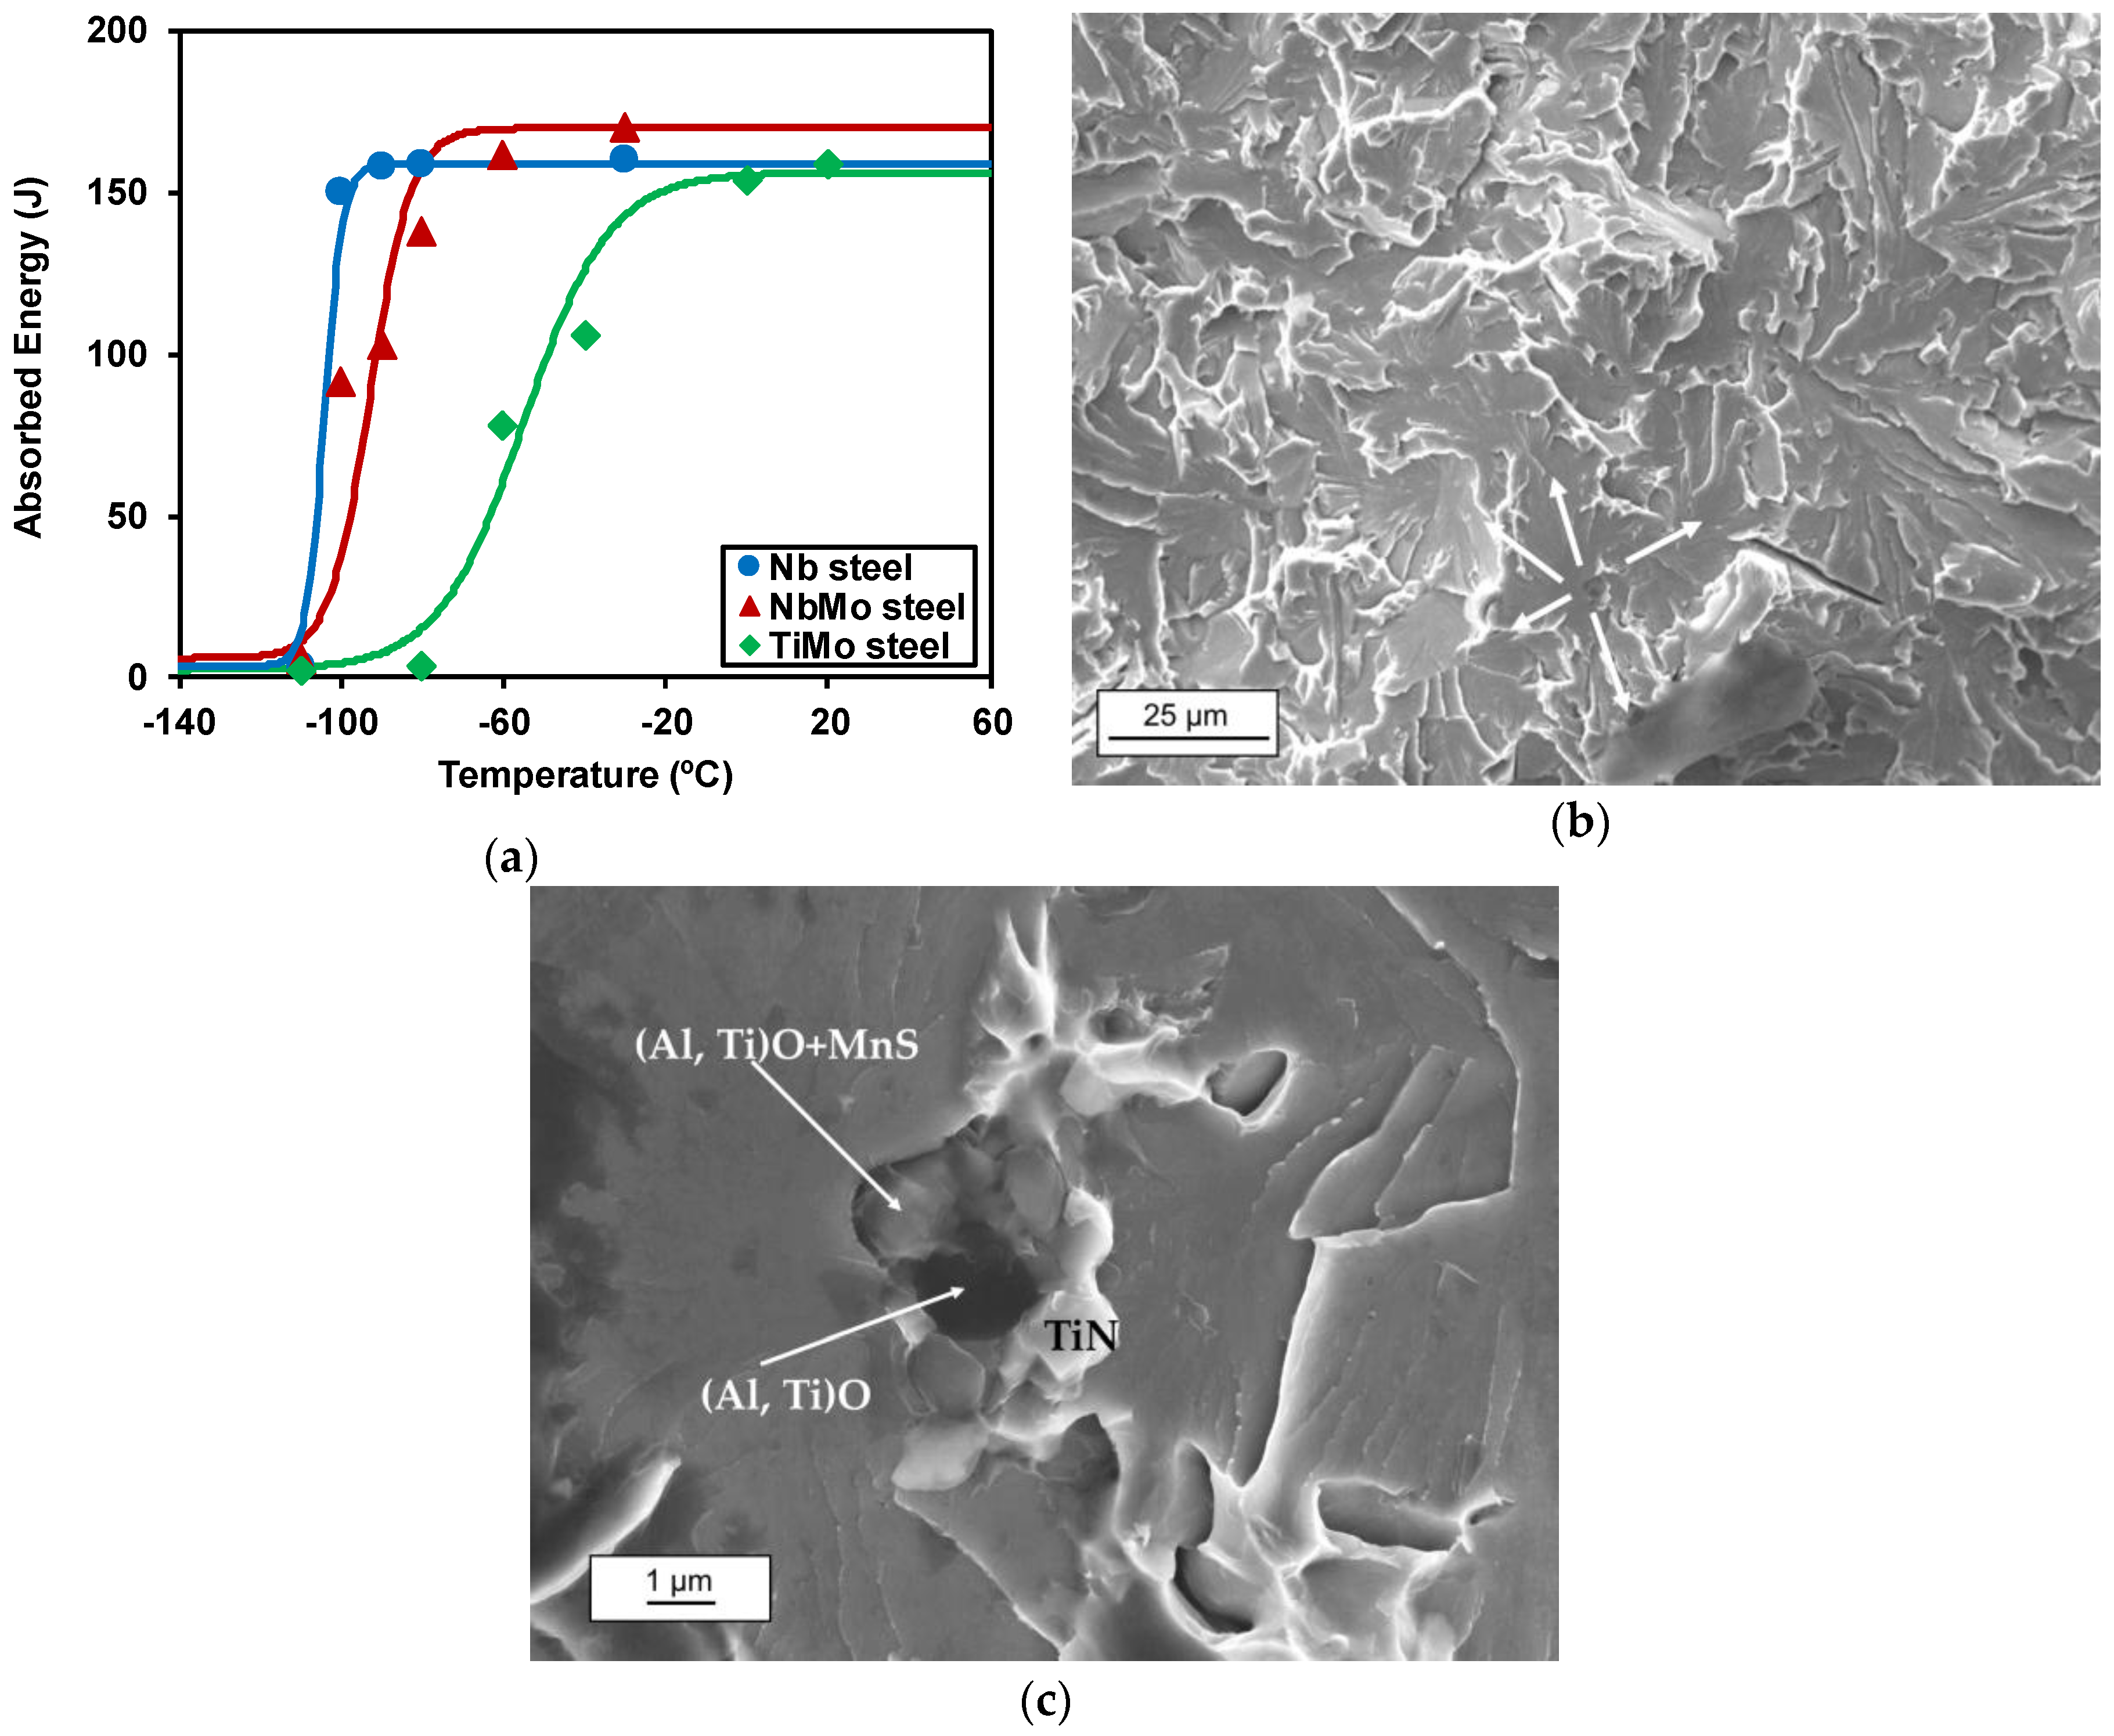
3.1.4. Secondary Phases

Besides the effect of the mentioned microstructural aspects, the presence of secondary phases, such as pearlite and MA islands, affects both tensile and impact toughness properties. Therefore, it is necessary to quantify the fraction and the size of these hard phases. As mentioned previously, the presence of MA islands is limited to the steels containing Mo (TiMo and NbMo) and high coiling temperatures (700 and 600 °C). Concerning pearlite, all the steels show this constituent at the highest coiling temperature of 700 °C. Both the morphology and size of the secondary phase differs considerably depending on the coiling temperature. In Table 2, the mean size of the MA islands, as well as the fraction of secondary phases, such as MA microconstituent and pearlite, are summarized. In the NbMo steel, as the coiling temperature decreases, non-polygonal phases are promoted and the diffusion of C is reduced, decreasing the C concentration in the non-transformed austenite [26]. These mechanisms lead to the refinement of MA islands. Mean sizes ranging from 2.5 to 1.2 µm are measured for the coiling temperature of 700 and 600 °C, respectively. A combination of MA (2.3%) and pearlite (13.9%) is detected after coiling at 700 °C, while the formation of pearlite is eliminated at the intermediate coiling temperature of 600 °C (see Table 2). In the TiMo steel, no significant variation in MA size is observed, which is associated with the formation of polygonal phases in the range between 700 and 600 °C. For the lowest coiling temperature of 500 °C, due to the significant reduction of the diffusion of carbon, MA islands cannot be identified in both steels.

3.2. Mechanical Behavior

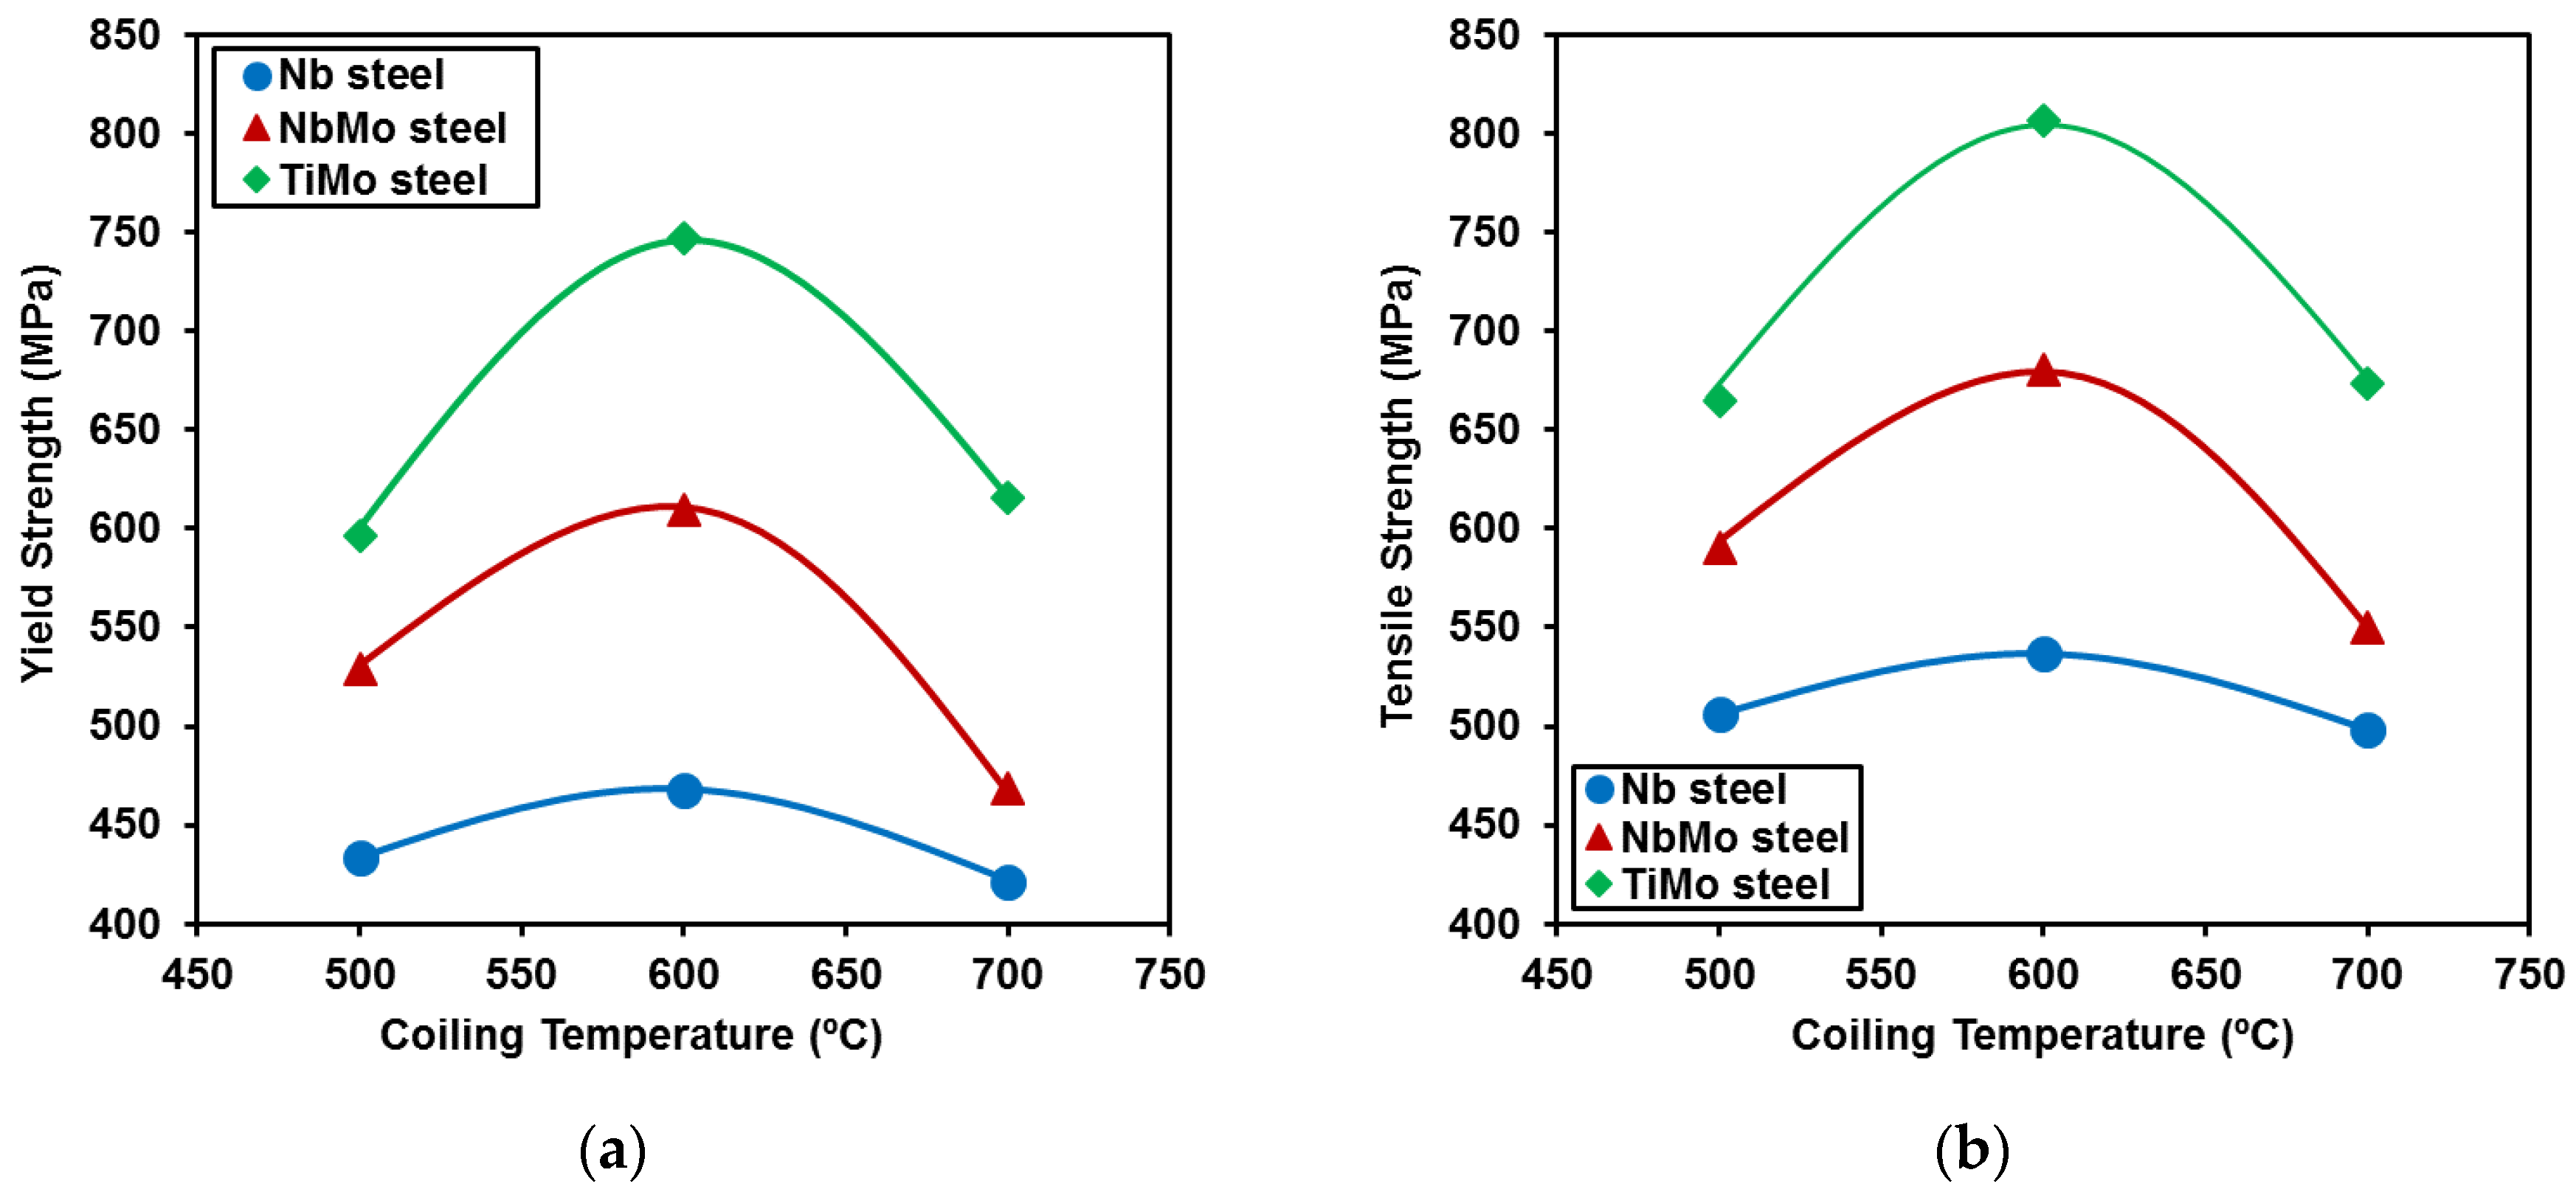
3.2.1. Tensile Properties

Tensile data (yield and tensile strength) are plotted in Figure 8a,b as a function of coiling temperature for all the microalloyed steels. The overall tensile property parameters are listed in Table 3. Looking at the evolution of yield strength (see Figure 8a), three strength levels can be clearly distinguished depending on the composition of the steel. The highest strength level is attained in TiMo steel, followed by the NbMo and Nb steels. A similar trend is observed for tensile strength (see Figure 8b). The addition of Mo to Nb microalloyed steels promotes an increase in the tensile properties (yield and tensile strength) mainly at intermediate (600 °C) and low coiling temperatures (500 °C). The addition of Mo induces the formation of non-polygonal phases, and this microstructural modification promotes an increment in strength through a substructure formation, an increase of the dislocation density and a higher presence of fine precipitates. These results are in line with previous reports [4]. This effect can additionally be associated with the presence of a higher fraction of fine precipitates at an intermediate coiling temperature (600 °C) in both Mo-containing steels (NbMo and TiMo). However, at the lowest coiling temperature of 500 °C, the strength decreases significantly (see Figure 8). This tensile improvement at intermediate temperatures can be justified by the presence of nanoscale precipitates distributed in the ferrite or bainitic matrix.
The maximum tensile properties (yield strength and tensile strength) are reached at the intermediate coiling temperature of 600 °C in TiMo and NbMo steel (see Figure 8 and Table 3). For the TiMo steel, maximum yield and tensile strengths of 747 and 807 MPa are obtained. Funakawa [5] reported the potential to improve strength in TiMo microalloyed steels through interphase precipitation. They proposed a strength improvement of 300–350 MPa, which is 2–3 times higher than that expected from conventional random precipitation hardening in microalloyed steels. Other authors provide support for the maximum tensile properties being reached at intermediate coiling temperatures in the range between 600 and 630 °C [27]. In terms of elongation (see Table 3), the Nb steel shows the highest values. The NbMo steel shows some dependency on MA presence, as the elongation drops sharply for the 700 °C coiling temperature, where big MA islands are formed. For the TiMo steel, however, the elongation values remain constant at approximately 27% even for yield strength values as high as 747 MPa. This suggests that the combination of a mostly ferritic matrix and very fine titanium carbides is a suitable route for combining high strength and good cold formability using a combination of titanium and molybdenum.

3.2.2. Toughness Properties

The impact transition curves corresponding to the different compositions and a coiling temperature of 700 °C are plotted together in Figure 9a. In terms of the effect of chemical composition, the best toughness properties are achieved for the Nb steel, followed by the NbMo and finally the TiMo steel. For example, for the 700 °C coiling temperature, 50% ductile–brittle appearance transition temperature (DBTT) values of −109, −94 and −51 °C are measured for the Nb, NbMo and TiMo steels, respectively. In the Nb and NbMo steels the transition from the ductile regime to the brittle one is produced in a narrow temperature range (the transition curve is almost vertical in Nb steel), whereas in the TiMo steel this transition temperature range is wider (see Figure 9a).
Detailed fractographic examination was carried out on the tested Charpy samples for the purpose of classifying and evaluating possible cleavage crack-initiation sites and microstructural features in their vicinity. In Figure 9b,c, a cleavage initiation site is shown for the TiMo steel coiled at 700 °C at different magnifications. This case corresponds to a cleavage-initiation site due to the presence of a complex inclusion formed by TiN, (Mn, Ti)S and oxides. Nevertheless, a fractography examination carried out in NbMo fracture surfaces shows that the initiation appears in a secondary phase with a morphology typical of the MA constituent, which is in agreement with previously published works [28]. In the Nb steel, crack initiators are not easily detected, but in etched samples the presence of carbides seems to be the most important factor in controlling the crack initiation.

3.3. Predicting Mechanical Properties

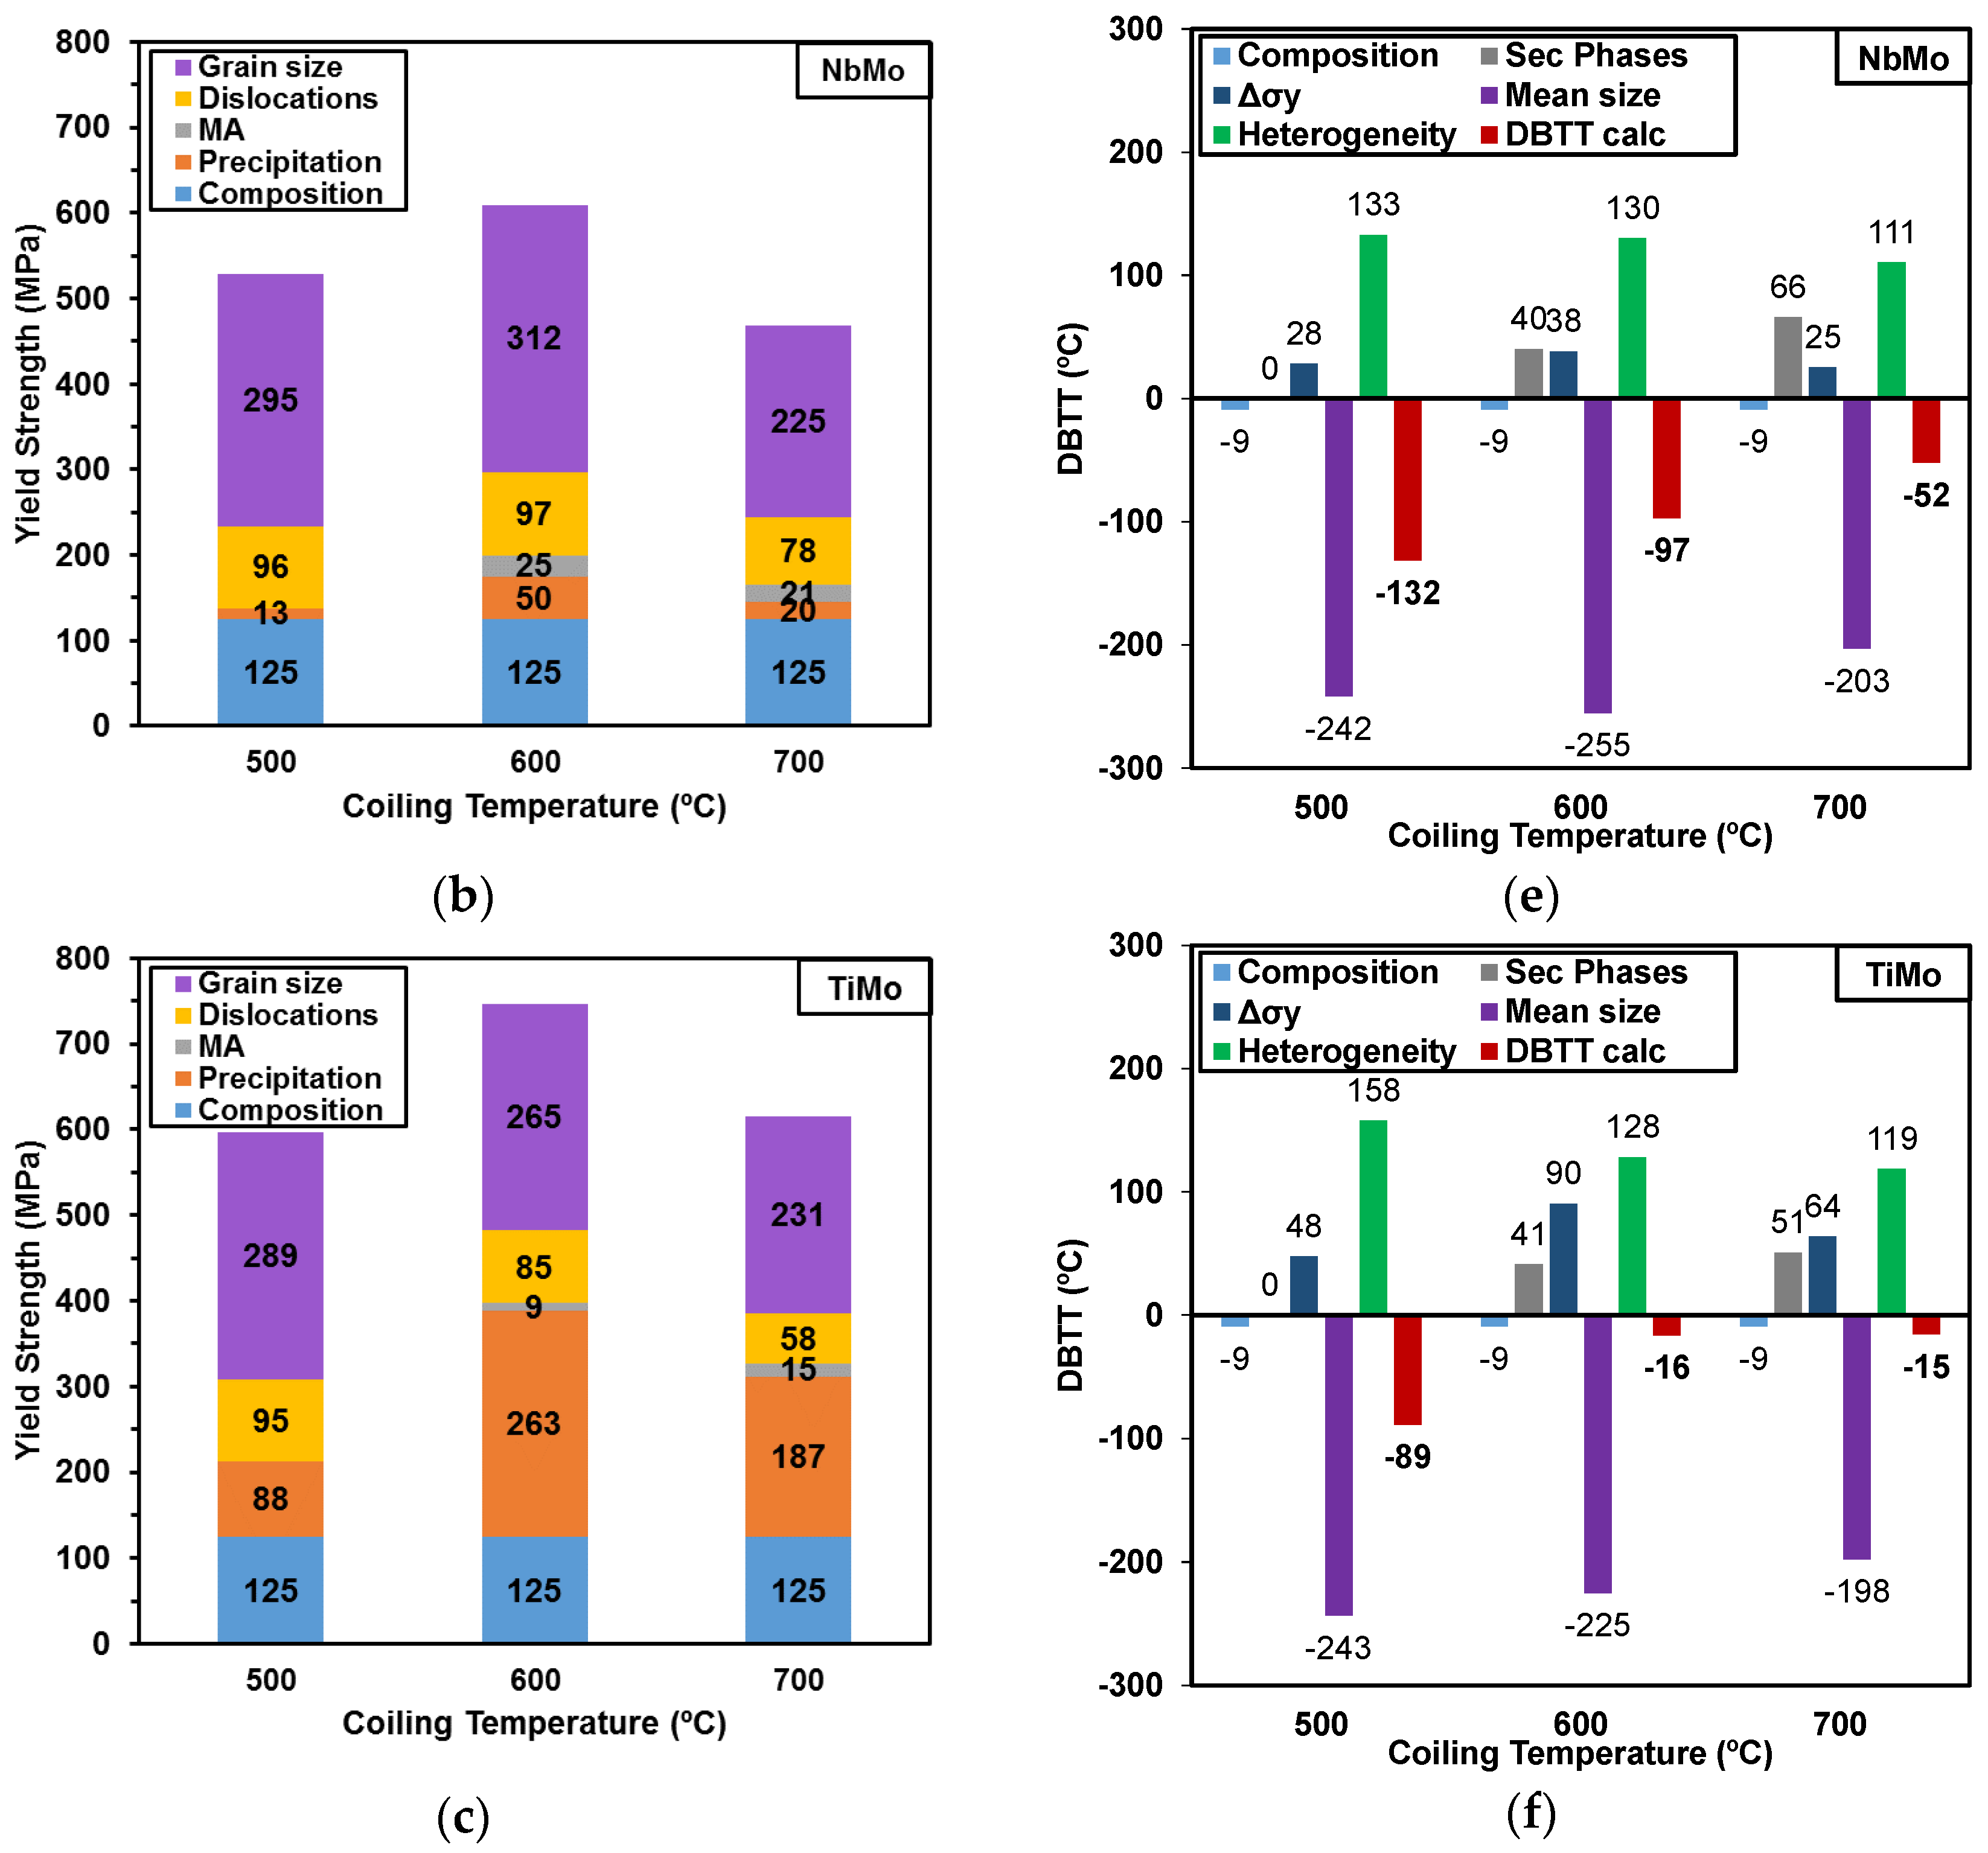
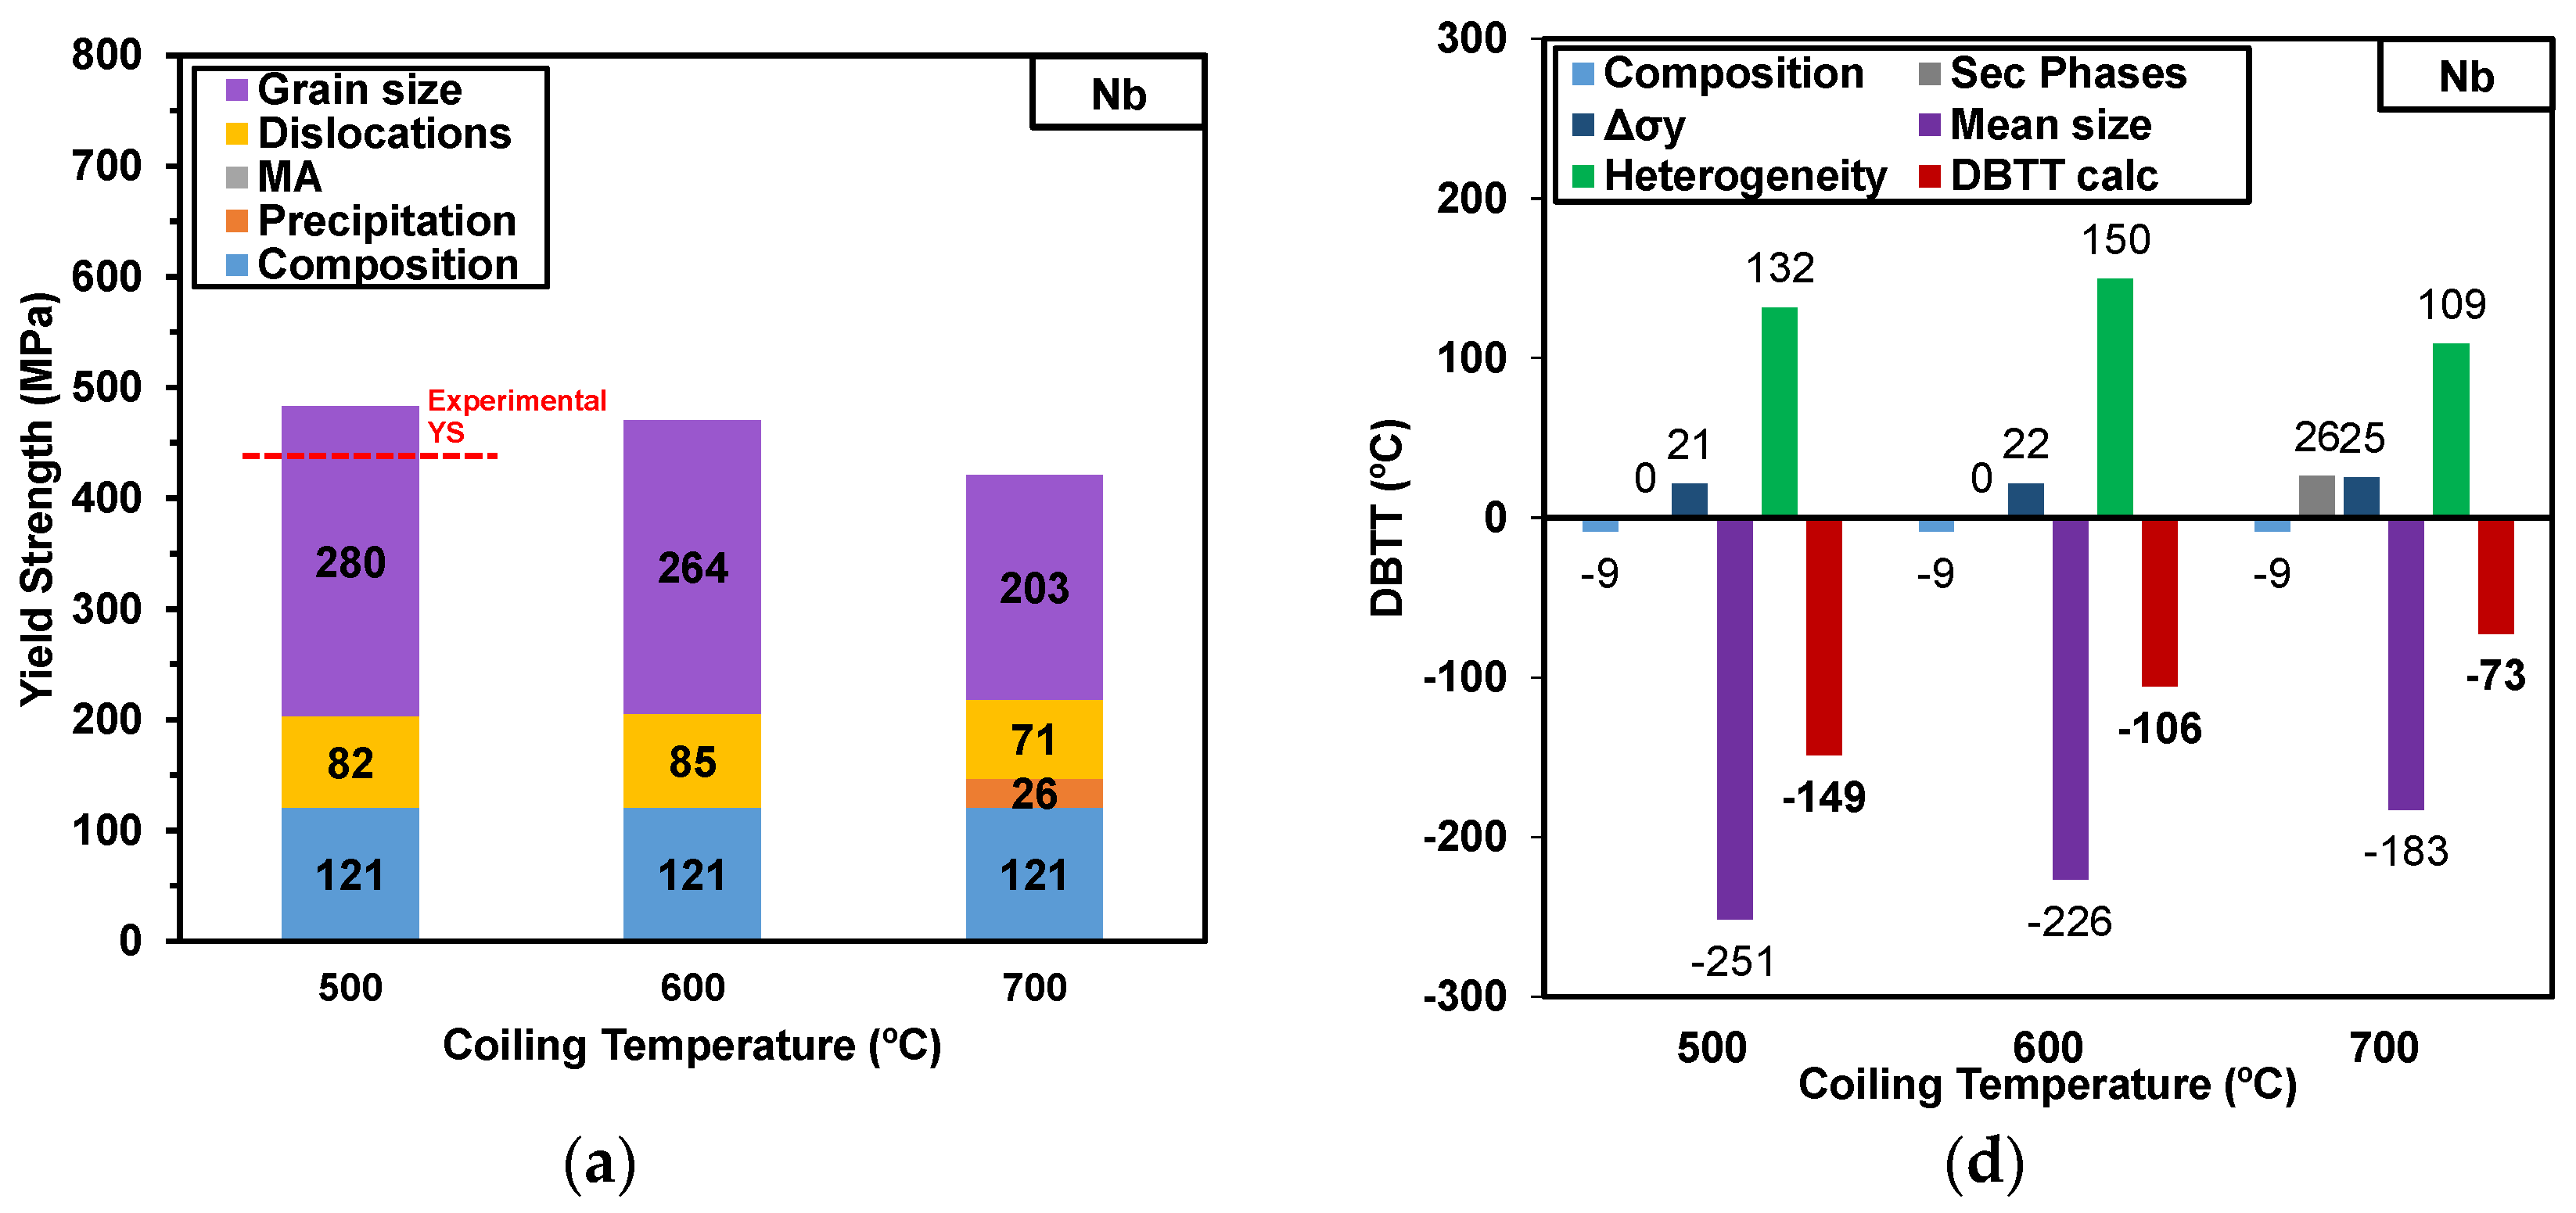
3.3.1. Yield Strength Prediction

The yield strength of low carbon microalloyed steels can be described as a combination of different strengthening contributions. Although the most widely used approach is based on a linear summation of the contributions [29,30,31], several non-linear relationships, which consider the interaction of different strengthening mechanisms, have also been reported in the literature [27,32]. In the present study, a linear approach based on the sum of the contributions (solid solution [33], grain size [15], dislocations [10], presence of secondary phases [34] and fine precipitation [35]) has been considered (see Equation (3)). To estimate the individual contributions, equations previously reported in the literature have been employed and are listed in Equations (4)–(8) (see Nomenclature for symbol description). A more detailed description of the expressions can be found in [36]. For this study, due to the lack of an accurate measurement of precipitate volume fraction, the contribution of fine precipitation (σppt) was estimated by subtracting the strengthening associated with all the other contributions from the experimental yield strength.
General :   σ y = σ 0 +   σ ss +   σ gs +   σ ρ +   σ MA +   σ ppt
Solid   solution :   σ ss = σ 0   +   32.3 Mn   +   83.2 Si   +   11 Mo   +   354   ( % N free ) 0.5
Grain   size :   σ gs = 1.05 α M μ b [ 2 θ i 15 ° f i θ i + π 10 θ i 15 ° f i ] D 2 ° 0.5
Dislocations :   σ ρ = α M μ b ρ ,   where   ρ = 2 ϑ u b
MA   islands :   σ MA = 900 f M A
Precipitation :   σ ppt = 10.8 f v 0.5 x ln ( x 6.125 × 10 4 )
According to the Equations (3)–(8), the influence of each strengthening mechanism in yield strength has been plotted in Figure 10a–c as a function of coiling temperature. Concerning the Nb and NbMo steels, Figure 10a,b illustrates that the most predominant strengthening mechanism is related to grain size refinement, obtaining contributions from 203 to 312 MPa. It is clearly noticed that adding Mo (in Nb steel) and reducing the coiling temperature led to the increment of the term related to grain size. With regard to the influence of the strengthening contribution due to dislocation density, Figure 10a,b shows that this term increases as the coiling temperature decreases as it is associated with the formation of more non-polygonal or bainitic phases. Therefore, the NbMo steel shows a slightly higher effect relative to dislocations when compared to the Nb steel. This could be explained by the effect of Mo in the delay of phase transformations, providing the formation of more bainitic phases with a bigger dislocation density. In terms of the effect of fine precipitation, no significant contribution is observed in the Nb microalloyed steel in the entire range of coiling temperature. It is worth emphasizing that, in both Nb-based grades, the amount of this element is relatively too low (~0.035%) to have an important role in precipitation hardening. In the 500 °C coiling temperature prediction, the model overestimates the experimental values by 49 MPa by adding the measured contribution (the experimental value is indicated in Figure 10a). When Mo is added, a slightly higher contribution of precipitates is observable, reaching a maximum contribution of 50 MPa at the intermediate coiling temperature of 600 °C.
The trends observed in the TiMo microalloyed steel differ noticeably. In this case, the two most important strengthening contributions are due to grain size and fine precipitation. Even though similar terms related to grain size are shown in Figure 10c, a considerably higher precipitation contribution has been estimated for the TiMo microalloyed steel in all the coiling temperatures. Additionally, it is observed that the highest precipitation contribution is reached at the coiling temperature of 600 °C (263 MPa), where the maximum yield strength value of 747 MPa was measured. Similar precipitation contributions in the range of 220–320 MPa have been recently reported in other studies, defining 620 °C as the optimal coiling temperature, at which the best combination between tensile and toughness properties are achieved [37]. Nevertheless, at the lowest coiling temperature of 500 °C, precipitation hardening drops considerably from 263 MPa to 88 MPa. Other works also report less effective precipitation hardening at low coiling temperatures [36,38].

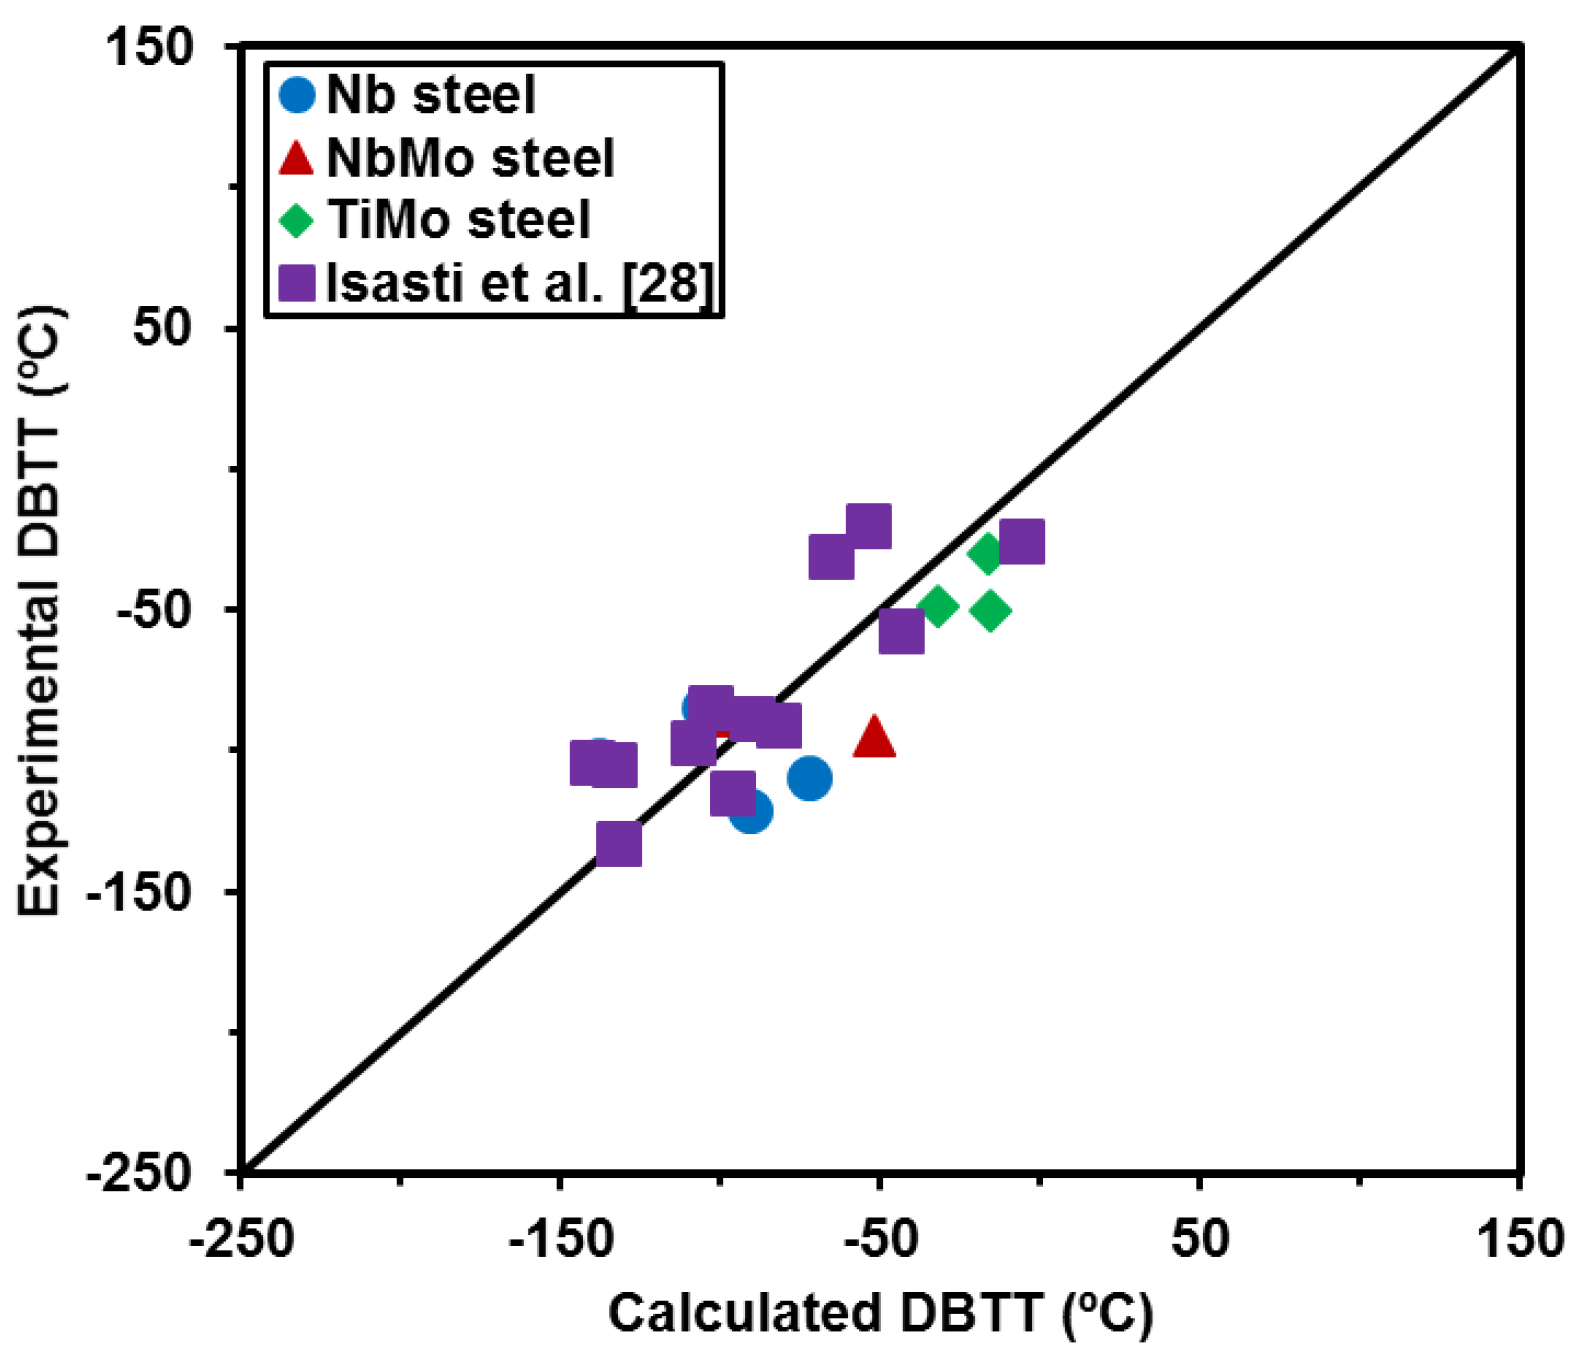
3.3.2. DBTT Prediction

Several relationships have been proposed in the literature for predicting impact transition temperatures [33,39]. In a recent study on low carbon Nb and NbMo microalloyed steels [28], the classical empirical equation proposed by Pickering and Gladman [33] was modified in order to take into account the effect of microstructural heterogeneity and the presence of hard secondary phases such as MA islands.
In the present study, higher transition temperatures were experimentally measured when compared to predictions calculated with the equation proposed in Reference [28]. This underestimation of DBTT values is mainly relevant for the TiMo steel, due to a significantly higher contribution of the term related to fine precipitation and dislocation density (Δσy = σρ + σppt), which is considerably lower for the Nb and NbMo steels. The increment in transition temperature by the increase in Δσy is reported as having different values, depending on the source. Gladman et al. [40] reported an increase in yield strength of 0.35 °C·MPa−1, whereas Gray [41] reported a value of 0.55 °C·MPa−1. Pickering [42] noted different effects of Δσy according to microstructure morphology. Pickering [42] noticed that a lower increase in yield strength is obtained for a bainitic microstructure (or acicular ferrite) than for a polygonal ferritic microstructure. An effect of 0.45 °C·MPa−1 is observed by Pickering for a ferritic phase, while this effect is reduced to 0.26 °C·MPa−1 for a bainitic one [42]. In the current study, in order to minimize the underestimation of the impact transition temperature, the detrimental contribution of Δσy to DBTT has been set at 0.26 °C·MPa−1 for all the steels and microstructures analyzed. By modifying the weight of the term related to precipitation and dislocations, the definition of new prefactors for the MA island size and heterogeneity terms were fitted from the experimental DBTT temperatures and resulted in values equal to 18 and 63, respectively. The modified equation is able to predict impact transition temperatures (DBTT), and shown in Equation (9):
DBTT   ( ) = 11 Mn + 42 Si + 700 ( N free ) 0.5 + 15 ( pct   Pearlite + pct   MA ) 1 3 + 0.26 Δ σ y 14 ( D 15 ° ) 0.5 + 63 ( D c 20 % D 15 ° ) 0.5 + 18 ( D MA ) 0.5 42
The first two terms in Equation (9) are related to the solid solution contribution. Nitrogen is considered to be precipitated by forming the undissolved and strain-induced niobium carbonitrides, and in the case of the TiMo steel, all nitrogen is tied by titanium due to its hyperstoichiometric composition. Consequently, free nitrogen is considered to be zero at room temperature for all the chemical compositions. The percent of secondary phases is the sum of the fraction of pearlite and MA islands. D15° refers to the effective cleavage unit size (see Figure 3b) and DMA is the size of the formed MA islands. Finally, the influence of heterogeneity is included by introducing the Dc20%/D15° factor (Figure 4). The comparison between the experimental DBTT values and the prediction calculated by Equation (9) is shown in Figure 11. The results obtained by Isasti et al. [28] have been included in the graph and computed to fix the constants. An accurate estimation of DBTT values is obtained for all the steels and different coiling temperatures studied.
Regarding toughness, the values of the individual contribution to DBTT are represented in Figure 10d–f for each chemical composition (Nb, NbMo and TiMo steels, respectively) and the entire range of coiling temperatures. The predicted impact transition temperature according to Equation (9) has also been plotted in red. It is clear that the contribution related to grain size is the most relevant term, and in conjunction with composition, they are the only mechanisms that enhance the toughness properties. The term associated with unit size refinement ranges between 183 and 251 °C. The fine precipitates and dislocation density (included in the Δσy term) result in an increment in the DBTT temperature. Regarding Δσy, the term varies considerably depending on the chemical composition and coiling temperature. The lowest Δσy values are measured for the Nb steel, followed by the NbMo and TiMo steels. Moreover, the results plotted in Figure 10 suggest that the maximum precipitation + dislocation term is reached at the intermediate coiling temperature of 600 °C for both steels containing Mo (see Figure 10b,c). For example, in the TiMo steel, the contribution associated with Δσy is about 64, 90 and 48 °C, after a coiling at 700, 600 and 500 °C, respectively. This trend could be attributed to more effective precipitation at the intermediate coiling temperature of 600 °C relative to the other coiling temperatures.
In addition to grain size, composition and the increase in yield strength, the contribution of heterogeneity as well as secondary phases has to be taken into account. Both contributions cause an increment in DBTT. In Figure 10, the contribution related to heterogeneity varies from 109 to 158 °C and increases as the coiling temperature decreases. Finally, the term concerning secondary phases includes a fraction of pearlite, a fraction of MA microconstituent and a mean size of MA islands. It is observed that the detrimental effect of the secondary phase is higher in the NbMo and TiMo steels than in the Nb steel, mainly at the highest coiling temperature of 700 °C. This contribution might cause a shift of 40–60 °C. Obviously, steel cleanliness is a key factor in controlling toughness properties. Different combinations of titanium oxides and nitrides were detected (see Figure 9) as trigger points for brittle fracture initiation.

4. Conclusions

A complete microstructural characterization procedure using EBSD and TEM is described to quantitatively evaluate the different mechanisms affecting yield strength and impact toughness. The proposed analysis and quantification methods are valid for the whole range of chemical composition and microstructures analyzed.
The quantification of each strengthening contribution has shown that crystallographic unit sizes play a major role up to 50%–70% of the yield strength, especially for the Nb and NbMo steels. Precipitation strengthening, together with average grain size, becomes predominant for the TiMo steel. Very fine interphase precipitation was detected in the TiMo showing a high volume fraction. The distribution of the nanoprecipitates varies from interphase row precipitates formed during austenite to ferrite decomposition to more randomly distributed particles within a non-polygonal matrix. The combination of Nb and Mo in the NbMo steel reduces the precipitate sizes and therefore increases the strengthening contribution of fine carbides precipitated at intermediate temperatures, showing a maximum for the intermediate coiling temperature of 600 °C. In this case, the spatial distribution is more random, as the transformed matrix is composed of granular and quasipolygonal bainite.
A study of the influence of coiling temperatures and chemical composition on impact toughness was also performed. In addition to mechanisms such as mean crystallographic unit sizes, secondary phase fractions, precipitation and the effect of dislocation density strengthening on transition temperatures, the impact of microstructural heterogeneity and MA island sizes has been expanded from a previously reported equation. The modified model for predicting the ductile–brittle transition temperature shows that the effect of precipitation strengthening on impact toughness when very high values are reached, such as the ones in the TiMo steel, is lower than 0.5·Δσy and it has been fixed at 0.26·Δσy, which is valid for the three steels.

Acknowledgments

The authors acknowledge a research grant from the European Commission Research Fund for Coal and Steel (RFSR-CT-2013-00007) as well as the financial support of the Basque Government (PI-2014-1-129).

Author Contributions

Gorka Larzabal carried out the experiments and wrote the manuscript; Nerea Isasti analyzed the data and wrote the manuscript; Jose M. Rodriguez-Ibabe supervised the results and edited the manuscript; Pello Uranga managed the project and edited the manuscript.

Conflicts of Interest

The authors declare no conflict of interest.

Nomenclature

σyYield Strength
σ0Lattice friction stress
σssStrengthening contribution due to solid solution
σgsStrengthening contribution due to grain size
σρStrengthening contribution due to dislocations
σpptStrengthening contribution due to precipitation
σMAStrengthening contribution due to MA islands
αNumerical factor
MTaylor factor
µShear modulus
bBurgers vector magnitude
fiRelative frequency
θiMisorientation angle in the interval i
DMean unit size using the 2° low angle boundary criterion
ρDislocation density
ϑKernel average misorientation
uUnit length related to Kernel
fMAVolume fraction of MA islands
fvVolume fraction of precipitates
xMean planar intercept diameter of the particles

References

  1. Jansto, S.G. Niobium-bearing steel development for value-added structural applications. In New Developments on Metallurgy and Applications of High Strength Steels; TMS: Warrendale, PA, USA, 2008; pp. 1313–1326. [Google Scholar]
  2. Isasti, N.; Jorge-Badiola, D.; Taheri, M.L.; Uranga, P. Phase transformation study in Nb-Mo microalloyed steels using dilatometry and EBSD quantification. Metall. Mater. Trans. A 2013, 44, 3552–3563. [Google Scholar] [CrossRef]
  3. Huang, B.M.; Yang, J.R.; Huang, C.Y. The synergistic effect of niobium-molybdenum additions on the microstructure of low-carbon bainitic steel. In Fundamentals and Applications of Mo and Nb Alloying in High Performance Steels, 2nd ed.; Mohrbacher, H., Ed.; CBMM, IMOA and TMS: Liège, Belgium, 2015; Volume 2, pp. 29–51. [Google Scholar]
  4. Cizek, P.; Wynne, B.P.; Davies, C.H.J.; Hodgson, P.D. The Effect of Simulated Thermomechanical Processing on the Transformation Behavior and Microstructure of a Low-Carbon Mo-Nb Linepipe Steel. Metall. Mater. Trans. A 2015, 46, 407–425. [Google Scholar] [CrossRef]
  5. Funakawa, Y.; Shiozaki, T.; Tomita, K.; Yamamoto, T.; Maeda, E. Development of High Strength Hot-rolled Sheet Steel Consisting of Ferrite and Nanometer-sized Carbides. ISIJ Int. 2004, 44, 1945–1951. [Google Scholar] [CrossRef]
  6. Mintz, B.; Peterson, G.; Nassar, A. Structure-property relationships in ferrite-perlite steels. Ironmak. Steelmak. 1994, 21, 215–222. [Google Scholar]
  7. Wallin, K. Modified Tank Fitting Algorithm for Charpy Impact Data; Research Seminar on Economical and Safe Application of Modern Steels for Pressure Vessels: Aachen, Germany, 2003. [Google Scholar]
  8. Araki, T.; Kozasu, I.; Tankechi, H.; Shibata, K.; Enomoto, M.; Tamehiro, H. Atlas for Bainitic Microstructures; ISIJ: Tokyo, Japan, 1992; Volume 1. [Google Scholar]
  9. Isasti, N.; Jorge-Badiola, D.; Taheri, M.L.; Uranga, P. Microstructural and Precipitation Characterization in Nb-Mo Microalloyed Steels: Estimation of the Contributions to the Strength. Met. Mater. Int. 2014, 20, 807–817. [Google Scholar] [CrossRef]
  10. Kubin, L.P.; Mortensen, A. Geometrically necessary dislocations and strain-gradient plasticity: A few critical issues. Scr. Mater. 2003, 48, 119–125. [Google Scholar] [CrossRef]
  11. Isasti, N.; Badiola, D.J.; Alkorta, J.; Uranga, P. Analysis of Complex Steel Microstructures by High-Resolution EBSD. JOM 2016, 68, 215–223. [Google Scholar] [CrossRef]
  12. Roberts, M.J. Effect of transformation substructure on the strength and toughness of Fe-Mn alloys. Metall. Trans. 1970, 1, 3287–3294. [Google Scholar]
  13. Wang, R.; García, C.I.; Hua, M.; Cho, K.; Zhang, H.; Deardo, A.J. Microstructure and Precipitation Behavior of Nb, Ti Complex Microalloyed Steel Produced by Compact Strip Processing. ISIJ Int. 2006, 46, 1345–1353. [Google Scholar] [CrossRef]
  14. Garcia-Mateo, C.; Caballero, F.G.; Capdevilla, C.; de Andres, C.G. Estimation of dislocation density in bainitic microstructures using high-resolution dilatometry. Scr. Mater. 2009, 61, 855–858. [Google Scholar] [CrossRef]
  15. Iza-Mendia, A.; Gutiérrez, I. Generalization of the existing relations between microstructure and yield stress from ferrite–pearlite to high strength steels. Mater. Sci. Eng. A 2013, 561, 40–51. [Google Scholar] [CrossRef]
  16. Lee, W.B.; Hong, S.G.; Park, C.G.; Park, S.H. Carbide Precipitation and High-Temperature Strength of Hot-rolled High-Strength, Low-Alloy Steels Containing Nb and Mo. Met. Mater. Trans. A 2002, 33, 1689–1698. [Google Scholar] [CrossRef]
  17. Wada, H.; Pehlke, R.D. Nitrogen solubility and nitride formation in austenitic Fe-Ti alloys. Metall. Trans. B 1985, 16, 815–822. [Google Scholar] [CrossRef]
  18. Akben, M.G.; Bacroix, B.; Jonas, J.J. Effect of Vanadium and Molybdenum addition on High Temperature Recovery, Recrystallization and Precipitation Behavior of Niobium-based Microalloyed Steels. Acta Metall. 1983, 31, 161–174. [Google Scholar] [CrossRef]
  19. Chen, C.Y.; Yen, H.W.; Kao, F.H.; Li, W.C.; Huang, C.Y.; Yang, J.R.; Wang, S.H. Precipitation hardening of high-strength low-alloy steels by nanometer-sized carbides. Mater. Sci. Eng. A 2009, 499, 162–166. [Google Scholar] [CrossRef]
  20. Wang, Z.; Zhang, H.; Guo, C.; Liu, W.; Yang, Z.; Sun, X.; Zhang, Z.; Jiang, F. Effect of molybdenum addition on the precipitation of carbides in the austenite matrix of titanium micro-alloyed steels. Mater. Sci. 2016, 51, 4996–5007. [Google Scholar] [CrossRef]
  21. Chen, M.Y.; Gouné, M.; Verdier, M.; Bréchet, Y.; Yang, J.R. Interphase precipitation in vanadium-alloyed steels: Strengthening contribution and morphological variability with austenite to ferrite transformation. Acta Mater. 2014, 64, 78–92. [Google Scholar] [CrossRef]
  22. Bu, F.Z.; Wang, X.M.; Yang, S.W.; Shang, C.J.; Misra, R.D.K. Contribution of interphase precipitation on yield strength in thermomechanically simulated Ti–Nb and Ti–Nb–Mo microalloyed steels. Mater. Sci. Eng. A 2015, 620, 22–29. [Google Scholar] [CrossRef]
  23. Ariga, T.; Funakawa, Y.; Uchida, Y. High-Tensile-Strength Hot-Rolled Plated Steel Sheet and Method for Producing Same. Patent WO 2013/069210A1, 16 May 2013. [Google Scholar]
  24. Xu, Y.; Zhang, W.; Sun, M.; Yi, H.; Liu, Z. The blocking effects of interphase precipitation on dislocations’ movement in Ti-bearing micro-alloyed steels. Mater. Lett. 2015, 139, 177–181. [Google Scholar] [CrossRef]
  25. Mukherjee, S.; Timokhina, I.B.; Zhu, C.; Ringer, S.P.; Hodgson, P.D. Three-dimensional atom probe microscopy study of interphase precipitation and nanocluster in thermomechanically treated titanium-molybdenum steels. Acta Mater. 2013, 61, 2521–2530. [Google Scholar] [CrossRef]
  26. Hua, J.; Dua, L.X.; Wang, J.J. Effect of cooling procedure on microstructures and mechanical properties of hot rolled Nb-Ti bainitic high strength steel. Mater. Sci. Eng. 2012, 554, 79–85. [Google Scholar] [CrossRef]
  27. Yen, H.W.; Chen, P.Y.; Huang, C.Y.; Yang, J.R. Interphase precipitation of nanometer-sized carbides in a titanium-molybdenum-bearing low-carbon steel. Acta Mater. 2011, 59, 6264–6274. [Google Scholar] [CrossRef]
  28. Isasti, N.; Jorge-Badiola, D.; Taheri, M.L.; Uranga, P. Microstructural Features Controlling Mechanical Properties in Nb-Mo Microalloyed Steels. Part II: Impact Toughness. Metall. Mater. Trans. 2014, 45, 4972–4982. [Google Scholar] [CrossRef]
  29. Gladman, T. The Physical Metallurgy of Microalloyed Steels, 2nd ed.; The Institute of Materials: London, UK, 1997. [Google Scholar]
  30. Pickering, F.B. Physical Metallurgy and the Design of Steels; Applied Science Publishers Ltd.: London, UK, 1978. [Google Scholar]
  31. Peng, Z.; Li, L.; Gao, J.; Huo, X. Precipitation strengthening of titanium microalloyed high-strength steel plates with isothermal treatment. Mater. Sci. Eng. 2016, 657, 413–421. [Google Scholar] [CrossRef]
  32. Yakubtsov, I.A.; Boyd, J.D.; Liu, W.J.; Essadiqui, E. Strengthening mechanism in dual-phase acicular ferrite+M/A microstructure. In Proceedings of the 42nd Mechanical Working and Steel Processing Conference, Iron and Steel Society/AIME, Toronto, ON, Canada, 2000; pp. 429–439.
  33. Pickering, F.B.; Gladman, T. Metallurgical Developments in Carbon Steels; Special Report No. 81; Iron and Steel Institute: London, UK, 1963. [Google Scholar]
  34. Bush, M.E.; Kelly, P.M. Strengthening mechanisms in bainitic steels. Acta Metall. 1971, 19, 1363–1372. [Google Scholar] [CrossRef]
  35. Gladman, T. Precipitation hardening in metals. Mater. Sci. Technol. 1999, 15, 30–36. [Google Scholar] [CrossRef]
  36. Isasti, N.; Jorge-Badiola, D.; Taheri, M.L.; Uranga, P. Microstructural Features Controlling Mechanical Properties in Nb-Mo Microalloyed Steels. Part I: Yield Strength. Metall. Mater. Trans. 2014, 45, 4960–4971. [Google Scholar] [CrossRef]
  37. Kim, Y.W.; Song, S.W.; Seo, S.J.; Hong, S.G.; Lee, C.S. Development of Ti and Mo micro-alloyed hot-rolled high strength sheet steel by controlling thermomechanical controlled processing schedule. Mater. Sci. Eng. 2013, 565, 430–438. [Google Scholar] [CrossRef]
  38. Zhang, K.; Li, Z.; Wang, Z.; Sun, X.; Yong, Q. Precipitation behavior and mechanical properties of hot-rolled high strength Ti-Mo-bearing ferritic sheet steel: The great potential of nanometer-sized (Ti, Mo)C carbide. Mater. Res. 2016, 31, 1254–1263. [Google Scholar] [CrossRef]
  39. Gutiérrez, I. Effect of microstructure on the impact toughness of Nb-microalloyed steel: Generalisation of existing relations from ferrite-pearlite to high strength microstructures. Mater. Sci. Eng. 2013, 571, 57–67. [Google Scholar] [CrossRef]
  40. Gladman, T.; Holmes, B.; McIvor, I.D. Effects of Second Phase Particles on Strength, Toughness and Ductility; The Iron and Steel Institute: London, UK, 1971; p. 68. [Google Scholar]
  41. Gray, J.M. Strength-Toughness Relations for Precipitation-Strengthened Low-Alloy Steels Containing Columbium. Metall. Mater. Trans. 1972, 3, 1495–1500. [Google Scholar] [CrossRef]
  42. Pickering, F.B. The optimization of microstructures in steel and their relationship to mechanical properties. In Hardenability Concepts with Applications to Steel; Doane, D.V., Kirkaldy, J.S., Eds.; AIME: New York, NY, USA, 1978; pp. 179–228. [Google Scholar]
Figure 1. Schematic of the thermomechanical schedule.
Metals 07 00065 g001
Figure 2. (a,b) IPF (Inverse Pole Figure) and (c,d) grain boundary maps obtained via EBSD in: TiMo (a,c); and NbMo (b,d) steels for a coiling temperature of 600 °C.
Metals 07 00065 g002
Figure 3. Influence of coiling temperature and chemical composition on the average unit size, using different threshold misorientation criteria: (a) low angle (2°); and (b) high angle (15°) boundaries.
Metals 07 00065 g003
Figure 4. (a) Accumulated area fraction using a 15° misorientation criterion for the TiMo steel; and (b) evolution of the Dc20%/D15° parameter as a function of the coiling temperature.
Metals 07 00065 g004
Figure 5. (a,b) Kernel maps obtained after a coiling temperature of 600 °C for NbMo and TiMo steels, respectively; and (c) dislocation density as a function of coiling temperature for all the microalloyed steels.
Metals 07 00065 g005
Figure 6. Presence of fine precipitates in the microstructures after coiling temperature of 700 °C for different steels: (a) Nb (NbC); (b) NbMo ((Nb, Mo)C); and (c) TiMo ((Ti, Mo)C).
Metals 07 00065 g006
Figure 7. (a,b) Presence of interphase precipitation in the TiMo steel after coiling at 700 °C; and (c) random precipitation at 600 °C.
Metals 07 00065 g007
Figure 8. Evolution of the: yield strength (a); and tensile strength (b) as a function of coiling temperature.
Metals 07 00065 g008
Figure 9. (a) Absorbed energy as a function of test temperature with a coiling temperature of 700 °C. (b,c) Fracture images corresponding to the TiMo steel and a coiling temperature of 700 °C, showing the origin of the brittle fracture.
Metals 07 00065 g009
Figure 10. (ac) Individual contributions (grain size, dislocations, MA islands, precipitation and composition) weighted according to Equation (3) for each coiling temperature. (df) Estimated contributions to the DBTT as a function of the coiling temperature and for all the microalloyed steels: (a,d) Nb; (b,e) NbMo; and (c,f) TiMo.
Metals 07 00065 g010aMetals 07 00065 g010b
Figure 11. Comparison between experimental and calculated DBTT values predicted by Equation (9). The results obtained by Isasti et al. [28] have been included.
Metals 07 00065 g011
Table 1. Chemical composition of the steels (weight percent).
SteelCMnSiPSTiNbMoAlN
Nb0.0401.550.200.0170.006-0.034-0.010.005
NbMo0.0491.600.210.0190.007-0.0350.20.020.007
TiMo0.0481.610.200.0200.0060.09-0.20.020.004
Table 2. Mean size of MA islands, MA fraction and pearlite fraction for each steel and coiling temperature.
SteelTcoiling (°C)Mean Size of MA Islands (µm)MA Fraction (%)Pearlite Fraction (%)
Nb700005.3
NbMo7002.52.313.9
6001.22.80
TiMo7001.91.73.9
6002.11.00
Table 3. Yield Strength (YS), Tensile Strength (TS), Elongation (%) and Area Reduction (%) values for the TiMo, NbMo and Nb steels and coiling temperatures of 700 °C, 600 °C and 500 °C.
SteelTcoiling (°C)YS (MPa)TS (MPa)Elongation (%)Area Reduction (%)
Nb7004214983987
6004685363389
5004345063989
NbMo7004685502882
6006106812685
5005295903390
TiMo7006166742982
6007478072779
5005976652684

