Article

Evolution of Anode Porosity under Air Oxidation: The Unveiling of the Active Pore Size

1
Department of Mining, Metallurgical and Materials Engineering, Laval University, Quebec City, QC G1V 0A6, Canada
2
NSERC/Alcoa Industrial Research Chair MACE3 and Aluminum Research Centre—REGAL, Laval University, Quebec City, QC G1V 0A6, Canada
3
Alcoa Primary Metals, Alcoa Technical Center, 100 Technical Drive, Alcoa Center, New Kensington, PA 15069-0001, USA
*
Author to whom correspondence should be addressed.
Metals 2017, 7(3), 101; https://doi.org/10.3390/met7030101
Submission received: 18 January 2017 / Revised: 14 March 2017 / Accepted: 15 March 2017 / Published: 18 March 2017

Abstract

:
The carbon anode, used in aluminum electrolysis (Hall–Héroult process), is over-consumed by air oxidation and carboxy-reaction (with CO2). Several anode features may affect this over-consumption, such as impurity content, graphitization level and anode porosity features (e.g., porosity volume fraction or pore size distribution). The two first parameters are basically related to the quality of raw materials and coke calcination conditions. Anode porosity is, however, greatly affected by anode manufacturing conditions, and is possible to be modified, to some extent, by adjusting the anode recipe and the processing parameters. This work aims to investigate the effect of anode porosity on its air reactivity. Baked anode samples were prepared in laboratory scale and then crushed into powder form (−4760 + 4000 µm). The recipe for anode preparation was similar to a typical industrial recipe, except that in the lab scale no butt particles were used in the recipe. Anode particles were then gasified at six different conversion levels (0, 5, 15, 25, 35 and 50 wt %) under air at 525 °C. The porosity was characterized in several pore size ranges, measured by nitrogen adsorption and mercury intrusion (0.0014–0.020, 0.002–0.025, 0.025–0.100, 0.1–40.0 and superior at 40 µm). The volume variation of each pore range, as a function of carbon conversion, was assessed and used to determine the size of the most active pores for air oxidation. The most active pore size was found to be the pores inferior at 40 µm before 15 wt % of gasification and pores superior at 40 µm between 15 and 50 wt % of carbon conversion. Limitation of pore size range could be used as an additional guideline, along with other targets such as high homogeneity and density, to set the optimum anode manufacturing parameters.

1. Introduction

Aluminum is produced by the reduction of alumina (Al2O3) in an electrolysis cell at 960 °C, according to the Hall–Héroult process. The cell contains carbon anodes, carbon cathode and molten cryolite as electrolyte. The carbon anode is composed of calcined petroleum coke, used anodes (butts), rejected green and baked anodes, and coal tar pitch. In the electrolysis cell, the anode top is exposed to the ambient air (despite a cover of crushed bath and alumina) and the temperature ranges between 400 and 600 °C [1]. In this range, the oxygen in the air can react with the carbon anode, according to the Equations (1) and (2). Both reactions are undesirable since the carbon anode is consumed without producing metal. Between 8 and 30 wt % of anode is consumed either by the air oxidation (depending on the anode quality and the cell conditions) or by the Boudouard reaction (CO2 + carbon) [2].
C (anode) + O2 (g) → CO2 (g)
2 C (anode) + O2 (g) → 2 CO (g)
Several studies have been published to reveal the essential parameters controlling air oxidation. Air reactivity is correlated with different parameters, i.e., calcination level of coke [3,4,5], air reactivity of the coke itself [6], level of impurities [7,8,9,10] as well as manufacturing parameters such as anode recipe [11,12] and the temperature and soaking time during anode baking [13,14,15,16,17]. Additives may also have an effect on the electrolytic consumption of anodes in aluminum electrolysis [18], possibly leading to correlation of air with electrochemical reactivity [19,20]. Some studies also reported the effect of cell operation conditions on reactivity, i.e., temperature of the anode top, the protection effect of alumina covering [1,21] and current density [22].
Most of these parameters are controlled by the quality of raw materials. Edwards [23] detailed the deterioration of coke quality and the new challenges of aluminum smelters to produce a high quality of anodes. To decrease air oxidation, anode manufacturing steps could be considered to counterbalance the poor properties of raw materials. Tkac [24] proposed that some parameters, such as pitch content, the mixing time of raw materials and the applied pressure during vibro compaction influence air reactivity. These parameters could influence anode oxidation because they may increase anode porosity and favor air burning.
Reports on the effects of pore size distribution on the final properties of anodes are quite rare. Keller and Perruchoud [25] and Fischer and Perruchoud [5] proposed that the pores superior at 50 µm could influence anode permeability, thus indirectly its air reactivity. Pores between 1 and 100 µm in size, could play a role in the impregnation of bath in anodes, thus increasing its CO2 reactivity [26]. The microporosity (pores inferior at 5 µm) could influence the optimum quantity of binder pitch [27]. Thermal desulfurization may result in the creation of small pores (0.1–15 µm) and particularly for pores inferior at 0.1 µm, and affect the anode apparent density [28].
Suriyapraphadilok et al. [29] and Bird et al. [30] have remarked that the interior of anode is modified with air gasification, leading to pore volume variations. Turkdogan [31] proposed that pores larger than a micron in carbon material control air reactivity. For coke materials, the active pore range seems to be range from 0.5 to 15 µm [5]. In the same way, Tran et al. [32] found that the volume of three pore size ranges (inferior to 2 nm, between 2 and 50 nm and superior to 50 nm) increased with gasification percentage. Tordai [33] revealed that anode air burning takes place preferentially in pores ranging between 1 and 10 µm. Chevarin et al. [34] proposed that the air reactivity of industrial carbon anodes might be controlled by pores with a pore entrance radius of 1.5 and 12 µm. Porosity thus seems to have a significant effect on air reactivity of anode material. However, the importance of each pore size during anode gasification was not clearly quantified. This article presents the role of porosity and external surface area of particles in gasification of carbon anodes.

2. Materials and Methods

2.1. Materials

Laboratory-scale prebaked anodes were prepared following a typical recipe used in the anode manufacturing process. The raw materials used in this work were provided by Deschambault aluminum smelting plant (Alcoa, Montreal, QC, Canada). The anode recipe comprised of calcined petroleum coke (86.1 wt %) and coal tar pitch (13.9 wt %). In this lab recipe, butts were not added (Table 1). Fractions of the coke particle are detailed in Table 2. The coke particles were preheated at 185 °C for 90 min and mixed with the pitch. The blend was mixed at the same temperature for 10 min and then pressed at 150 °C for 3 min by applying a uniaxial pressure of 70 MPa [35,36,37]. This sample, called a green anode, had a diameter of 50 mm and an approximate height of 100 mm. Prior to baking in a muffle furnace, the green samples were placed in an Inconel® box and covered with coke particles in order to protect them against air oxidation. The anode sample was heated from room temperature to 150 °C at a heating rate of 60 °C/h, then from 150 to 650 °C at a heating rate of 20 °C/h, and finally from 650 to 1100 °C at a heating rate of 50 °C/h. This was followed by a soaking time of 20 h at 1100 °C. At the end of this cycle, the furnace was switched off and allowed to cool to room temperature. The anode samples were thereafter crushed using jaw and roll crushers and sieved through two different USA standard sieve trays, which were chosen in order to get a narrow particle size range of 4000 to 4760 µm (−4 + 5 US Mesh). The particle size range was chosen to have a representative sampling of the anode; i.e., the largest fraction of particles in the typical industrial recipe was removed from the laboratory recipe since the size of the lab-scale anode was too small to contain particles larger than 4 mm. The anode particle properties are detailed in Table 3.

2.2. Air Reactivity Tests

Two air reactivity tests were performed: a Thermo-Gravimetric Analyzer (Netzsch, Selb, Germany) with an analytical balance (TGA) and a Fixed Bed Reactor (FBR). TGA was used to estimate the apparent reaction rate, r (Equation (3)) of the anode particles by measuring the sample weight loss for a defined time interval (0–7 h) at 525 °C, according to the standard ISO 12989-2. A quartz crucible was used for all thermo-gravimetric (TG) measurements. 50 to 300 mg of anode particles (corresponding to 1 to 3 particles) were gasified under air atmosphere [38,39]. Five gasification tests were performed and the reaction rate was determined using Equation (3)
r =     1 m ( t ) ×   d m d t =     1 ( 1 X ) ×   d X d t  
where: m(t): instantaneous mass at time t; dm: mass loss in the time interval dt; X: carbon conversion at time t.
Since the quantity of the samples used in TGA was too small for analytical instruments, larger amounts of material were gasified in the FBR for further characterizations. A similar methodology was used by Chevarin et al. [40,41]. Between 10 and 40 anode particles (1 to 3 g) were placed in a monolayer (to limit the inter-particular mass transport) in an alumina tray and put in the FBR. The materials were heated under inert atmosphere (N2 gas) until the target temperature was reached. The sample was gasified under air at a similar temperature as TGA at different reaction times (between 1 and 4 h). After a specific duration of carbon conversion, the furnace was switched off and the anode particles were cooled down under inert atmosphere.
To quantify the dusting during the anode oxidation, the gasified carbon particles were sieved through a USA standard sieve (8 US Mesh, 2380 µm; Fisher Scientific Company LLC, Pittsburgh, PA, USA). Then, the portions of the residues were determined; i.e., the residual body of the gasified anode particles superior to 2380 µm, the dust (broken particles and/and fine particles with a size inferior at 2380 µm), and the mass loss due to the combustion of carbon particles (ISO 12989).

2.3. Analytical Instruments

The crystallite size (LC) and the level of impurities were measured by X-Ray Diffraction (XRD) spectrometer (PW 1800 using the ISO standard 20203, PANalytical, formerly Philips Analytical, Almelo, The Netherlands) and X-Ray Fluorescence (XRF) spectrometer (PANalytical Axios max according to the ASTM D4326-06 standard, PANalytical, Almelo, The Netherlands), respectively. The helium density of the anode particles was measured by a Helium-Pycnometer (AccuPyc II 1340, Micromeritics, Norcross, GA, USA). Each sample of about 50 g was weighed by an analytical balance (MS204S, Mettler Toledo, Columbus, OH, USA) and put in the 100 cm3 stainless steel cell of the He-Pycnometer. The helium molecules can penetrate into the submicron pores ranging down to 0.3 nm [42]. Consequently, it is possible to measure the volume of the material excluding the pore volume.
The specific surface area, pore volume and pore size distribution of anode particles were measured by two different techniques [43]:
-
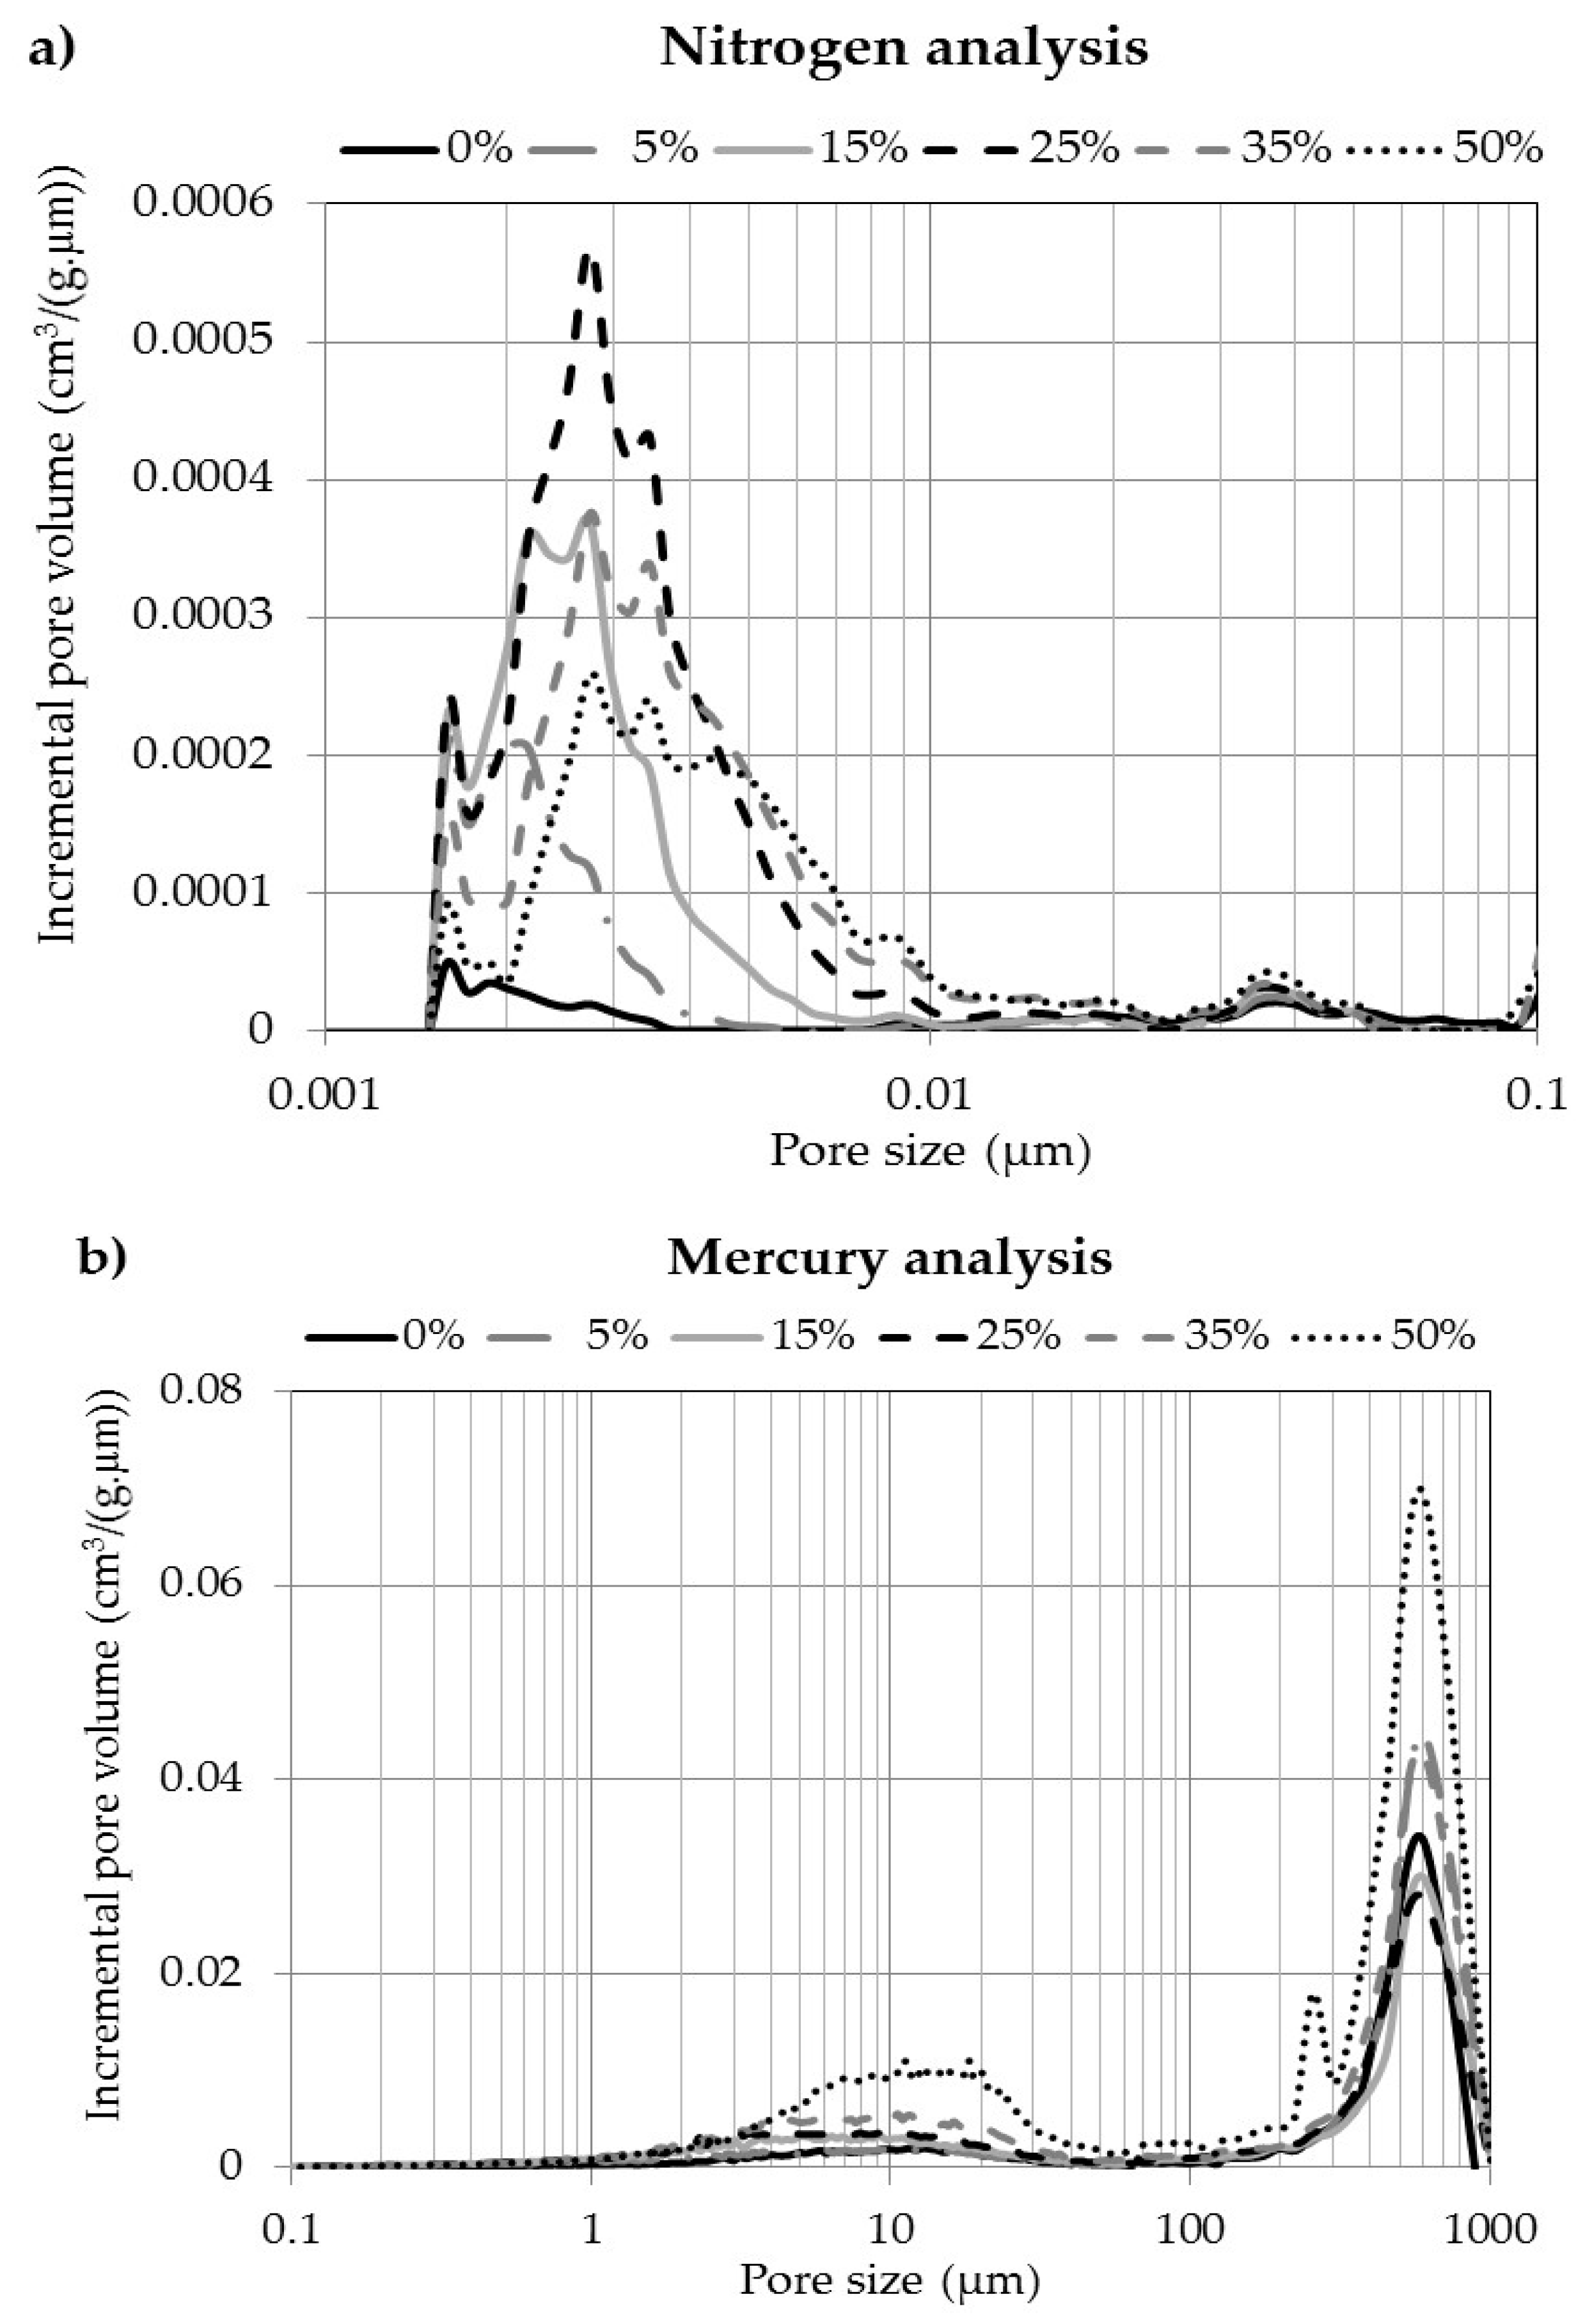
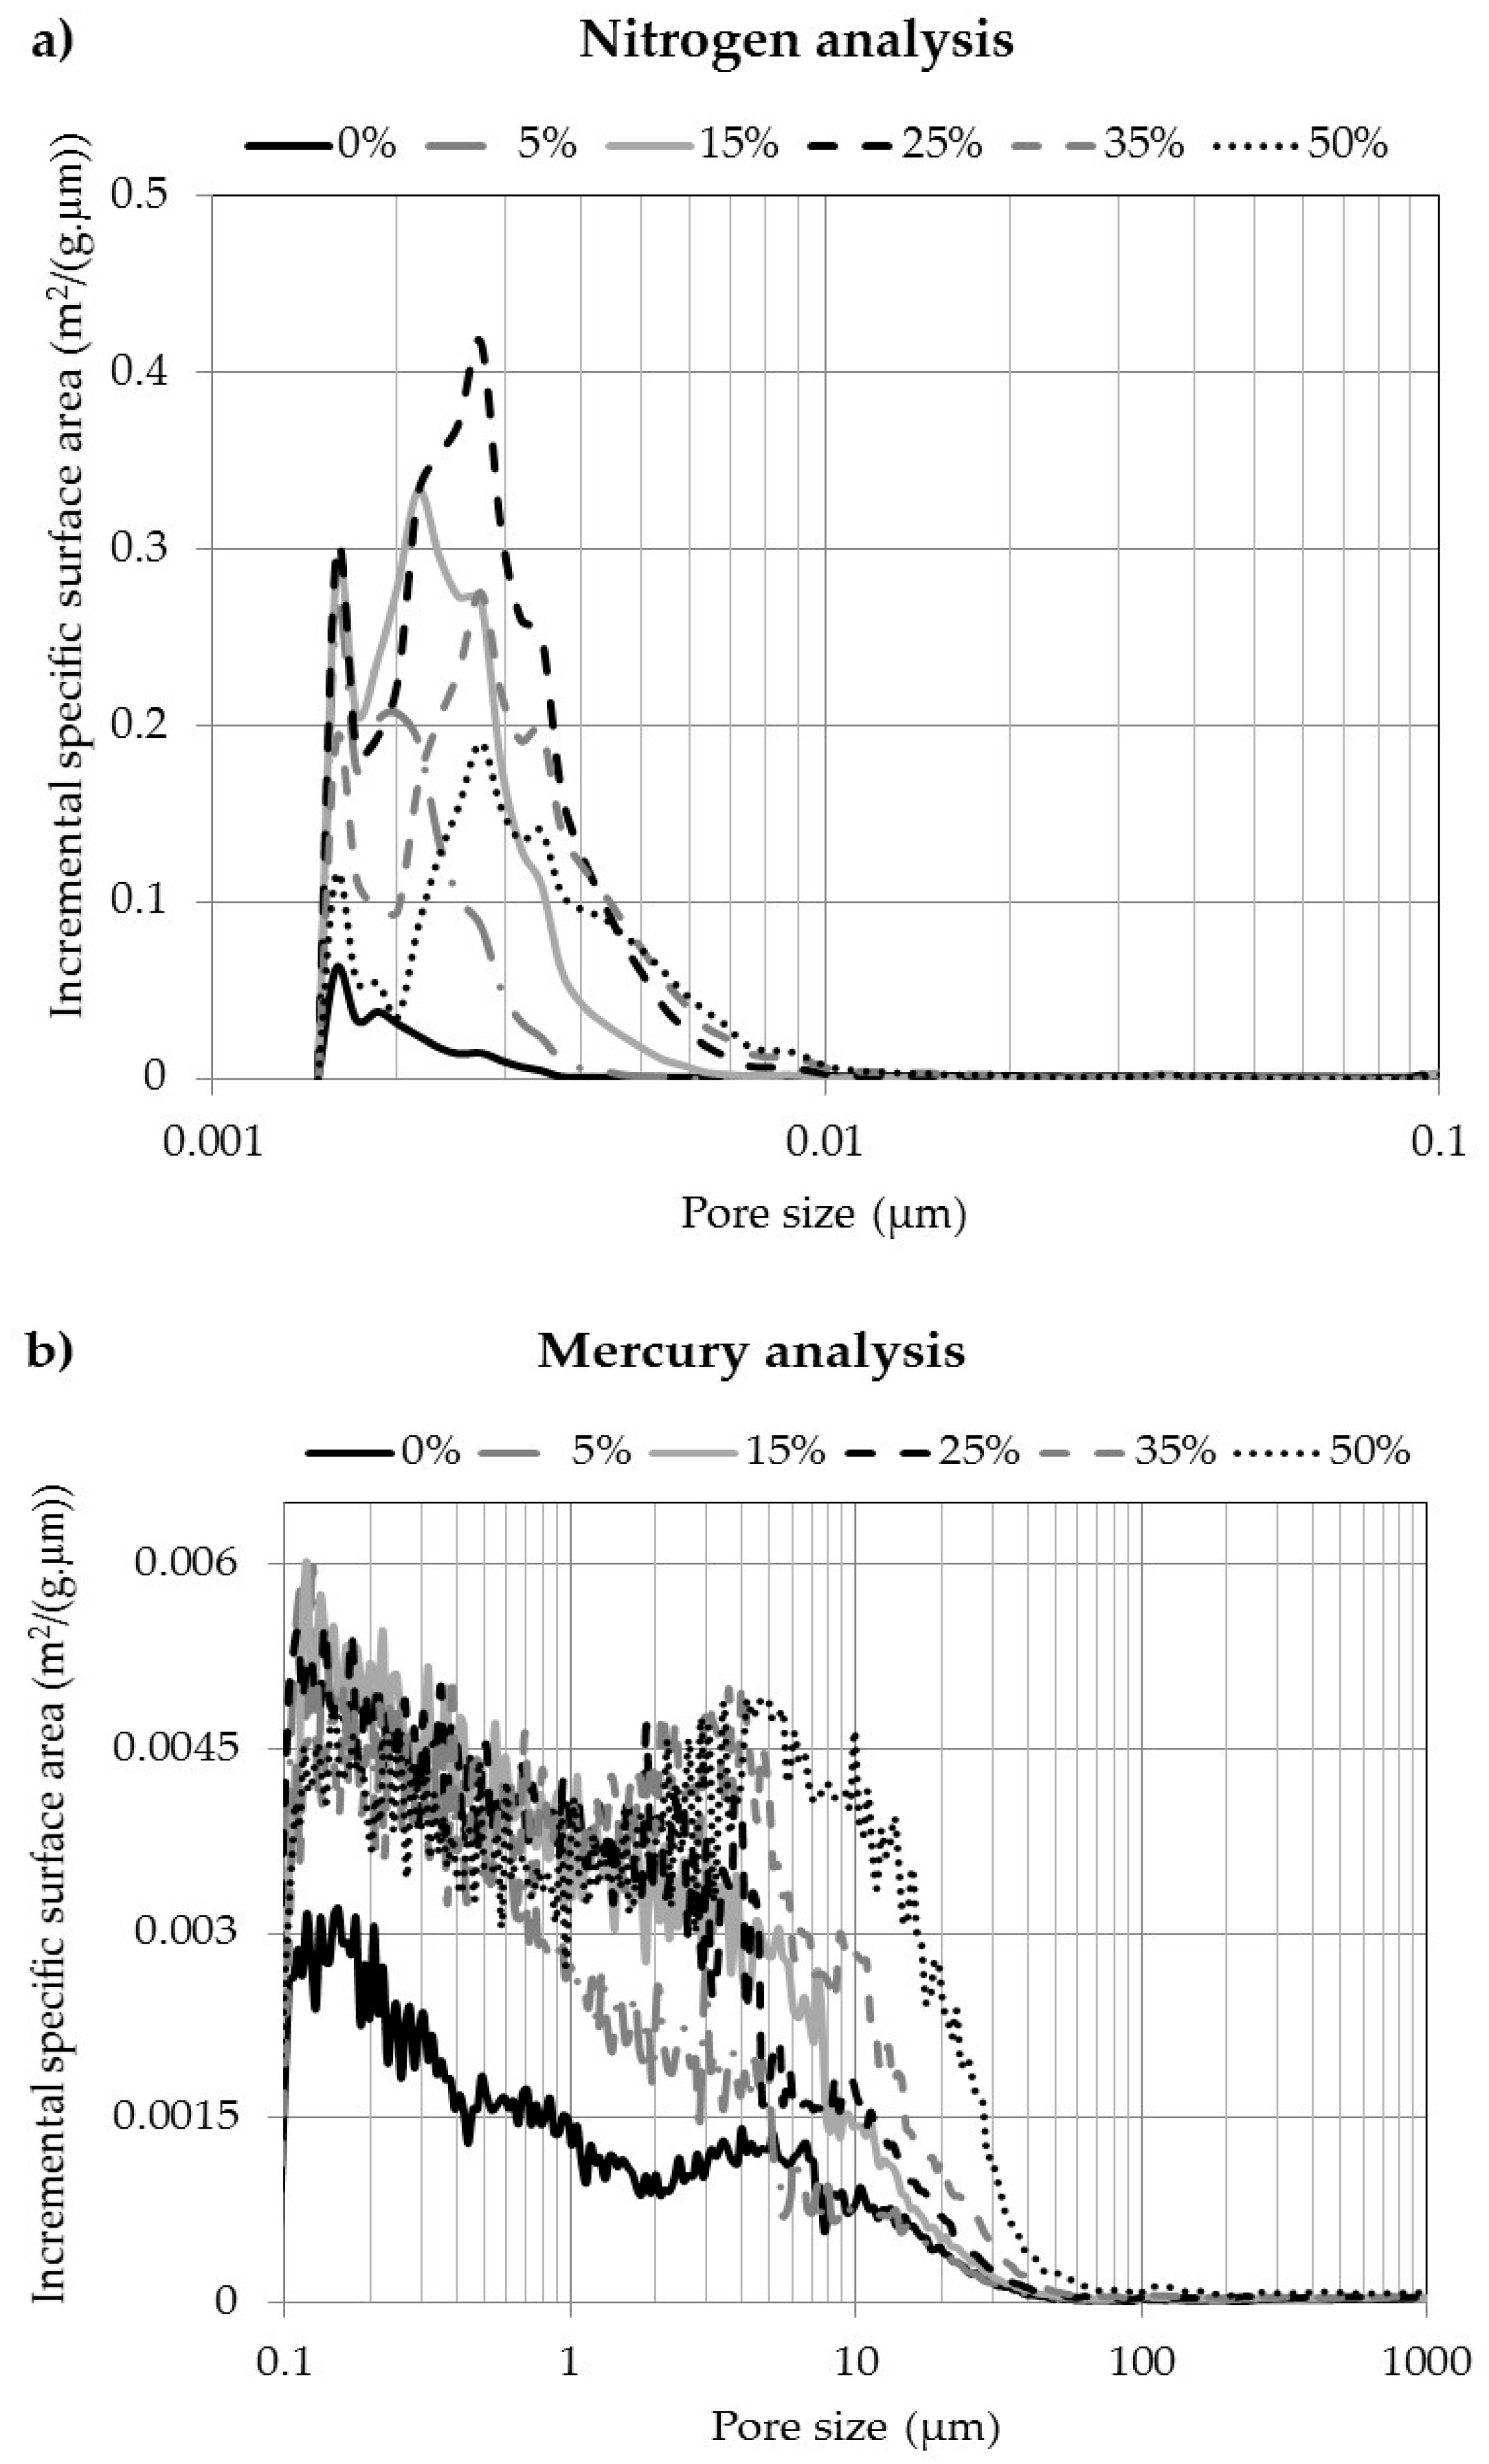
Between 0.0014 and 0.100 µm of pore size, a gas adsorption analyzer (Tristar II 3020, Micromeritics, Norcross, GA, USA) with the Density Functional Theory (DFT) equation and the nitrogen adsorptive gas was used;
-
For the pores superior to 0.1 µm to about 1000 µm (ISO 15901-1), a mercury porosimeter (Auto Pore IV, Micromeritics, Norcross, GA, USA) was used.

3. Results

3.1. Thermo-Gravimetric (TG) Analysis

To estimate the air reactivity, the anode particles were gasified in the TG instrument at 525 °C, under air atmosphere. The apparent reaction rate of anode particles as a function of carbon conversion is presented in Figure 1. The rate of reaction increased gradually between 0 and 70 wt % of gasification and decreased between 70 and 80 wt %. This trend of apparent reaction rate exhibiting a maximum has often been remarked in carbon consumption studies in the literature [32,44,45,46,47]. Bhatia and Perlmutter [46] and Ballal and Zygouraki [47] explained the maximum rate with the combination of two opposite effects: the augmentation of the reactive surface with pore growth and pore accessibility, and the disappearance of this surface area with pore coalescence and consumption of carbon material.
To reveal the evolution of anode porosity as a function of carbon conversion, a structural analysis is required. However, as reported previously, the TG instrument allows the gasifying of only a small quantity of material. Thus, a second reactor is necessary to have enough materials for characterization.

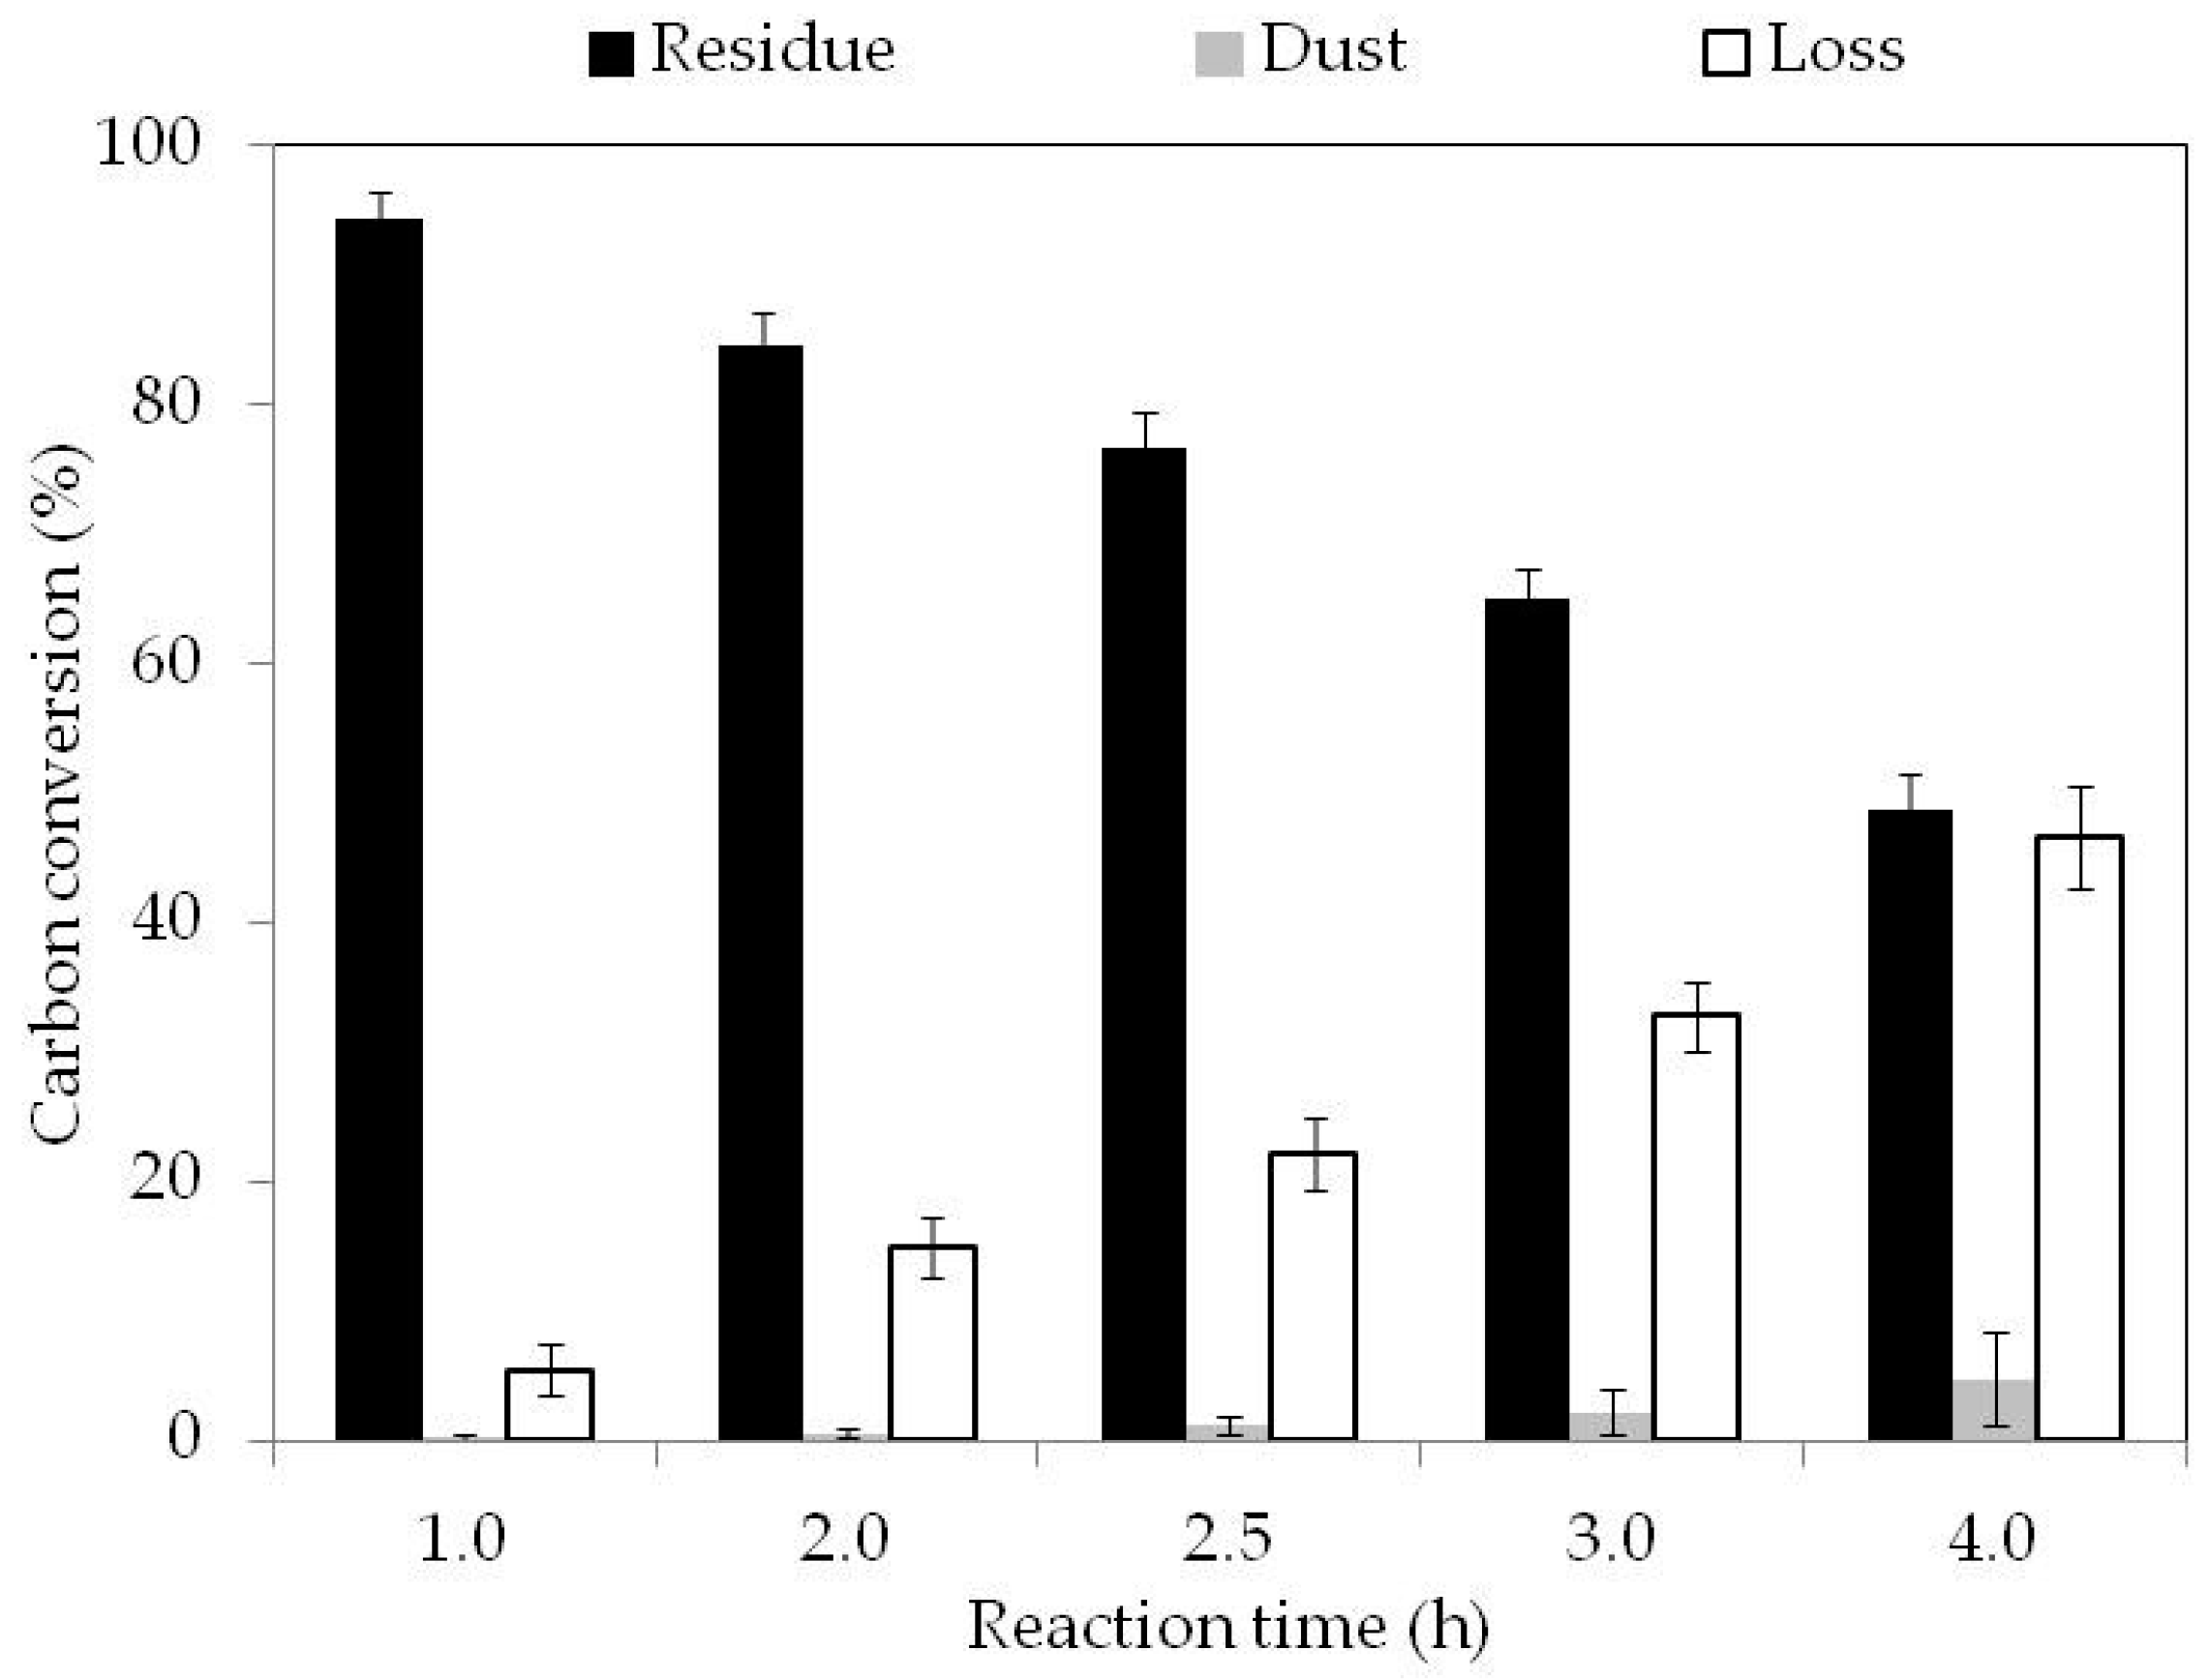
3.2. Fixed Bed Reactor Gasification

To obtain a large amount of gasified materials, a Fixed Bed Reactor (FBR) was used. After a specific reaction time, the anode particles were sieved to quantify the portions of residue, dust and mass loss in the form of CO2 and CO. Figure 2 presents these three quantities for the anode particles gasified during 1, 2, 2.5, 3 and 4 h under air at 525 °C. Although the mass of the residue decreases with increasing reaction time, the mass of dust as well as the mass loss in the form of gas (under the form of CO molecules) was increased. Figure 2 reveals the importance of carbon loss in the form of gas compared to the loss due to dusting. In consequence, considering the type of reactor and that the dust could react with the reactive gas, the oxidation of carbon anode by air provides preferentially a mass loss in the form of gas, from the residue instead of dusting phenomenon.
After sieving the gasified material in FBR, some analyses were performed on the residues to characterize the attacked material, to reveal the parameter controlling the reactivity, and to understand the augmentation of the reaction rate.

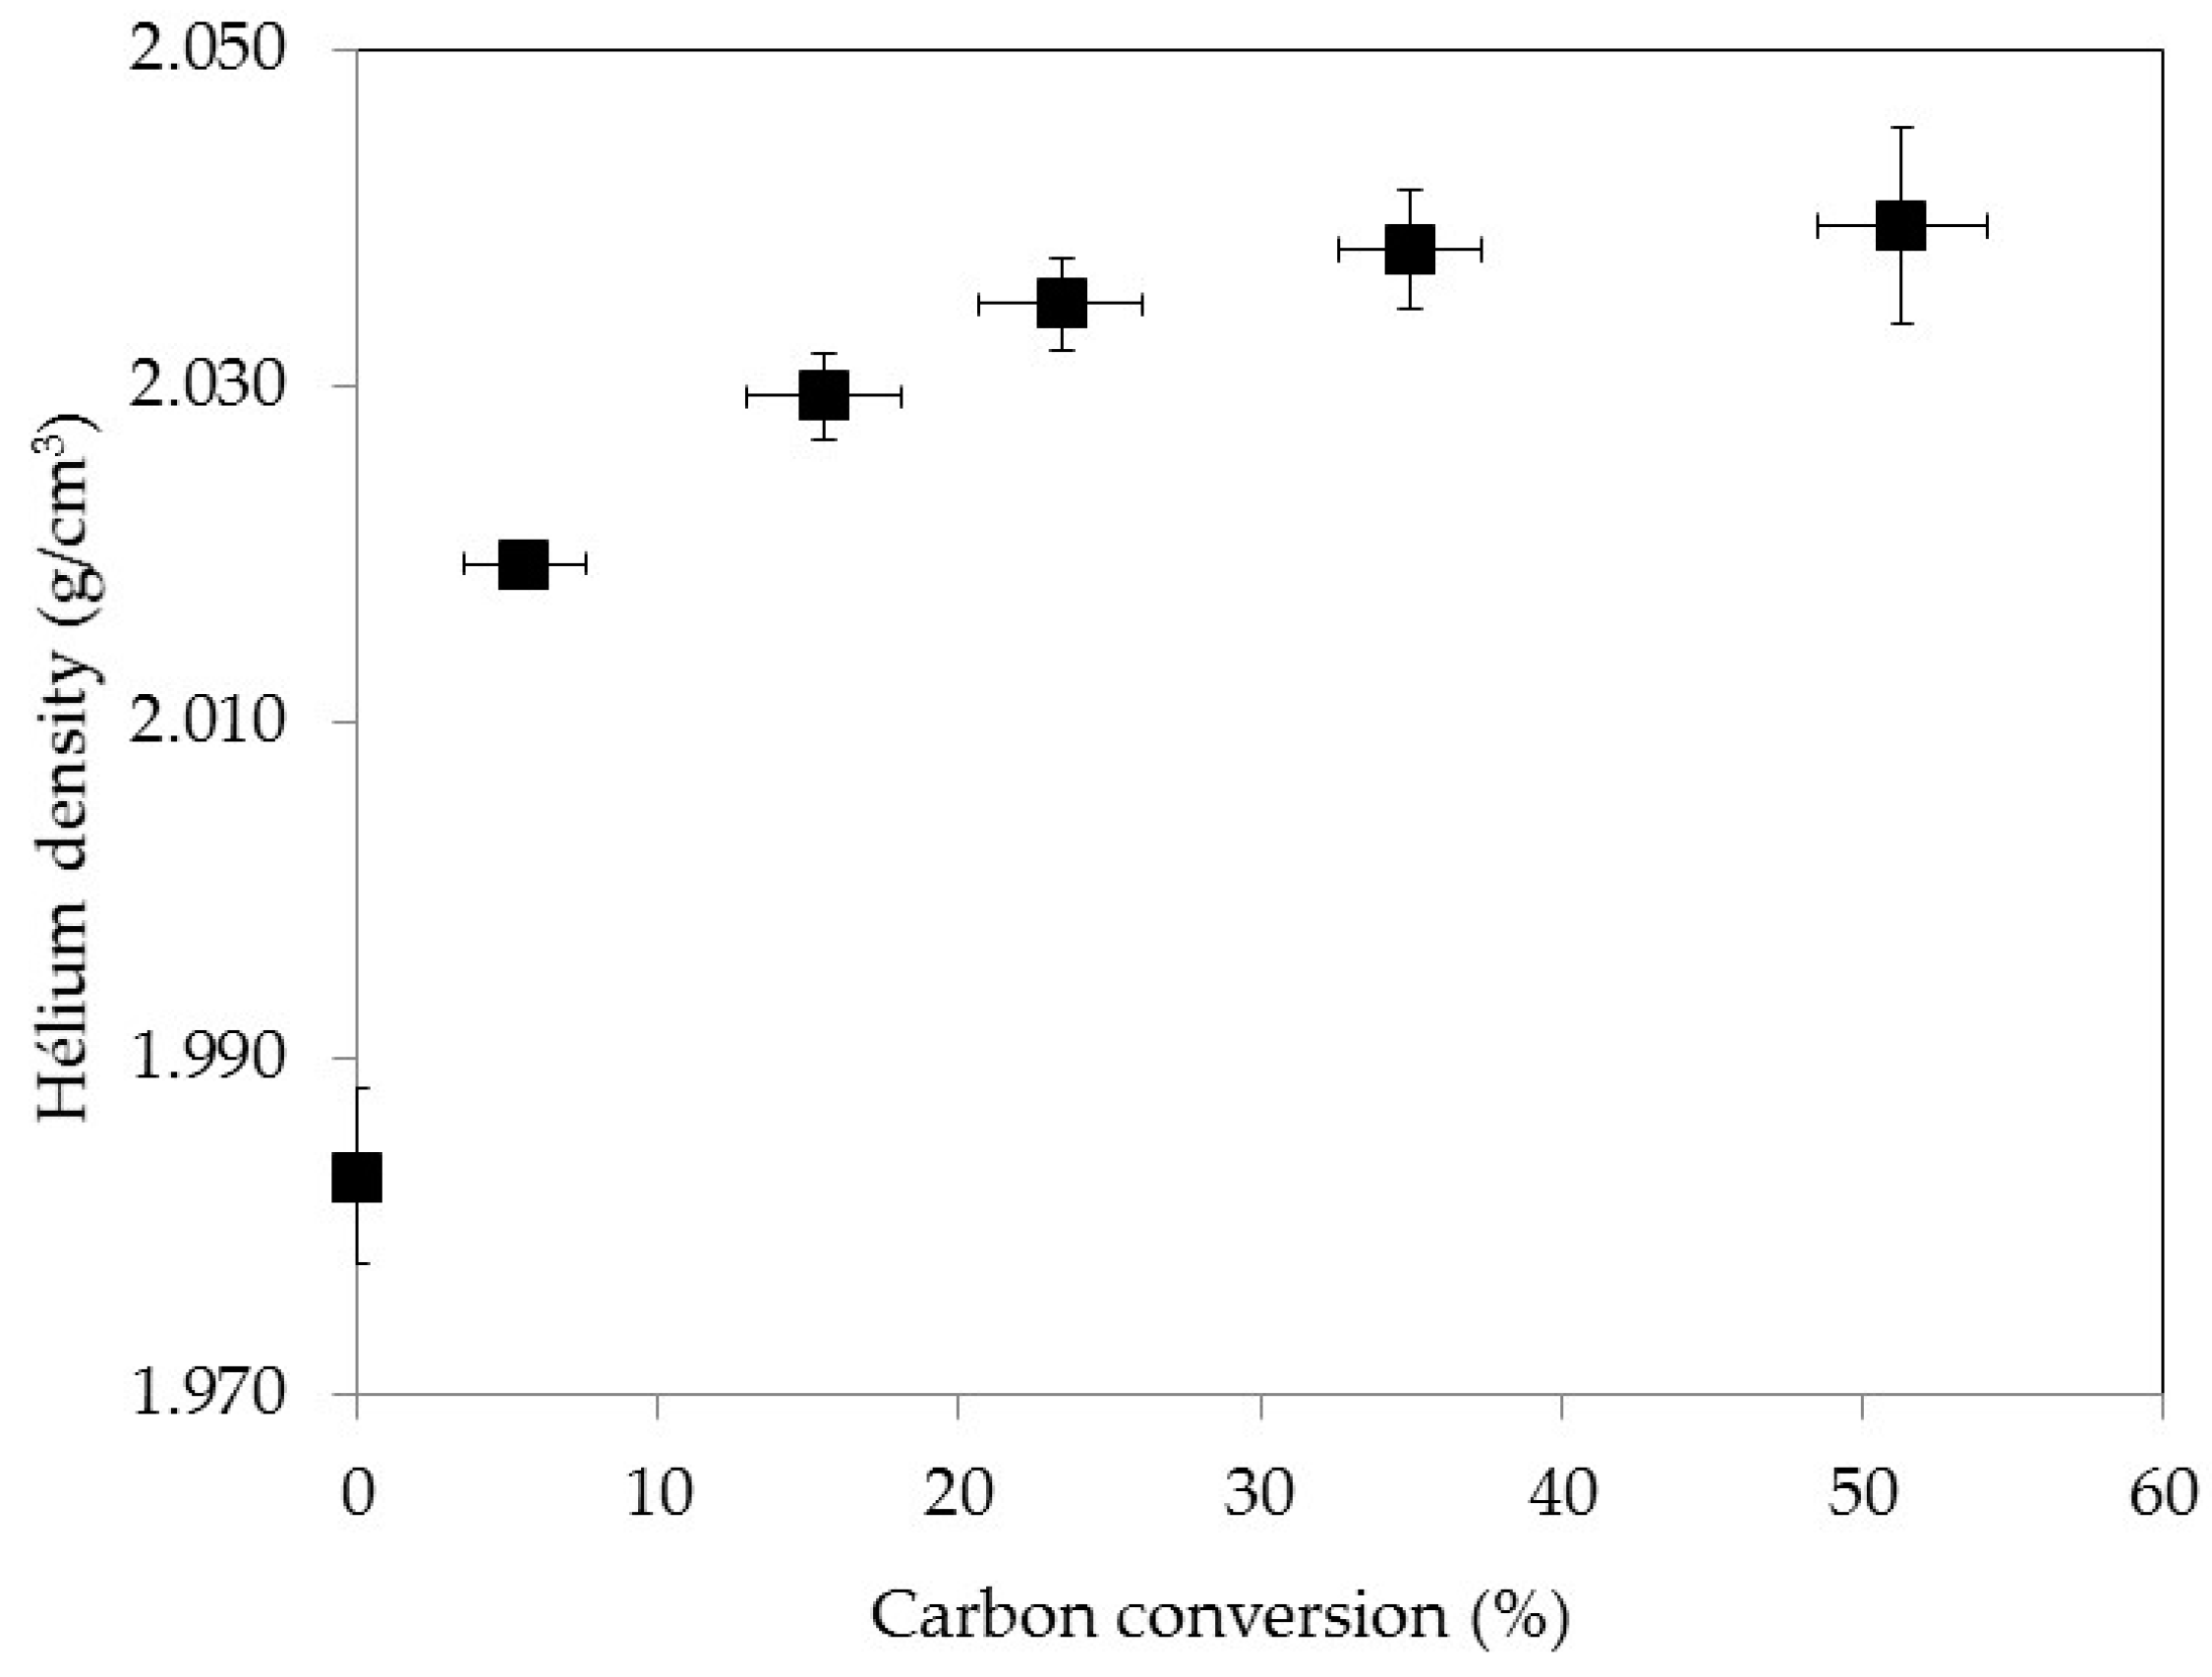
3.3. Density Evolution during Gasification

The helium density can be measured by He-pycnometer for semi-graphitic materials. Figure 3 presents the He-density evolution of the gasified anode particles, i.e., the residues (between 0 and 50 wt %) under air at 525 °C in FBR. An augmentation of the helium density with an increase of carbon conversion from 0 to 35 wt % and a plateau between 35 and 50 wt % could be observed. Tran et al. [42] has shown that the gasification of anode particles with a size ranging between 180 and 212 µm shows an increase of helium density from 0 to 10 wt % and a plateau between 10 and 70 wt %. This discrepancy with the present study could be explained by the difference in the initial particle size (for the small particles where the closed pores were probably opened by size reduction) and raw materials. When the initial particle size is smaller, a large fraction of closed pores are opened at early stages of gasification, while it is delayed for the larger particles. Thus, a constant of helium density is achieved faster for smaller particles.
Figure 1 presents a quasi-linear increase of the reaction rate between 0 and 70 wt % conversion. Compared to Figure 3, no correlation is found between helium density and reaction rate. Another structural parameter that was considered is the change of specific surface area with respect to pore size distribution.

3.4. Pore Size and Volume Distribution

Figure 4 presents the pore volume distributions measured by liquid nitrogen using the DFT model (Figure 4a) and by mercury intrusion (Figure 4b) as a function of the pore size for anode particles gasified under air at 525 °C and at gasification levels of 0, 5, 15, 25, 35 and 50 wt %. As can be seen in Figure 4a, it is possible to distinguish three different pore size ranges: 0.0014–0.0020, 0.002–0.025 and 0.025–0.100 µm. The mercury analysis (Figure 4b) revealed two other pore size ranges: 0.1–40.0 µm and superior to 40 µm. The pore size limit of 40 µm could be denoted as the Critical Pore Size (CPS) because the mercury infiltration is not able to distinguish the large pores in the particles and the pores between the particles [48]. After the determination of the experimental pore size ranges, it is possible to establish a relationship between the specific surface area in each pore size with the evolution of apparent reaction rate.

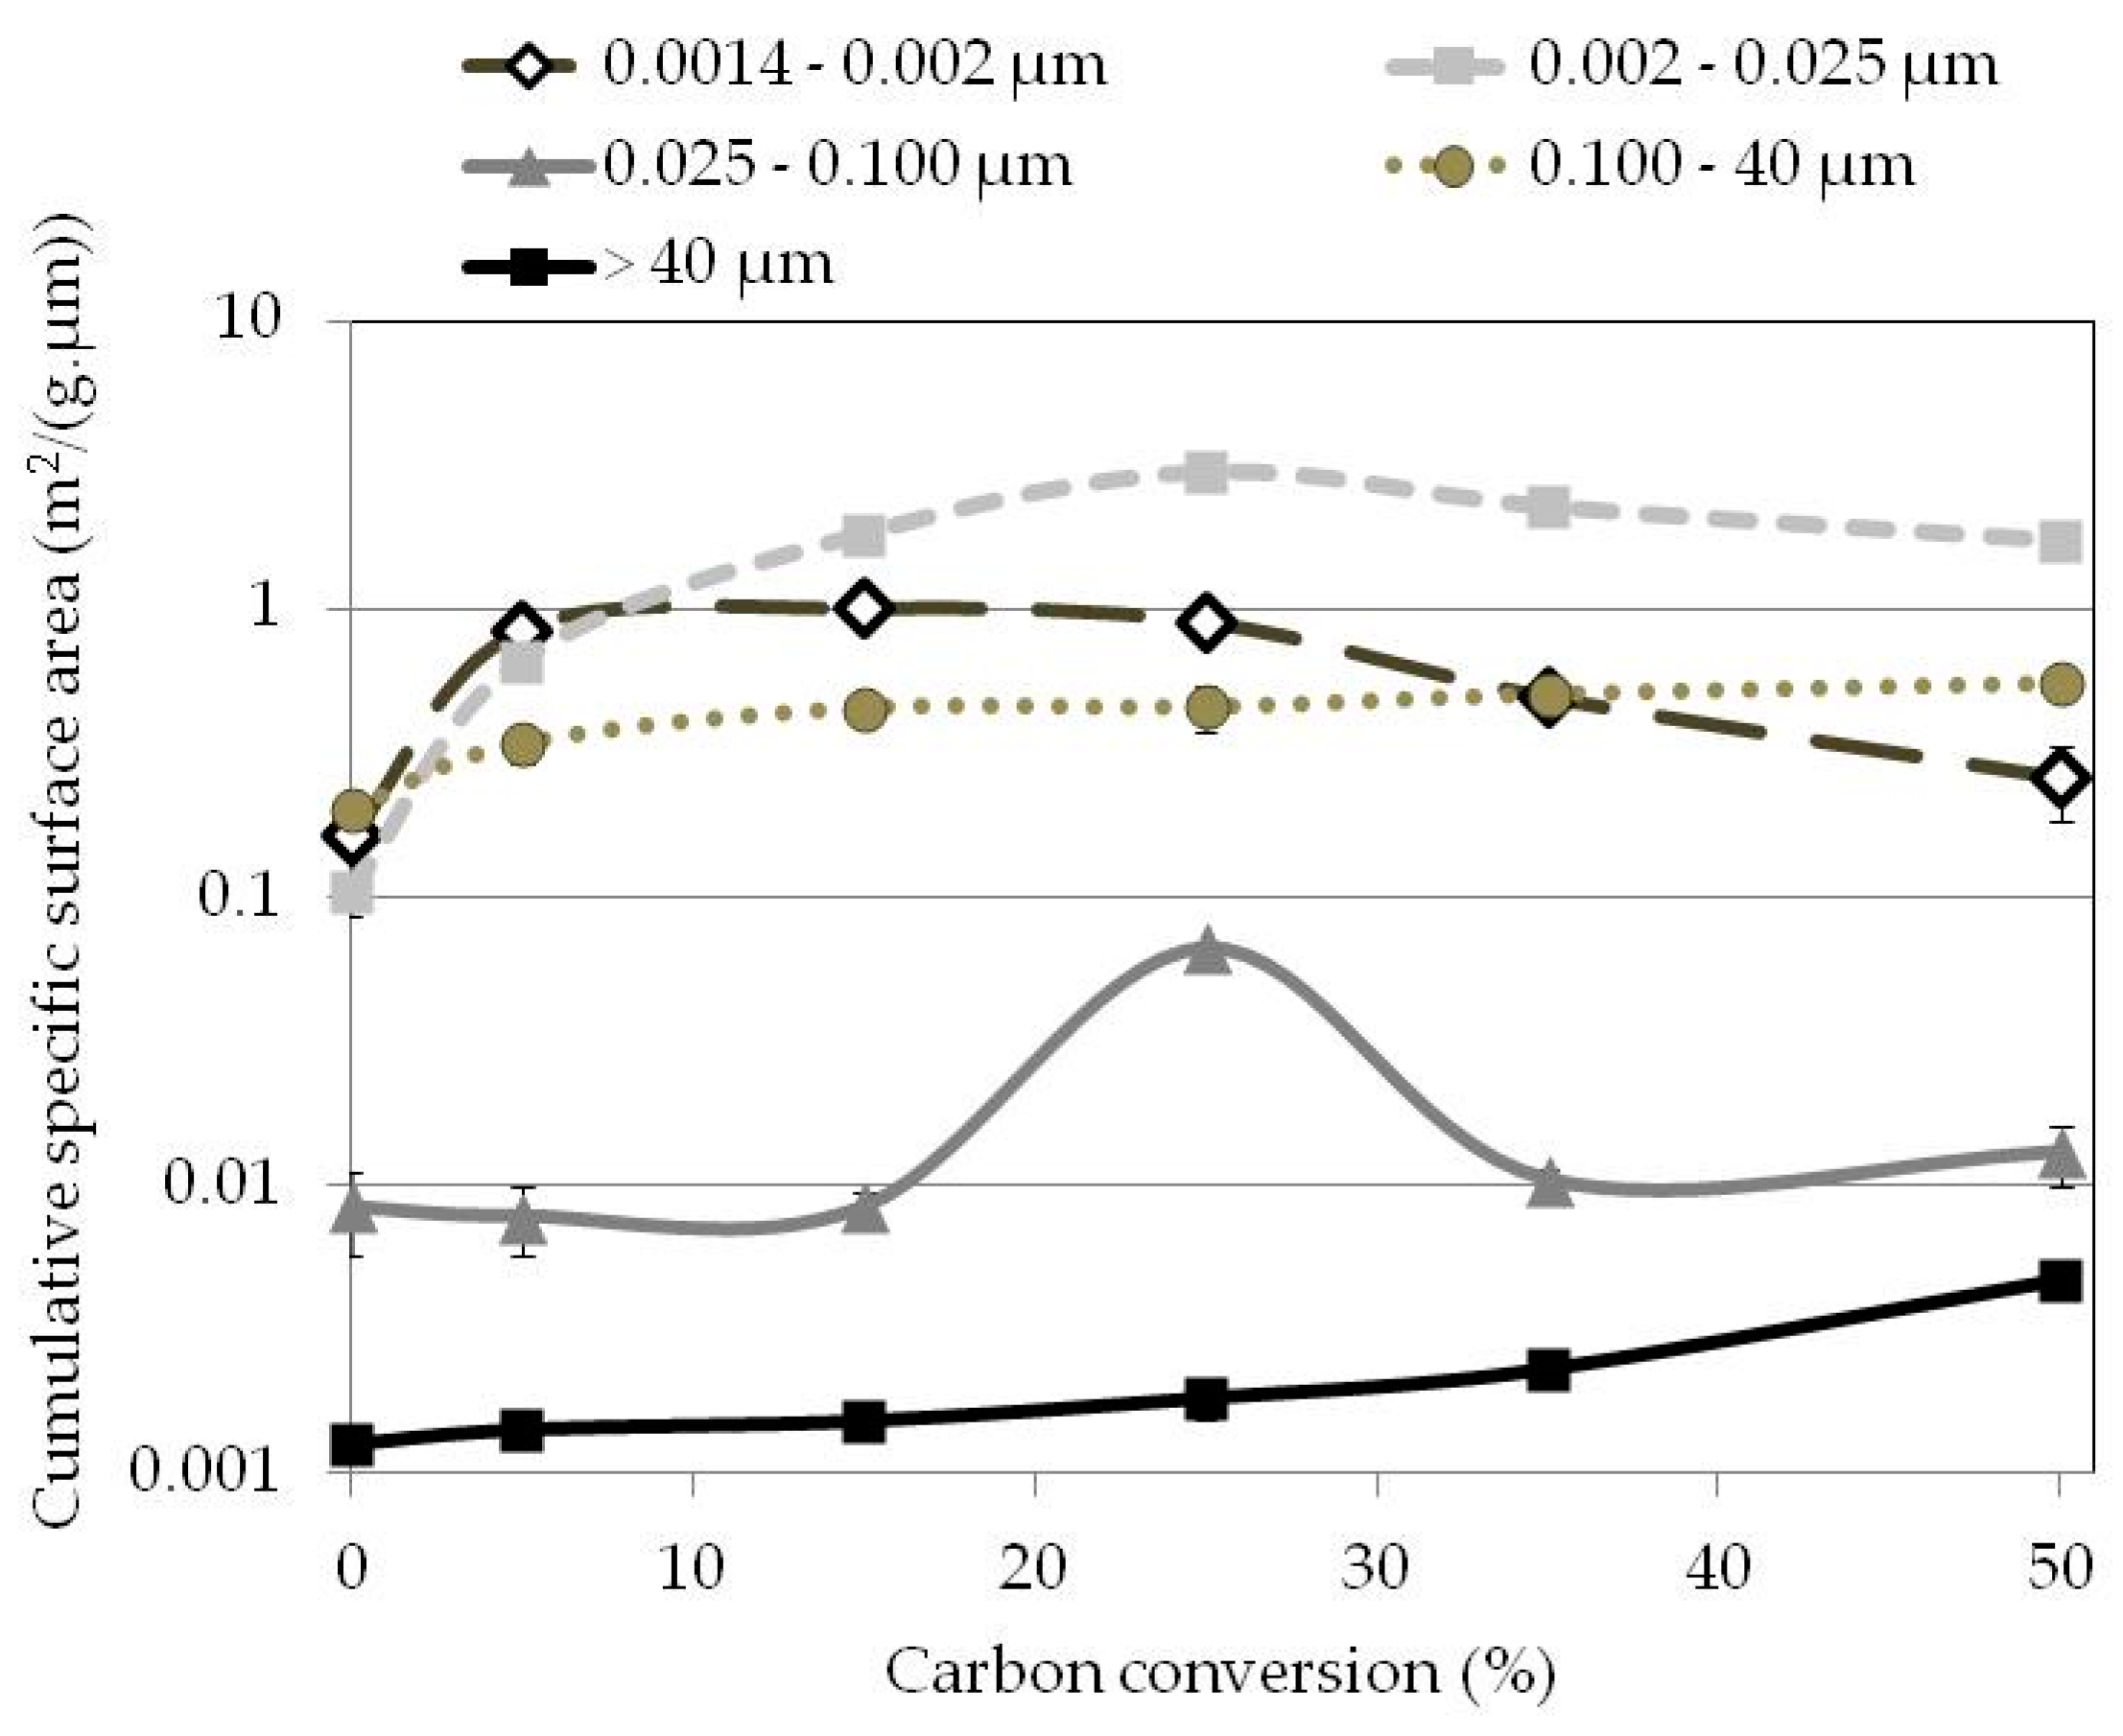
3.5. Specific Surface Area
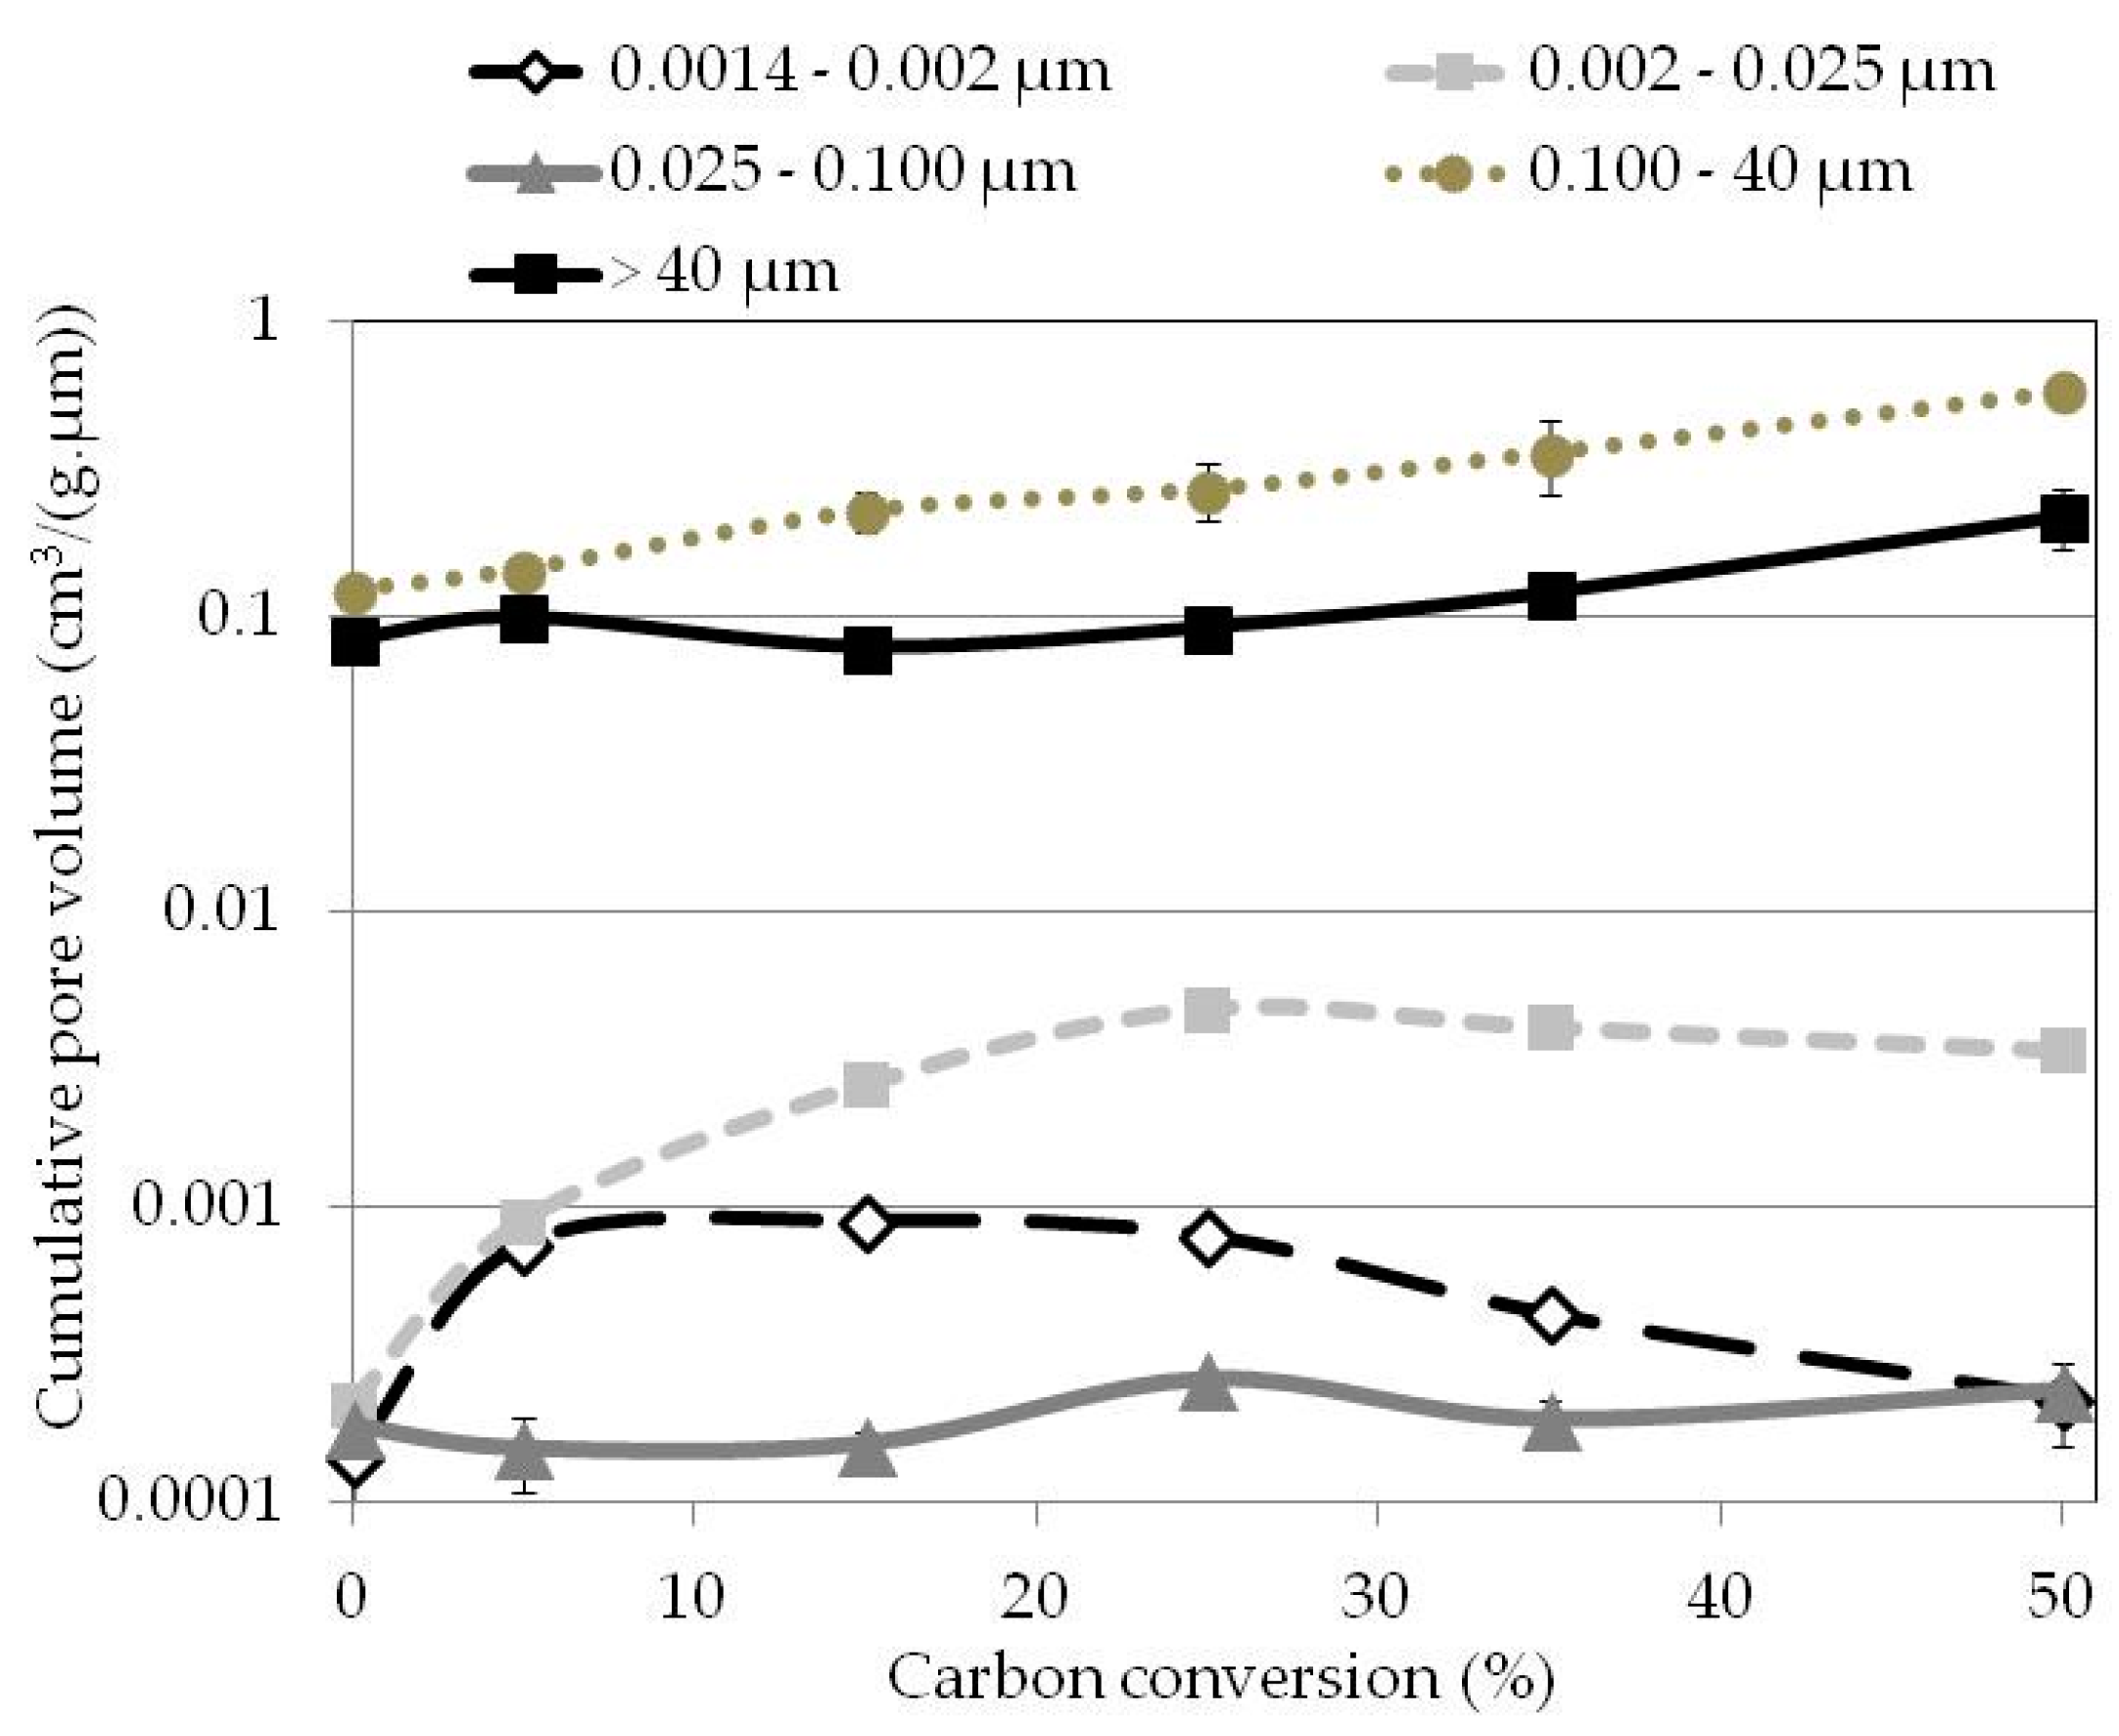
According to the literature, carbon reactivity could be controlled by the level of impurities [2,41,49] and by specific surface area [43,50]. Based on the Density Functional Theory model (DFT) for the gas adsorption and with the assumption that the pores are cylindrical for the mercury analysis, it is possible to obtain the specific surface area as a function of pore size distribution. This is shown in Figure 5 for anode particles, gasified at five different levels, measured with nitrogen adsorption (Figure 5a) and mercury infiltration (Figure 5b).
To reveal a possible relationship between the surface area and the augmentation of the apparent reaction rate (Figure 1), Figure 6 shows the cumulative specific surface area for each pore size range for the six gasification percentages. The specific surface area of the three smaller pore size ranges (0.0014–0.002, 0.002–0.025 and 0.025–0.100 µm) presents a similar trend; an increase of the specific surface area followed by a decrease as a function of carbon conversion. The two larger pore sizes (0.1–40.0 and superior at 40 µm) indicate a slight augmentation of the surface area as the reaction progresses. Thus, a possible correlation could be proposed between the continuous increase of the surface areas in these two large pore ranges and the quasi-linear rise of the apparent reaction rate (Figure 1). With the objective of comparing the importance of each pore size, some calculations were performed to evaluate the carbon mass consumption in each pore size.

3.6. Pore Volumes

The variation in cumulative pore volumes versus the carbon conversion for six gasification levels under air at 525 °C is shown in Figure 7 (based on Figure 4). Table 4 presents the pore volumes measured with nitrogen adsorption and mercury intrusion for anode particles and five carbon conversions. Nitrogen adsorption analysis results reveal that the volume of the pores, in the range of 0.0014–0.002, 0.002–0.025 and 0.025–0.100 µm, presents a maximum with respect to carbon conversion, while the volume of pores in the range of 0.1–40.0 µm, measured with mercury infiltration, increases gradually with gasification level. Thus, considering the progressive increase of the apparent reaction rate, it seems that the pores in the range of 0.1–40.0 µm control the gasification rate of the anode particles. The log scale of the Y-axis in Figure 7 points out that the increase in the 0.1–40.0 range surpasses remarkably the increase of the other pore volumes. To confirm this hypothesis, it is essential to evaluate the amount of carbon consumption in different pore sizes as a function of carbon conversion.

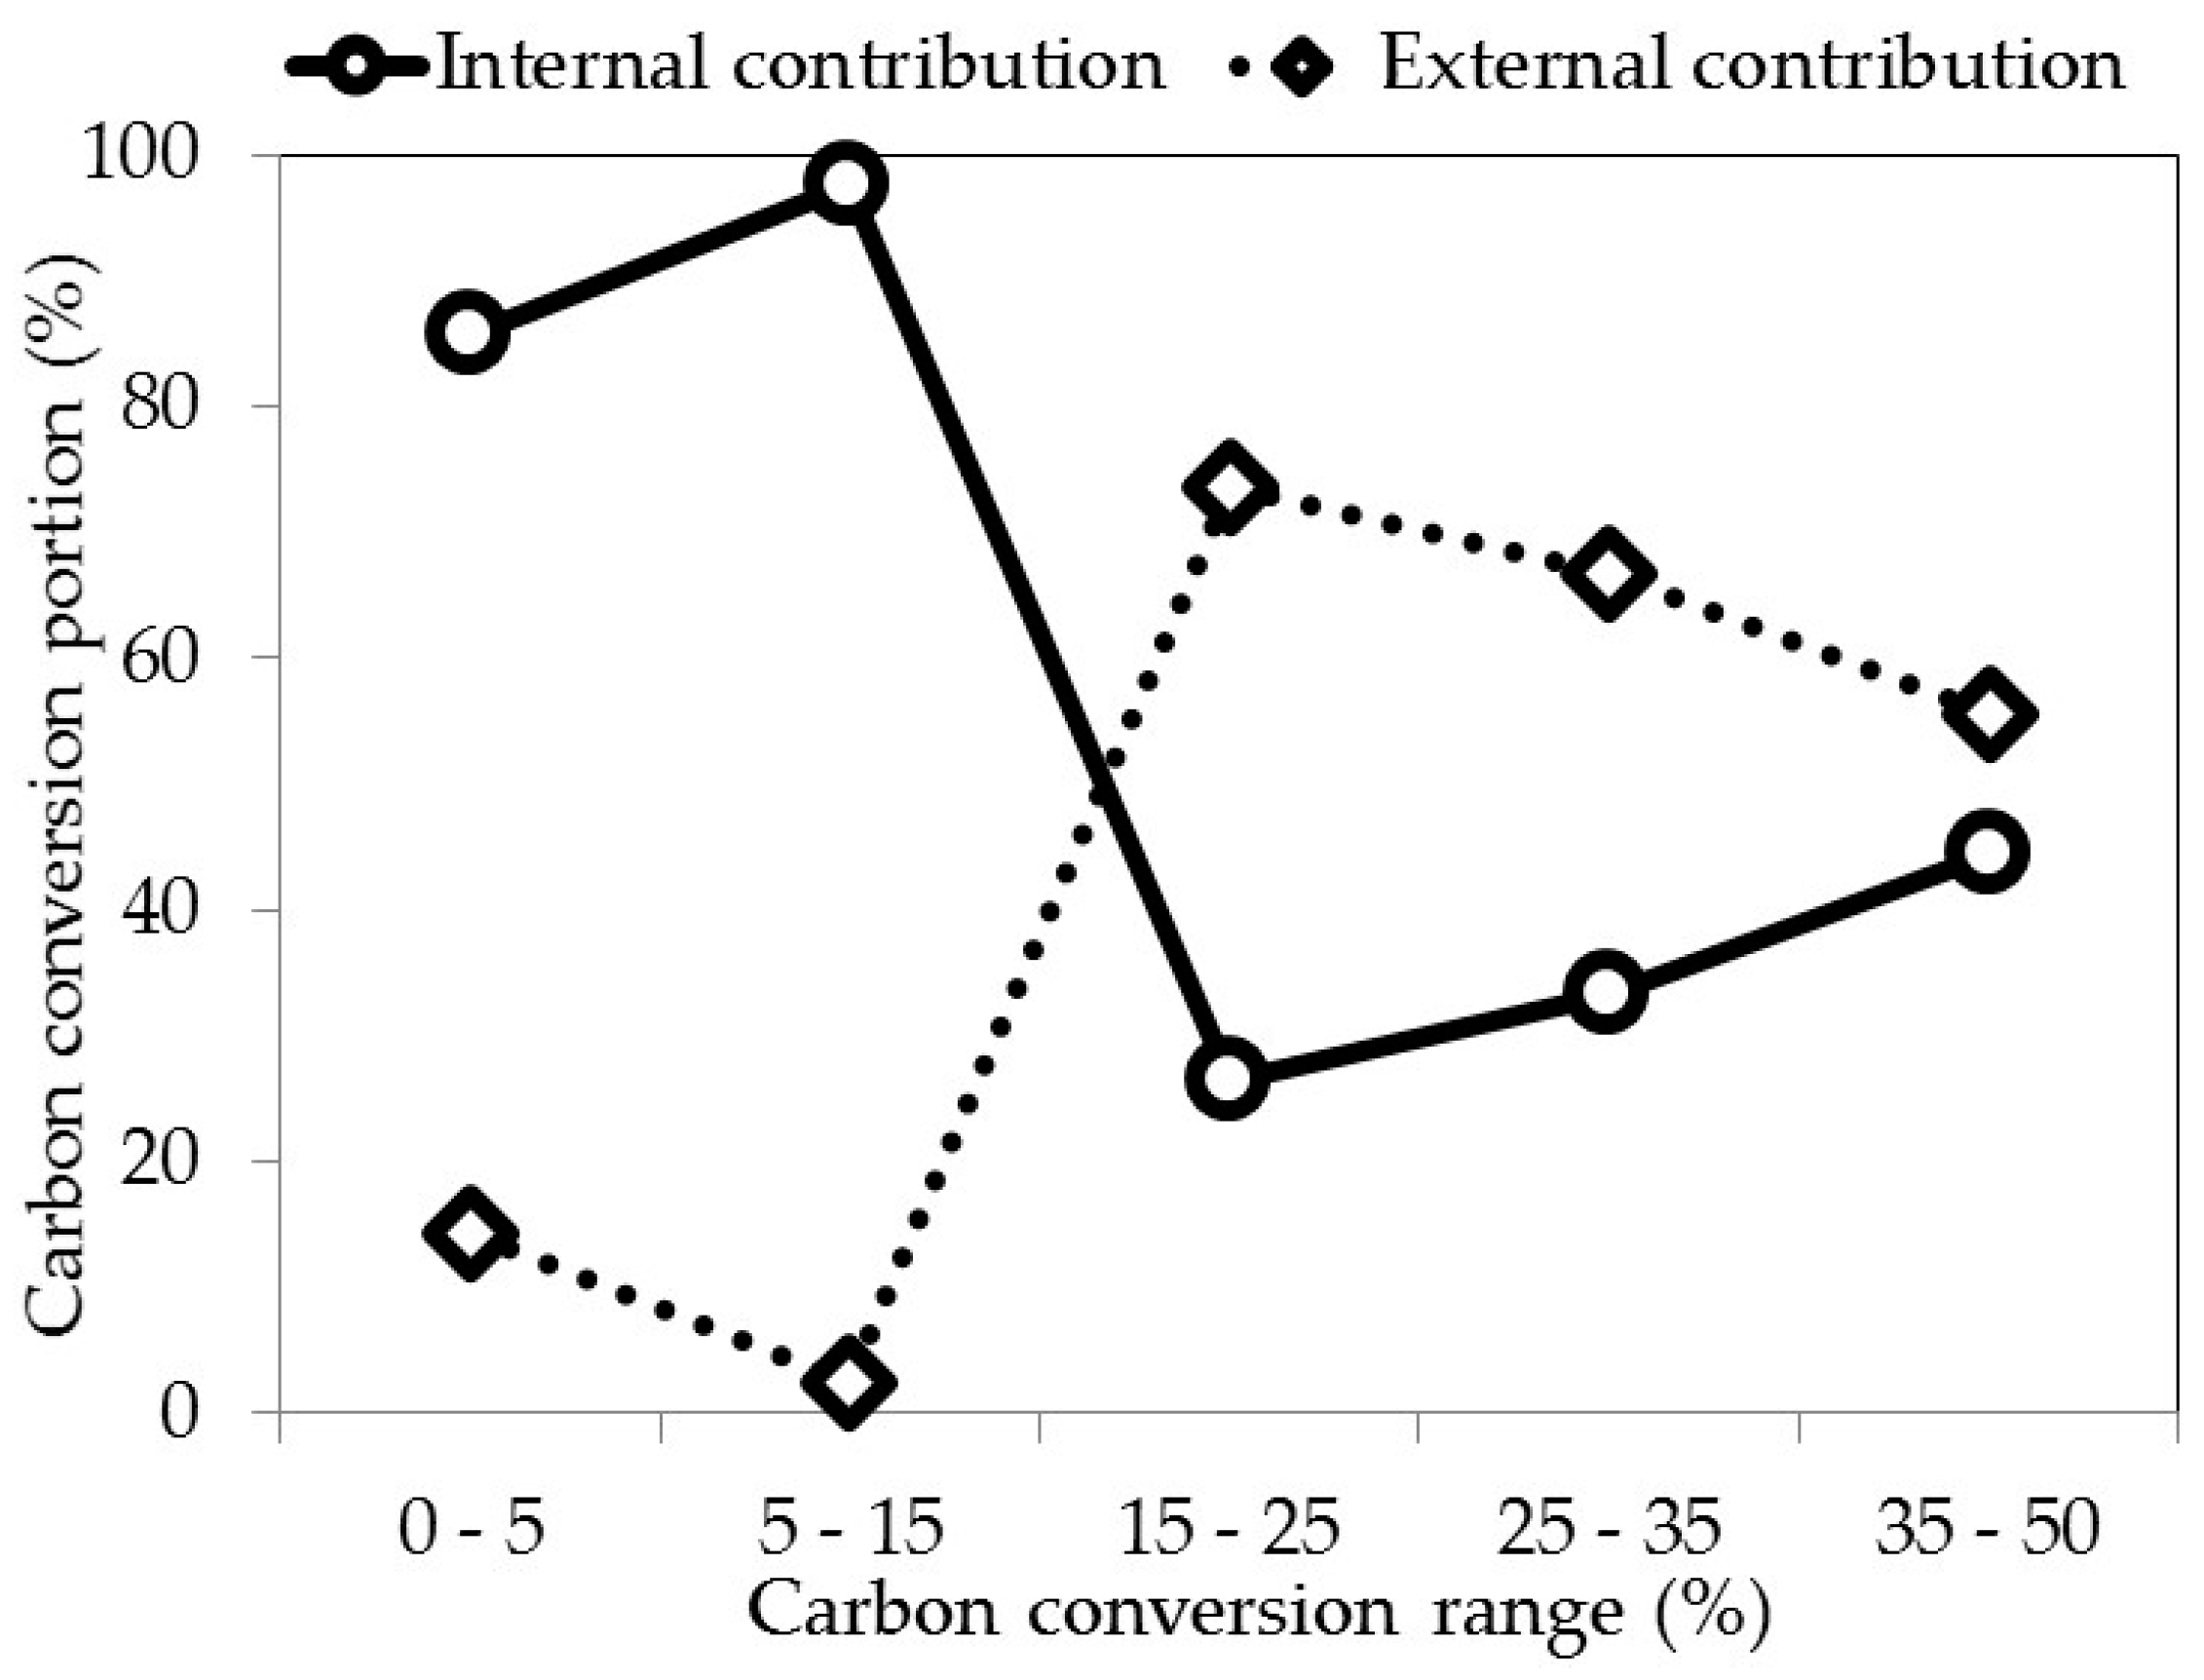
3.7. Active Pore Size

In order to reveal the contribution of each pore size in gasified anode, overall consumption is divided to two sub-classes, i.e., internal and external gasifications. Internal gasification is associated with consumption of material inside pores smaller than 40 µm whereas external gasification is attributed to carbon consumption in pores larger 40 µm. Then, the mass of the consumed carbon in each pore within a given size interval and at each gasification interval was evaluated. The detailed calculations were given by Chevarin et al. [40]. Figure 8 illustrates the portions of external and internal contributions for five conversion ranges: 0–5, 5–15, 15–25, 25–35 and 35–50 wt %. Table 5 indicates the carbon conversion, carbon amount, contribution for the pore size inferior and superior at 40 µm. Between 0 and 15 wt % conversion, the internal contribution (reaction in the pores smaller than 40 µm) controls the total gasification of anode, representing between 80% and 98% of the total conversion. After 15 wt % of gasification, an inversion of the contribution type is observed. External contribution (reaction in the pores larger than 40 µm) preferentially dominates the anode consumption, representing between 55 and 75 wt % of the total gasification.
From 0 to 15 wt % gasification, pores smaller than 40 µm are enlarged (average pore size is about 10 µm). At 15 wt %, pores with a size close to 40 µm (average pore size shifts to 20 µm) continue to grow and exceed the upper size limit. These pores enlarge and are considered as external pores. Thus, the contribution of these new large pores is added to the contribution of the initial large pores and increases the portion of the external contribution. The high reactivity of large pores (0.1–40.0 µm) could be explained by an easier mass transport within these pores combined with a relatively large specific surface area. The contribution of smaller pores, although exhibiting large specific surface area, is thus lower due to the mass transport limitations.
In other words, the active pores during carbon anode gasification under air are the pores with a size inferior to 40 µm and, more specifically, the size ranging between 0.1 and 40 µm, because the volume variation of pores inferior to 0.1 µm is very small (0.002 cm3/g·µm) versus 0.1 cm3/g·µm for the range 0.1–40 µm). At the early steps of gasification (from 0 to 15 wt %), the reaction essentially takes place in the small pores (0.1–40 µm). This step enlarges the pores and the pores superior to 40 µm become the active pores ranging between 15 and 50 wt % of carbon conversion.
These results suggest that air gasification is greatly affected by pore size distribution of the anode. To reduce air reactivity of anode, it would be preferable that the volume fraction of the pores in the range of 0.1–40.0 µm be reduced, possibly by adjusting the anode manufacturing steps. In this regard, a number of valuable data are available in the literature. Tkac [24] manufactured lots of anode samples with different manufacturing parameters (pitch content, mixing, baking, etc.) and assessed the final quality of the baked anodes. Using the Pareto diagram, a statistical method to determine the relationship between the process and the anode’s properties, Tkac proposed the essential process parameters, controlling the pore size distribution in baked anodes. According to these data, the time of vibro compaction and pitch content are the most important parameters to limit the pores inferior at 40 µm. In addition, Buzunov et al. [51] reported that heating rate during coke calcination process determines pore size distribution in a calcined coke, which may in turn affect pore size distribution of the anode. Having said that, this suggestion is only based on the air reactivity tests as performed in this study. Considering a number of other phenomena being involved in anode overconsumption, e.g., CO2 gasification or electrochemical reaction with cryolite, more investigations are required to address this issue properly. For instance, the critical pore size for CO2 reactivity was found to be superior at 40 µm [40], which is quite different from that for air reactivity. In addition, the electrochemical reaction of cryolite with anode and its penetration into the anode pores at the carbon/cryolite interface could, to a great extent, be affected by bath surface tension and anode pore size distribution.

4. Conclusions

In the present study, anode particles were gasified under air at 525 °C in two different reactors (Thermo-Gravimetric Analyzer and Fixed Bed Reactor) and at up to six carbon conversion levels (0, 5, 15, 25, 35 and 50 wt %). The partially reacted particles were sieved (to remove the dust) and their structural properties such as the He-density, specific surface areas and pore volumes were characterized using different analytical methods. The variation of gasification percentages of the anode particles allows the evaluation of surface area and pore volume evolution for different carbon conversion ranges. Characterization of pore size variation in anode particles during gasification under air revealed that active pores are those with a size ranging between 0.1 and 40.0 µm. The important contribution of this pore size to air gasification of the anode could be attributed to both high specific surface area and large pore volume resulting in lower mass transport limitation.
If one considers only the air reactivity of anode, it seems that the reduction of pores in the range of 0.1–40.0 µm is an adequate approach to reduce the carbon overconsumption. However, a number of other parameters, e.g., CO2 reactivity, bath penetration in anode porosity, etc., should also be considered to propose an optimum microstructure for anode. Considering the critical pore size for CO2 reactivity (superior to 40 µm), as reported in the literature, and the results obtained in this work for air reactivity, one may conclude that the pores larger than 0.1 µm should be avoided in an anode, despite the great portion of the anode-specific surface area being originated from the pores smaller than 0.1 µm.

Acknowledgments

The authors would like to acknowledge the financial support of Natural Sciences and Engineering Research Council of Canada, Fonds de Recherche du Québec—Nature et Technologies, Alcoa and the Aluminium Research Centre—REGAL. The assistance of Denis Drapeau and his colleagues at Alcoa Deschambault plant (QC, Canada) for conducting the chemical and crystallite size analyses is gratefully acknowledged. The authors would also like to extend their appreciation to Donald Picard at Laval University for the scientific discussions, as well as Jayson Tessier, Guillaume Gauvin and Hugues Ferland for their technical support.

Author Contributions

Francois Chevarin and Ramzi Ishak conceived and designed the experiments; Francois Chevarin and Ramzi Ishak performed the experiments; Donald Ziegler, Mario Fafard and Houshang Alamdari contributed in data analysis; Francois Chevarin wrote the paper and all co-authors commented/corrected it.

Conflicts of Interest

The authors declare no conflict of interest.

References

  1. Fischer, W.K.; Perruchoud, R.C. Factors Influencing the Carboxy- and Air-Reactivity Behavior of Prebaked Anodes in Hall—Heroult Cells. Light Met. 1986, 2, 575–580. [Google Scholar]
  2. Houston, G.J.; Øye, H.A. Consumption of Anode Carbon During Aluminium Electrolysis. Aluminium 1985, 61, 251–254. [Google Scholar]
  3. Brym, M.J.C.; Gagnon, A.; Boulanger, C.; Lepage, D.; Savard, G.; Bouchard, G.; Lagace, C.; Charette, A. Anode reactivity: Effect of coke calcination level. Light Met. 2009, 905–908. [Google Scholar]
  4. Lhuissier, J.; Bezamanifary, L.; Gendre, M.; Chollier, M.J. Use of under-calcined coke for the production of low reactivity anodes. In Essential Readings in Light Metals: Electrode Technology for Aluminum Production; John Wiley & Sons, Inc.: Somerset, NJ, USA, 2013; Volume 4, pp. 109–113. [Google Scholar]
  5. Fischer, W.K.; Perruchoud, R. Influence of coke calcining parameters on petroleum coke quality. Light Met. 1985, 811–826. [Google Scholar]
  6. Rolle, J.G.; Czikall, R.A. Use of coke air reactivity testing for predicting anode air reactivity. Light Met. 2001, 67, 5–67. [Google Scholar]
  7. Engvoll, M.A.; Øye, H.A.; Sørlie, M. Influence of bath contaminations on anode reactivity. Light Met. 2001, 661–667. [Google Scholar]
  8. Müftüoglu, T.; Steine, B.; Fernandez, R. Anode burning behaviour and sodium sensitivity of coke from different feedstocks: A pilot scale study. Light Met. 1993, 543–548. [Google Scholar]
  9. Müftüoglu, T.; Øye, H. Reactivity and electrolytic consumption of anode carbon with various additives. In Essential Readings in Light Metals: Electrode Technology for Aluminum Production; John Wiley & Sons, Inc.: Somerset, NJ, USA, 2013; Volume 4, pp. 667–671. [Google Scholar]
  10. Rolle, J.G.; Hoang, Y.K. Studies of the impact of vanadium and sodium on the air reactivity of coke and anodes. In Essential Readings in Light Metals: Electrode Technology for Aluminum Production; John Wiley & Sons, Inc.: Somerset, NJ, USA, 2013; Volume 4, pp. 606–610. [Google Scholar]
  11. Edwards, L.; Vogt, F.; Robinette, M.; Love, R.; Ross, A.; McClung, M.; Roush, R.; Morgan, W. Use of shot coke as an anode raw material. Light Met. 2009, 985–990. [Google Scholar]
  12. Schmidt-Hatting, W.; Kooijman, A.; Perruchoud, R. Investigation of the quality of recycled anode butts. Light Met. 1991, 705–720. [Google Scholar]
  13. Buhler, U.; Perruchoud, R.C. Dynamic process optimization. Light Met. 1995, 707–714. [Google Scholar]
  14. Lustenberger, M. Heat treatment of anodes for the Aluminium Industry. In Institut des Matériaux; Faculté Sciences et Techniques de l’Ingénieur: Lausanne, Switzerland, 2004; p. 143. [Google Scholar]
  15. Coste, B.; Schneider, J.P. Influence of coke real density on anode reactivity consequence on anode baking. Light Met. 1994, 583–591. [Google Scholar]
  16. Foosnæs, T.; Kulset, N.; Linga, H.; Naeumann, G.; Werge-Olsen, A. Measurement and control of the calcining level in anode baking furnaces. In Essential Readings in Light Metals: Electrode Technology for Aluminum Production; John Wiley & Sons, Inc.: Somerset, NJ, USA, 2013; Volume 4, pp. 418–421. [Google Scholar]
  17. Fischer, W.K.; Keller, F.; Perruchoud, R.; Oderbolz, S. Baking parameters and the resulting anode quality. In Essential Readings in Light Metals: Electrode Technology for Aluminum Production; John Wiley & Sons, Inc.: Somerset, NJ, USA, 2013; Volume 4, pp. 427–433. [Google Scholar]
  18. Kuang, Z.; Thonstad, J.; Sørlie, M. Effects of additives on the electrolytic consumption of carbon anodes in aluminium electrolysis. Carbon 1995, 33, 1479–1484. [Google Scholar] [CrossRef]
  19. Thorne, R.J.; Sommerseth, C.; Ratvik, A.P.; Rørvik, S.; Sandnes, E.; Lossius, L.P.; Linga, H.; Svensson, A.M. Correlation between Coke Type, Microstructure and Anodic Reaction Overpotential in Aluminium Electrolysis. J. Electrochem. Soc. 2015, 162, E296–E306. [Google Scholar] [CrossRef]
  20. Thonstad, J.; Hove, E. On the anodic overvoltage in aluminum electrolysis. Can. J. Chem. 1964, 42, 1542–1550. [Google Scholar] [CrossRef]
  21. Rey Boero, J.F. Studies on anode reactivity to oxidant gases. In Essential Readings in Light Metals: Electrode Technology for Aluminum Production; John Wiley & Sons, Inc.: Somerset, NJ, USA, 2013; Volume 4, pp. 580–588. [Google Scholar]
  22. Kuang, Z.-L.; Thonstad, J.; Rolseth, S.; Sørlie, M. Effect of baking temperature and anode current density on anode carbon consumption. Metall. Mater. Trans. B 1996, 27, 177–183. [Google Scholar] [CrossRef]
  23. Edwards, L. The History and Future Challenges of Calcined Petroleum Coke Production and Use in Aluminum Smelting. JOM 2015, 67, 308–321. [Google Scholar] [CrossRef]
  24. Tkac, M. Porosity development in composite carbon materials during heat treatment. In Department of Materials Science and Engineering; Norwegian University of Science and Technology: Trondheim, Norway, 2007; p. 189. [Google Scholar]
  25. Keller, F.; Fischer, W.K. Development of anode quality criteria by statistical evaluation of operational results in the electrolysis. Light Met. 1982, 729–740. [Google Scholar]
  26. Perruchoud, R.C.; Meier, M.W.; Fischer, W.K. Bath impregnation of carbon anodes. In Essential Readings in Light Metals: Electrode Technology for Aluminum Production; John Wiley & Sons, Inc.: Somerset, NJ, USA, 2013; Volume 4, pp. 673–679. [Google Scholar]
  27. Beltiskus, D.; Danka, D. A comprehensive determination of effects of calcined petroleum coke properties on aluminium reduction cell anode properties. Light Met. 1988, 429–439. [Google Scholar]
  28. Hardin, E.E.; Beilharz, C.L.; Melvin, L.L. Comprehensive review of the effect of coke structure and properties when calcined at various temperatures. Light Met. 1993, 501–508. [Google Scholar]
  29. Suriyapraphadilok, U.; Halleck, P.; Grader, A.; Andresen, J.M. Physical, chemical and X-Ray Computed Tomography characterization of anode butt cores. In Proceedings of the Technical Sessions at the TMS Aluminum Committee at the 134th TMS Annual Meeting, San Francisco, CA, USA, 13–17 February 2005; pp. 617–621.
  30. Bird, N.; McEnaney, B.; Sadler, B.A. Some practical consequences of analyses of the carboxy and airburn reactions of anode carbons. In Essential Readings in Light Metals: Electrode Technology for Aluminum Production; John Wiley & Sons, Inc.: Somerset, NJ, USA, 2013; Volume 4, pp. 589–593. [Google Scholar]
  31. Turkdogan, E.T.; Olsson, R.; Vinters, J. Pore characteristics of carbons. Carbon 1970, 8. [Google Scholar] [CrossRef]
  32. Tran, K.N.; Bhatia, S.K.; Tomsett, A. Air reactivity of petroleum cokes: Role of inaccessible porosity. Ind. Eng. Chem. Res. 2006, 46, 3265–3274. [Google Scholar] [CrossRef]
  33. Tordai, T. Anode Dusting during the Electrolytic Production of Aluminium; École Polytechnique Fédérale de Lausanne: Lausanne, Switzerland, 2007; p. 351. [Google Scholar]
  34. Chevarin, F.; Alamdari, H.; Lauzon-Gauthier, J.; Azari, K.; Fafard, M.; Duchesne, C.; Ziegler, D. Effects of Microstructural Characteristics on Anode Reactivity. In Proceeedings of the COM-2011 40th Annual conference of metallurgists of CIM, Montréal, QC, Canada, 2–5 October 2011.
  35. Azari, K.; Alamdari, H.; Ammar, H.; Fafard, M.; Adams, A.; Ziegler, D. Influence of mixing parameters on the density and compaction behavior of carbon anodes used in aluminum production. In Thermec 2012; Trans Tech Publications Ltd.: Quebec city, QC, Canada, 2012; pp. 17–22. [Google Scholar]
  36. Azari, K.; Alamdari, H.; Aryanpour, G.; Ziegler, D.; Picard, D.; Fafard, M. Compaction properties of carbon materials used for prebaked anodes in aluminum production plants. Powder Technol. 2013, 246, 650–657. [Google Scholar] [CrossRef]
  37. Azari, K. Investigation of the materials and paste relationship to improve forming process and anode quality. In Mining, Metallurgical and Materials Engineering Department; Laval University: Québec, QC, Canada, 2013; p. 148. [Google Scholar]
  38. Hussein, A.; Larachi, F.; Ziegler, D.; Alamdari, H. Effects of heat treatment and acid washing on properties and reactivity of charcoal. Biomass Bioenergy 2016, 90, 101–113. [Google Scholar] [CrossRef]
  39. Chevarin, F.; Lemieux, L.; Ziegler, D.; Fafard, M.; Alamdari, H. Air and CO2 Reactivity of Carbon Anode and Its Constituents: An Attempt to Understand Dusting Phenomenon. In Light Metals 2015; Springer: New York, NY, USA, 2015; pp. 1147–1152. [Google Scholar]
  40. Chevarin, F.; Azari, K.; Lemieux, L.; Ziegler, D.; Fafard, M.; Alamdari, H. Active pore sizes during the CO2 gasification of carbon anode at 960 °C. Fuel 2016, 178, 93–102. [Google Scholar] [CrossRef]
  41. Chevarin, F.; Lemieux, L.; Picard, D.; Ziegler, D.; Fafard, M.; Alamdari, H. Characterization of carbon anode constituents under CO2 gasification: A try to understand the dusting phenomenon. Fuel 2015, 156, 198–210. [Google Scholar] [CrossRef]
  42. Tran, K.N.; Berkovich, A.J.; Tomsett, A.; Bhatia, S.K. Crystalline Structure Transformation of Carbon Anodes during Gasification. Energy Fuels 2008, 22, 1902–1910. [Google Scholar] [CrossRef]
  43. Chevarin, F.; Azari, K.; Ziegler, D.; Gauvin, R.; Fafard, M.; Alamdari, H. Substrate effect of coke particles on the structure and reactivity of coke/pitch mixtures in carbon anodes. Fuel 2016, 183, 123–131. [Google Scholar] [CrossRef]
  44. D’amore, M.; Tognotti, L.; Sarofim, A. Oxidation rates of a single char particle in an electrodynamic balance. Combust. Flame 1993, 95, 374–382. [Google Scholar] [CrossRef]
  45. Boero, J.R. The reaction of petroleum cokes with air. Carbon 1987, 25, 477–483. [Google Scholar] [CrossRef]
  46. Bhatia, S.K.; Perlmutter, D.D. A random pore model for fluid-solid reactions: I. Isothermal, kinetic control. AIChE J. 1980, 26, 379–386. [Google Scholar] [CrossRef]
  47. Ballal, G.; Zygourakis, K. Evolution of pore surface area during noncatalytic gas-solid reactions. II: Experimental results and model validation. Ind. Eng. Chem. Res. 1987, 26, 1787–1796. [Google Scholar] [CrossRef]
  48. International Organization for Standardization. ISO15901–1. Pore Size Distribution and Porosity of Solid Materials by Mercury Porosimetry and Gas Adsorption—Part 1: Mercury Porosimetry 2005; ISO: Geneva, Switzerland, 2005. [Google Scholar]
  49. Hume, S.M.; Fischer, W.K.; Perruchoud, R.C.; Welch, B.J. Model for petroleum coke reactivity. Light Met. 1993, 525–531. [Google Scholar]
  50. Farr-Wharton, R.; Welch, B.J.; Hannah, R.C.; Dorin, R.; Gardner, H.J. Chemical and electrochemical oxidation of heterogeneous carbon anodes. Electrochim. Acta 1980, 25, 217–221. [Google Scholar] [CrossRef]
  51. Buzunov, V.; Mann, V.; Khramenko, S.; Johnson, J. Influence of Calcination Temperature and Sulfur Level on Coke Properties. In Light Metals 2017; Springer: New York, NY, USA, 2017; pp. 1151–1156. [Google Scholar]
Figure 1. Apparent reaction rate of the anode particles (−4760 + 4000 µm) as a function of carbon conversion at 525 °C, under air atmosphere; analyses performed on a thermo-gravimetric (TG) instrument.
Metals 07 00101 g001
Figure 2. Portions of residue, dust and loss of anode particles gasified at different times (1, 2, 2.5, 3 and 4 h) under air atmosphere at 525 °C; analyses performed on a Fixed Bed Reactor.
Metals 07 00101 g002
Figure 3. Helium density versus carbon conversion of the anode particles gasified at different times (0, 5, 15, 25, 35 and 50 wt %) under air at 525 °C.
Metals 07 00101 g003
Figure 4. (a, b) Pore volume distribution versus the pore size for anode particles gasified under air at 525 °C and at different conversion levels. Pore volume distribution was measured with liquid nitrogen, using Density Functional Theory (DFT) model, and with mercury intrusion.
Metals 07 00101 g004
Figure 5. (a, b) Specific surface areas versus the pore size for anode particles gasified under air at 525 °C and different conversion levels. Pore volume distribution was measured with liquid nitrogen, using DFT model, and with mercury intrusion.
Metals 07 00101 g005
Figure 6. Cumulative surface area for five pore size ranges versus carbon conversion of anode particles.
Metals 07 00101 g006
Figure 7. Cumulative pore volume for five pore size ranges versus carbon conversion of anode particles.
Metals 07 00101 g007
Figure 8. Comparison of internal and external carbon contribution versus the carbon conversion ranges for anode particles gasified under air at 525 °C in a fixed bed reactor.
Metals 07 00101 g008
Table 1. Chemical composition of calcined coke and coal tar pitch.
PropertiesS (wt %)Na (ppmw)Si (ppmw)Ca (ppmw)V (ppmw)Fe (ppmw)Ni (ppmw)
Calcined coke2.13 ± 0.06100 ± 7120 ± 17130 ± 7360 ± 18460 ± 23250 ± 13
Coal tar pitch0.55 ± 0.0248 ± 3254 ± 3671 ± 4N/A209 ± 10N/A
Table 2. Particle size distribution of calcined coke (wt %) used for the preparation of the dry mixture used for the fabrication of prebaked anodes.
Particle Sizes (US Mesh)−4 + 8−8 + 16−16 + 30−30 + 50−50 + 100−100 + 200Fines (4000 BN *)
Particle sizes (µm)Superior limit−4760−2380−1410−595−297−149−149
Inferior limit+2380+1410+595+297+149+74-
Coke (wt %)22.010.011.512.78.810.824.2
* BN: Blaine Number.
Table 3. Properties of the particles of baked anode.
PropertiesSNaSiCaVFeNiLCParticle Weight
Unit(wt %)(ppmw)(ppmw)(ppmw)(ppmw)(ppmw)(ppmw)(nm)(mg)
Value1.816506243772241193412.973.2
Standard deviation0.05913119118170.122.0
Table 4. Pore volumes measured by nitrogen adsorption and mercury infiltration for five pore size ranges.
Carbon Conversion (wt %)Pore Size Range (µm)
0.0014–0.00200.002–0.0250.025–0.1000.1–40.0Superior at 40
Pore Volume (mm3/g)
Measured by Nitrogen Adsorption
Pore Volume (cm3/g)
Measured by Mercury Infiltration
00.142 ± 0.0420.216 ± 0.0190.181 ± 0.0320.123 ± 0.0120.084 ± 0.006
50.753 ± 0.0300.900 ± 0.1470.151 ± 0.0440.145 ± 0.0110.100 ± 0.004
150.905 ± 0.0502.616 ± 0.1450.157 ± 0.0170.230 ± 0.0340.079 ± 0.008
250.802 ± 0.0024.740 ± 0.1480.261 ± 0.0100.272 ± 0.0610.092 ± 0.013
350.434 ± 0.0084.088 ± 0.3180.190 ± 0.0290.363 ± 0.1050.121 ± 0.022
500.225 ± 0.0703.400 ± 0.1500.240 ± 0.0210.588 ± 0.0540.221 ± 0.051
Table 5. Carbon conversion, carbon amount and contribution for the pore size inferior and superior to 40 µm.
Carbon Conversion Range (wt %)0–55–1515–2525–3535–50
Total carbon amount remaining for an initial amount of sample of 1 g0.950.850.750.650.5
Total amount of carbon loss (g)0.050.150.250.350.5
Amount of carbon loss associated at the pore volume variation in the pores inferior at 40 µm (g)0.0430.1460.0660.1170.222
Amount of carbon loss associated at the pore volume variation in the pores superior at 40 µm (g)0.0070.0040.1840.2330.278
Total carbon conversion (%)515253550
Carbon conversion in the pores inferior at 40 µm (%)4.314.66.611.722.2
Carbon conversion in the pores superior at 40 µm (%)0.70.418.423.327.8
Internal contribution, inferior at 40 µm (%)86.097.326.433.444.4
External contribution, superior at 40 µm (%)14.02.773.866.755.6

