
Microstructure Evolution and Biodegradation Behavior of Laser Rapid Solidified Mg–Al–Zn Alloy


Abstract
:1. Introduction
2. Materials and Methods
2.1. Material
2.2. Processing
2.3. Microstructure and Mechanical Characterization
2.4. Immersion Measurements
2.5. Statistical Analysis
3. Results and Discussion
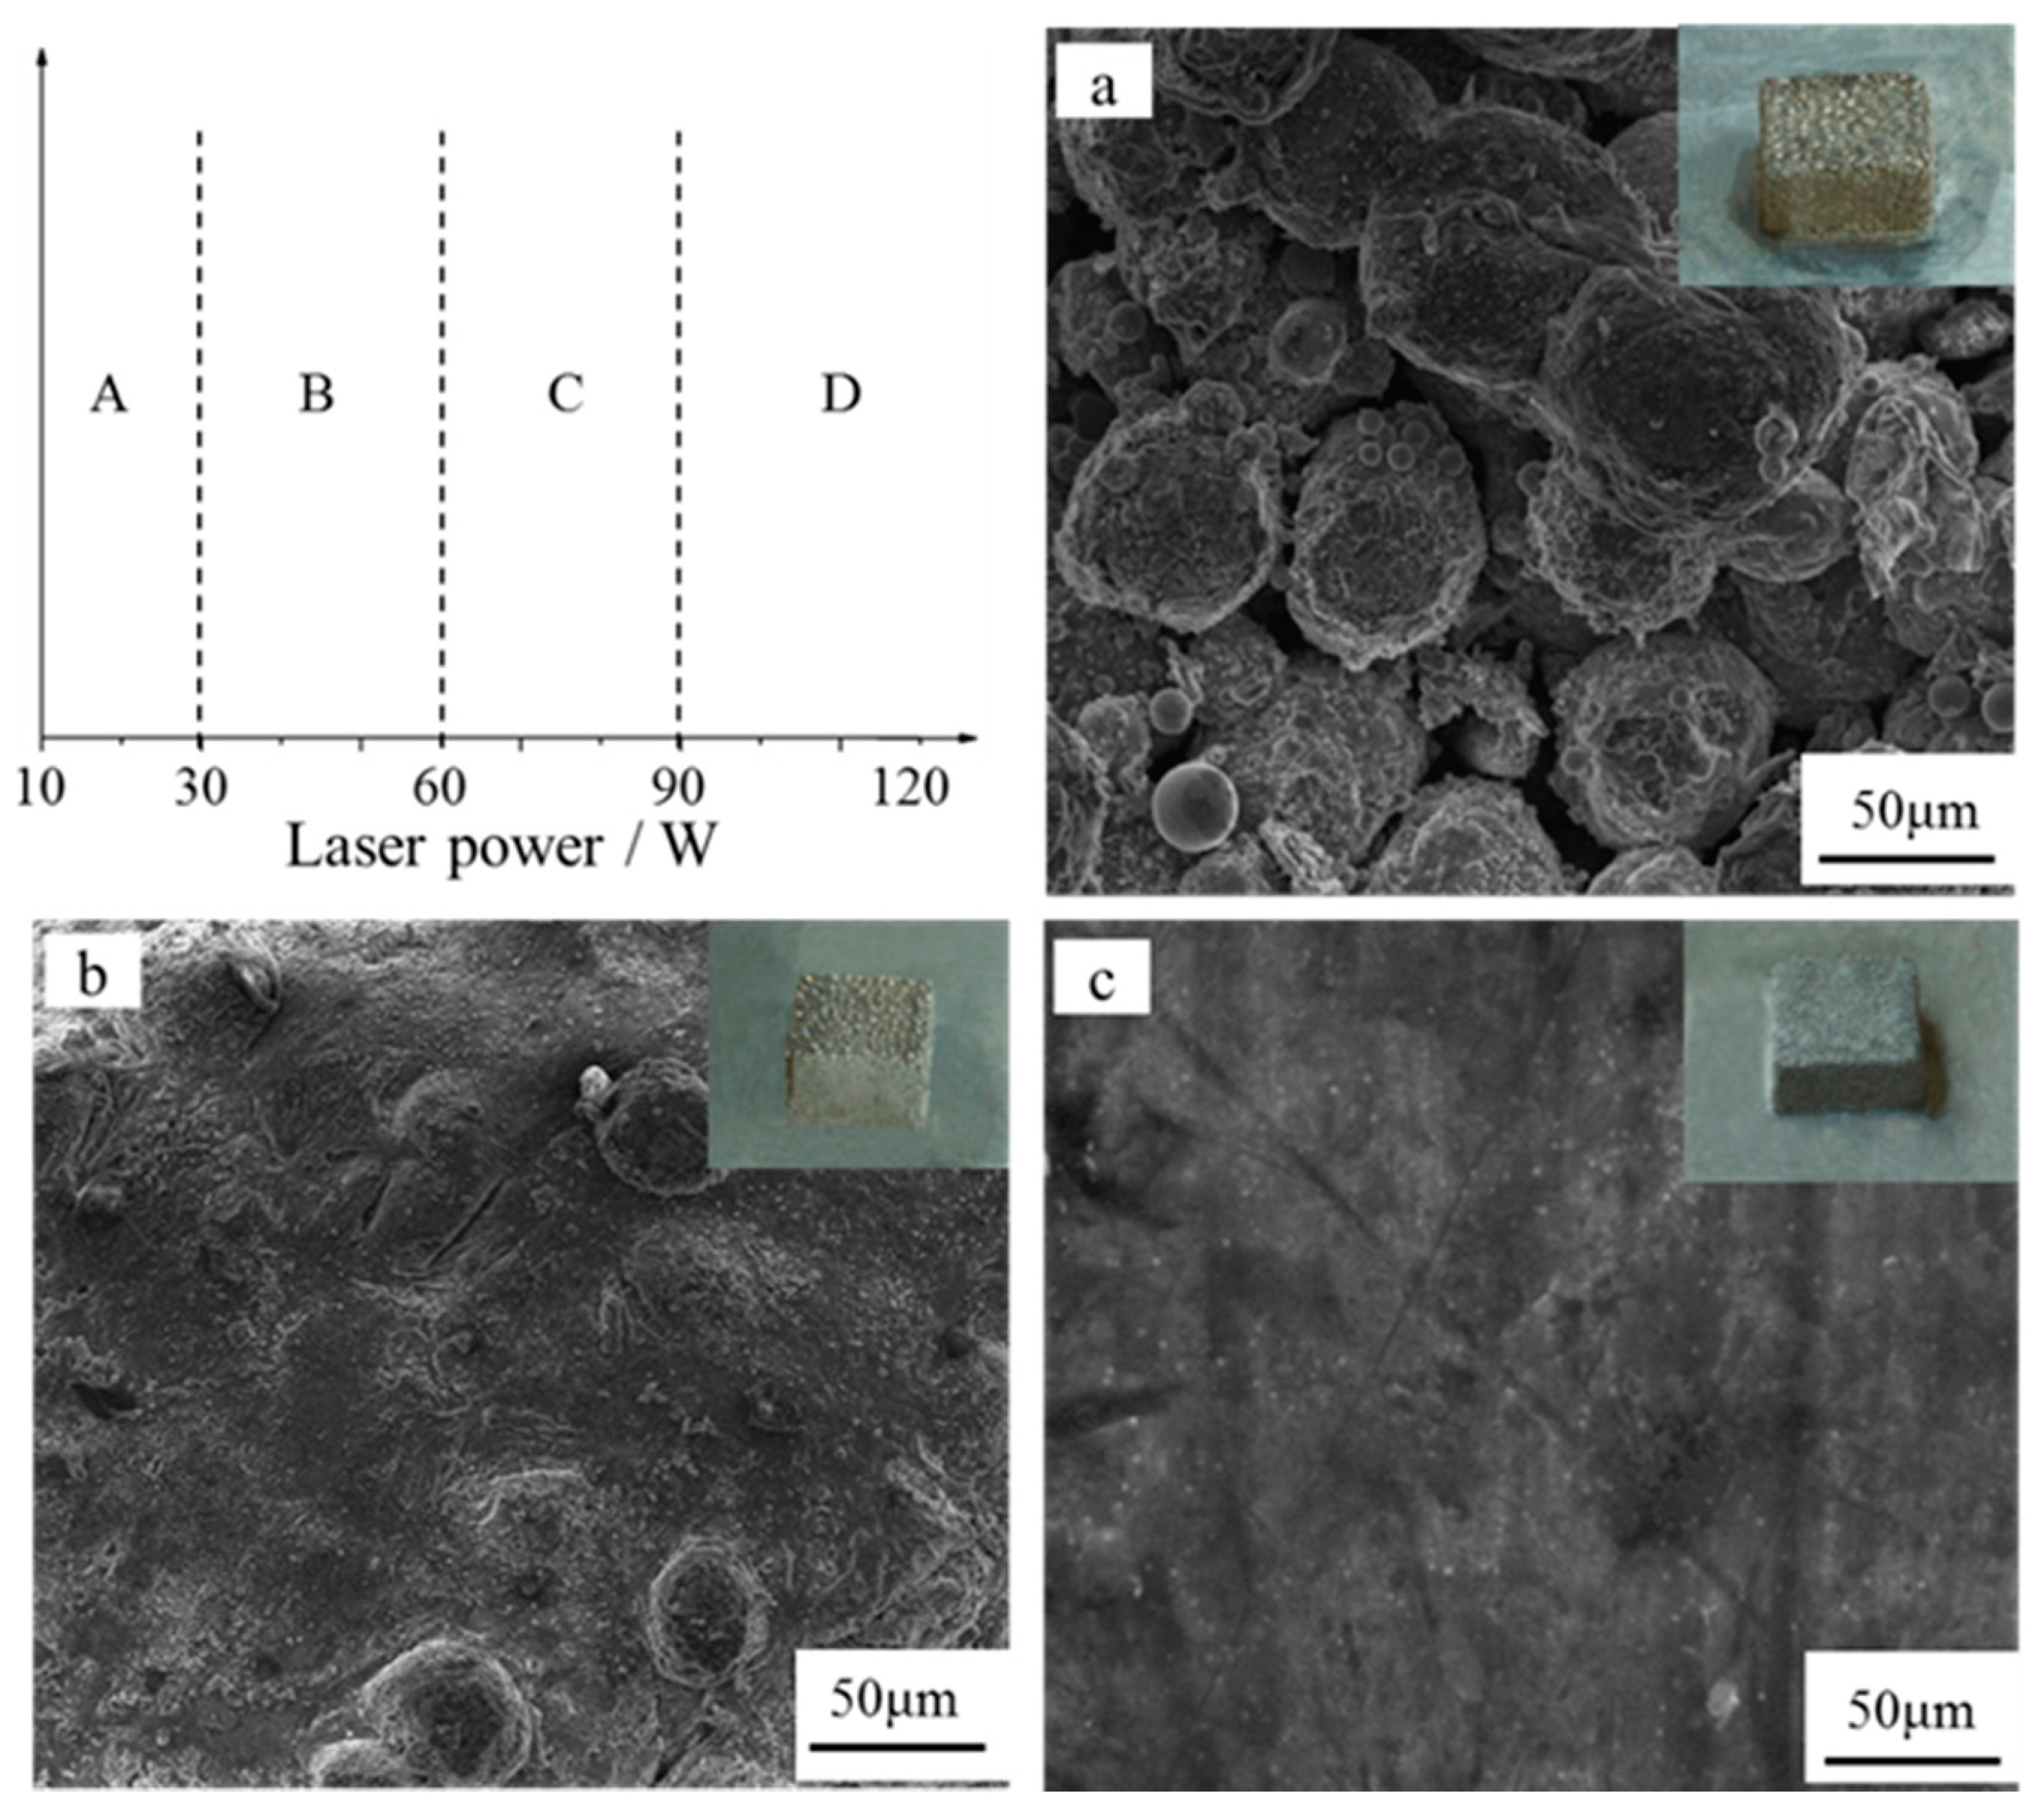
3.1. Formability
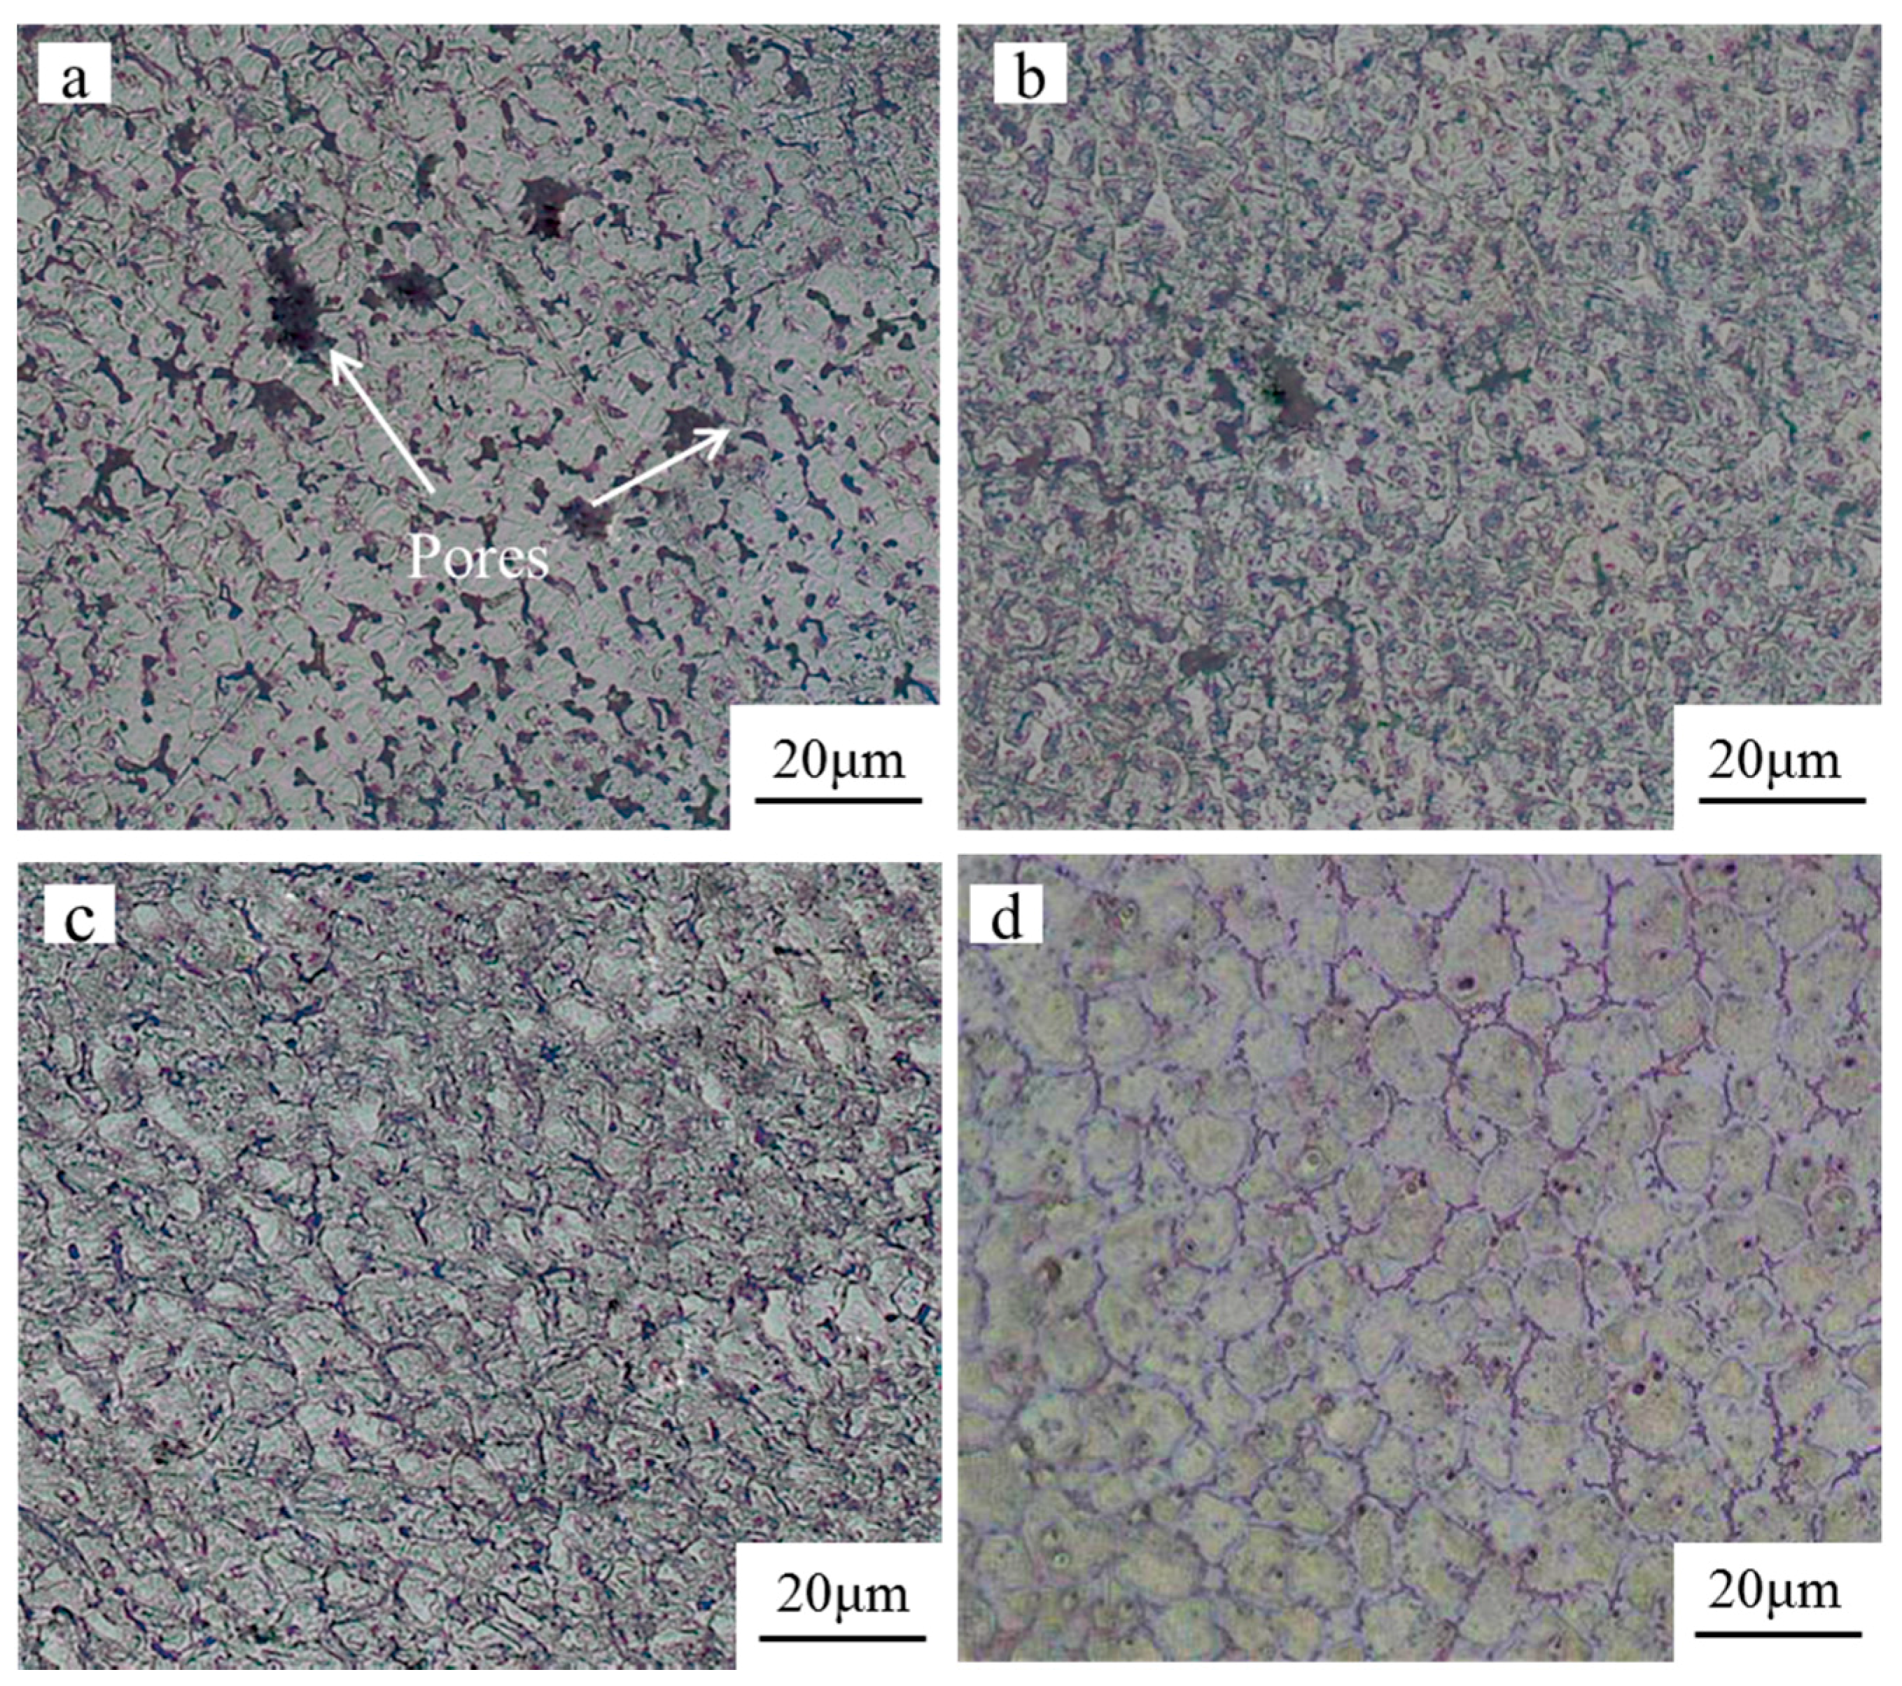
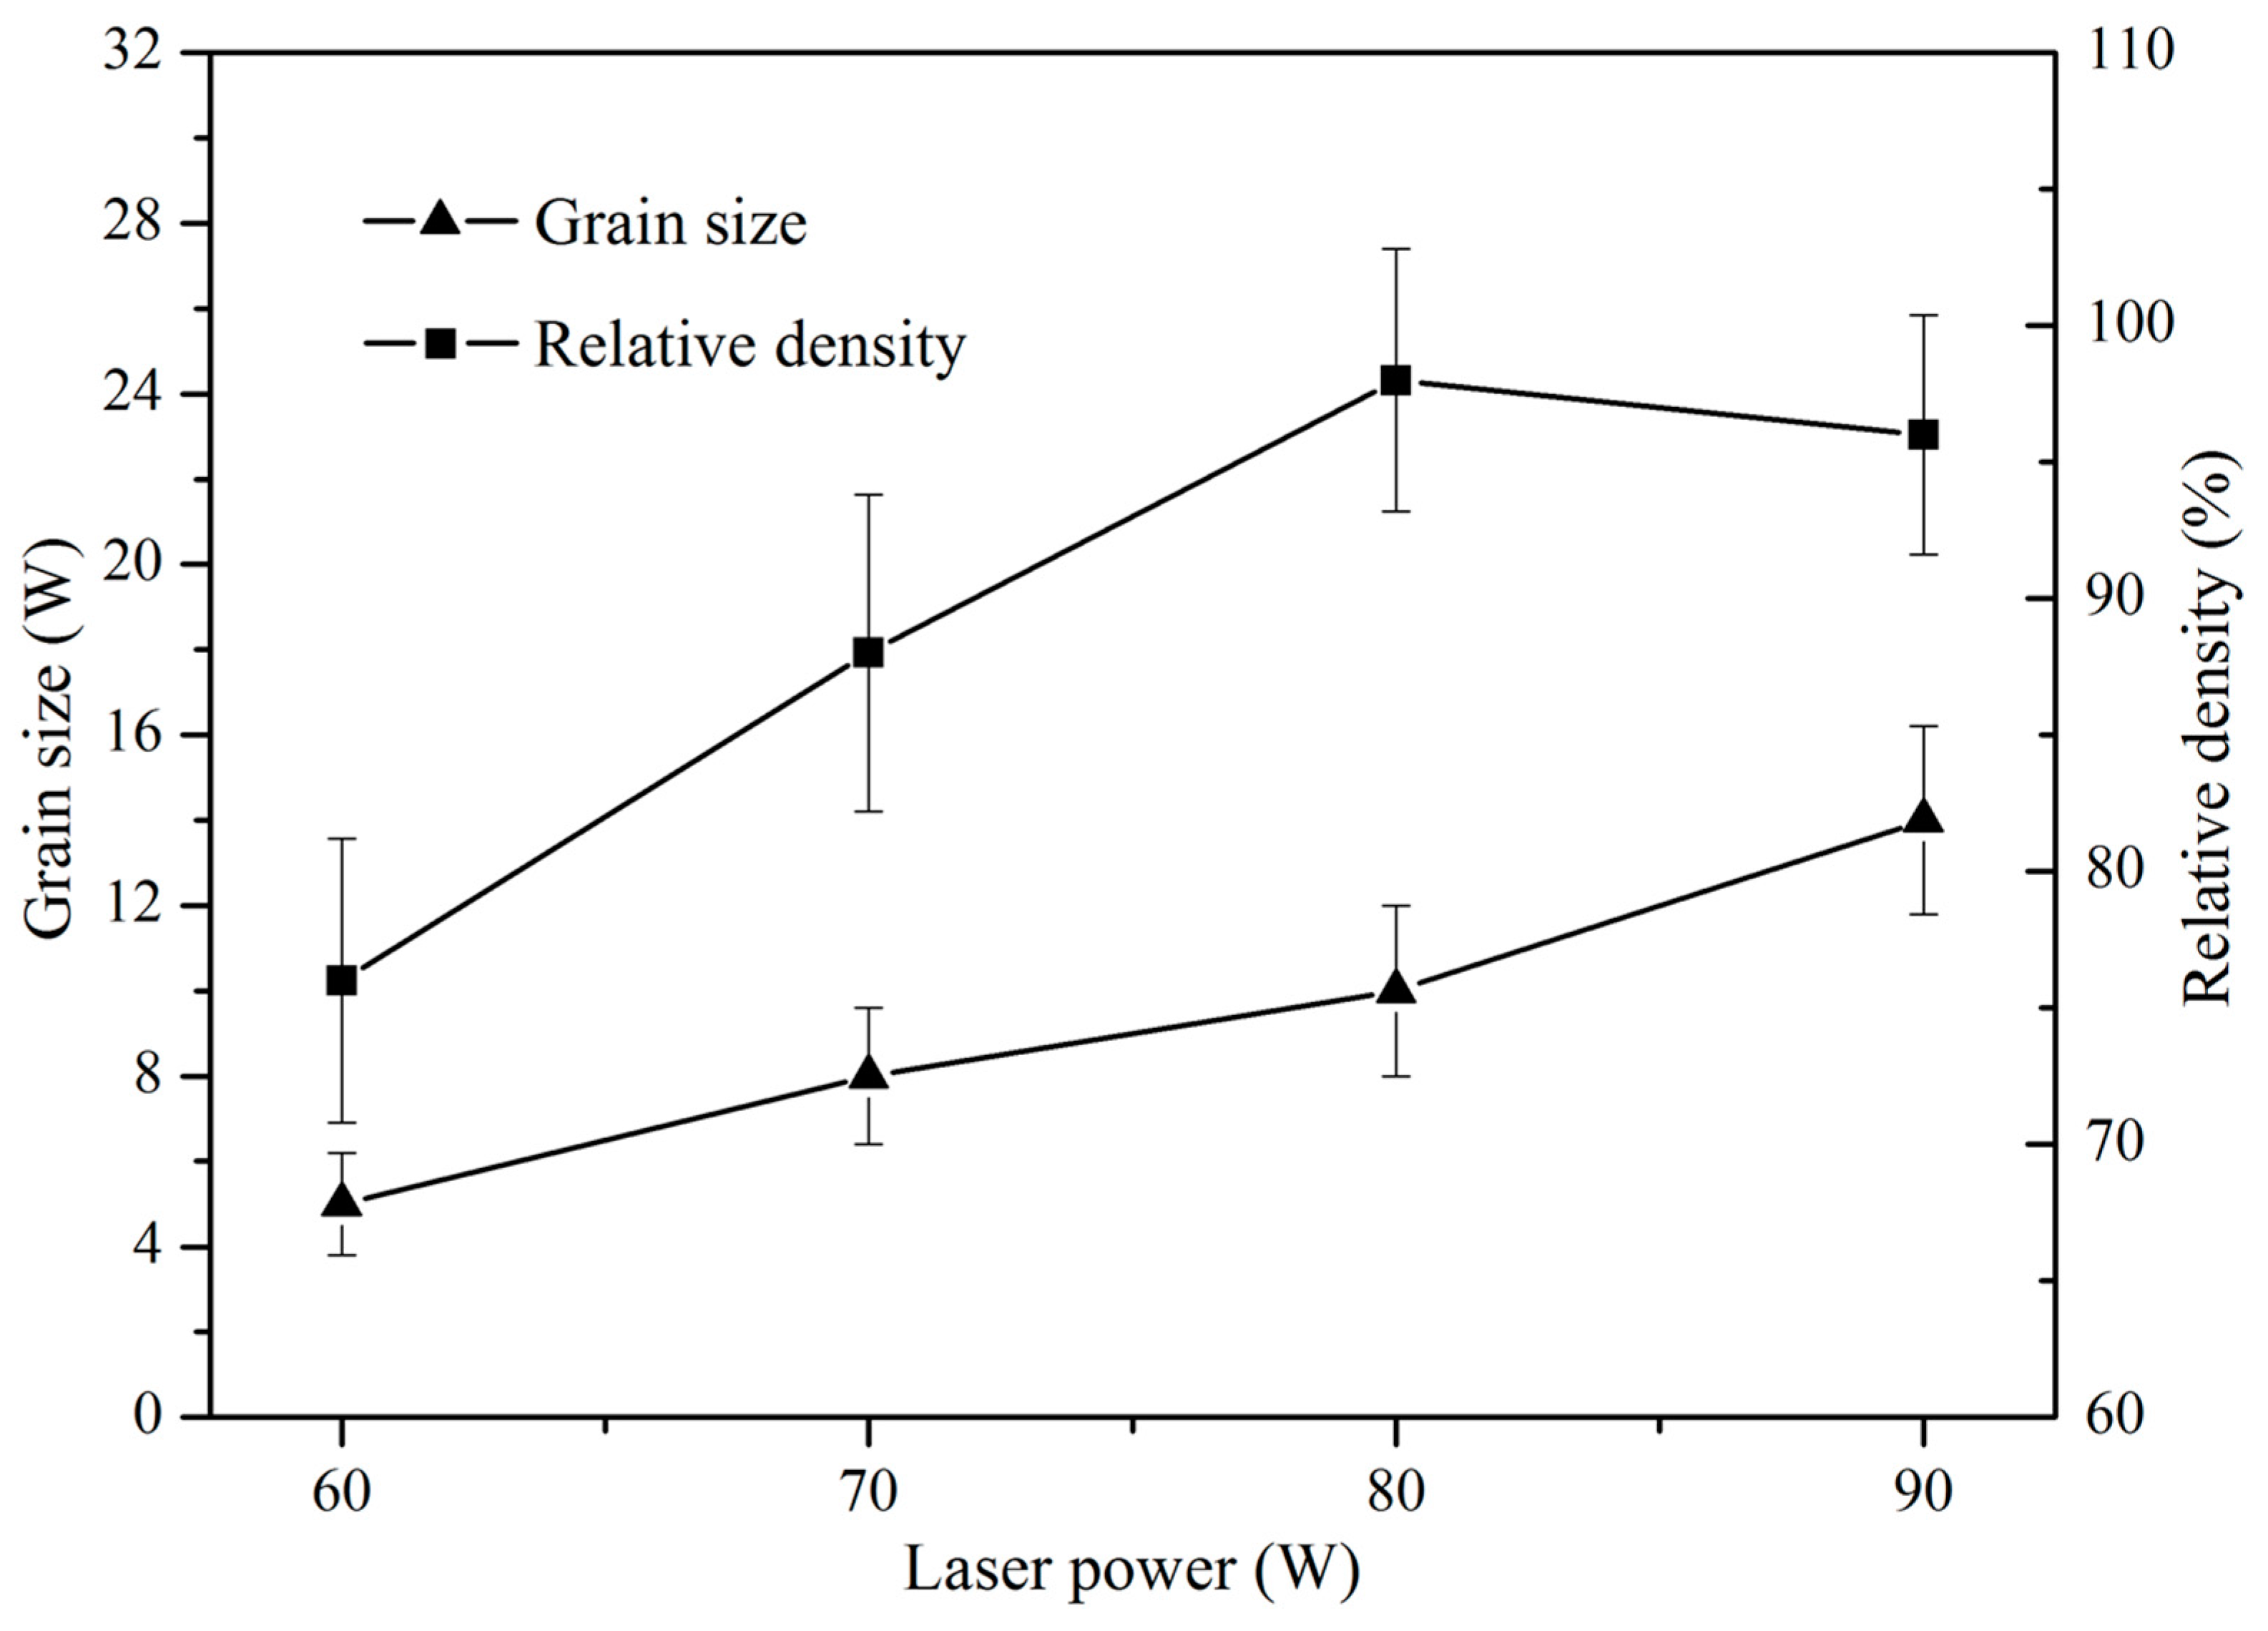
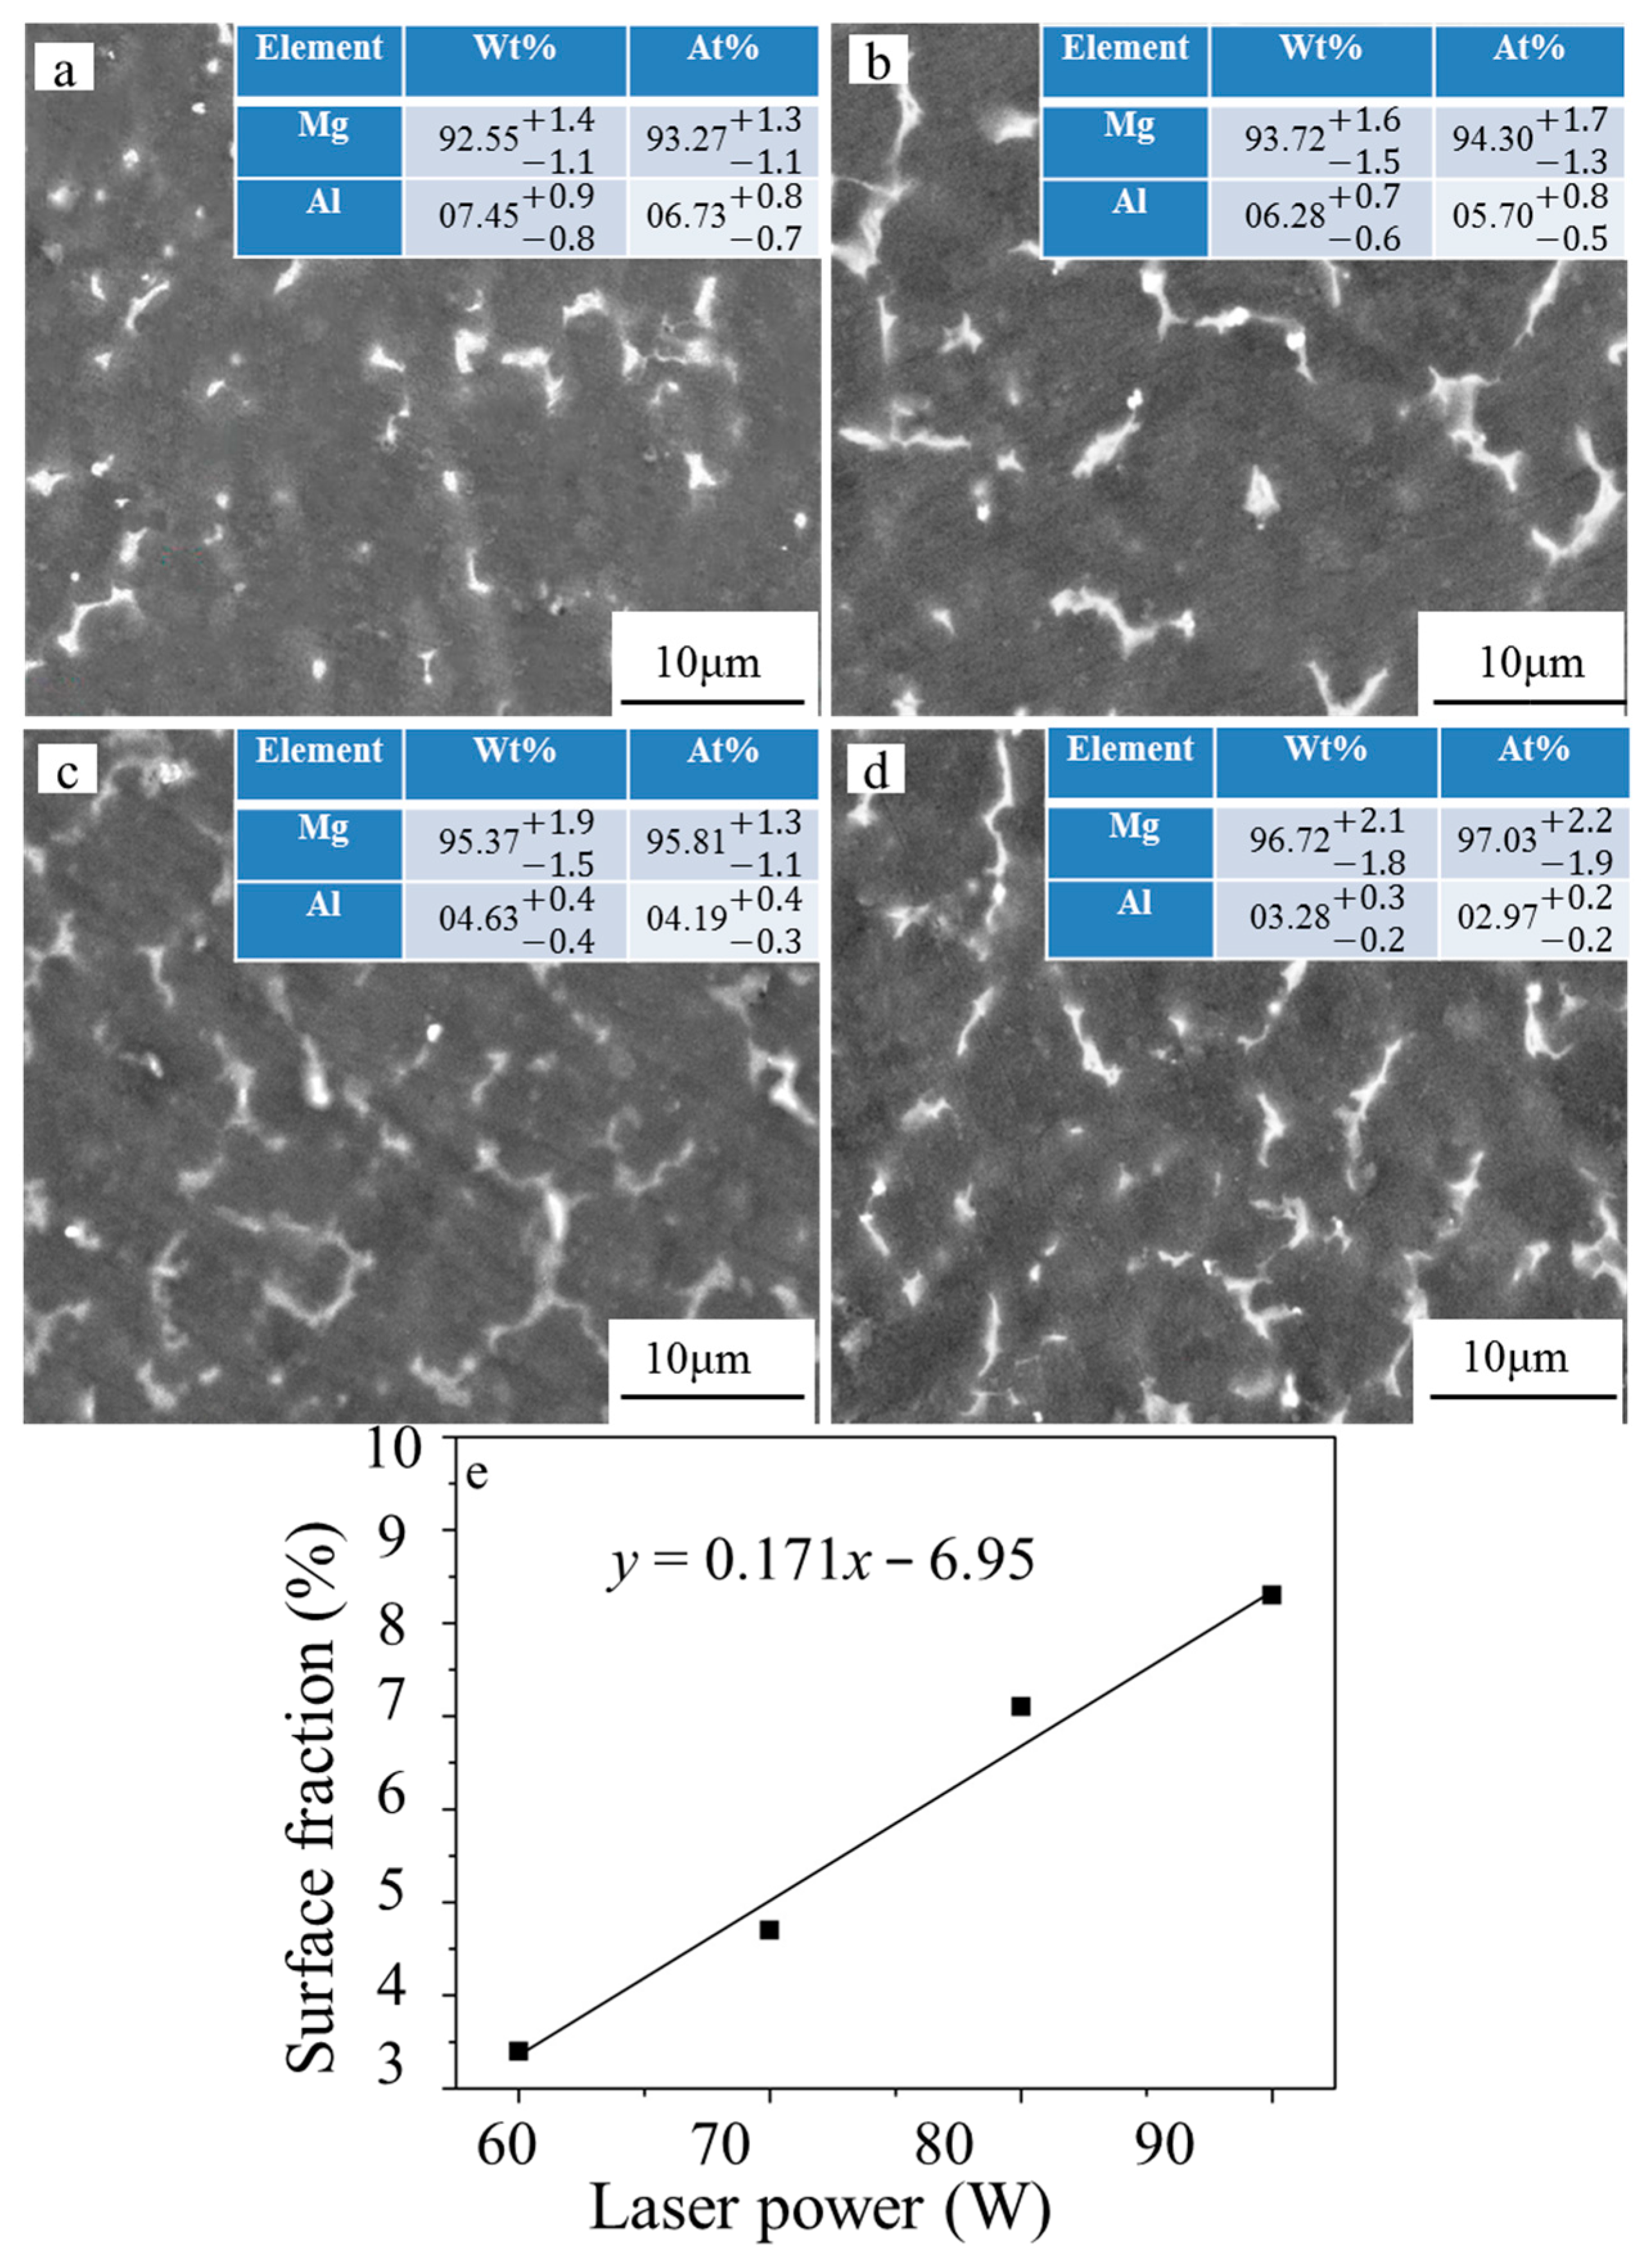
3.2. Microstructure Characterization
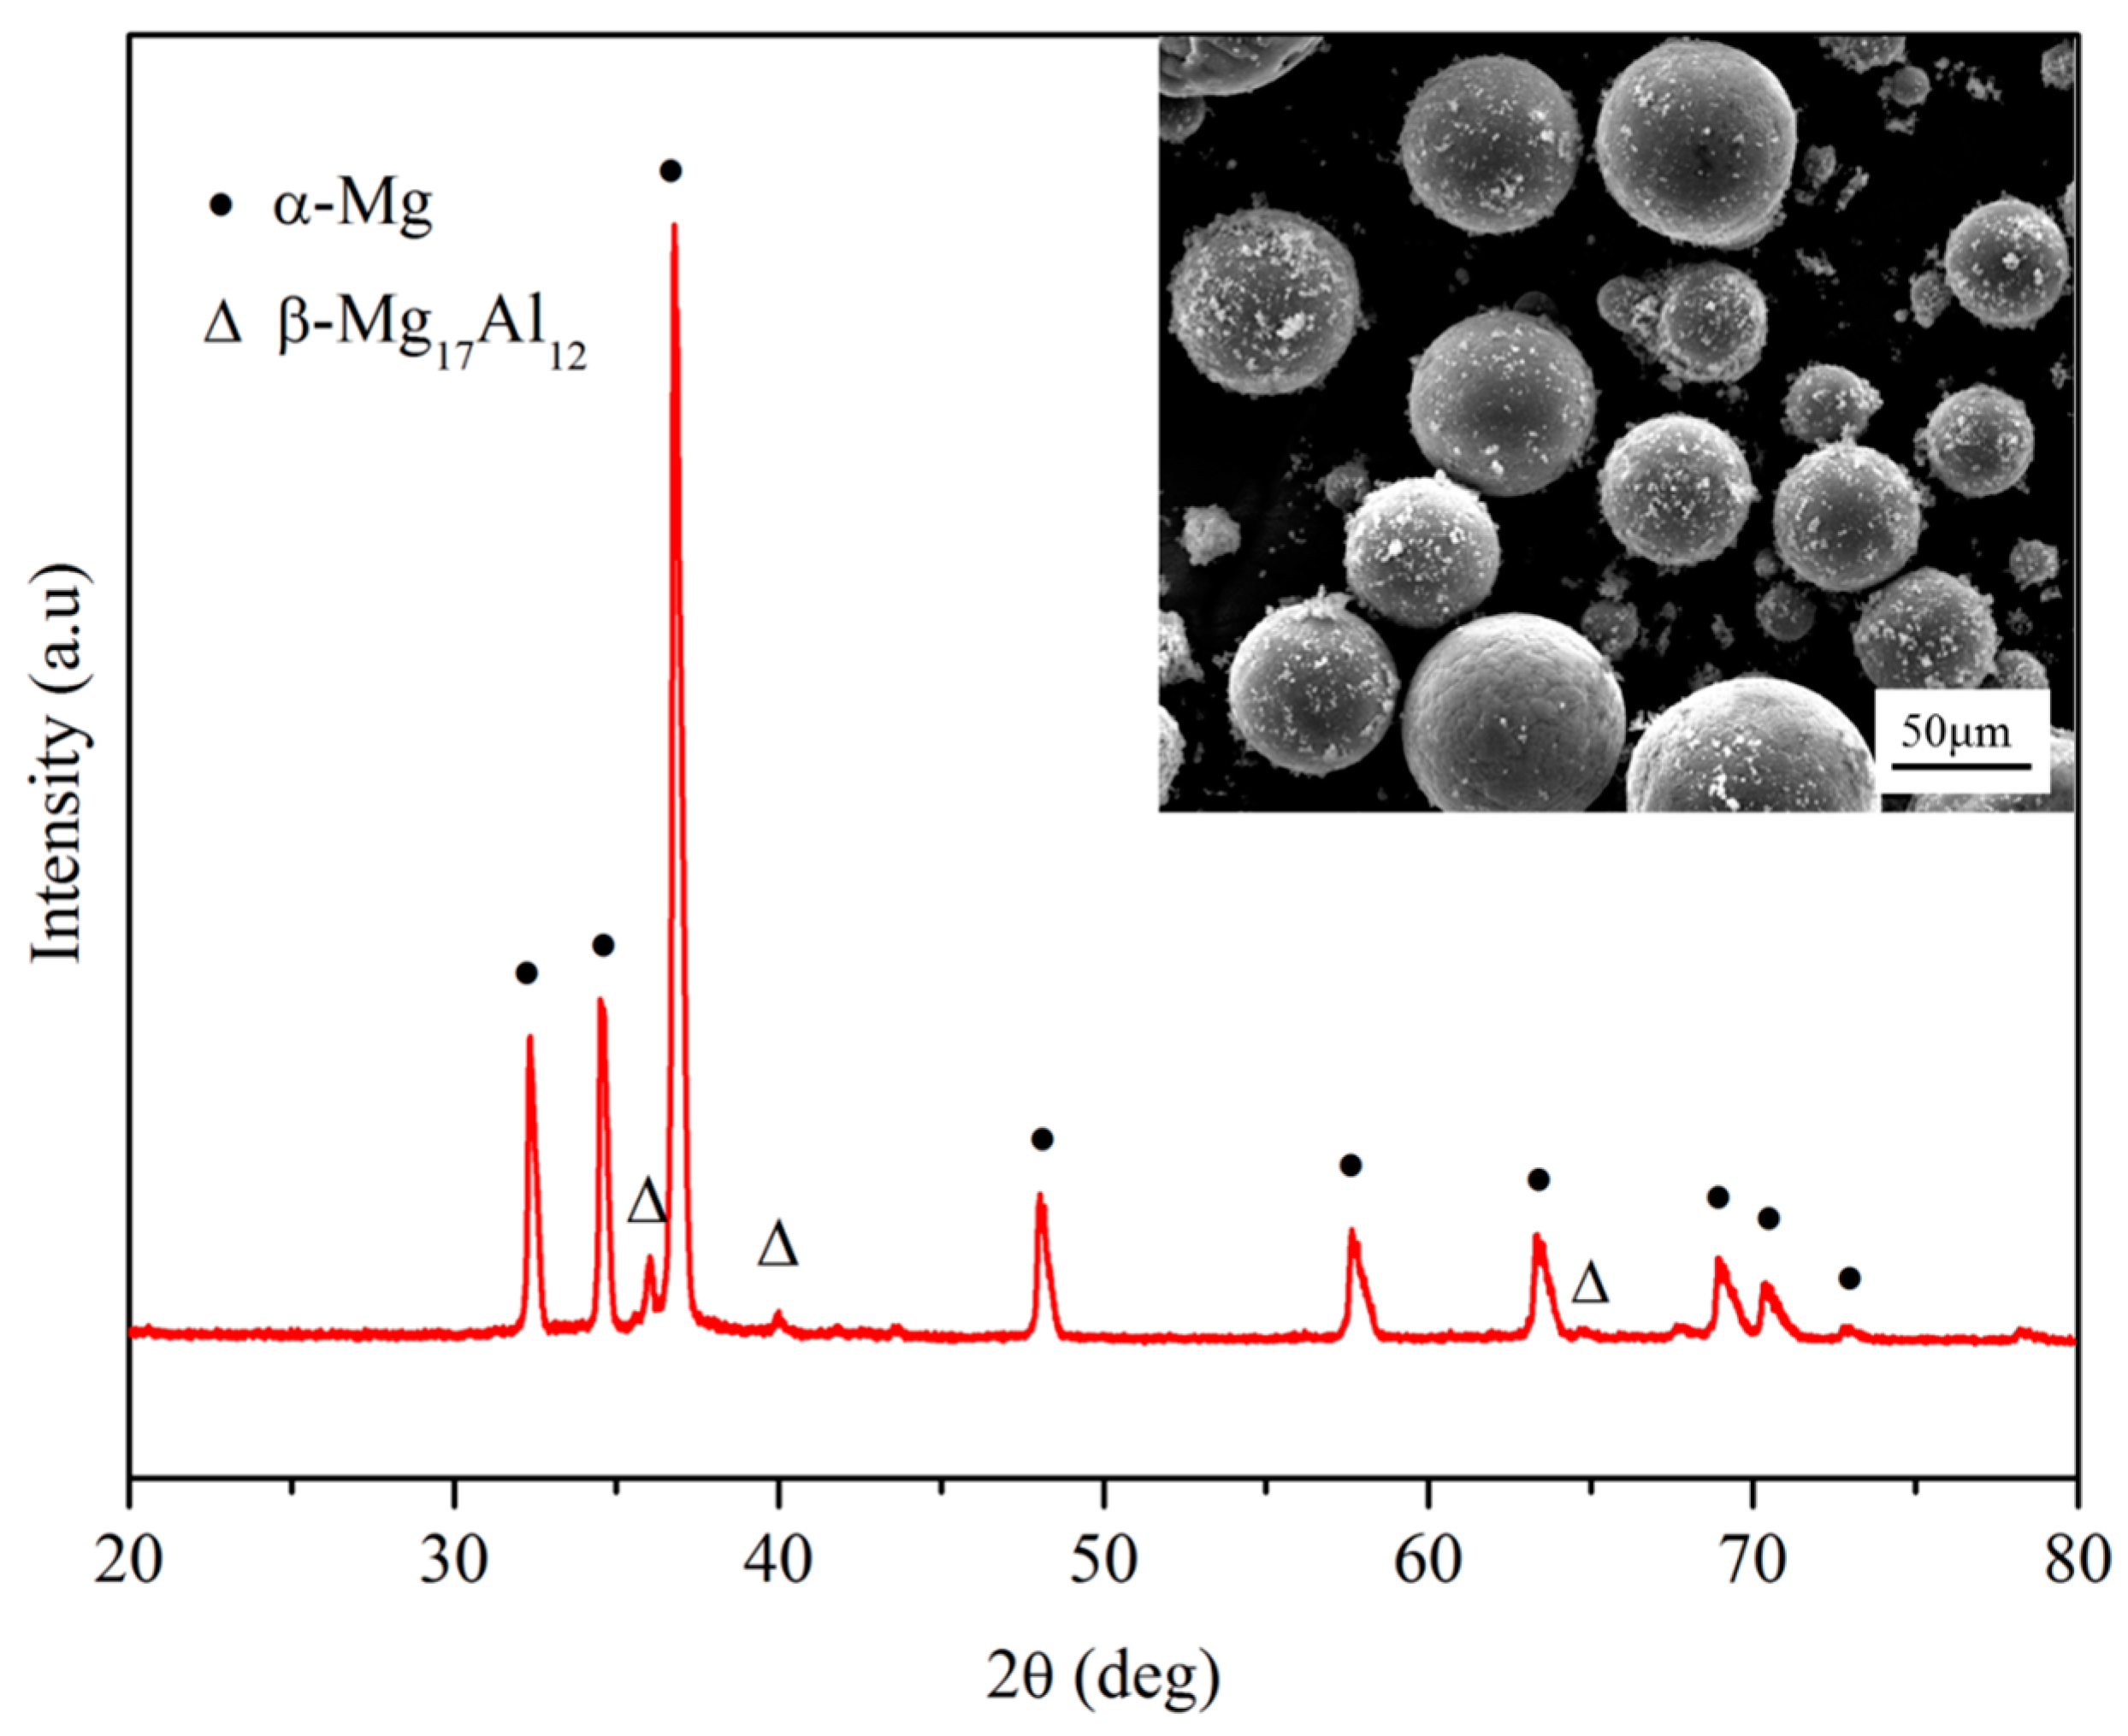
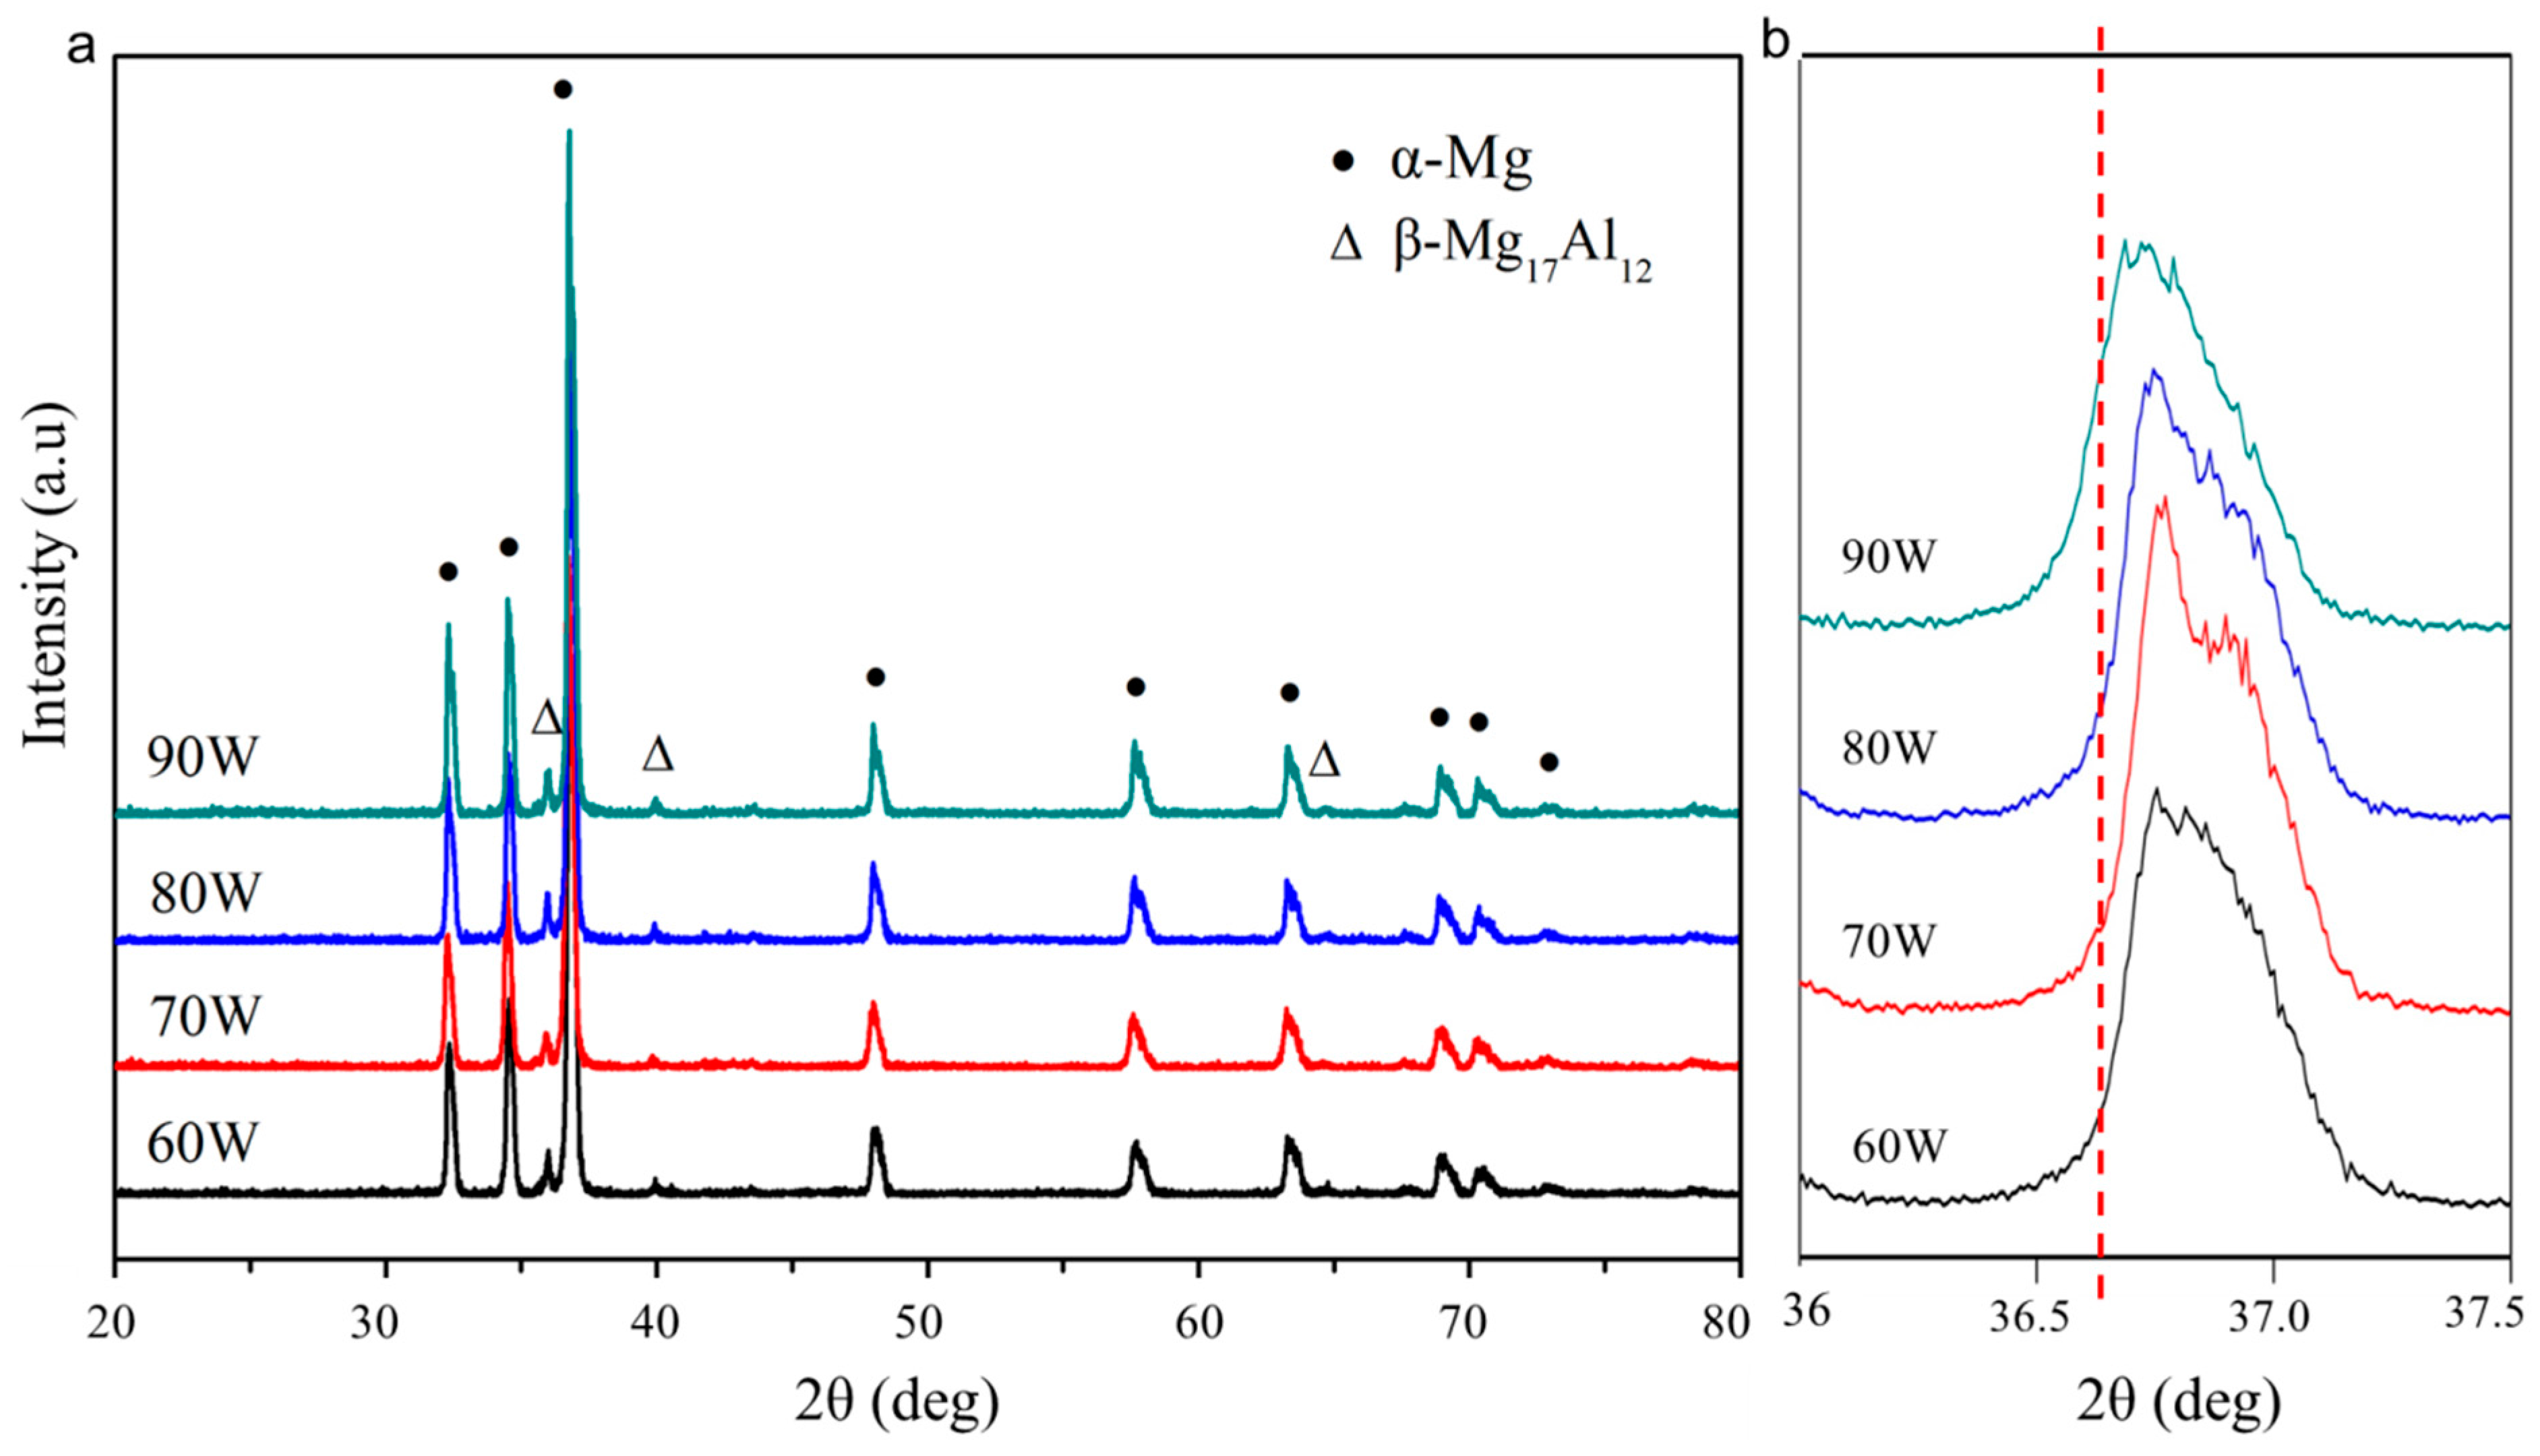
3.3. Phase and Dispersion
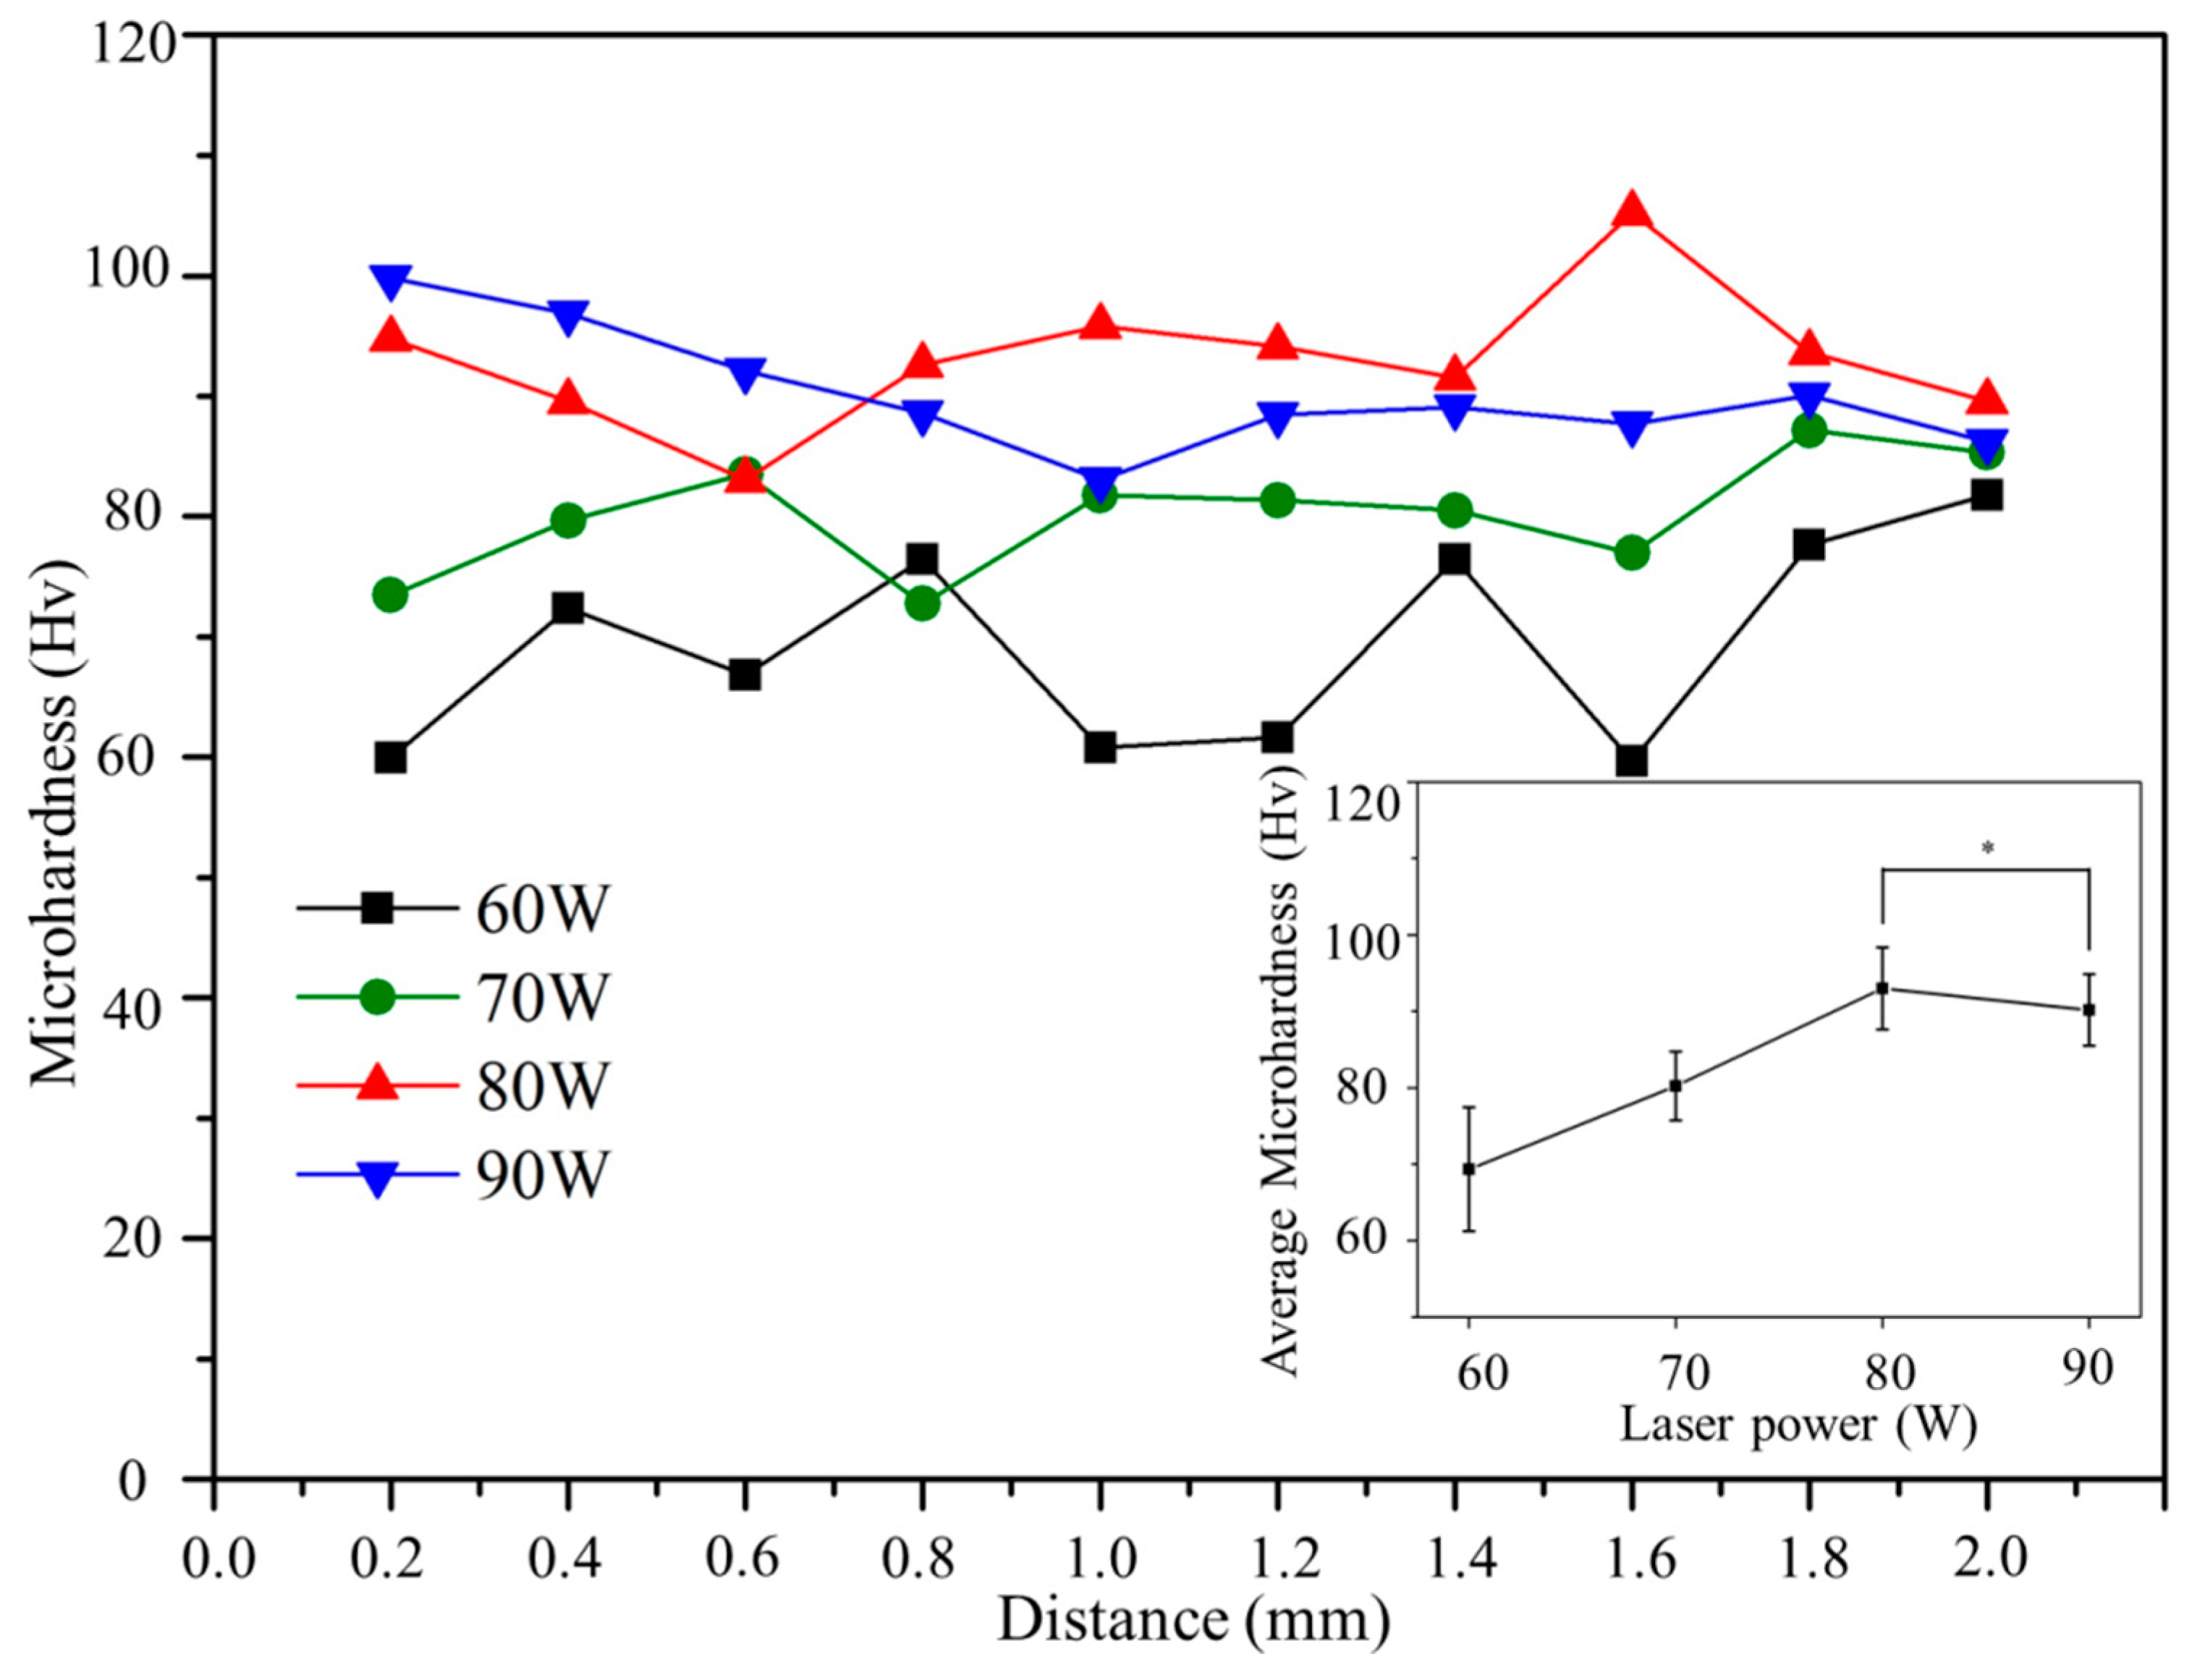
3.4. Microhardness
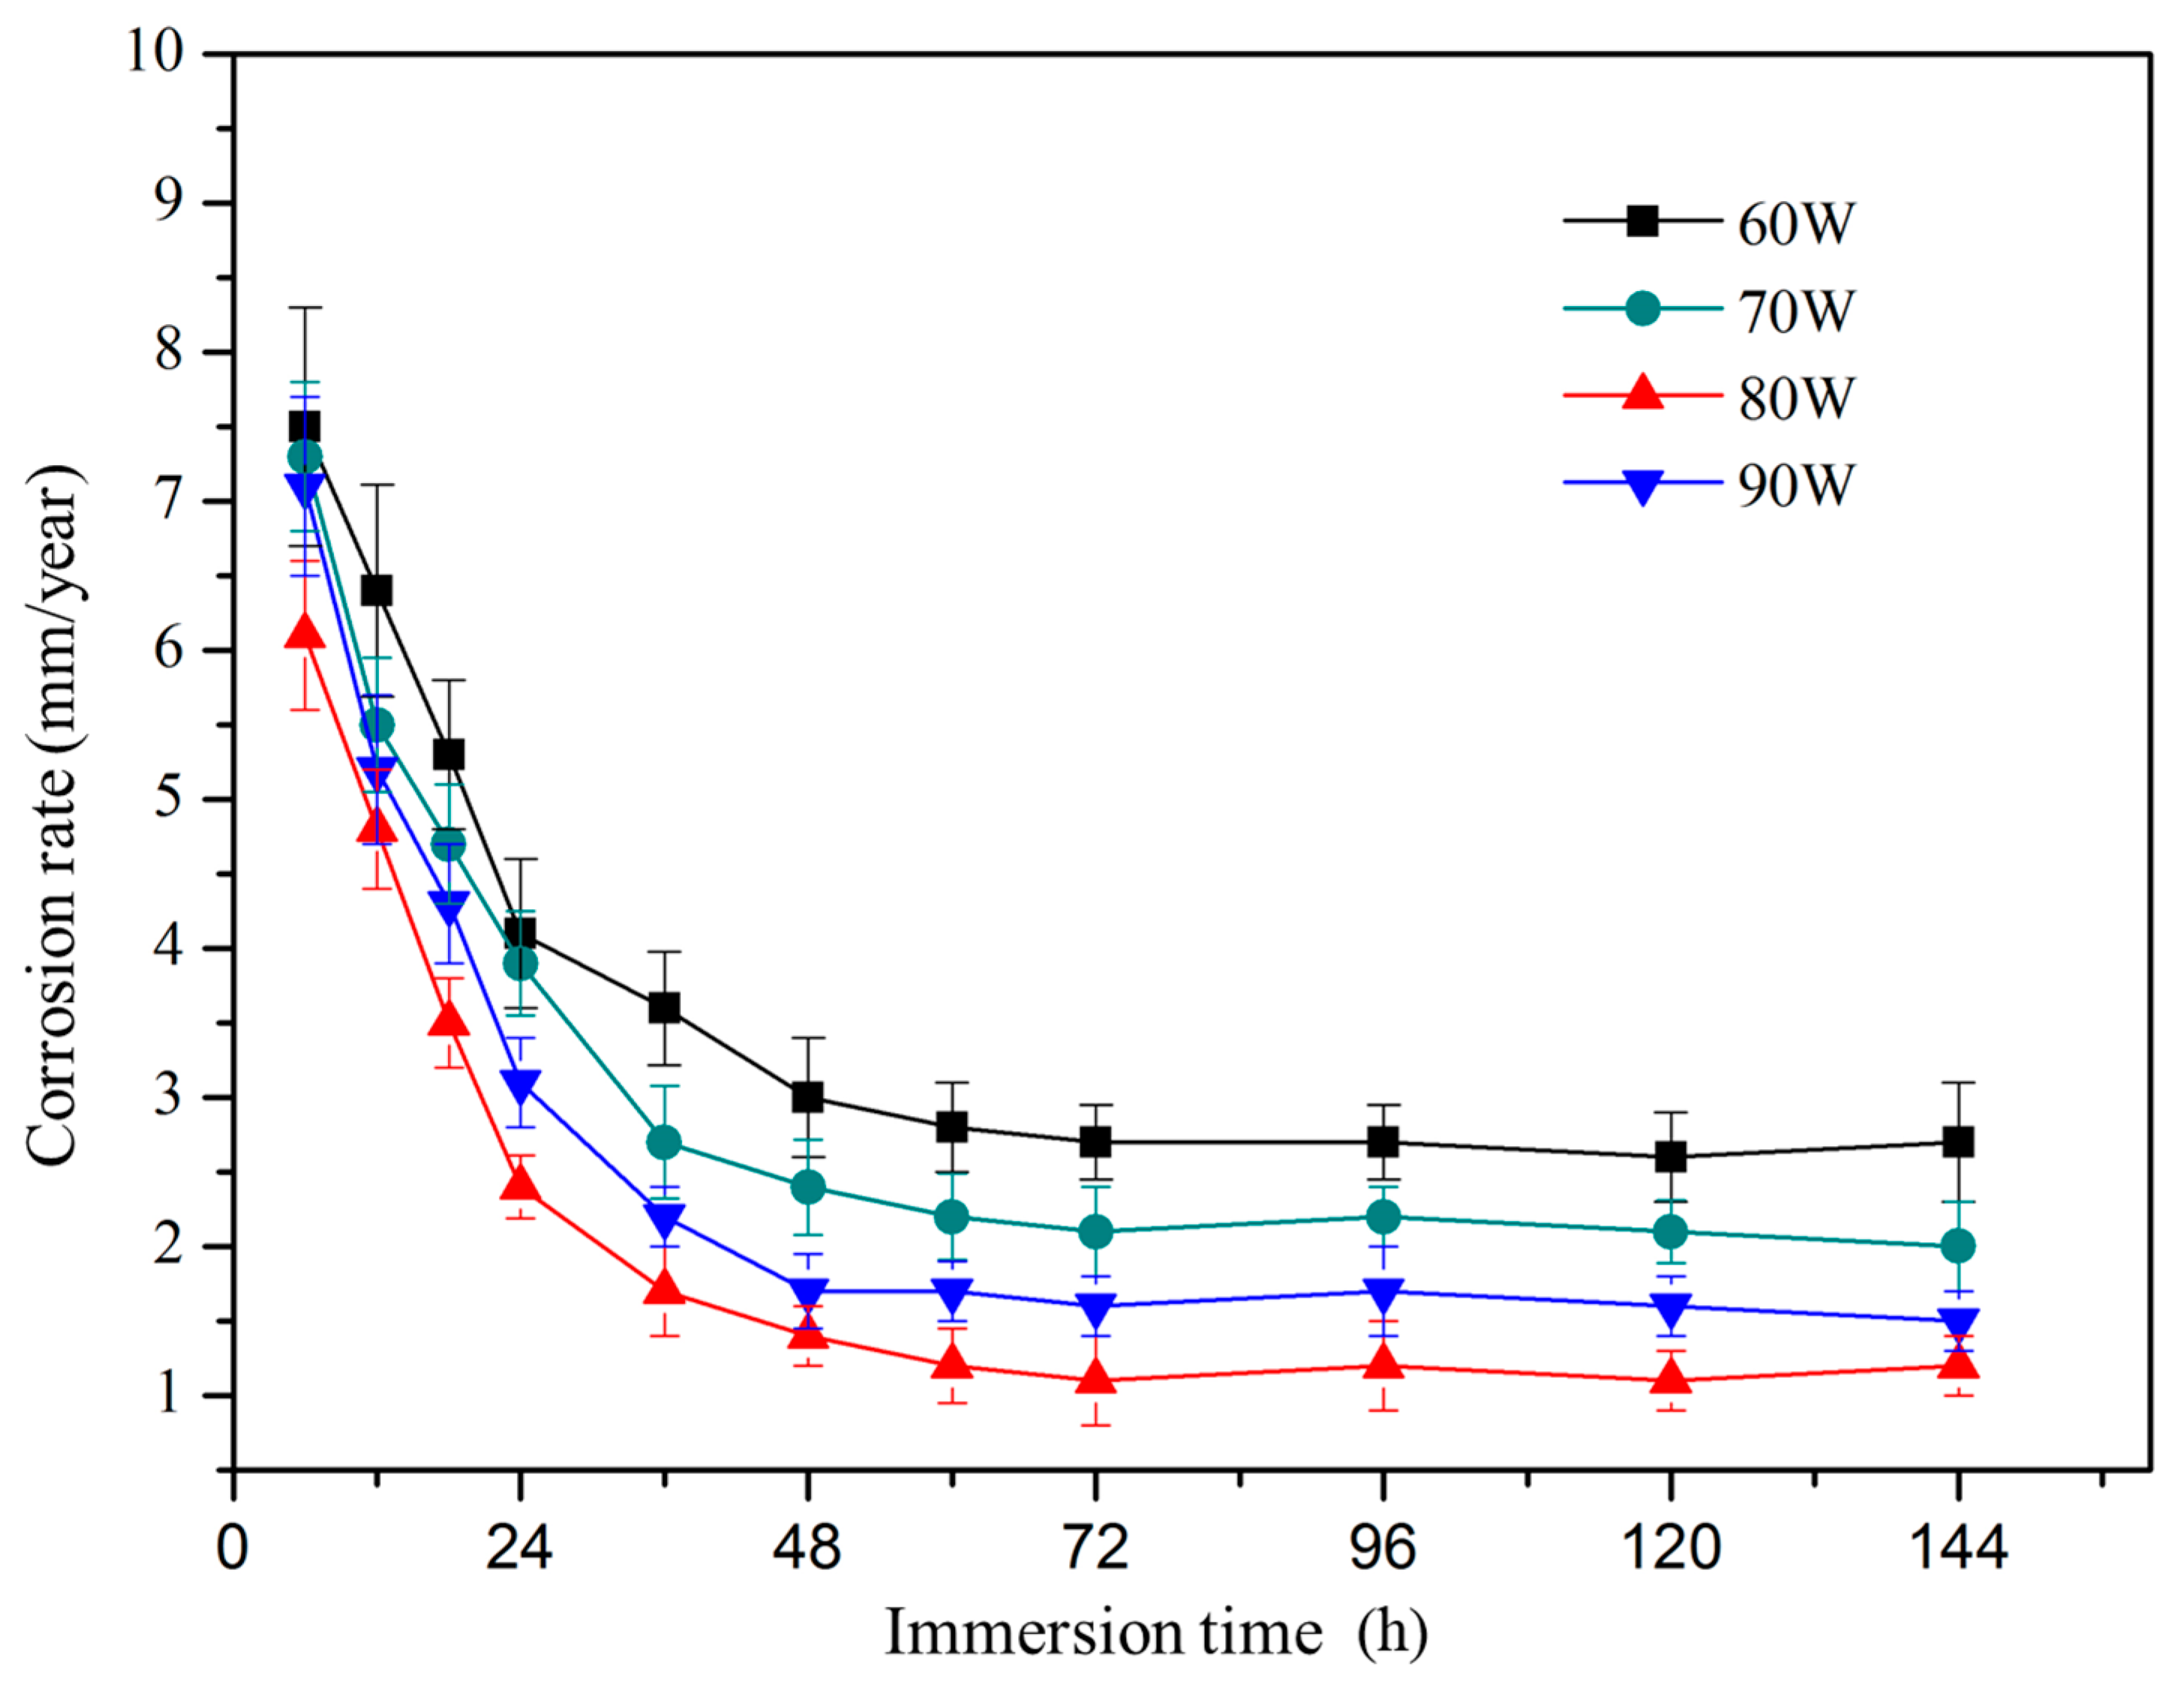
3.5. Degradation
4. Conclusions
Acknowledgments
Author Contributions
Conflicts of Interest
References
- Song, G. Control of biodegradation of biocompatable magnesium alloys. Corros. Sci. 2007, 49, 1696–1701. [Google Scholar] [CrossRef]
- Virtanen, S. Biodegradable Mg and Mg alloys: Corrosion and biocompatibility. Mater. Sci. Eng. B 2011, 176, 1600–1608. [Google Scholar] [CrossRef]
- Jemimah, W.; Shaylin, S.; Woodfield, T.B.F.; Staiger, M.P.; Dias, G.J. Magnesium biomaterials for orthopedic application: A review from a biological perspective. J. Biomed. Mater. Res. Part B Appl. Biomater. 2014, 102, 1316–1331. [Google Scholar]
- Aghion, E.; Jan, L.; Meshi, L.; Goldman, J. Increased corrosion resistance of the AZ80 magnesium alloy by rapid solidification. J. Biomed. Mater. Res. Part B Appl. Biomater. 2015, 103, 1541–1548. [Google Scholar] [CrossRef] [PubMed]
- Zhang, L.; Cao, Z.Y.; Liu, Y.B.; Su, G.H.; Cheng, L.R. Effect of Al content on the microstructures and mechanical properties of Mg–Al alloys. Mater. Sci. Eng. A. 2009, 508, 129–133. [Google Scholar] [CrossRef]
- Taltavull, C.; Torres, B.; Lopez, A.J.; Rodrigo, P.; Otero, E.; Atrens, A.; Rams, J. Corrosion behaviour of laser surface melted magnesium alloy AZ91D. Mater. Des. 2014, 57, 40–50. [Google Scholar] [CrossRef]
- Liu, C.; Liang, J.; Zhou, J.; Wang, L.; Li, Q. Effect of laser surface melting on microstructure and corrosion characteristics of AM60B magnesium alloy. Appl. Surface Sci. 2015, 343, 133–140. [Google Scholar] [CrossRef]
- Taltavull, C.; Torres, B.; López, A.J.; Rodrigo, P.; Otero, E.; Rams, J. Selective laser surface melting of a magnesium–aluminium alloy. Mater. Lett. 2012, 85, 98–101. [Google Scholar] [CrossRef]
- Yang, Y.; Wu, P.; Lin, X.; Liu, Y.; Bian, H.; Zhou, Y.; Gao, C.; Shuai, C. System development, formability quality and microstructure evolution of selective laser-melted magnesium. Virtual Phys. Prototyp. 2016, 11, 173–181. [Google Scholar] [CrossRef]
- Xie, D.; Zhao, J.; Qi, Y.; Li, Y.; Shen, L.; Xiao, M. Decreasing pores in a laser cladding layer with pulsed current. Chin. Opt. Lett. 2013, 11, 54–57. [Google Scholar]
- Ralston, K.D.; Birbilis, N. Effect of Grain Size on Corrosion: A Review. Corrosion 2010, 66, 319–324. [Google Scholar] [CrossRef]
- Thijs, L.; Verhaeghe, F.; Craeghs, T.; Humbeeck, J.V.; Kruth, J.P. A study of the microstructural evolution during selective laser melting of Ti–6Al–4V. Acta Mater. 2010, 58, 3303–3312. [Google Scholar] [CrossRef]
- Ding, Y.; Wen, C.; Hodgson, P.; Li, Y. Effects of alloying elements on the corrosion behavior and biocompatibility of biodegradable magnesium alloys: A review. J. Mater. Chem. 2014, 2, 1912–1933. [Google Scholar] [CrossRef]
- Li, R.; Shi, Y.; Wang, Z.; Li, W.; Liu, J.; Wei, J. Densification behavior of gas and water atomized 316L stainless steel powder during selective laser melting. Appl. Surf. Sci. 2010, 256, 4350–4356. [Google Scholar] [CrossRef]
- Song, B.; Dong, S.; Zhang, B.; Liao, H.; Coddet, C. Effects of processing parameters on microstructure and mechanical property of selective laser melted Ti6Al4V. Mater. Des. 2012, 35, 120–125. [Google Scholar] [CrossRef]
- Wang, Z.; Guan, K.; Gao, M.; Li, X.; Chen, X.; Zeng, X. The microstructure and mechanical properties of deposited-IN718 by selective laser melting. J. Alloys Compd. 2012, 513, 518–523. [Google Scholar] [CrossRef]
- Ng, C.C.; Savalani, M.M.; Lau, M.L.; Man, H.C. Microstructure and mechanical properties of selective laser melted magnesium. Appl. Surface Sci. 2011, 257, 7447–7454. [Google Scholar] [CrossRef]
- Wei, K.; Gao, M.; Wang, Z.; Zeng, X. Effect of energy input on formability, microstructure and mechanical properties of selective laser melted AZ91D magnesium alloy. Mater. Sci. Eng. A 2014, 611, 212–222. [Google Scholar] [CrossRef]
- Zhou, Y.; Wu, P.; Yang, Y.; Gao, D.; Feng, P.; Gao, C.; Wu, H.; Liu, Y.; Bian, H.; Shuai, C. The microstructure, mechanical properties and degradation behavior of laser-melted Mg–Sn alloys. J. Alloys Compd. 2016, 687, 109–114. [Google Scholar] [CrossRef]
- El-Kady, O.; Fathy, A. Effect of SiC particle size on the physical and mechanical properties of extruded Al matrix nanocomposites. Mater. Des. 2014, 54, 348–353. [Google Scholar] [CrossRef]
- Kokubo, T.; Takadama, H. How useful is SBF in predicting in vivo bone bioactivity? Biomaterials 2006, 27, 2907–2915. [Google Scholar] [CrossRef] [PubMed]
- Gu, D.; Shen, Y. Balling phenomena in direct laser sintering of stainless steel powder: Metallurgical mechanisms and control methods. Mater. Des. 2009, 30, 2903–2910. [Google Scholar] [CrossRef]
- Shuai, C.; Yang, Y.; Wu, P.; Lin, X.; Liu, Y.; Zhou, Y.; Feng, P.; Liu, X.; Peng, S. Laser rapid solidification improves corrosion behavior of Mg–Zn–Zr alloy. J. Alloys Compd. 2016, 691, 961–969. [Google Scholar] [CrossRef]
- Gao, L.; Chen, R.S.; Han, E.H. Effects of rare-earth elements Gd and Y on the solid solution strengthening of Mg alloys. J. Alloys Compd. 2009, 481, 379–384. [Google Scholar] [CrossRef]
- Jiqing, L.I.; Liu, Y.; Zhao, X.; Ruizhi, W.U. Effects of Al content on the lattice parameter and microstrain of α-Mg phase in Mg–Li alloys. Appl. Sci. Technol. 2011, 501–504. [Google Scholar]
- Kita, H.; Kimoto, M.; Kudo, T. Influence of Al Content on Corrosion Resistance of Mg–Al–Zn Alloys in Chloride Environments. J. Jpn. Inst. Metals 2005, 69, 805–809. [Google Scholar] [CrossRef]
- Baker, J.C.; Gahn, J.W. Solute trapping by rapid solidification. Acta Metall. 1969, 17, 575–578. [Google Scholar] [CrossRef]
- Kim, J.M.; Park, J.S. Effects of Grain Refinement and Melt Stirring on the Mechanical Properties and Fluidity of Mg–Al Alloys. J. Korea Foundry Soc. 2010, 30, 111–114. [Google Scholar]
- Wen, Z.; Wu, C.; Dai, C.; Yang, F. Corrosion behaviors of Mg and its alloys with different Al contents in a modified simulated body fluid. J. Alloys C ompd. 2009, 488, 392–399. [Google Scholar] [CrossRef]
- Ko, Y.J.; Chang, D.Y.; Lim, J.D.; Shin, K.S. Effect of Mg17Al12 Precipitate on Corrosion Behavior of AZ91D Magnesium Alloy. Mater. Sci. Forum 2003, 419, 851–856. [Google Scholar] [CrossRef]
- Li, Z.; Gu, X.; Lou, S.; Zheng, Y. The development of binary Mg–Ca alloys for use as biodegradable materials within bone. Biomaterials 2008, 29, 1329–1344. [Google Scholar] [CrossRef] [PubMed]
- Song, Y.; Shan, D.; Chen, R.; Zhang, F.; Han, E.H. Biodegradable behaviors of AZ31 magnesium alloy in simulated body fluid. Mater. Sci. Eng C 2009, 29, 1039–1045. [Google Scholar] [CrossRef]


© 2017 by the authors. Licensee MDPI, Basel, Switzerland. This article is an open access article distributed under the terms and conditions of the Creative Commons Attribution (CC BY) license ( http://creativecommons.org/licenses/by/4.0/).
Share and Cite
He, C.; Bin, S.; Wu, P.; Gao, C.; Feng, P.; Yang, Y.; Liu, L.; Zhou, Y.; Zhao, M.; Yang, S.; et al. Microstructure Evolution and Biodegradation Behavior of Laser Rapid Solidified Mg–Al–Zn Alloy. Metals 2017, 7, 105. https://doi.org/10.3390/met7030105
He C, Bin S, Wu P, Gao C, Feng P, Yang Y, Liu L, Zhou Y, Zhao M, Yang S, et al. Microstructure Evolution and Biodegradation Behavior of Laser Rapid Solidified Mg–Al–Zn Alloy. Metals. 2017; 7(3):105. https://doi.org/10.3390/met7030105
Chicago/Turabian StyleHe, Chongxian, Shizhen Bin, Ping Wu, Chengde Gao, Pei Feng, Youwen Yang, Long Liu, Yuanzhuo Zhou, Mingchun Zhao, Sheng Yang, and et al. 2017. "Microstructure Evolution and Biodegradation Behavior of Laser Rapid Solidified Mg–Al–Zn Alloy" Metals 7, no. 3: 105. https://doi.org/10.3390/met7030105