Article

The Effect of Varying Mixing Temperatures and Baking Level on the Quality of Pilot Scale Anodes—A Factorial Design Analysis

by
Camilla Sommerseth
1,*,†,
Rebecca Jayne Thorne
1,‡,
Arne Petter Ratvik
2,
Espen Sandnes
3,
Hogne Linga
4,
Lorentz Petter Lossius
4 and
Ann Mari Svensson
3
1
Materials Science and Engineering, Norwegian University of Science and Technology, NO-7491 Trondheim, Norway
2
SINTEF Materials and Chemistry, NO-7465 Trondheim, Norway
3
Materials Science and Engineering, Norwegian University of Science and Technology, NO-7491 Trondheim, Norway
4
Hydro Aluminium PMT, Box 303, NO-6882 Årdal, Norway
*
Author to whom correspondence should be addressed.
Current address: SINTEF Materials and Chemistry, NO-7465 Trondheim, Norway.
Current address: Norwegian Institute for Air Research, NO-2027 Kjeller, Norway
Metals 2017, 7(3), 74; https://doi.org/10.3390/met7030074
Submission received: 20 December 2016 / Revised: 7 February 2017 / Accepted: 13 February 2017 / Published: 25 February 2017

Abstract

:
Identifying optimum anode baking level and mixing temperature are important when producing high quality anodes. The effect of varying mixing temperature and baking level were investigated in terms of the resulting apparent anode density, specific electrical resistivity (SER), air permeability, coefficient of thermal expansion (CTE), air reactivity, and CO2 reactivity. Six pilot-scale anodes were prepared at Hydro Aluminium using a single source petroleum coke and <2 mm coke fractions. A coal tar pitch was used with Mettler softening point of 119.1 °C. The aggregate was mixed at 150 °C or 210 °C and baked to a low, medium, or high baking level. A 22 full-factorial design analysis was performed to determine the response of the analyzed properties to the applied mixing and baking temperature. Apparent density, SER, and air permeability were found to be highly dependent on mixing temperature. Apparent density and SER were also slightly affected by baking level. CTE was found to be independent of both baking level and mixing temperature. Air reactivity was found to be mainly dependent on baking level, while CO2 reactivity was dependent on both mixing temperature and baking level.

1. Introduction

Aluminum is produced according to the reaction described in Equation (1) [1]:
2Al2O3 + 3C = 4Al + 3CO2
Carbon anodes serve as the carbon source on the left-hand side of the equation. The carbon anodes are produced from calcined petroleum coke, with coal tar pitch as the binder. The aluminum industry always strives to improve the production of carbon anodes in order to improve cell stability and lifetime of the anodes. As the anodes are consumed, they need to be changed every 22–28 days. Anode change is part of the routine work in a potroom, and causes temporary instability in each individual cell. This instability includes freezing of electrolyte onto the surface of the cold new anode, and during the time it takes for the electrolyte to melt, no current is drawn by this anode. This in turn causes increased current to be drawn by the remaining anodes. Hence, the introduction of a cold anode will affect both the current load of all the anodes in the cell and the thermal balance of the cell. Anode change will also cause instability in the flow of electrolyte within the cell, and in turn the flow of alumina towards the anodes. Good anode quality is crucial to maintain stable operation, and it is of great interest to optimize the lifetime of the anodes [1]. High density, low specific electrical resistivity, low impurity level, low permeability, and low air and CO2 reactivity are all parameters that characterize a high-quality anode. The optimization of carbon anodes relies on many different production parameters, such as mixing temperature, baking level, coke and pitch quality, aggregate composition, etc. The optimum baking level and mixing temperature are dependent on the coke and pitch qualities used [2].
The Mettler softening point of the pitch is commonly used as a standard guideline for the selection of the proper mixing temperature between coke, pitch, and butts. Most commonly, the mixing temperature is set approximately 50 °C above the Mettler softening point [3]. However, studies using the sessile drop technique show that an even higher temperature may be needed to optimize the wetting angle between the coke and the pitch, and that the wetting angle between coke and pitch is dependent on both the pitch itself and the coke substrate [4,5]. Wilkening [2,6] has suggested using mixing temperatures as high as 350 °C in order to improve anode density, specific electrical resistivity (SER), and strength.
A large part of the porosity in anodes is mostly a result of the mixing and vibroforming processes; however, increased porosity can be introduced during the baking process. This type of porosity can be reduced by good baking process control. During the heating part of the baking process, the pitch binder is carbonized to pitch-coke, with release of approximately 1/3 of the pitch matter as volatiles [7]. During the volatilization and carbonization processes of pitch, more porosity is introduced to the anodes. This porosity is inevitable, but excess porosity can be avoided by good baking furnace design with good temperature control, low ΔT throughout the furnace, and by using a slow heating rate [8,9]. A target baking temperature also needs to be found, as overbaking can cause desulfurization and hence increased microporosity in the anode [9]. Jentoftsen et al. [10] suggested that underbaked anodes caused lower anodic current efficiency in the potroom.
Many have studied the effect of production parameters on the final properties of anodes. Azari et al. [11] studied the effect of a wide range of mixing temperatures (158 °C, 168 °C, 178 °C, and 188 °C) and mixing time (6 min, 10 min, 15 min, and 20 min) on a pitch with a Mettler softening point at 109 °C. They found an optimum mixing temperature at 178 °C and a mixing time of 10 min in their laboratory setup. With this mixing temperature and time, they achieved the highest baked apparent density, the lowest air permeability, and the lowest surface area (measured using the Brunauer-Emmett-Teller (BET) method). With a higher mixing temperature, the anode properties became poorer, and they argued that this was because the viscosity of the pitch became so low that the pitch penetrated very small pores of the coke. They argue that it might make the amount of pitch insufficient to fill the voids between coke particles. At lower mixing temperatures, the viscosity of the pitch was increasingly higher, resulting in agglomeration of the fine particles without penetration of the pitch into open pores.
Air reactivity of cokes and air reactivity of baked anodes have been studied extensively over the years. The results are not unambiguous, and this is likely due to the many coke calcination temperatures studied, the different types of cokes, and if the cokes have been calcined in an industrial calciner or in a laboratory environment [12]. The results of air reactivity on cokes are not always directly transferrable to baked anode properties. Belitskus [12] studied the effect of coke calcination temperature and anode baking temperature on the crystallite height, Lc, of the coke, the baked apparent density, specific electrical resistivity, and air reactivity. The crystallite height of the cokes calcined at three different temperatures (1150 °C, 1250 °C, and 1350 °C) increased linearly with calcination temperature. It was found that the apparent density of the anode increased with increasing baking temperature. The effect was higher for the anodes baked at the highest baking temperature, produced from coke with lowest calcination temperature. SER decreased with increasing baking temperature for all the coke calcination temperatures used. Air reactivity of the anodes also decreased with increasing baking temperature and with increasing coke calcination temperature.
The fact that Lc increases with increasing calcination temperature of cokes was also found by Boero [13]. He also found that air reactivity decreased as Lc increased. It was also suggested that the surface area of the coke could affect air reactivity, but Boero argued that this effect is difficult to measure, since the surface area would change over time when the cokes react with air.
Dreyer, Samanos, and Vogt [14] studied two different cokes—one high in sulfur and one low in sulfur—and the final properties of baked carbon anodes. The two cokes were calcined at a high and a low level, and four pilot-scale anodes were produced. The sulfur content of the low-sulfur coke was found to be constant over the course of the baking temperature, and no desulfurization was observed. For the high-sulfur coke, desulfurization was observed, and a rapid drop in sulfur content appeared. When studying various properties of the anodes, they found that the coefficient of thermal expansion (CTE) was little affected by baking temperature for the low sulfur content anode. However, for the higher sulfur content anode, a rapid drop in CTE was found when the baking temperature exceeded the threshold for desulfurization. CO2 reactivity was not significantly affected by baking temperature, although the higher sulfur anodes were slightly more affected by baking temperature with respect to CO2 reactivity. This was attributed to desulfurization. SER decreased with increasing baking temperature, but SER was not affected by desulfurization.
The aim of this paper is to study the effect of two mixing temperatures and three baking levels on the resulting quality of six pilot-scale anodes, using the statistical tool called factorial design. The coke is a single source coke of a relatively low impurity level and constant calcination temperature. No butts were added, and the type and level of pitch was the same for all experiments. Impurity levels may therefore be assumed to be constant, and effects of calcination level of the coke on pitch wetting can be neglected. Thus, mixing temperature and baking level are the only parameters varied in the experiments, selected in order to minimize the complex interdependencies of material and process parameters on anode properties. The experiments were performed in accordance with 22 full factorial designs in order to identify how and if the mixing temperatures and baking levels affect the density, SER, air permeability, CTE, air reactivity, and CO2 reactivity, and whether there are possible interaction effects.

1.1. Factorial Design as a Statistical Tool

Factorial design is a statistical tool that allows investigation of the effect of many factors simultaneously, provided that these factors are independent [15]. The 22 full factorial design is the simplest of its kind. The 22 nomenclature denotes two factors varied at two levels [16]. In the present experimental design, the two factors varied are mixing temperature and baking level. The two levels are a high and low value. For the mixing temperature, the high level is 210 °C and the low level is 150 °C, which are 90.9 °C and 30.9 °C above the Mettler softening point, respectively. The baking level was varied on three levels: 1150 °E, 1260 °E, and 1350 °E, where °E denotes equivalent temperature according to ISO 17499:2011—a measure of calcination level that is a function of maximum temperature and hold time at this temperature, used by Hydro to describe the baking level of an anode. The resulting anode baking level is measured by sending a reference coke in a graphite container together with the anode through the baking furnace. After calcination in the baking furnace, the level of graphitization is measured by investigations of Lc (i.e., the determination of the mean crystallite height, the 002 band, by interpreting the X-ray diffraction pattern found by use of X-ray diffraction techniques) according to ISO 20203:2005. Since the temperature of the baking furnace is non-homogeneous throughout, measuring the exact calcination temperature each carbon anode sees is non-trivial. More on the technique is described in ISO 17499:2011 and in [17,18]. The heating ramp in the baking furnace was 7–20 °C, with the highest heating rate during the pitch volatilization.
The statistical analysis was performed as three 22 full factorial designs, by treating the baking level in pairs, with three low and high levels; i.e., 1150 °E (underbaking) vs. 1260 °E (target baking), 1260 °E (target baking) vs. 1350 °E (overbaking), and 1150 °E (underbaking) vs. 1350 °E (overbaking). In factorial design analysis, it is common to use the term “main factor” [15] on the factors that are varied; hence, mixing temperature (A) and baking level (B) are the two main factors. The low values are denoted −1 and the high values are denoted +1. Table 1 shows the three 22 factorial design setups that are investigated in this work.
The effects on anode quality when varying the main factors are investigated through physical properties testing, including apparent density (from now on given as density), specific electrical resistivity, air permeability, coefficient of thermal expansion, air reactivity, and CO2 reactivity. Each physical property is termed a “response” of the main factor [15], where density = y1, SER = y2, permeability = y3, CTE = y4, CO2 reactivity = y5, and air reactivity = y6. The effect of each main factor is calculated according to Equation (2):
Effect = y + n + y n
where n is the total number of data collected at each level. Equation (2) simply states that the effect of a main factor A or B is the average of the high responses subtracted by the average of the low responses [15].
The interaction effect, AB, between the main factors A and B is calculated by averaging the positive AB responses and subtracting the average negative AB responses [15]. In this factorial design setup, the positive AB responses are from lines one and four in Table 1 (since (−1) × (−1) = (+1) and (+1) × (+1) = (+1)). The interaction effect helps determine if one factor, the other, or a combination of the two affects the responses of the experimental setup.

2. Materials and Methods

2.1. Pilot Anode Materials

A pilot anode line (Ø = 130 mm, h = 180 mm) of six different anodes was prepared by Hydro Aluminium AS in Årdalstangen. A single source industrial sponge coke of anisotropic character was mixed with an industrial-grade coal tar pitch. The coal tar pitch had a Mettler softening point equal to 119.1 °C and a primary quinoline insolubles (QI) content of 7.8%. The particle size of the coke aggregate was 0–2 mm, and this small-scale aggregate was chosen in order to ensure homogeneity between samples in small-scale laboratory experiments. The coke aggregate recipe was kept constant between the pilot anodes, while mixing and baking levels were varied. A vibroformer was used, and the anode paste was transferred directly from the mixer to the vibroformer with minimum time delay in between and a short temperature equilibration time.

2.2. Physical Analysis of the Anodes

The anodes were characterized using industry ISO methods as summarized in Table 2. These test methods are considered as standard methods at Hydro. Only one test was performed for each sample. The reproducibility within a lab and between labs are indicated in Table 2. These numbers are given in the ISO standards. No data on the reproducibility is available for the CO2 reactivity and air reactivity, since these are in-house methods developed by Hydro. However, it is to be expected that the reproducibility of these tests are high. This implies that it is relevant to perform a statistical factorial design analysis on the basis of the present figures (shown in Table 3, Table 4 and Table 5) and that the variance seen between the physical properties between the six samples is a result of the production parameters.
Hg porosimetry was used to investigate the microporosity (<1 μm) of the pilot-scale anodes. The equipment used was a Micrometrics Autopore IV 9500 Mercury Porosimeter (Norcross, GA, USA). Hg was filled into anode bulk samples of ≈2.2 g at pressures of 0.50–60,000 psia (corresponding to 3.45 × 10³–4.14 × 10⁸ Pa). The pore diameter range measured by mercury intrusion was 0.003–360 μm.

3. Results

Table 3, Table 4 and Table 5 show the anode production parameters with corresponding raw data physical properties for the three factorial design setups demonstrated in Table 1. The 22 factorial design setup is indicated with main factors A (mixing temperature) and B (baking level), and standard notation −1 indicating low levels and +1 indicating high levels.
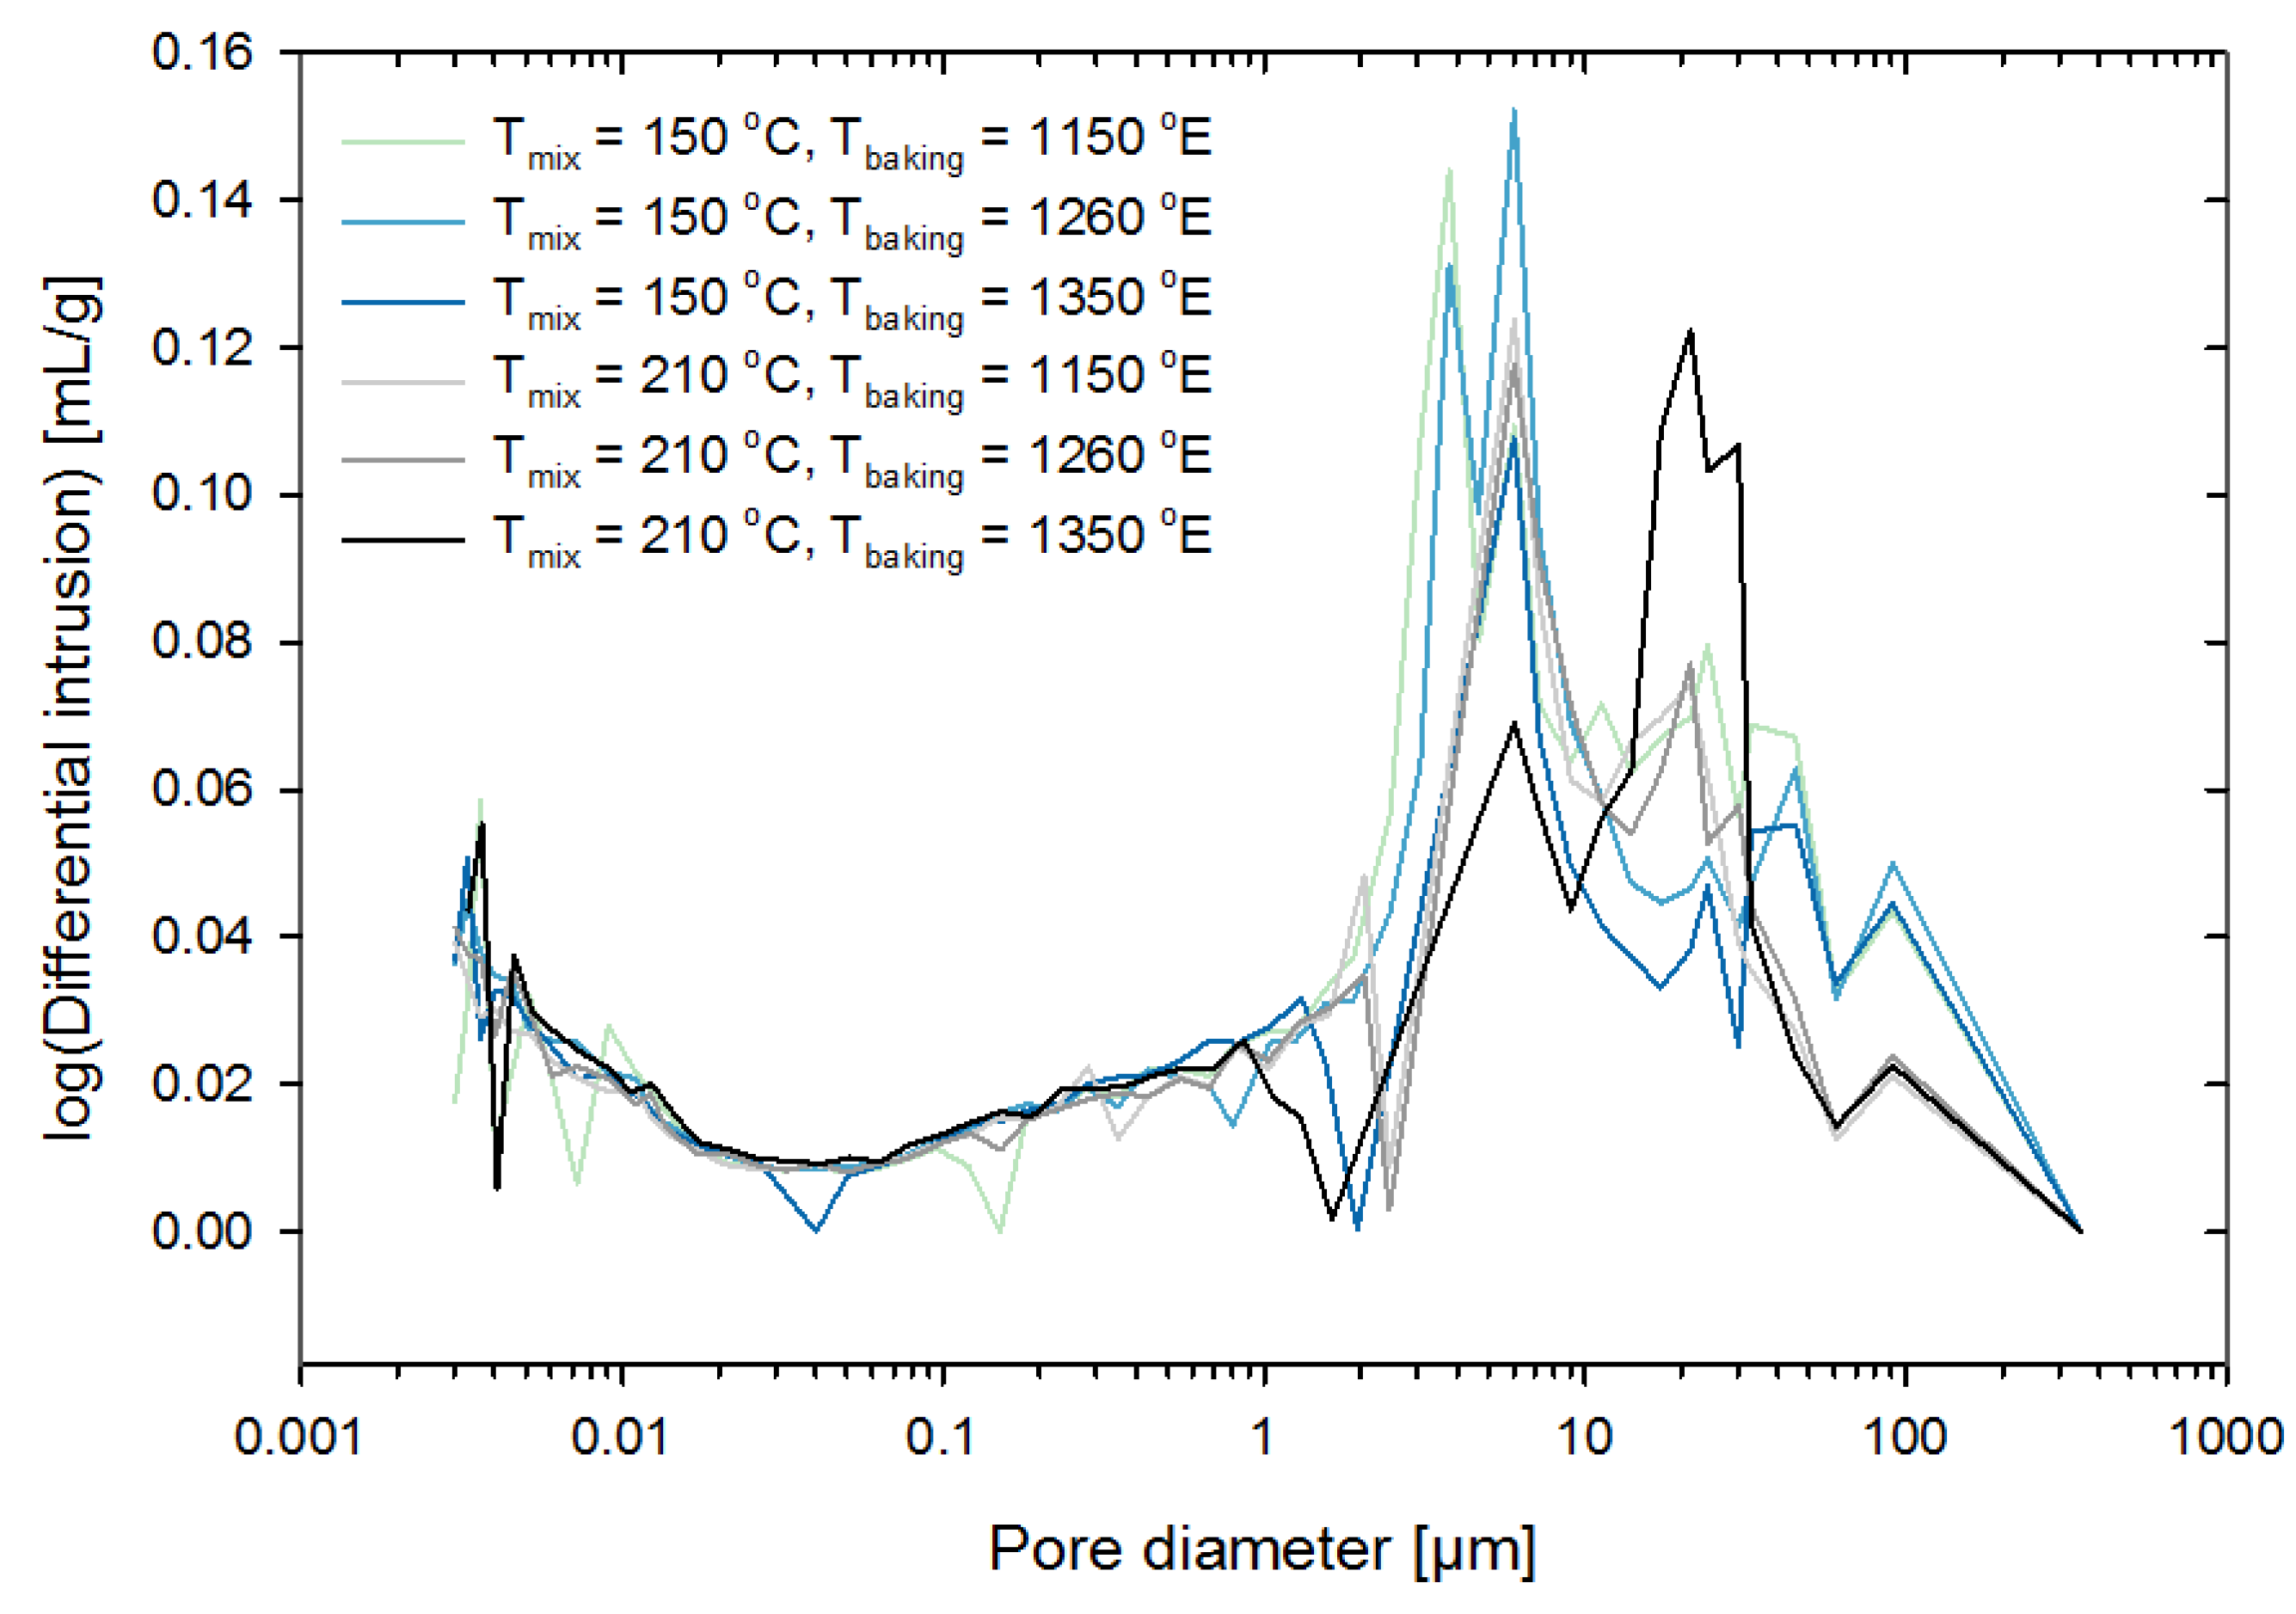
Figure 1 shows the pore size distribution of the pilot scale anodes, as found by Hg porosimetry. The peaks that appear at about 4–7 μm are pores that are likely to appear due to porosity between fines. Peaks between 20–30 μm correspond to calcining pores, appearing when volatiles are being released from pitch during baking and larger pores between fines. The peaks at about 100 μm are inhomogeneity pore that appear due to the non-ideal low mixing temperature. These peaks are much more evident for the low mixing temperature anodes, compared with the high mixing temperature anodes. It is not apparent why the two parallels of the high mixing, high baked anode show a much larger peak at 20–30 μm than the other anode samples. The increase in porosity observed at pore sizes below 0.01 μm is most likely due to crushing of the anode samples at the high pressure imposed on the samples. 
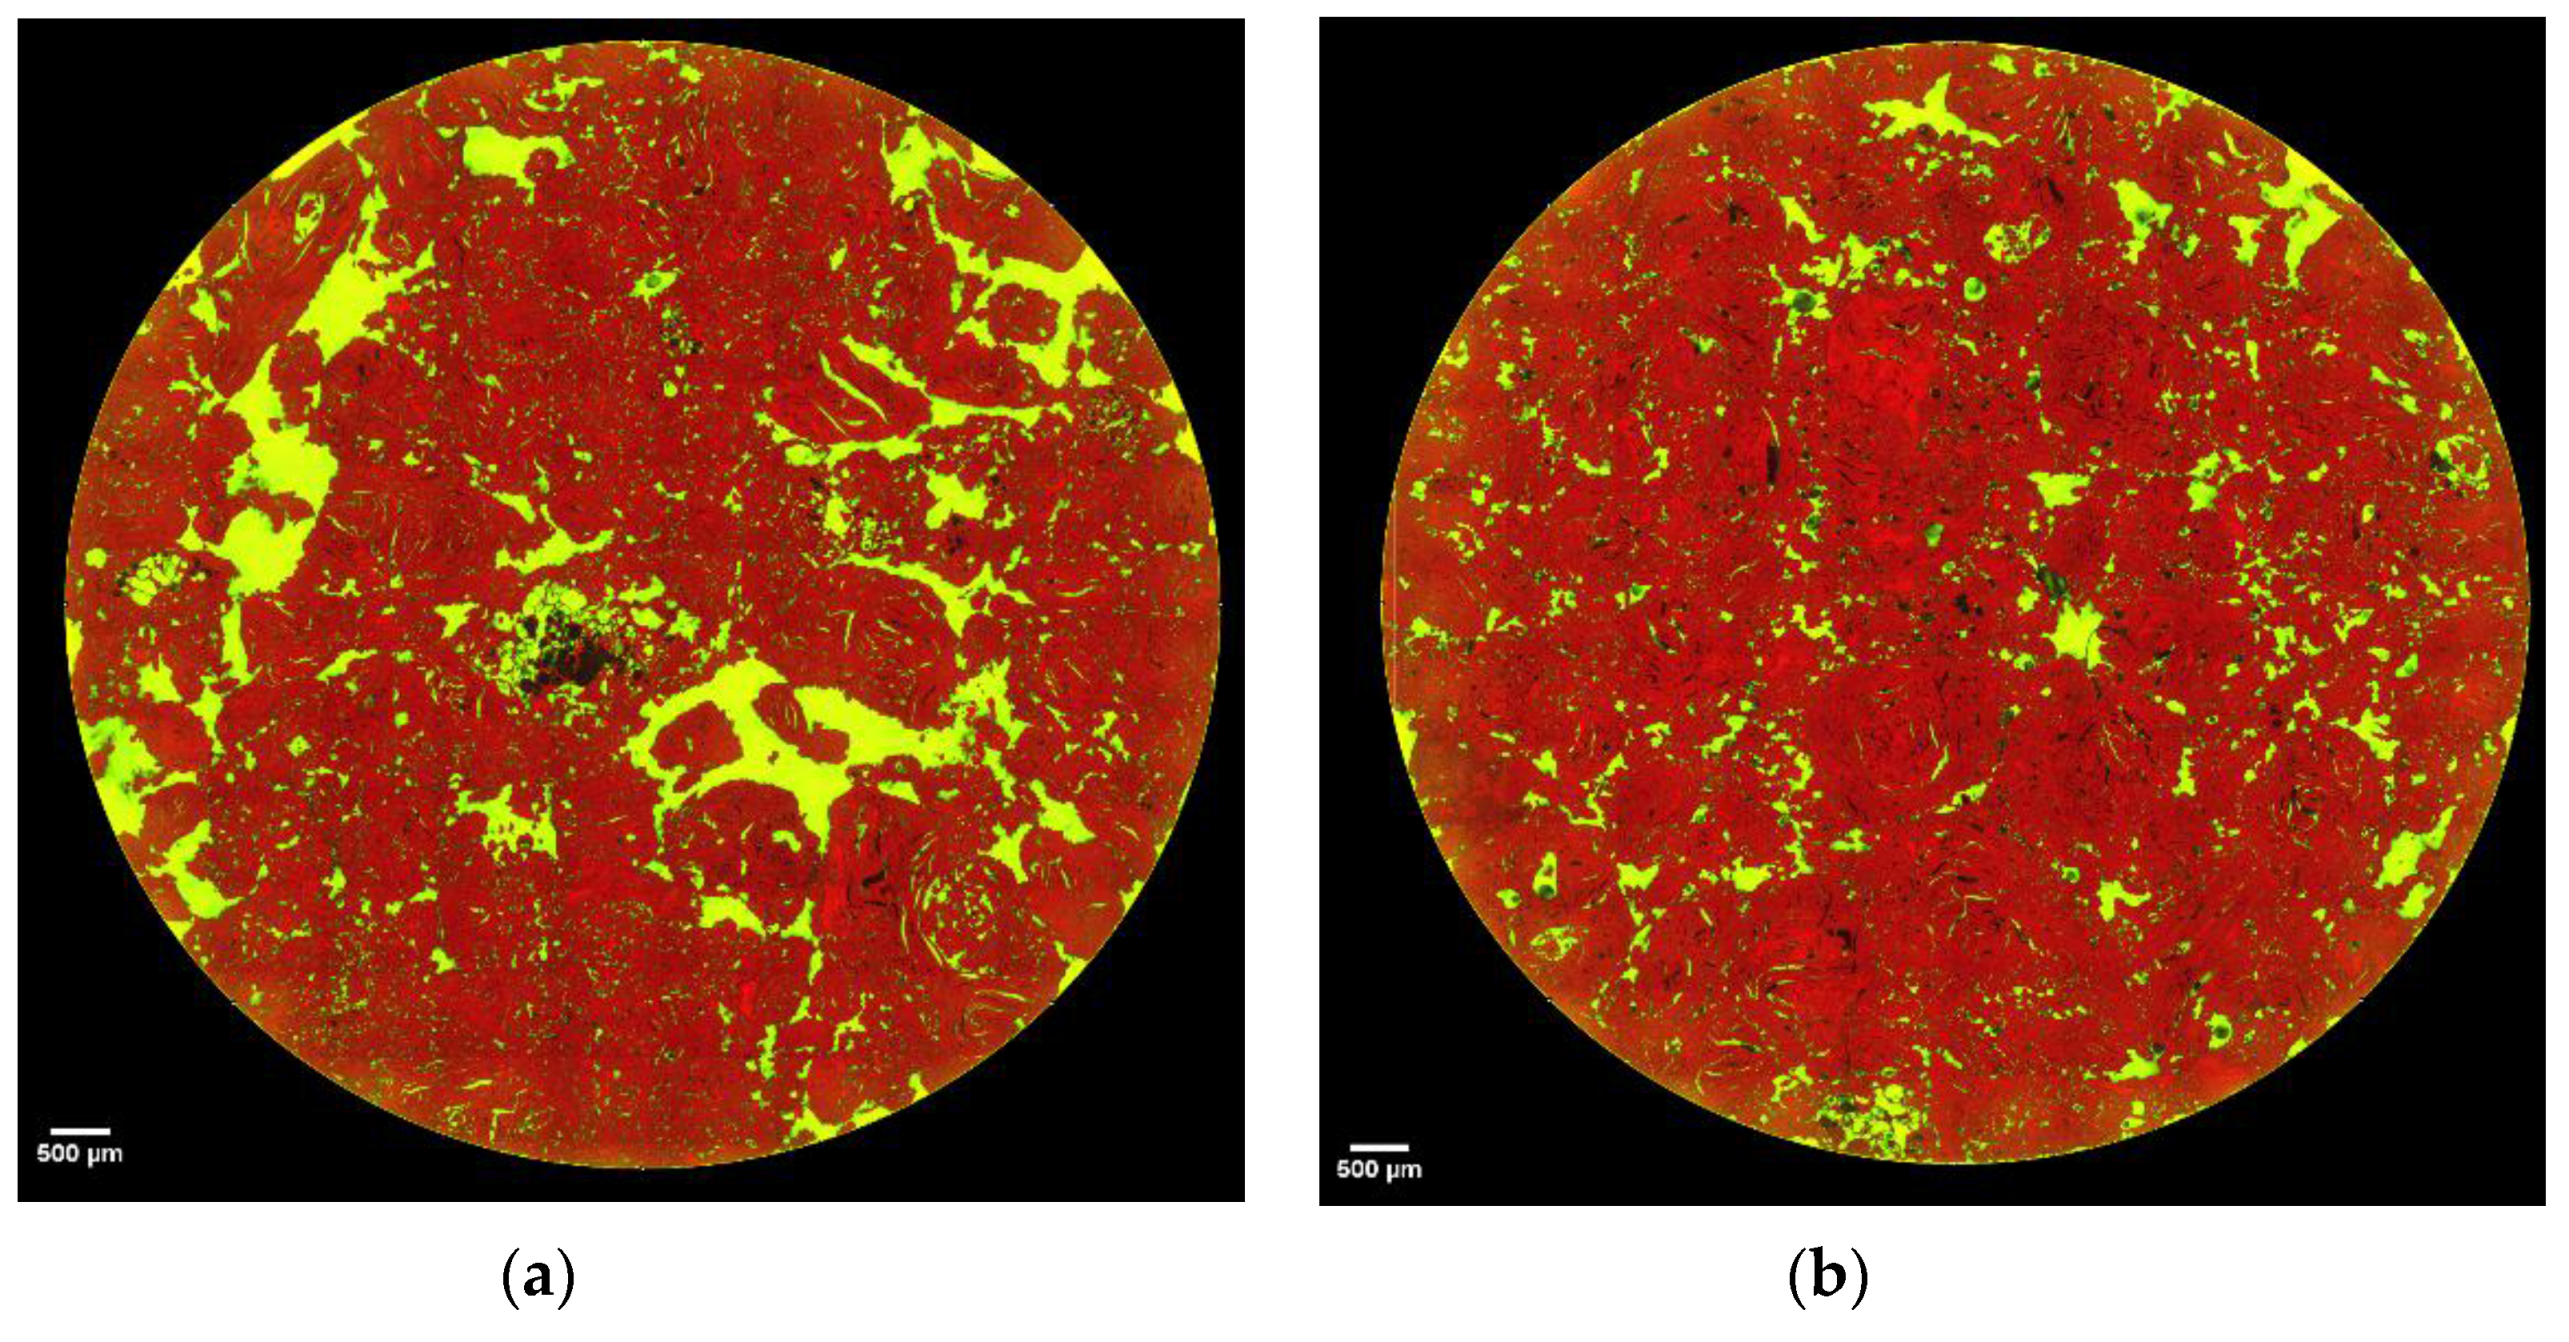
Figure 2 shows the visual effect of mixing temperature on the porosity in the anodes. This difference in porosity affects air permeability and SER directly, as shown in Table 4 and Figure 3. 
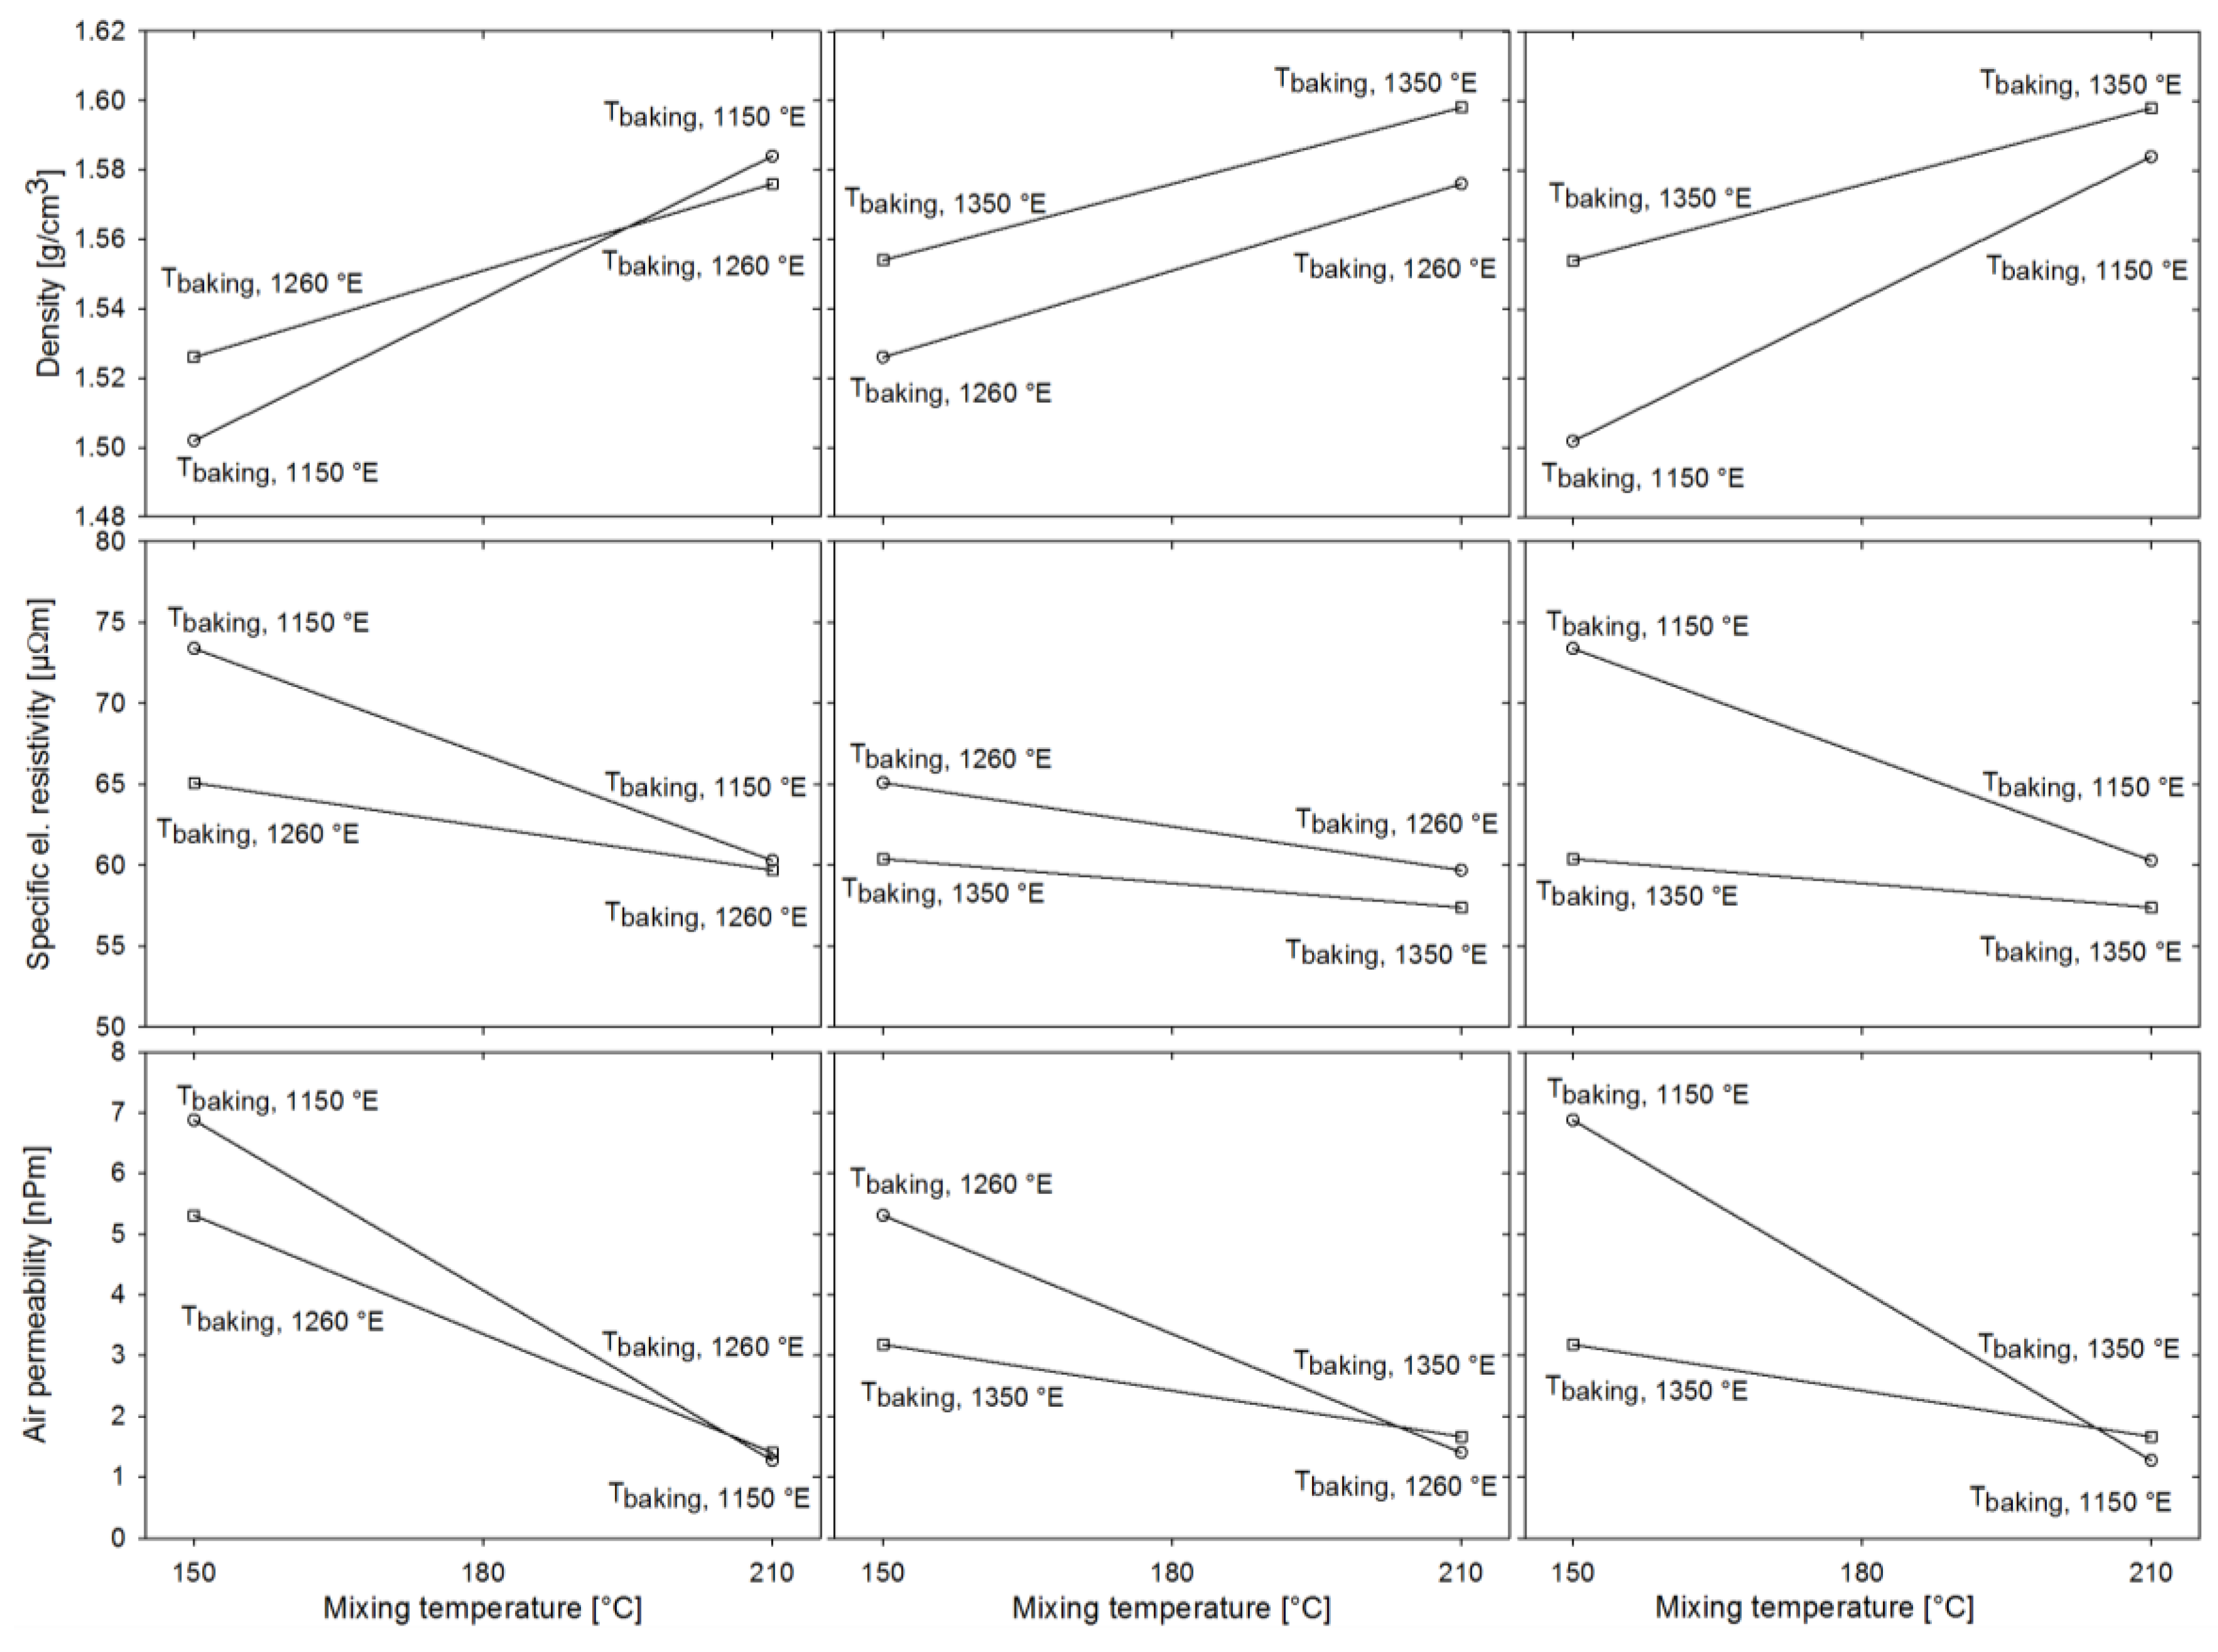
Figure 3 shows the effect of mixing temperature and baking level on the physical parameters density, SER, and air permeability. 
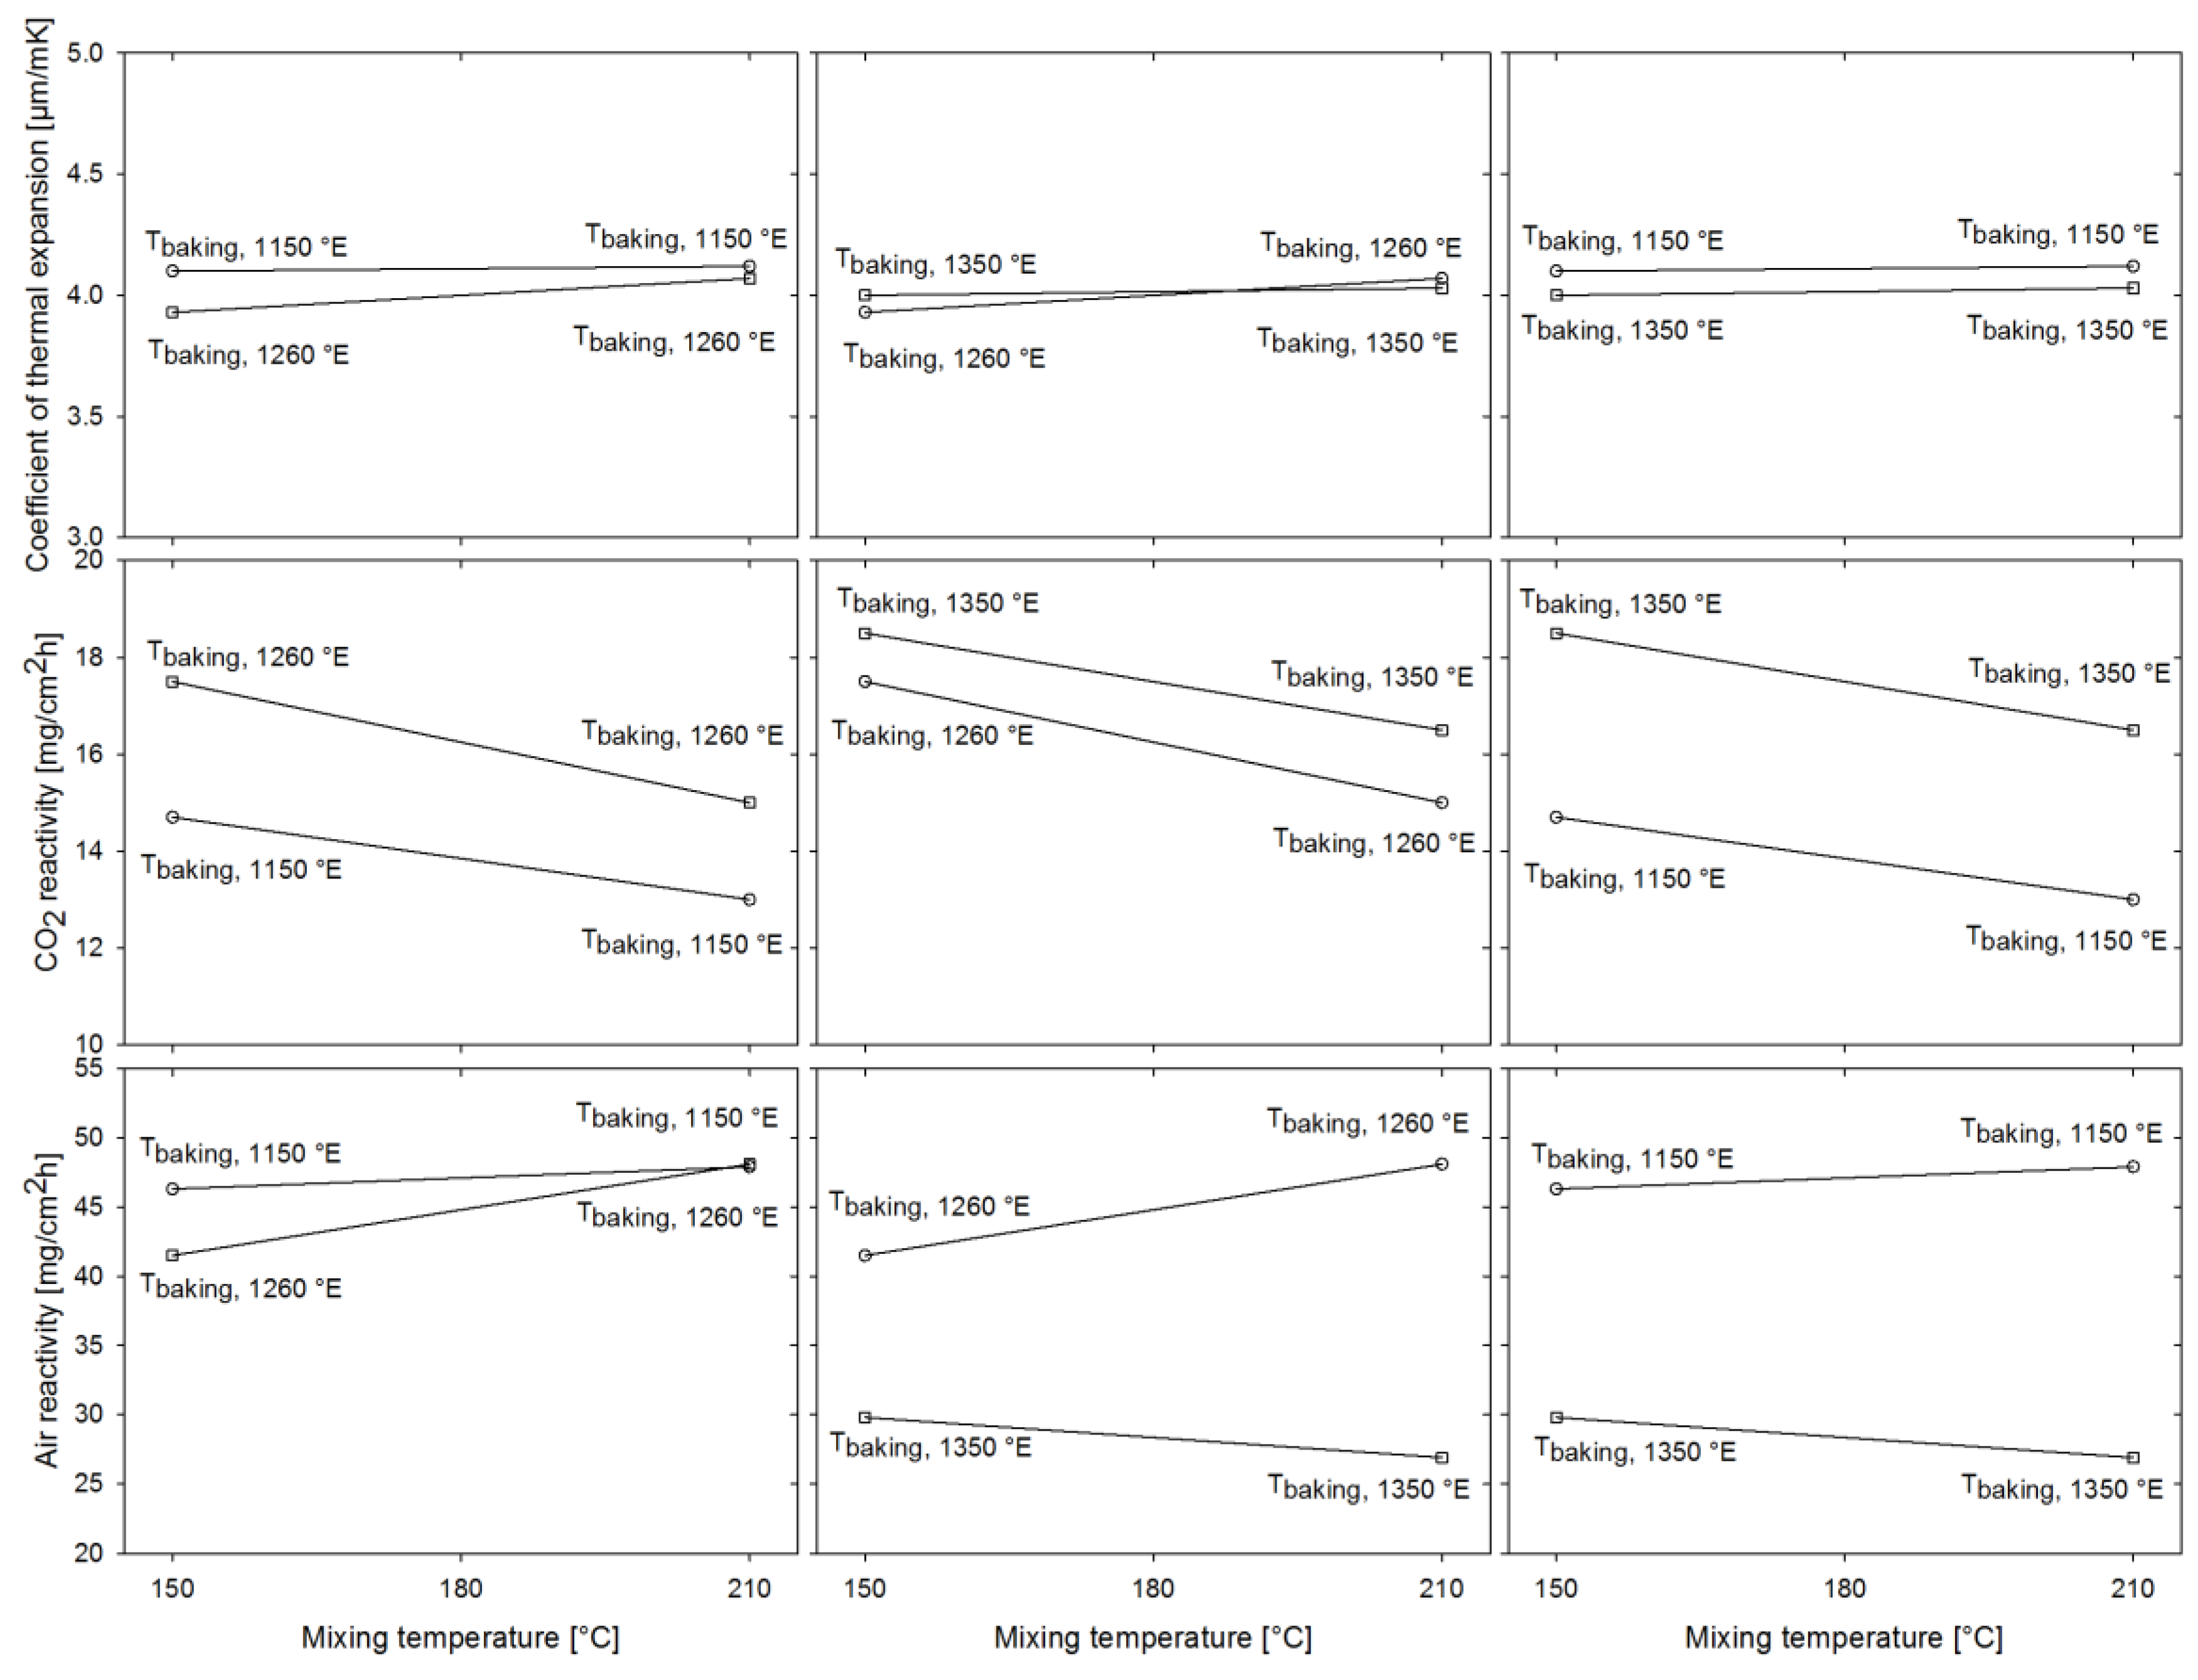
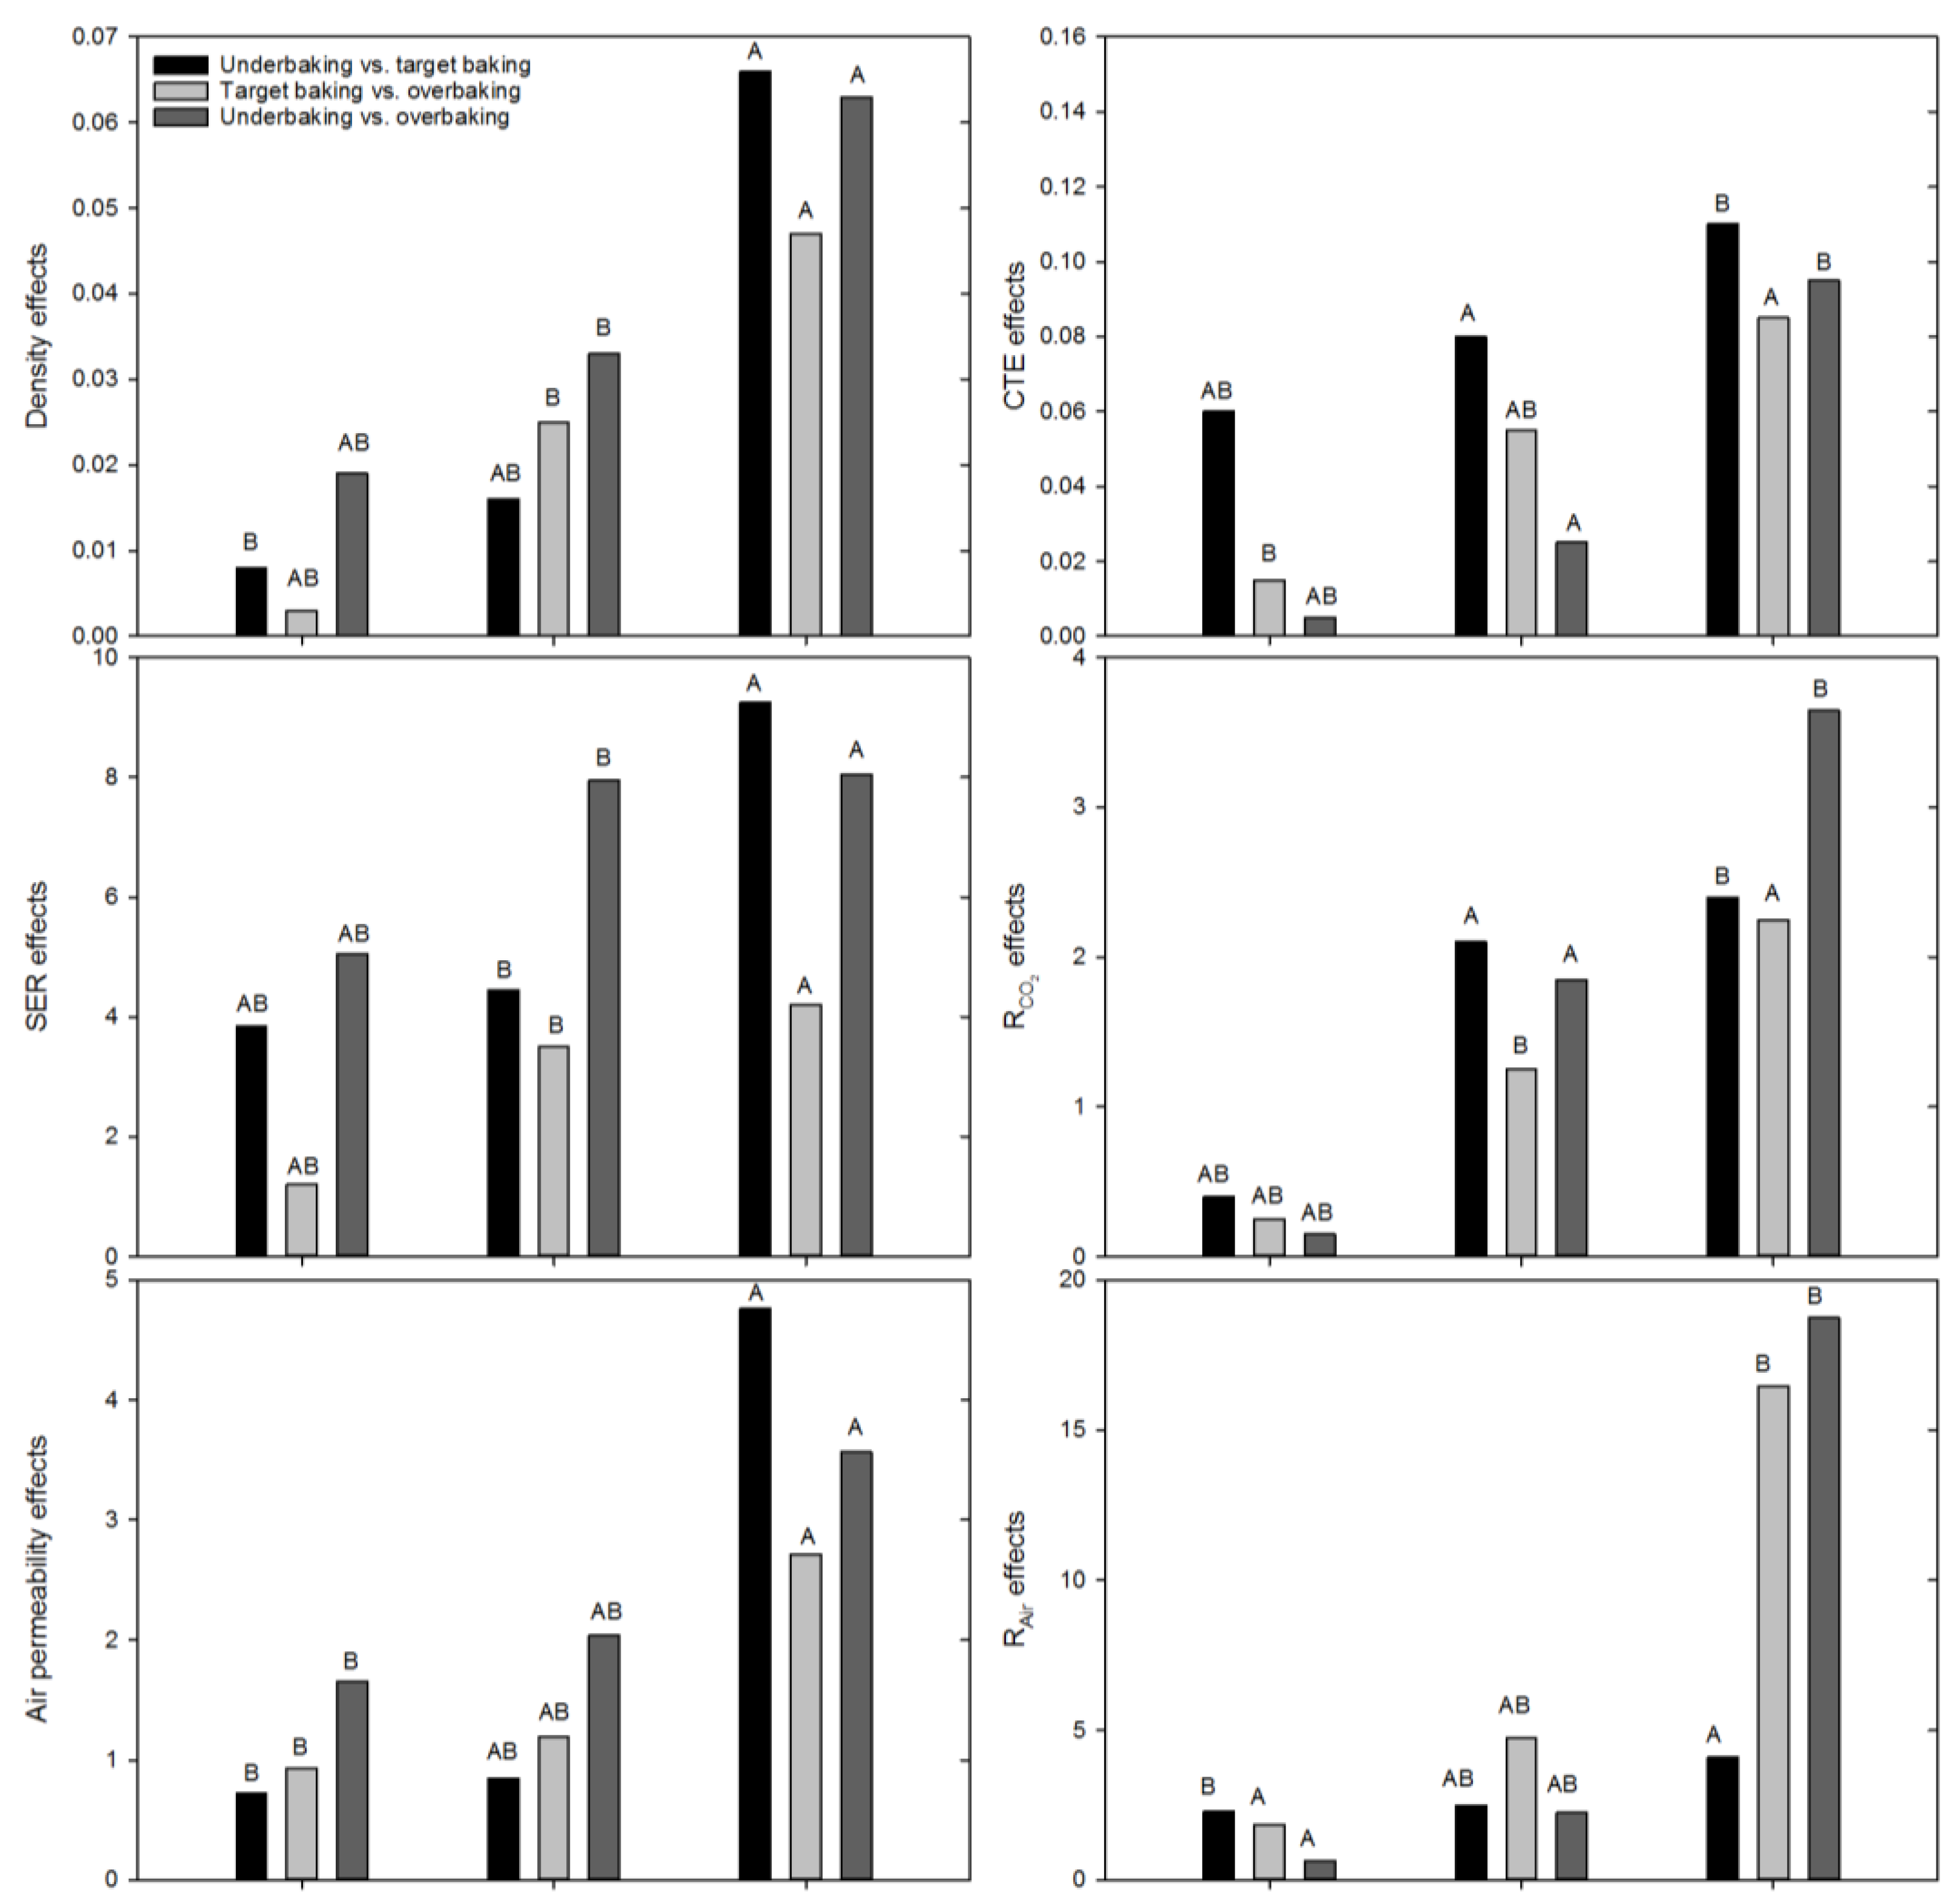
Figure 4 shows the effect of mixing temperature and baking temperature on the coefficient of thermal expansion, CO2 reactivity, and air reactivity. The left column shows underbaking vs. target baking, the middle column shows target baking vs. overbaking, and the right column shows underbaking vs. overbaking.
A steep slope between low and high level of mixing temperature indicates a high effect of mixing temperature on the physical properties. Density, air permeability, and CO2 reactivity show a steep slope between low and high mixing temperature. Density increases and air permeability decreases with higher mixing temperature. SER also decreases somewhat with higher mixing temperature, but is also affected by baking level, and this is in accordance with literature [12,14]. Both the decrease in air permeability and SER can be related to the increase in density. A higher mixing temperature is clearly beneficial in terms of density, air permeability, and SER.
A large difference between the two lines in each window in Figure 3 and Figure 4 indicates a large effect of baking level on the physical properties. In Figure 3, the difference in physical properties between high and low baking levels is not significant, except when comparing underbaking and overbaking. This is especially true at the low mixing temperature level, indicating that low mixing and low baking level give a particularly poor quality anode as expected, with low density, high SER, and high air permeability.
In Figure 4, a fairly large difference is observed between the graphs of CO2 and air reactivity, indicating a high influence of baking temperature on these physical properties. CO2 reactivity increases with higher baking temperature, and intuitively this could be argued to be due to some release of sulfur from the coke structure during baking, as described in literature [9]. Sulfur is a known inhibitor of CO2 reactivity, as it forms inactive metal–sulfur complexes with metal catalysts [19]. However, it was also observed in Figure 4 that density of the anodes generally increased with increasing baking level, including the overbaked anodes, and the coke used in this work is a low sulfur coke (<1%, found by X-Ray Fluorescence (XRF), ISO 12980:2000 and reported in [20]). Low-sulfur cokes have shown low “puffing” effect and little release of sulfur at baking levels relevant to the levels used in this study [14,19]. This also implies that it is plausible that little sulfur is released during the baking of these pilot anodes, since desulfurization would cause increased microporosity in the coke structure and lower the final density of the anode. Hg porosimetry also shows little change in microporosity during the increase in baking temperature, so it is convincing that little desulfurization takes place. CO2 reactivity decreases with higher mixing temperature, indicating a covariance between CO2 reactivity and anode density.
The effect of main factors A and B—namely, mixing temperature and baking level—can be calculated using Equation 2. Table 6, Table 7 and Table 8 show the calculated effects of main factors A and B and the interaction effect AB for the three factorial design setups demonstrated in Table 1. When investigating Table 6, Table 7 and Table 8, it is clear that mixing temperature is a factor that determines the output density to a much larger degree than the baking temperature. Additionally, the interaction effect is rather small between mixing and baking temperature. However, for SER, both mixing temperature and baking level affect the output property. The interaction effect is also rather high. Mixing temperature is important in controlling the density, as seen visually in Figure 2. A higher baking level is beneficial for the SER, supporting the argument that little sulfur is released from the coke structure because desulfurization would cause increased microstructure. Increased microstructure would lower the SER. This is also in accordance with literature [12,14]. Air permeability is also strongly affected by mixing temperature, and a higher mixing temperature decreases the permeability.
No significant difference is seen between the high and low baking and mixing temperatures for coefficient of thermal expansion. CTE is clearly not affected by either mixing temperature or baking level, even though the anodes show fairly large effects of the production parameters on the other properties of this study, density in particular. This suggests that CTE is a raw material property, mainly the coke. This is also in accordance with what Dreyer, Samanos, and Vogt [14] found for anodes made from low-sulfur coke.
Both mixing temperature and baking level affect the CO2 reactivity. However, the interaction effect is rather low. A higher mixing temperature lowers the CO2 reactivity, while a higher baking level increases the CO2 reactivity. The density of the anodes increases with both increasing mixing and baking temperature as illustrated in Figure 3. In Figure 2, the lower mixing temperature gives larger and more pores compared to when using a higher mixing temperature, and these findings are further confirmed quantitatively in Figure 1. A large open porosity will increase CO2 reactivity due to an increased exposed surface area. Azari et al. [11] found an increase in BET surface area as the density decreased, and it is reasonable to believe that similar results would have been found here if BET had been performed. At the same binder level, the higher mixing temperature will lower the viscosity of the pitch and hence spread the binder better and thinner between and within coke particles. This leads to higher density and more homogeneous anodes [11].
Air reactivity is strongly affected by baking temperature, especially when comparing the overbaked pilot anodes to the anodes baked at 1150 °E and 1260 °E, as shown in Figure 4 and Table 7 and Table 8. However, for the target baking case, the mixing temperature also appears to have a slight impact on the air reactivity. Air reactivity decreases significantly for the overbaked pilot anodes compared to the target baking and underbaked case, regardless of mixing temperature. This is most likely due to the baking level in the overbaked case being higher than the calcination temperature of the coke used. According to Hydro Aluminium, a typical calcination temperature for the coke used is 1240–1280 °E [21]. During further calcination of the coke in the anodes, the graphite structure changes as described by Oberlin [22]. The crystallite height grows larger during calcination from 700–1300 °C, and Lc is highest at the highest calcination temperature. It is reasonable to assume that a change in graphite crystallite structure can affect the air reactivity due to ordering of the graphite structure giving fewer active sites available for reaction between air and carbon. Another explanation can be that with higher baking temperature, some metal complexes may be released from the coke structure upon heating. Vanadium is a known metal air burn catalyst, as it destabilizes the carbon ring structure of the surrounding carbons [23]. However, no proof is given in the present work that vanadium or other metal complexes are actually released during the baking process. Since the mixing temperature did not affect the air reactivity significantly, this indicates that other factors such as increased graphitization of the anode coke or metal impurity concentration are more important than porosity and exposed surface area.
Pareto charts [15] created from the absolute values of effects A, B, and interaction effect AB are shown in Figure 5. The Pareto chart helps visualize which effects are most important for each physical property underlining the discussion above.

4. Conclusions

By factorial design analysis, it has been shown that density and air permeability were highly affected by the mixing temperature—a higher mixing temperature increased the density and decreased the air permeability. A higher baking level was beneficial to the density, but the effect was smaller than that observed for mixing temperature. Air permeability was not affected by baking level to a large extent, and the interaction effect between baking level and mixing temperature was also low. Specific electrical resistivity was affected by both baking level and mixing temperature, and the interaction effect between the mixing and baking temperatures was fairly high. This directly mirrors the increased density observed when increasing both the mixing temperature and baking level. The coefficient of thermal expansion was not affected by either mixing temperature or baking level, suggesting that the coke quality determines this property. CO2 reactivity was affected by both mixing temperature and baking level; however, the interaction effect was low. Increased open porosity has a negative effect on CO2 reactivity, as it gives increased surface area available for CO2 to react with the carbon matrix. Air reactivity was highly affected by baking level, and this can be related to the increase in Lc when the baking level exceeds the coke calcination temperature.
Factorial design helps visualize which production parameter affects the physical properties, and if any interaction between the production parameters can be seen. Factorial design can and should be used further by industry to help optimize anode production parameters; however, good planning of the experiments is crucial for experiments to be successful.

Acknowledgments

The work was financed by Hydro Aluminium and The Research Council of Norway through the research program called “HAL Ultra Performance Aluminium Cell”. Writing of the publication was financed through the research program “Carma”. Thanks are due to technicians at Hydro Aluminium Årdalstangen for producing the pilot anodes and for testing the anodes’ physical properties. This paper has previously been published as a conference paper at “The International Committee for Study of Bauxite, Alumina & Aluminium 2016”.

Author Contributions

Camilla Sommerseth did the statistical analysis and wrote the paper. Rebecca Jayne Thorne, Arne Petter Ratvik, Espen Sandnes and Ann Mari Svensson designed the experiments and planned the pilot anode production. Hogne Linga and Lorentz Petter Lossius contributed with the materials for pilot anode production, produced the anodes and supervised the physical performance tests of the various anodes.

Conflicts of Interest

The authors declare no conflict of interest.

References

  1. Gjrotheim, K.; Kvande, H. Introduction to Aluminium Electrolysis, 2nd ed.; Aluminium-Verlag: Düsseldorf, Germany, 1993; pp. 1–8. [Google Scholar]
  2. Wilkening, S. Maintaining consistent anode density using varying carbon raw materials. In Proceedings of Light Metals 2009, San Francisco, CA, USA, 15–19 February 2009; pp. 991–997.
  3. Kocaefe, D.; Sarkar, A.; Das, S.; Amrani, S.; Bhattacharyay, D.; Sarkar, D.; Kocaefe, Y.; Morais, B.; Gagnon, M. Review of different techniques to study the interactions between coke and pitch in anode manufacturing. In Proceedings of Light Metals 2013, San Antonio, TX, USA, 3–7 March 2013; pp. 1045–1050.
  4. Rocha, V.G.; Blanco, C.; Santamaría, R.; Diestre, E.I.; Menéndez, R.; Granda, M. An insight into pitch/substrate processing temperature on pitch wetting capacity. Fuel 2007, 86, 1046–1052. [Google Scholar] [CrossRef]
  5. Sarkar, A.; Kocaefe, D.; Kocaefe, Y.; Sarkar, D.; Bhattacharyay, D.; Morais, B.; Chabot, J. Coke-pitch interactions during anode preparation. Fuel 2014, 117, 598–607. [Google Scholar] [CrossRef]
  6. Wilkening, S. Potentialities in the paste plant. In Proceedings of Light Metals 1997, Orlando, FL, USA, 9–13 February 1997; pp. 569–576.
  7. Keller, F.; Sulger, P.O. Anode Baking, 2nd ed.; R&D Carbon Ltd.: Sierre, Switzerland, 2008; pp. 95–96. [Google Scholar]
  8. Piffer, V.; Miotto, P.; Kato, C.; Silva, M.A.; Meier, M.; Perruchoud, R.; Sulger, P. Process optimization in the bake furnace. In Proceedings of Light Metals 2007, Orlando, FL, USA, 25 February–1 March 2007; pp. 959–964.
  9. Samanos, B.; Dreyer, C. Impact of coke calcination level and anode baking temperature on anode properties. In Proceedings of Light Metals 2001, New Orleans, LA, USA, 11–15 February 2001; pp. 681–688.
  10. Jentoftsen, T.E.; Linga, H.; Holden, I.; Aga, B.E.; Christensen, V.G.; Hoff, F. Correlation between anode properties and cell performance. In Proceedings of Light Metals 2009, San Francisco, CA, USA, 15–19 February 2009; pp. 301–304.
  11. Azari, K.; Alamdari, H.; Aryanpour, G.; Picard, D.; Fafard, M.; Adams, A. Mixing variables for prebaked anodes used in aluminium production. Powder Technol. 2013, 235, 341–348. [Google Scholar] [CrossRef]
  12. Belitskus, D.L. Effects of petroleum coke calcination temperature and anode baking temperature on anode properties. In Proceedings of Light Metals 1991, New Orleans, LA, USA, 17–21 February 1991; pp. 557–563.
  13. Boero, J.R. The reaction of petroleum cokes with air. Carbon 1987, 25, 477–483. [Google Scholar] [CrossRef]
  14. Dreyer, C.; Samanos, B.; Vogt, F. Coke calcination levels and aluminium anode quality. In Proceedings of Light Metals 1996, Anaheim, CA, USA, 4–8 February 1996; pp. 535–542.
  15. Anderson, M.J.; Whitcomb, P.J. DOE Simplified: Practical Tools for Effective Experimentation, 2nd ed.; Taylor & Francis: Abingdon, UK, 2007. [Google Scholar]
  16. Eriksson, L.; Johansson, E.; Kettaneh-Wold, N.; Wikström, C.; Wold, S. Design of Experiments–Principles and Applications, 3rd ed.; Umetrics AB: Umeå, Sweden, 2008. [Google Scholar]
  17. Lossius, L.P.; Holden, I.; Linga, H. The equivalent temperature method for measuring the baking level of anodes. In Proceedings of Light Metals 2006, San Antonio, TX, USA, 12–16 March 2006; pp. 609–613.
  18. Rørvik, S.; Lossius, L.P.; Ratvik, A.P. Determination of coke calcination level and anode baking level–application and reproducibility of L-sub-C based methods. In Proceedings of Light Metals 2011, San Diego, CA, USA, 27 February–3 March 2011; pp. 841–846.
  19. Al-Haj-Ibrahim, H.; Morsi, B.I. Desulfurization of petroleum coke: A review. Ind. Eng. Chem. Res. 1992, 31, 1835–1840. [Google Scholar] [CrossRef]
  20. Sommerseth, C. The effect of production parameters on the performance of carbon anodes for aluminium production. Ph.D. Thesis, Norwegian University of Science and Technology, Trondheim, Norway, 2016. [Google Scholar]
  21. Lossius, L.P.; Hydro Aluminium, Oslo. Personal communication, 2017.
  22. Oberlin, A. Carbonization and graphitization. Carbon 1984, 22, 521–541. [Google Scholar] [CrossRef]
  23. Tran, K.N.; Berkovich, A.J.; Tomsett, A.; Bhatia, S.K. Influence on sulfur and metal microconstituents on the reactivity of carbon anodes. Energy Fuels 2009, 23, 1909–1924. [Google Scholar] [CrossRef]
Figure 1. Pore size distribution for the pilot scale anodes varying in mixing temperature and baking level obtained by Hg porosimetry.
Metals 07 00074 g001
Figure 2. Optical microscopy image of anode samples mounted in fluorescent epoxy. Pores filled with epoxy appear yellow and carbon matrix appears red. The image (a) shows the anode with low mixing temperature and baking level. The image (b) shows the anode with high mixing temperature and target baking level.
Metals 07 00074 g002
Figure 3. Interaction of mixing temperature vs. baking level on the physical parameters density, specific electrical resistivity, and air permeability.
Metals 07 00074 g003
Figure 4. Interaction of mixing temperature vs. baking level on the physical properties coefficient of thermal expansion, CO2 reactivity, and air reactivity.
Metals 07 00074 g004
Figure 5. Pareto chart showing effects A, B, and interaction effect AB for all three cases.
Metals 07 00074 g005
Table 1. The three 22 factorial design setup with main factors A (mixing temperature) and B (baking level), and −1 indicating low levels and +1 indicating high levels.
Prod. Param.Main FactorProd. Param.Main FactorProd. Param.Main Factor
TMix (°C)TBaking (°E)ABTMix (°C)TBaking (°E)ABTMix (°C)TBaking (°E)AB
1501150−1−11501260−1−11501150−1−1
21011501−121012601−121011501−1
1501260−111501350−111501350−11
210126011210135011210135011
Table 2. ISO standard methods used when characterizing the pilot anodes. CTE: coefficient of thermal expansion; SER: specific electrical resistivity.
Physical PropertyISO Standardr *R **
Density12985-1:20000.0040.008
SER11713:20001.21.5
Air perm.In-house method at Hydro comparable to 15906:20070.030.13
CTE14420:2005 (temp. range extended to 300–700 °C)0.10.17
RCO2In-house method at Hydro comparable to 12988-1N/AN/A
RAirIn-house method at Hydro comparable to 12989-1N/AN/A
* Reproducibility within-lab; ** Reproducibility between-labs.
Table 3. Underbaking (1150 °E) vs. target baking (1260 °E). Anode production parameters and corresponding physical properties (yn) of these anodes.
Prod. Param.Main Factory1y2y3y4y5y6
TMixTBakingABDensitySERPerm.CTERCO2RAir
°C°Eg/cm3µΩmnPmµm/(m·K)mg/(cm2·h)mg/(cm2·h)
1501150−1−11.50273.46.884.114.746.3
21011501−11.58460.31.274.121347.9
1501260−111.52665.15.313.9317.541.5
2101260111.57659.71.44.071548.1
Table 4. Target baking (1260 °E) vs. overbaking (1350 °E). Anode production parameters and corresponding physical properties (yn) of these anodes.
Prod. Param.Main Factory1y2y3y4y5y6
TMixTBakingABDensitySERPerm.CTERCO2RAir
°C°Eg/cm3µΩmnPmµm/(m·K)mg/(cm2·h)mg/(cm2·h)
1501260−1−11.52665.15.313.9317.541.5
21012601−11.57659.71.44.071548.1
1501350−111.55460.43.18418.529.8
2101350111.59857.41.664.0316.526.9
Table 5. Underbaking (1150 °E) vs. overbaking (1350 °E). Anode production parameters and corresponding physical properties (yn) of these anodes.
Prod. Param.Main Factory1y2y3y4y5y6
TMixTBakingABDensitySERPerm.CTERCO2RAir
°C°Eg/cm3µΩmnPmµm/(m·K)mg/(cm2·h)mg/(cm2·h)
1501150−1−11.50273.46.884.114.746.3
21011501−11.58460.31.274.121347.9
1501350−111.55460.43.18418.529.8
2101350111.59857.41.664.0316.526.9
Table 6. Underbaking vs. target baking. Effects of main factors A and B, and interaction effect AB on the various physical parameters.
Effecty1y2y3y4y5y6
DensitySERPerm.CTERCO2RAir
g/cm3µΩmnPmµm/(m·K)mg/(cm2·h)mg/(cm2·h)
A0.066−9.25−4.760.08−2.14.1
B0.008−4.45−0.72−0.112.4−2.3
Interaction AB−0.0163.850.850.06−0.42.5
Table 7. Target baking vs. overbaking. Effects of main factors A and B, and interaction effect AB on the various physical parameters.
Effecty1y2y3y4y5y6
DensitySERPerm.CTERCO2RAir
g/cm3µΩmnPmµm/(m·K)mg/(cm2·h)mg/(cm2·h)
A0.047−4.2−2.7150.085−2.251.85
B0.025−3.5−0.9350.0151.25−16.45
Interaction AB−0.0031.21.195−0.0550.25−4.75
Table 8. Underbaking vs. overbaking. Effects of main factors A and B, and interaction effect AB on the various physical parameters.
Effecty1y2y3y4y5y6
DensitySERPerm.CTERCO2RAir
g/cm3µΩmnPmµm/(m·K)mg/(cm2·h)mg/(cm2·h)
A0.063−8.05−3.5650.025−1.85−0.65
B0.033−7.95−1.655−0.0953.65−18.75
Interaction AB−0.0195.052.0450.005−0.15−2.25

