
Comparison of Hydrostatic Extrusion between Pressure-Load and Displacement-Load Models


Abstract
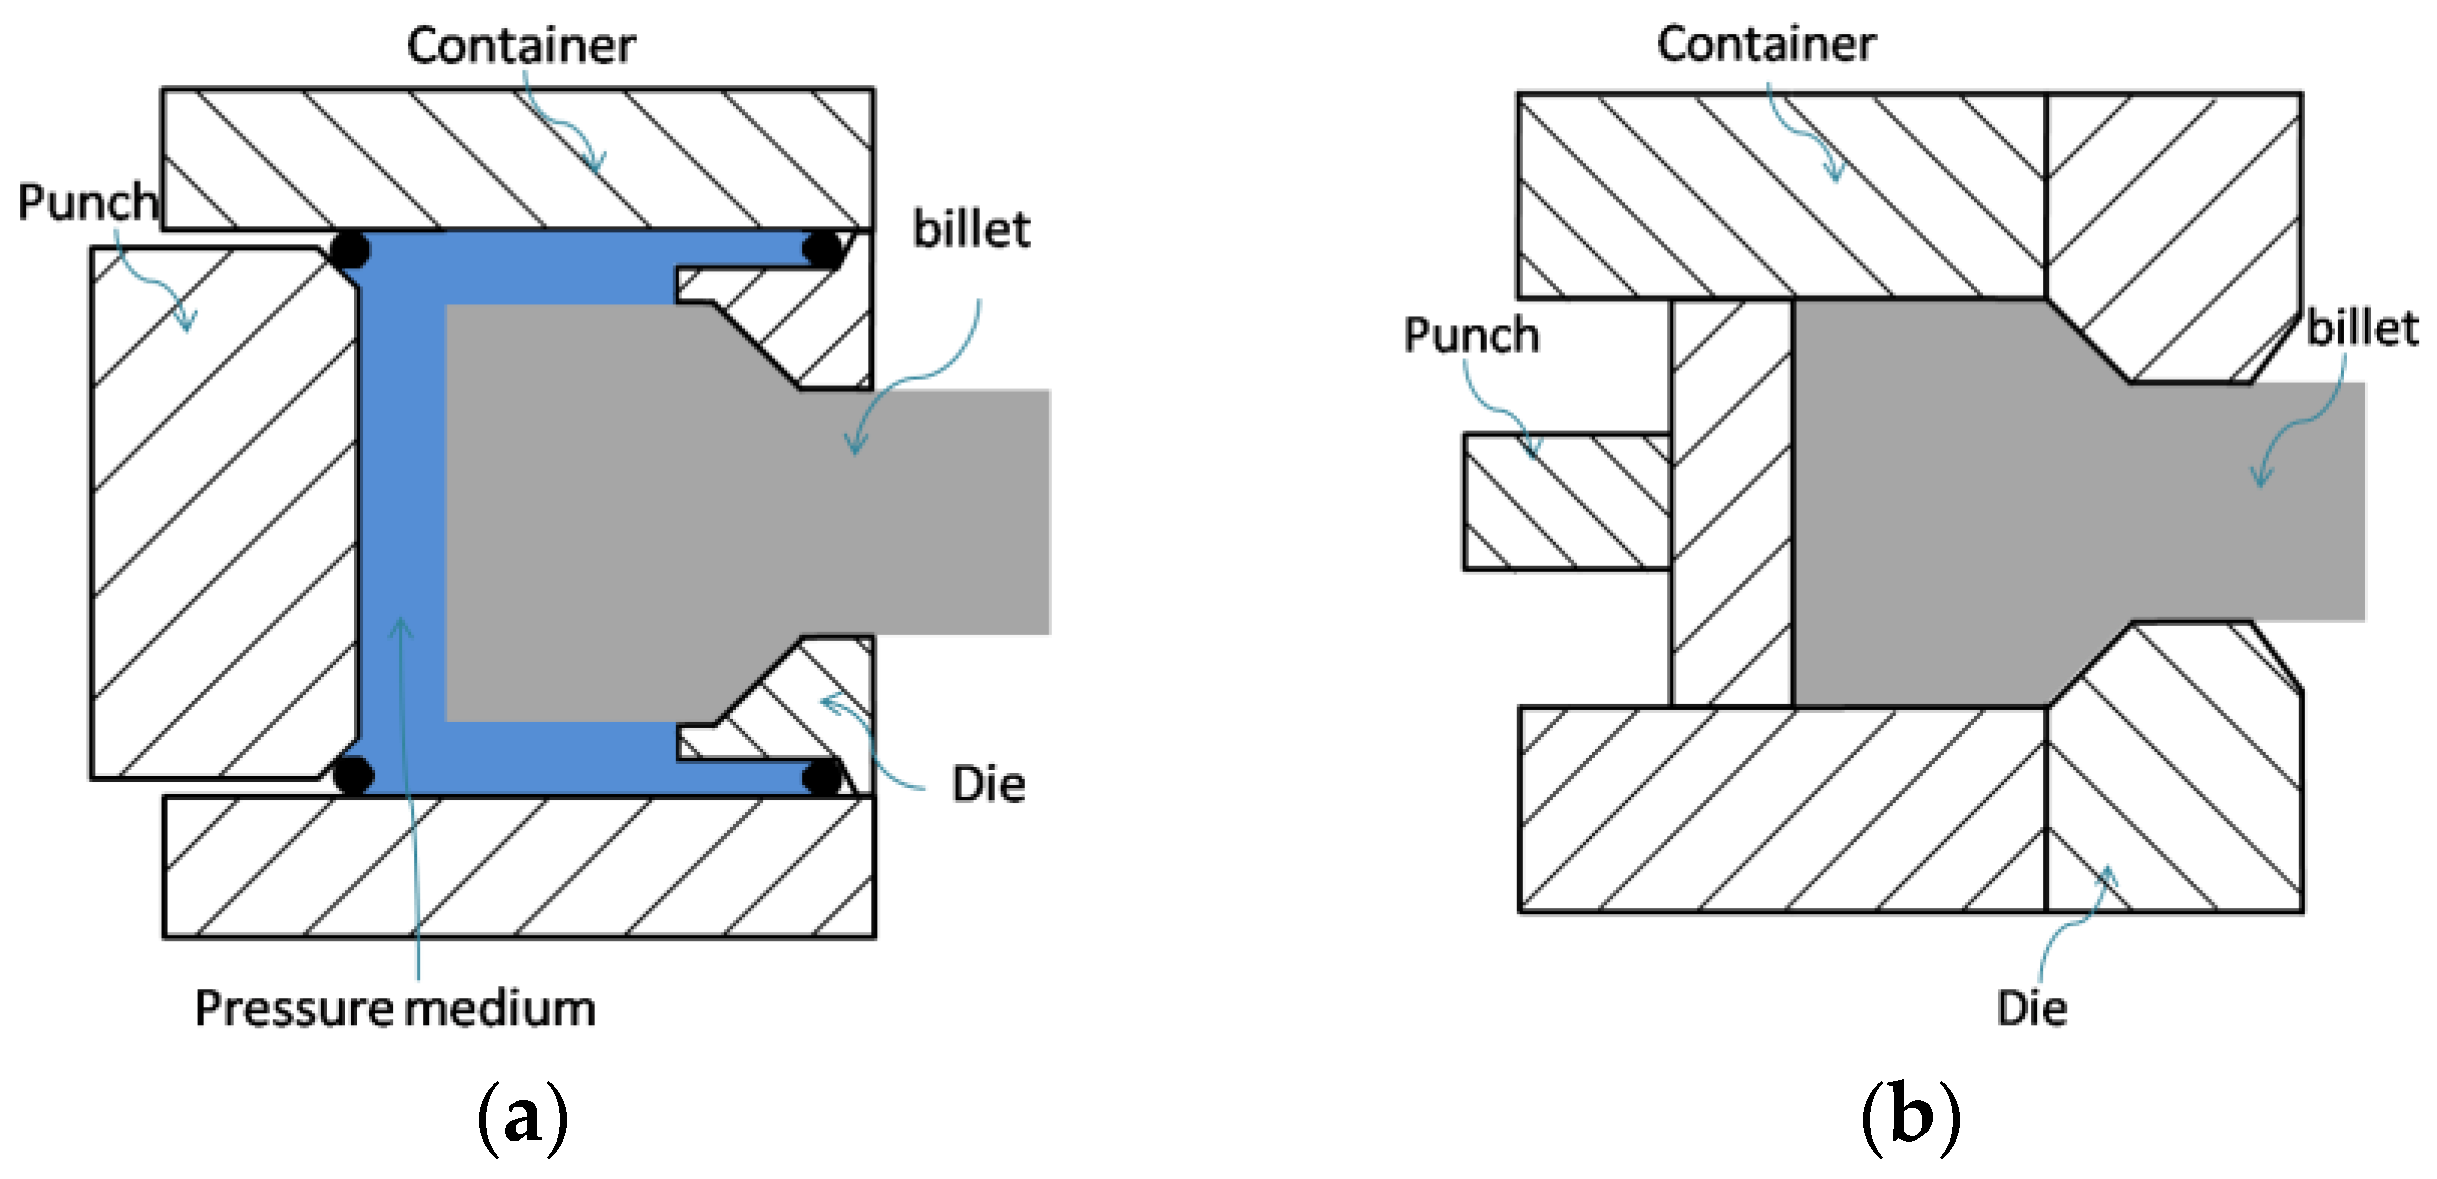
:1. Introduction
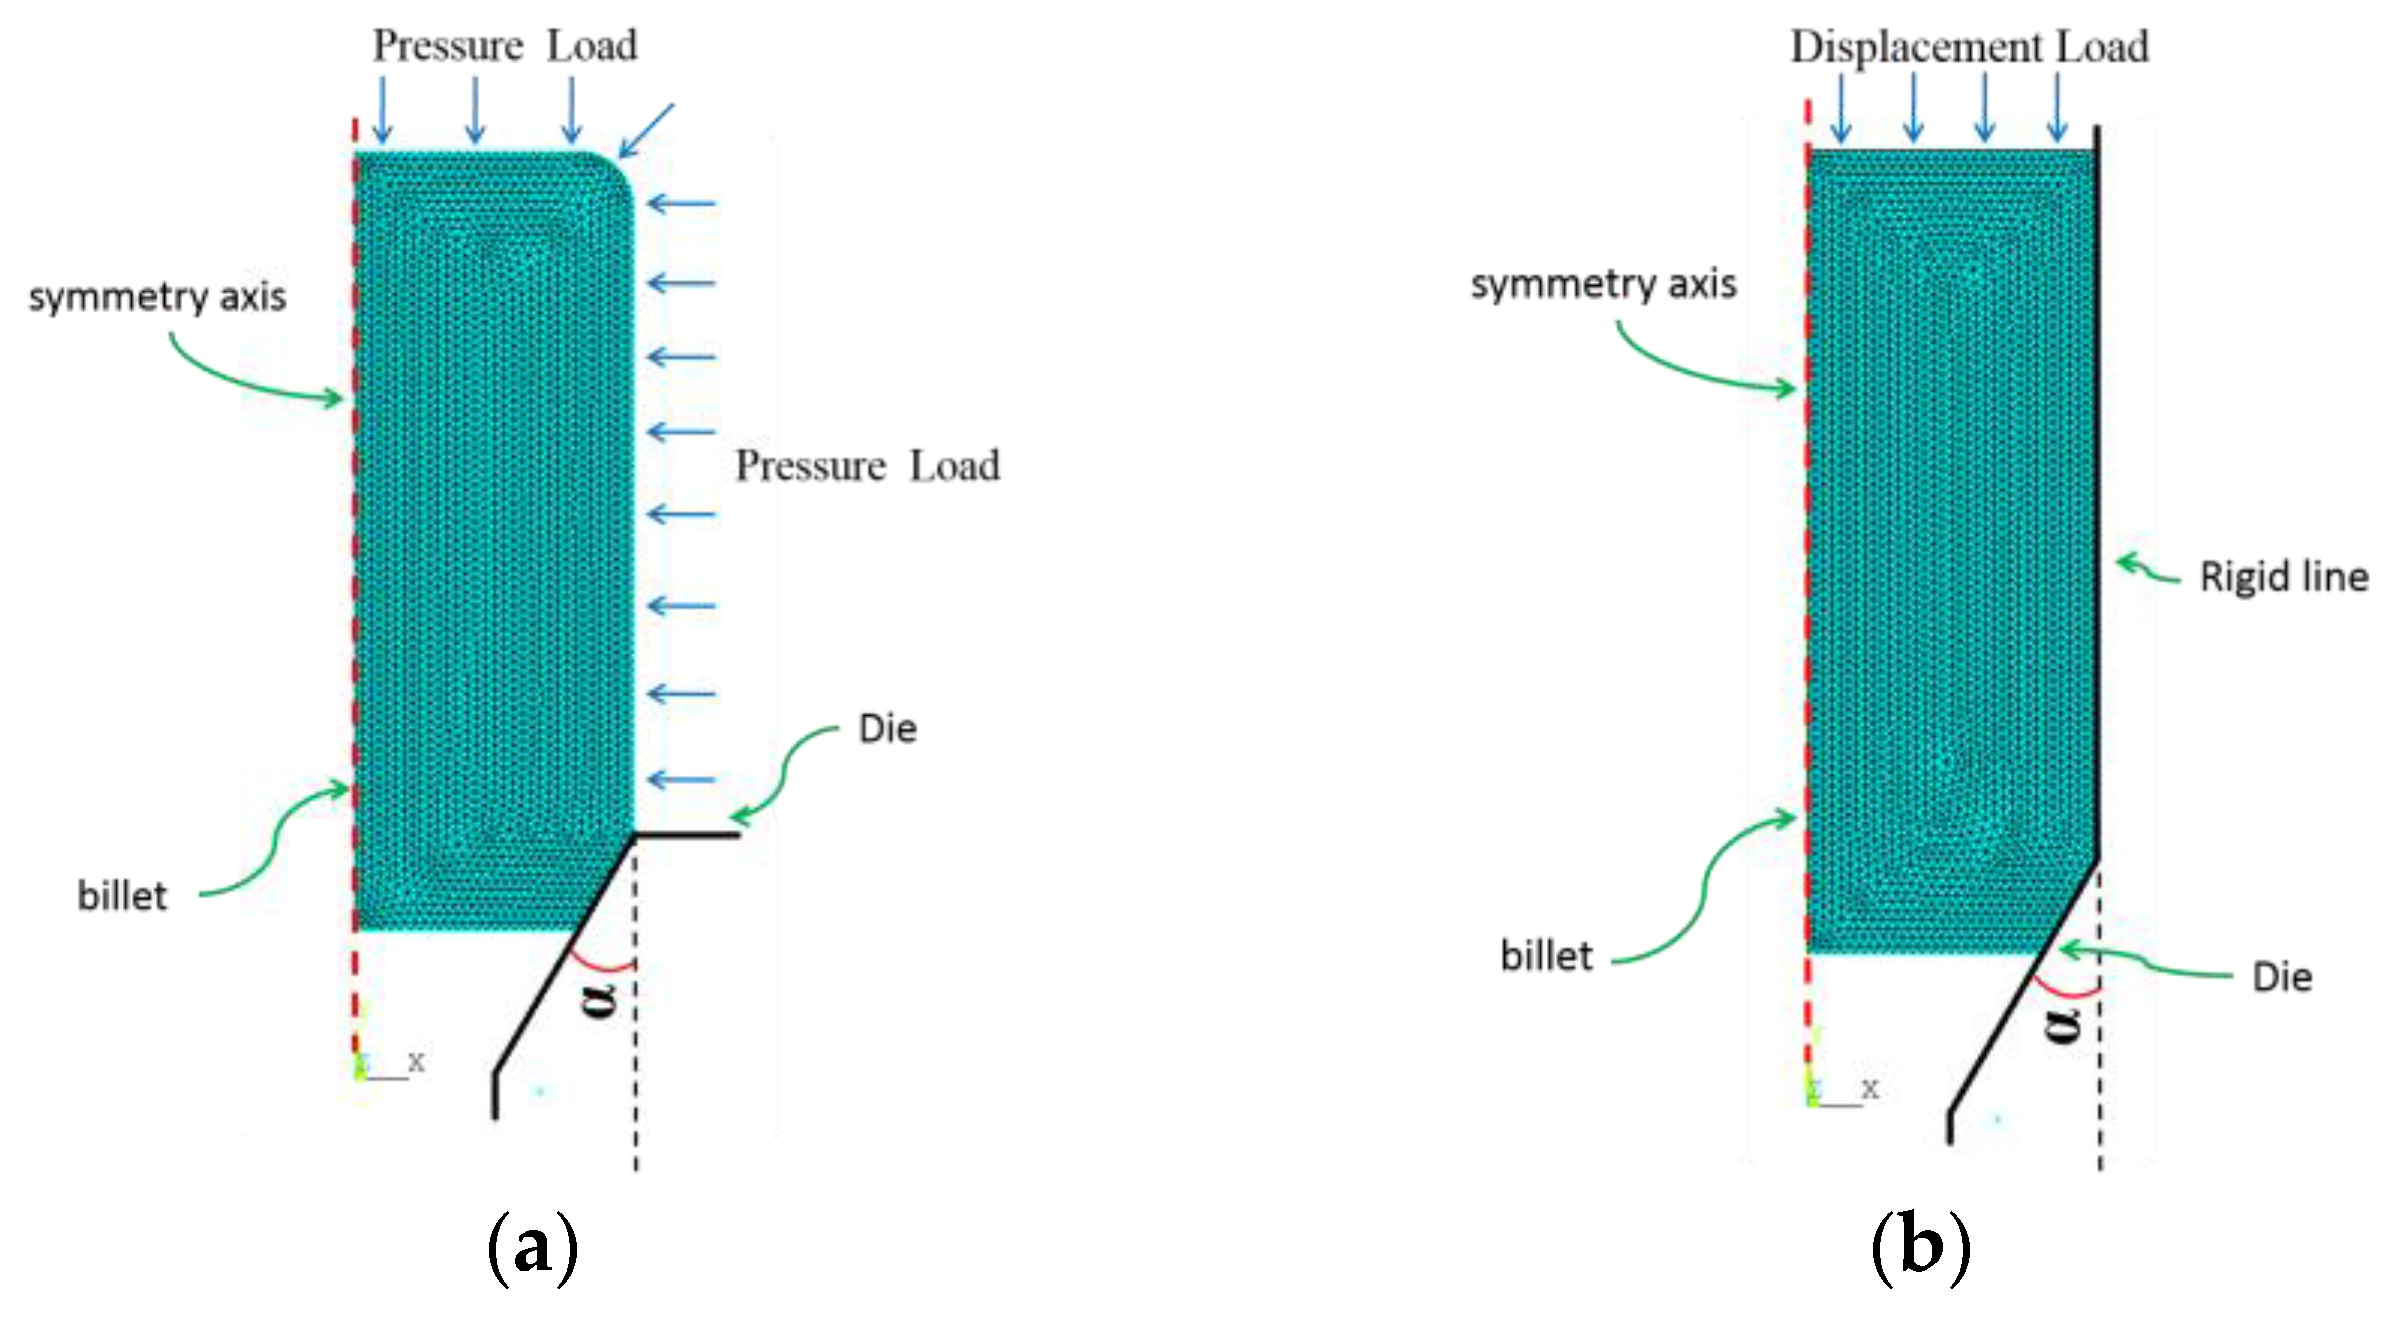
2. FEM Methods and Materials
3. Results and Discussion
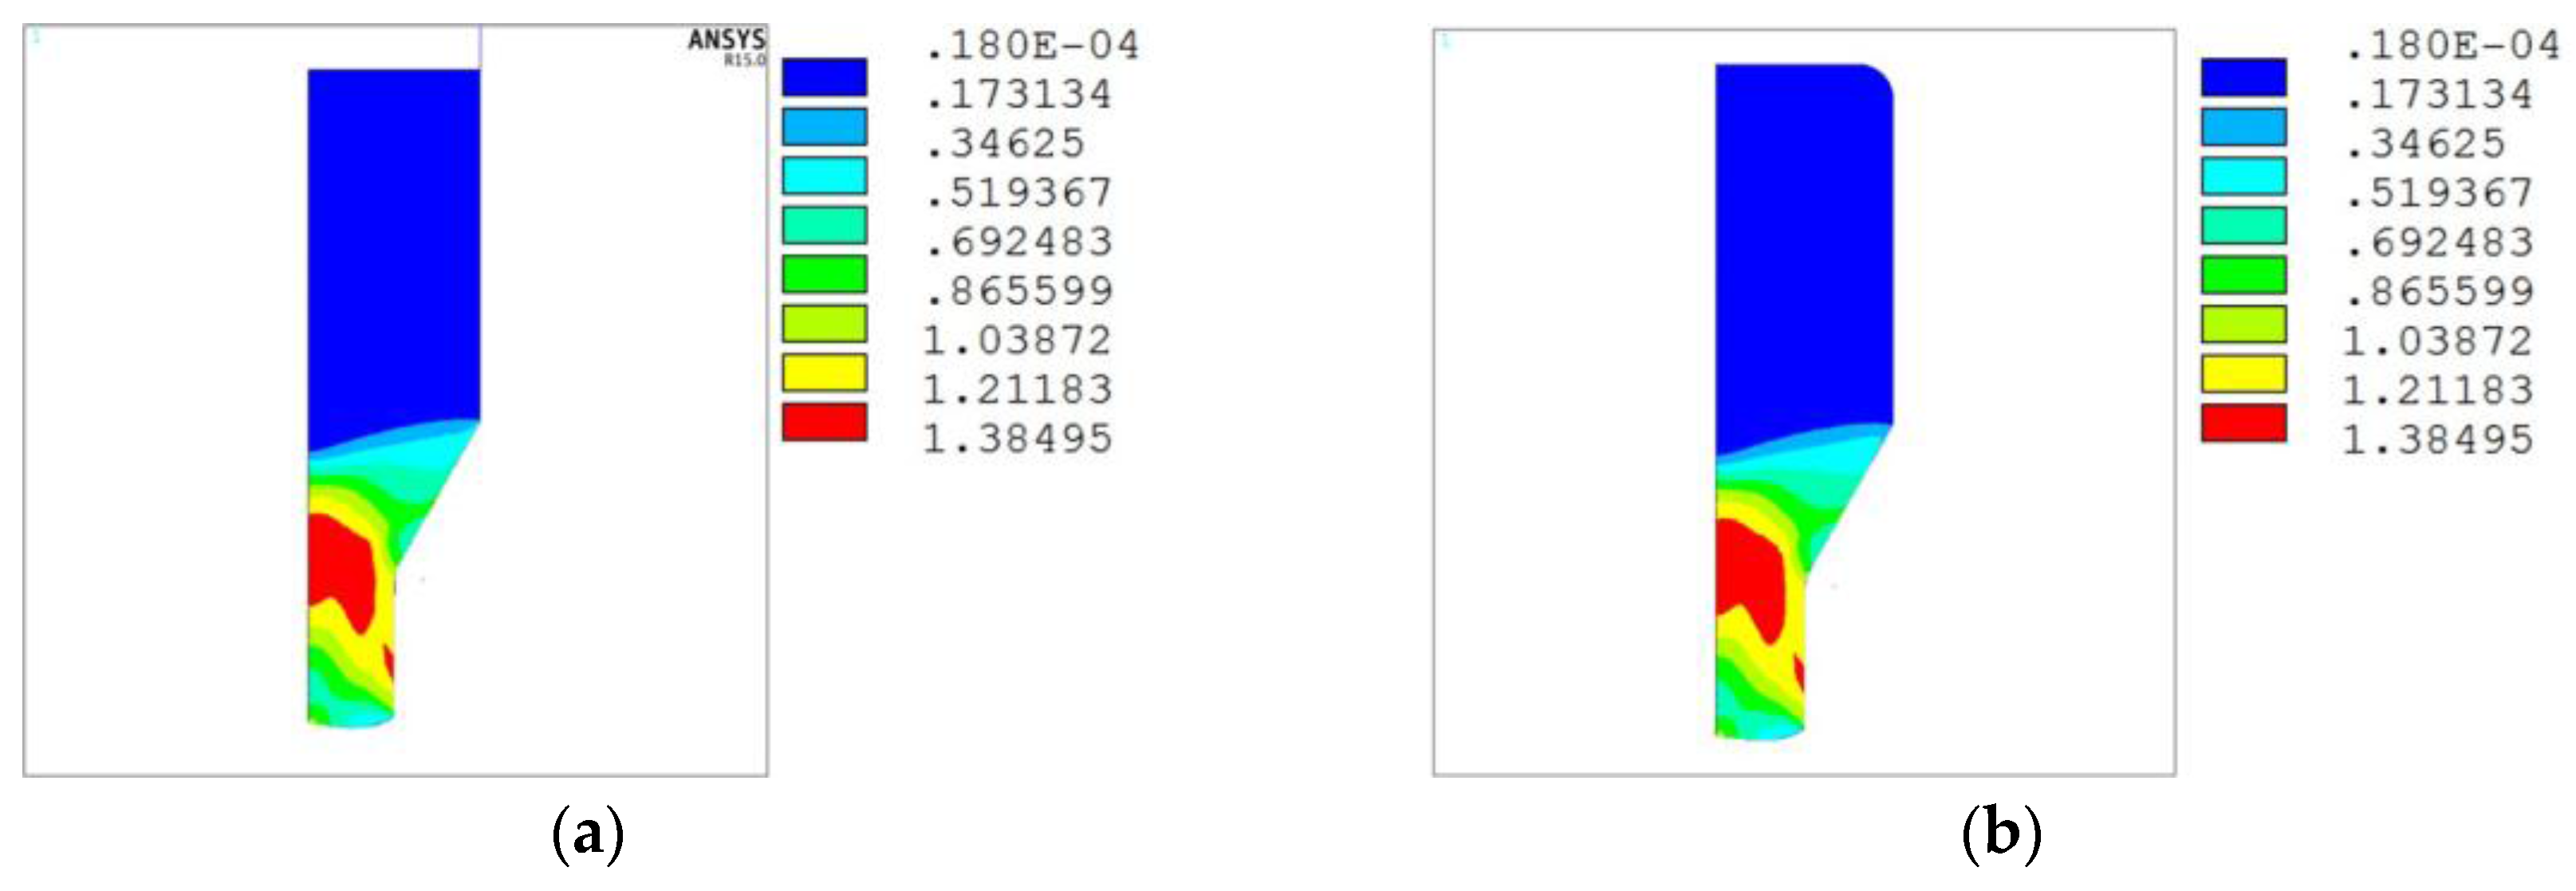
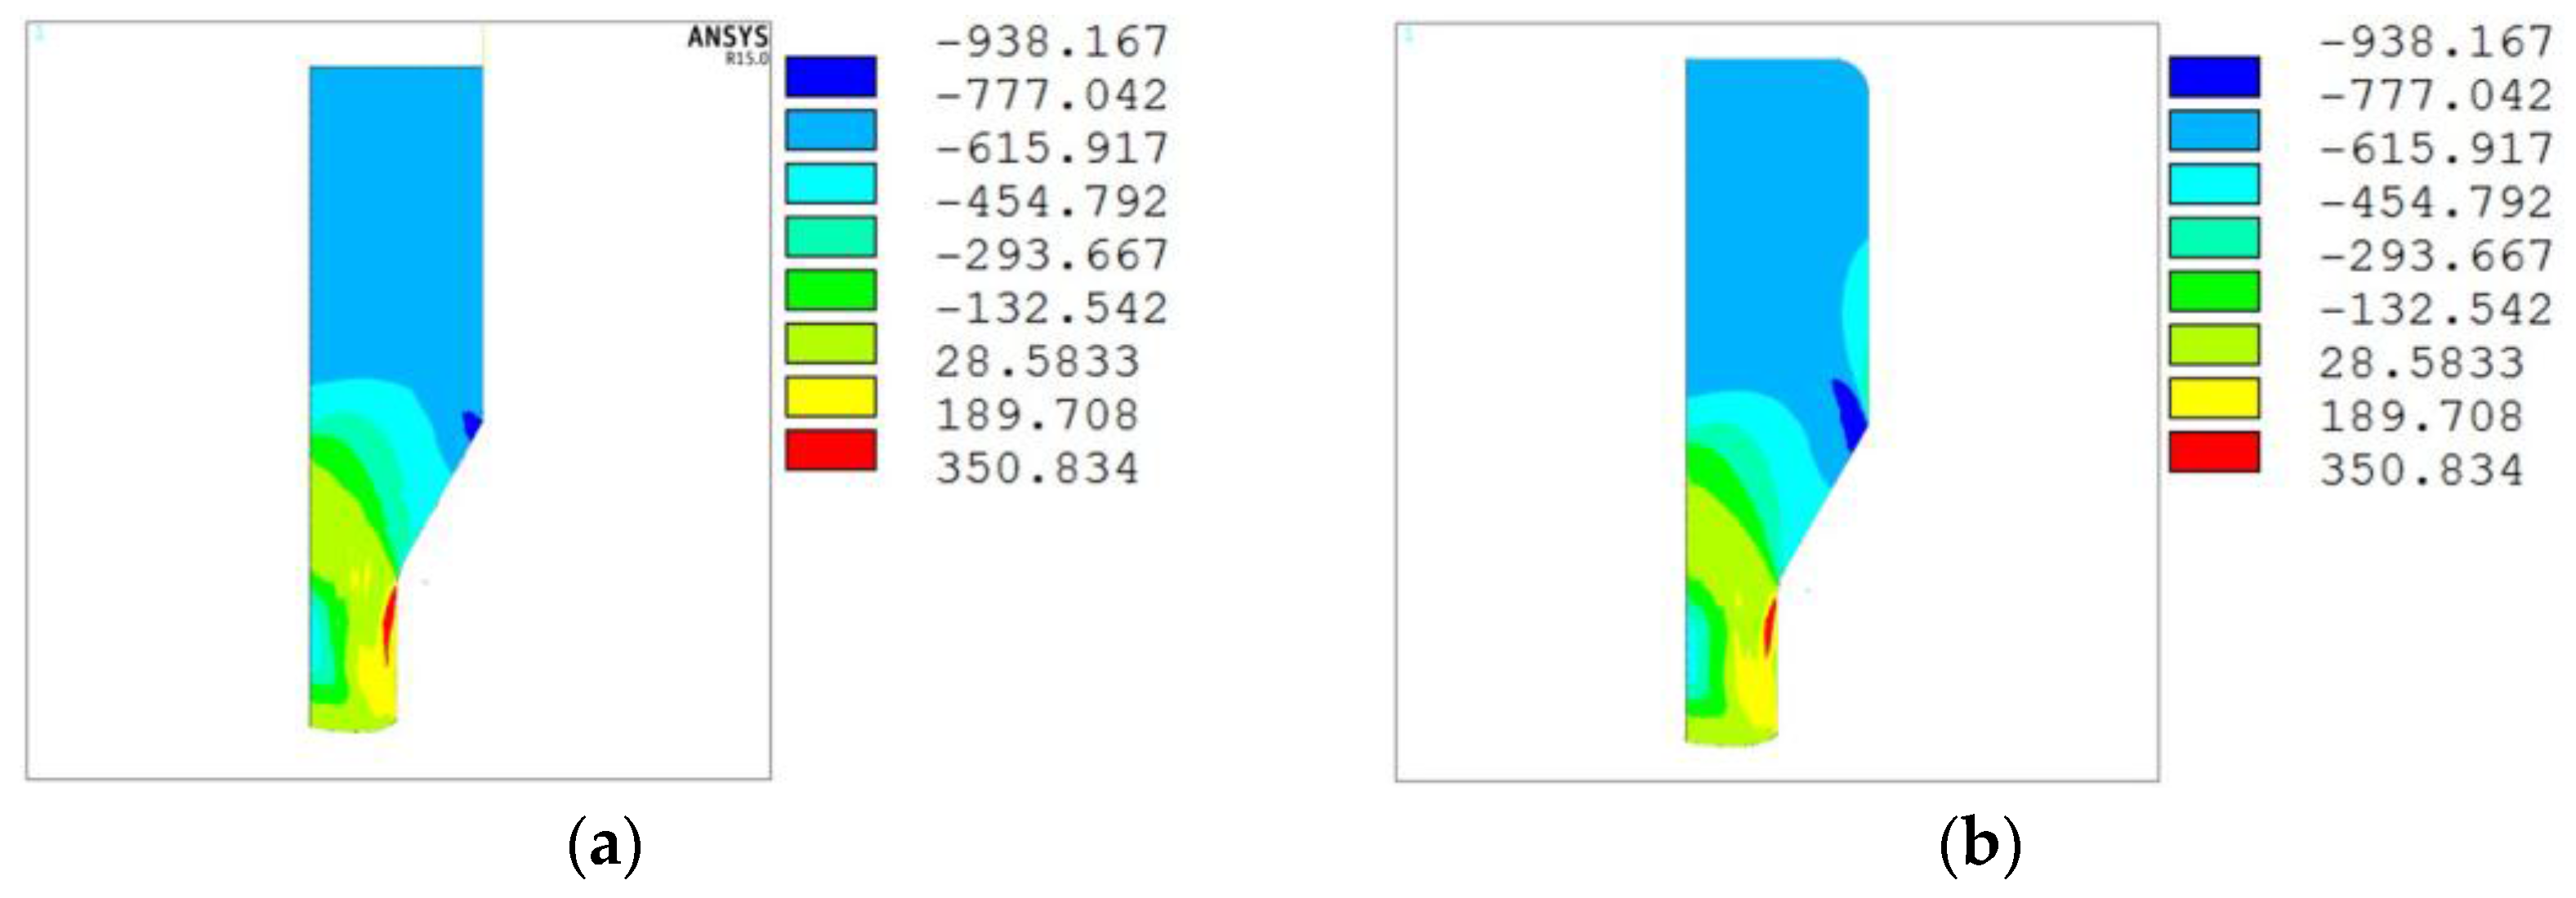
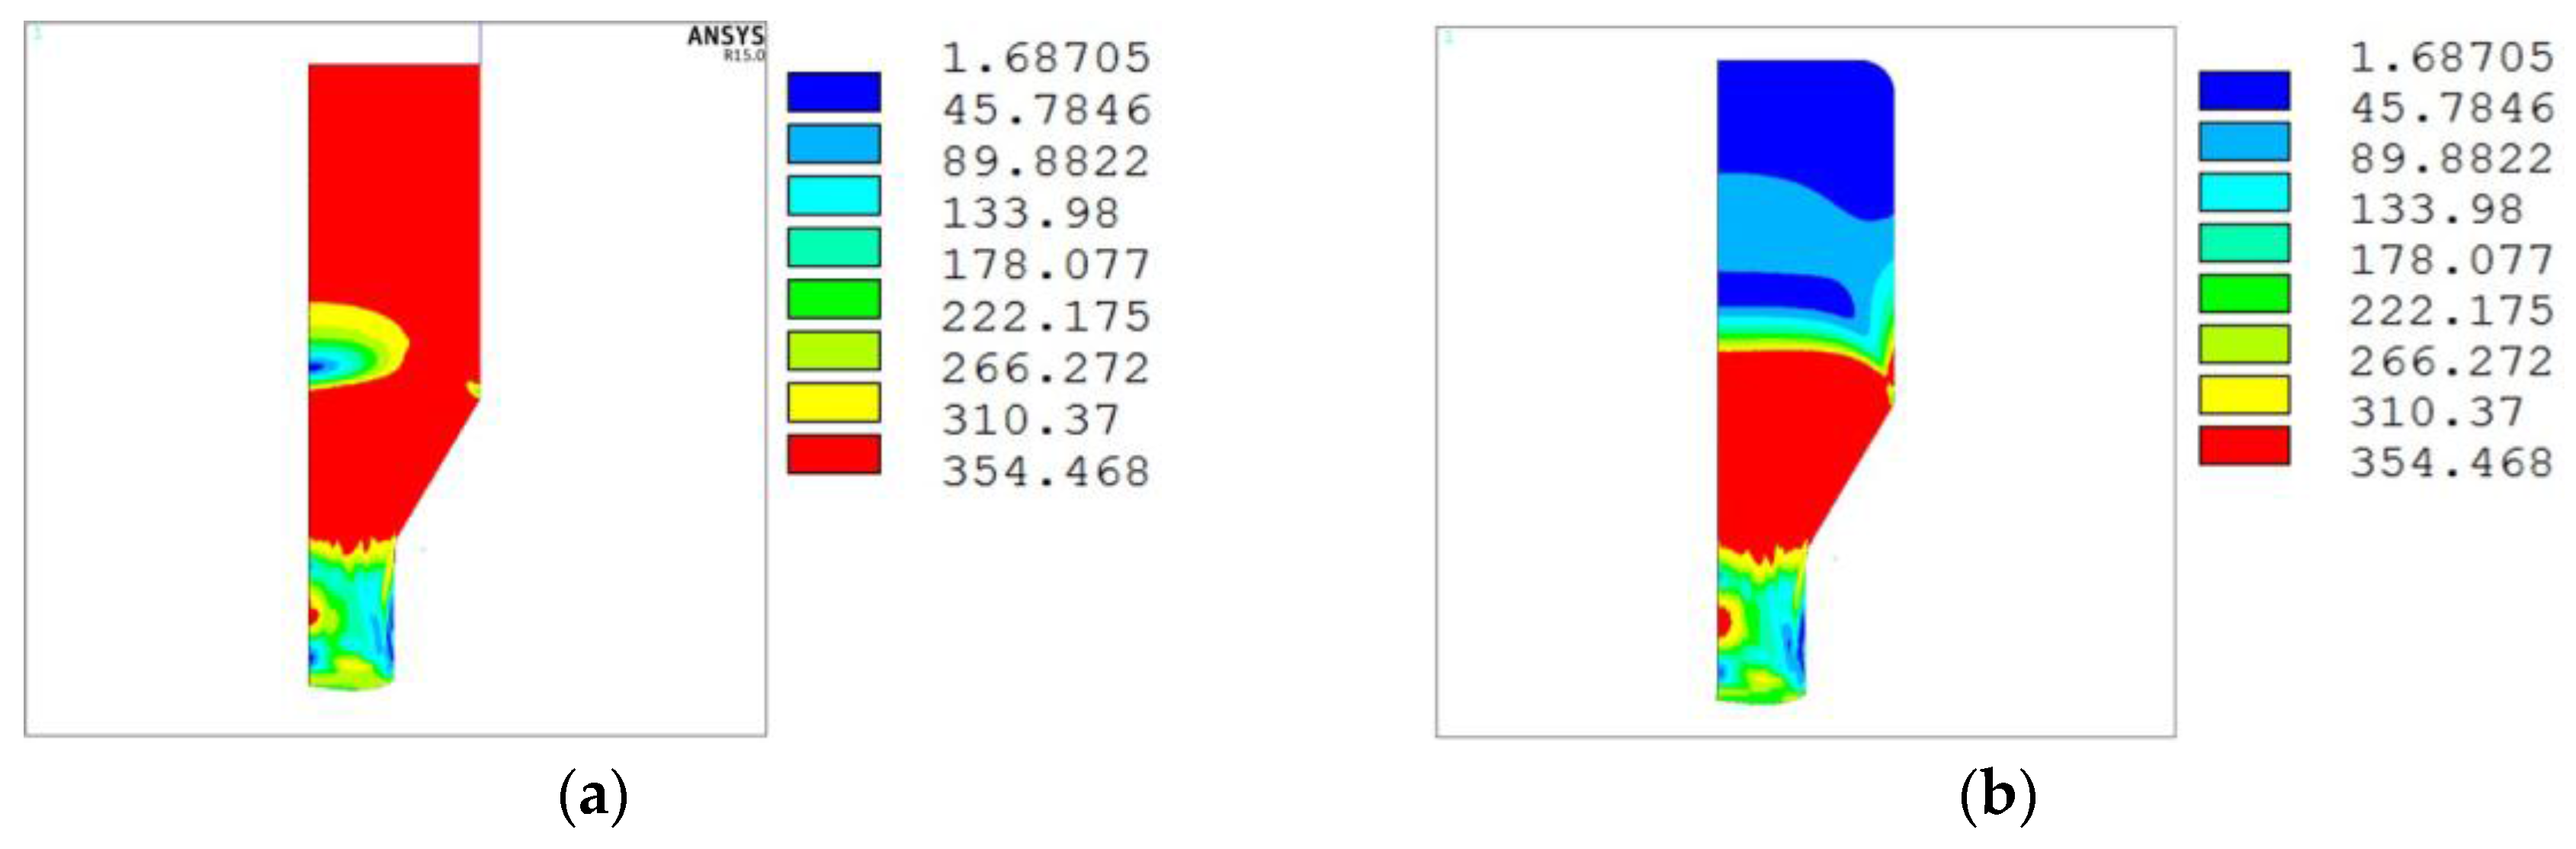
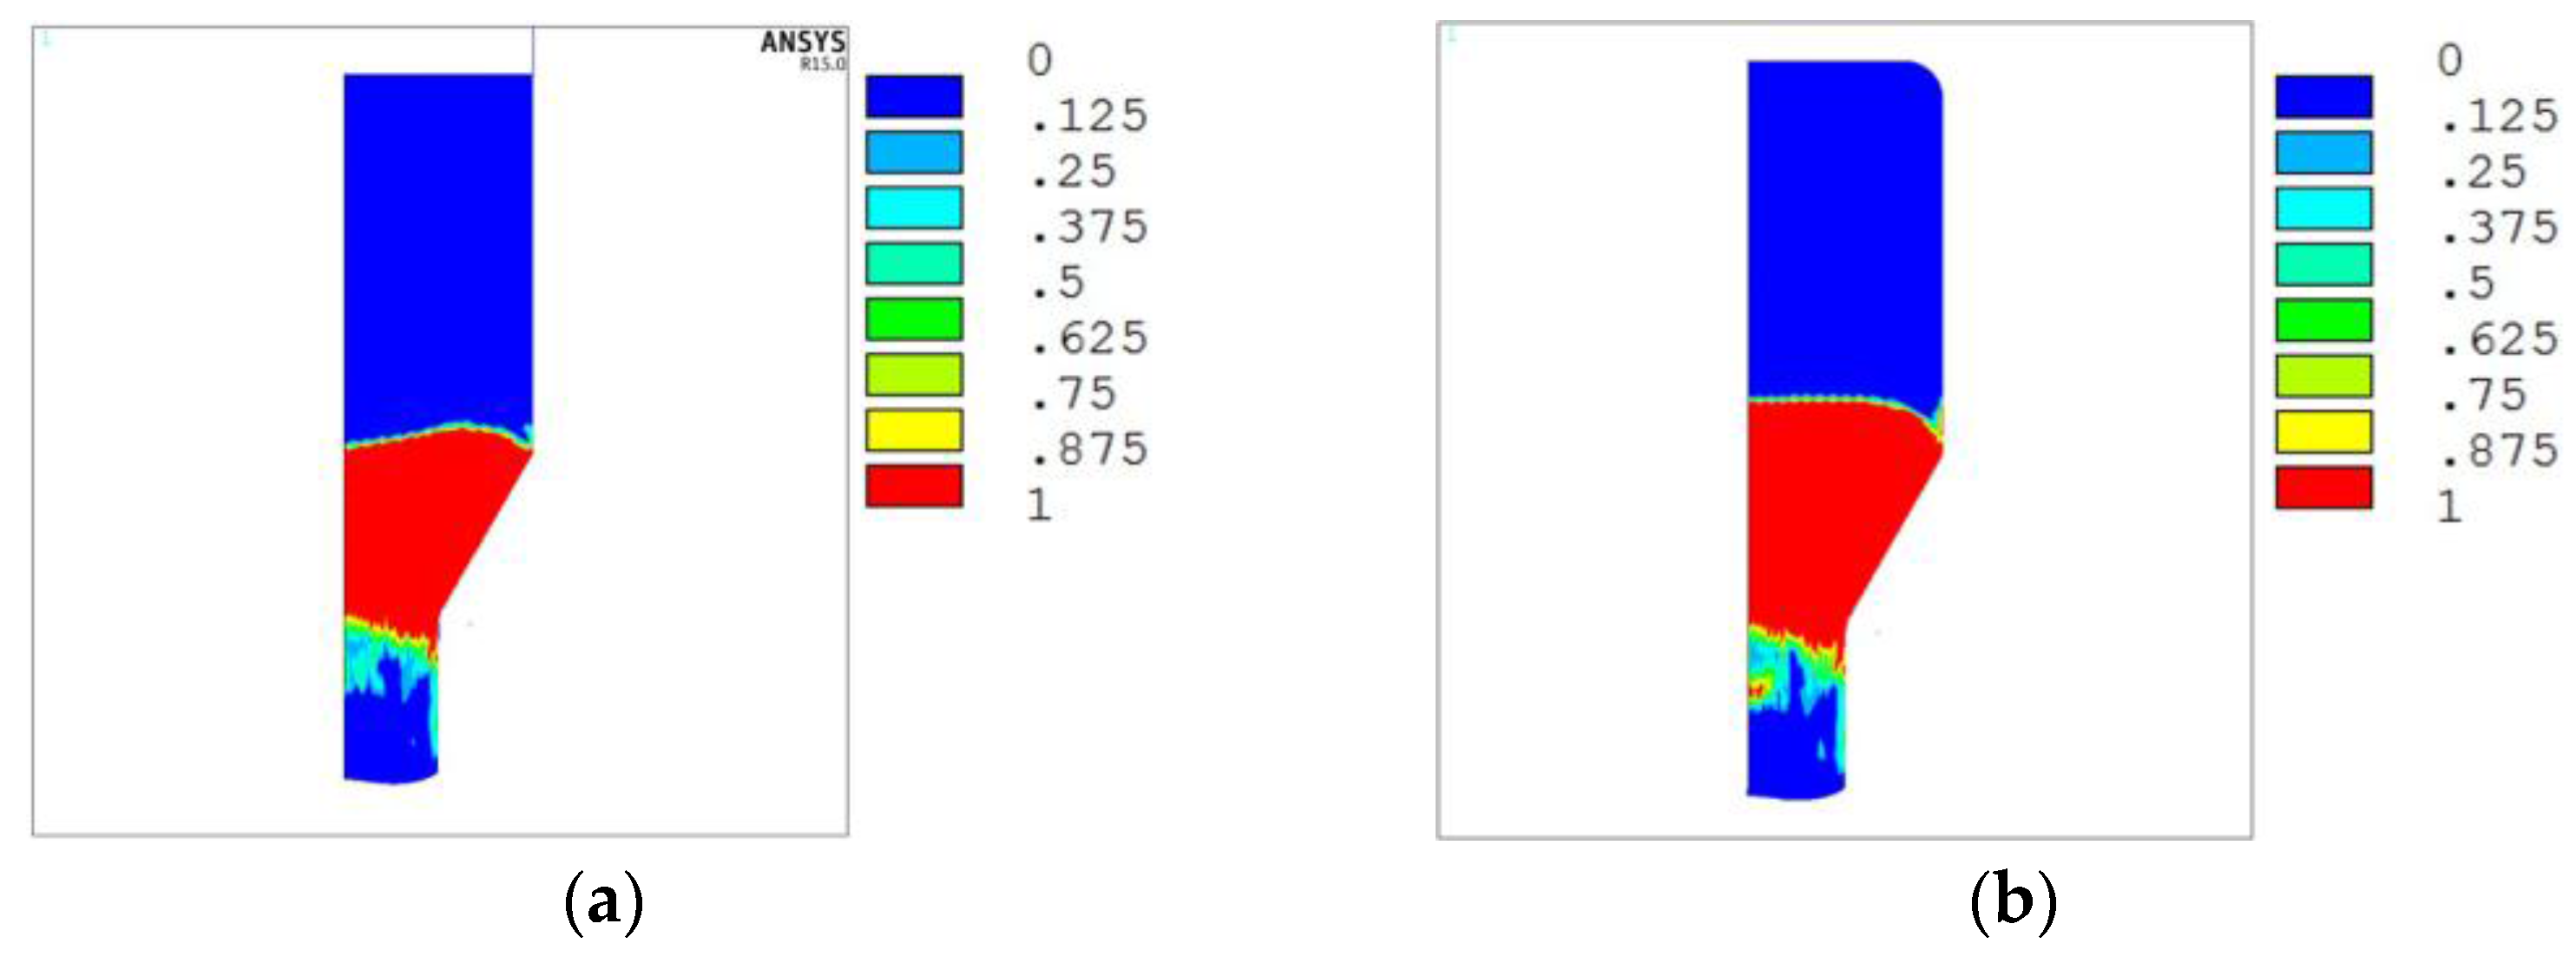
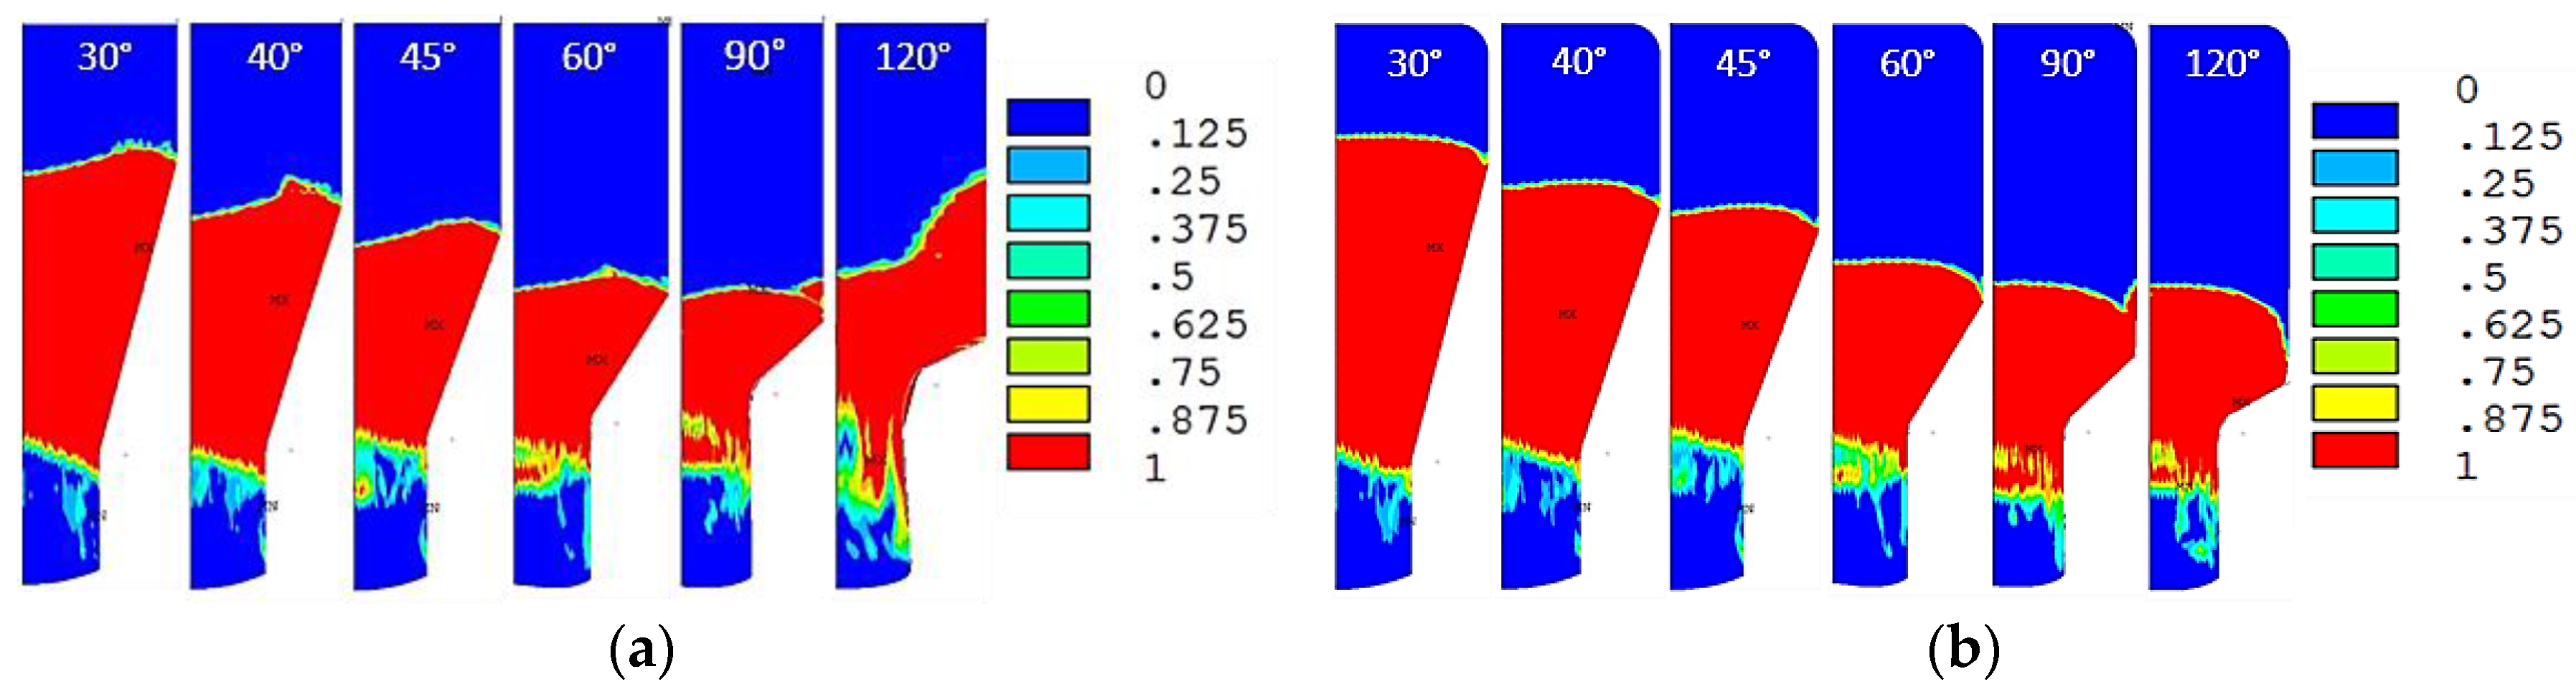
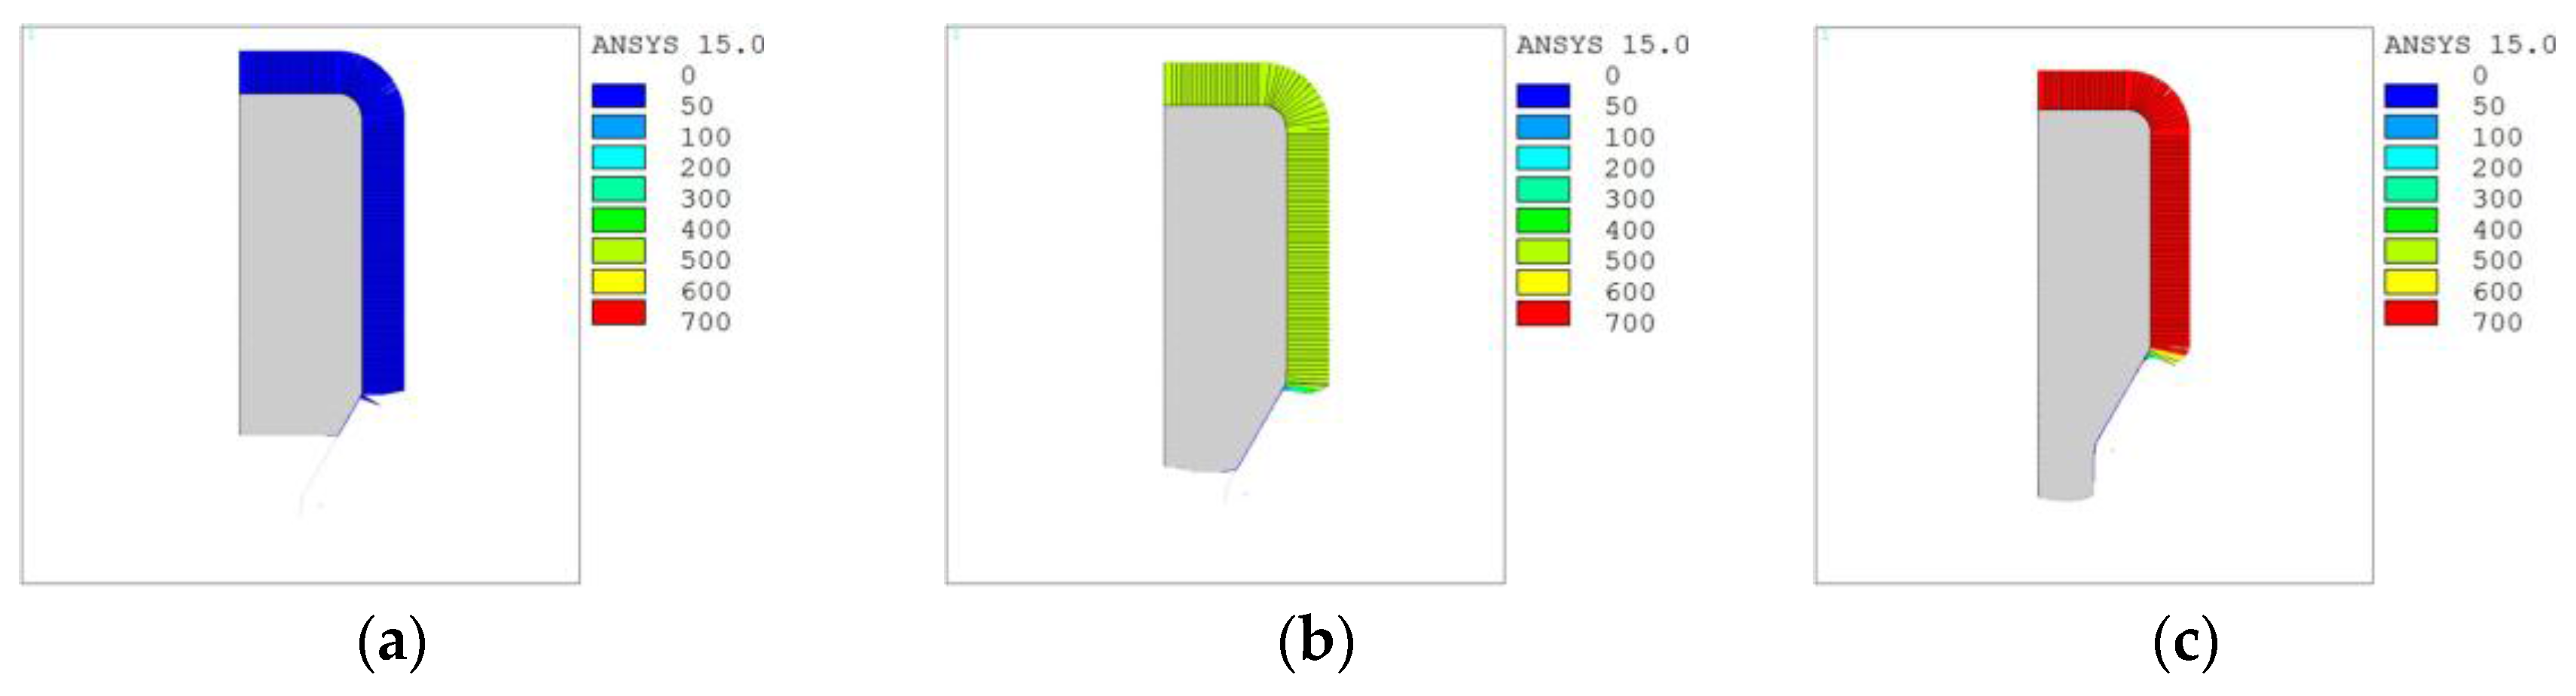
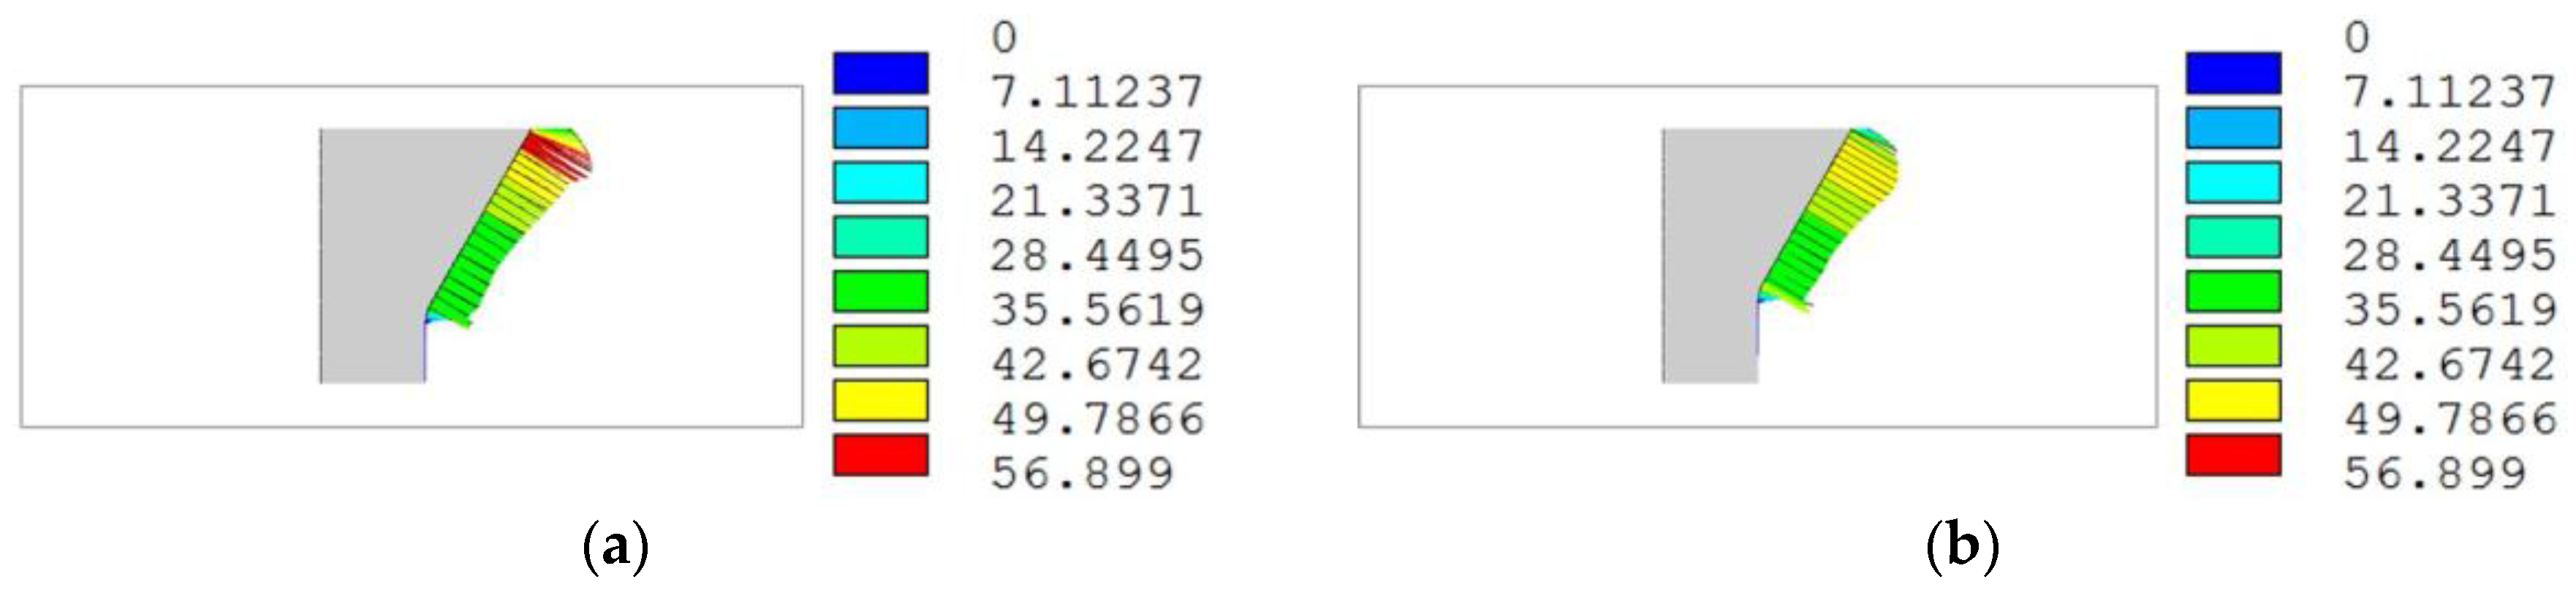
3.1. Comparison of Distribution of Stress and Strain Field
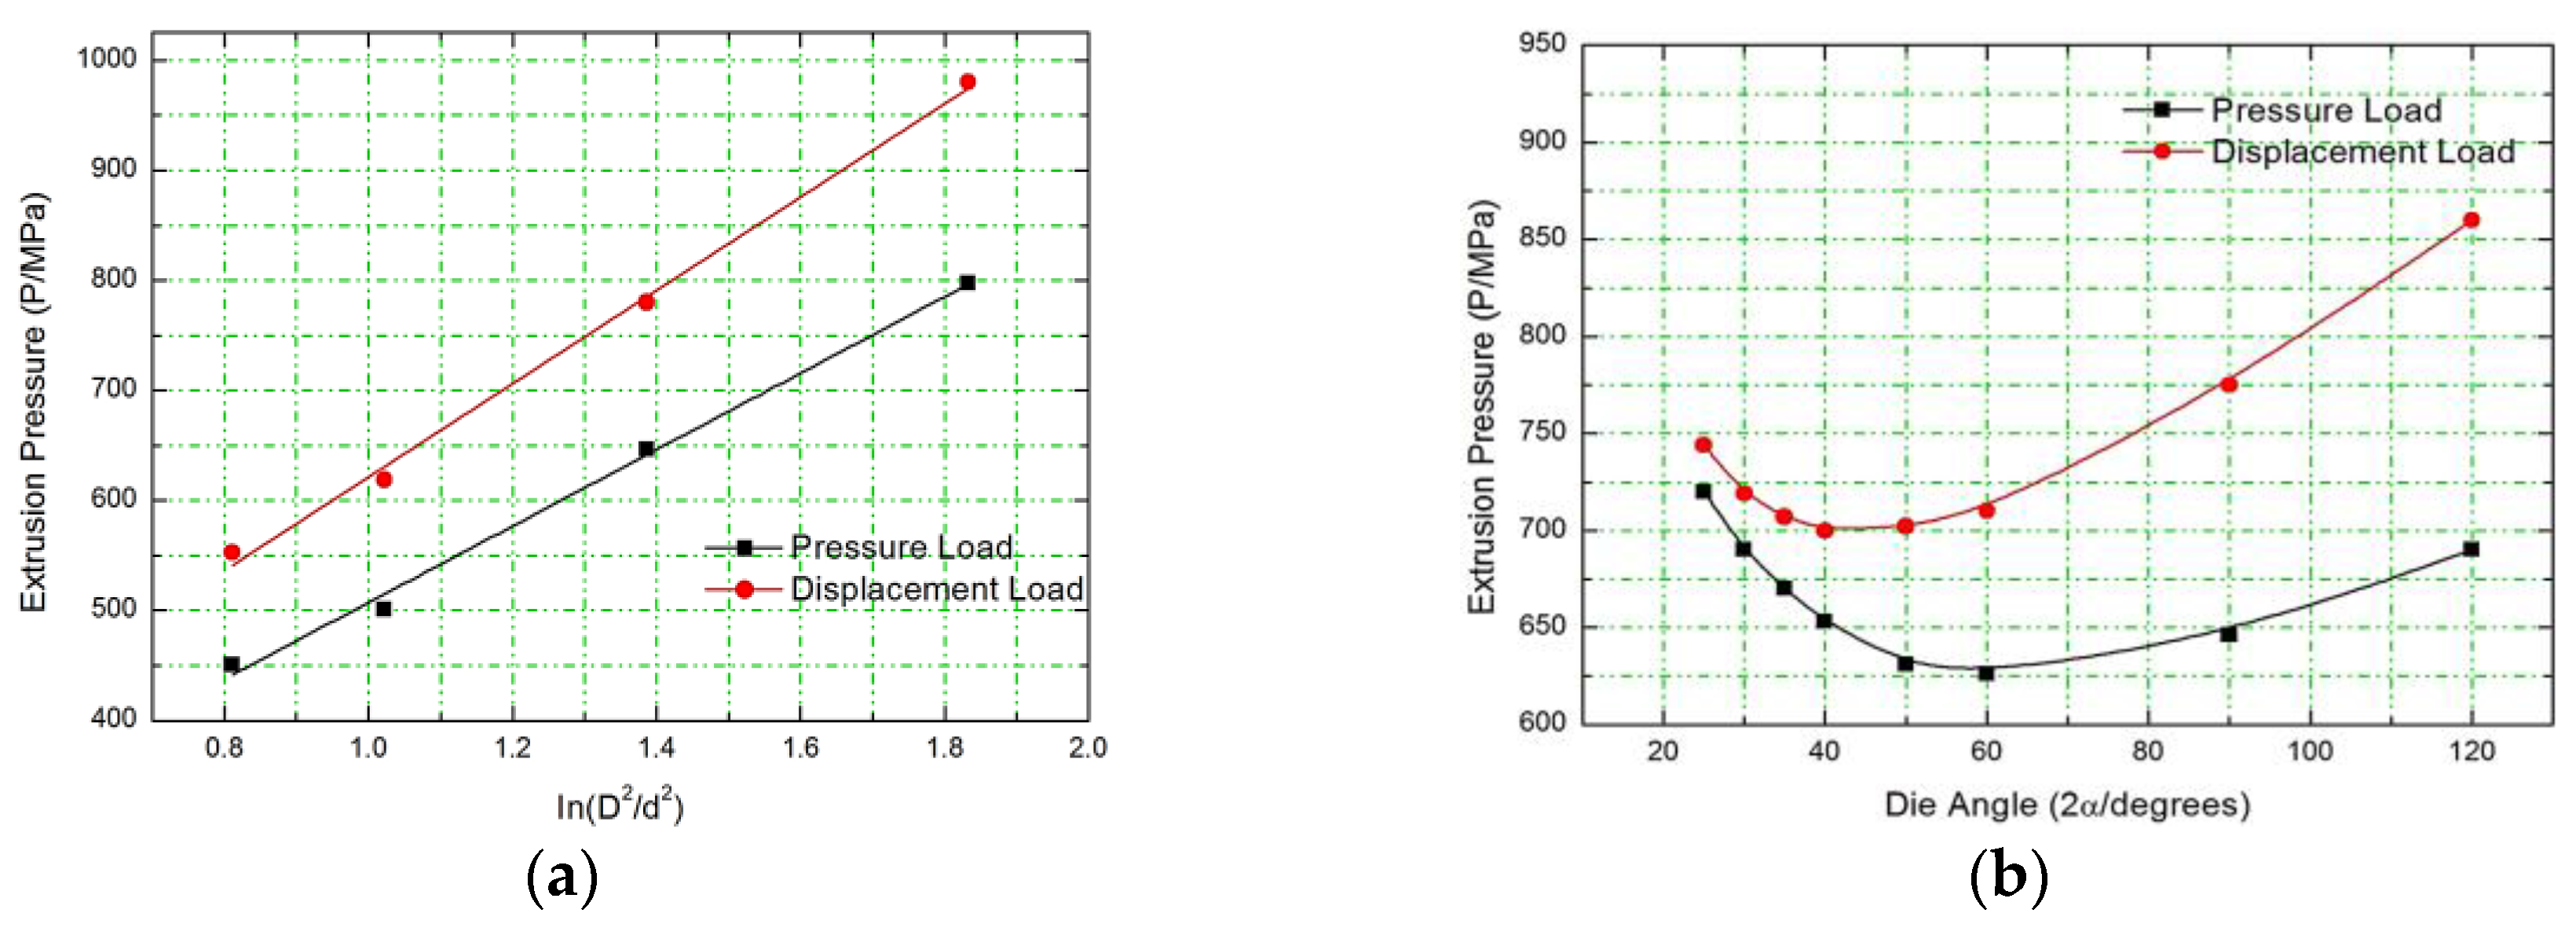
3.2. Comparison of Extrusion Pressure
4. Conclusions
Acknowledgments
Author Contributions
Conflicts of Interest
References
- Robertson, J. Method of and Apparatus for Forming Metal Articles. British Patent No. 19 356, 14 October 1894. [Google Scholar]
- Wilson, W.R.D.; Walowit, J.A. An isothermal hydrodynamic lubrication theory for hydrostatic extrusion and drawing processes with conical dies. J. Lubr. Technol. 1971, 93, 69–74. [Google Scholar] [CrossRef]
- Ozaltin, K.; Chrominski, W.; Kulczyk, M.; Panigrahi, A.; Horky, J.; Zehetbauer, M.; Lewandowska, M. Enhancement of mechanical properties of biocompatible Ti–45Nb alloy by hydrostatic extrusion. J. Mater. Sci. 2014, 49, 6930–6936. [Google Scholar] [CrossRef]
- Yu, Y.; Zhang, W.C.; Duan, X.R. Study on microstructure and properties of thin tube of AZ31 magnesium alloy by extrusion technology. Powder Metall. Technol. 2013, 31, 201–206. [Google Scholar] [CrossRef]
- Xue, Y.F.; Cai, H.N.; Wang, L.; Wang, F.C.; Zhang, H.F. Strength-improved Zr-based metallic glass/porous tungsten phase composite by hydrostatic extrusion. Appl. Phys. Lett. 2007, 90, 081901. [Google Scholar] [CrossRef]
- Kaszuwara, W.; Kulczyk, M.; Leonowicz, M.K.; Gizynski, T.; Michalski, B. Densification of Nd-Fe-B powders by hydrostatic extrusion. IEEE Trans. Magn. 2014, 50, 1–5. [Google Scholar] [CrossRef]
- Kováč, P.; Hušek, I.; Melišek, T.; Kopera, L.; Kováč, J. Critical currents, Ic-anisotropy and stress tolerance of MgB2 wires made by internal magnesium diffusion. Sci. Technol. 2014, 27, 88–93. [Google Scholar] [CrossRef]
- Skiba, J.; Pachla, W.; Mazur, A.; Przybysz, S.; Kulczyk, M.; Przybysz, M.; Wróblewska, M. Press for hydrostatic extrusion with back-pressure and the properties of thus extruded materials. J. Mater. Process. Technol. 2014, 214, 67–74. [Google Scholar] [CrossRef]
- Zhang, Z.H.; Wang, F.C.; Sun, M.Y.; Yang, R.; Li, S.K. Finite element analysis and experimental investigation of the hydrostatic extrusion process of deforming two-layer Cu/Al composite. J. Beijing Inst. Technol. 2013, 22, 544–549. (In Chinese) [Google Scholar]
- Li, D.R.; Liu, Z.Y.; Yu, Y.; Wang, E.D. Numerical simulation of hot hydrostatic extrusion of W-40 wt. % Cu. Mater. Sci. Eng. A 2009, 499, 118–122. [Google Scholar] [CrossRef]
- Manafi, B.; Saeidi, M. Deformation behavior of 93 Tungsten alloy under hydrostatic extrusion. Elixir Mech. Eng. 2014, 76, 28487–28492. [Google Scholar]
- Peng, X.; Sumption, M.D.; Collings, E.W. Finite element modeling of hydrostatic extrusion for mono-core superconductor billets. IEEE Trans. Appl. Supercond. 2003, 13, 3434–3437. [Google Scholar] [CrossRef]
- Manafi, B.; Shatermashhadi, V.; Abrinia, K.; Faraji, G.; Sanei, M. Development of a novel bulk plastic deformation method: Hydrostatic backward extrusion. Int. J. Adv. Manuf. Technol. 2016, 82, 1823–1830. [Google Scholar] [CrossRef]
- Kopp, R.; Barton, G. Finite element modeling of hydrostatic extrusion of magnesium. J. Technol. Plast Technol. 2003, 28, 1–12. [Google Scholar]
- Barton, G. Finite-Elemente Modellierung des Hydrostatischen Strangpressens von Magnesiumlegierungen. Ph.D. Thesis, Rheinisch-Westfaelische Technische Hochschule Aachen, Aachen, Germany, January 2009. Available online: http://publications.rwth-aachen.de/record/51193/files/Barton_Gabriel.pdf (accessed on 1 March 2017). [Google Scholar]
- Kulczyk, M.; Przybysz, S.; Skiba, J.; Pachla, W. Severe plastic deformation induced in Al, Al-Si, Ag and Cu by hydrostatic extrusion. Arch. Metall. Mater. 2014, 59, 59–64. [Google Scholar] [CrossRef]


| Material | Density | Poisson Ratio | Elastic Modulus | Yield Stress |
|---|---|---|---|---|
| AA2024 | 2.79 g/cm3 | 0.3 | 71.7 GPa | 340 MPa |
| Load Mode | Extrusion Ratio | Die Angle (2α) | Initial Height | Initial Diameter |
|---|---|---|---|---|
| Pressure load | 2.25, 2.78, 4.00, 6.25 | 25°, 30°, 35°, 40°, 60°, 90°, 120° | 80 mm | 30 mm |
| Displacement load |
© 2017 by the authors. Licensee MDPI, Basel, Switzerland. This article is an open access article distributed under the terms and conditions of the Creative Commons Attribution (CC BY) license ( http://creativecommons.org/licenses/by/4.0/).
Share and Cite
Du, S.; Zan, X.; Li, P.; Luo, L.; Zhu, X.; Wu, Y. Comparison of Hydrostatic Extrusion between Pressure-Load and Displacement-Load Models. Metals 2017, 7, 78. https://doi.org/10.3390/met7030078
Du S, Zan X, Li P, Luo L, Zhu X, Wu Y. Comparison of Hydrostatic Extrusion between Pressure-Load and Displacement-Load Models. Metals. 2017; 7(3):78. https://doi.org/10.3390/met7030078
Chicago/Turabian StyleDu, Shengqiang, Xiang Zan, Ping Li, Laima Luo, Xiaoyong Zhu, and Yucheng Wu. 2017. "Comparison of Hydrostatic Extrusion between Pressure-Load and Displacement-Load Models" Metals 7, no. 3: 78. https://doi.org/10.3390/met7030078