Article

Experimental and Numerical Simulation Investigation on Laser Flexible Shock Micro-Bulging

1
School of Mechanical Engineering, Jiangsu University, Zhenjiang 212013, China
2
Department of Mechanical Engineering, Northern Illinois University, DeKalb, IL 60115, USA
*
Author to whom correspondence should be addressed.
Metals 2017, 7(3), 93; https://doi.org/10.3390/met7030093
Submission received: 13 February 2017 / Revised: 6 March 2017 / Accepted: 10 March 2017 / Published: 12 March 2017

Abstract

:
Laser flexible shock micro-bulging (LFSB) is a novel micro fabrication technology, which combines laser dynamic forming and flexible die forming, which is a type of high strain rate micro-forming. The LFSB of 304 stainless steel foils was investigated in this paper. Experimental and simulated results indicated that the bulging depth and thickness thinning rate of bulging parts increased with an increase of laser energy and a decrease of workpiece thickness. Experimental results also showed the surface morphology of bulging parts. The hardness distribution in the cross section of bulging parts was revealed by nanoindentation experiments. The internal microstructure of micro bulging parts was observed by TEM. In addition, the equivalent stress and plastic strain distribution of bulging parts were shown in the numerical simulation under different workpiece thicknesses and laser energies.

1. Introduction

With the trend of miniaturization and integration becoming increasingly prominent, the application of parts with micro features is becoming more widespread. At the same time, this has greatly promoted the development of micro fabrication technologies [1]. Among them, the micro forming of foils is becoming a focus of current research [2].
The micro forming of foils includes micro bending, micro drawing, micro bulging, etc. Gau et al. [3] carried out the three points bending experiment to study the springback behavior of brass in the micro bending process. The experimental results showed that when the workpiece thickness was less than 350 µm, there was a certain function relation between the springback and the ratio of workpiece thickness to average grain size. Fu et al. [4] manufactured micro drawing cups by the blanking and drawing compound process, and discussed the influence of grain size and feature size on the deformation behavior of material. Recently, flexible die forming has become prevalent. Peng et al. [5] investigated the effect of the soft punch hardness and lubrication on micro bending forming properties through experimental and numerical simulation methods. Irthiea and Green [6] conducted an experimental investigation of micro-deep drawing processes of stainless steel 304 foils by utilizing soft dies based on scaling factors. Wang et al. [7] investigated material deformation behaviors through numerical simulation during the flexible micro-bending process.
At present, due to the many advantages of laser processing, such as no limits on the material usage, high precision, and no pollution, many scholars have conducted extensive studies on the applications of lasers. Gao [8] explored the effects of laser shot peening on the fatigue performance of materials. The results indicated that laser shot peening can induce deeper compressive residual stress fields and improve fatigue strength more effectively compared with the conventional surface enhancement techniques, such as shot peening, roller burnishing, and ball burnishing [9]. Avilés et al. [10] investigated the influence of laser polishing on the high cycle fatigue strength of AISI 1045 steel in a N2 atmosphere and drew the conclusion that laser polishing in N2 produced better surface features and fatigue-behavior. Martínez et al. [11] found that two different process regimes depended on the scanning speed and feed rate values in the scanner-based laser hardening process. Numerical simulation has been the key to discovering the feasibility of different laser techniques. Tabernero et al. [12] presented the complete development of a powder flux numerical model for an industrial laser cladding coaxial nozzle. The pulsed laser was applied to the micro forming of metal foils based on the advantages of laser shot peening. Niehoff et al. [13] first realized the laser micro deep drawing process. The results showed that the failure mode was similar to that of mechanical micro deep drawing. Zhou et al. [14] investigated the direct forming of three-dimensional metallic structures at the micro scale by combining laser thermodynamic irradiation and the laser driving-flyer process. Ocaña et al. [15] discussed the feasibility of laser shock microforming on metal sheets. Gao and Cheng [16] used different types of micro molds to fabricate arrays of square micro grids, micro channels, and micro domes in laser dynamic forming, and investigated the effect of mold size and workpiece thickness on the deformation behavior. Zheng et al. [17] studied the laser direct shock micro bulging process of pure copper through numerical simulation and experimental methods. Wang et al. [18] used a flexible rubber material as the soft punch to fabricate micro-parts during micro scale laser shock forming. Nagaraja et al. [19] reported the fabrication of micro-features on metallic foils using laser-induced shock forming without the assistance of micromold patterns and discussed the influence of laser energy on the cater profile. Zhang et al. [20] carried out a mold-free laser shock micro-forming process by using plasticine as the flexible support. Generally, the round laser spot should be more suitable for micro bulging processes, and the feasibility of laser shock micro bulging was verified [17]. However, the investigation on combining laser shock and flexible die micro bulging has not been reported.
In this paper, the laser flexible shock micro-bulging (LFSB) LFSB process of foils was established by combining laser dynamic forming and flexible die forming. The influence of workpiece thickness and laser energy on the deformation behavior of the LFSB was investigated by experiment and numerical simulation methods. The experiment employed two cold rolled 304 stainless steel foils with different thicknesses and two laser energies. The surface morphology of micro bulging parts was observed by an S-3400N scanning electron microscope (SEM). The effect of thickness and laser energy on the depth and thickness thinning rate of the micro bulging parts was studied in the LFSB. In addition, numerical simulation studies revealed the equivalent stress and plastic strain distribution of the bulging parts. The hardness distribution in the cross section of the bulging parts was revealed by the nanoindentation experiment. The internal microstructure of the micro bulging parts was observed by transmission electron microscopy (TEM).

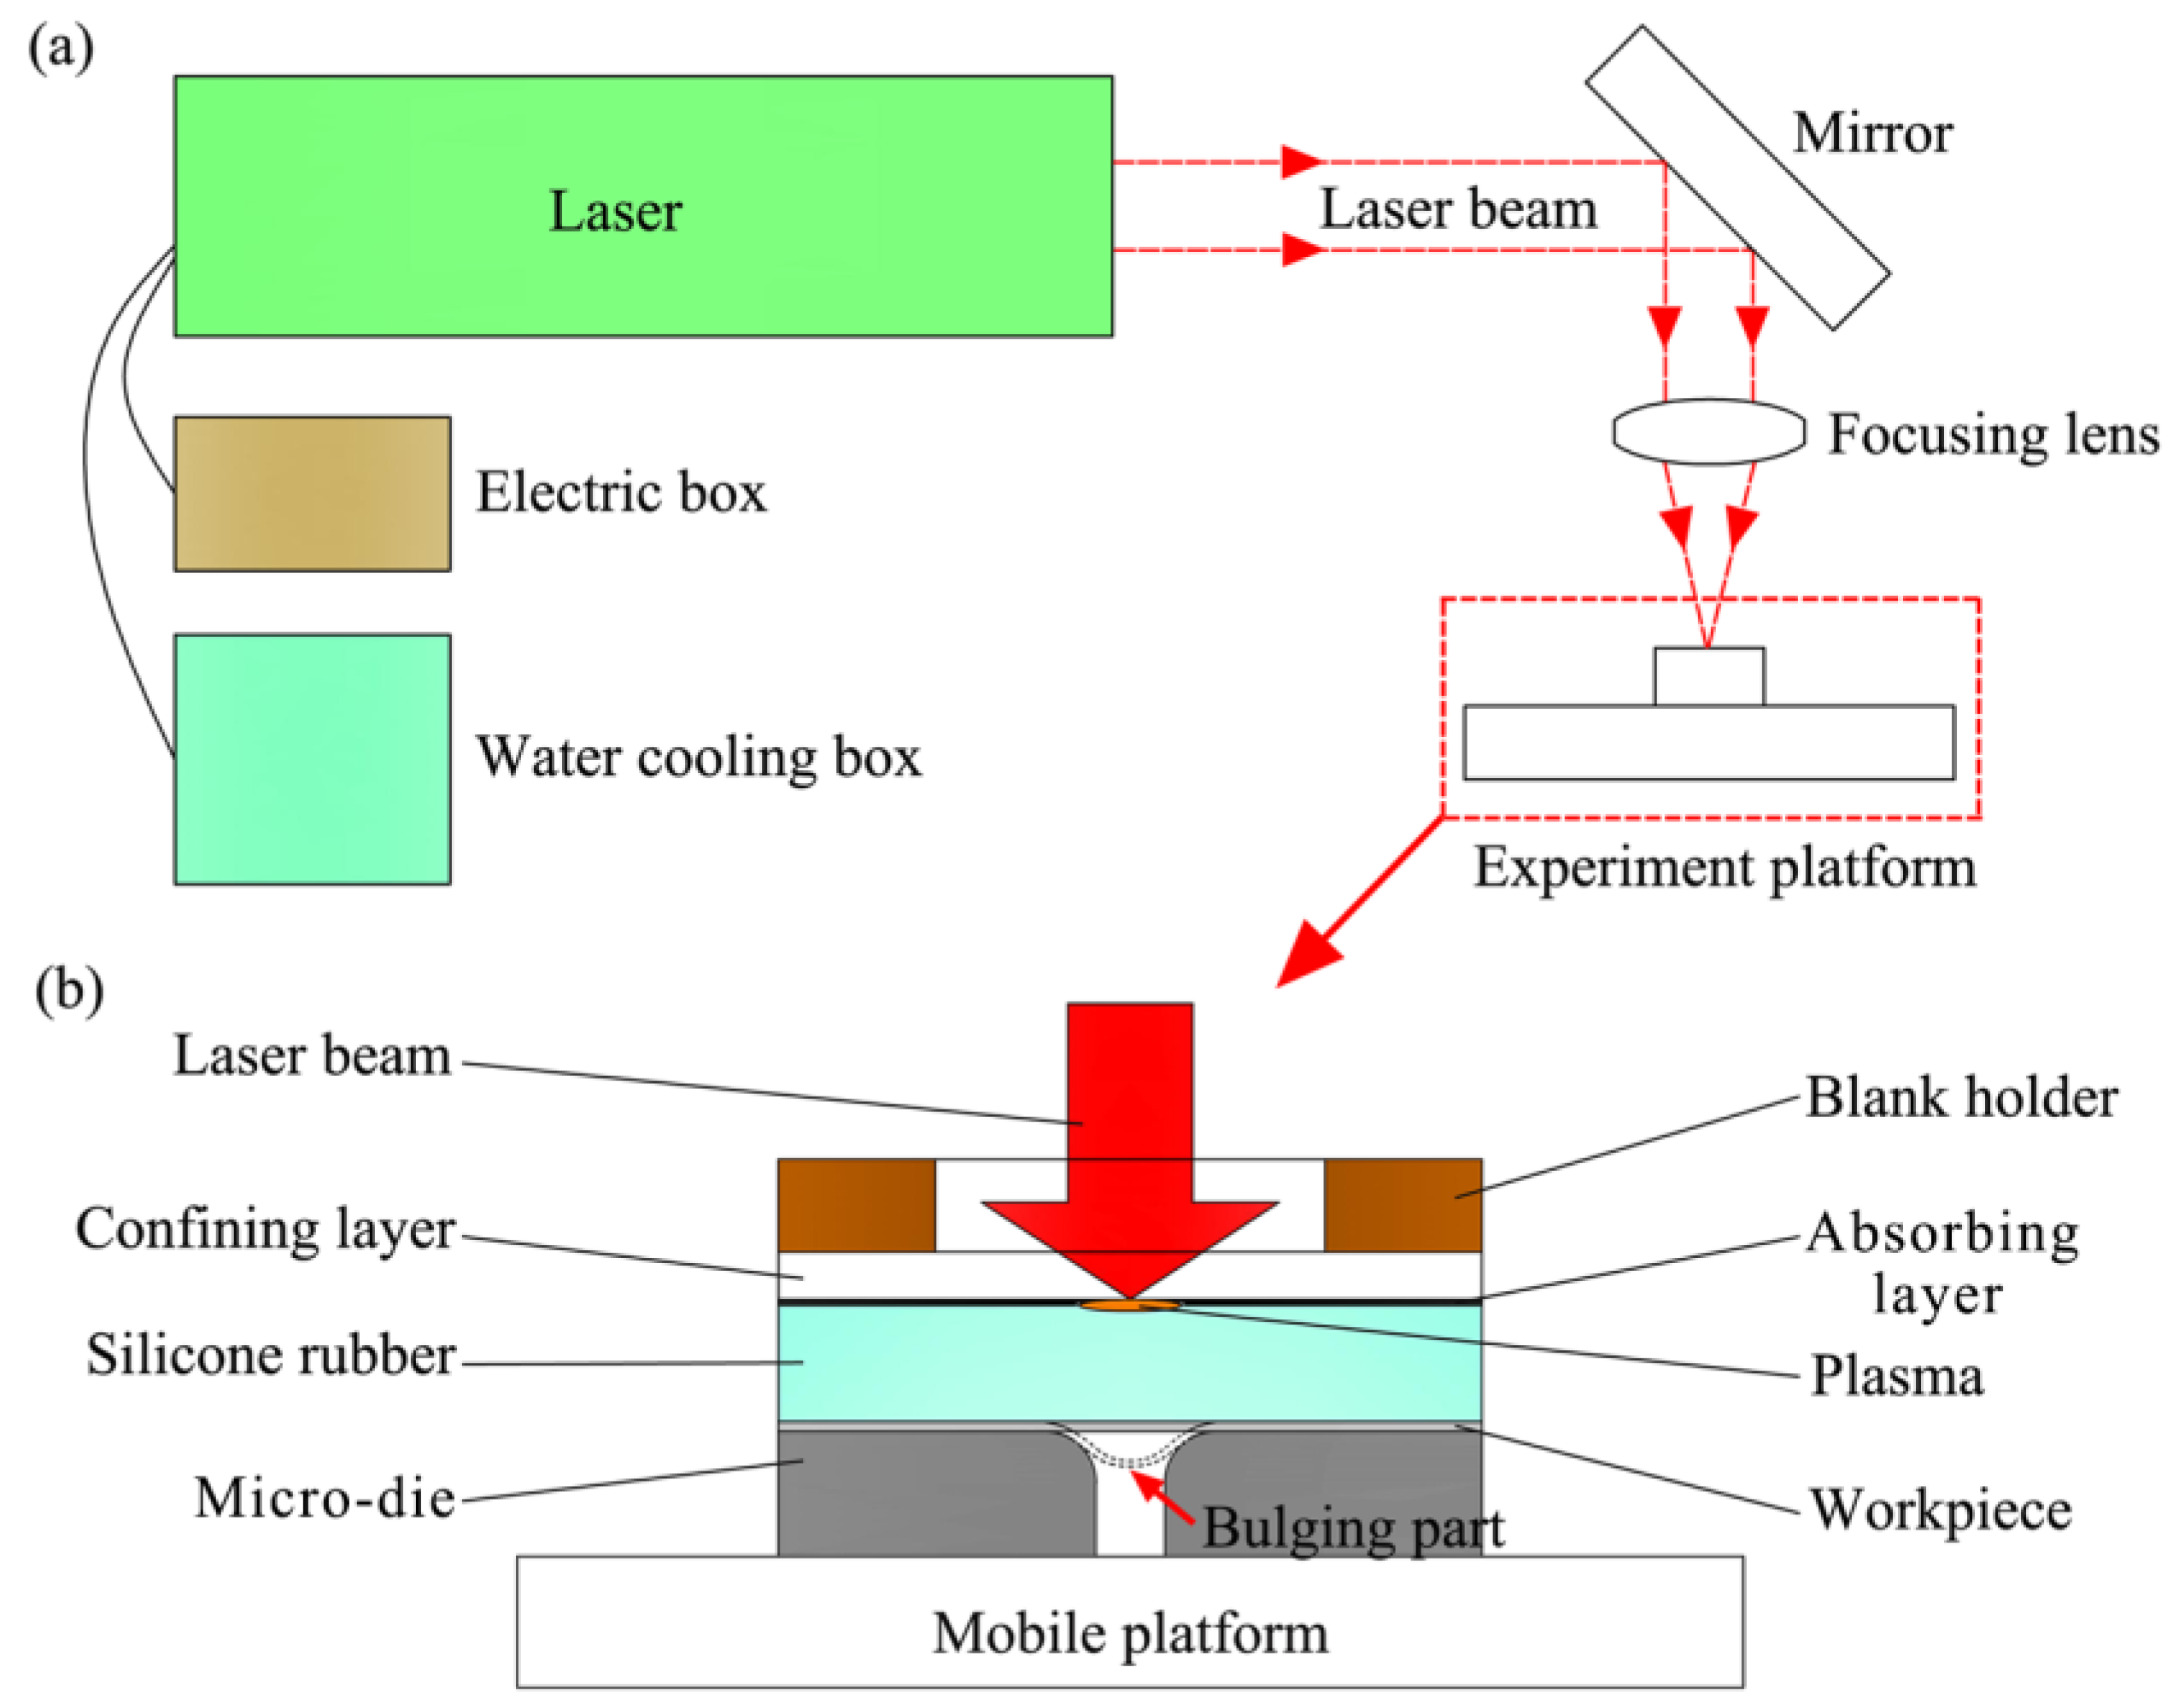
2. Mechanism of Laser Flexible Shock Micro-Bulging

A forming system of LFSB includes a laser, control system, water cooling system, and experiment platform, as shown in Figure 1 [21]. The experiment platform is installed on the mobile platform. The experiment platform from top to bottom is a blank holder, confining layer, absorbing layer, silicone rubber, workpiece, and micro-die. When the laser penetrates the confining layer and irradiates on the absorbing layer, laser energy is absorbed and vaporizes instantaneously into high temperature and high pressure plasma. The plasma continues to absorb laser energy, which generates a shock wave. When the shock wave acts on the silicone rubber, it propagates inside in the form of stress waves. This could generate a pressure enhancement effect due to the fact that the wave impedance of silicone rubber is less than the wave impedance of the workpiece, which is the principle of impedance matching failure [22]. Finally, the elastic deformation of the silicone rubber leads to the plastic deformation of the workpiece.

3. Experiment

3.1. Experimental Material
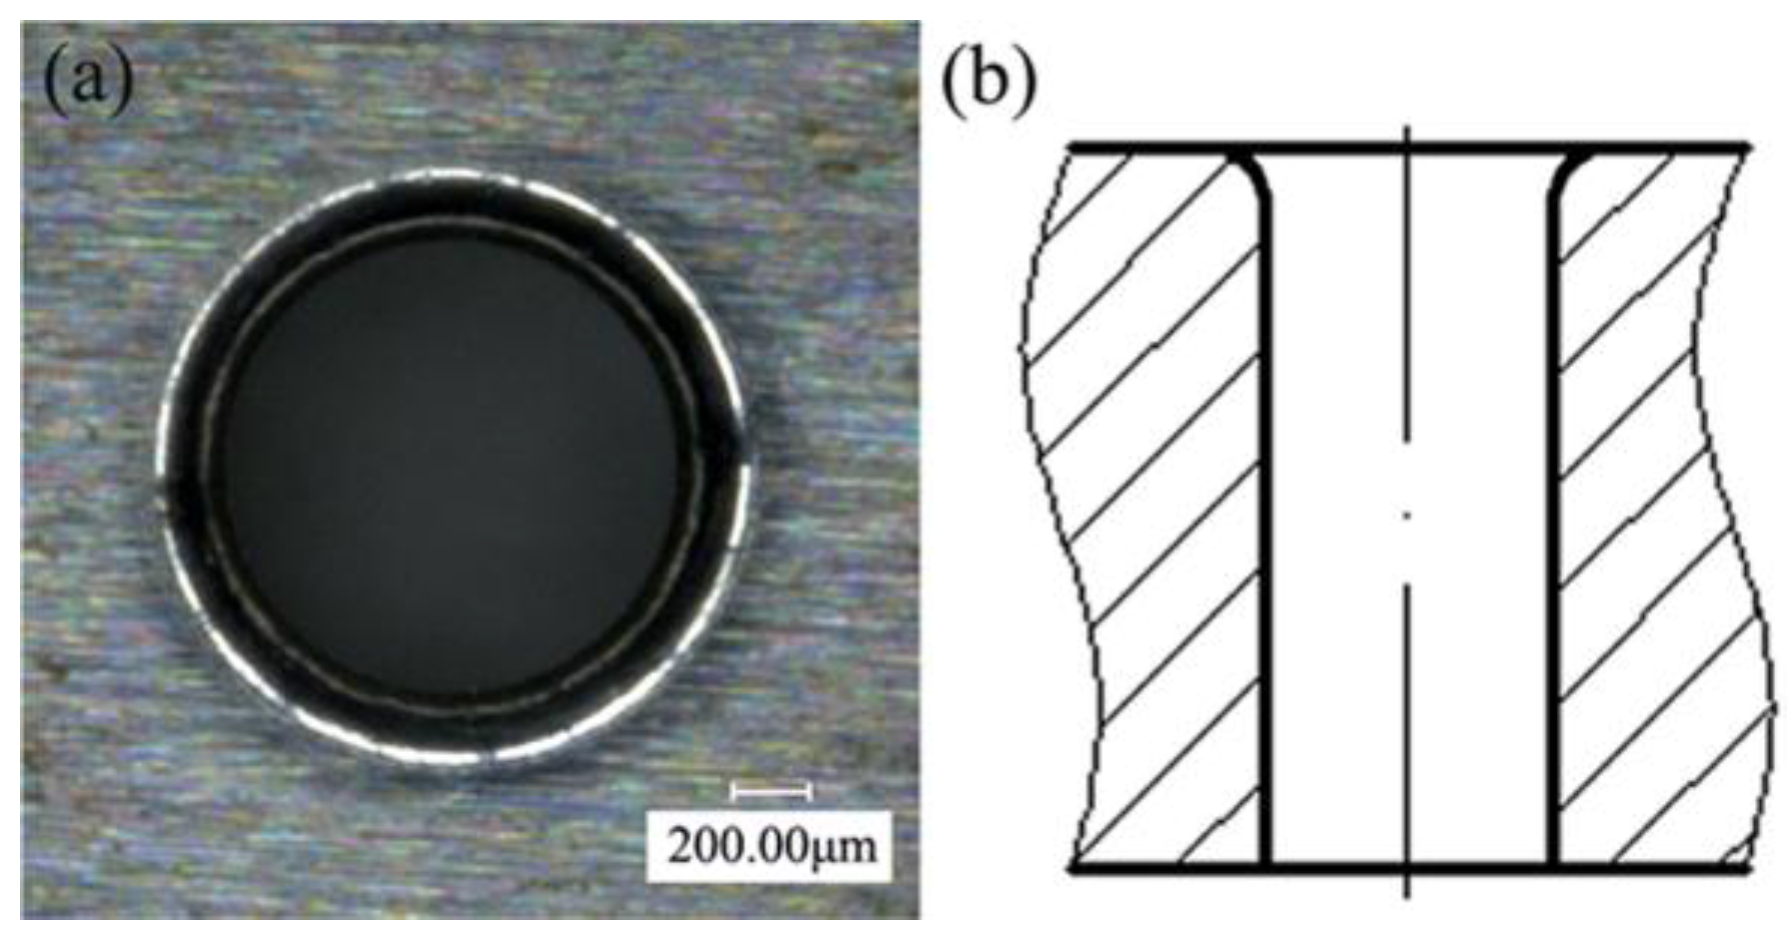
This paper employed cold rolled 304 stainless steel foils as the experimental material, and its thickness was 40 µm and 60 µm, respectively. Because 304 stainless steel foils have the characteristics of good processing performance and high toughness, it is widely used in micro-electro-mechanical systems (MEMS) and the medical industry. Firstly, 304 stainless steel foils were cut into 10 mm × 10 mm. Then, the stainless steel foil squares were cleaned of dirt with alcohol. Finally, the residual liquid was wiped off the surface of the stainless steel foil squares.

3.2. Micro-Die

In order to reduce the effect of air resistance on the LFSB, the micro-bulging die was designed by a through-hole, as shown in Figure 2. In addition, the micro-die surface should have a certain hardness in the LFSB. Thus, 1095 die steel was selected as the die material. The surface hardness of 1095 die steel can reach HRC60 (Rockwell hardness) after heat treatment. The micro-die was fabricated by the wire cutting technique and measured through digital microscopy (KEYENCE VHX-1000C, KEYENCE Corporation, Osaka, Japan). The design dimensions and actual dimensions of the micro-die are shown in Table 1. It can be seen from the table that the dimension error was very small, so the micro-die met the experimental requirements.

3.3. Experimental Parameters

The Spitlight 2000 Nd:YAG Laser (InnoLas Corporation, München, Germany) was adopted in the LFSB experiment. The energy distribution of the laser is a Gaussian distribution, and its technical parameters are shown in Table 2. Black paint was uniformly sprayed on the silicone rubber as the absorbing layer before the experiment. The thickness of the silicone rubber was 0.5 mm. The silicone rubber not only had the pressure enhancement effect, but also could isolate the heat of the laser on stainless steel foils and avoid the ablation phenomenon of the workpiece surface, protecting the surface quality of the bulging parts. A polymethyl methacrylate (PMMA) (PMMA) with a thickness of 3 mm was used as the confining layer. On the one hand, it reduced the loss of laser energy. On the other hand, it restricted the upward movement of plasma. The blank holder force was 12 N, and it not only prevented the leakage of plasma, but also inhibited the radial flow of material.
For the laser energy, this paper employed 565 mJ and 835 mJ. In addition, the spot diameter was determined as 2 mm in order to cover the micro-die cavity as well as simplify the operation of alignment between the spot and micro-die cavity. Because the energy output of the laser is in the form of Joules, in order to simulate the LFSB, it is necessary to obtain the history curve of pressure P and time t. Due to the fact that the energy distribution of the laser beam has a Gaussian distribution, the laser power density I0 is calculated according to the following formula [23]
I 0 = 4 E π d 2 τ
where E is laser energy, d is spot diameter, and τ is pulse width. The widely used Fabbro model [24] is adopted to calculate the peak pressure Pmax of the shock wave induced by the laser under the constraint condition.
P max ( GPa ) = 0.01 × ( α 2 α + 3 ) 1 / 2 × Z 1 / 2 ( g / c m 2 s ) × I 0 1 / 2 ( GW / c m 2 )
where Pmax is the peak pressure of the shock wave induced by the laser, α is the fraction of absorbed energy (generally equal to 0.1), I0 is the laser power density, and Z is the shock impedance and can be calculated by
2 Z = 1 Z 1 + 1 Z 2
where Z1 is the wave impedance of PMMA, Z2 is the wave impedance of silicone rubber, Z1 = 0.32 × 10⁶ g/cm2s, and Z2 = 0.47 × 10⁶ g/cm2s [25]. Therefore, the peak pressure of the shock wave corresponding to 565 mJ and 835 mJ can be calculated according to the Equations (1) to (3), and were 1.6 GPa and 2.0 GPa, respectively. The detailed LFSB experimental parameters are listed in Table 3.

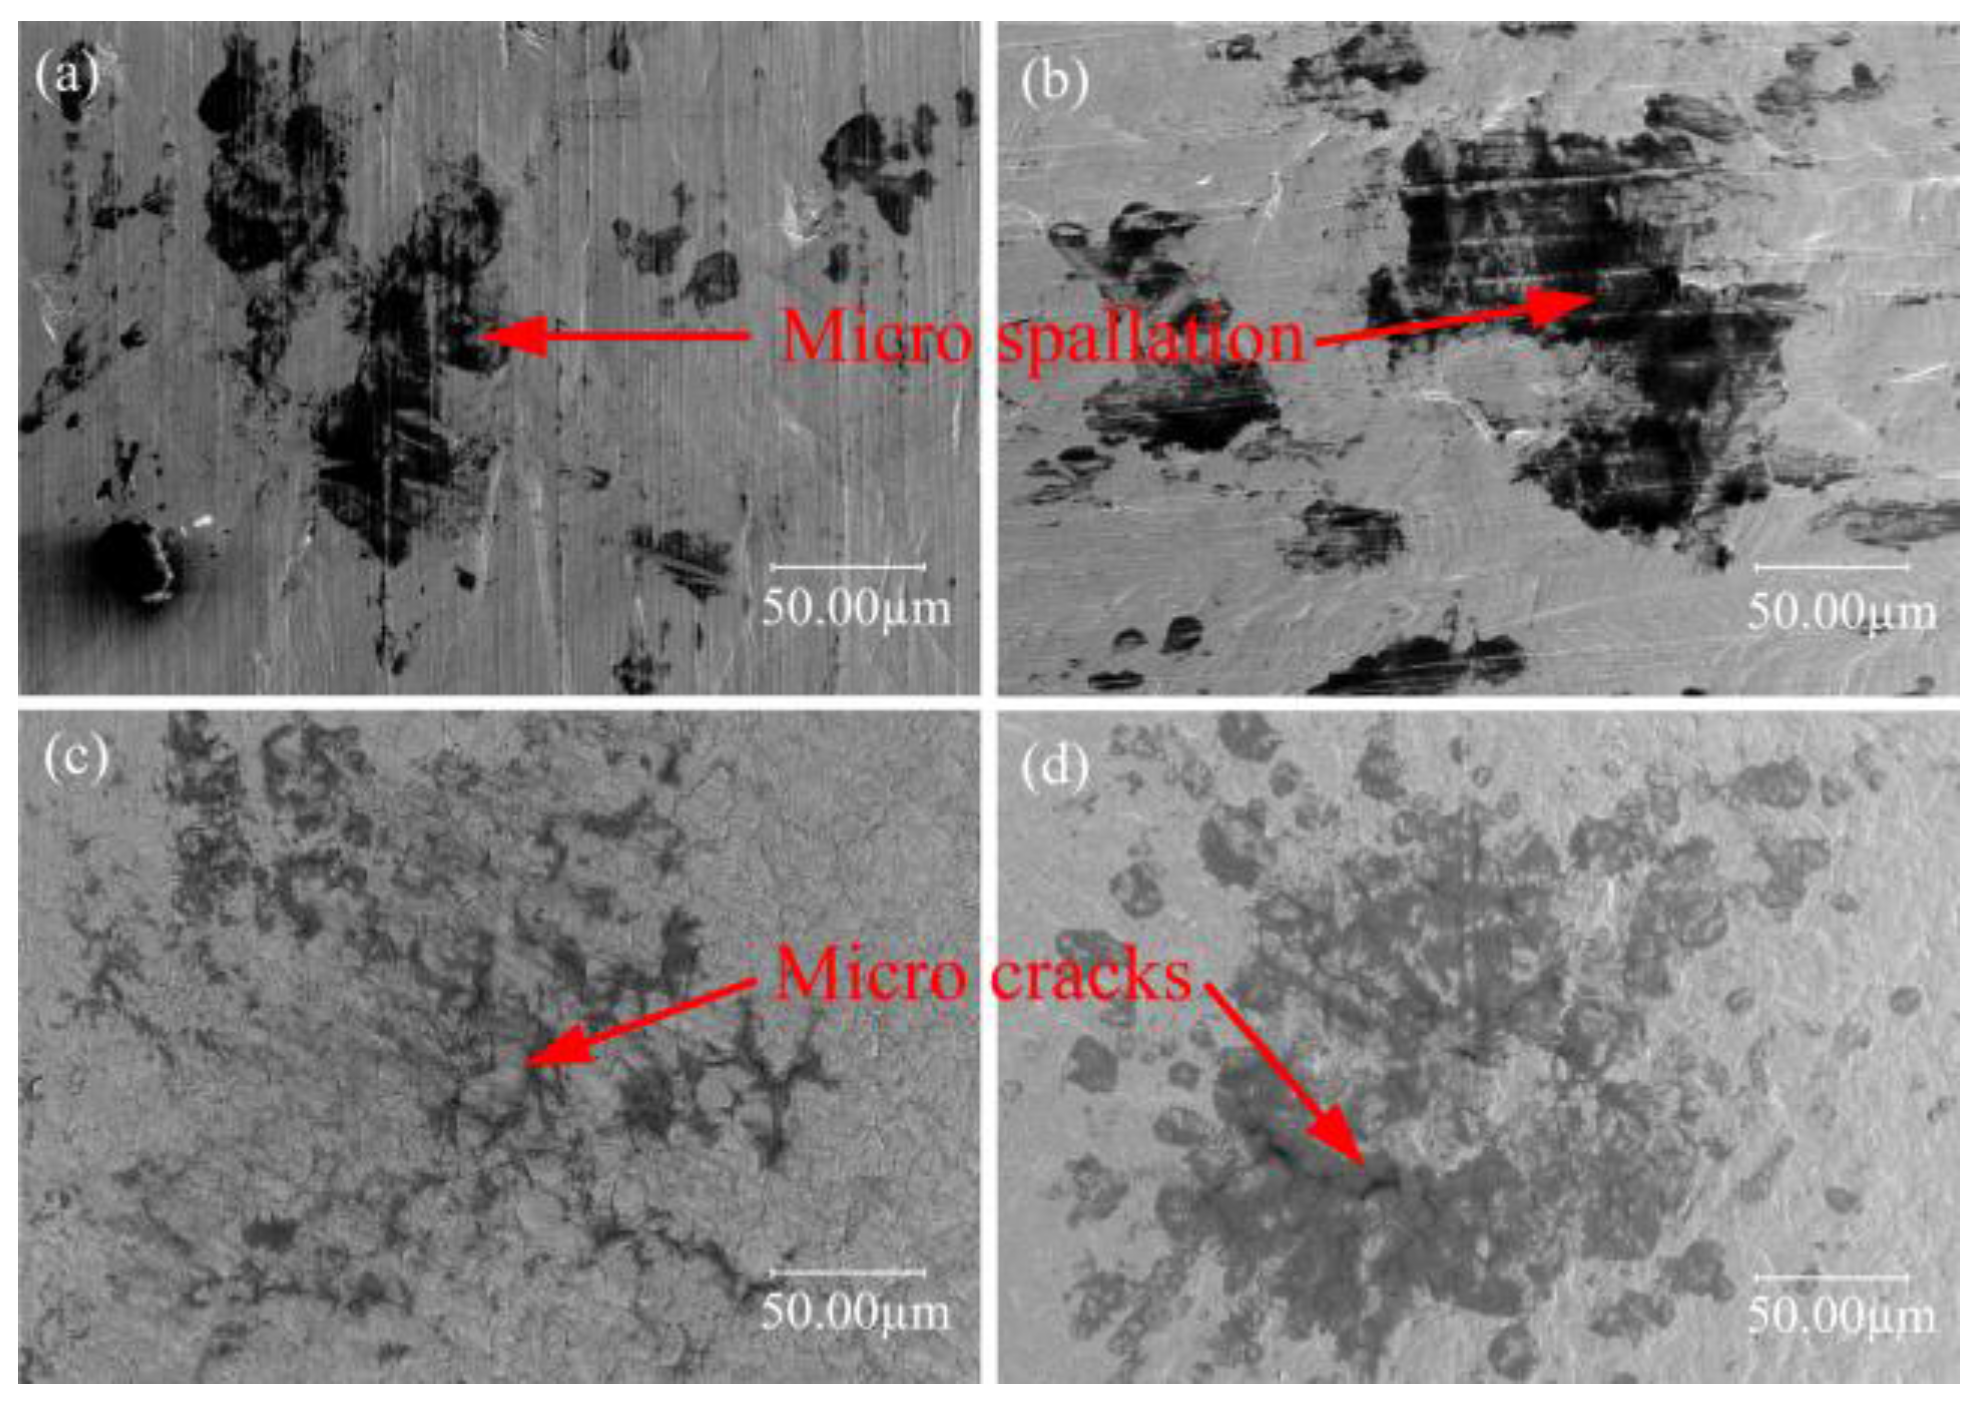
3.4. TEM Methodology

A JEM-2010 TEM (JEOL Corporation, Tokyo, Japan) was adapted to observe the material microstructures after laser flexible shock. It was necessary to prepare samples before observation. Firstly, micro bulging parts were cut into 3 mm diameter circles with a hole-punching machine. Then, electrolytic polishing was employed to thin the samples. The polishing solution was a mixed solution of 5 g HCl4O and 95 g C2H6O. Finally, we observed whether the sample was perforated in the electrolytic polishing process. The sample was extracted when it was perforated. The sample was observed through TEM after drying.

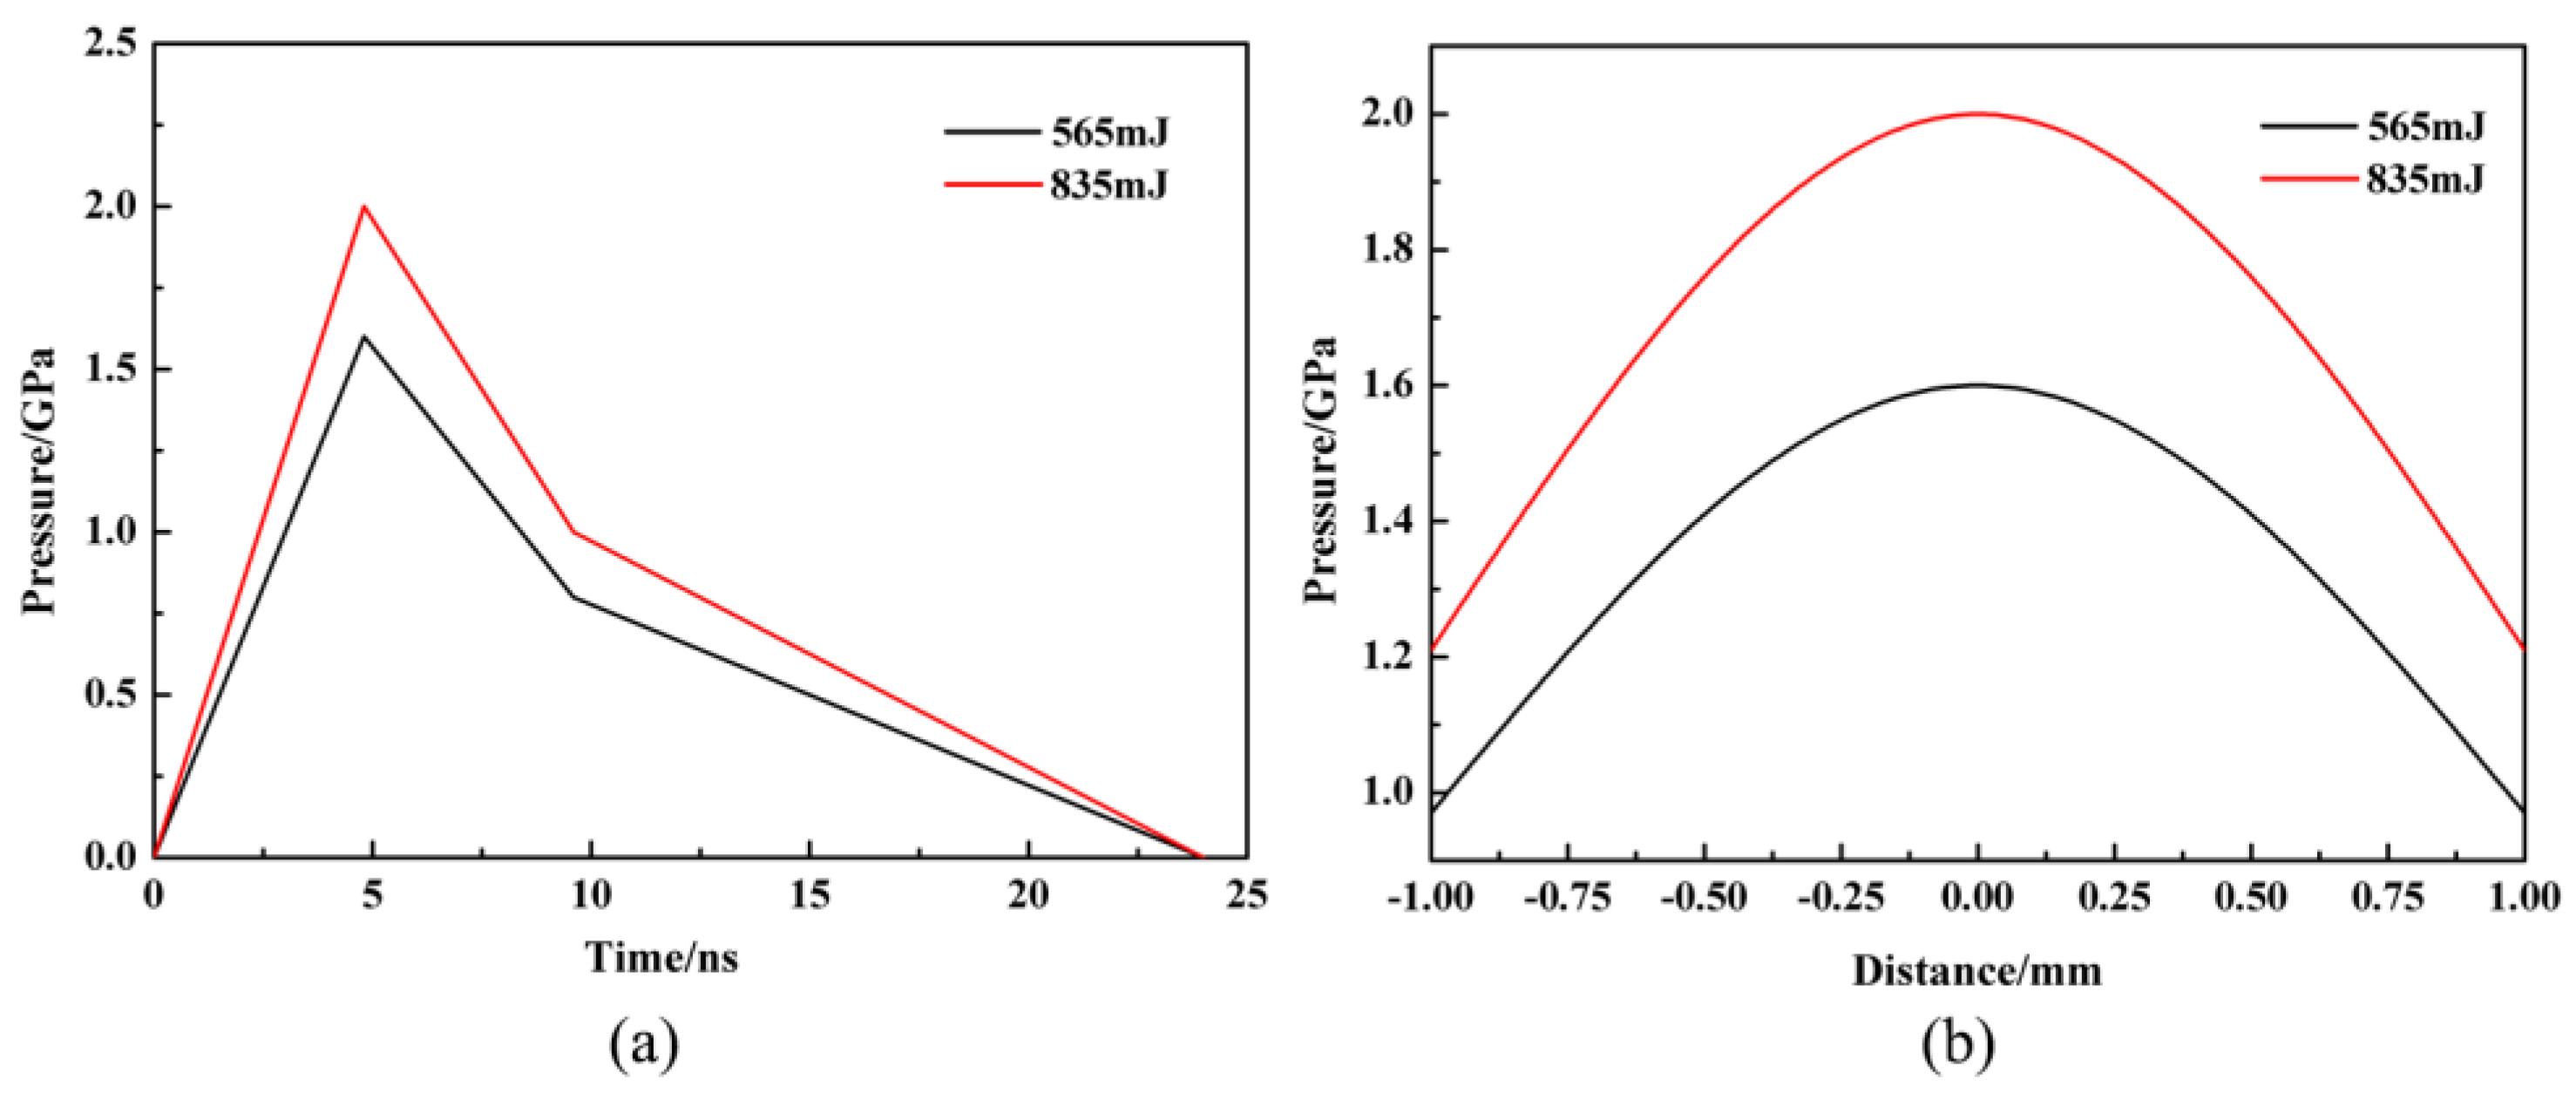
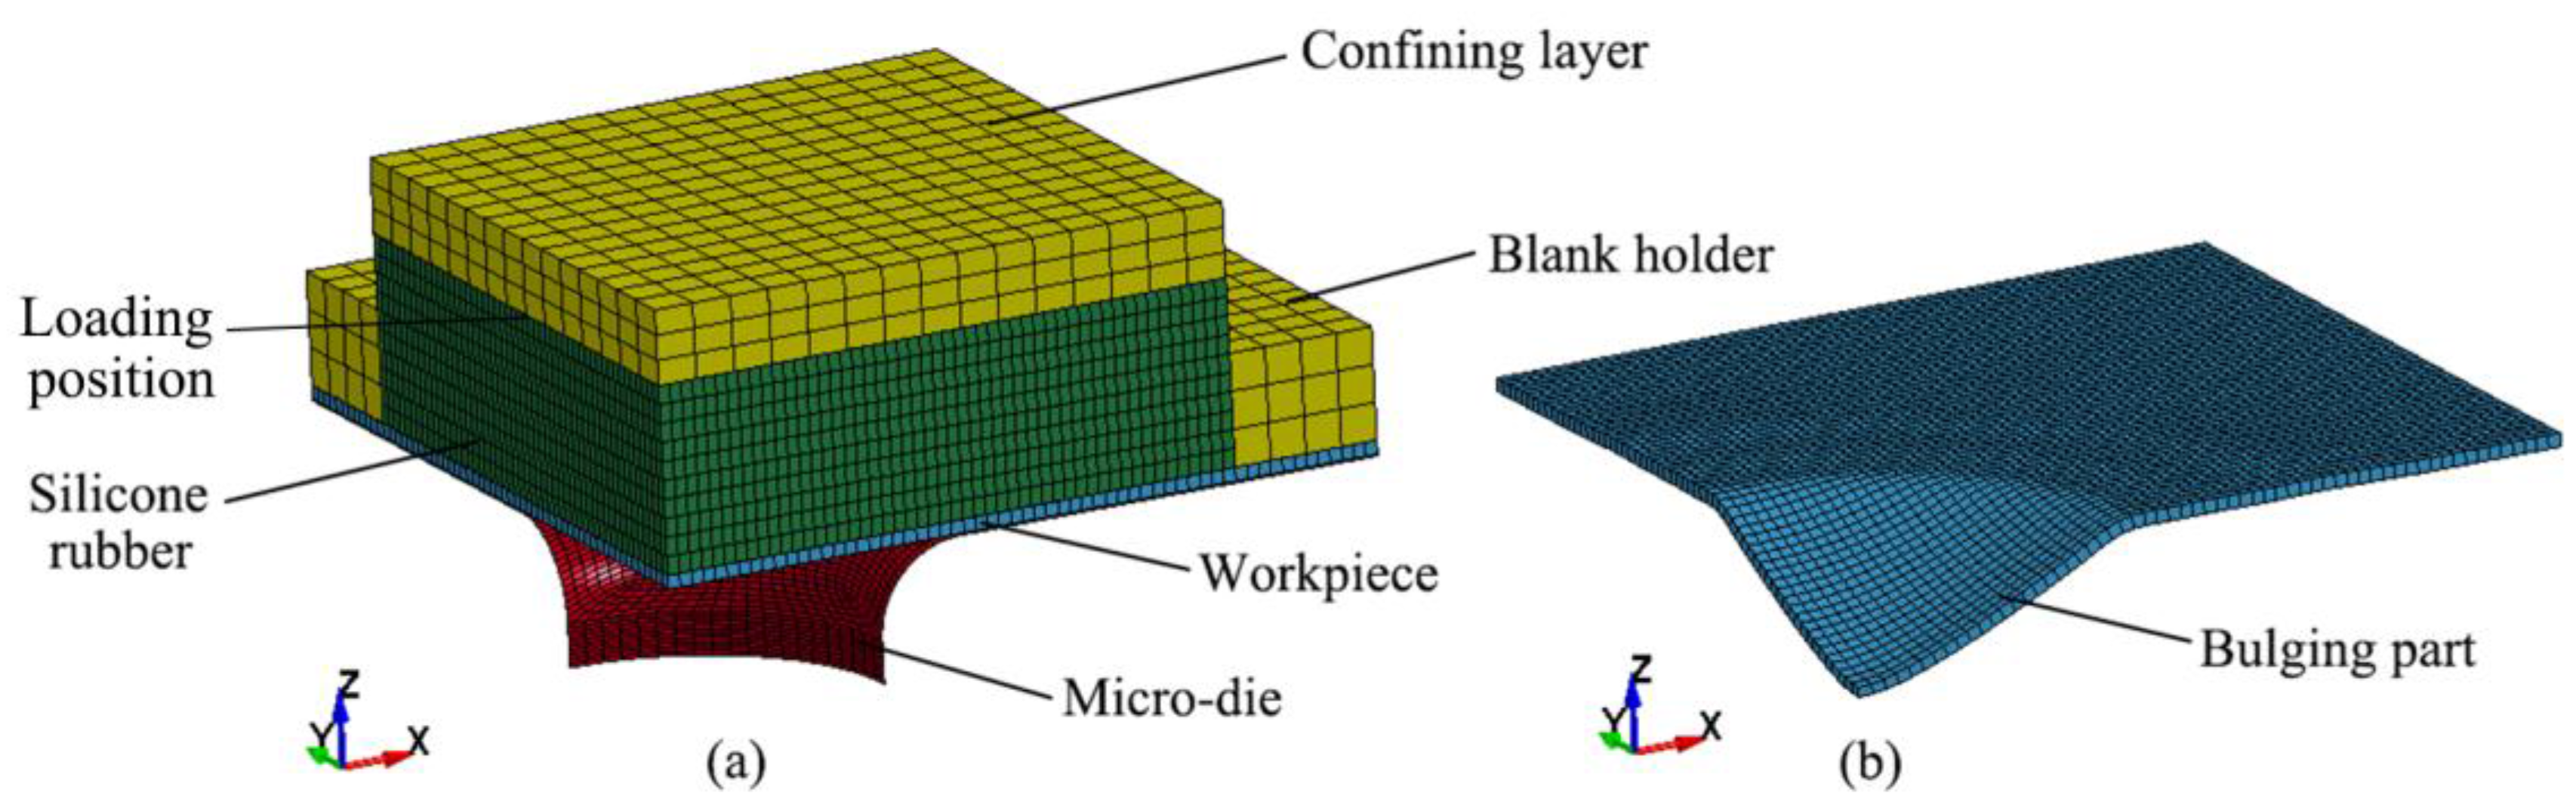
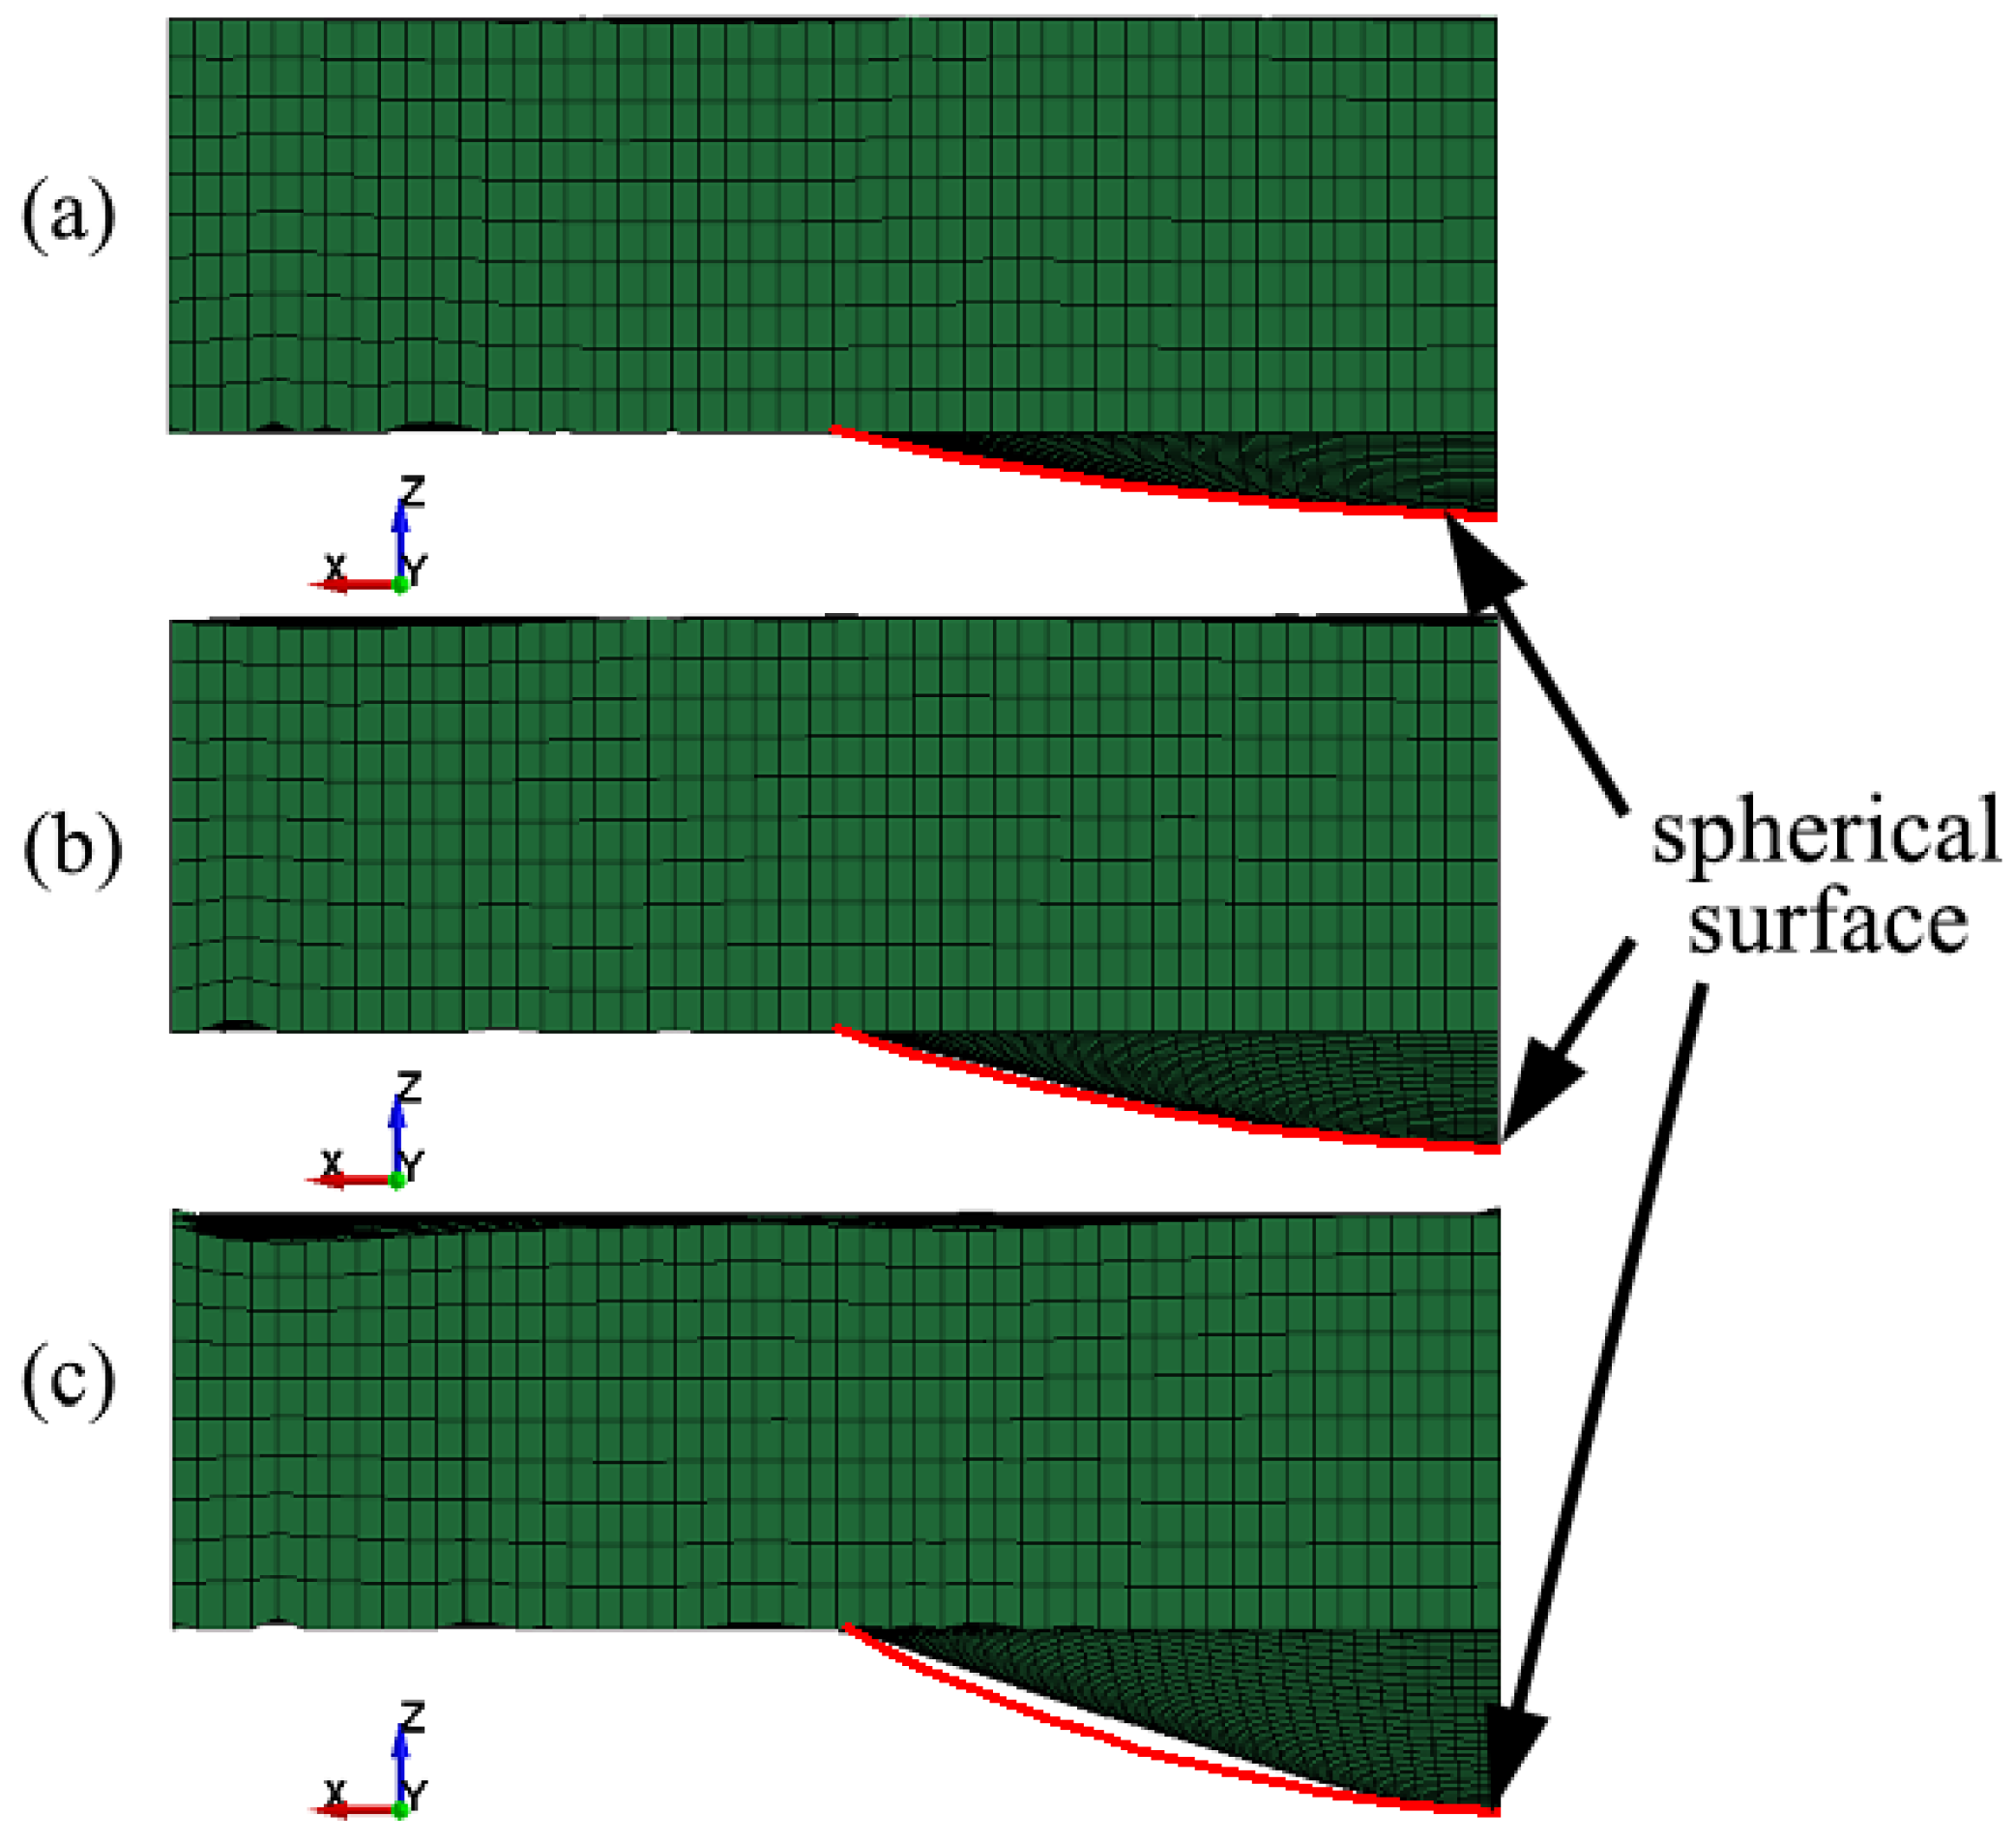
4. Numerical Simulation

In this paper, the nonlinear dynamic analysis software LS-DYNA (ANSYS Corporation, Cecil, PA, USA) with large deformation and high speed collision was employed for simulations, owing to the fact that the LFSB belongs to high strain rate deformation. In the numerical simulation process, the element type of the 304 stainless steel foil and micro-die was defined as the SHELL 163 shell element. The algorithm of the shell element was set to the Belytschko-Wong-Chiang and the shell element thickness of stainless steel foils was 40 µm and 60 µm. In addition, 80-µm-thick 304 stainless steel foil was added in the simulation. The contact between the micro-die and workpiece was defined as an automatic surface to surface. The element type of the silicone rubber, confining layer, and blank holder was defined as the SOLID 164 solid element.
The micro-die, confining layer, and blank holder were all set as the rigid body model. The 304 stainless steel foil used the Johnson-Cook model [26], because the Johnson-Cook model has been widely used to describe the dynamic response behavior of the material under large deformation and high strain rate. The silicone rubber isolated the heat of the laser on stainless steel foils during the LFSB, so there was no obvious change of temperature in the deformation of 304 stainless steel foils. Thus, the simplified Johnson-Cook model is shown as follows:
σ = ( A + B ε n ) ( 1 + C ln ε 1 ε 0 )
where σ is equivalent yield strength, ε is equivalent plastic strain, ε1 is equivalent plastic strain rate, ε0 is reference strain rate, and A, B, C, and n are workpiece parameters. The specific parameters of the 304 stainless steel foils in the Johnson-Cook model are shown in Table 4 [26].
The silicone rubber could generate large deformation and be incompressible in the LFSB, so the silicone rubber material was defined by the Mooney-Rivlin model [27]:
W = k + m = 1 n C k m ( I 1 3 ) k + ( I 2 3 ) m + 1 2 k 0 ( I 3 1 ) 2
σ i j = W ε i j
where W is the strain energy per unit of reference volume, I1I3 are the strain invariants, and k0 is the bulk modulus. Because the silicone rubber is incompressible, the value of I3 is 1. Ckm is the material super elastic strain constant. Commonly, the C10 and C01 are used to control the strain response of the hyperelastic body silicone rubber. The mechanical properties of the silicone rubber material are shown in Table 5 [27].
In Section 3.3, the peak pressure of the shock wave corresponding to 565 mJ and 835 mJ was calculated as 1.6 Gpa and 2.0 GPa, respectively. The action time of the shock wave pressure was about 2–3 times the laser pulse width under the constraint condition [28]. According to the Fabbro model simplified by Zhou [29], the temporal distribution and the spatial distribution of the shock wave pressure are shown in Figure 3. The shock wave pressure was applied on the upper surface of the silicone rubber. The loading area was the area of laser beam irradiation (d = 2 mm).
This paper used the actual dimensions of the micro-die for modeling in order to compare with the experimental study. The 1/4 finite element model of the LFSB and micro bulging part are shown in Figure 4.

5. Results and Discussions

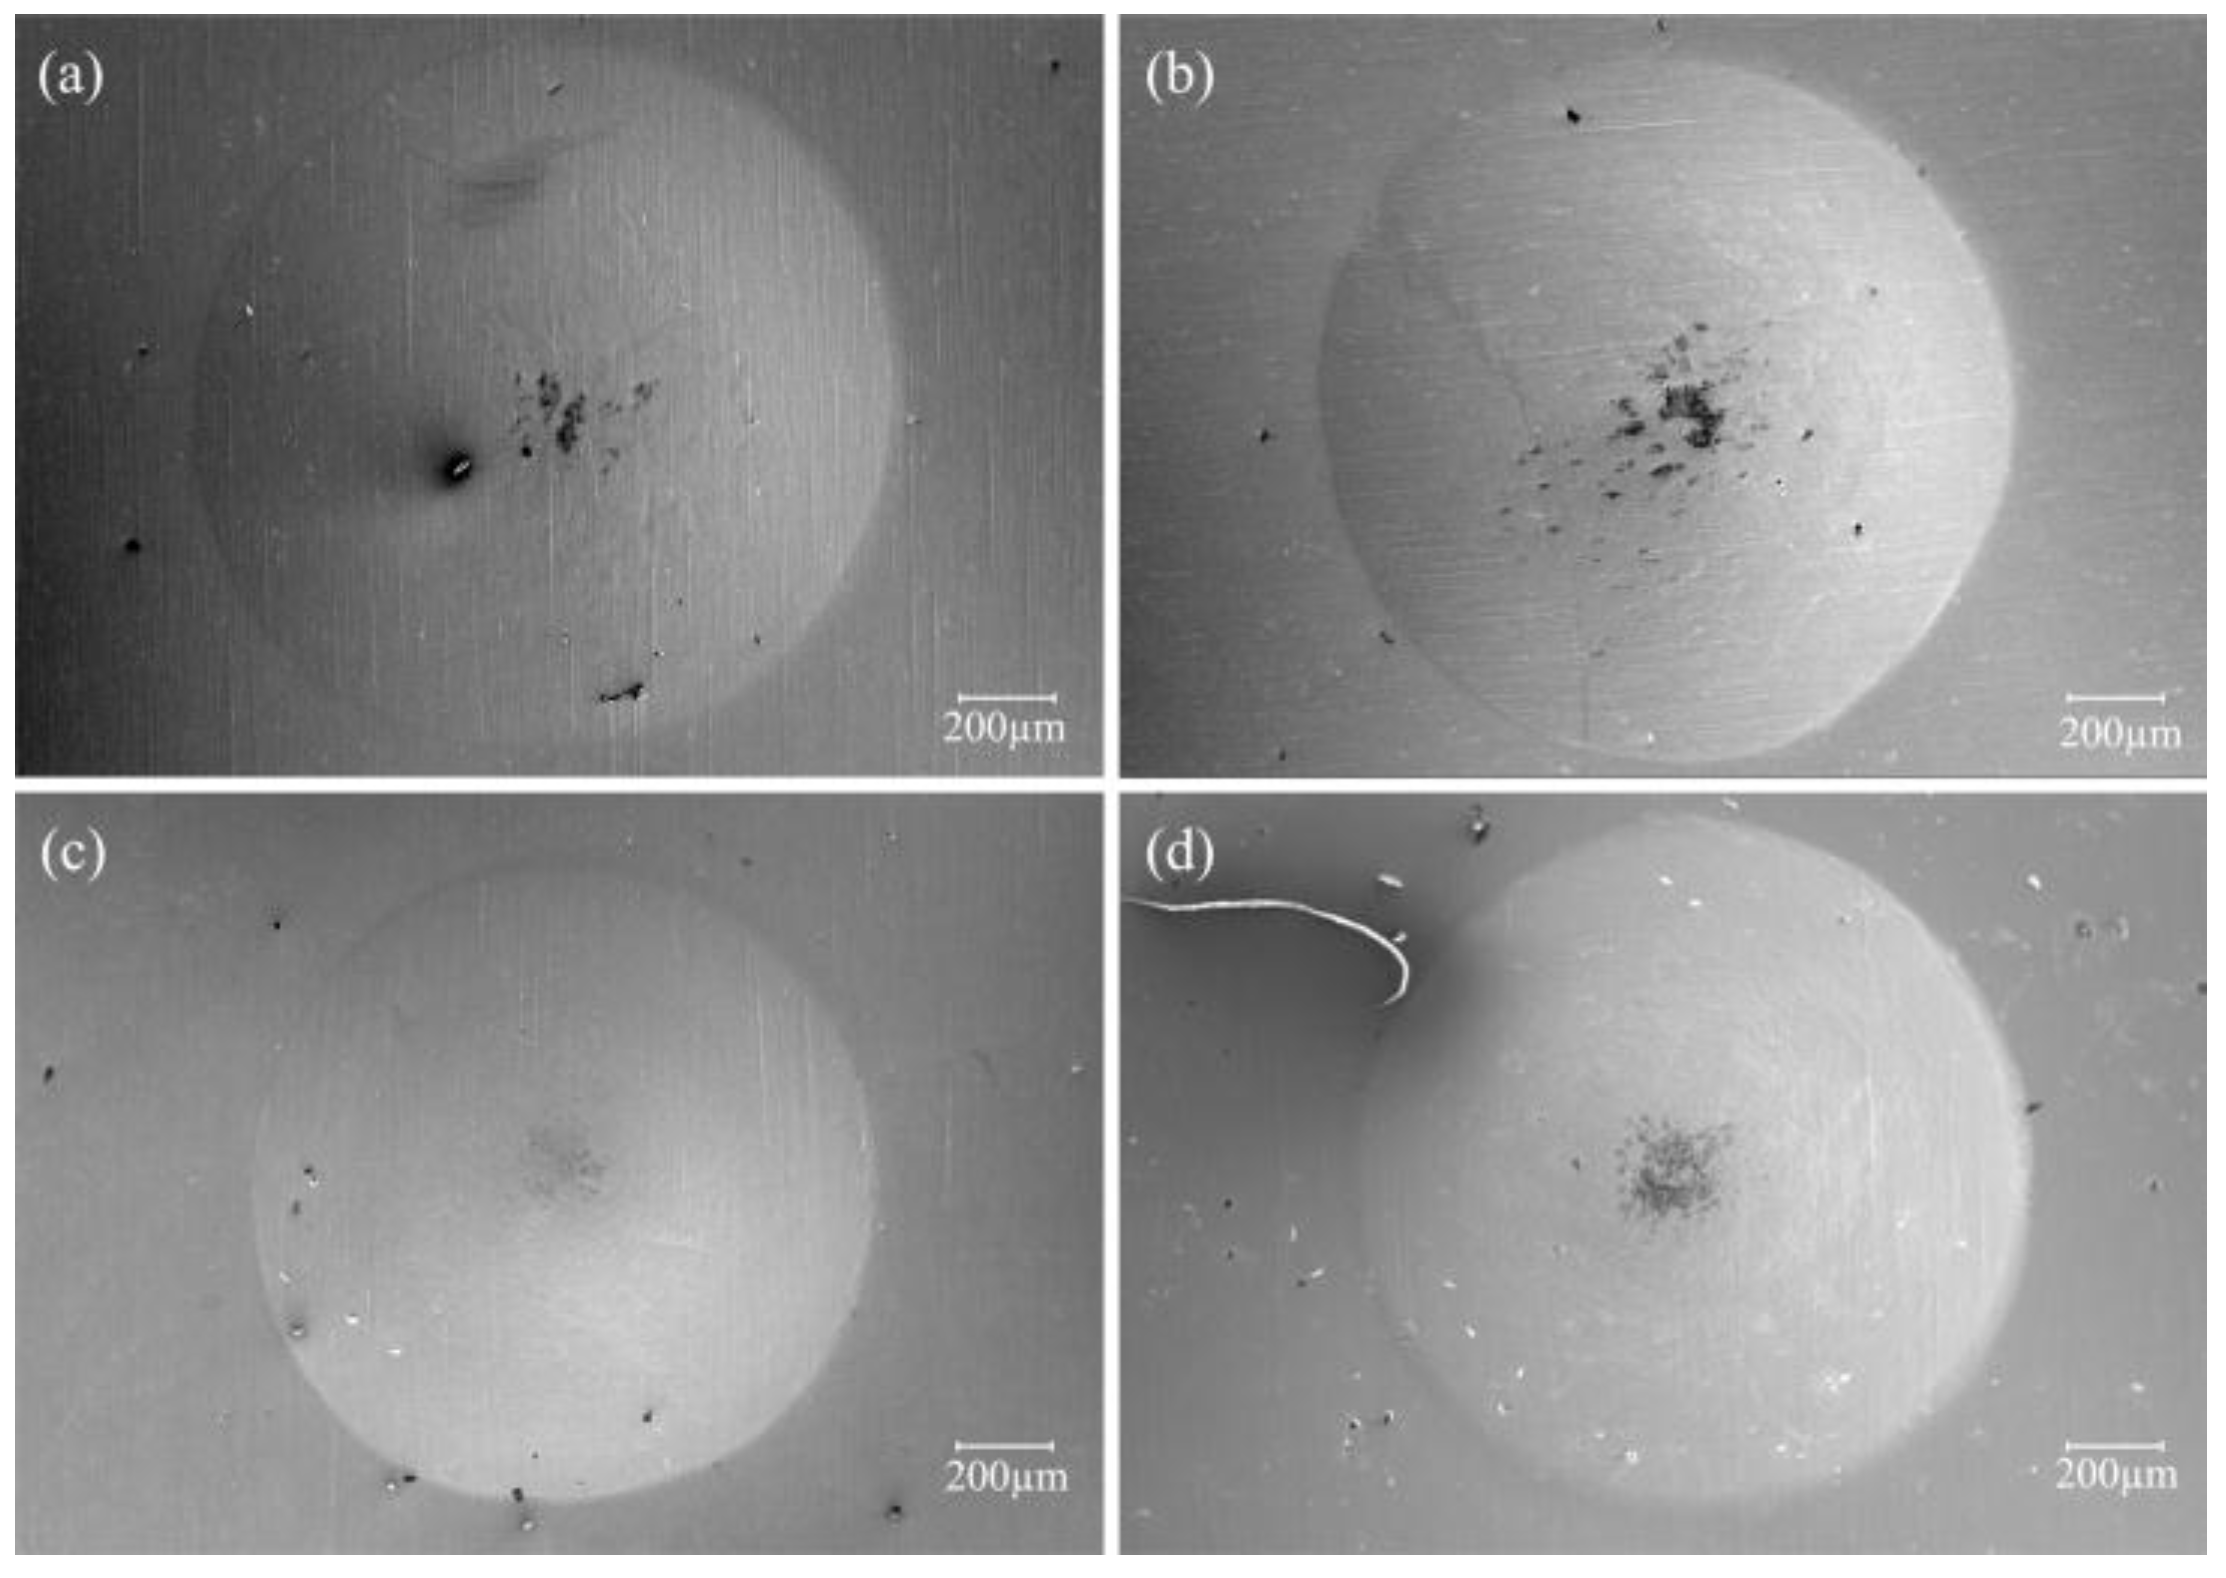
5.1. Surface Morphology
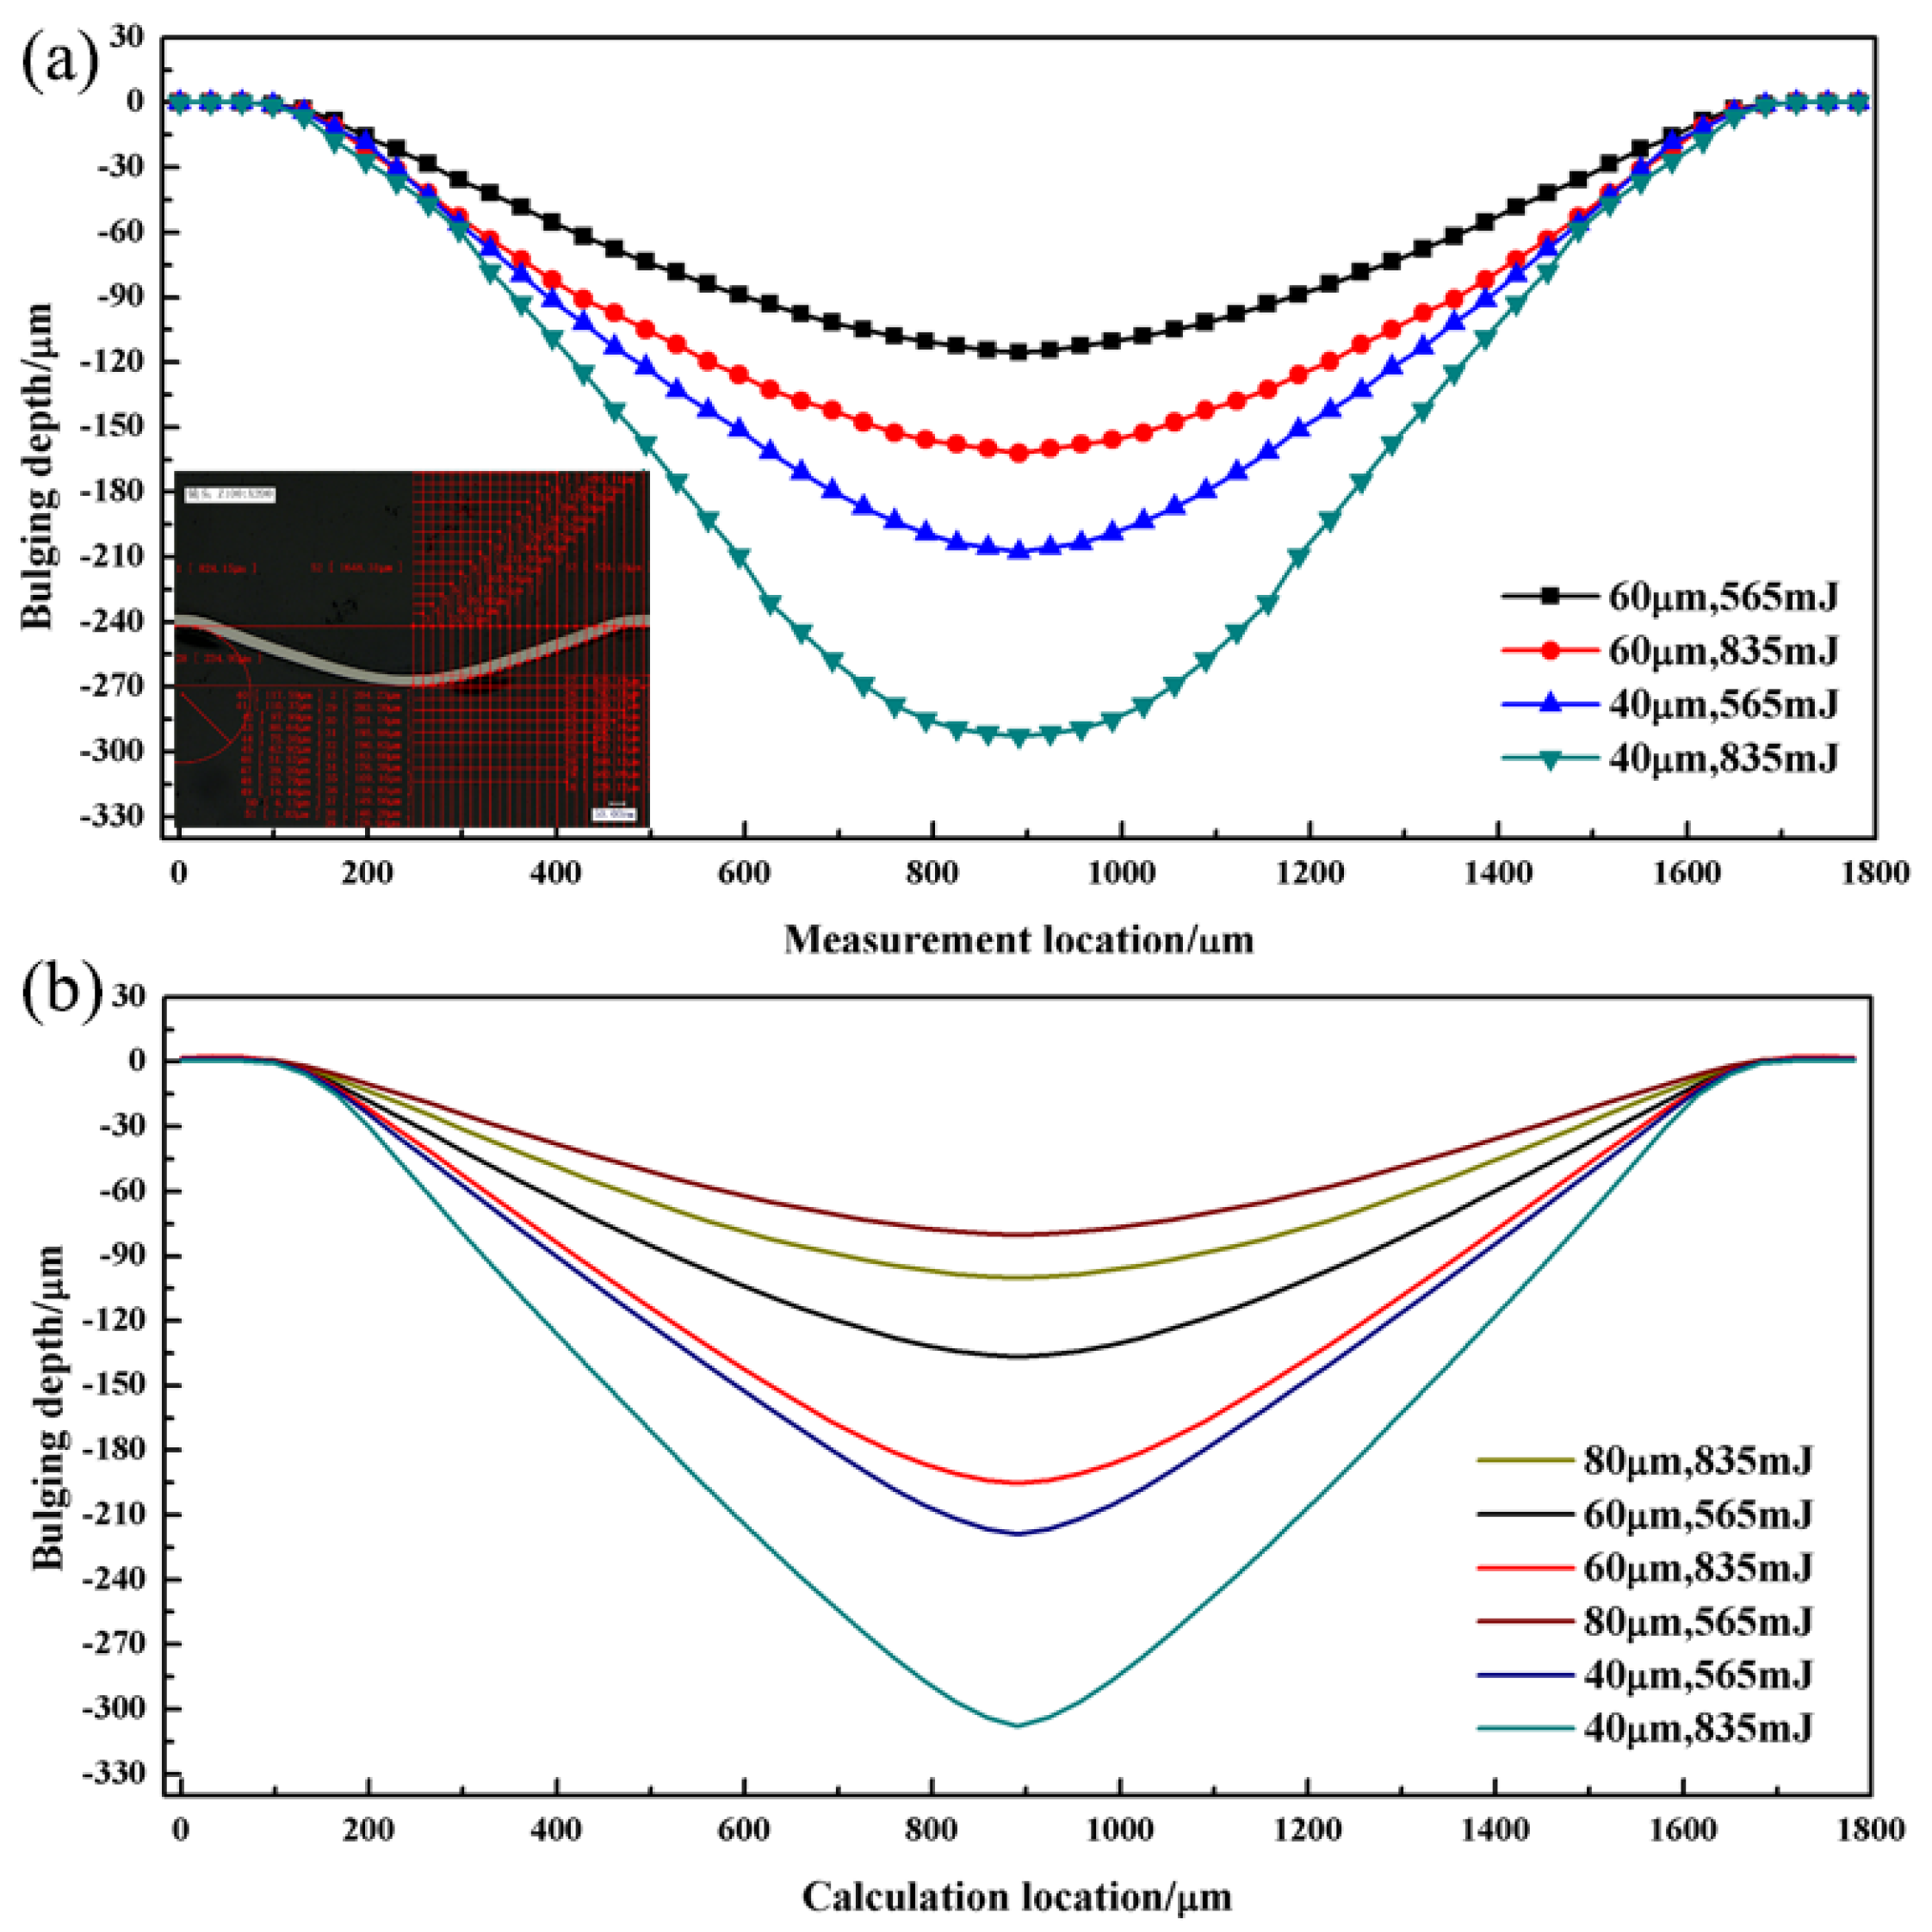
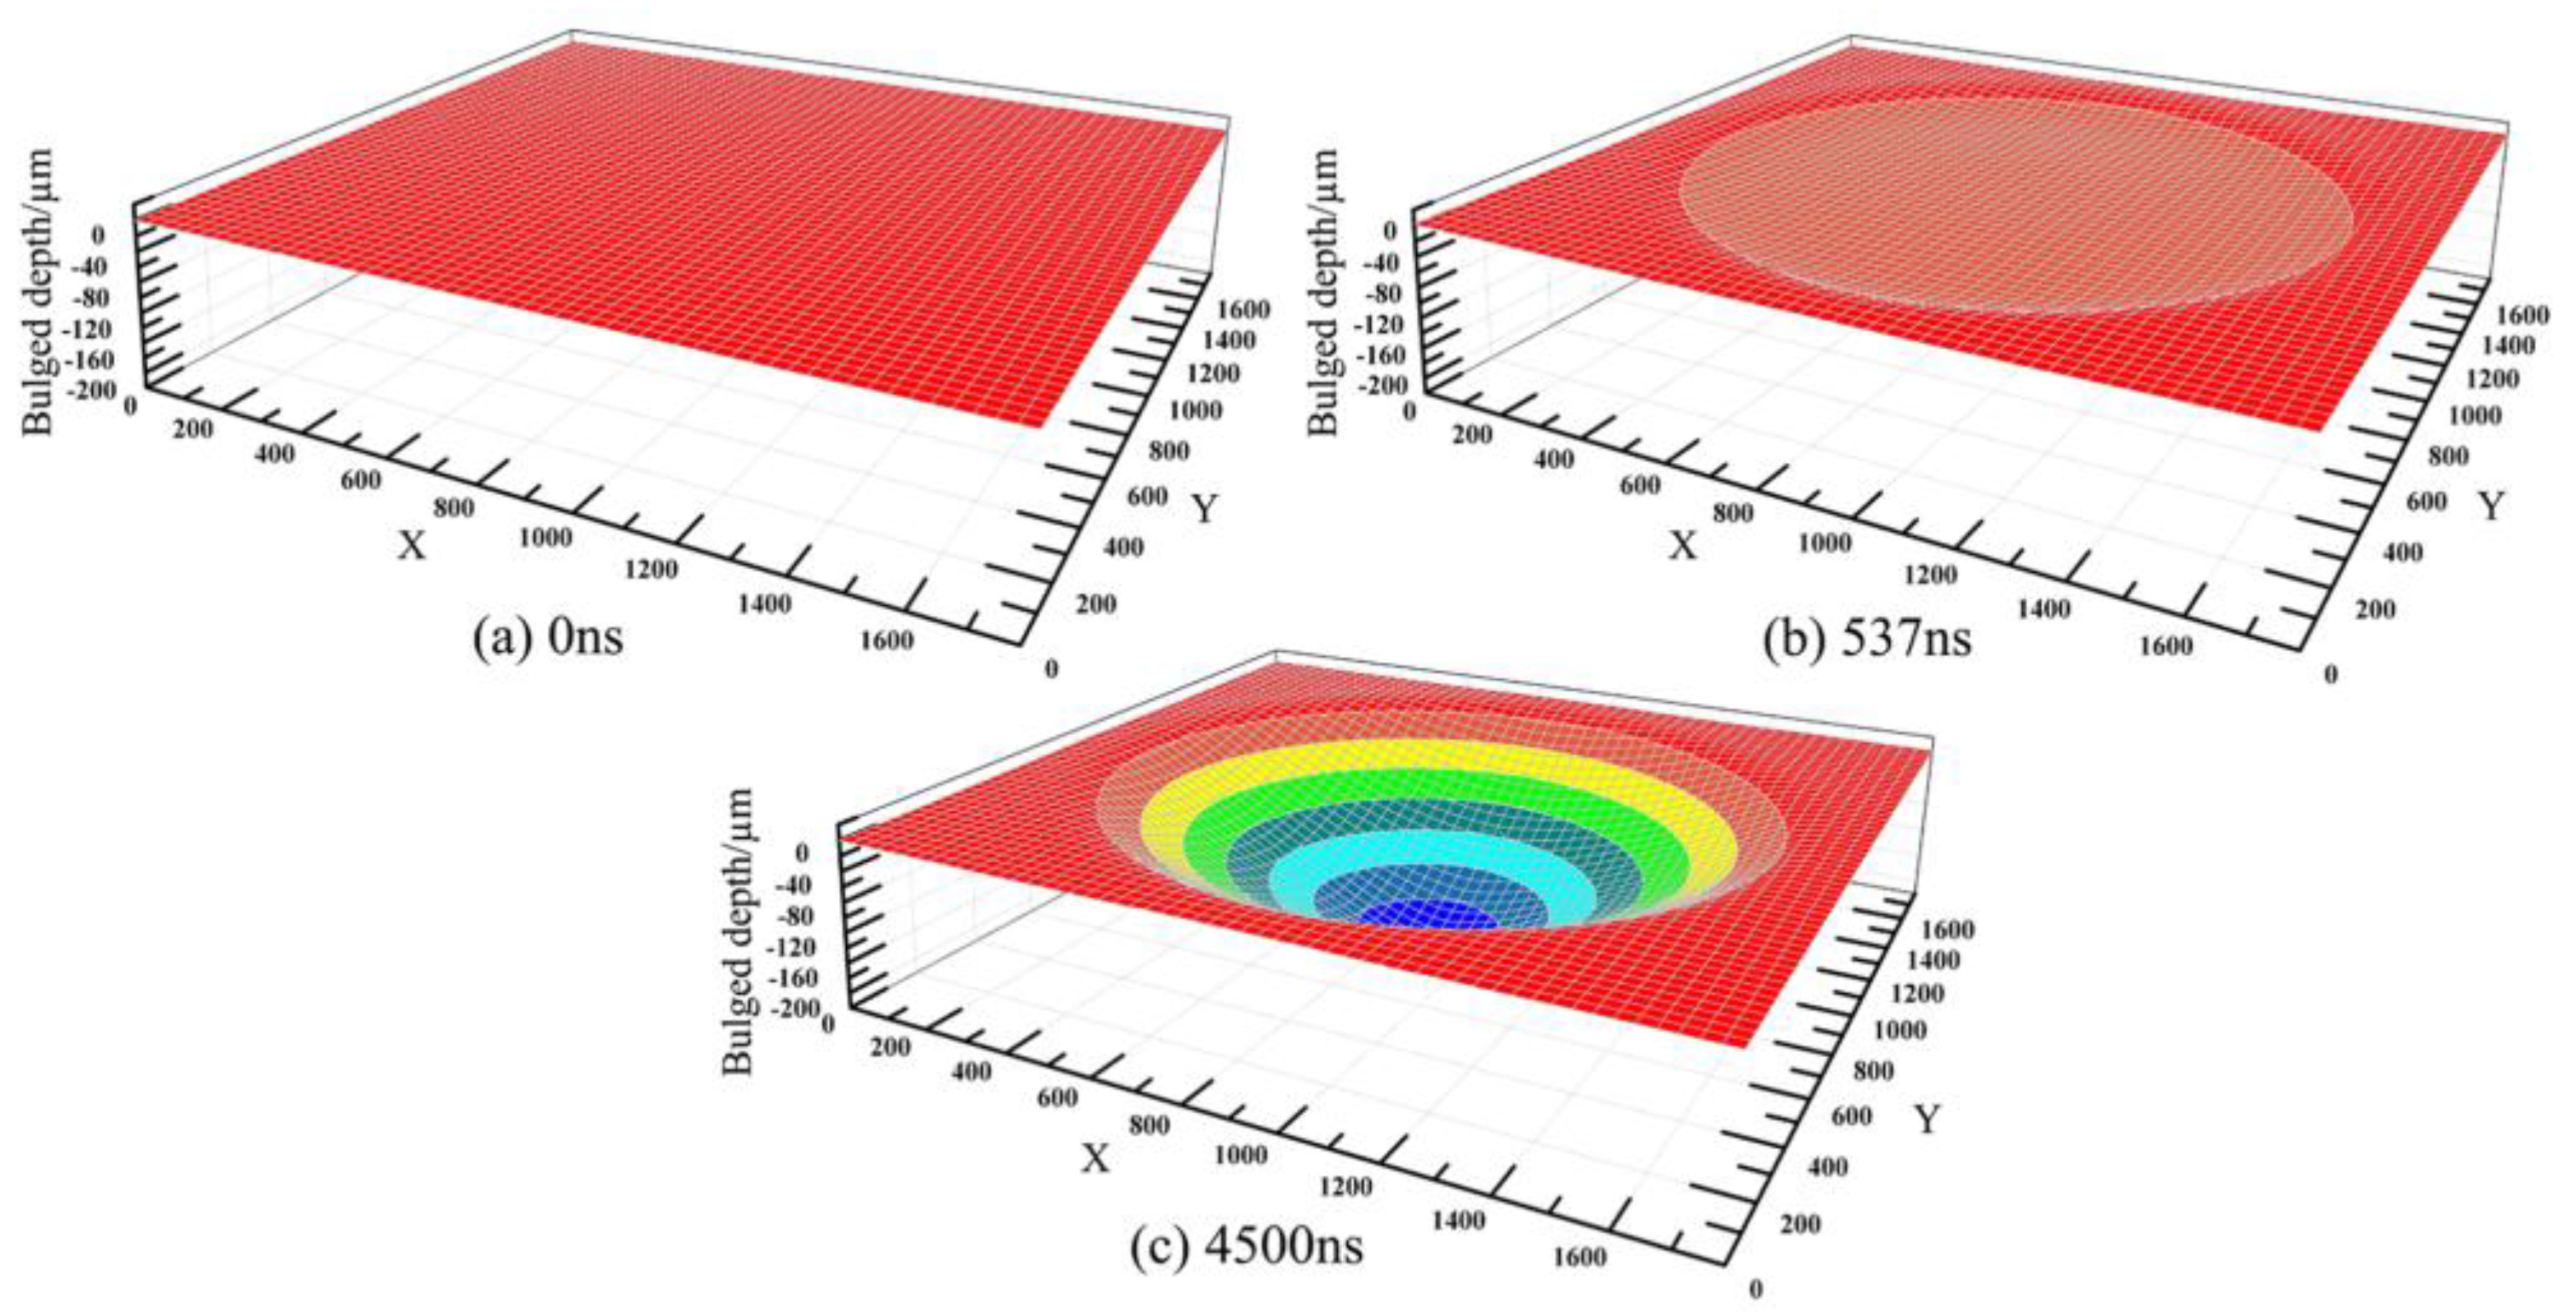
The bottom surface morphology of the micro bulging parts was observed through SEM, as shown in Figure 5. It was found that the shape of the LFSB had a spherical surface when the workpiece thickness was larger, and was a nearly spherical surface when it was small. The deformation shape of the silicone rubber in the numerical simulation is shown in Figure 6. The red curve in the graph represents the cross section of the sphere. It is clearly seen that the deformation shape of the silicone rubber tended towards a spherical surface with an increase of the workpiece thickness. This illustrated that the shape of the bulging parts was closely related to the deformation of silicone rubber. In addition, there were different defects at the bottom of the micro bulging parts. Figure 7 shows the bottom surface features of the micro bulging parts. It was found that under the same laser energy, the bottom defect of the micro bulging part was obvious when the workpiece thickness was larger. This phenomenon was contrary to laser driven flyer impacting [30]; the bottom defect of the micro bulging part also increased obviously with an increase of the laser energy. When the shock wave pressure induced by the laser exceeded the dynamic yield strength of the material, the material produced plastic deformation. A reflection sparse wave would be generated when the shock wave was transmitted to the free surface of the workpiece. The reflection sparse wave and subsequent rarefaction wave on the loading surface met on the free surface, and the two sparse waves collided and produced very high tensile stress. Cracks would be on the free surface when the tensile stress exceeded the maximum dynamic tensile strength. The cracks were magnified with an increase of the laser energy. Spallation was generated when the cracks were large enough.

5.2. Bulging Depth

In order to reveal the influence of workpiece thickness and laser energy on the depth of the micro bulging parts, these were mounted by low viscosity epoxy, grinded by 180# to 2000# sand papers, and polished by a polishing machine. Finally, the cross section of the micro bulging parts was obtained. The cross section was measured by a digital microscope, as shown in Figure 8a. According to Figure 5 and Figure 8a, it was found that the depth of the micro bulging parts increased with an increase of the laser energy under the same workpiece thickness; under the same laser energy, the depth of the micro bulging parts also increased with a decrease of workpiece thickness. This phenomenon can be explained by the surface layer model for the polycrystalline material [31]. Figure 8 shows the numerical simulation results about the depth of the micro bulging parts under different conditions. The trend of the numerical simulation results was consistent with the experiments. However, the numerical simulation results were larger compared with the experimental results. The deviation of the bulging depth reached about 20% for the thicker samples and 5% for the thinner samples between the experiments and simulation. Part of the reason for this might be a certain air resistance in the experiment.

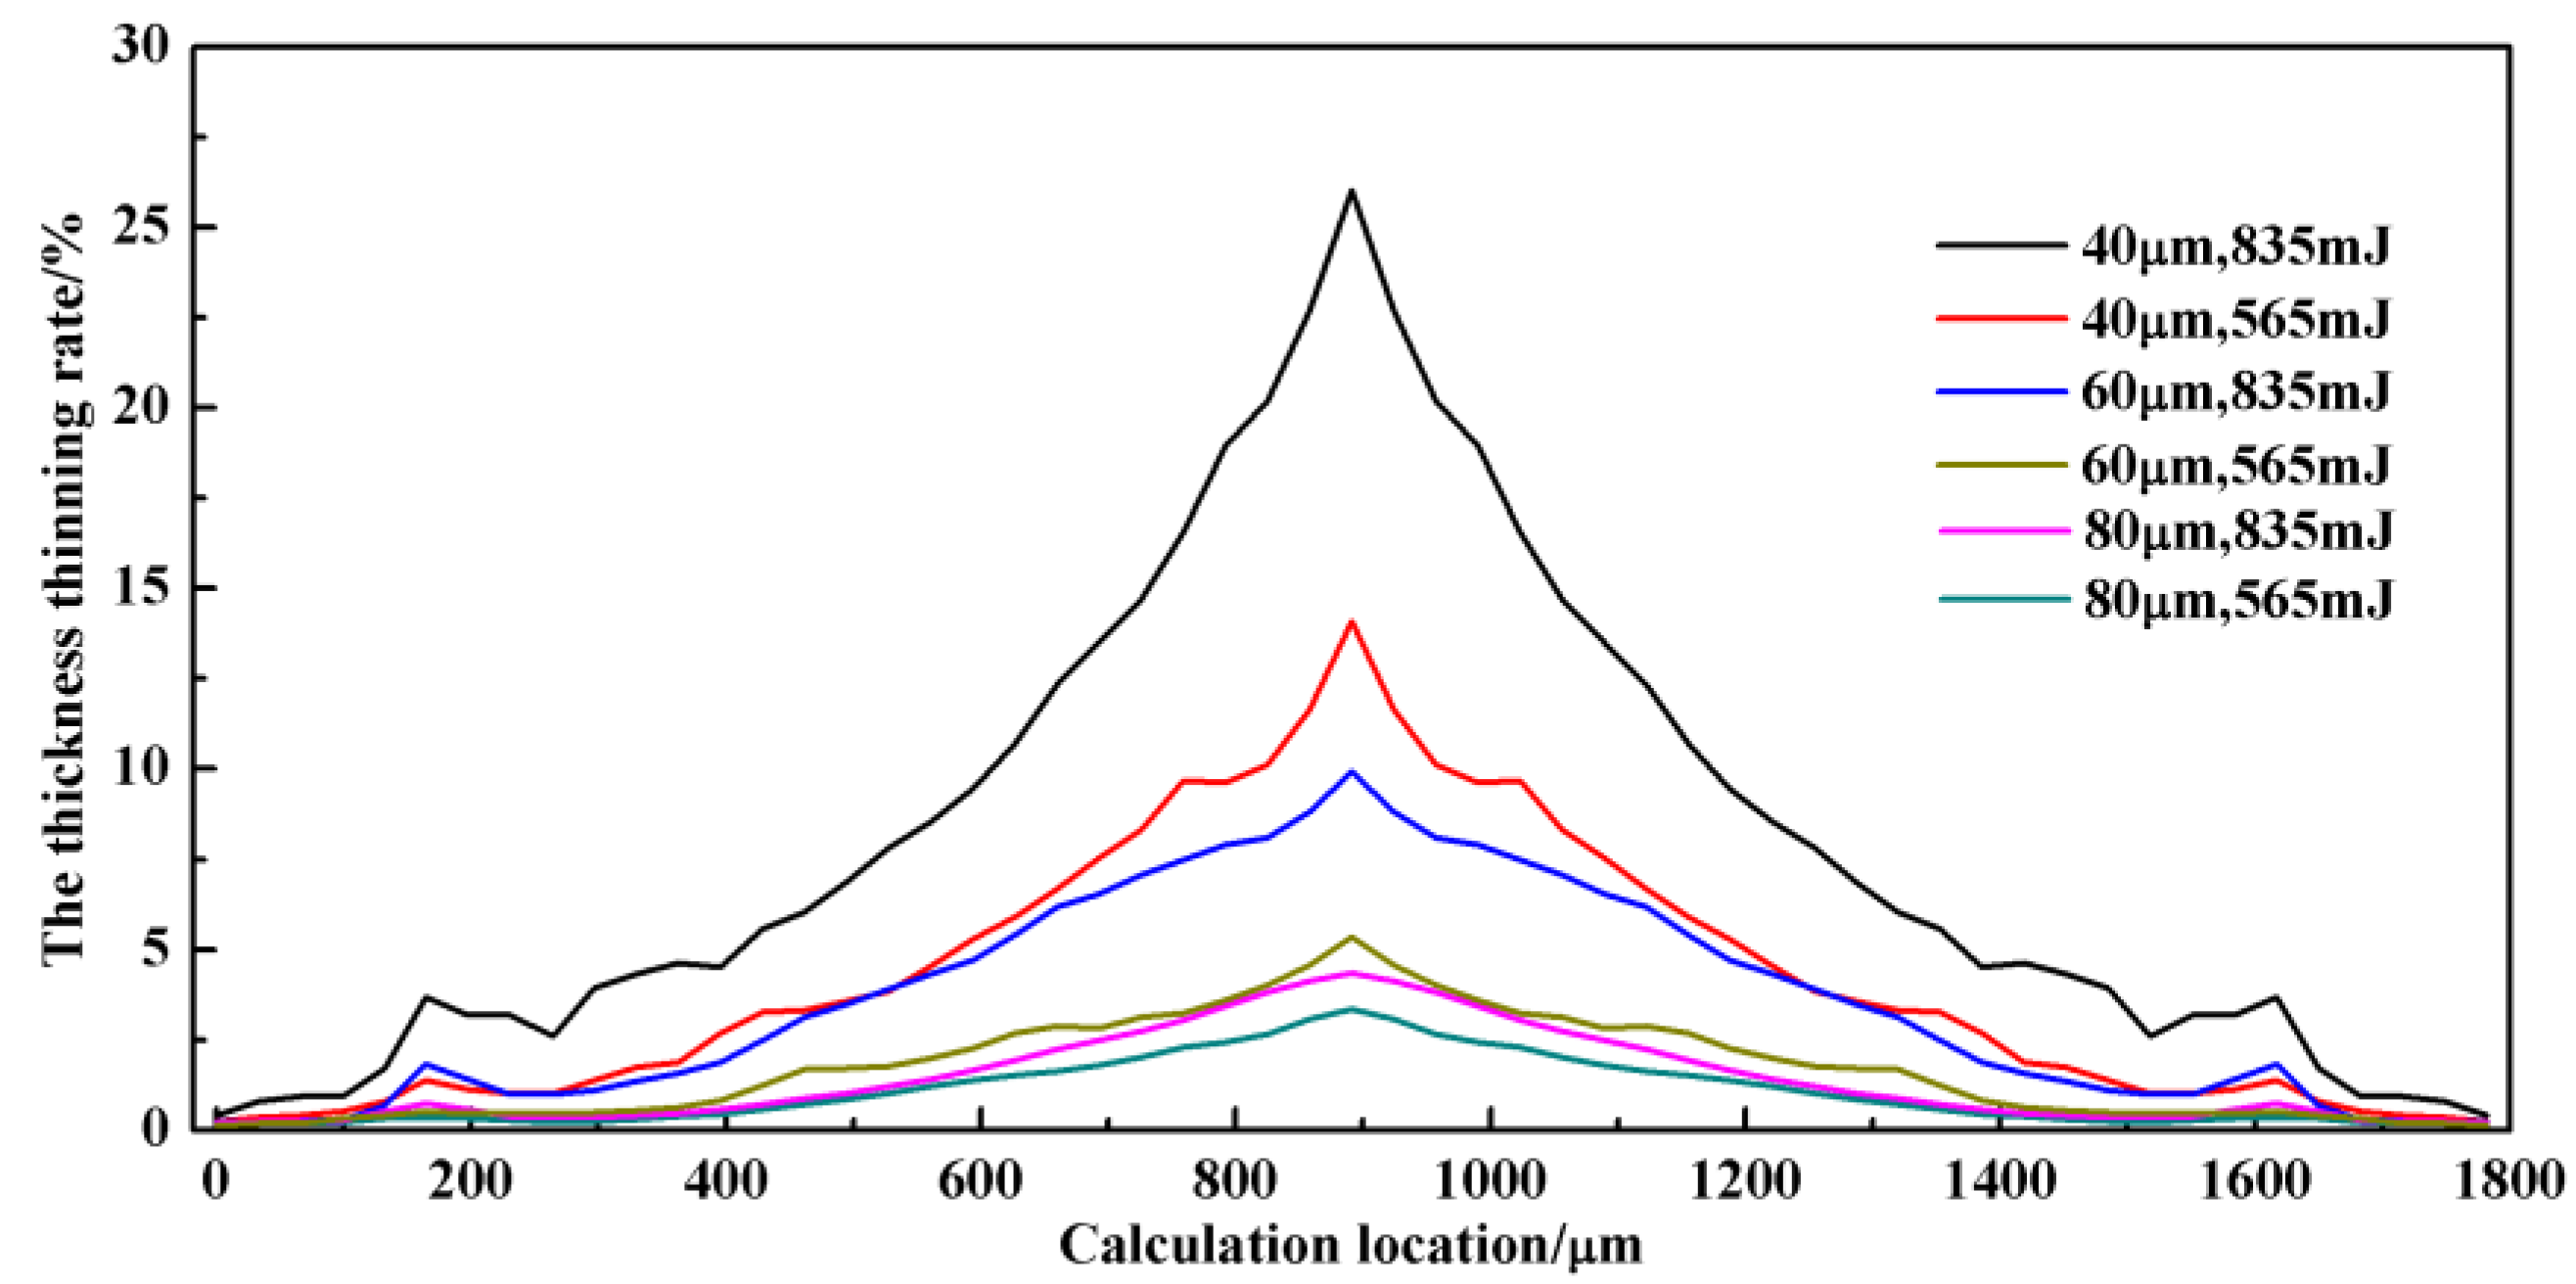
5.3. Thickness Thinning Rate

Based on the obtained cross section of the micro bulging parts, the thickness distribution was analyzed quantitatively by measuring the thickness of the cross section, as shown in Figure 9. The thickness thinning rate T is defined as follows:
T = l 0 l i l 0 × 100 %
where l0 is the initial thickness of the workpiece and li is the measuring point thickness of the micro bulging parts. It was found that the thickness thinning rate gradually increased from the micro-die cavity surrounding the fillet; the thickness thinning rate first decreased and then increased from the fillet to the bottom of the micro bulging parts. This was because the silicone rubber was subjected to the shock wave effect induced by the laser and generated elastic deformation during the LFSB. Then, the silicone rubber began to squeeze the workpiece. The workpiece had a bending deformation in the fillet of the micro-die. The silicone rubber continued to squeeze the workpiece. The thinning rate of the fillet increased due to the rigid contact between the workpiece and the fillet of the micro-die. At the same time, the thickness change of the workpiece was relatively small in the micro-die cavity edge. The silicone rubber continued to squeeze into the micro-die cavity, making the material at the micro-die cavity edge stretch inside. According to the inertial effect [32], the final thickness thinning rate of the micro bulging parts first decreased and then increased from the fillet to the bottom, and the thinning rate of the bottom was greater than that of the fillet. The deformation process of the workpiece can be found from the numerical simulation, as shown in Figure 10. Figure 10 shows the deformation process of 304 stainless steel foil with 40 µm thickness at 565 mJ. Bending deformation occurred in the workpiece from 0 ns (i.e., starting) to 537 ns. The workpiece was stretched inside the micro-die cavity by the silicone rubber from 537 ns to 4500 ns (i.e., bending).
It was found from Figure 9 that the thickness thinning rate of the micro bulging parts gradually increased with a decrease of workpiece thickness and an increase of laser energy. This result was consistent with that shown by the bulging depth. The workpiece generated larger plastic deformation with an increase of laser energy under the same thickness, so that thickness thinning of the workpiece increased. According to the surface layer model, the flow stress of the material decreased with a decrease of the thickness. Thus, the plastic deformation of the thinner workpiece was larger at the same laser energy. In addition, the thinning rate increased significantly with an increase of laser energy from 565 mJ to 835 mJ for the 304 stainless steel foil with 40 µm thickness. For the maximum thinning rate, the value for the workpiece with 40 µm thickness was 12.6% and 24.8%, while for the workpiece with 60 µm thickness was 4.8% and 8.9%, for the laser energies of 565 mJ and 835 mJ, respectively. These results indicated that the thinner workpiece generated a larger deformation under a larger laser energy. Figure 11 shows the thickness thinning rate distribution of the micro bulging parts in the numerical simulation. Although the maximum thinning rate in the simulation was larger than that in the experiment—the deviation of the thickness thinning rate reaches about 12% for the thicker samples and 10% for the thinner samples between the experiments and simulation—the trend of the simulation results was in agreement with the experimental results.

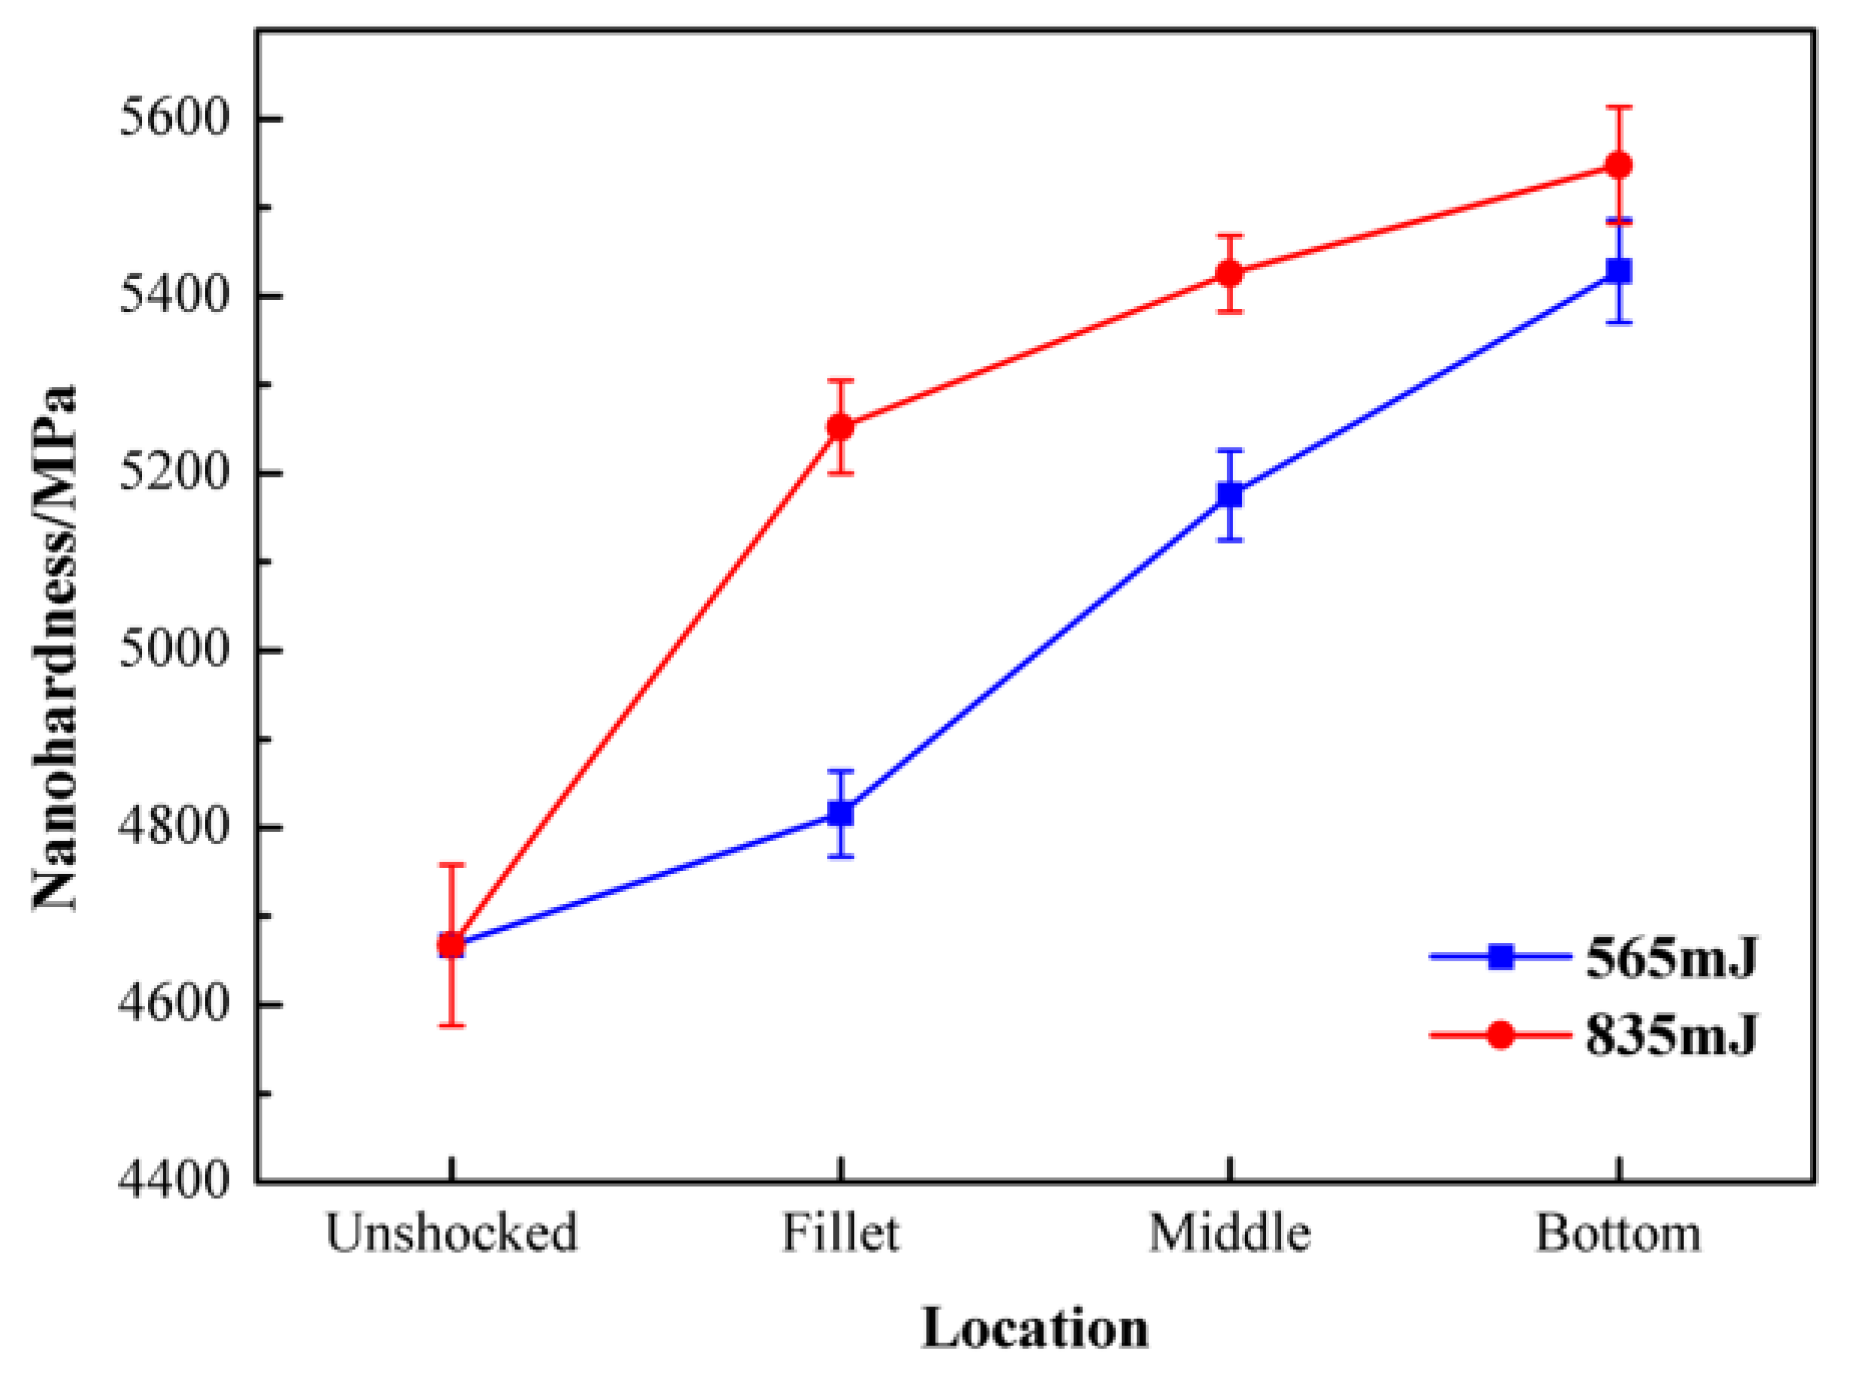
5.4. Hardness Distribution of the Cross Section

Nanoindentation test technology has been widely used to characterize the micro scale mechanical properties of the materials, including nanohardness and elastic modulus. A NanoIndenter CSM with a Berkovich diamond indenter was used to test the hardness in the cross sections of the micro bulging parts in this paper. The location of the nanoindentation test points is shown in Figure 12. It included the bottom, middle, and fillet of the cross section, and the measuring position was in the middle of the corresponding thickness. The maximum load was set to 10 mN, and the holding time was 5 s in the measurement process. Figure 13 shows the nanoindentation load-displacement curve of the 304 stainless steel foil with 40 µm thickness before and after laser flexible shock.
According to the Oliver-Pharr method [33], the hardness distribution in the cross section of the micro bulging parts is shown in Figure 14. It was clear that the hardness of the workpiece cross section increased significantly after laser flexible shock compared with before laser flexible shock. The hardness of the 304 stainless steel foils with thickness of 40 µm was 4667.126 MPa before laser flexible shock, while the hardness at the bottom, middle, and fillet of the micro bulging parts was 5547.813 MPa, 5425.542 MPa, and 5252.36 MPa, respectively, after the flexible shock of the 835 mJ laser energy. The hardness was increased by 18.9%, 16.3%, and 12.5%, respectively, compared with before the laser flexible shock. The increase of hardness may be attributed to the generation of a large number of dislocation tangles in the process of laser flexible shock, as shown in Figure 15a. These dislocation tangles were further developed into subgrain boundaries, which generated subgrains. For example, 1–3 subgrains were observed in Figure 15a through TEM. Figure 15b presents the electron diffraction of the corresponding selected area (Figure 15a). The diffraction diagram consisted of a series of concentric circles. These diffraction rings represented typical boundaries of polycrystalline materials. Therefore, there were many fine grains at the laser flexible shock area.

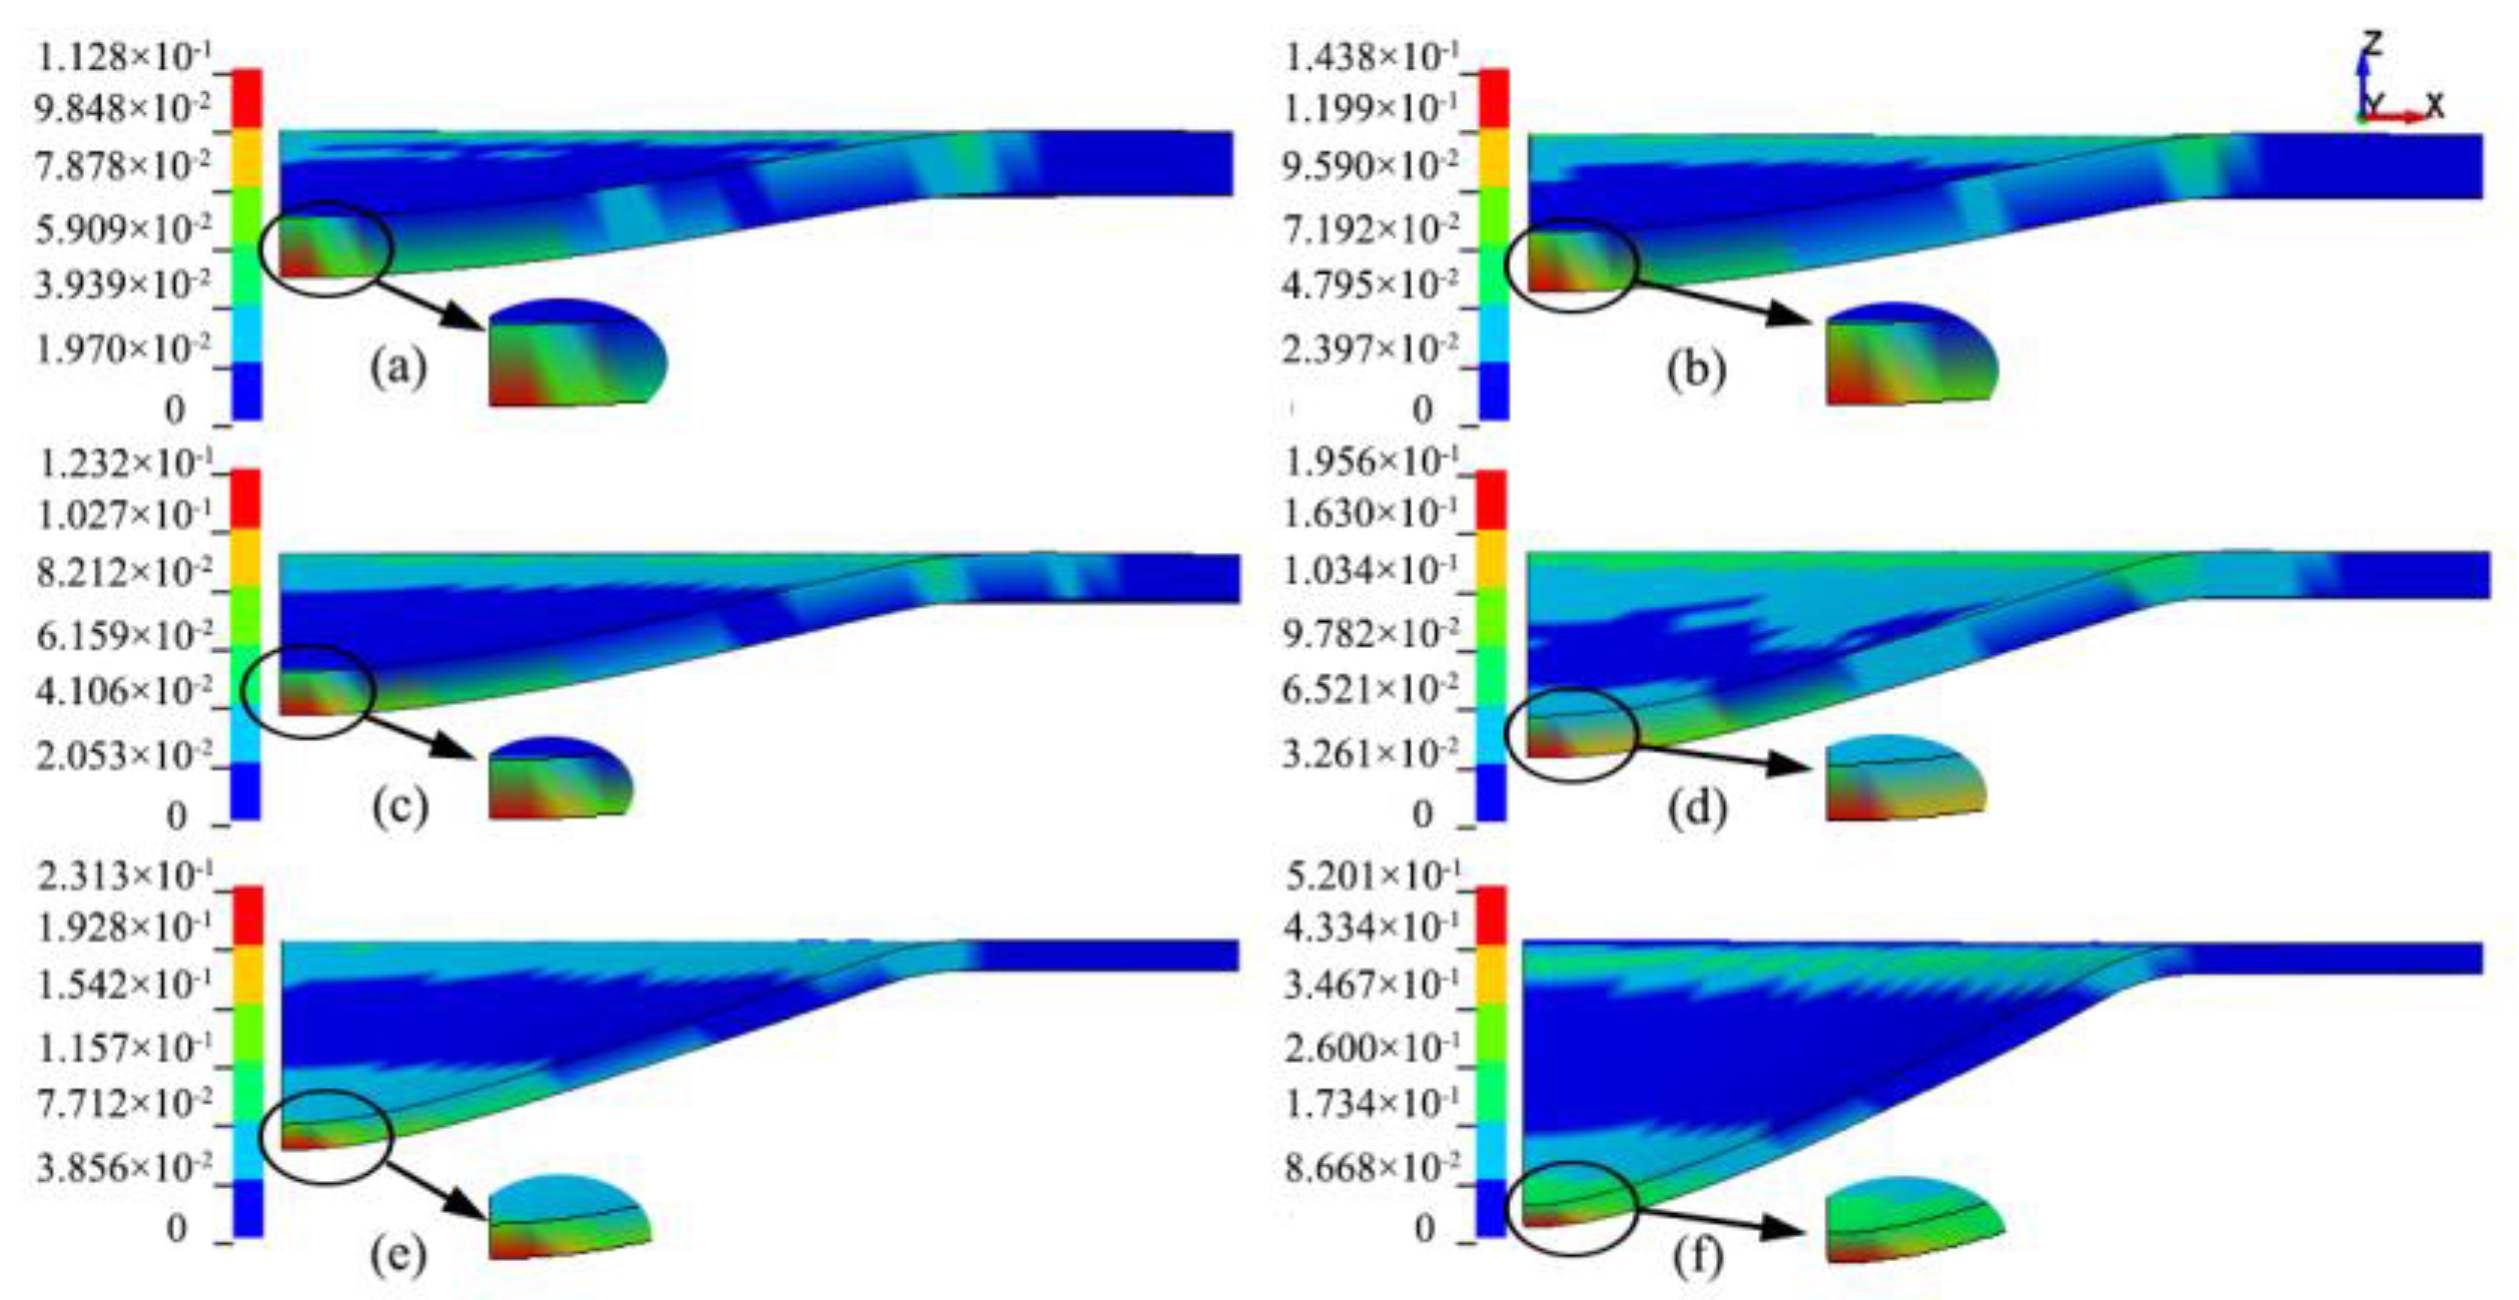
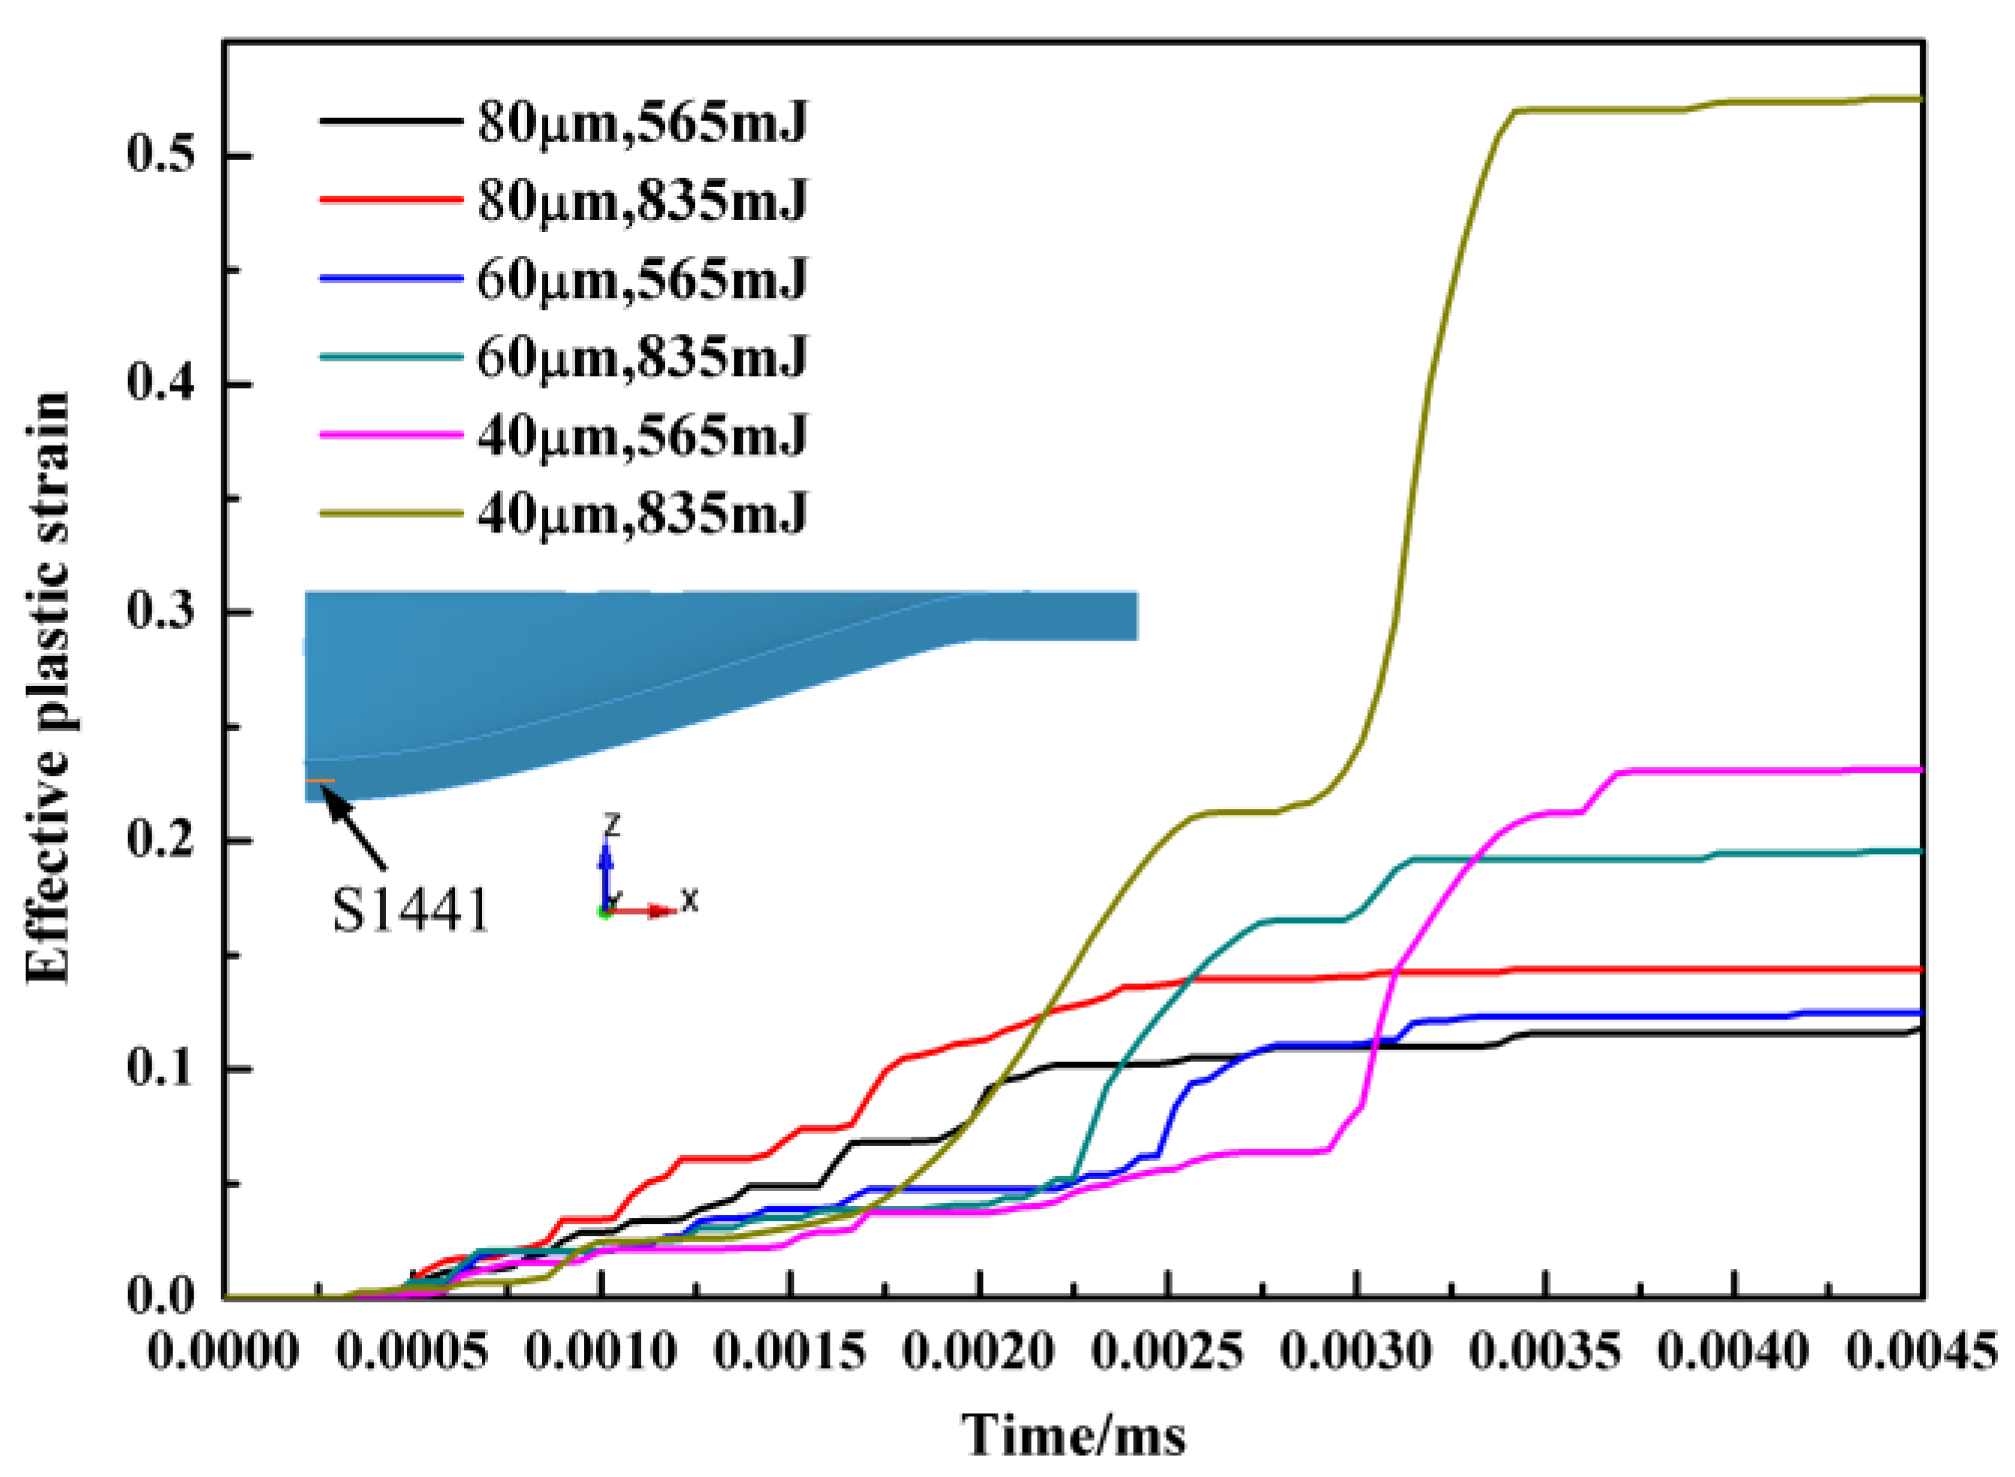
5.5. Equivalent Stress and Plastic Strain Distribution

Figure 16 shows the equivalent stress distribution of the micro bulging parts in the numerical simulation. It was found that the maximum equivalent stress appeared at the bottom of the parts and decreased along the Z axis. This result was related to the LFSB process. According to the simulation process, the final forming of the part was attributed to the flexible stretching of the silicone rubber. Thus, the stress was concentrated at the bottom of the micro bulging part. It can be seen from Figure 16 that the maximum equivalent stress was 517.3, 593.4, and 618.1 MPa, respectively, when the workpiece thickness was 80, 60, and 40 µm under the laser energy of 565 mJ; it was 618.1 and 686.9 MPa, respectively, when laser energy was 565 and 835 mJ for the 40 µm thick workpiece. The maximum equivalent stress increased with an increase of the laser energy and a decrease of the workpiece thickness.
Figure 17 shows the equivalent plastic strain distribution of the micro bulging parts under different conditions. From the deformation process of micro-bulging (Figure 10), the plastic deformation of the workpiece occurred first at the mold fillet. The maximum equivalent plastic strain was at the bottom lower surface of the micro bulging parts with the continuous elastic deformation of silicone rubber. It can be seen clearly from Figure 17 that the maximum equivalent plastic strain increased from 0.12 to 0.52 with a decrease of the workpiece thickness from 80 µm to 40 µm and an increase of the laser energy from 565 mJ to 835 mJ. The simulated results indicated that the relative deformation of the bottom was larger with a decrease of the workpiece thickness and an increase of the laser energy. The variation of the equivalent plastic strain at the bottom thickness middle element S1441 of the micro bulging parts is shown in Figure 18. The equivalent plastic strain of the element S1441 presented an increasing trend. It was found that the increase was relatively slow in the beginning, and subsequently increased rapidly, since the micro-die fillet material was squeezed by the silicone rubber in the starting phase. However, the material at the micro-die cavity center was not obviously squeezed by the silicone rubber due to the lack of rigid contact. With the continuous deformation of the silicone rubber, the material was stretched inside of the cavity, so that the equivalent plastic strain of the element S1441 increased insignificantly. The variation of the equivalent plastic strain in the fillet thickness middle element S1463 of the micro bulging parts is shown in Figure 19. Similarly, there was an increase for the equivalent plastic strain of element S1463. According to Figure 18 and Figure 19, it was clear that the variation of the equivalent plastic strain in elements S1441 and S1463 was relatively larger when the workpiece thickness was 40 µm and the laser energy was 835 mJ.

6. Conclusions

In this paper, the deformation behavior of 304 stainless steel foils was investigated by experiments and numerical simulation in the LFSB, including the surface morphology, bulging depth, and thickness thinning rate. The distribution of hardness in the cross section of the micro bulging parts was revealed by the nanoindentation tests. The equivalent stress and equivalent plastic strain distribution of the micro bulging parts were presented. The research conclusions were as following:
(1)
The shape of the micro bulging parts was closely related to the deformation of silicone rubber according to the Gaussian laser model in the LFSB process. The surface integrity of the micro bulging parts was good with a decrease of the laser energy and workpiece thickness.
(2)
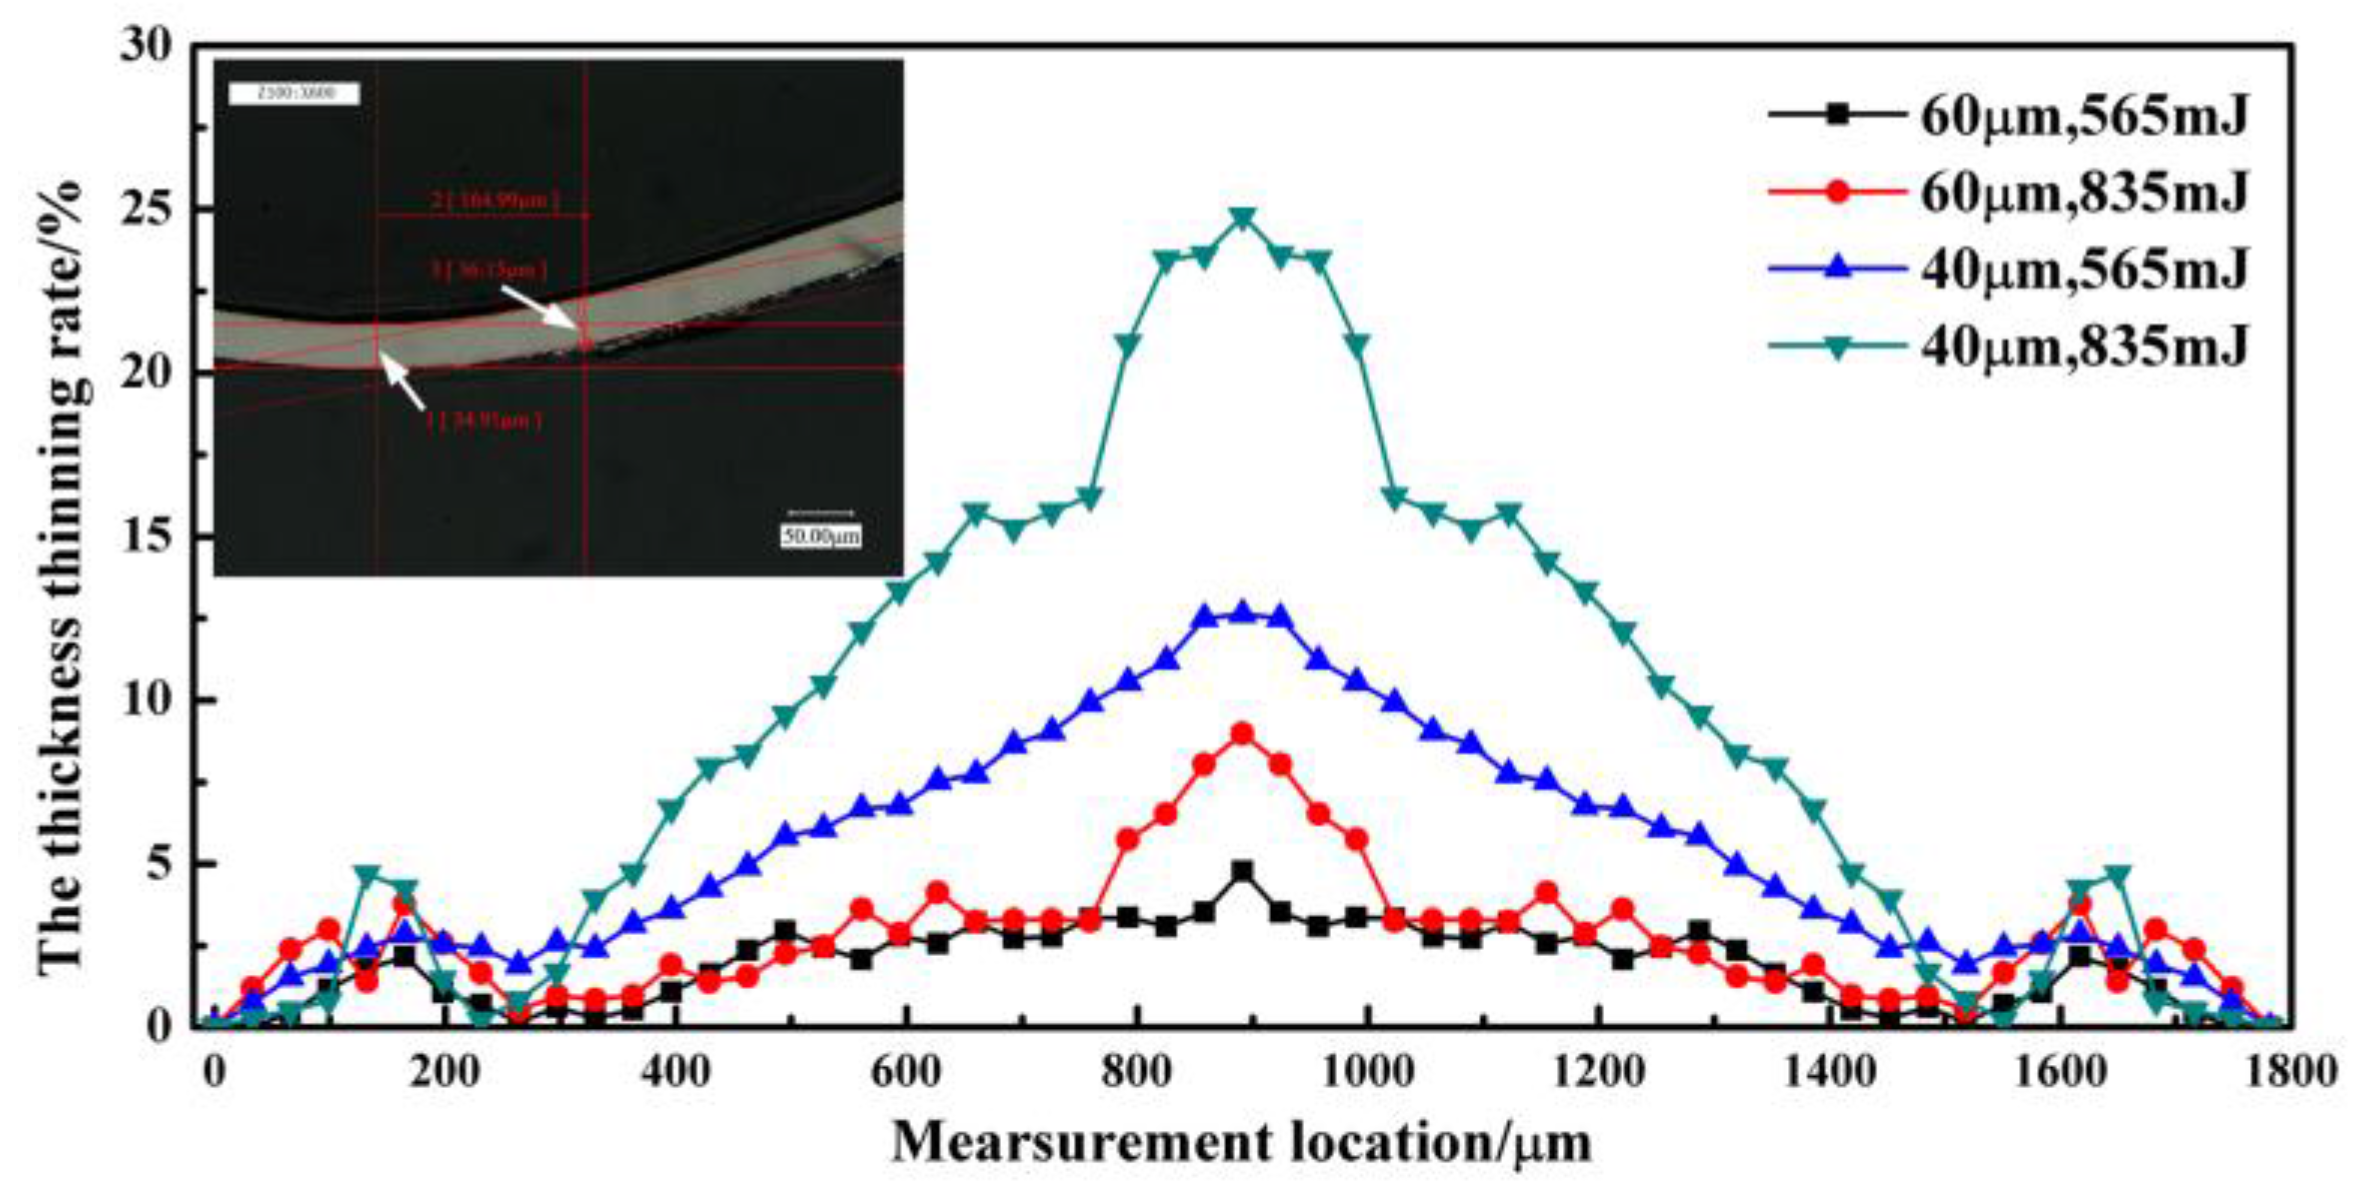
As the workpiece thickness decreased and laser energy increased, the bulging depth and thickness thinning rate of the micro bulging parts increased. This was similar to traditional micro forming.
(3)
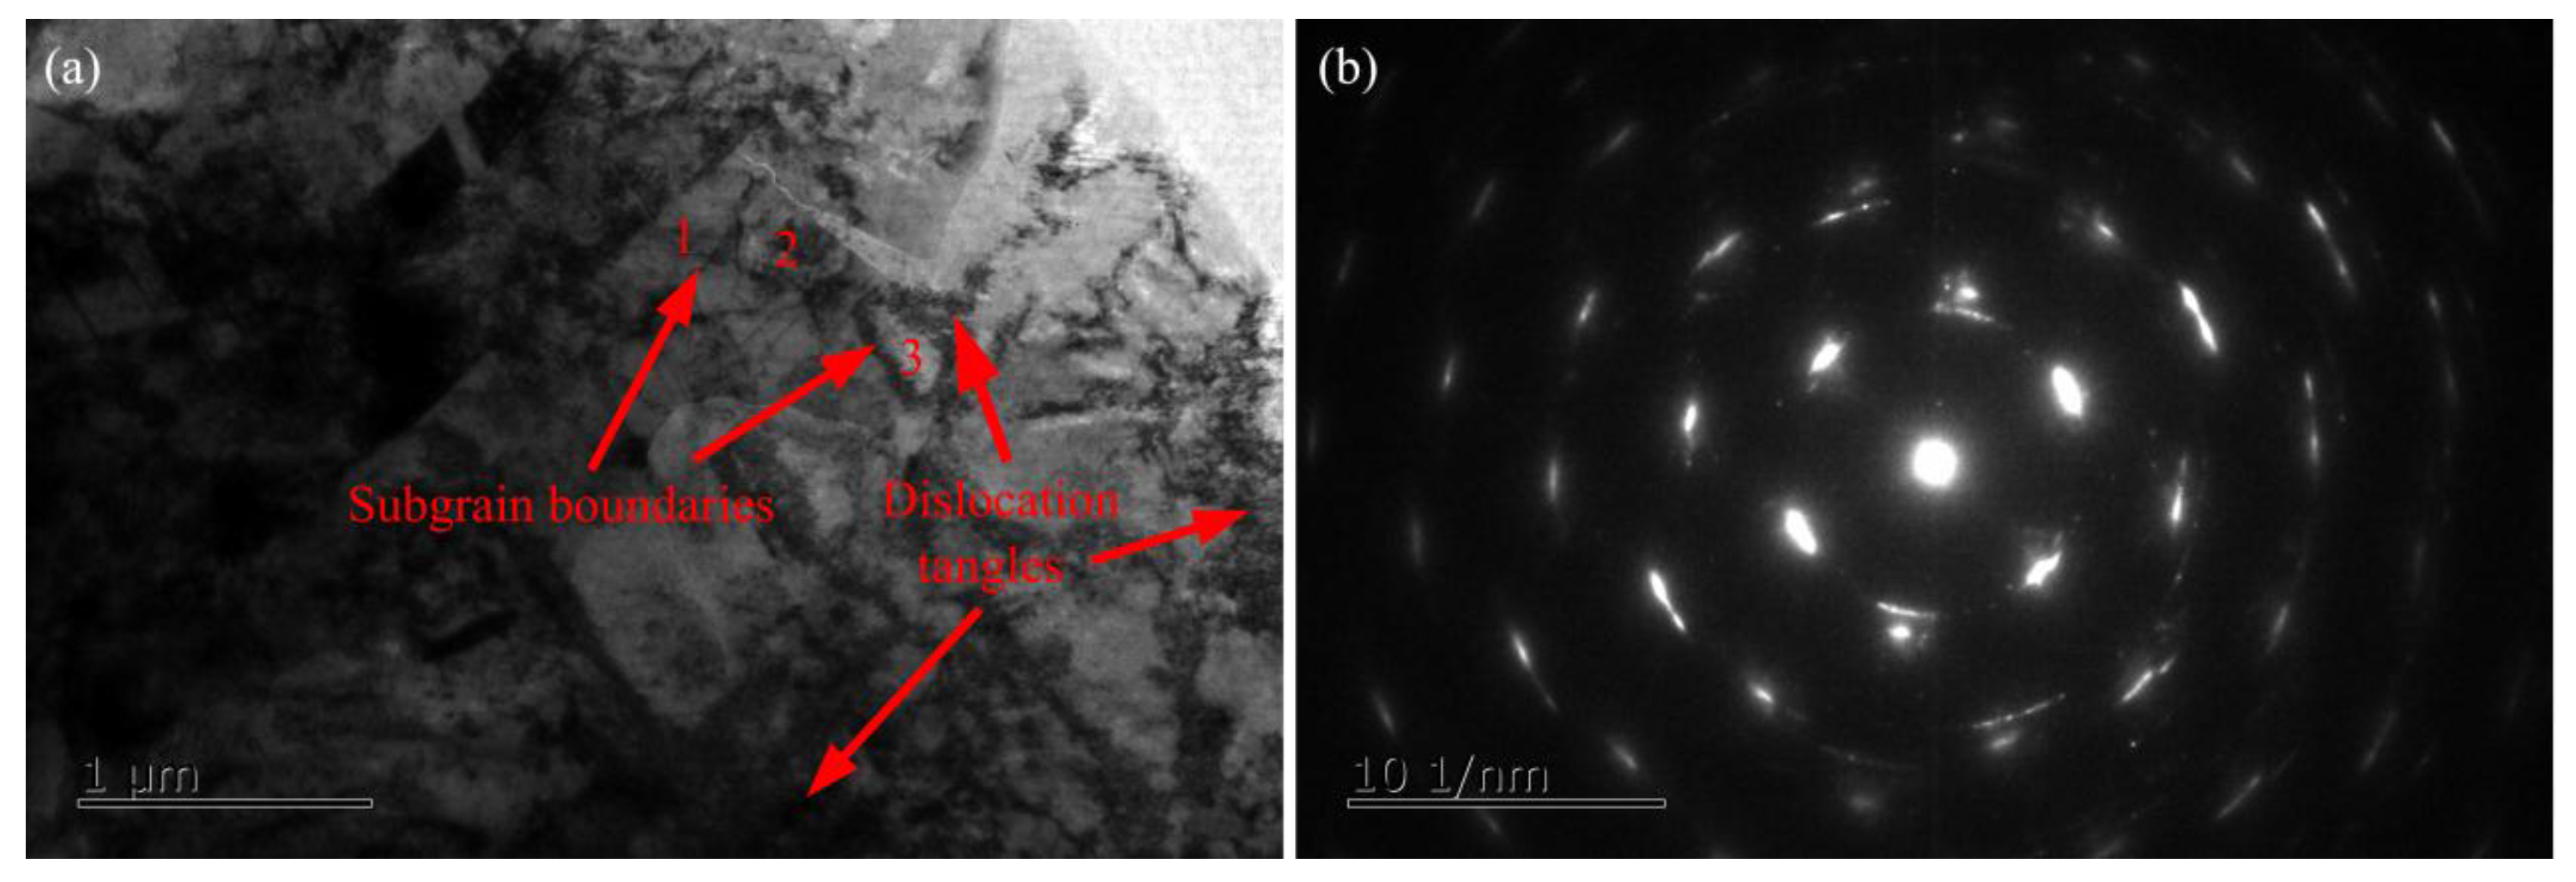
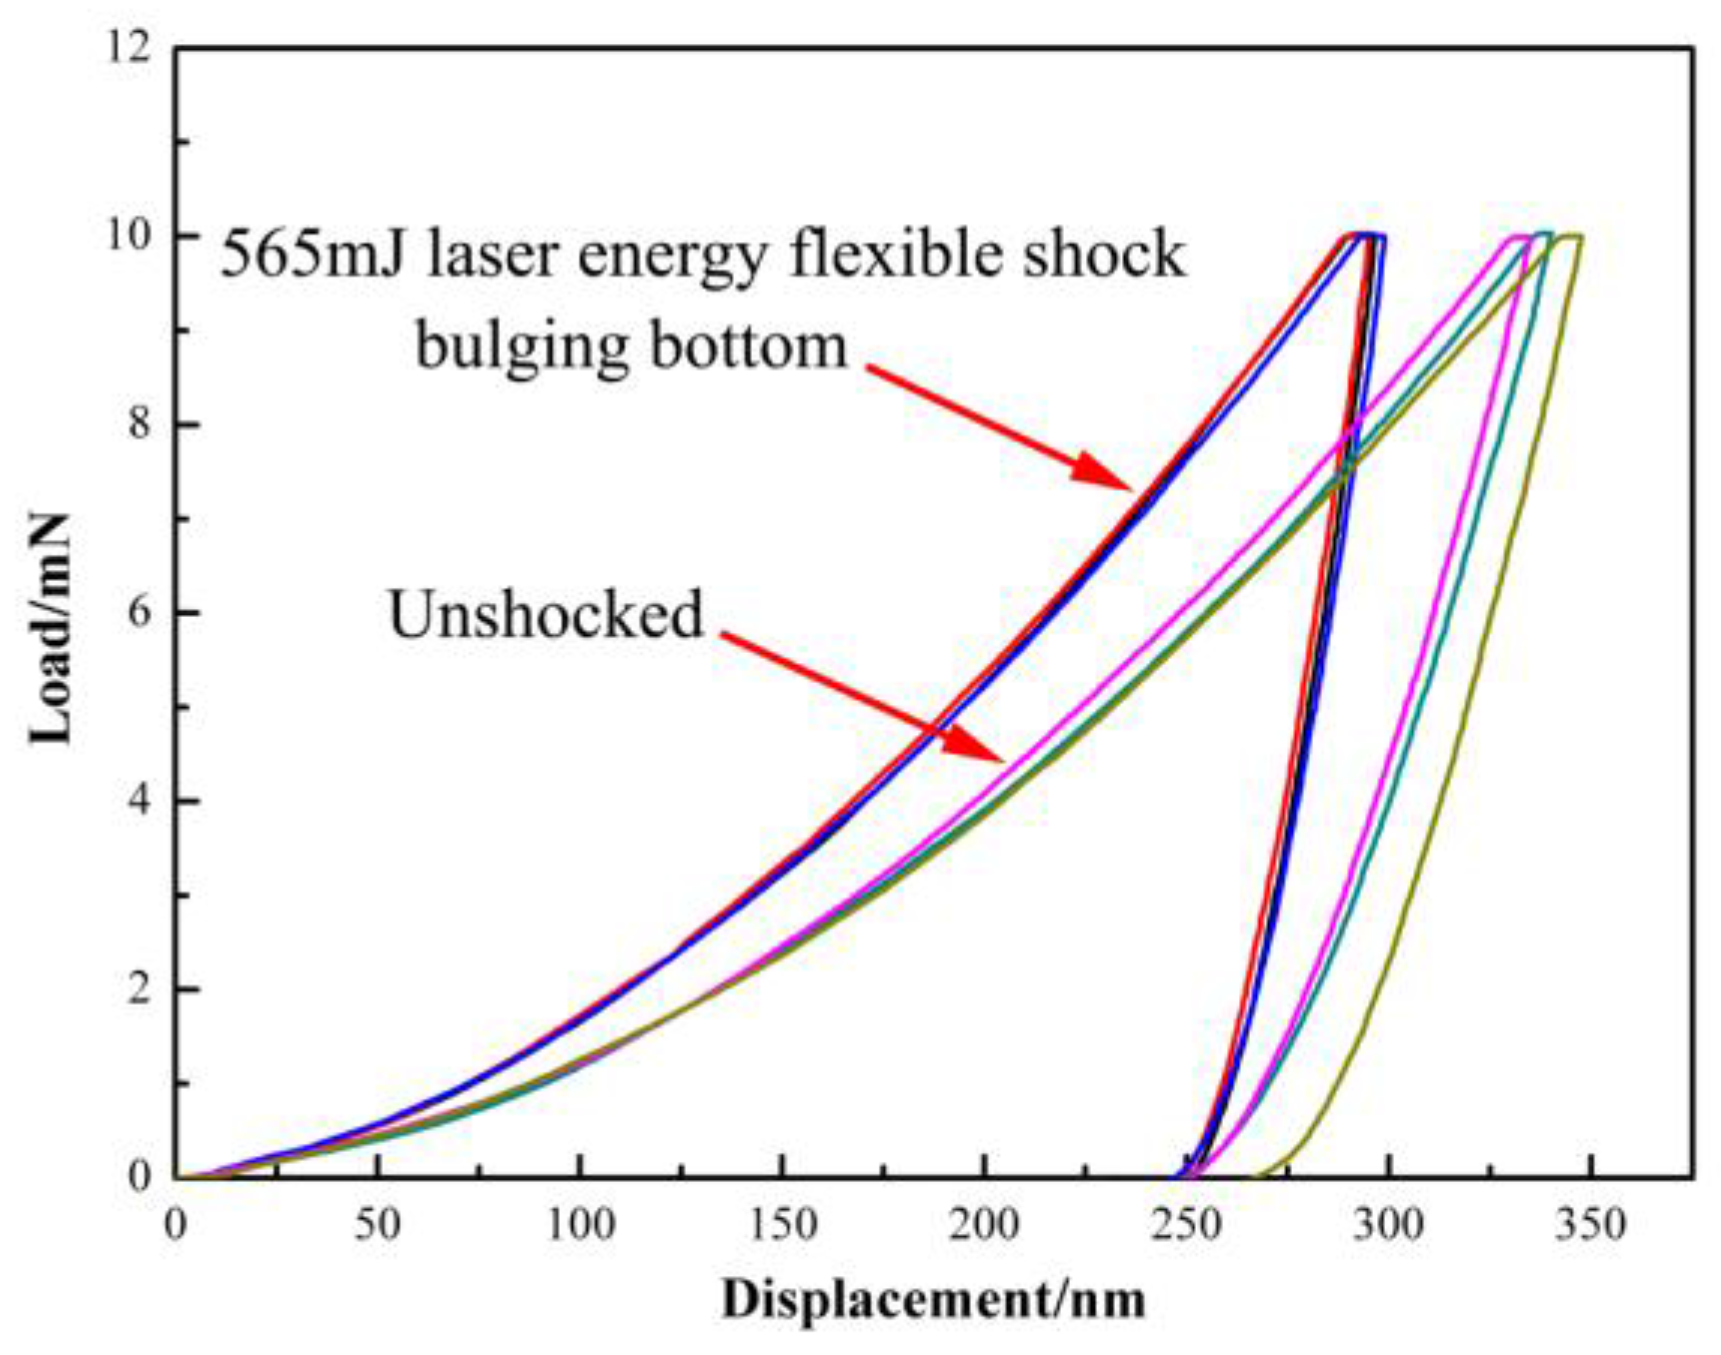
The grains were refined and the nano-hardness of the workpiece in the cross section increased obviously after the laser flexible shock effect.
(4)
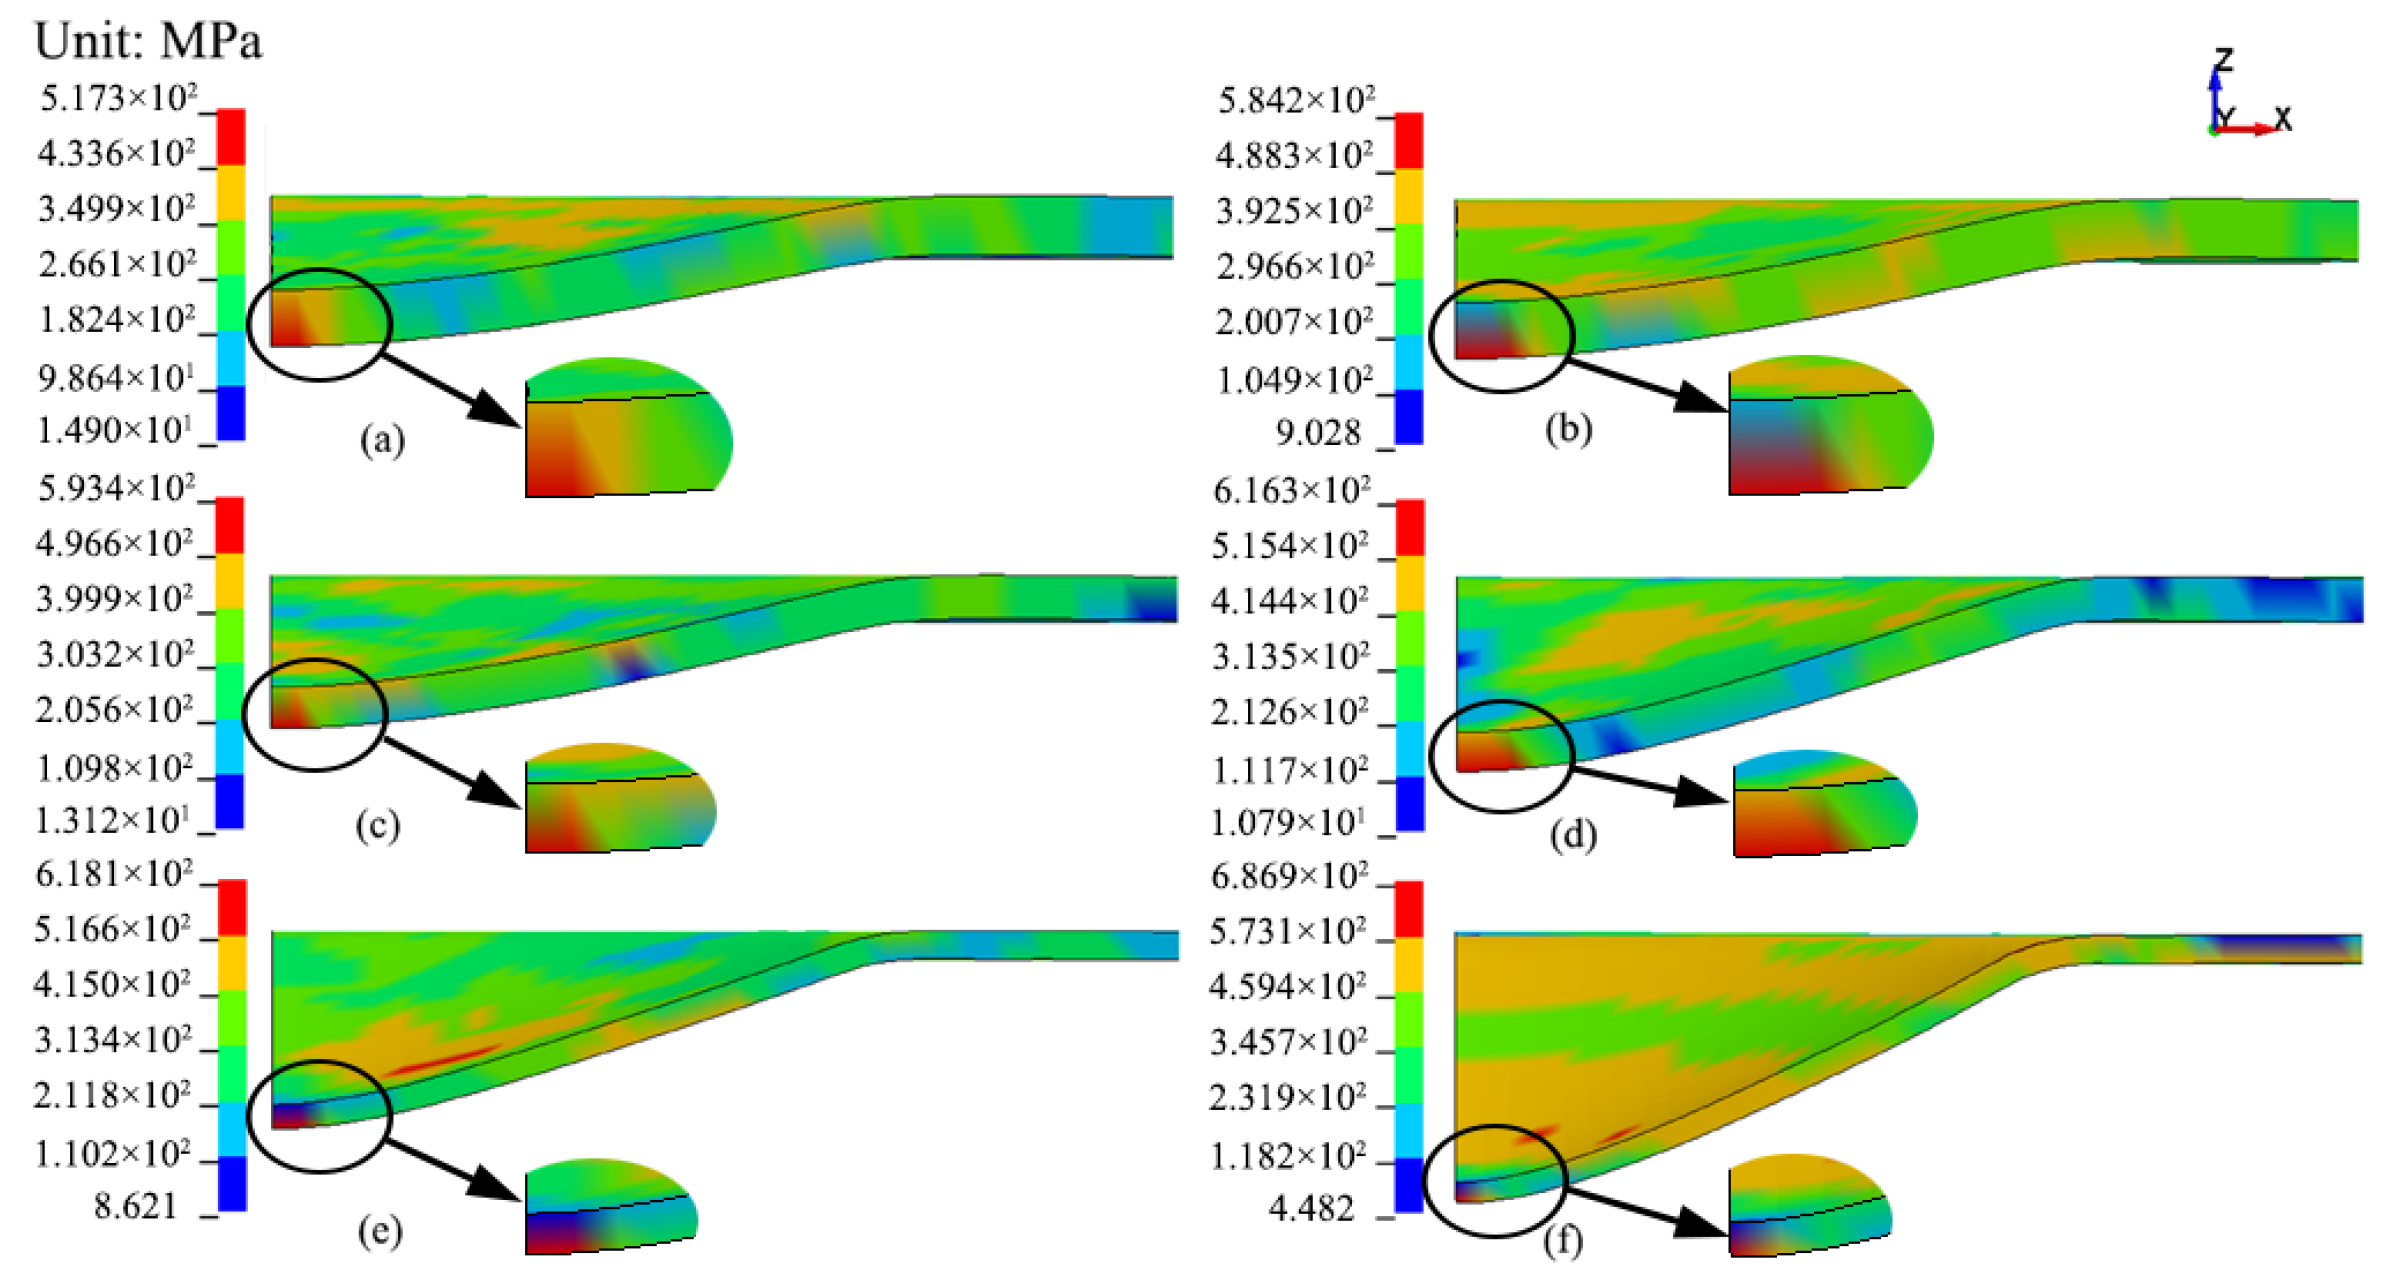
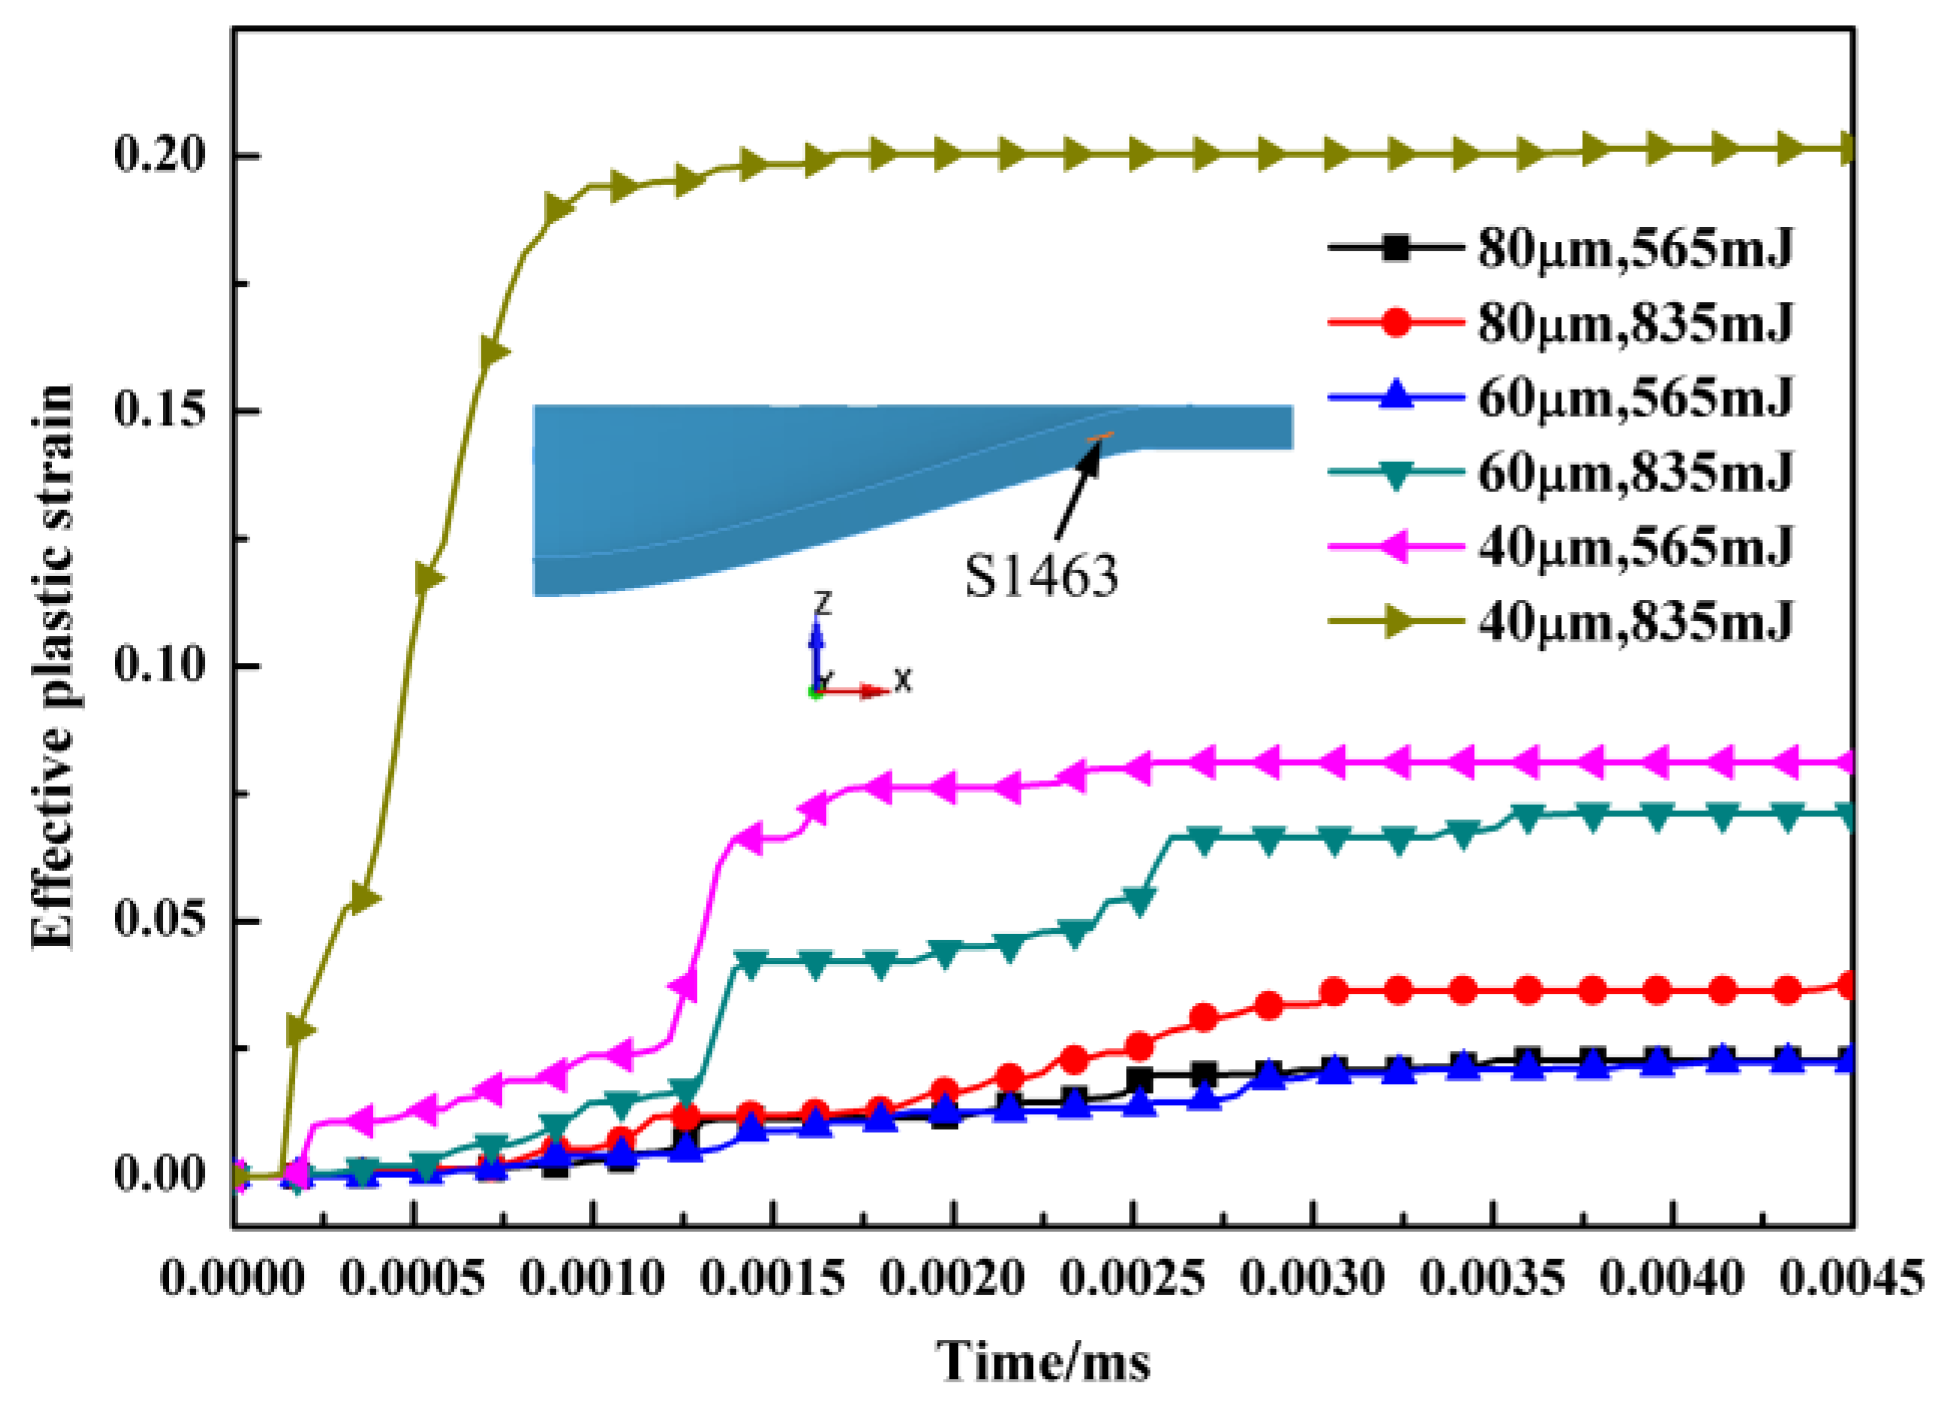
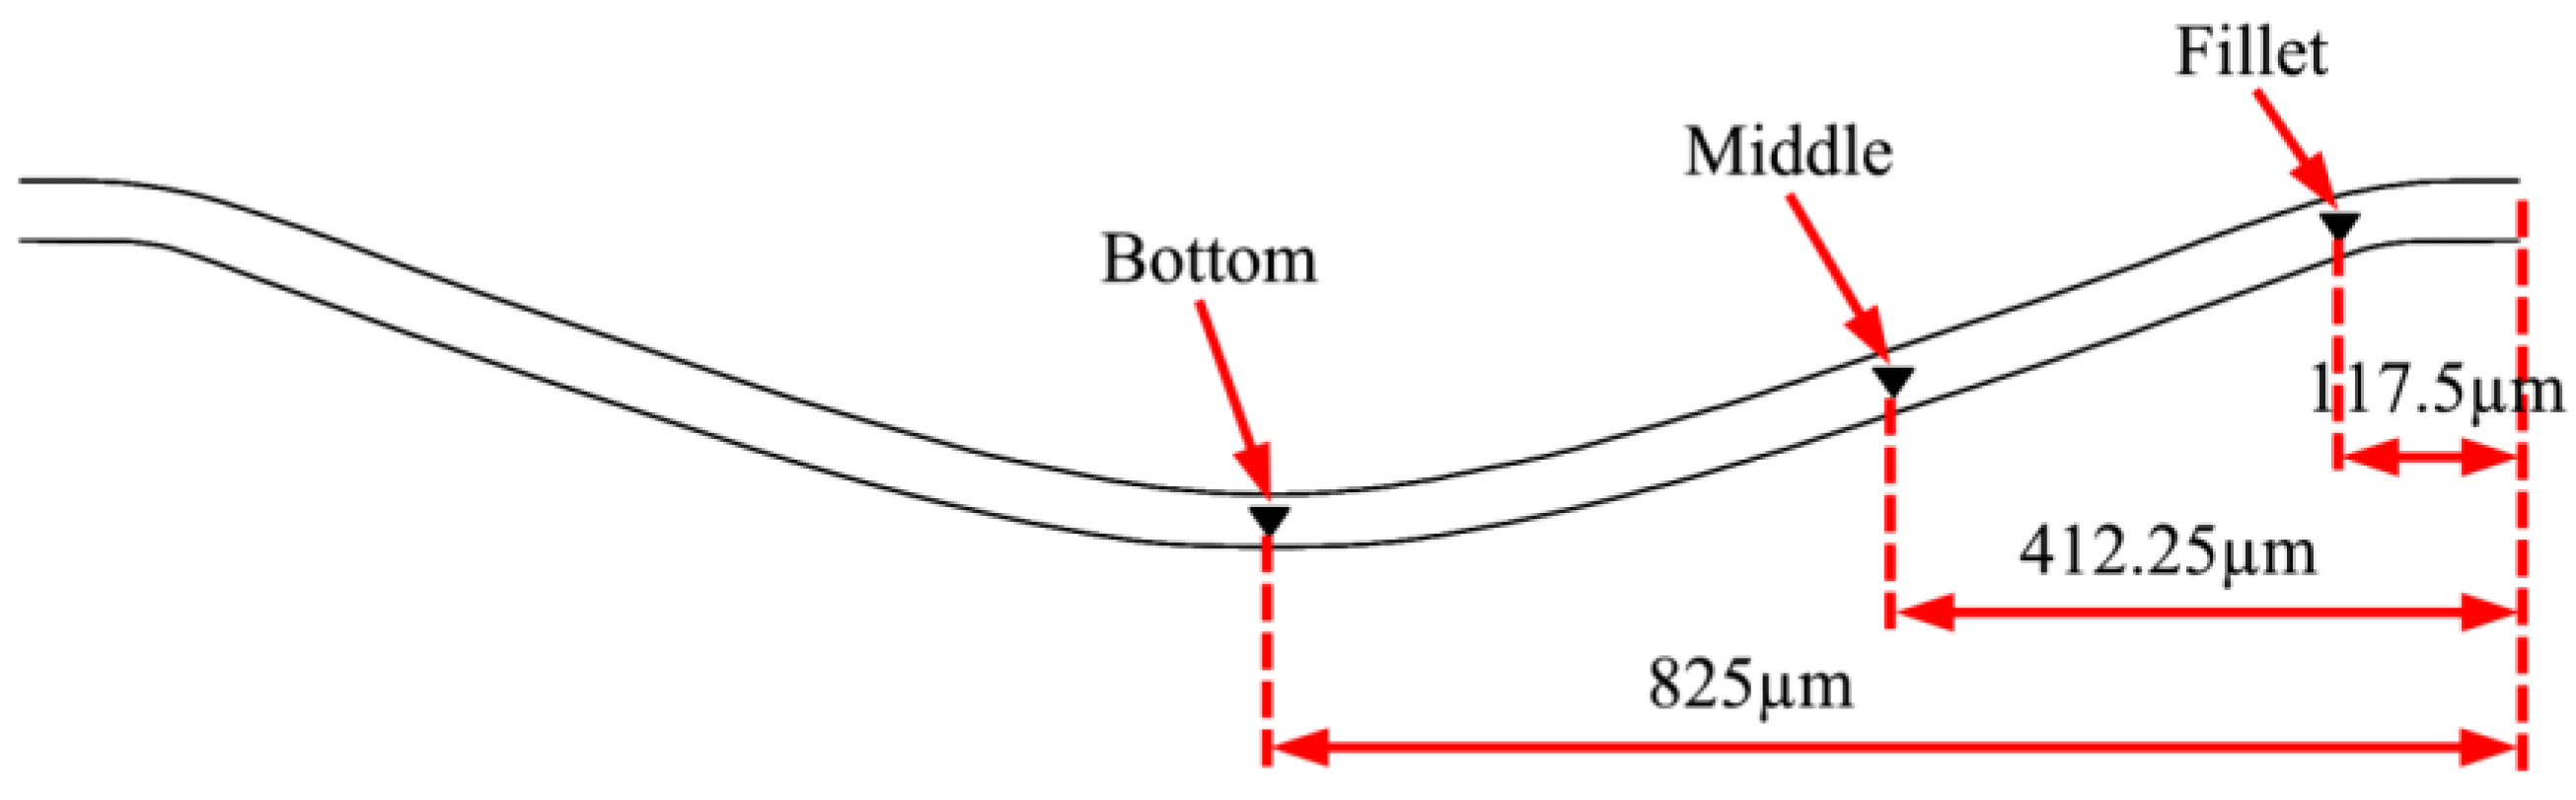
The equivalent stress and plastic strain was concentrated at the bottom of the micro bulging parts. The maximum equivalent stress and plastic strain increased with an increase of the laser energy and a decrease of the workpiece thickness. The variation of the equivalent plastic strain of the elements S1441 and S1463 presented a significantly increasing trend under a thinner workpiece and larger laser energy.

Acknowledgments

This work is supported by the National Natural Science Foundation of China (No. 51675243) and (No. 51175235), and the Natural Science Foundation of Jiangsu Province (No. BK20151343).

Author Contributions

Huixia Liu, Xianqing Sun, and Xiao Wang conceived and designed the experiments; Zongbao Shen and Liyin Li performed the experiments; Chaofei Sha, Youjuan Ma, and Jenn-Terng Gau analyzed the data; Huixia Liu, Xianqing Sun, and Xiao Wang wrote the paper.

Conflicts of Interest

The authors declare no conflict of interest.

References

  1. Geiger, M.; Kleiner, M. Microforming. CIRP Ann. Manuf. Technol. 2001, 50, 445–462. [Google Scholar] [CrossRef]
  2. Joo, B.Y.; Oh, S.I. Forming of Micro Channels with Ultra Thin Metal Foils. CIRP Ann. Manuf. Technol. 2004, 53, 243–246. [Google Scholar] [CrossRef]
  3. Gau, J.T.; Principe, C. Springback behavior of brass in micro sheet forming. J. Mater. Process. Technol. 2007, 191, 7–10. [Google Scholar] [CrossRef]
  4. Fu, M.W.; Yang, B. Experimental and simulation studies of micro blanking and deep drawing compound process using copper sheet. J. Mater. Process. Technol. 2013, 213, 101–110. [Google Scholar] [CrossRef]
  5. Peng, L.F.; Hu, P. Investigation of micro/meso sheet soft punch stamping process—Simulation and experiments. Mater. Des. 2009, 30, 783–790. [Google Scholar] [CrossRef]
  6. Irthiea, I.K.; Green, G. Evaluation of micro deep drawing technique using soft die-simulation and experiments. Int. J. Adv. Manuf. Technol. 2017, 89, 2363–2374. [Google Scholar] [CrossRef]
  7. Wang, X.; Qian, Q. Numerical simulation of flexible micro-bending processes with consideration of grain structure. Comput. Mater. Sci. 2015, 110, 134–143. [Google Scholar] [CrossRef]
  8. Gao, Y.K. Improvement of fatigue property in 7050–T7451 aluminum alloy by laser peening and shot peening. Mater. Sci. Eng. A 2011, 528, 3823–3828. [Google Scholar] [CrossRef]
  9. López de Lacalle, L.N.; Lamikiz, A. The effect of ball burnishing on heat-treated steel and Inconel 718 milled surfaces. Int. J. Adv. Manuf. Technol. 2007, 32, 958–968. [Google Scholar] [CrossRef]
  10. Avilés, R.; Albizuri, J. Influence of laser polishing in an inert atmosphere on the high cycle fatigue strength of AISI 1045 steel. Int. J. Fatigue 2014, 68, 67–79. [Google Scholar] [CrossRef]
  11. Martínez, S.; Lamikiz, A. Analysis of the regimes in the scanner-based laser hardening process. Opt. Lasers Eng. 2017, 90, 72–80. [Google Scholar] [CrossRef]
  12. Tabernero, I.; Lamikiz, A. Numerical simulation and experimental validation of powder flux distribution in coaxial laser cladding. J. Mater. Process. Technol. 2010, 210, 2125–2134. [Google Scholar] [CrossRef]
  13. Niehoff, S.H.; Hu, Z.Y. Mechanical and Laser Micro Deep Drawing. Key Eng. Mater. 2007, 344, 799–806. [Google Scholar] [CrossRef]
  14. Zhou, M.; Huang, T. The novel nanosecond laser micro-manufacturing of three-dimensional metallic structures. Appl. Phys. A 2008, 90, 293–297. [Google Scholar] [CrossRef]
  15. Ocaña, J.L.; Morales, M. Laser shock microforming of thin metal sheets. Appl. Surf. Sci. 2009, 255, 5633–5636. [Google Scholar] [CrossRef] [Green Version]
  16. Gao, H.; Cheng, G.J. Laser-Induced High-Strain-Rate Superplastic 3-D Microforming of Metallic Thin Films. J. Microelectromech. Syst. 2010, 19, 273–281. [Google Scholar] [CrossRef]
  17. Zheng, C.; Sun, S. Numerical simulation and experimentation of micro scale laser bulge forming. Int. J. Mach. Tools Manuf. 2010, 50, 1048–1056. [Google Scholar] [CrossRef]
  18. Wang, X.; Zhang, D. Micro scale laser shock forming of pure copper and titanium sheet with forming/blanking compound die. Opt. Lasers Eng. 2015, 67, 83–93. [Google Scholar] [CrossRef]
  19. Nagarajan, B.; Castagne, S. Mold-free fabrication of 3D microfeatures using laser-induced shock pressure. Appl. Surf. Sci. 2013, 268, 529–534. [Google Scholar] [CrossRef]
  20. Zhang, D.; Lin, Y. A mold-free laser shock micro-drawing forming process using Plasticine as the flexible support. Int. J. Adv. Manuf. Technol. 2015, 79, 265–272. [Google Scholar] [CrossRef]
  21. Wang, X.; Du, D. Investigation of microscale laser dynamic flexible forming process—Simulation and experiments. Int. J. Mach. Tools Manuf. 2013, 67, 8–17. [Google Scholar] [CrossRef]
  22. Liu, H.X.; Li, J.W. Experimental and Numerical Simulation Research on Micro-Gears Fabrication by Laser Shock Punching Process. Micromachines 2015, 6, 969–983. [Google Scholar] [CrossRef]
  23. Zheng, C.; Ji, Z. Variation of fracture mode in micro-scale laser shock punching. Opt. Laser Technol. 2015, 72, 25–32. [Google Scholar] [CrossRef]
  24. Fabbro, R.; Fournier, J. Physical study of laser-produced plasma in confined geometry. J. Appl. Phys. 1990, 68, 775–784. [Google Scholar] [CrossRef]
  25. Zhou, J.Z.; Yang, J.C. Experimental study on the effects of overlay properties on laser-induced shock waves. Chin. J. Lasers 2002, 11, 1041–1044. [Google Scholar]
  26. Johnson, G.R.; Cook, W.H. A constitutive model and data for metals subjected to large strains, high strain rates and high temperatures. In Proceedings of the 7th International Symposium on Ballistics, The Hague, The Netherlands, 19–21 April 1983; pp. 541–547.
  27. Dirikolu, M.H.; Akdemir, E. Computer aided modelling of flexible forming process. J. Mater. Process. Technol. 2004, 148, 376–381. [Google Scholar] [CrossRef]
  28. Peyre, P.; Fabbro, R. Laser shock processing: A review of the physics and applications. Opt. Quantum Electron. 1995, 27, 1213–1229. [Google Scholar]
  29. Zhou, J.Z.; Ni, M.X. Theoretical investigation and finite element simulation of laser peen forming of metal plate. Chin. J. Lasers 2007, 34, 288–294. [Google Scholar]
  30. Wang, H.J.; Liu, H.X. Numerical simulations of the spall damage of the target material induced by laser driven flyer impacting. Adv. Mater. Res. 2011, 156–157, 1305–1312. [Google Scholar] [CrossRef]
  31. Geiger, M.; Vollertsen, F. Fundamentals on the Manufacturing of Sheet Metal Microparts. CIRP Ann. Manuf. Technol. 1996, 45, 277–282. [Google Scholar] [CrossRef]
  32. Cheng, G.J.; Pirzada, D. Microstructure and mechanical property characterizations of metal foil after microscale laser dynamic forming. J. Appl. Phys. 2007, 101, 063108. [Google Scholar] [CrossRef]
  33. Oliver, W.C.; Pharr, G.M. An improved technique for determining hardness and elastic modulus using load and displacement sensing indentation experiments. J. Mater. Res. 1992, 7, 1564–1583. [Google Scholar] [CrossRef]
Figure 1. (a) The formation system of laser flexible shock micro-bulging; (b) experimental principal of laser flexible shock micro-bulging.
Metals 07 00093 g001
Figure 2. (a) Top view of the micro-die; (b) cross-sectional diagram of the micro-die.
Metals 07 00093 g002
Figure 3. (a) The temporal distribution of the shock wave pressure; (b) the spatial distribution of the shock wave pressure.
Metals 07 00093 g003
Figure 4. (a) The 1/4 finite element model of laser flexible shock micro-bulging; (b) micro bulging part.
Metals 07 00093 g004
Figure 5. The surface morphology of micro bulging parts under different conditions: (a) 60 µm, 565 mJ (b) 60 µm, 835 mJ (c) 40 µm, 565 mJ (d) 40 µm, 835 mJ.
Metals 07 00093 g005
Figure 6. Deformation shape of silicone rubber under different conditions in the numerical simulation: (a) 80 µm, 565 mJ (b) 60 µm, 565 mJ (c) 40 µm, 565 mJ.
Metals 07 00093 g006
Figure 7. The bottom surface feature of the micro bulging parts under different conditions: (a) 60 µm, 565 mJ (b) 60 µm, 835 mJ (c) 40 µm, 565 mJ (d) 40 µm, 835 mJ.
Metals 07 00093 g007
Figure 8. The depth of the micro bulging parts (a) experimental results (b) simulation results.
Metals 07 00093 g008
Figure 9. The experimental results of the thickness thinning rate of the micro bulging parts.
Metals 07 00093 g009
Figure 10. The deformation process of a workpiece in the simulation, (a) starting phase (b) bending phase (c) stretching phase.
Metals 07 00093 g010
Figure 11. The thickness thinning rate distribution of the micro bulging parts in the simulation.
Metals 07 00093 g011
Figure 12. The location of nanoindentation test points.
Metals 07 00093 g012
Figure 13. The nanoindentation load-displacement curve of 304 stainless steel foil with 40 µm before and after laser flexible shock.
Metals 07 00093 g013
Figure 14. The hardness distribution of the cross section of the micro bulging parts.
Metals 07 00093 g014
Figure 15. (a) TEM image showing subgrains of the bottom area after laser flexible shock; (b) the electron diffraction of the corresponding selected area.
Metals 07 00093 g015
Figure 16. The equivalent stress distribution of micro bulging parts under different conditions: (a) 80 µm, 565 mJ (b) 80 µm, 835 mJ (c) 60 µm, 565 mJ (d) 60 µm, 835 mJ (e) 40 µm, 565 mJ (f) 40 µm, 835 mJ.
Metals 07 00093 g016
Figure 17. The equivalent plastic strain distribution of the micro bulging parts under different conditions: (a) 80 µm, 565 mJ (b) 80 µm, 835 mJ (c) 60 µm, 565 mJ (d) 60 µm, 835 mJ (e) 40 µm, 565 mJ (f) 40 µm, 835 mJ.
Metals 07 00093 g017
Figure 18. The variation of the equivalent plastic strain of element S1441.
Metals 07 00093 g018
Figure 19. The variation of the equivalent plastic strain of element S1463.
Metals 07 00093 g019
Table 1. The design dimensions and actual dimensions of the micro-die.
ParameterDesign Dimensions/mmActual Dimensions/mmError/%
Diameter/d1.21.181.67
Fillet radius/r0.240.2352.08
Table 2. The technical parameters of the Spitlight 2000 Nd:YAG Laser.
Technical ParametersValue
Single pulse energy80–2000 mJ
Pulse width8 ns
Wave length1064 nm
Energy stability<±1%
Exit spot diameter9 mm
Table 3. The experimental parameters of laser flexible shock micro-bulging.
ParameterValue
Laser energy/mJ565, 835
304 stainless steel foil/µm40, 60
Spot diameter/mm2
PMMA/mm3
Silicone rubber/mm0.5
Blank holder force/N12
Table 4. Johnson-Cook model parameters of 304 stainless steel foils.
MaterialA (MPa)B (MPa)Cnε0 (s1)
304 stainless steel foil3502750.0220.361
Table 5. Mechanical properties of the silicon rubber material.
MaterialHardness Shore A (°)M-R Constant C10 (MPa)M-R Constant C01 (MPa)Poisson’s Ratio (v)
Silicone rubber700.7360.1840.49997

