Article

Impact of the Solidification Rate on the Chemical Composition of Frozen Cryolite Bath

by
Sándor Poncsák
1,*,
László I. Kiss
1,
Sébastien Guérard
2 and
Jean-François Bilodeau
2
1
Applied Sciences Department, Université du Québec à Chicoutimi, Chicoutimi, QC G7H 2B1, Canada
2
Arvida Research Center, Rio Tinto Aluminium, Jonquière, QC G7S 4K8, Canada
*
Author to whom correspondence should be addressed.
Metals 2017, 7(3), 97; https://doi.org/10.3390/met7030097
Submission received: 15 December 2016 / Revised: 6 March 2017 / Accepted: 10 March 2017 / Published: 16 March 2017

Abstract

:
Solidification of cryolite (Na3AlF6)-based bath takes place at different rates along the sideledge, and around alumina rafts and new anodes. The solidification rate has a significant impact on the structure and the chemical composition that determine the thermal conductivity and thus the thickness of sideledge, or the duration of the existence of the temporary frozen bath layers in other cases. Unfortunately, samples that can be collected in industrial cells are formed under unknown, spatially and temporally varying conditions. For this reason, frozen bath samples were created under different heat flux conditions in a well-controlled laboratory environment using the so-called cold finger technique. The samples were analyzed by X-ray Diffractometer (XRD) and Scanning Electron Microscope (SEM) in Back Scattering (BS) mode in order to obtain spatial distribution of chemical composition. Results were correlated with structural analysis. XRD confirmed our earlier hypothesis of recrystallization of cryolite to chiolite under medium heat flux regime. Lower α-alumina, and higher γ-alumina content in the samples obtained with very high heating rate suggest that fast cooling reduces α–γ conversion. In accordance with the expectation, SEM-BS revealed significant variation of the Na/Al ratio in the transient sample.

1. Introduction

Solidification of cryolite (Na3AlF6)-based bath takes place with different rates at sideledge, alumina rafts, new anodes or any other cold objects inserted into the molten electrolyte for different operations or measurement campaigns. In the aluminium electrolysis process, pre-beaked carbon anodes are replaced regularly as they are consumed by the electrochemical reaction. The structure of the solidified phase (number of the nucleation sites and pores, the size, the orientation and the structure of the different crystals, the proportion of the amorphous phases), as well as the difference between the chemical compositions of molten and frozen bath depend on the cooling rate or in other words, on the cooling rate. In fact, the cooling rate has a huge impact on the relative velocities of nucleation versus crystal growth [1] and on the probability of the entrapment of liquid pockets by fast growing crystals [1,2]. As the pure cryolite has the highest melting point in the electrolyte mixture [3,4,5], it forms predominantly with some AlF3 containing solution when a slow solidification rate takes place close to equilibrium state. During the formation of pure cryolite crystals, the other elements coming from the additives are repulsed toward the liquid phase. On the other hand, fast solidification can freeze and thus immobilise the system (reducing ion migration), resulting in a spatially more homogeneous solid phase.
The structure and the chemical composition determine the thermal conductivity and thus either the thickness of sideledge or the duration of the existence of temporary frozen bath layers around cold objects.
Some information can be found about the structure and the chemical composition of frozen bath in sideledge [2,3,4,5,6,7,8,9,10] and in the crust [1,11] using samples taken from industrial cells. However, those samples were formed under unknown and varying conditions. To resolve this problem, the authors of this paper created frozen bath samples under different heat flux conditions in a well-controlled laboratory environment in order to study the variation of the chemical composition and structure with the cooling rate. Results about the structure obtained with Scanning Electron Microscope (SEM) with Secondary Electron Imaging (SEI) mode were published earlier [12]. This paper presents chemical composition data correlated with structure, heat flux and solidification rate. The two latter were computed with an in-house developed mathematical model using measured temperature histories as input.

2. Methodology

2.1. Solidified Bath Samples Produced Using Cold Finger Technique

Solidified bath samples were produced in a well-controlled laboratory cell using the so-called cold finger technique. Namely, cold brick-shaped blocks (probes) were inserted into an unstirred synthetic cryolite (Na3AlF6, produced by the company STACA) based molten electrolytic bath with known composition. Molten cryolite is the unique solvent of alumina. Both the composition and the superheat of the bath corresponded to those used in many Rio Tinto Aluminium plants. The quantity of the bath was high enough to avoid any significant perturbation of bulk liquid temperature by the insertion of the probe itself. In the absence of electrolysis, the absorption of heat during the insertion of the probe and the loss toward the environment were compensated by the same heating furnace that melted the bath. Samples were cut from the middle of the large surfaces of the blocks in order to minimize the end effect. On the external surface, there were some easily removable, round shaped, dark colored impurity particles, which were removed and thus not included in the chemical analysis [12].
The solidified bath samples were produced under both transient and near steady-state conditions, including strongly varying (28–2200 kW/m2) and relatively constant, low heat fluxes (28–100 kW/m2) respectively. For brevity, in the following we call the first technique “transient”, the second “steady-state”. Table 1 summarizes the main characteristics of the two scenarios. More details are presented in an earlier published paper [12].
Carbon steel and stainless steel were chosen to build the transient and steady-state probes respectively due to their relatively good mechanical and chemical resistance to high temperature electrolyte while still having an acceptable thermal conductivity compared to the frozen bath. Higher thermal conductivity of ordinary steel was important to increase heat transfer during transient test. On the other hand, the limited oxidation rate of stainless steel was important for the steady-state test due to the extended exposure of inner channels of the probe to circulating air at very high temperature.
Although the steady-state probe was cooled by a constant flow rate and input temperature of the cooling air, there was some temporal variation of the heat flux through the solid wall of the probe due to the initial thickening of the crust freezing around it. However, this variation is very small compared to that can be obtained with the transient probe. In all cases, the temperature histories were measured by N-type thermocouples (pre-selected by calibration), inserted both into the center of the probes and into the bulk of the liquid. For the steady-state probe, different wall thicknesses were tested [12]. Finally, the value shown in Table 1 was chosen as it ensures sufficiently small temperature difference between its two sides without any visible deformation of the probe.

2.2. Mathematical Model of Transient Freeze Formation

A mathematical model of transient freeze formation [12] was used to estimate the heat flux and solidification rate during the freezing of the bath around the transient and steady-state probes as well as to calculate the time necessary to produce the maximal thickness of the crust around the transient probe. Detailed description of the model can be found in the literature [11].

2.3. XRD Analysis

All samples used for X-ray Diffractometry (XRD) analysis were cut into two halves, one including the zones close to the solid wall of the probe (probe side) and other with zones far from this same wall (bath side). The high fragility and the small thickness of the samples (5.1 and 6 mm obtained with steady-state and transient probes respectively) did not permit to make finer division for the crystal structure study. The separated samples were then ground to fine powder and kept dry.
XRD analyses were carried out with a Bruker D8 Discover system (Bruker Co., Karlsruhe, Germany) with CuK-α radiation source (0.154nm) to investigate the crystalline properties. The angle between the incident X-ray beam and detection plane of the refracted beam (2θ) was varied from 5° to 80° using 0.02° steps.

2.4. Chemical Element Mapping

Scanning Electron Microscope (SEM, Neoscope JCM-6000 equipped with Oxford SiLi detector and Inca software, (JEOL Ltd., Tokyo, Japan) with Back Scattered Electron (BSE) mode was used to obtain information about the spatial variation of elementary chemical composition on polished faces cut in the normal direction to the probe-sample contact surface. This way, variations in the successively formed layers can be revealed. Polishing of the surfaces was carried out without using destructive water. The samples were coated by the deposition of an ultra-thin, conducting layer (gold). This can prevent accumulation of static charge and increases the signal to noise ratio. The element mapping of the whole surface was carried out under low vacuum condition. Results were correlated with earlier published observations about crystal topography obtained on the same faces, using secondary electron imaging mode (SEI) (JEOL Ltd., Tokyo, Japan) with SEM (JEOL JSM 6480 LV with EDS Oxford SiLi detector, (JEOL Ltd., Tokyo, Japan) [10].

3. Results and Discussion

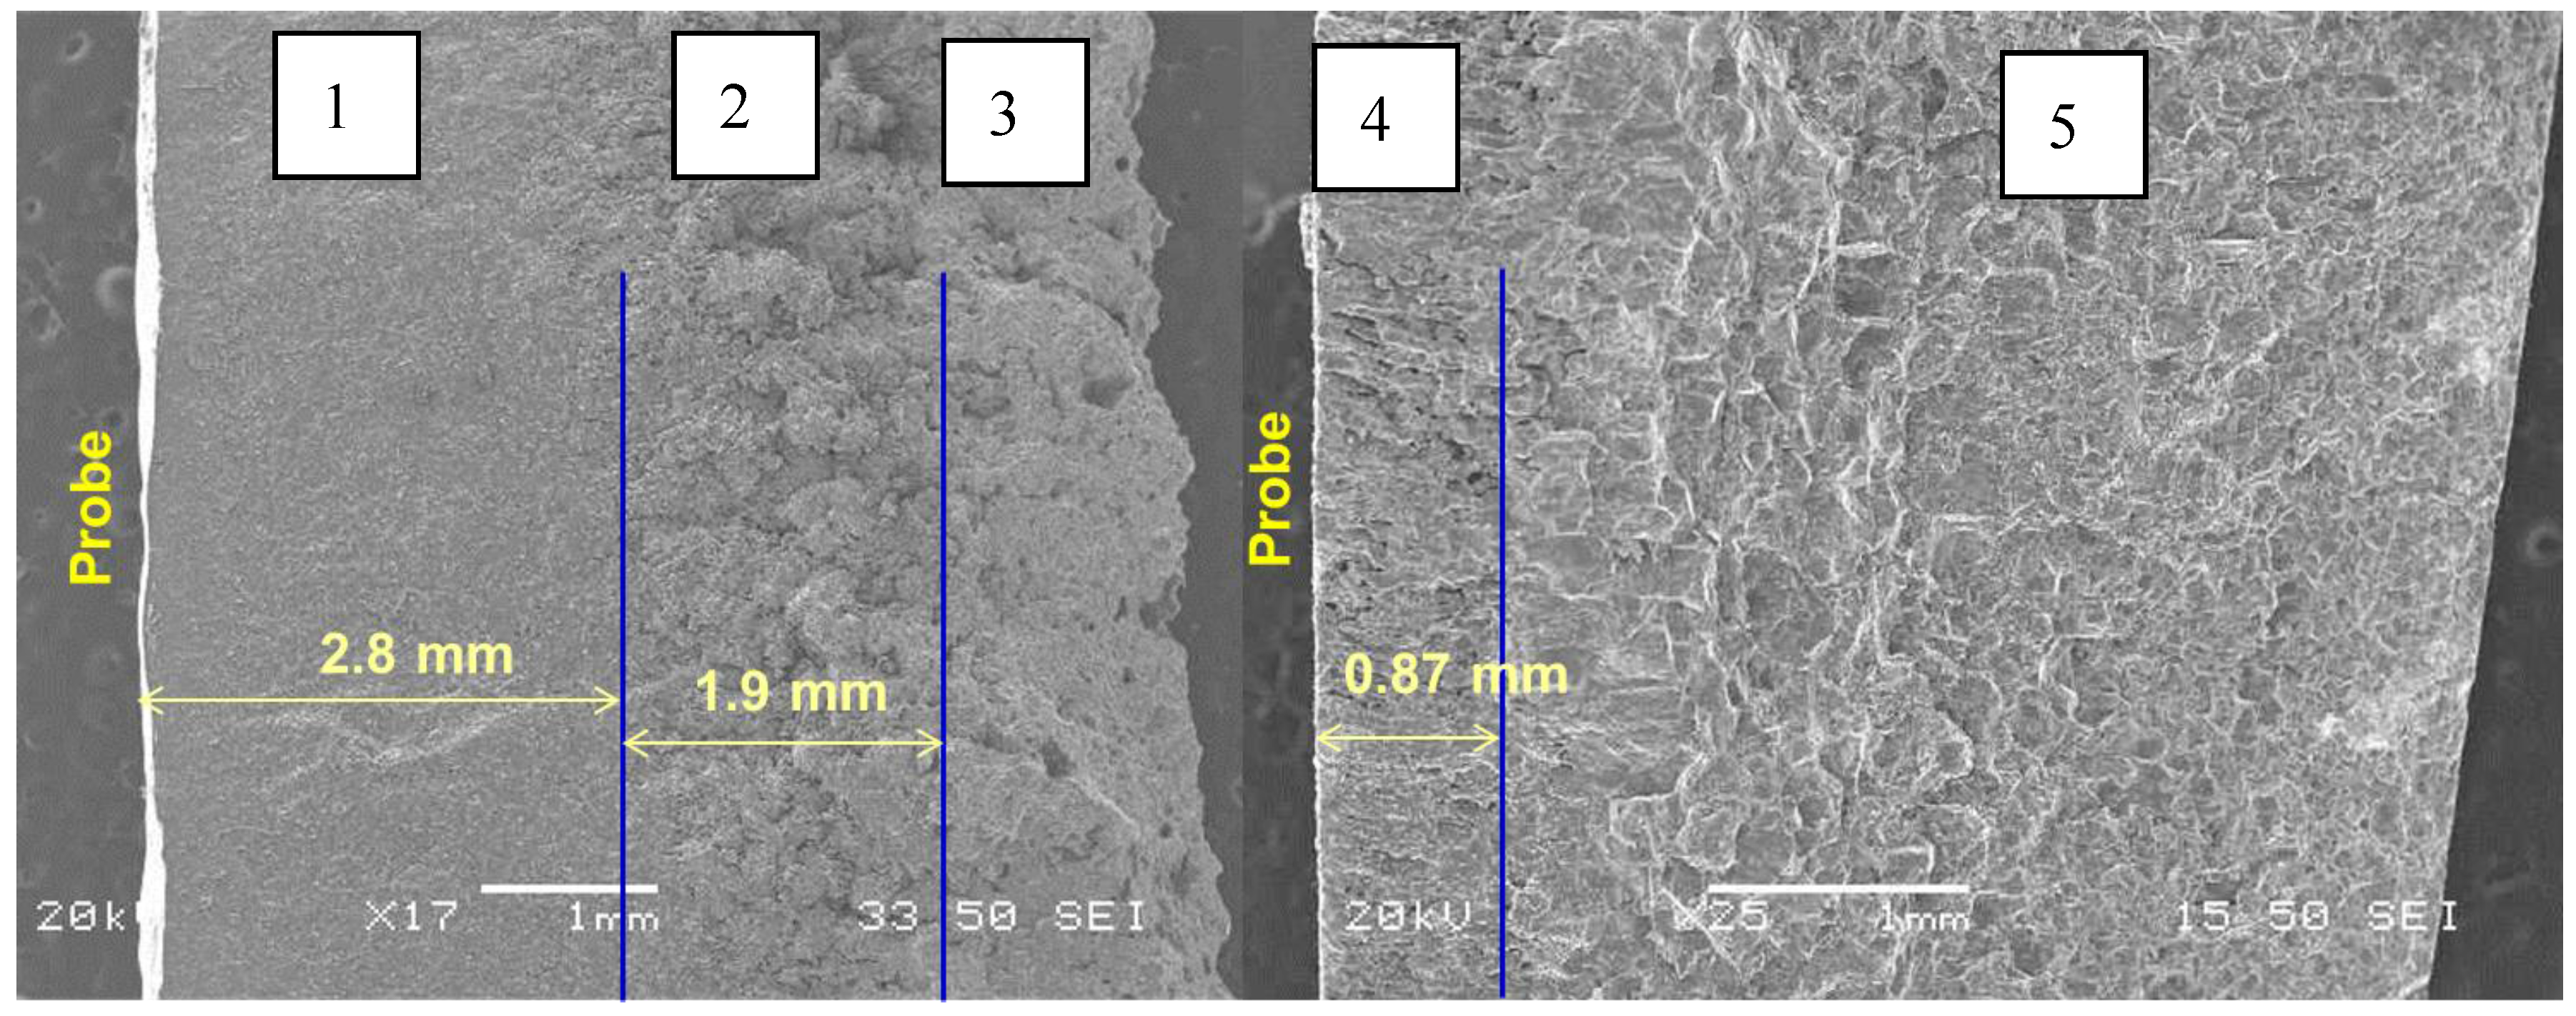
3.1. Identification of Zones with Different Structures

Figure 1 shows the SEM-SEI images of the surfaces of both transient and steady-state samples in a plane perpendicular to the probe-sample contact face. Those images were presented and explained in details in a former article [12]. Whose synopsis will follow in the next section. In accordance with the expectations, the samples produced with the transient probe (strongly varying heat flux and solidification rate with thickness) were much more heterogeneous than those formed with the almost steady-state technique (almost constant heat flux and solidification for the whole thickness). The following different zones could be distinguished:

3.1.1. Sample Obtained with the Transient Probe

1)
Compact, low porosity and relatively hard layer formed with very fast homogeneous nucleation at very high heat flux (110–2200 kW/m2); a large number of microcrystals without any visible orientation (micro-aphanitic structure).
2)
Transition zone between zones 1 and 3 with structure similar to zone 3 but containing even more porosity.
3)
Fragile and porous layer, formed at medium heat flux (60–100 kW/m2) except a very thin layer being longer in direct contact with the bath at the right side; characterized by rounded shaped crystals and exsolution (process through which an initially homogeneous solid solution separates into at least two different crystalline minerals without the addition or removal of any materials). The exsolution is indicated by very small, acne-like outgrowths on the crystal surface [12]. Both morphological features could be the result of long exposure to strongly acidic entrapped liquid pockets (high AlF3 excess). In fact, in the presence of large amounts of AlF3, the cryolite can be recrystallized into chiolite around 750 °C [14]: 5Na3AlF6 + 4AlF3 = 3Na5Al3F14.

3.1.2. Sample Obtained with Steady-State Probe

4)
Thin layer with strong crystal orientation due to the heterogeneous nucleation at the probe surface. It is formed mainly at medium heat flux (50–100 kW/m2). Similarly to zone 3, pores, rounded shaped crystals and exsolution can be observed at a certain distance from the probe surface (beyond the above mentioned very first layers).
5)
Relatively low porosity layer with well-defined straight crystal boundaries, formed at low heat flux (28–50 kW/m2). Such straight boundaries can be formed when the growing crystal is exposed for long time to low acidity bulk liquid.
For the XRD analysis, as mentioned above, the high fragility and the small thickness of the samples did not permit to make a very fine division following the five characteristic zones, presented in Figure 1. Both the transient and steady-state samples were divided into two halves the following way:
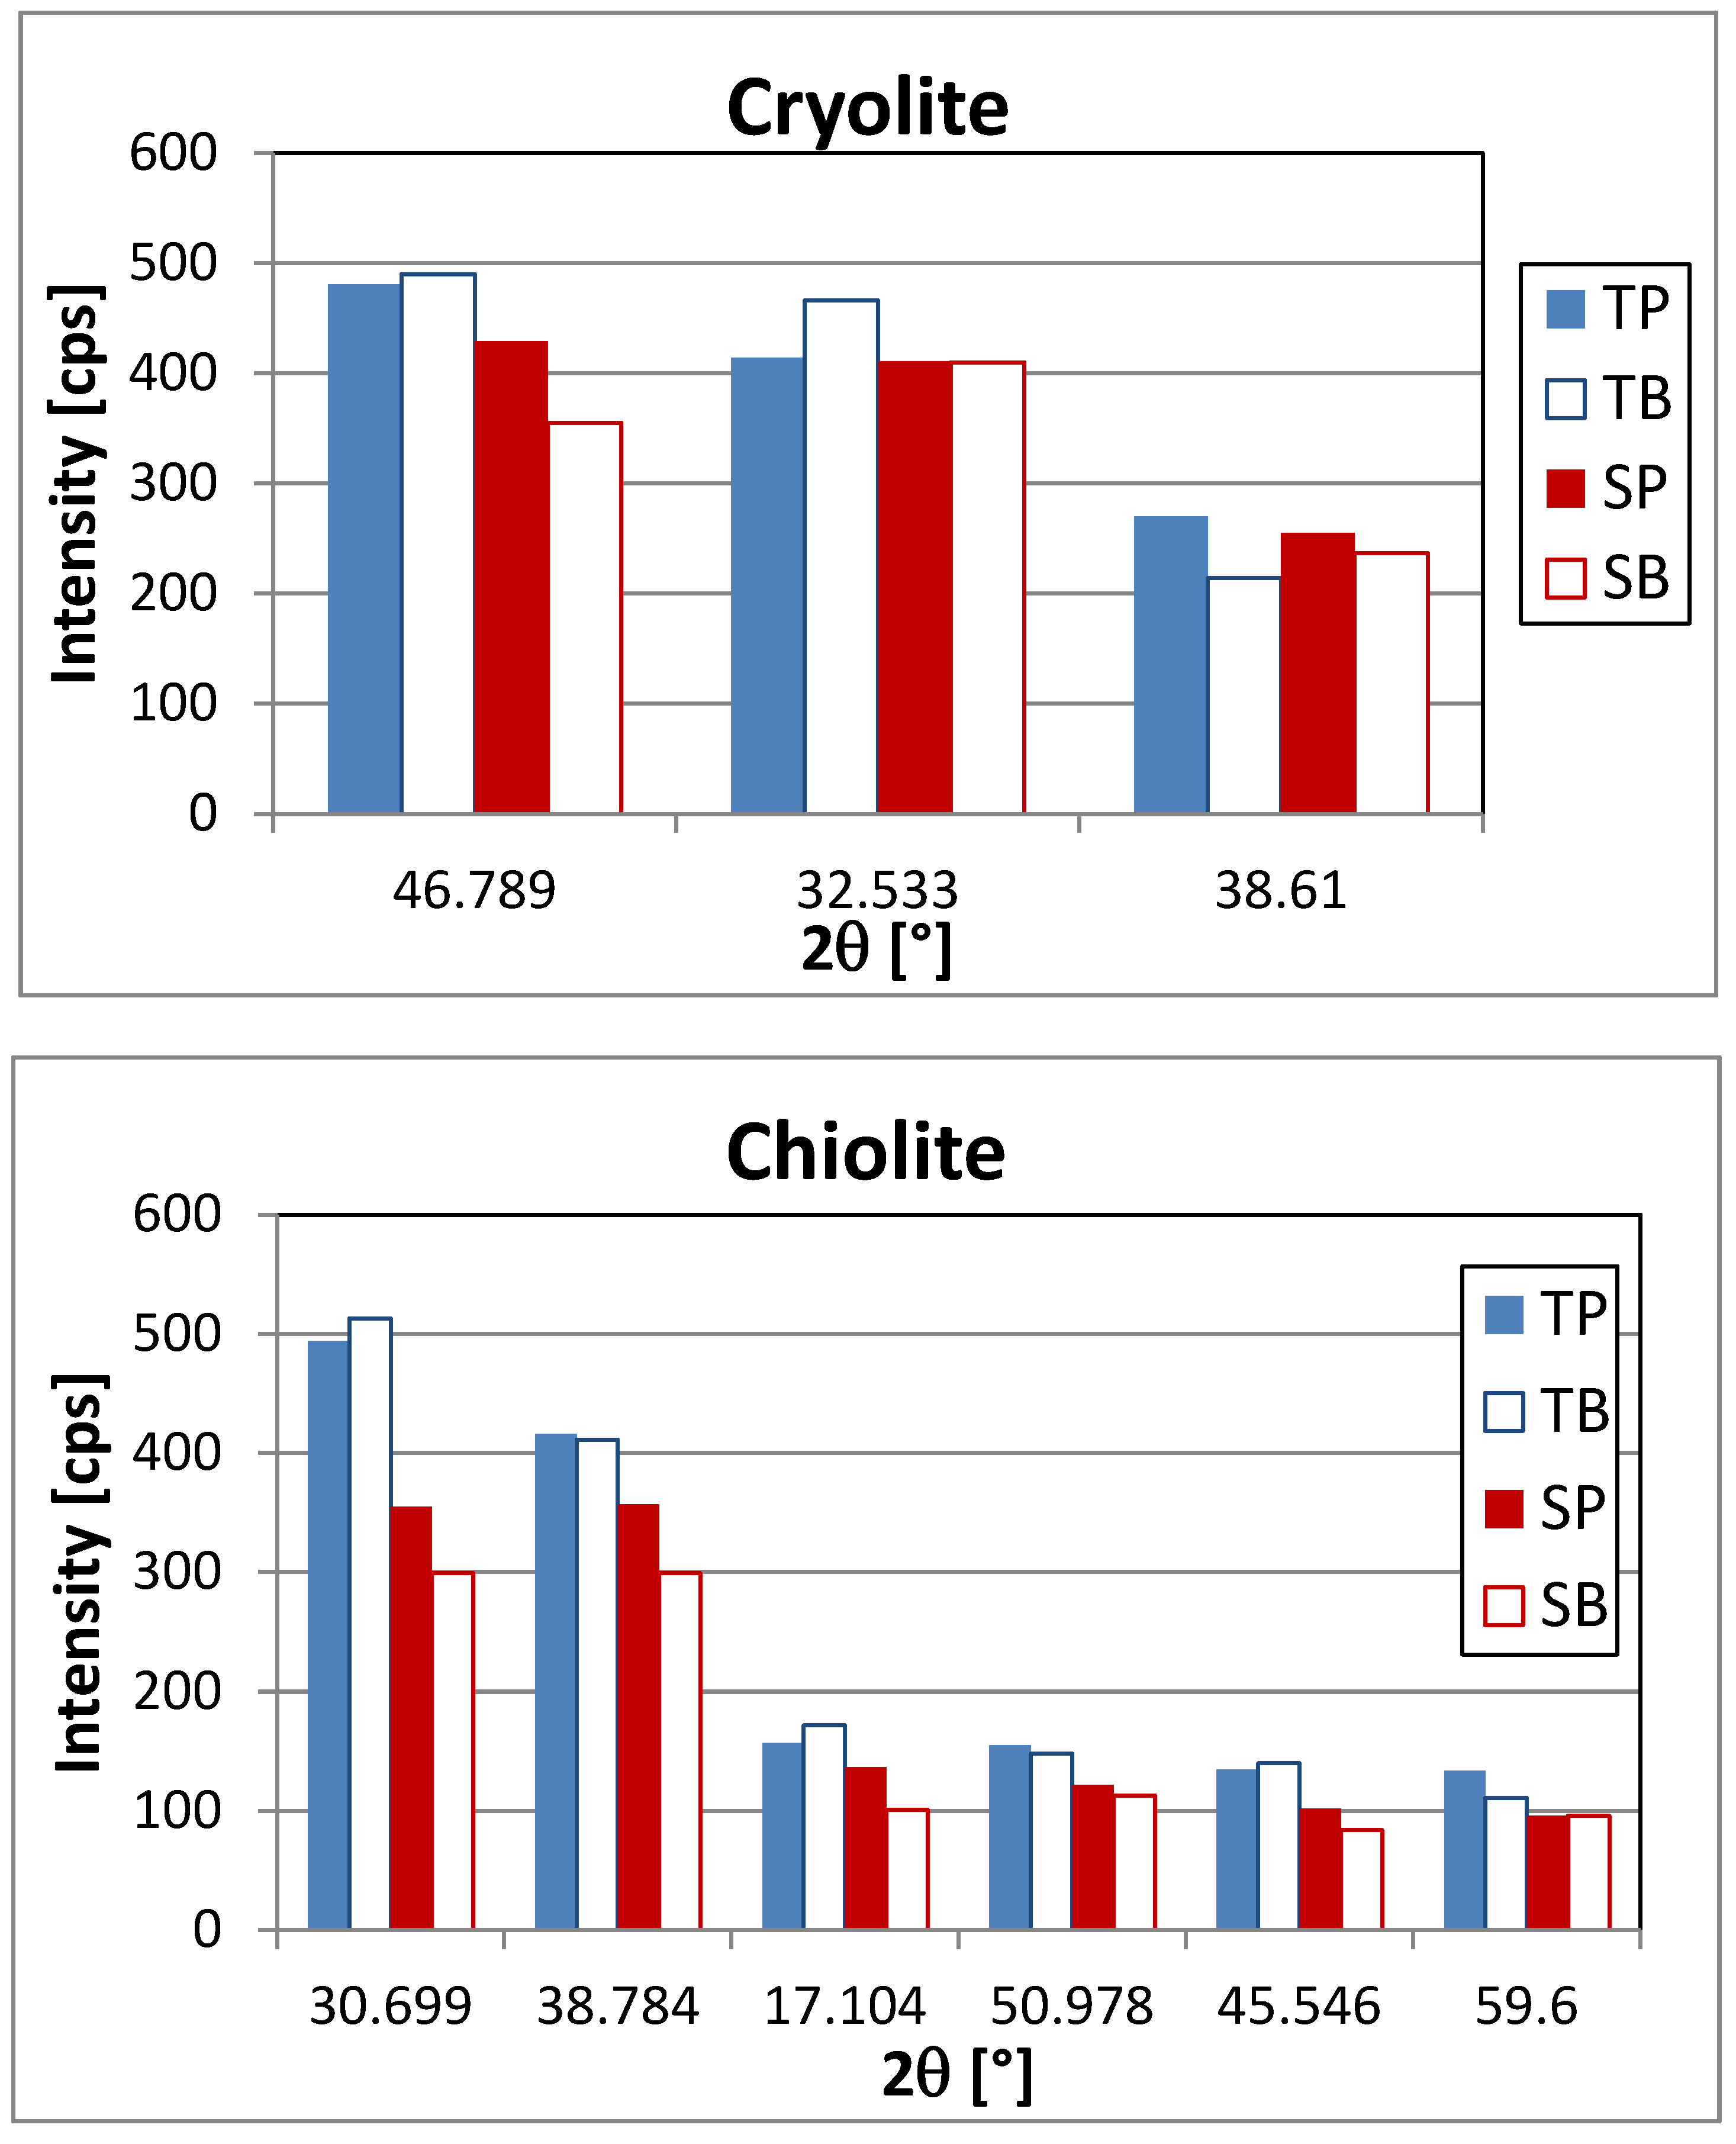
  • The probe side of the transient sample (TP) contained zone 1
  • The bath side of the transient sample (TB) contained zones 2 and 3
  • The probe side of the steady-state sample (SP) contained zone 4 and a smaller portion of the zone 5 close to probe
  • The bath side of the steady-state sample (SB) contained the bigger portion of the zone 5 which is close to the bath
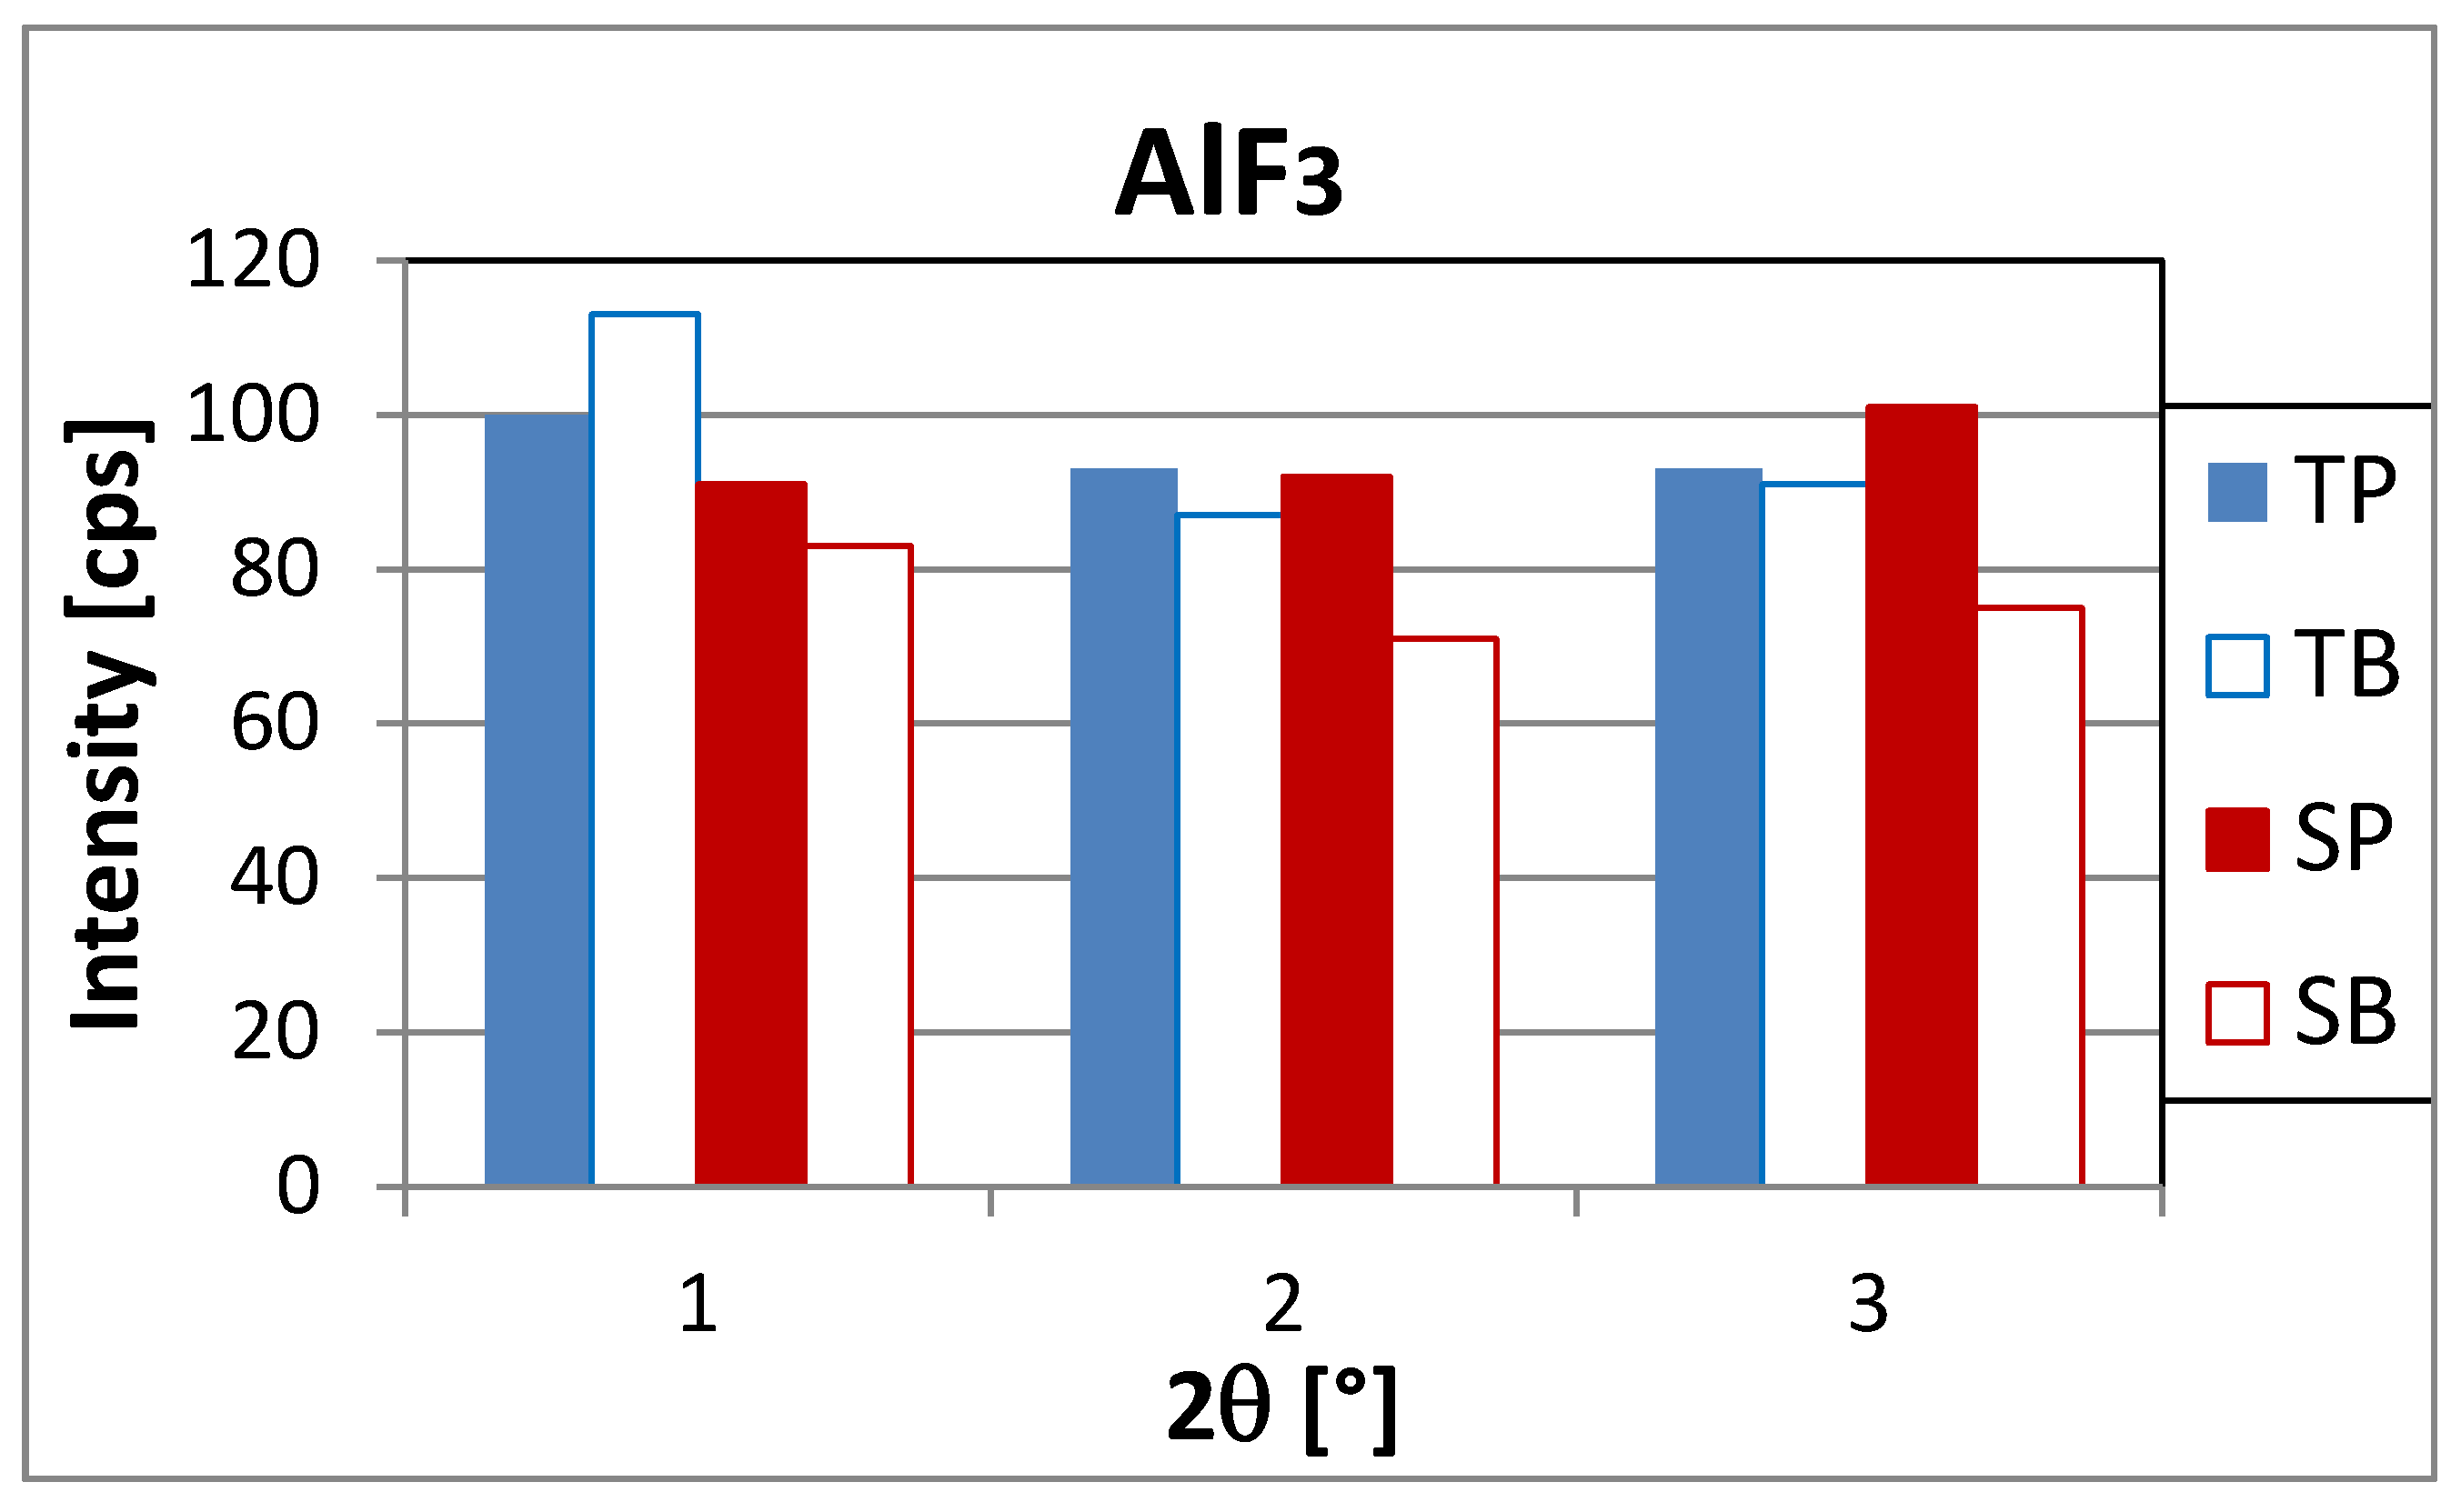
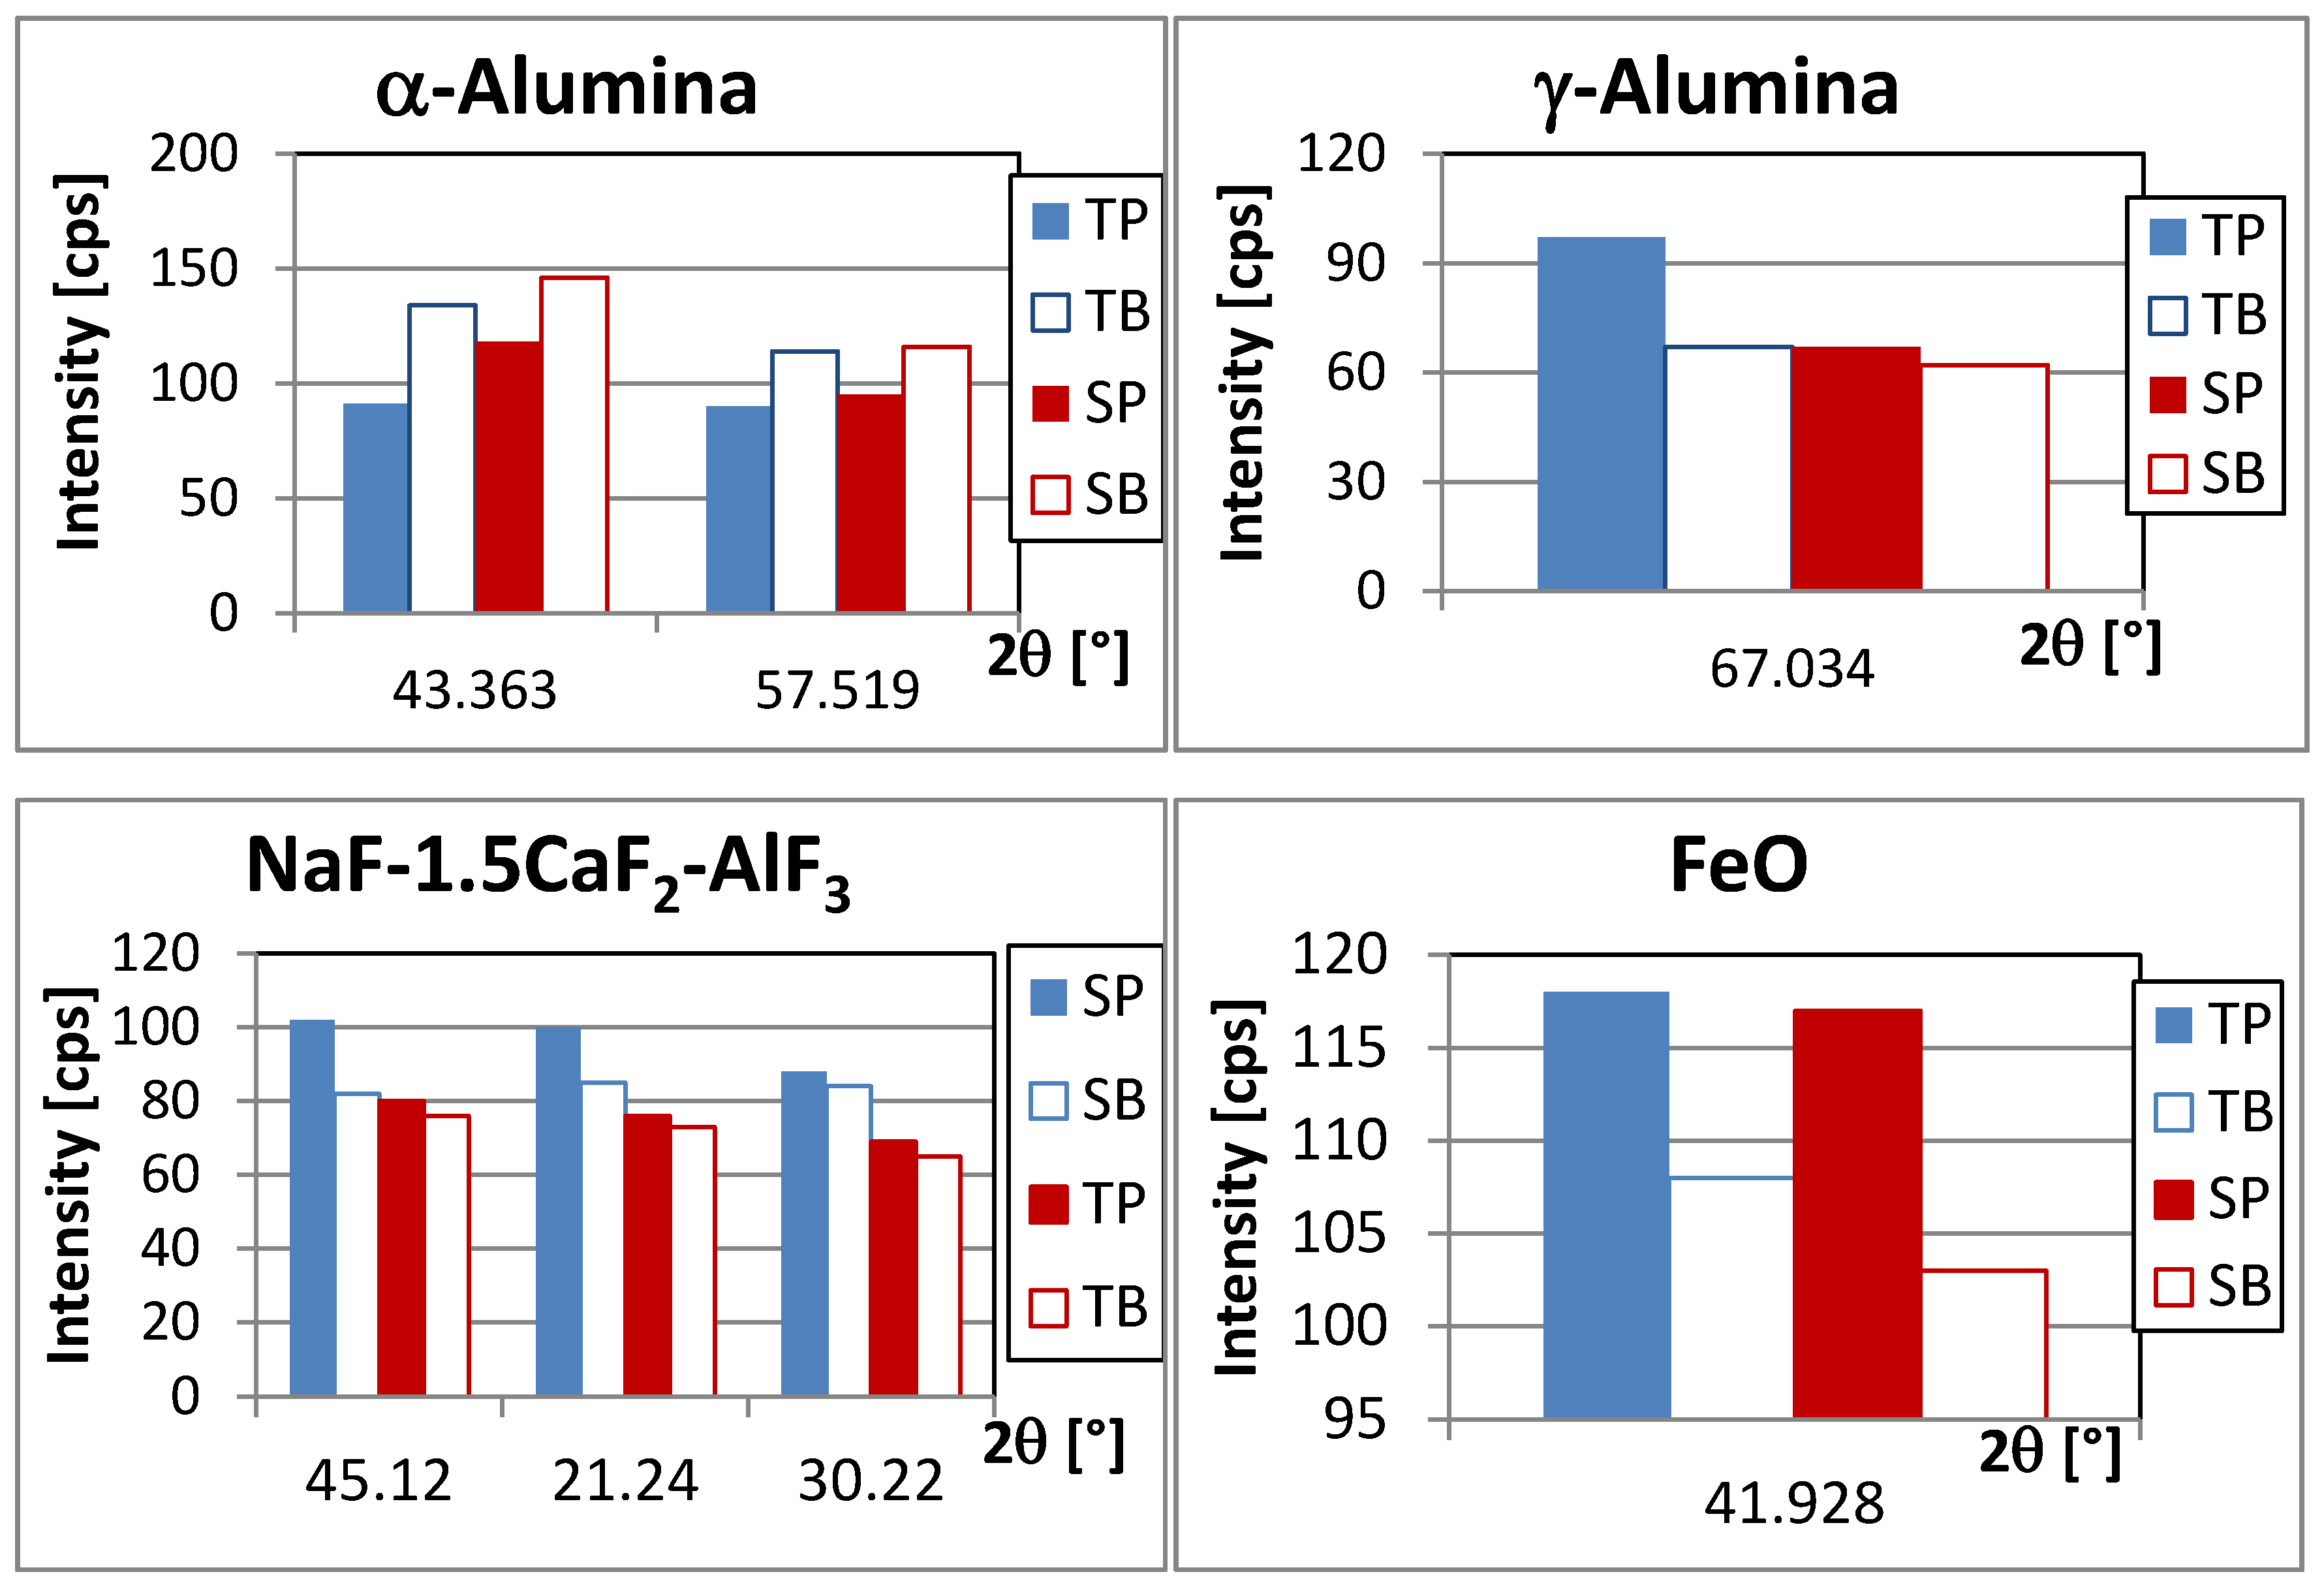
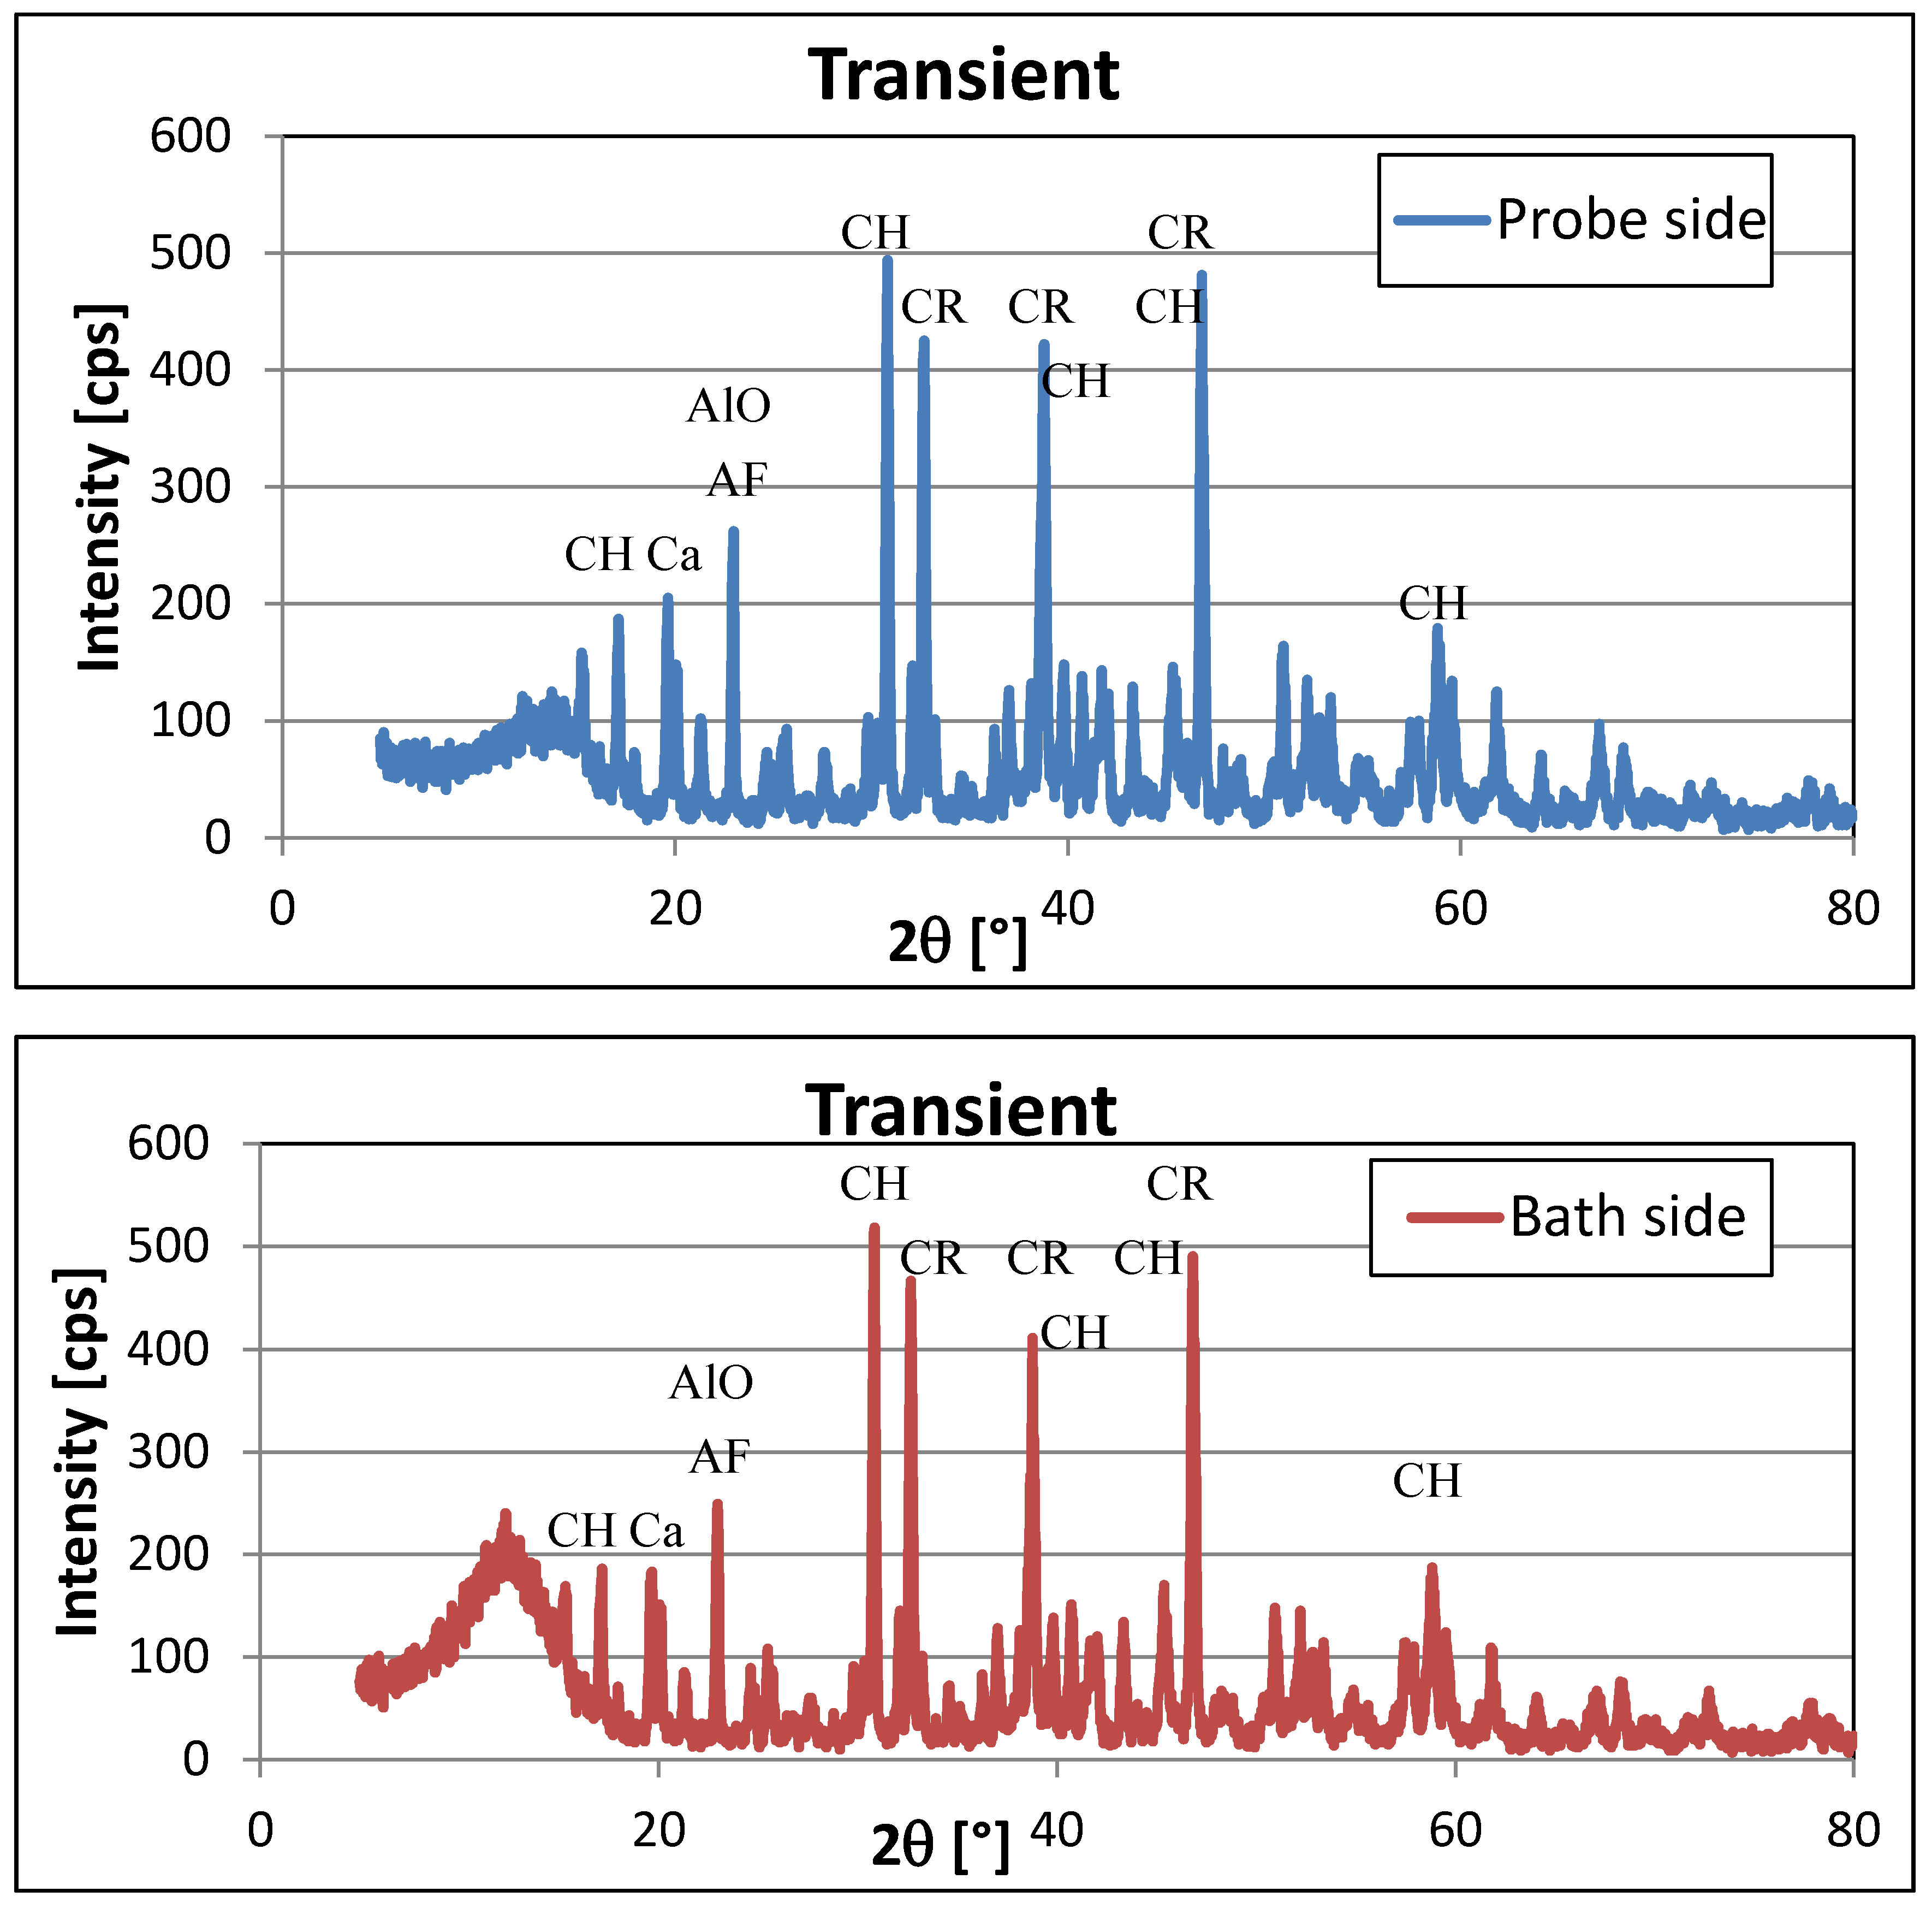
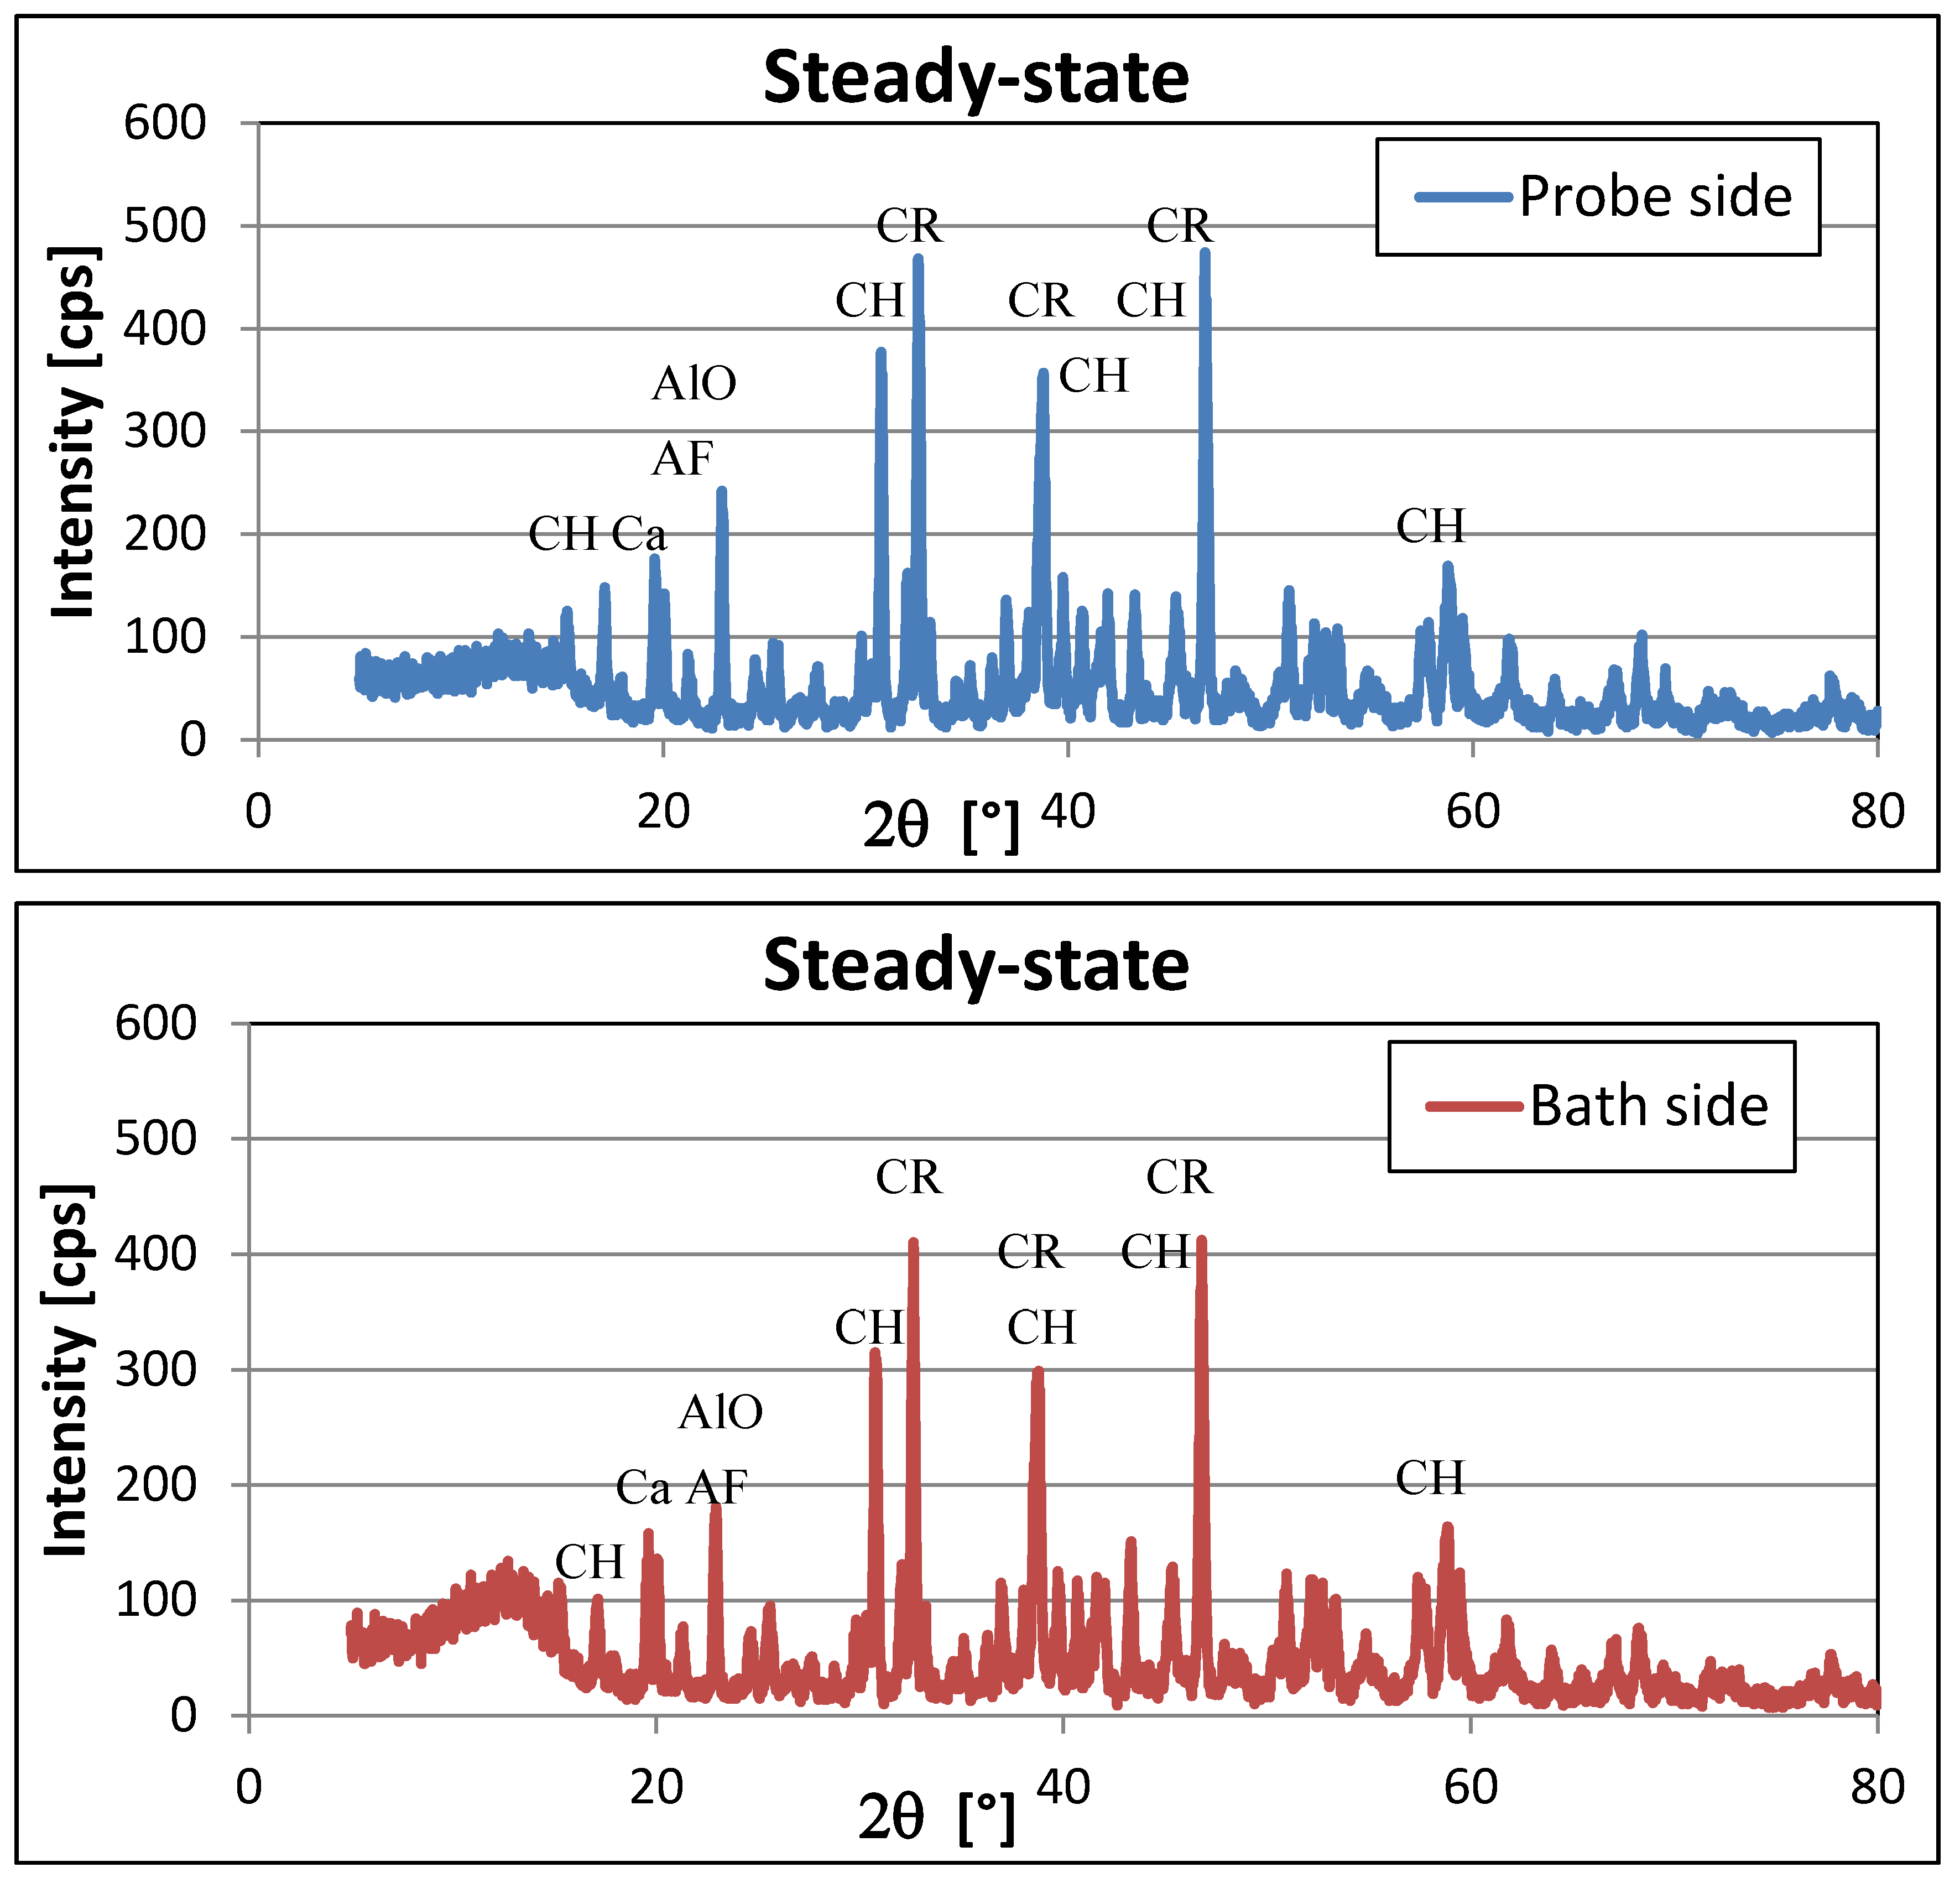
3.2. XRD Analysis

Figure 2 shows the variation of the intensity of diffracted X-ray beams with the angle between the incident and refracted beams (2θ) for the four different samples (TP, TB, SP, SB). All the characteristic peaks on the XRD spectra correspond to a given crystalline compound in the frozen bath mixture, thus permitting to their identification. Even if in certain cases there was some overlap between the neighbouring peaks, the fact that most of the compounds have more peaks made the evaluation relatively easy.
The crystalline compounds revealed by XRD are presented in Table 2. The characteristic angles (2θ) for a given compound are listed in decreasing importance. The peaks, which were either very weak or highly overlapping with neighboring peaks (marked with asterisk), were not included in the analysis. Overlapping of peaks can corrupt information extracted from XRD spectra.
It can be concluded that the four strongest peaks (above 300) are either formed by cryolite (2) or chiolite (2), which is normal as they are the main compounds of the frozen bath. The relatively weak AlF3 peaks suggest that the biggest part of excess AlF3 participated in the formation of chiolite that is probably related to the above-mentioned exsolution.
Figure 3, Figure 4 and Figure 5 show the spatial distributions of the detected crystalline compounds. It is important to keep in mind that they do not give any information about amorphous phases that can modify the total mass balance.
Cryolite produces three of the five strongest peaks to the spectra. Unfortunately, they are all overlapped with peaks of other components. This fact, along with the strong inhomogeneities, can probably explain why no conclusion can be drawn from its characteristic peaks. In fact, the increase of the porosity reduces itself the amount of a given chemical element in the same volume. On the other hand, more chiolite seems to be present in the transient sample and this is particularly evident at the strongest characteristic peak (Figure 3 bottom). What is more, the bath side of the steady-state sample seems to contain the least chiolite. The difference between the two sides (SP vs. SB) could be probably even more significant if SP were not much more porous and for fragility and low thickness reasons we should not have been obliged to include some part of zone 5, formed with low heat flux in SP. This confirms that high and medium solidification rates at high and medium heat fluxes promote the formation of compounds with composition closer to that of the acidic bath, either by blocking ion migration, which is promoted by cryolite formation (TP), or by recrystallization of cryolite to chiolite (TB and SP).
Evaluation of AlF3 peaks is somewhat more complicated as it is affected by factors that work against each other. Fast solidification blocks ion migration and permits the entrapment of liquid pockets rich in excess AlF3. On the other hand, recrystallization of cryolite to chiolite in the presence of AlF3-rich liquid consumes it. At all peaks, the SB sample, formed with the lowest heat flux, contains the least AlF3 (Figure 4). This is in accordance with the lack of any visible sign of AlF3-rich liquid pockets and the possibility of extended ion migration in this zone.
Crystallized alumina content of the bath is composed mainly of corundum (α-alumina) and some γ-alumina. No evidence was found for the presence of β-alumina (Figure 5). In all cases, less α-alumina can be found on the probe side (TP and SP) while γ-alumina content is much higher in the fastest cooled zone (TP). This can be explained by the fact that faster cooling at the probe side diminishes γ–α conversion.
The main peak of the CaF2 is completely hidden by the main peak of the cryolite while its secondary peak was not measurable. For this reason, its presence in the mixtures was not reported. Calcium in the bath seems to form more probably a small amount of calcium-cryolites (mainly NaF-1.5CaF2-AlF3; Figure 5). Its high concentration in the fastest cooled zone (TP) can be explained by the blocked migration. Unfortunately, the two characteristic peaks of α-NaCaAlF6 overlap considerably with some important chiolite and AlF3 peaks and thus they were not included in the analysis. However, the doublet shape of those two peaks permits us to assume the presence of a small amount of α-NaCaAlF6.
A small amount of FeO inclusion was also detected (Figure 5). However, only the main peak is strong enough for reliable analysis. That peak is much higher in both samples on the side closer to the steel probe that is in accordance with the expectations. In fact, any steel object inserted into the very corrosive molten cryolitic bath around 960 °C can be slightly attacked at its surface. Measurement of ferrous oxides by XRD is discussed in the literature [15]. No carbon coming from the graphite crucible was detected with XRD in the samples. It probably gathered in the darker, easily removable inclusions on the surface of the freeze layer [12], which were excluded from this analysis.

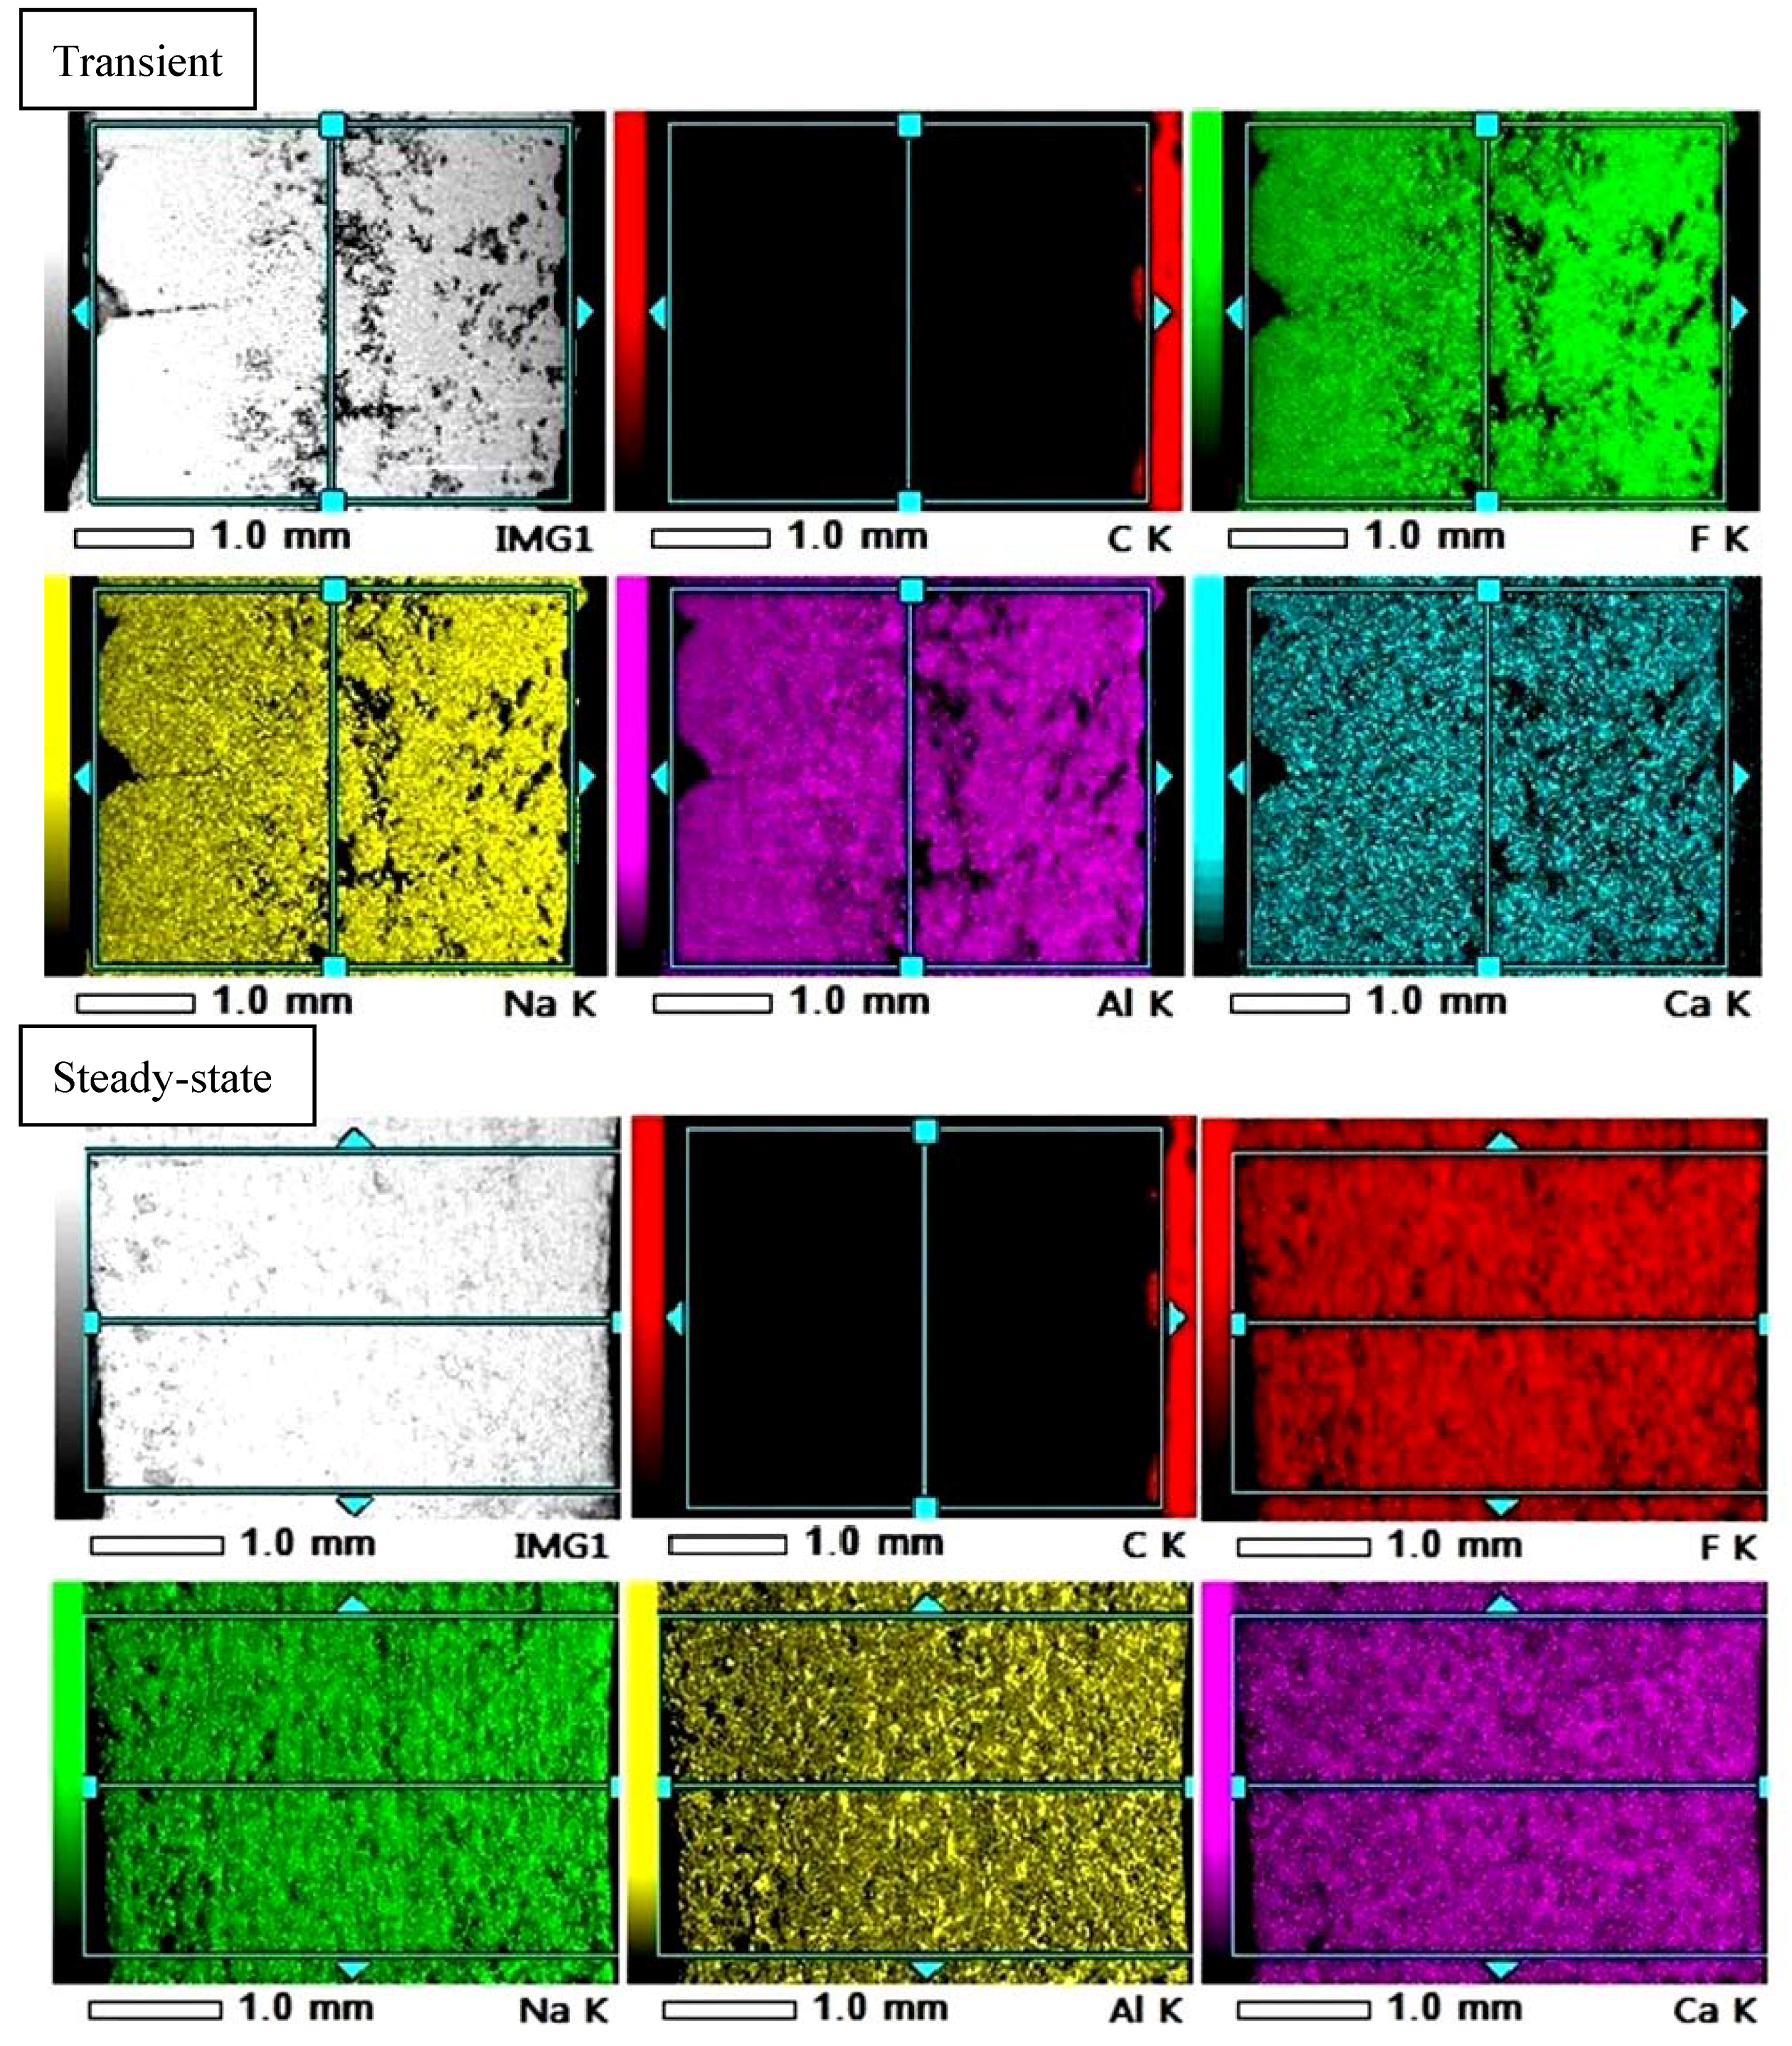
3.3. Analysis of Elementary Composition Using Electron Microscope with BSE Mode

The distribution of elementary chemical composition on the surface of transient and steady-state samples in the direction perpendicular to the probe surface was obtained using the SEM-BSE mapping technique (Figure 6). The Na, Al, F, Ca and C were included in this study. The left and right sides of samples in the pictures were in contact with the probe and the bath respectively.
Similarly to the structure, the distribution of the chemical elements seems to be much more homogeneous on the steady-state sample (except for Al, for which a slight increase further from the probe can be seen in Figure 6). This is in accordance with the expectations, as the major part of this sample was solidified under similar condition (heat flux and solidification rate). On the other hand, the transient probe shows a significant inhomogeneity. The occurrence of the Na and F increases in the zones situated further from the probe face despite the higher local porosity. The other elements are distributed more uniformly. Such distribution can be explained by the fact that slow solidification promotes cryolite formation (with higher Na/Al ratio), while very fast initial solidification, close to the cold finger probe, will freeze the bath (lower Na/Al ratio due to the AlF3 excess) without any possible significant change in composition by mass diffusion.

4. Conclusions

Frozen bath samples were created under different heat flux conditions in a well-controlled laboratory environment using the so-called cold finger technique. The samples were analyzed by XRD and SEM with BSE mode in order to obtain the spatial variation of chemical composition. Results were correlated with earlier structural analysis. The following conclusions can be drawn from the results:
  • In accordance with the expectations, the cryolite and chiolite are the two main components of the frozen bath.
  • The distribution of the chemical elements is more inhomogeneous in the transient sample similarly to the structure and in accordance with the expectation. In fact, the heat flux and solidification rate change substantially in the successively formed layers at different distance from the cold finger probe.
  • Very fast solidification of acidic bath with AlF3 excess at very high cooling rate blocks the migration of ions that decreases the Na to Al ratio. It seems to slightly increase the local concentration of chiolite and calcium containing compounds and reduces γ–α conversion as well.
  • The earlier presented hypothesis that medium solidification rate promotes the recrystallization of cryolite to chiolite (exsolution), due to the presence of acidic liquid pockets entrapped by growing crystals, was confirmed by XRD.
  • The contact between the molten bath and the steel probe forms some FeO that is entrapped mainly in a thin, generally darker layer, close to the probe.

Acknowledgment

This work was realized with the valuable financial support of Rio Tinto Aluminium and the National Sciences and Engineering Research Council of Canada (NSERC). The authors would like to thank the technical support of Dilip Kuma Sarkar (UQAC) with the XRD studies and Breno Leite (JEOL USA Inc.) for SEM-BSE analysis of frozen bath samples. The contribution of Adam Ugron with the design of the cold finger probes is equally acknowledged.

Author Contributions

The first two authors participated in the production of the samples, the measurements and the preparation of this article. All the authors participated in the analysis of the data. The company of the 3rd and 4th authors supplied materiel, financial support and they personally participated in the analysis of the data and reviewed the article as well.

Conflicts of Interest

The authors declare no conflict of interest.

References

  1. Zhang, Q.; Taylor, M.; Chen, J. Composition and Thermal Analysis of Crust Formed from Industrial Anode Cover. In Light Metals 2013; John Wiley & Sons, Inc.: Hoboken, NJ, USA, 2013; pp. 675–680. [Google Scholar]
  2. Solheim, A. Some Aspects of Heat Transfer between Bath and Sideledge in Aluminium Reduction Cells. In Light Metals 2011; Springer: Berlin, Germany, 2011; pp. 381–386. [Google Scholar]
  3. Thonstad, J.; Fellner, P.; Haarberg, G.M.; Hives, J.; Kvande, H.; Sterten, A. Aluminium Electrolysis−Fundamentals of the Hall-Héroult Process, 3rd ed.; Aluminium-Verlag: Dusseldorf, Germany, 2001. [Google Scholar]
  4. Solheim, A.; Støen, L.I.R. On the Composition of Solid Deposits Frozen out from the Cryolitic Melts. In Light Metals; Metallurgical Society of AIME: Warrendale, PA, USA, 1997; pp. 325–332. [Google Scholar]
  5. Chartrand, P.; Pelton, A.D. A Predictive Thermodynamic Model for the Al-NaF-AlF3-CaF2-Al2O3 System. In Light Metals; Metallurgical Society of AIME: Warrendale, PA, USA, 2002; pp. 245–252. [Google Scholar]
  6. Solheim, A.; Rolseth, S.; Skybakmoen, E.; Støen, L.; Sterten, Å.; Støre, T. Liquidus Temperatures for Primary Crystallisation of Cryolite in Molten Salt Systems of Interest for the Aluminium Electrolysis. Met. Trans. B 1996, 27, 739–744. [Google Scholar] [CrossRef]
  7. Grandfield, J.; Poncsák, S.; Kiss, L.; St-Pierre, R.; Guérard, S.; Bilodeau, J.F. Structural Characterisation and Thermophysical Properties of the Side Ledge in Hall-Héroult Cells. In Light Metals 2014; Springer: Berlin, Germany, 2014. [Google Scholar]
  8. Thonstad, J.; Rolseth, S. Equilibrium between Bath and Sideledge. In TMS Light Metals; Metallurgical Society of AIME: Warrendale, PA, USA, 1983; pp. 415–424. [Google Scholar]
  9. Taylor, M.P.; Zhang, W.D.; Wills, V.; Schmid, S. A dynamic model for the energy balance of an electrolysis cell. Chem. Eng. Res. Des. 1996, 8, 913–933. [Google Scholar] [CrossRef]
  10. Taylor, M.P.; Welch, B.J. Melt/freeze heat transfer measurements in cryolite-based electrolytes. Metall. Trans. B 1987, 2, 391–398. [Google Scholar] [CrossRef]
  11. Hyland, M.; Allard, F.; Désilets, M.; LeBreux, M.; Biais, A. Chemical Characterization and Thermodynamic Investigation of Anode Crust Used in Aluminum Electrolysis Cells. In Light Metals 2015; Springer: Berlin, Germany, 2015; pp. 656–670. [Google Scholar]
  12. Williams, E.; Poncsák, S.; Kiss, L.; Raymond, V.D.; Kaszás, C.; Guérard, S.; Bilodeau, J. Impact of the heat flux on solidification of cryolite based bath. In Light Metals 2016; Springer: Berlin, Germany, 2016; pp. 359–364. [Google Scholar]
  13. Dassylva-Raymond, V.; Istvan Kiss, L.; Poncsak, S.; Guérard, S. Modelling the behavior of alumina agglomerate in Hall-Héroult process. In Light Metals 2014; Springer: Berlin, Germany, 2014; pp. 603–608. [Google Scholar]
  14. Lindsay, S.J.; Wang, X.; Tarcy, G.; Batista, E.; Wood, G. Active Pot Control using Alcoa STARprobe™. In Light Metals 2011; Springer: Berlin, Germany, 2011; pp. 483–489. [Google Scholar]
  15. Minakshi, M. Lithium intercalation into amorphous FePO4 cathode in aqueous solutions. Electrochim. Acta 2010, 55, 9174–9178. [Google Scholar] [CrossRef]
Figure 1. Structure of transient (left) and steady-state (right) samples, revealed by SEM-SEI (SEM: Scanning Electron Microscope; SEI: Secondary Electron Imaging) images of frozen bath surfaces cut in a perpendicular direction to the probe-sample contact interface [12].
Metals 07 00097 g001
Figure 2. Variation of the intensity of diffracted X-ray beams with 2θ for TP, TB, SP, SB samples obtained with X-ray Diffractometer (XRD); cps denotes “count per second”, CR: cryolite, CH: chiolite, AF: AlF3, AO: Al2O3, Ca: calcium containing complex ions.
Metals 07 00097 g002aMetals 07 00097 g002b
Figure 3. Distribution of the crystallized cryolite (top) and chiolite (bottom) in the frozen bath samples as revealed by XRD.
Metals 07 00097 g003
Figure 4. Distribution of the crystallized AlF3 in the frozen bath samples, revealed by XRD.
Metals 07 00097 g004
Figure 5. Distribution of the minor components in the frozen bath samples, revealed by XRD.
Metals 07 00097 g005
Figure 6. Distribution of the elementary chemical composition on the surface of transient (top) and steady-state (bottom) samples using SEM-BSE mapping technique.
Metals 07 00097 g006
Table 1. Main characteristics of the transient and near steady-state production of samples.
ParametersTransientSteady-State
Probesolid (full) block 12.5 × 11 × 2.54 cmhollow with inner channels 12.5 × 11 × 2.54 cm with a wall thickness of 6.35 mm
Initial temperaturepreheated to ~150 °C in order to remove humiditypreheated to ~150 °C in order to remove humidity and then preheated to the bath temperature in the molten bath
Sample producing processinsertion of cold probe to the bath in order to obtain the thickest possible crustinsertion of cold probe into the molten bath, then waiting until the transient crust is completely re-melted and the temperature of the probe stabilizes close to the bulk temperature; near steady-state crust is formed by the circulation of dried and compressed cold air in the channels of the probe with constant flow rate
Duration of insertion3 min this time was estimated by our mathematical model [13]~30 min probes were removed when the temperature became constant inside the probe
Table 2. Crystalline compounds revealed by XRD in TP, TB, SP, SB samples.
CompoundLatticeCharacteristic Peaks
2θ [°]Intensity
Cryolite Na3AlF6Monoclinic46.789 *350–490
32.533 *410–421
38.61 *203–275
Chiolite Na5Al3F14Tetragonal30.699309–518
17.104101–186
38.784300–420
45.546 *84–140
50.978 *105–148
59.696–134
Aluminium-fluoride AlF3Hexagonal14.74791–144
24.971 *very weak peak
25.689 *71–93
29.74675–101
α-aluminaRhombohedral43.363118–151
35.136very weak peak
57.51990–116
25.584 *81–92
γ–aluminaFace-centered cubic45.864 *overlapping with strong peak of cryolite
67.03462–97
α-NaCaAlF6Monoclinic24.5 *not evident due to overlapping
50.182 *
NaF-1.5CaF2-AlF3Body-centered cubic45.12 *76–102
21.2473–100
30.2274–98
FeOFace-centered cubic41.928103–118
36.041too weak
* Overlapping with other peaks

