Article

The Effects of Prestrain and Subsequent Annealing on Tensile Properties of CP-Ti

School of Mechanical and Power Engineering, Nanjing Tech University, Nanjing 211816, China
*
Author to whom correspondence should be addressed.
Metals 2017, 7(3), 99; https://doi.org/10.3390/met7030099
Submission received: 14 February 2017 / Revised: 12 March 2017 / Accepted: 14 March 2017 / Published: 17 March 2017
(This article belongs to the Special Issue Titanium Alloys 2017)

Abstract

:
The aim of the present work is to investigate the effects of prestrain and subsequent annealing on tensile properties of commercial pure titanium (CP-Ti). According to tensile test results, yield strength and ultimate tensile strength increase with the increase of prestrain. Elongation and uniform strain decrease linearly with prestrain. In the case of prestrain that is higher than 3.5%, the macro-yield of specimens changes from gradual yielding to discontinuous yielding. It is supposed that considerable numbers of dislocations introduced into the material lead to the appearance of yield plateau. The quantitative analysis of the contribution of dislocation hardening to the strain hardening shows that dislocation-associated mechanisms play an important role in strain hardening. Moreover, a modified Fields-Backofen model is proposed to predict the flow stress of prestrained CP-Ti at different strain rates. Both strain rate sensitivity and strain hardening exponent decrease with prestrain. Fracture surfaces of the specimens show that fracture mechanism of all tested specimens is dimple fracture. The more ductile deformation in prestrained CP-Ti after annealing indicates that its ductility is improved by annealing.

1. Introduction

During the manufacture of materials (stamping, cold rolling, equal channel angular pressing, bending) and the installation and service history of the equipment components (such as creep, overload), different degrees of plastic deformation will happen in the materials. The extent of prior plastic strain introduced into the material can significantly change the mechanical properties and consequently affect the plastic deformation behavior. At present, the investigation of the influence of prestrain on the materials has been focused on steels [1,2,3,4,5,6,7], titanium alloys [8,9,10], aluminum alloys [11,12], magnesium alloys [13,14,15], Zr-based alloys [16] and so on. Usually, prior heavy cold work leads to a considerable increase in strength by creating dislocation barriers to inhibit subsequent dislocation movement during plastic deformation at room temperature. For instance, Zhang et al. [2] found that by pre-straining and bake hardening, the strength of C–Mn–Si TRIP steel was enhanced. Further, they supposed that the unlocking from weak carbon atmospheres of dislocations newly formed during prestraining led to the appearance of yield point on the stress–strain curve [3]. Lee et al. [6,7] found that work hardening rate and strain rate sensitivity (SRS) of 304 L stainless steel were dependent on the variation of prestrain. Sarker et al. [13,14] suggested that the variation of strain hardening rate of AM30 magnesium alloy with pre-straining was related to deformation twinning and detwinning. Thus, it can be seen that prestrain has important effects on the subsequent plastic deformation behavior for many materials. Also, it provides that the effects of prestrain on the performance of hexagonal close-packed materials are associated with twinning structures produced in the prior deformation [13,14,15]. Many researchers have studied the effects of prior severe plastic deformation, such as cold rolling and equal channel angular pressing (ECAP) on mechanical properties of CP-Ti [17,18,19]. The activation of twinning in CP-Ti is affected by many factors, such as deformation temperature, strain rate, deformation value, deformation direction [20,21]. Prior deformation (cold rolling and ECAP) produces many twins in the initial microstructure of CP-Ti, which is different from tensile prestrain [18,19,22,23,24]. The effects of stretching prestrain on the mechanical properties of CP-Ti have not been examined. Thus, in this paper, different amounts of prestrain were applied to CP-Ti and a uniaxial tensile experiment was conducted to investigate the effects of prestrain on mechanical properties, work hardening rate, flow stress and fracture mechanism.

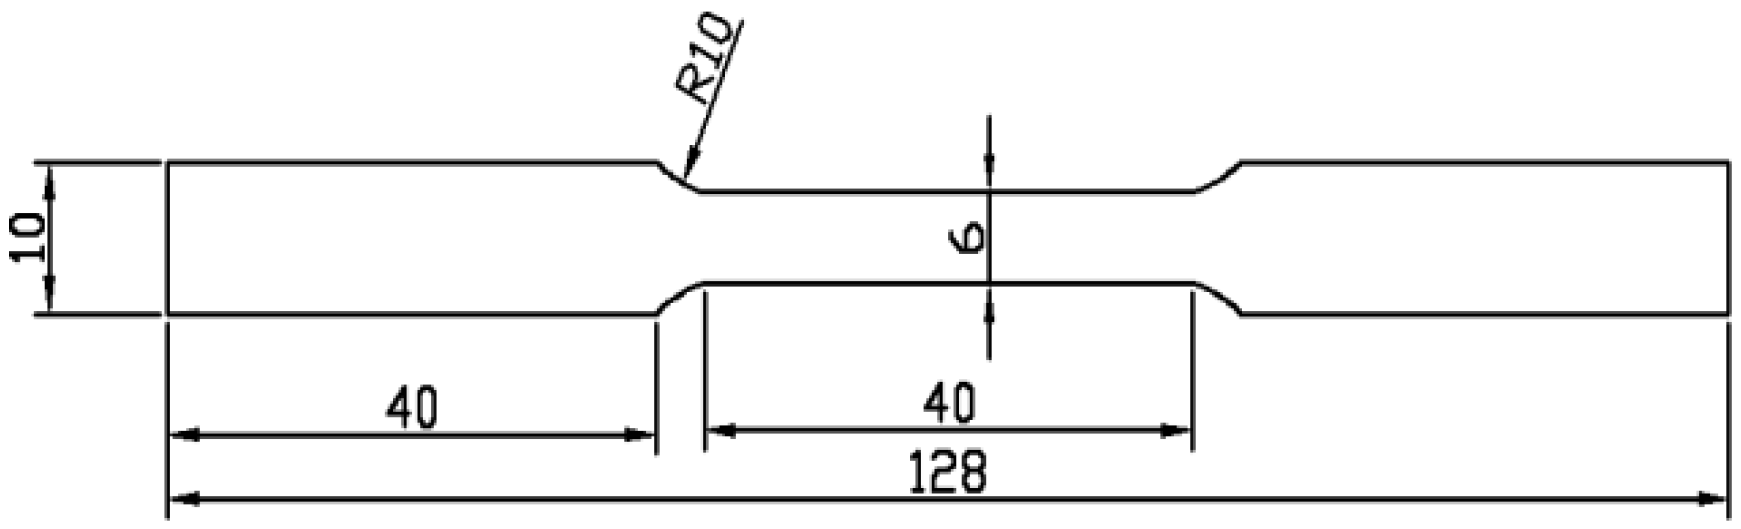
2. Experimental Materials and Procedures

The materials used in the present study were CP-Ti in the form of a cold-rolled and annealed plate. The chemical composition was given in Table 1. The specimens with 3 mm thickness (see Figure 1) were machined from the as-received plate by wire electrical discharge machining. In order to exclude the effect of surface roughness, the specimens were ground and polished by metallographic abrasive paper. The tensile testing was carried out by Instron tensile experimental equipment (INSTRON, Norwood, MA, USA). The strain was automatically measured by extensometer (INSTRON, Norwood, MA, USA). Different levels of pre-deformation along rolling direction were applied at the same strain rate (0.0005 s−1) with the control of extensometer. Then, the specimens were unloaded and reloaded to fracture. The strain rate during reloading ranged from 0.00005 to 0.004 s−1. In addition, to investigate the effects of subsequent annealing on tensile properties of prestrained samples, isothermal heat-treatment was conducted using a vacuum furnace equipped with an auto tune temperature controller (HUAHONG, Suzhou, China). The annealing temperatures were 500 °C and 600 °C with dwell times ranging from 30 min to 1 h. The detailed annealing experimental scheme was listed in Table 2. The microstructure was characterized using optical metallography. The specimens were mechanically ground and chemically etched in a solution consisting of 10 mL nitric acid, 2 mL hydrofluoric acid and 88 mL distillated water. Study on the fracture surface of tensile specimens was carried out using a JSM-6360LV scanning electron microscope (JEOL, Tokyo, Japan).

3. Results and Discussion

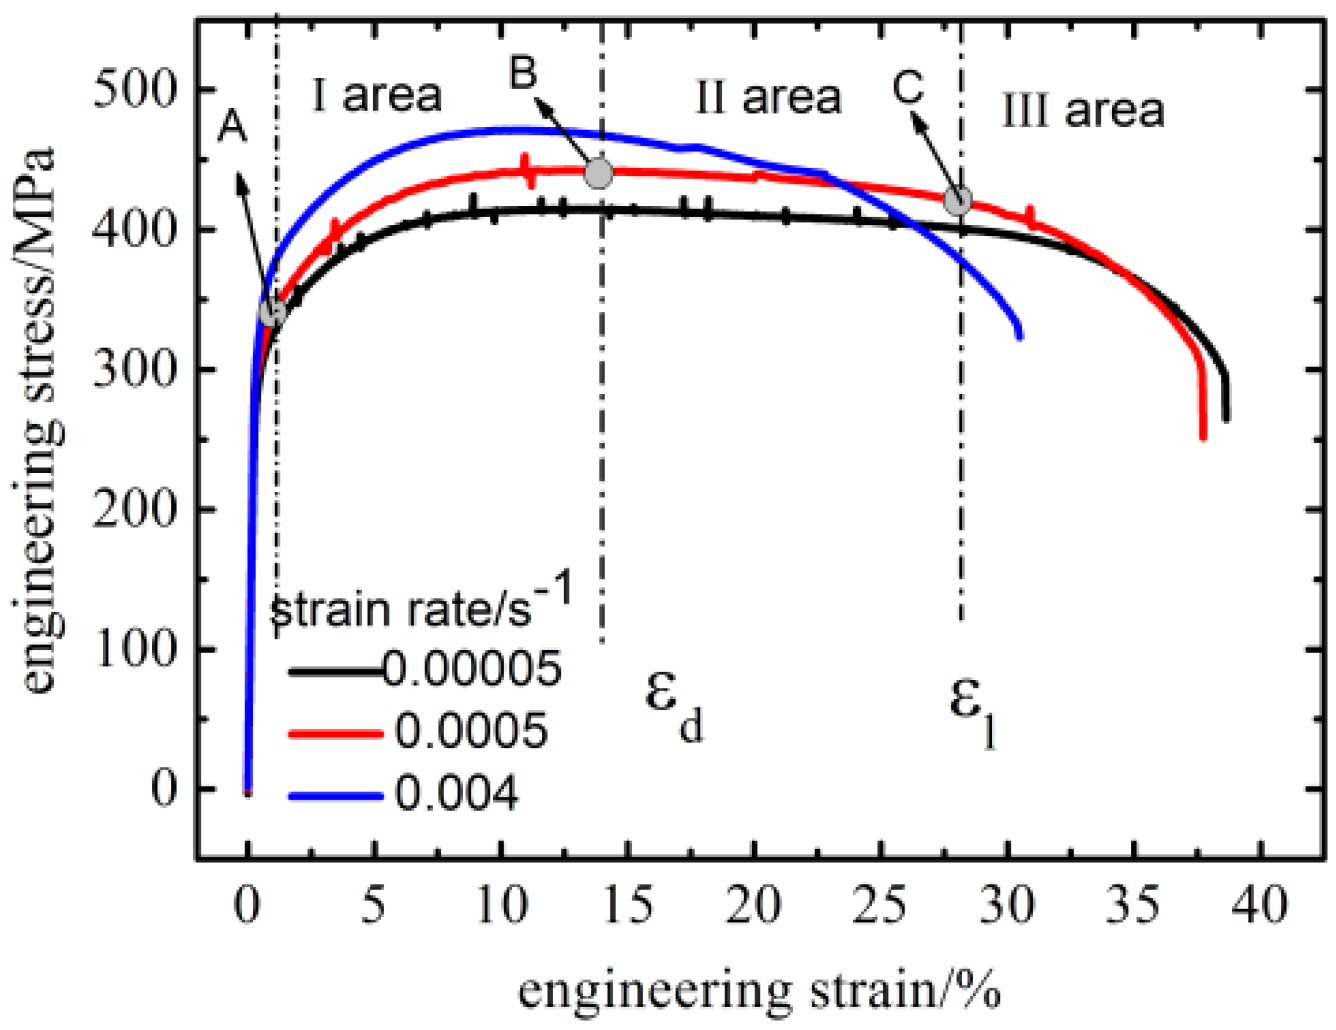
3.1. Tensile Properties of As-Received Commercial Pure (CP)-Ti

According to uniaxial tensile experiment, mechanical properties of CP-Ti were determined. Engineering stress–strain curves of the as-received material were given in Figure 2. Plastic deformation process can be divided into three stages by the three characteristic points (A, B, C) on the tensile curve. The first feature point is yield strength point (point A), deformation before this point is the elastic deformation stage. Obviously, in the range of 0.00005–0.004 s−1, the yield of CP-Ti is continuous as no yield plateau appears. The second feature point is the highest point (point B). Generally, when maximum tensile force reaches, sample necking starts, the corresponding point B is the demarcation between uniform plastic deformation and non-uniform plastic deformation. When plastic deformation is concentrated, load-bearing capacity decreases quickly, the corresponding feature point is point C. The strain of diffuse necking and localized necking were expressed as follows:
ε d = n
ε l = 2 n
where εd is initial strain of diffuse necking, εl is initial strain of localized necking and n is strain hardening index. The stress–strain curve in plastic stage is divided into three stages, via uniform deformation, diffuse necking stage and localized necking stage by the two perpendicular lines. As the work hardening exponent is different under different strain rates, distinguish area of stress–strain curve was only given at strain rate of 0.0005 s−1, as shown in Figure 2. It can be seen that CP-Ti has obvious strain rate sensitivity. With the increase of strain rate, tensile stress–strain curve of CP-Ti ascends. Moreover, the yield strength and tensile strength increase and the elongation decreases.

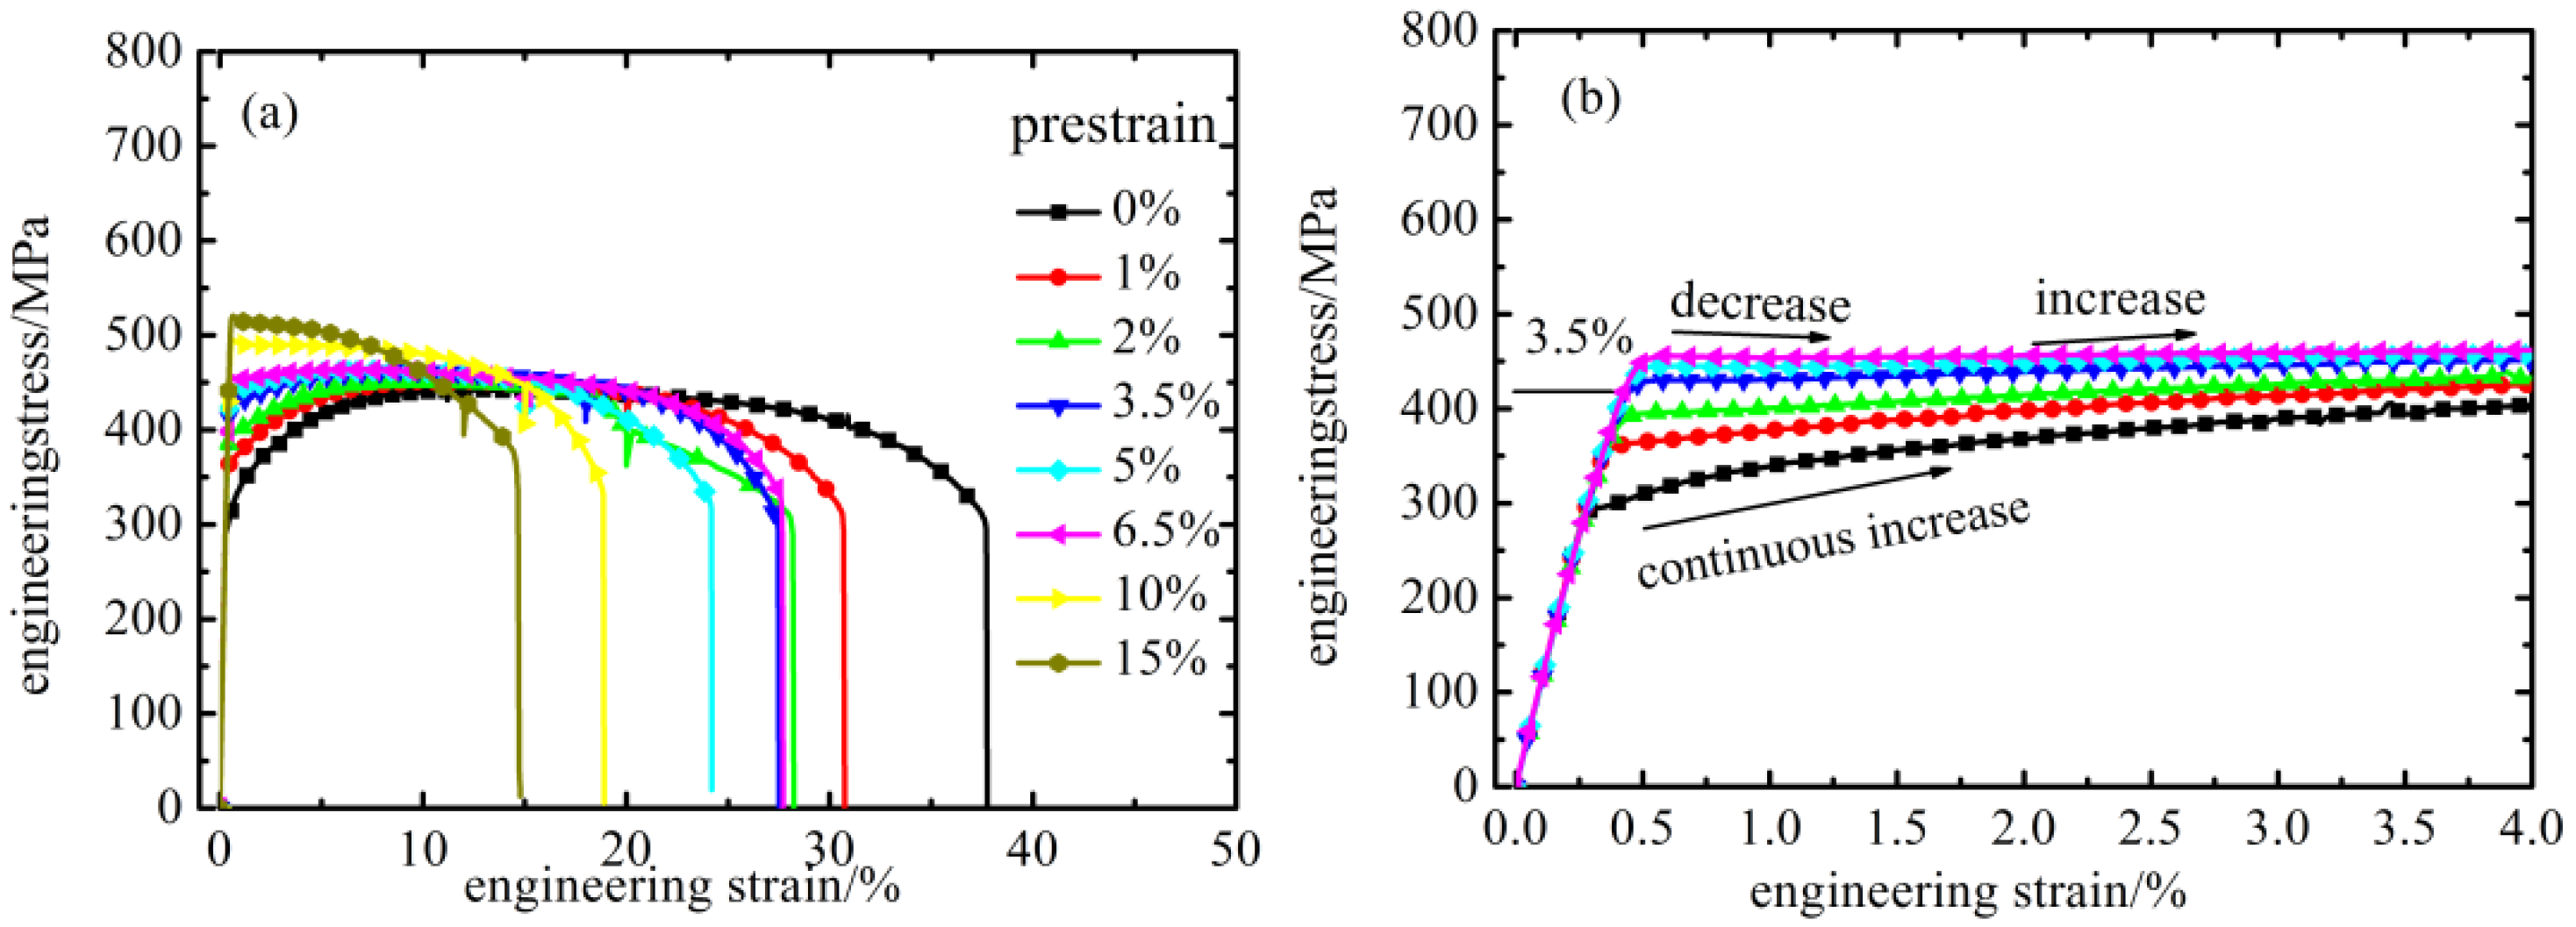
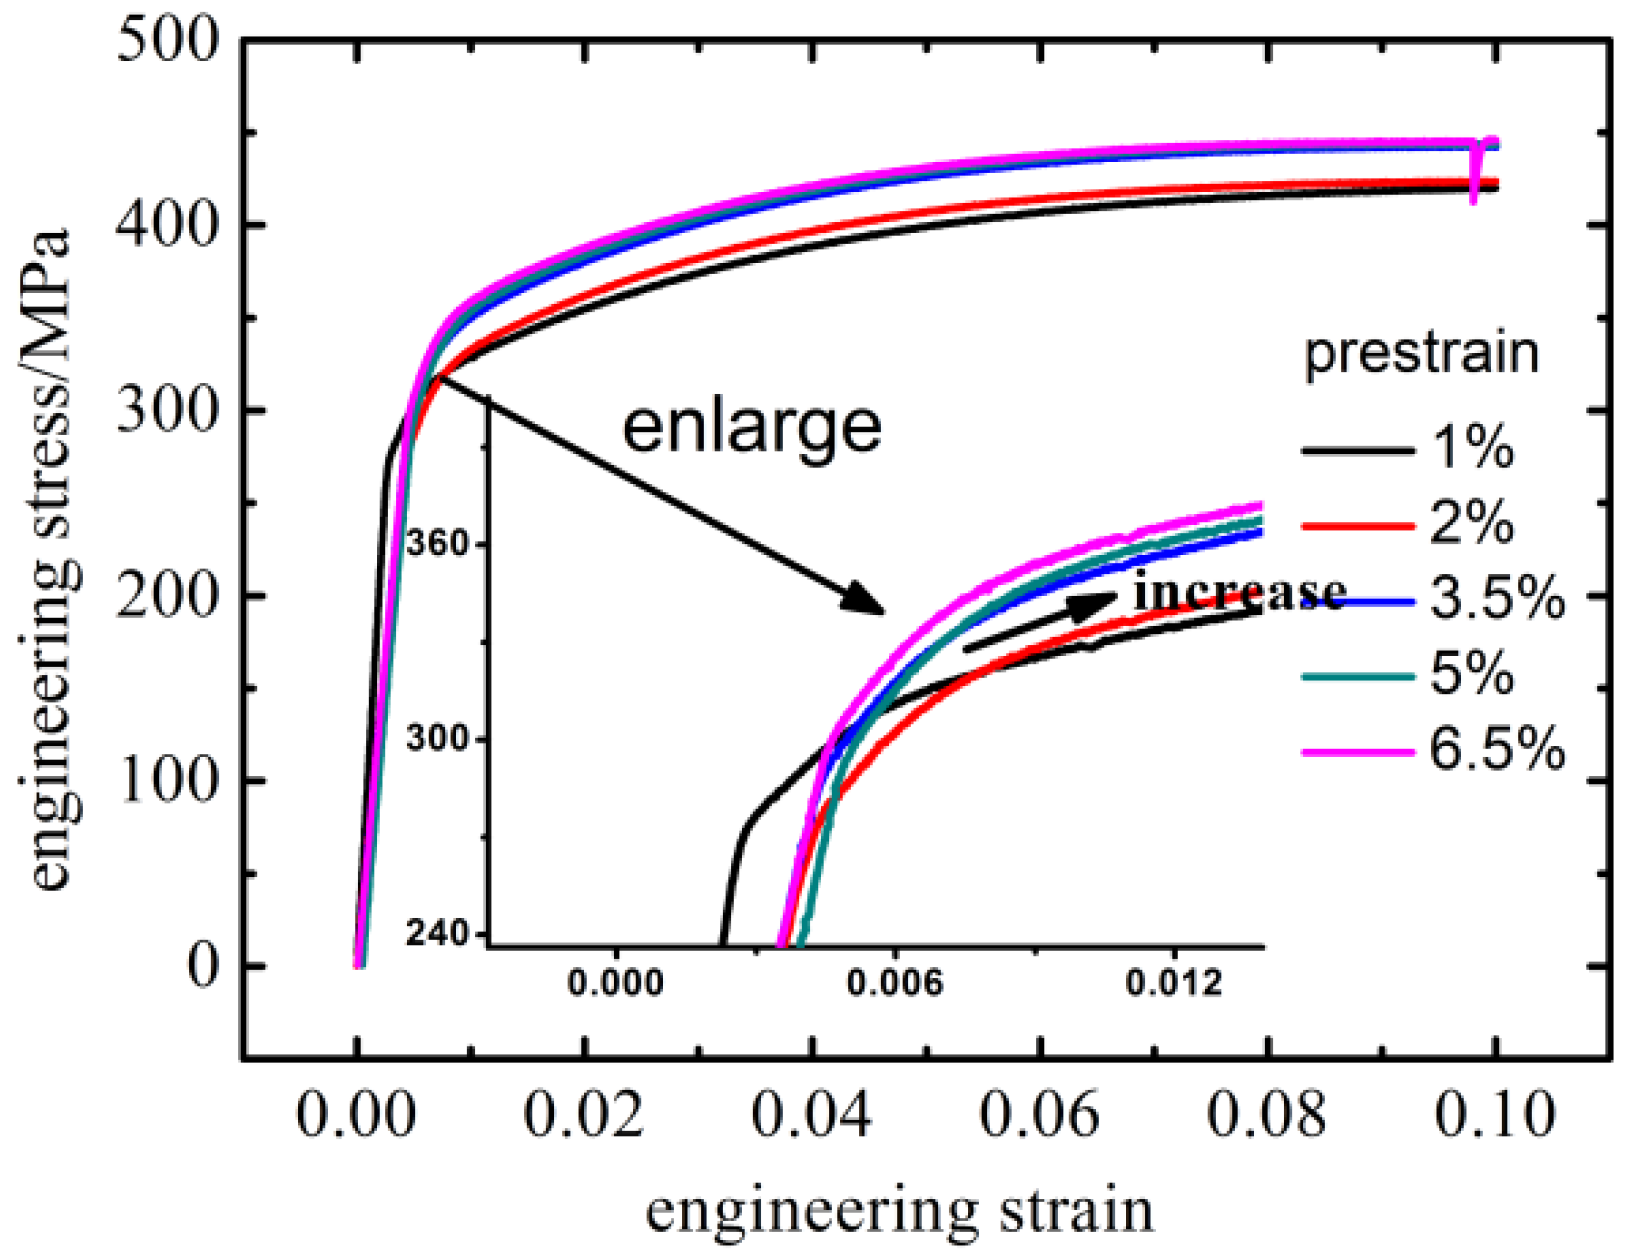
3.2. Tensile Properties of Prestrained Specimens

The prestrain was taken from the uniform plastic deformation zone and the dispersion instability region (1%, 2%, 3.5%, 5%, 6.5%, 10%, 15%, respectively). According to tensile stress–strain curves of different prestrained specimens, as shown in Figure 3a, it can be seen that, after pre-stretching, tensile stress–strain curve ascends. Both yield strength and ultimate tensile strength increase. The strength of CP-Ti is enhanced at the cost of ductility, as fracture strain decreases a lot with prestrain. By comparing the engineering stress–strain curves of 3.5%, 5% and 6.5% prestrained specimens, it can be seen that engineering stress–strain curves of these specimens are close, that means when prestrain is ranging from 3.5% to 6.5%, flow stress increases slightly with prestrain. When prestrain reaches 10% and above, the ultimate strength is rapidly reached and yield strength is very close to tensile strength. It is worth noting that as prestrain reaches 3.5%, the macro-yield changes from gradual yielding to discontinuous yielding, as shown in Figure 3b. The discontinuous increase of flow stress shows the appearance of yield plateau.
In order to evaluate the variation of flow stress with true strain, work hardening rate θ (dσ/dε) is derived from the true stress–strain curve. Figure 4 displays variations of θ with true strain for as-received and prestrained CP-Ti. An often reported feature for pure titanium, in particular in compression conditions, consists in a three-stage character of deformation curve [25,26]. Work hardening rate of as-received CP-Ti shows three decrease stages (A, B and C stage), as shown in Figure 4a. Work hardening rate decreases sharply at the beginning of plastic deformation (stage A) and then decreases gradually at moderate strain (stage B). In stage C, work hardening rate decreases slowly with strain, as the slopes flatten with the increase of true strain. Between stages A and B the transition occurs at a true plastic strain of 0.018, between stages B and C at a true plastic strain of 0.096. The transition points between stages A and B and that between stages B and C of as-received CP-Ti are consist with results of Becker et al. [27] and Hama et al. [28]. For prestrained CP-Ti in Figure 4b, its θ is dependent on true strain and prestrain. With the increase of prestrain (εpre ≥ 2%), a rise stage B of work hardening rate occurs. Stage B is characterized by an increasing strain hardening rate with true strain at the range of 0.5%–2%. With increasing prestrain, the rise tendency in stage B is more remarkable. In the case of εpre ≥ 3.5%, strain hardening rate at the end of stage A is negative, also indicates that yield plateau appears in tensile stress–strain curves, which is consist with Figure 3b. Additionally, compared with as-received CP-Ti, θ of prestrained CP-Ti decreases, indicating the decrease of work hardening ability. Li et al. [29] and Ghaderi et al. [30] investigated the effect of grain size on the tensile deformation mechanisms of CP-Ti and found that as grain size decreased to about 26 μm, yield plateau occurred. In this paper, the grain size of CP-Ti is about 30 μm, as shown in Figure 5a, determined by linear intercept method. Li et al. [29] supposed there were two possible reasons for the observed variation of the macro-yield. First is the high number of dislocation tangles and the mobile dislocation density. The second reason is the presence of deformation twinning. However, as grain size decreases to 30 μm, the activation of twinning in CP-Ti during tensile deformation is non-significant [29]. Thus, ascribing the initial yield plateau of CP-Ti during tensile deformation to the presence of twinning is unreasonable. It is no doubt that dislocation structure exists in the prestrained samples and its density increases with prestrain. However, the volume fraction of twinning is tremendously small, as shown in Figure 5b–f, though its density increases with prestrain. Almost no twinning structure can be observed in 2%–3.5% prestrained samples and few twins exists in 5%–15% prestrained samples indicated by white arrows. According to quantitative statistical analysis of microstructure in the process of tensile deformation along rolling direction [31,32,33,34], the twin volume fraction is always considerably small and the plastic deformation can be attributed to dislocation slip. Therefore, as prestrain reaches 3.5%, high dislocation density in the initial microstructure leads to the presence of yield plateau.
The variations of strength and ductility of CP-Ti as functions of tensile prestrain are shown in Figure 6 and Figure 7 respectively. It is observed that with the increase of prestrain, both yield strength and tensile strength increase. The increment in yield strength with the amount of prestrain is gradually slow, which can be seen from the slope of variation of yield strength with the increase of prestrain. The increase of yield strength with prestrain can be rationalised by following two reasons. One is that dislocation density increases quickly with increasing prestrain. As a result, the resistance to start plastic deformation on reloading increases sharply with increasing prestrain. The other is that as prestrain increases, few twins also contribute to the increase of yield strength. The yield strength increases more and more slowly with prestrain. The logarithmic curve of the yield strength versus the prestrain is linear. Thus, a power law can be used to describe the relationship between prestrain and yield strength, expressed as follow:
σ = 68.08 ε p r e 0.43 + 305.34
It is shown that the curve of the Equation (3) is consistent with the original data point, and the correlation coefficient R is 0.999. When prestrain is less than 6.5%, ultimate tensile strength increases slowly with prestrain. As prestrain increases up to 10%, ultimate tensile strength increases rapidly and yield strength is close to tensile strength. According to relationships between uniform strain, elongation (ε), total elongation (εtotal = εpre + ε) and prestrain, both uniform strain and elongation decrease linearly with prestrain. As prestrain increases up to 10%, plastic deformation of CP-Ti quickly develops into the diffuse necking stage. However, total elongation of CP-Ti remains constant about 30.5%, slightly less than the as-received material, that means the total ductility keeps in constant. During the initial prestrain process the higher the prestrain is, the lower elongation on reloading is.

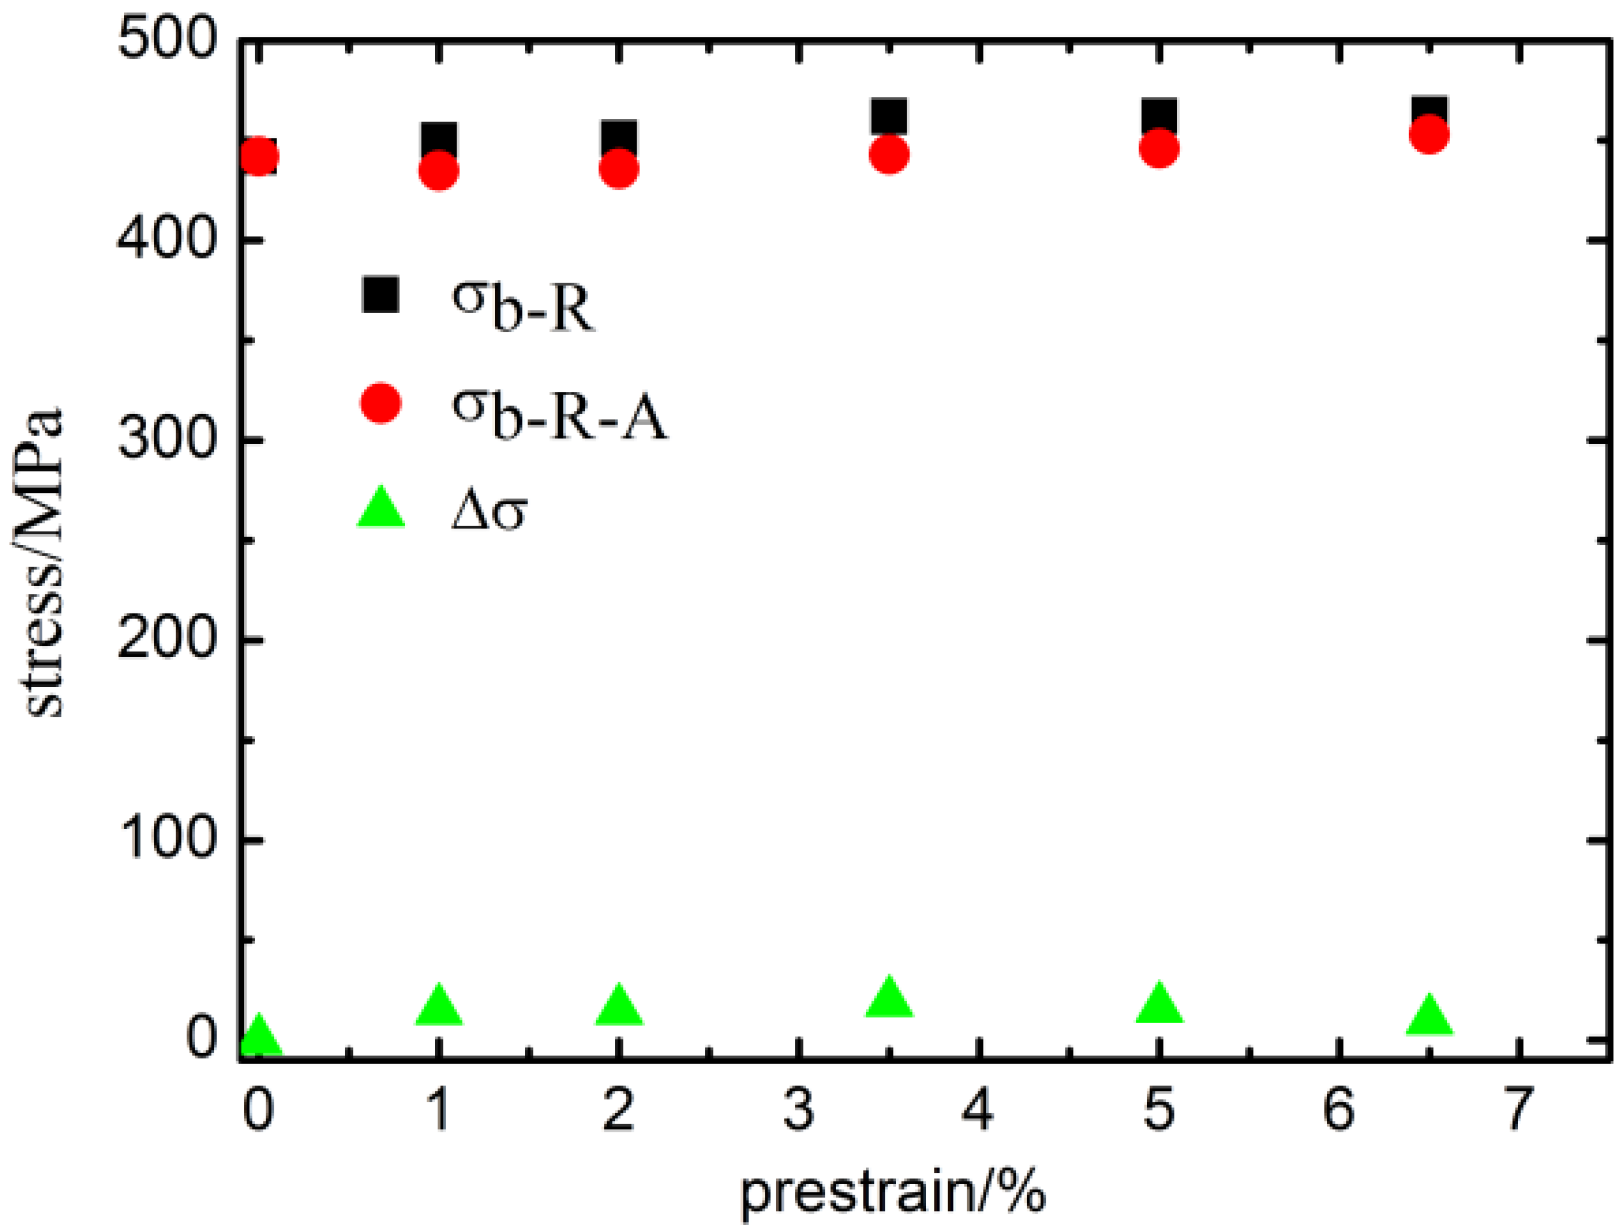
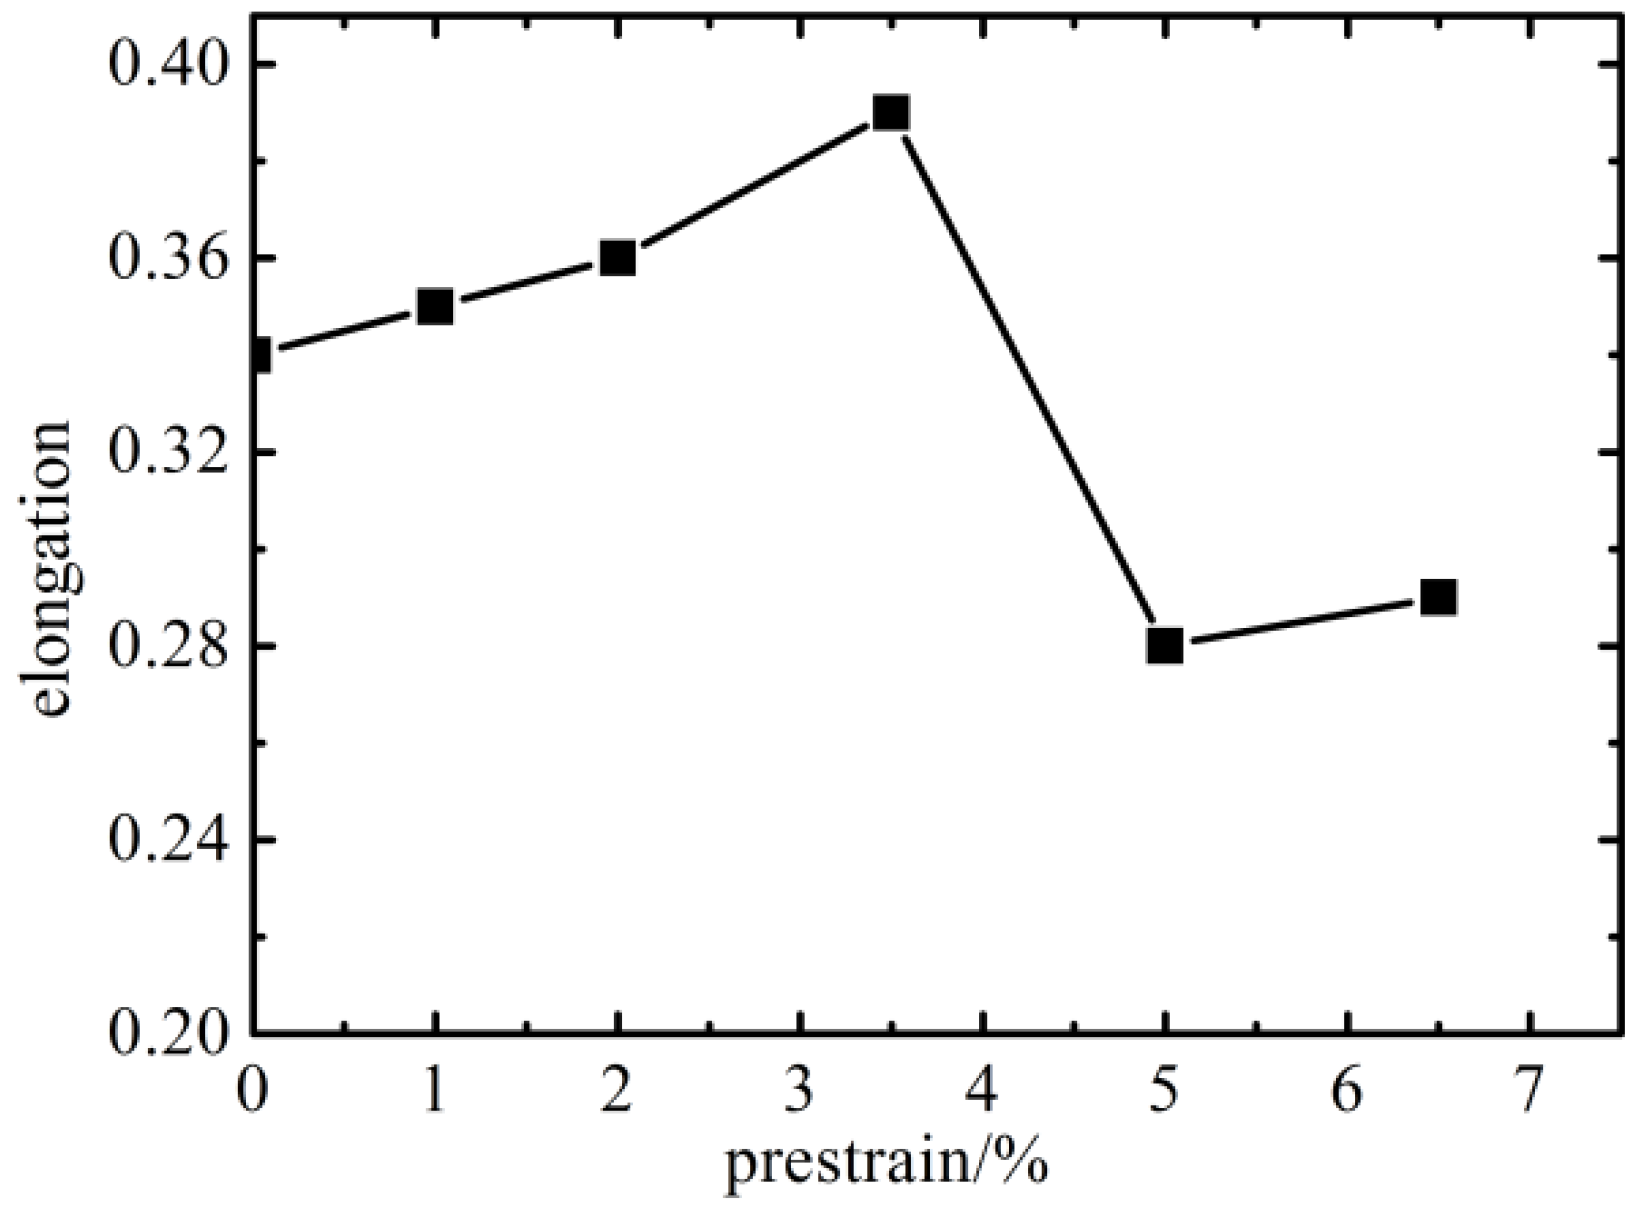
3.3. Tensile Properties of Prestrained Specimens after Annealing

In order to further analyze the phenomenon of discontinuous yielding occurs in higher prestrained specimens, subsequent annealing was conducted to remove dislocations. According to National military standard of the People’s Republic of China [35], stress relieving temperature is in the range of 445–595 °C and heating holding time is from 15 to 360 min. In order to establish proper heating parameters, the prestrained specimens were conducted heat-treatment at the temperature of 500 °C with 30–60 min and 600 °C with 30 min respectively. The results show that when prestrained specimens are heated at 500 °C, the yield and tensile strength no longer decrease as holding time up to 40 min. Additionally, compared with prestrained specimens without annealing, yield and tensile strength decrease. That means when holding time reaches to 40 min at 500 °C, most of dislocations can be eliminated. At the same time, after heat treatment at 600 °C and 30 min holding time, yield and tensile strength of prestrained specimens are equal to those of the as-received material. That indicates that recrystallization process of grain could be realized and both dislocations, twinning structures and other defects have been removed through heat-treatment at 600 °C and 30 min holding time. According to metallographic figures of different prestrained samples after annealing at 500 °C and 40 min, grain size and shape do not change, as shown in Figure 8. No twinning is observed in the two percent prestrained specimen and twinning structures in the five percent prestrained specimen keep same as these without annealing. This also implies that twinning structures in prestrained specimens couldn’t be annealing twins. Therefore, the heat treatment temperature and holding time were established as 500 °C and 40 min, which can eliminate the dislocations generated by prestrain and remain the twins. Engineering stress–strain cures of prestrained specimens after annealing are shown in Figure 9. It is observed that yield plateau of relative higher prestrain (εpre ≥ 3.5%) specimens disappears after annealing. Also, work hardening rate of prestrained CP-Ti after annealing is calculated according to true stress–strain curve. As most of dislocations is eliminated after annealing, it is expected that the variation of θ for prestrained specimens with annealing is consist with that of as-received CP-Ti, as shown in Figure 10. Work hardening rates of all specimens are positive and no rising stage can be observed. Additionally, the transitions between different stages of θ are consistent with those in Figure 4. Therefore, it is obviously demonstrated that the high dislocation density in prestrained specimens results in the appearance of yield plateau on reloading and rising stage of work hardening rate.
Further quantitative analysis of the contribution of dislocation hardening to the strain hardening of the material was made. In this paper, two parameters (Δσ1, Δσ2) were introduced, expressed as follows:
Δ σ 1 = σ R σ R A
Δ σ 2 = σ R A σ S
Δσ1, Δσ2 represents hardening contributions from dislocations associated mechanisms and other mechanisms, respectively. σS, σR and σRA refer to yield strength of as-received CP-Ti, prestrained specimens and prestrained specimens with annealing, respectively. From Figure 11, it can be seen that below the strain of two percent, the hardening mainly comes from the dislocations associated mechanisms and other hardening mechanisms are not important at this stage (about 3–4 MPa). As strain increases to 3.5%, Δσ2 (about 21–31 MPa) increases fast. With the increase of strain, the contribution on strain hardening from both the dislocations associated mechanisms and other mechanisms increases. Nevertheless, according to the variation of Δσ1/(Δσ1 + Δσ2) with prestrain in Figure 11, despite the decrease of contribution from dislocation hardening, dislocations associated mechanisms still occupy 80% of the overall strain hardening. Therefore, dislocations play an important role in strain hardening of CP-Ti during room temperature tensile along rolling direction. Also, it indicates that dislocation slip is the predominant plastic deformation mechanism. This is consistent with the results of Amouzou [31] and Roth et al. [33]. Based on Taylor-type relations between dislocation density and local flow stress, the quantified contribution of dislocation density to the increase of strength is expressed as follows:
σ p   =   σ 0 + M α G b ρ 1 / 2
where M, α, G and b are the Taylor factor, Taylor constant, shear modulus and Burgers vector, respectively; and σ0 is the lattice friction stress. According to the literature [31], the relation between dislocation density ( ρ ) and tensile strain (ε) is linear:
ρ = a 1 + a 2 ε
where a1 and a2 are constants. Thus, the variation of dislocation hardening stress (Δσ1) with prestrain (εpre) should satisfy the following relationship:
Δ σ 1 = c 1 + c 2 ( a 1 + a 2 ε p r e ) 1 / 2
where c1 and c2 are constants. From Figure 11, it is obviously that the relationship between Δσ1 and εpre satisfies Equation (8) and the correlation coefficient R is 0.97. After annealing treatment, ultimate tensile strength decreases, compared with prestrained specimens. The decrease of ultimate tensile strength in the 3.5% prestrained specimen is maximum, as shown in Figure 12. The elongation of prestrained specimens increases after annealing, as shown in Figure 13. When prestrain is less than 3.5%, the elongation of prestrained specimens after annealing is higher than the as-received CP-Ti. However, when prestrain is above five percent, the elongation of prestrained specimens after annealing starts to decrease compared with the as-received CP-Ti. This indicates that by proper heat treatment and certain prior plastic deformation, both the strength and ductility of CP-Ti can be improved.

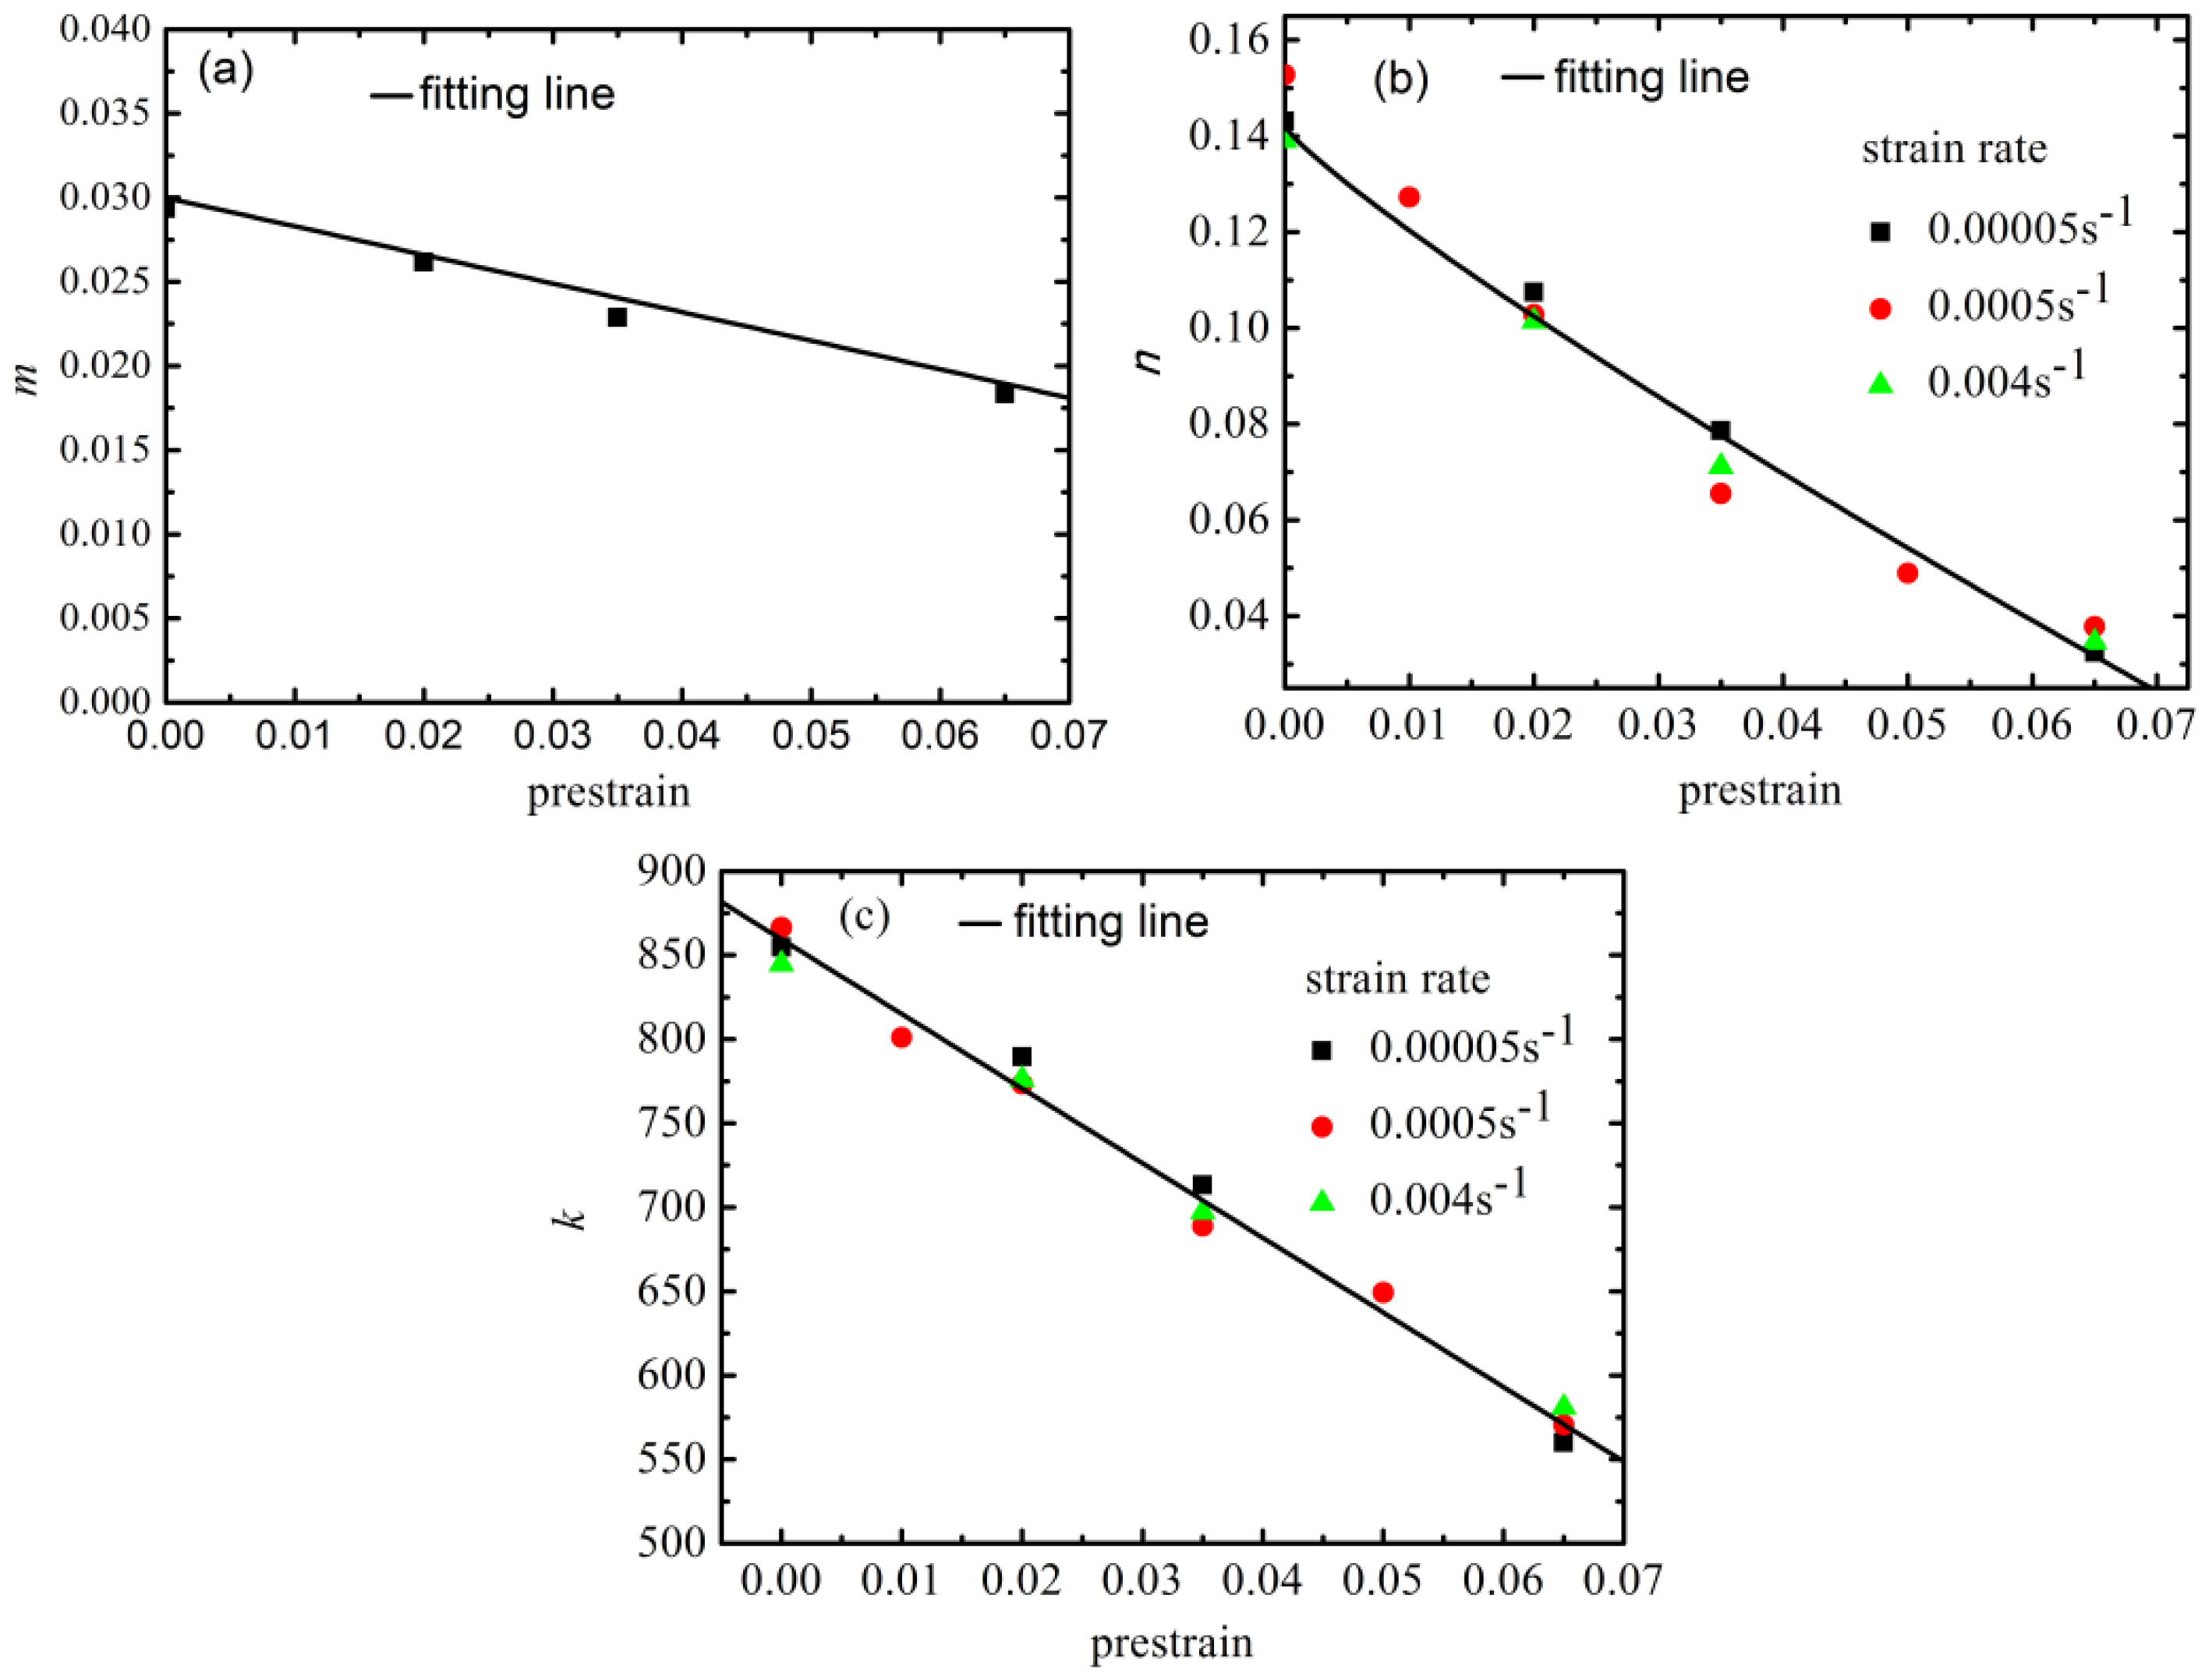
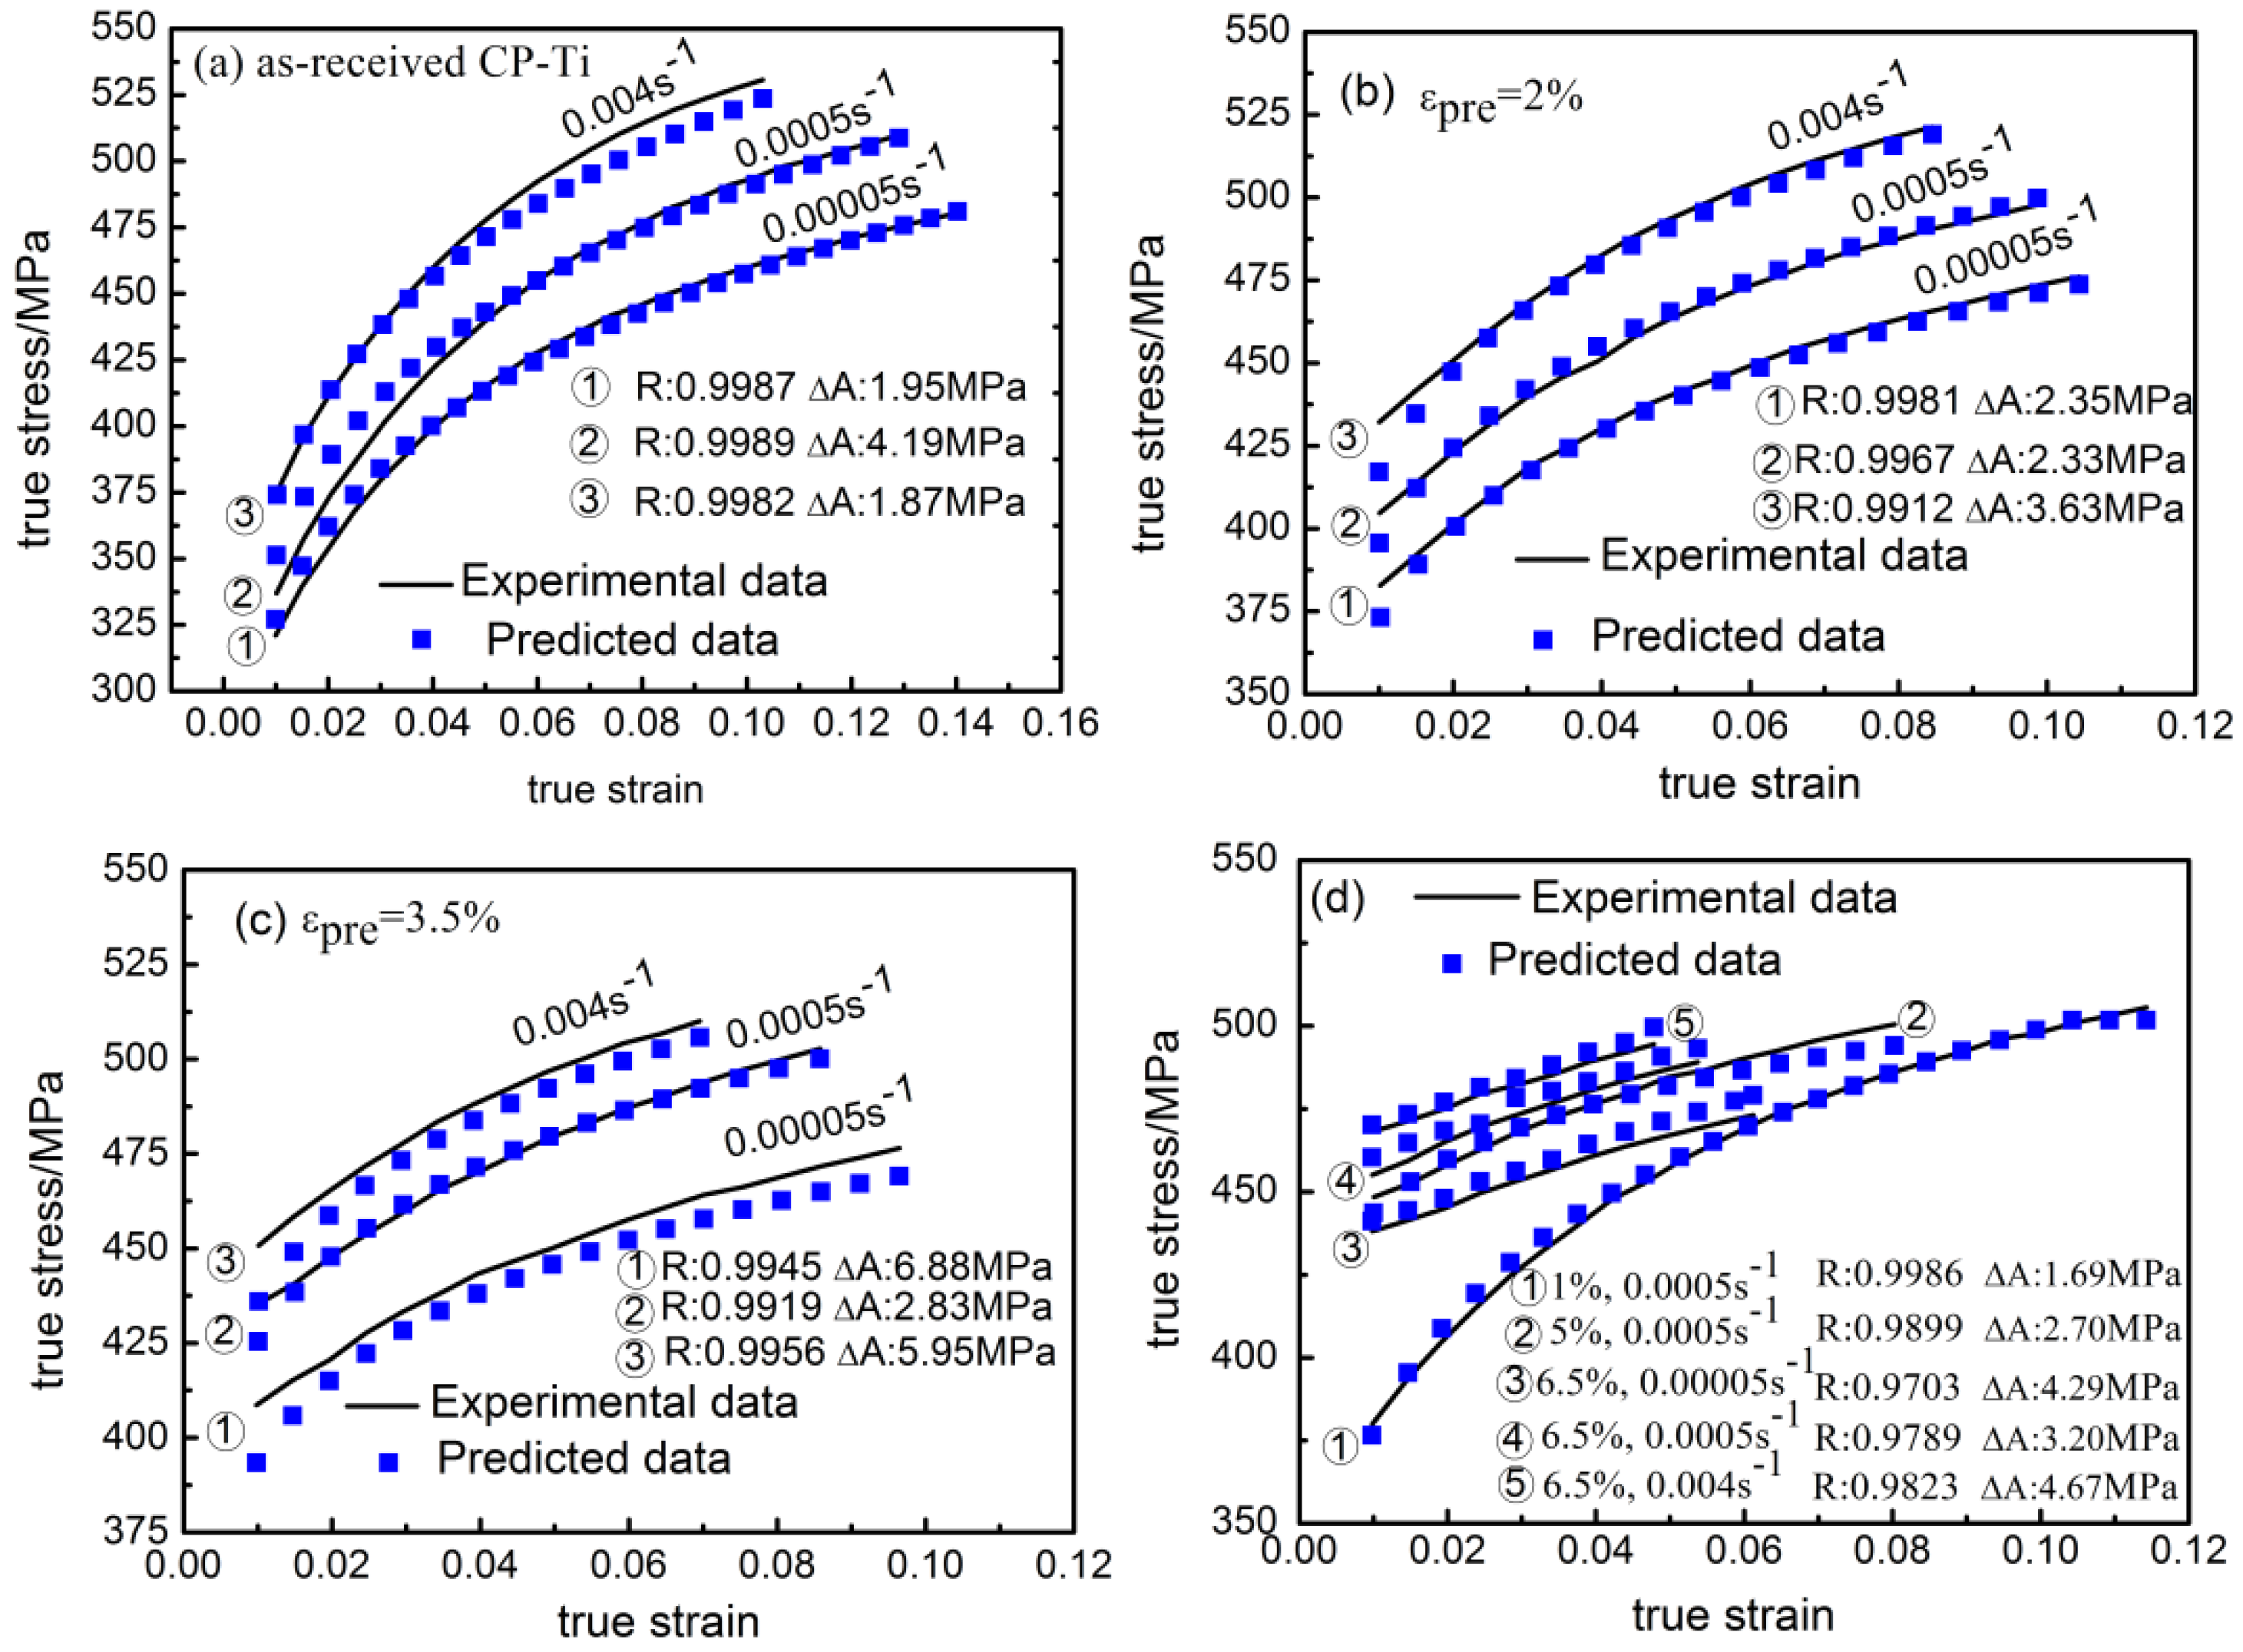
3.4. Constitutive Model of Prestrained CP-Ti

The Fields-Backofen model [36], expressed as follows:
σ = k ε n ε ˙ m
is commonly used to quantitatively describe the effects of strain rate sensitivity and strain strengthening on stress–strain curves of the homogeneous strain strengthening region, where k is the strength coefficient, n is the strain hardening exponent, and m is the strain rate sensitivity exponent. According to true stress–strain curves of prestrained CP-Ti at different strain rates, the variation of strain rate sensitivity index m( log σ / log ε ˙ ) with prestrain is presented in Figure 14a. SRS of prestrained CP-Ti decreases linearly with prestrain. Strain hardening exponent n( log σ / log ε ) and strength coefficient k( σ / ε n ε ˙ m ) of prestrained CP-Ti at different strain rates are calculated in Figure 14b,c. The values of strain hardening exponent and strength coefficient almost keep constant at different strain rates, as shown in Figure 14b,c. Both n and k decrease with prestrain. Based on experiment data, m, n and k as functions of prestrain were fitted as follows:
m = 0.17 ε p r e + 0.03
n = 1.19 ε p r e 0.87 + 0.14
k = 4440.70 ε p r e + 859.49
Thus, the modified Fields–Backofen model containing prestrain is finally obtained as follows:
σ = ( 4440.70 ε p r e + 859.49 ) ε 1.19 ε p r e 0.87 + 0.14 ε ˙ 0.17 ε p r e + 0.03
In order to investigate the prominence of the modified constitutive model, comparisons between the experimental data and the flow stress predicted by the modified constitutive model at different strain rates are shown in Figure 15. In addition, the predictability of the constitutive equation is verified via employing standard statistical parameters, such as absolute deviation (ΔA) and correlation coefficient (R), as shown in Figure 15a–d. At different strain rates, the values of correlation coefficient R in Figure 15a–d are above 0.97, hence the modified Fields-Backofen model shows a very high degree of goodness of fit. It is found that the absolute deviation of flow stress obtained from the modified constitutive model varies from 1.87 to 6.88 MPa. The constitutive equations gives the least absolute deviation of 1.87 at 0.004 s−1 of as-received CP-Ti and the largest absolute deviation of 6.88 at 0.00005 s−1 of 3.5% prestrained sample. Thus, the proposed constitutive equation presents a good estimate of the plastic flow stress for prestrained CP-Ti at different strain rates.

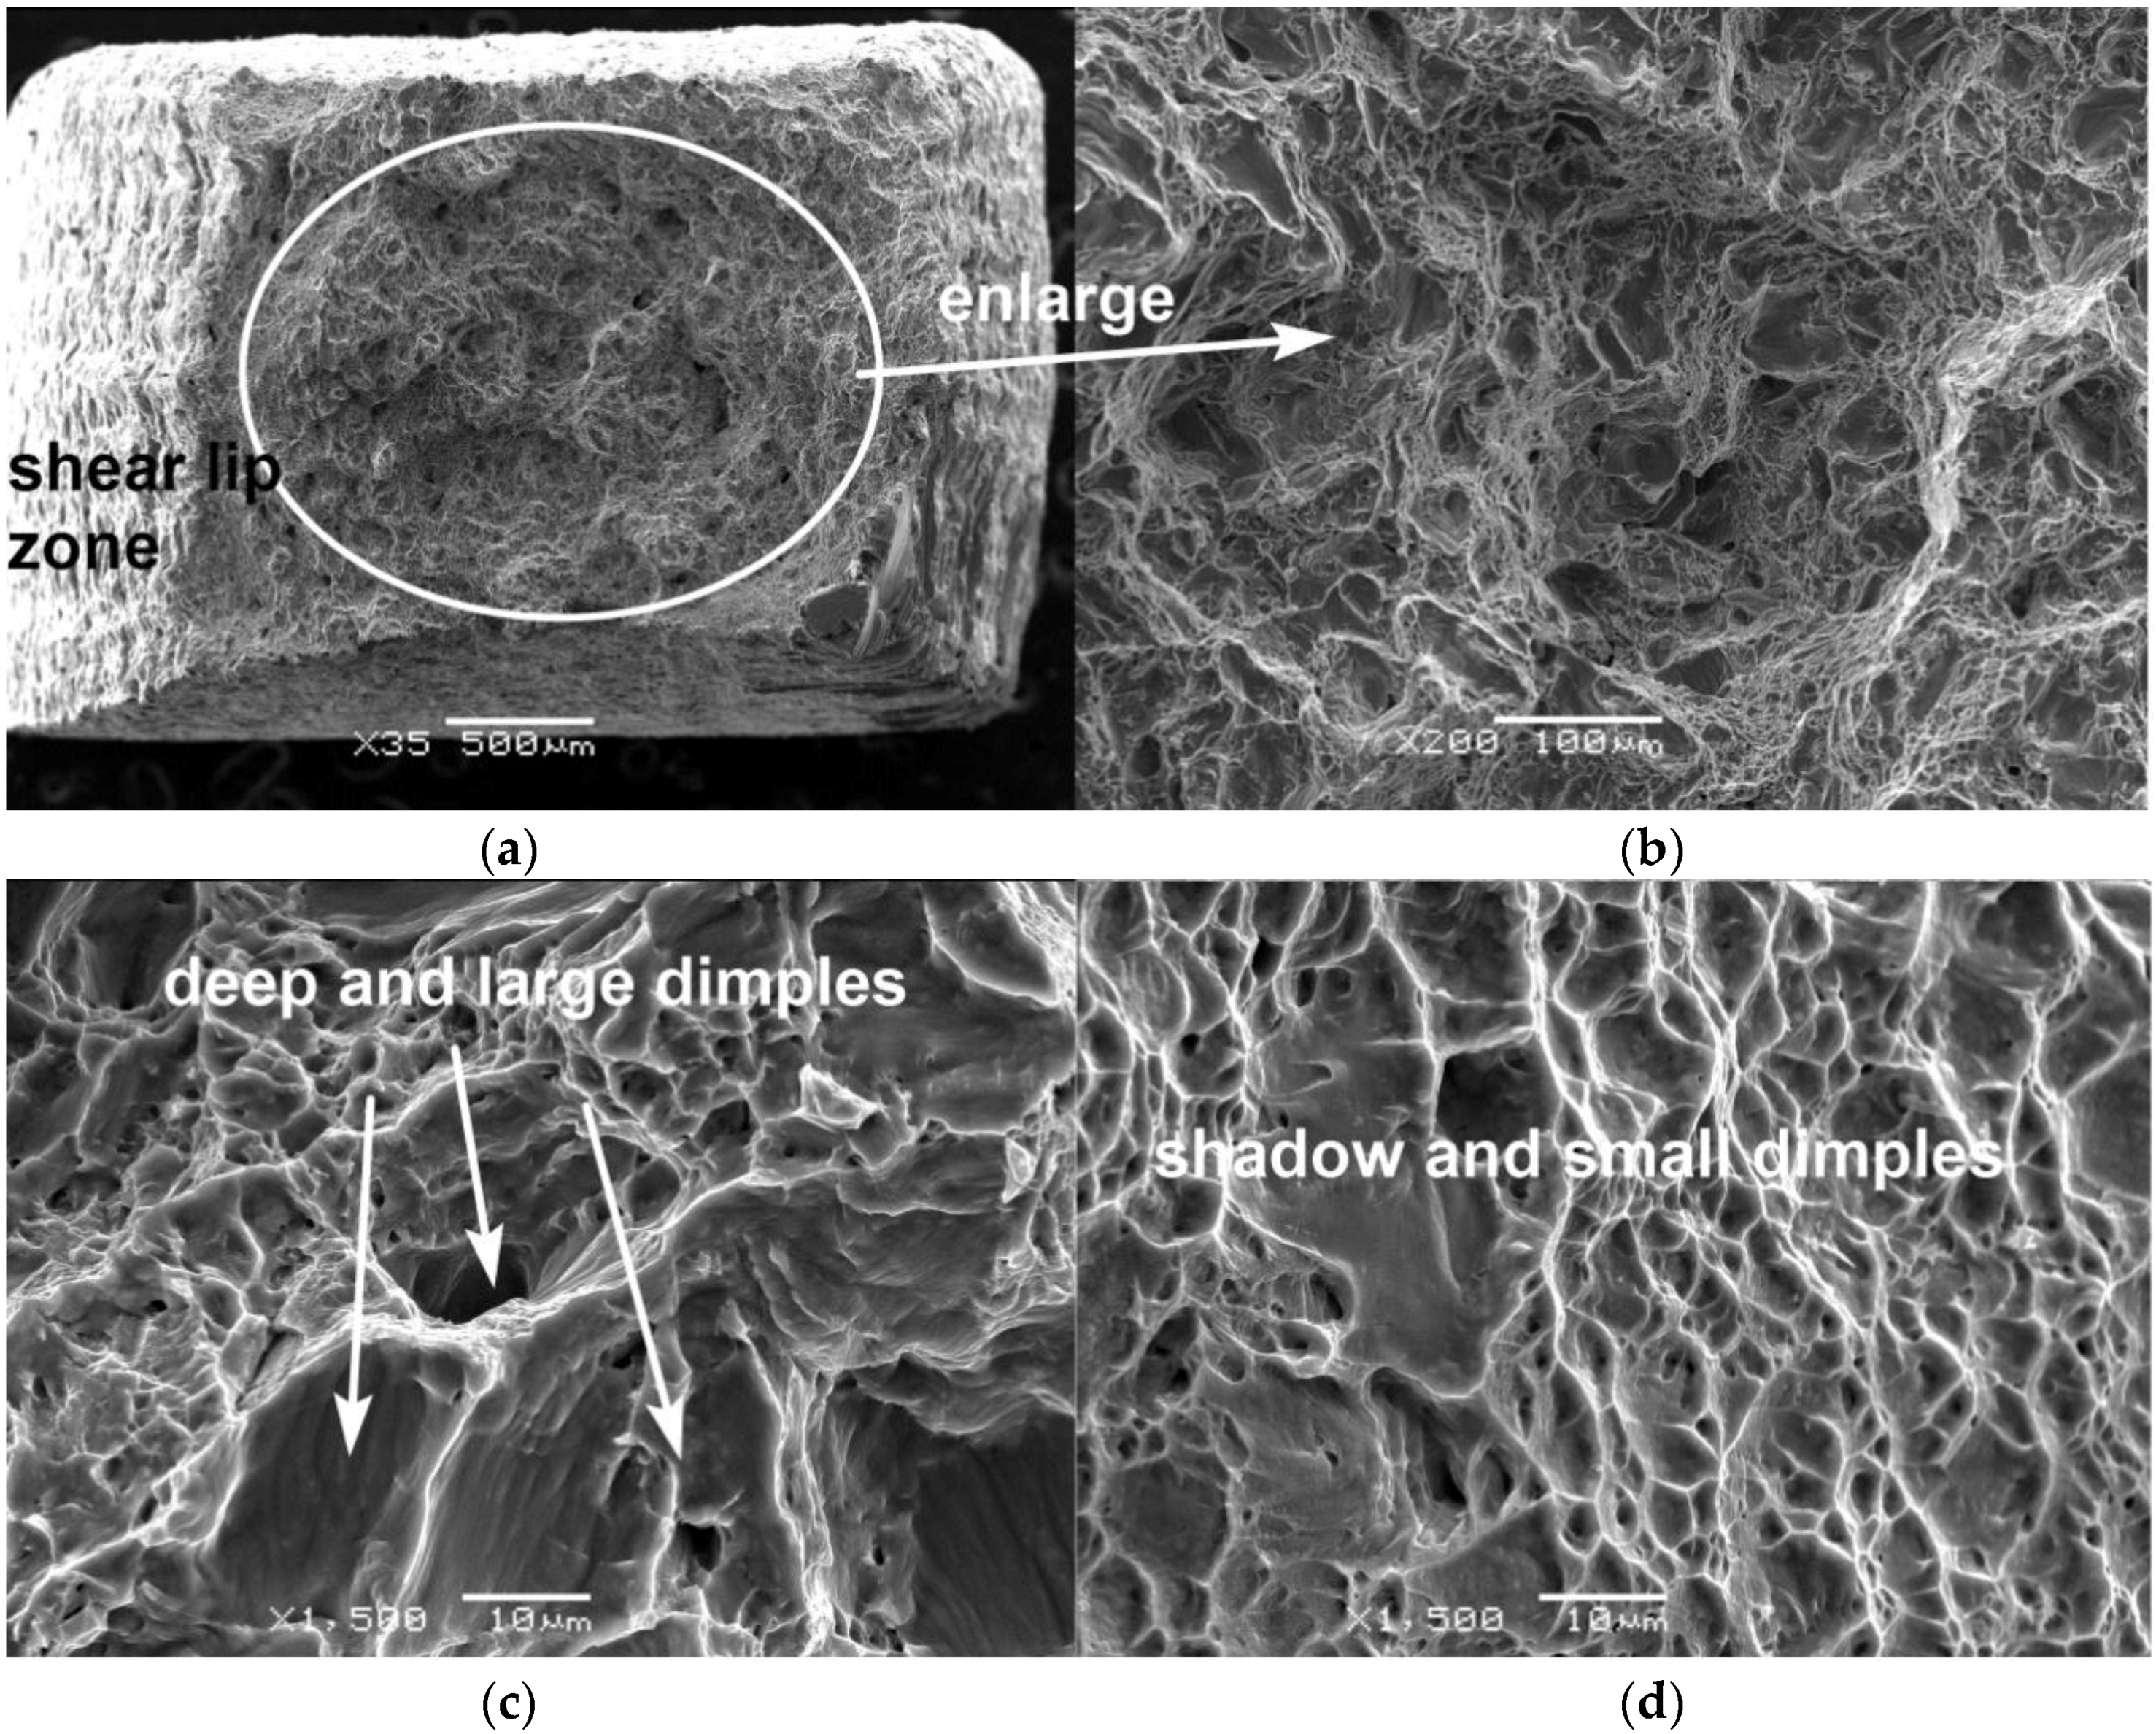
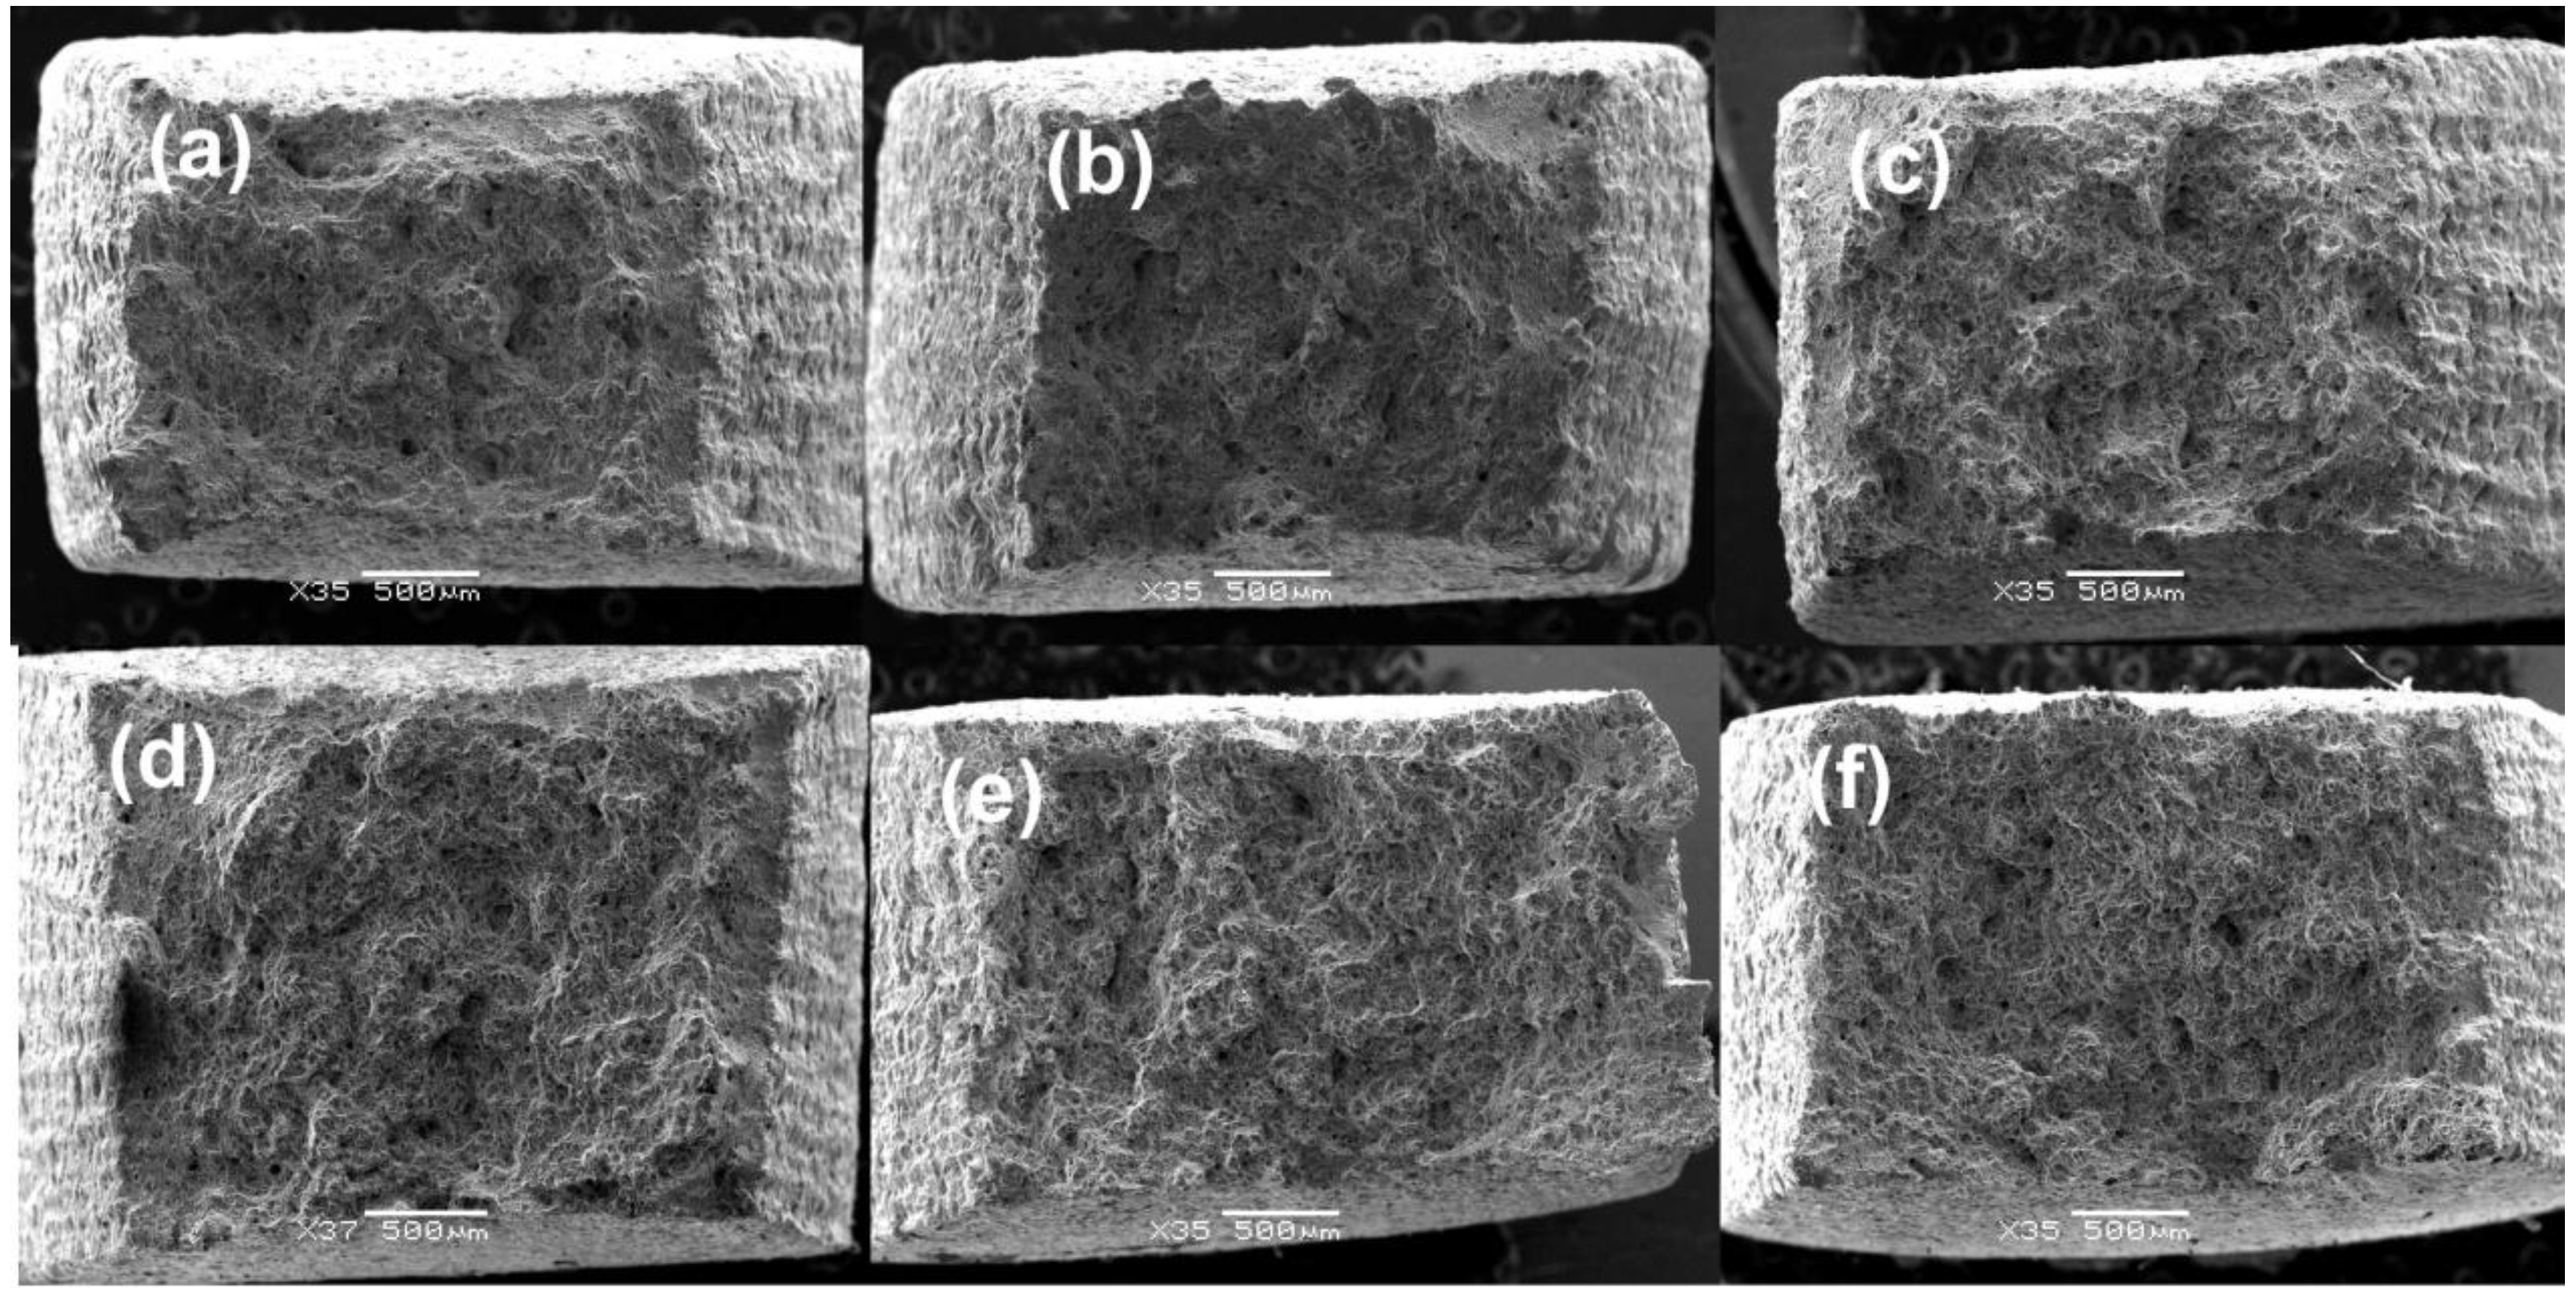
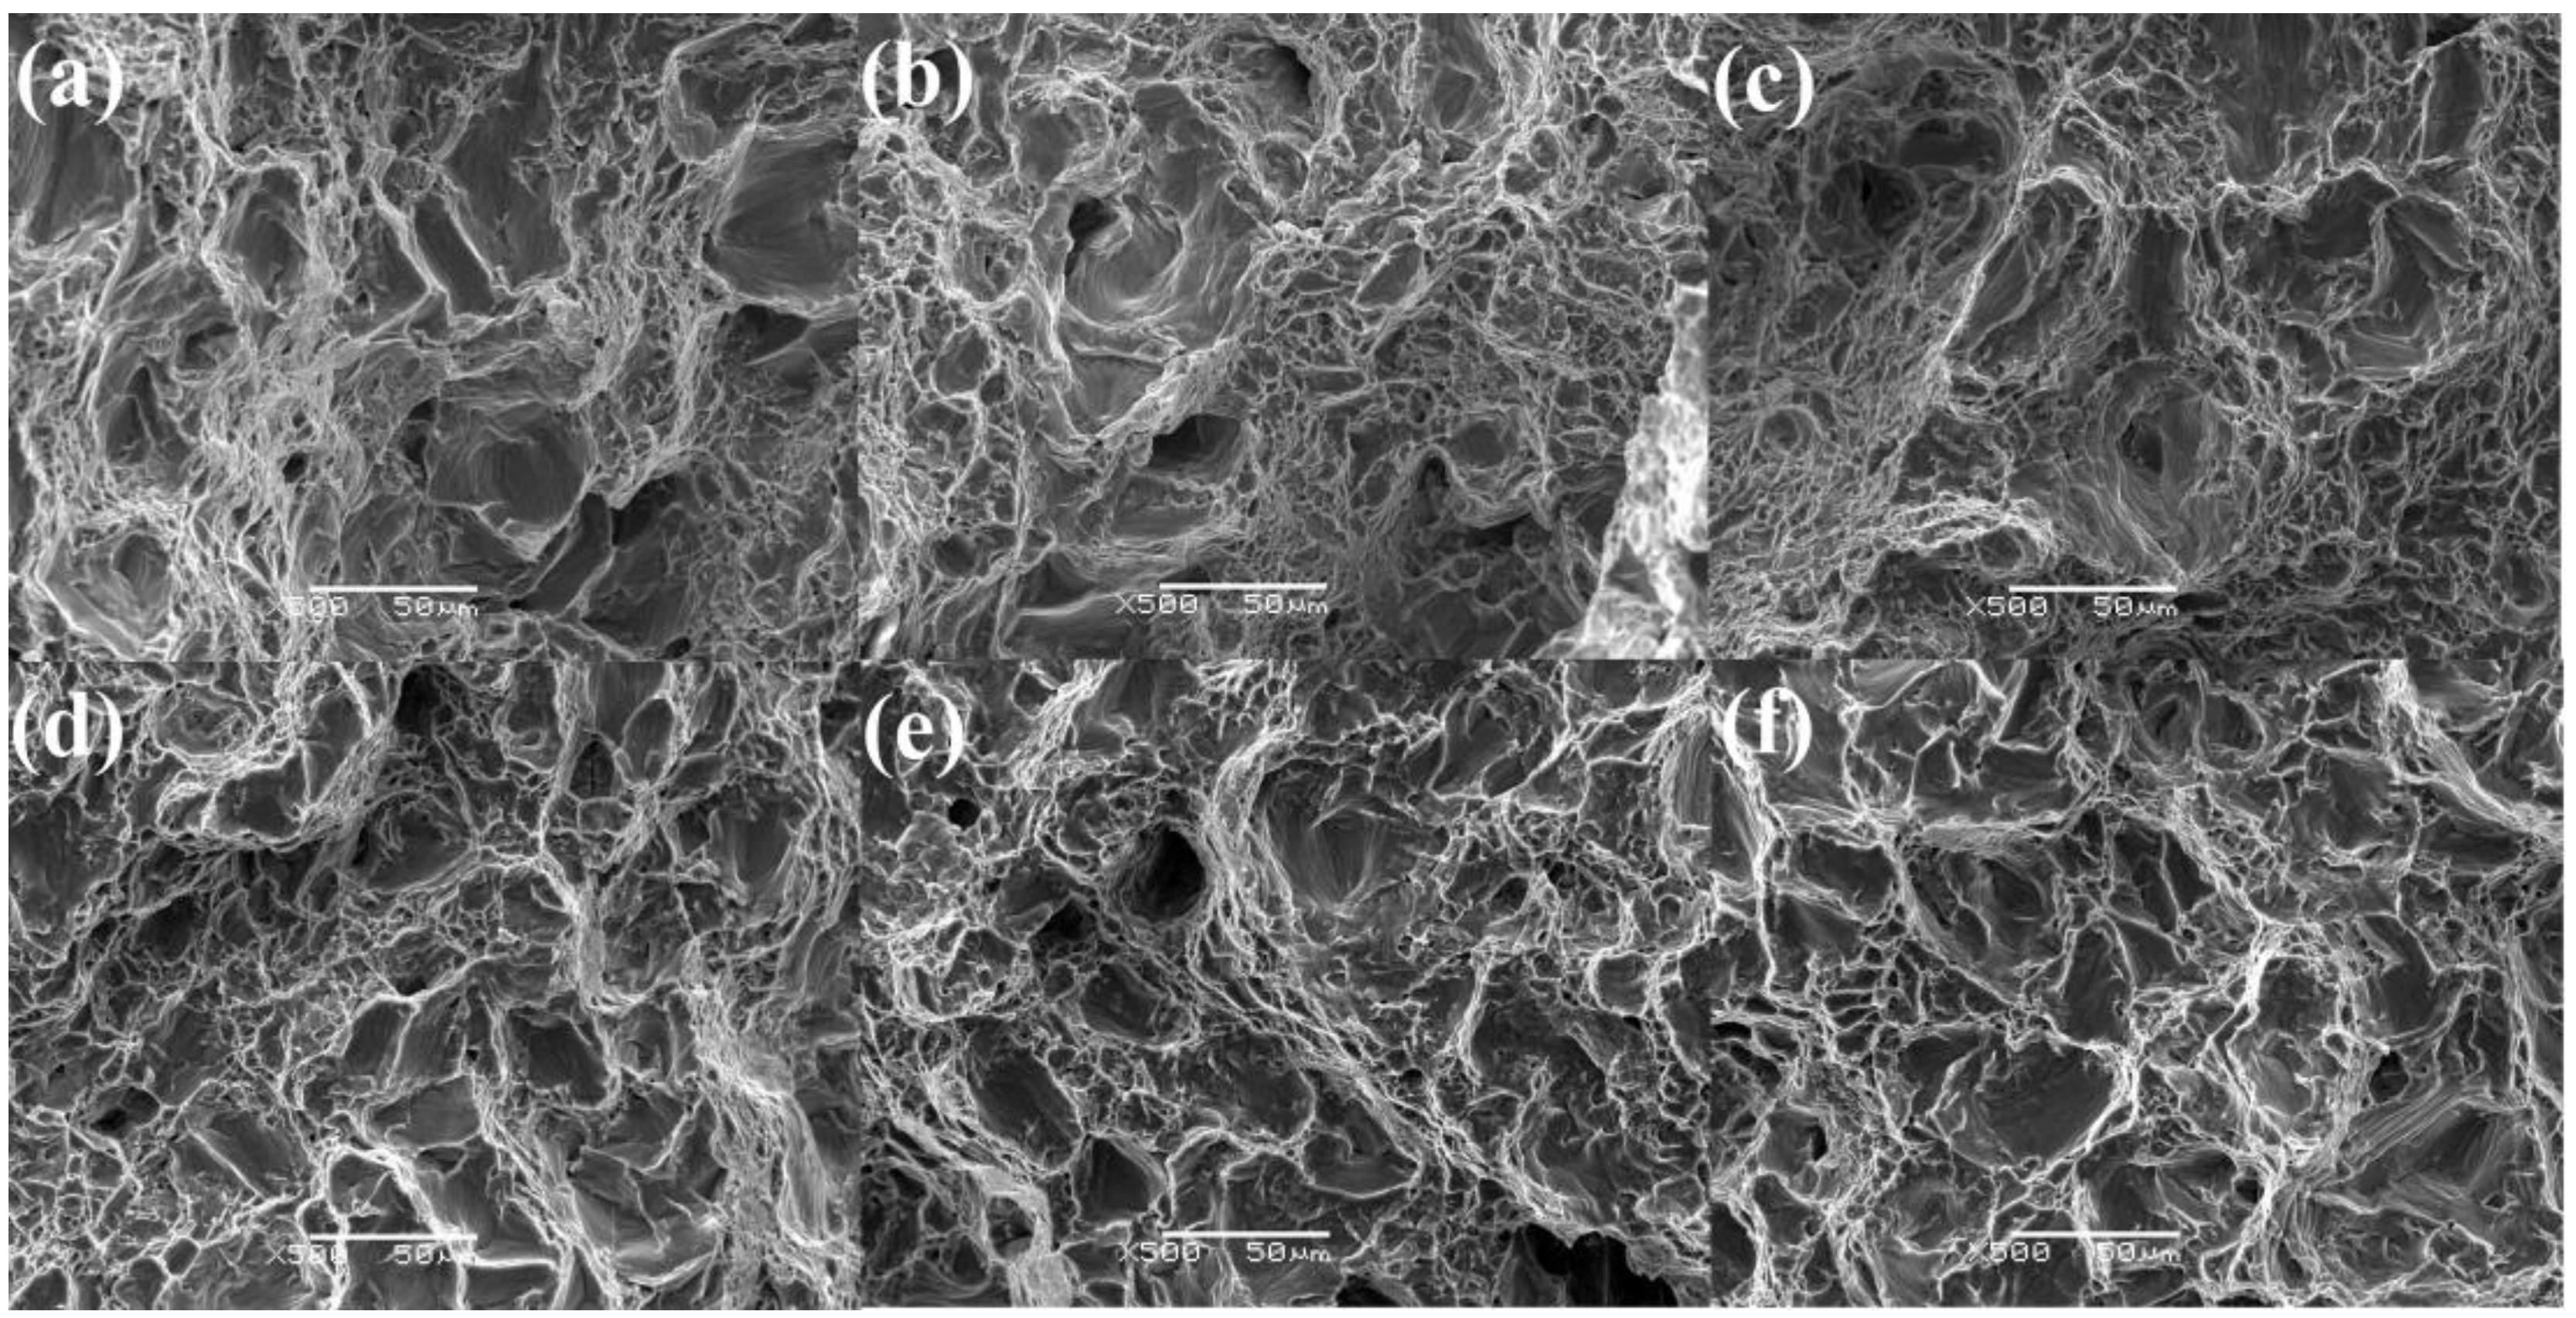
3.5. Fracture Behavior

Scanning electron microscopy (SEM) images of the fracture surfaces of as-received CP-Ti were presented in Figure 16. SEM images of the fracture surfaces show that the fracture mode of as-received CP-Ti is mostly ductile at room temperature. In Figure 16a, the central region is a crack propagation area with massive strong nests, and the outer region is a shear lip zone with shallow dimples and micro-pores. The central region shows more ductile deformation features than the outer shear-lip region, which has a flat surface with shallow dimples, as shown in Figure 16c,d. The mechanism for ductile crack growth can be characterized by micro-void nucleation, growth and coalescence. As the specimen is loaded, local strains and stresses at the crack tip become sufficient to nucleate void. These voids grow and link with the main crack [37].
The failure locations of prestrained and prestrained samples with annealing present pronounced necking feature, as shown in Figure 17 from macro view. The failure locations of all tested samples show that ragged fracture surface with some macro voids across the whole cross section of fracture surface, and relatively flat shear lip zone was detected in marginal area. Magnified images of central region of fracture surfaces were presented in Figure 18. It is obvious that the size of dimples shown in Figure 18d,f is larger than that in Figure 18a–c, the depth of dimples is much deeper and its distribution is more uniform. The more ductile deformation in prestrained CP-Ti after annealing indicates that the ductility of prestrained CP-Ti is improved by annealing. The increase in ductility is a result of high dislocation mobility, where the crack tip is proceeded by a plastic deformation mechanism that forms dense arrays of dimples without cleavage steps and facets [38].

4. Conclusions

In the present paper, the effect of prestrain and subsequent annealing on the mechanical behaviors of CP-Ti along cold rolling direction was investigated. The main results presented in this paper are as follows:
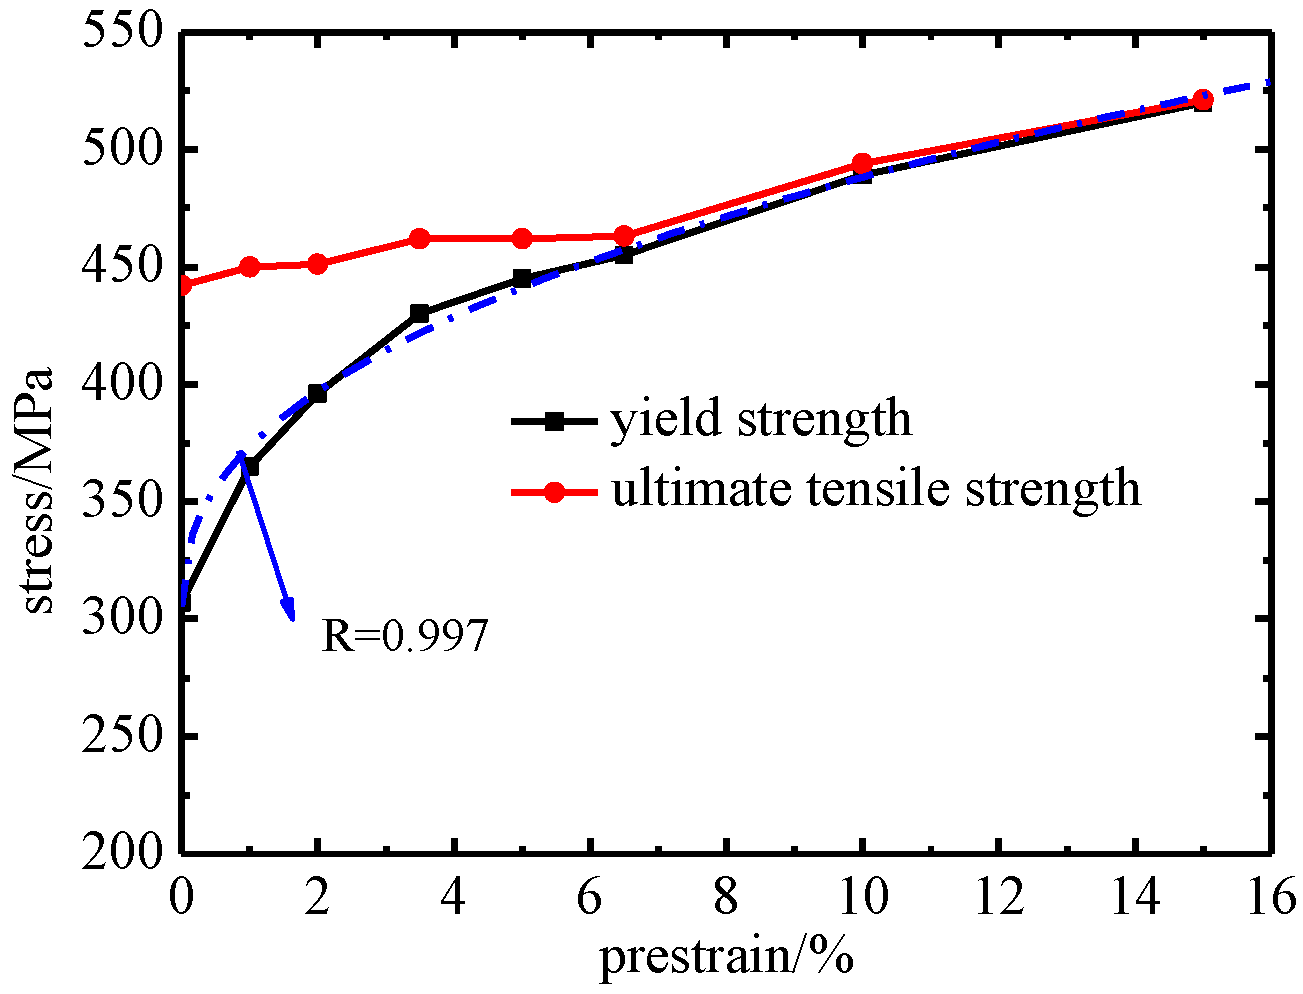
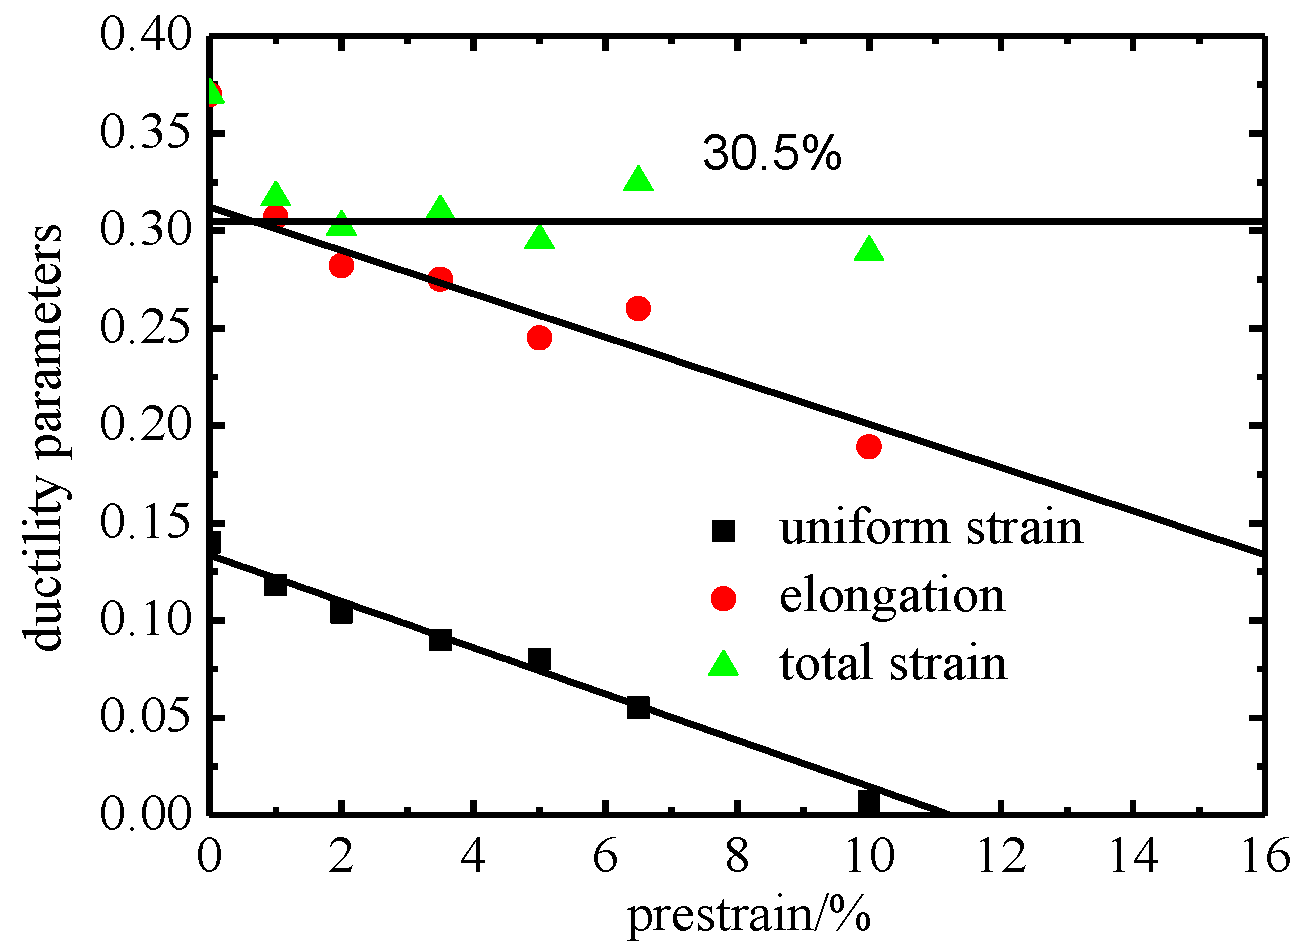
  • Engineering yield strength and tensile strength increase with the tensile prestrain. The relationship between prestrain and yield strength can be described by power law. Elongation and uniform strain decrease linearly with increasing the tensile prestrain, and total strain is almost constant, which is slightly less than as-received CP-Ti.
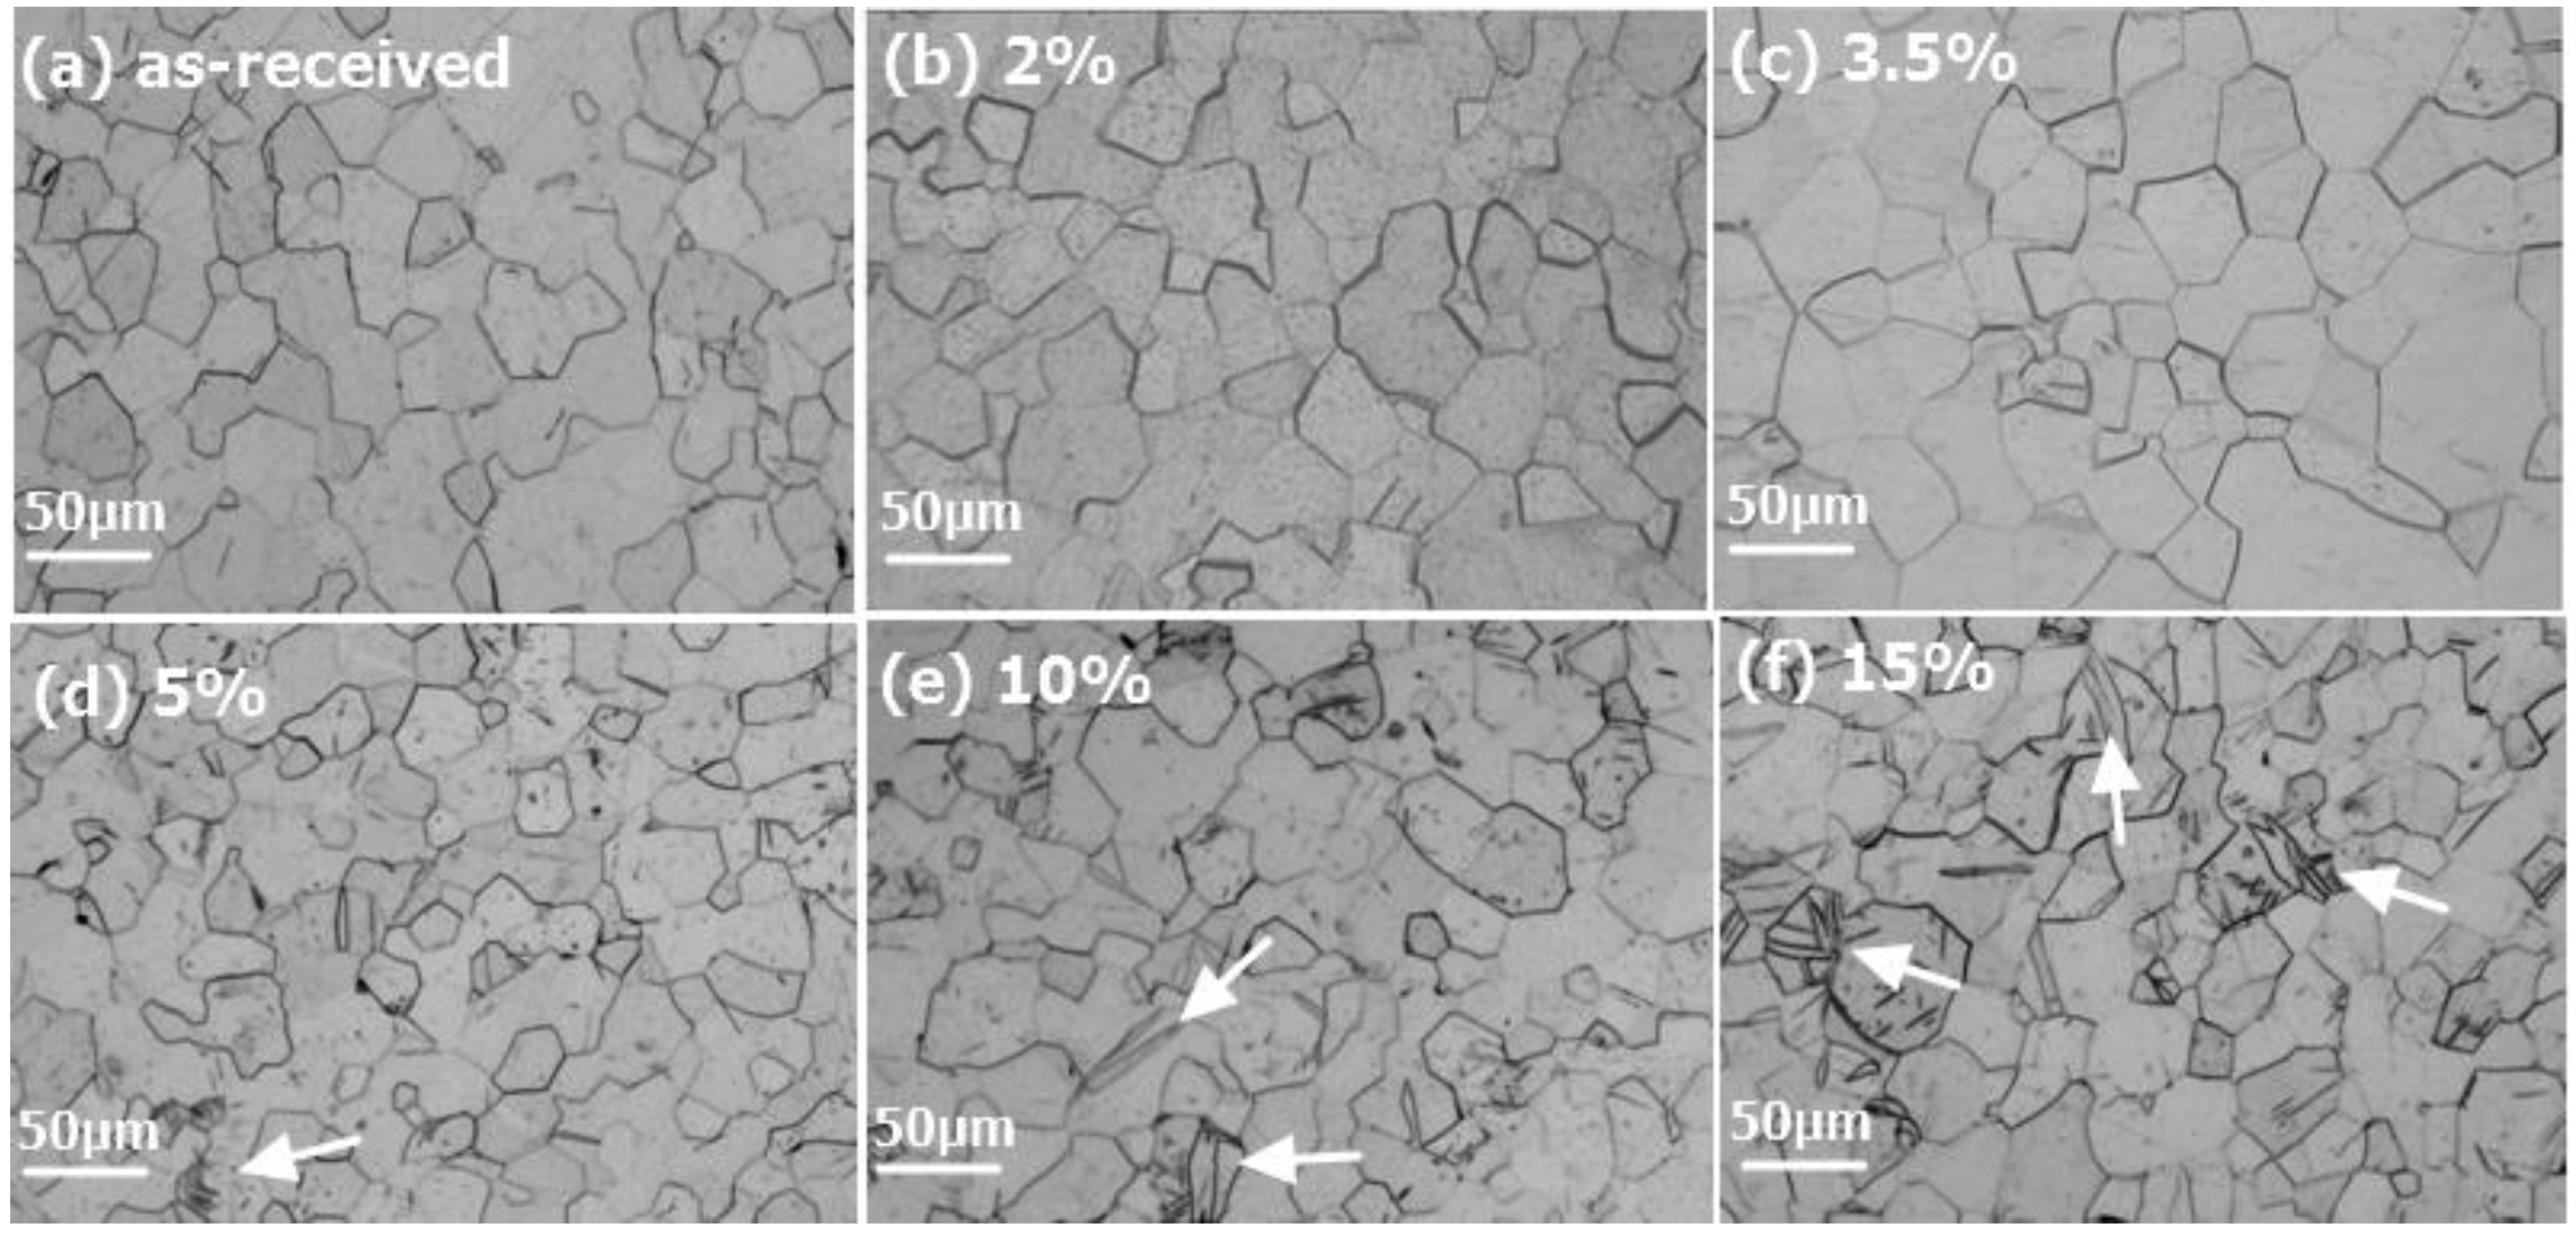
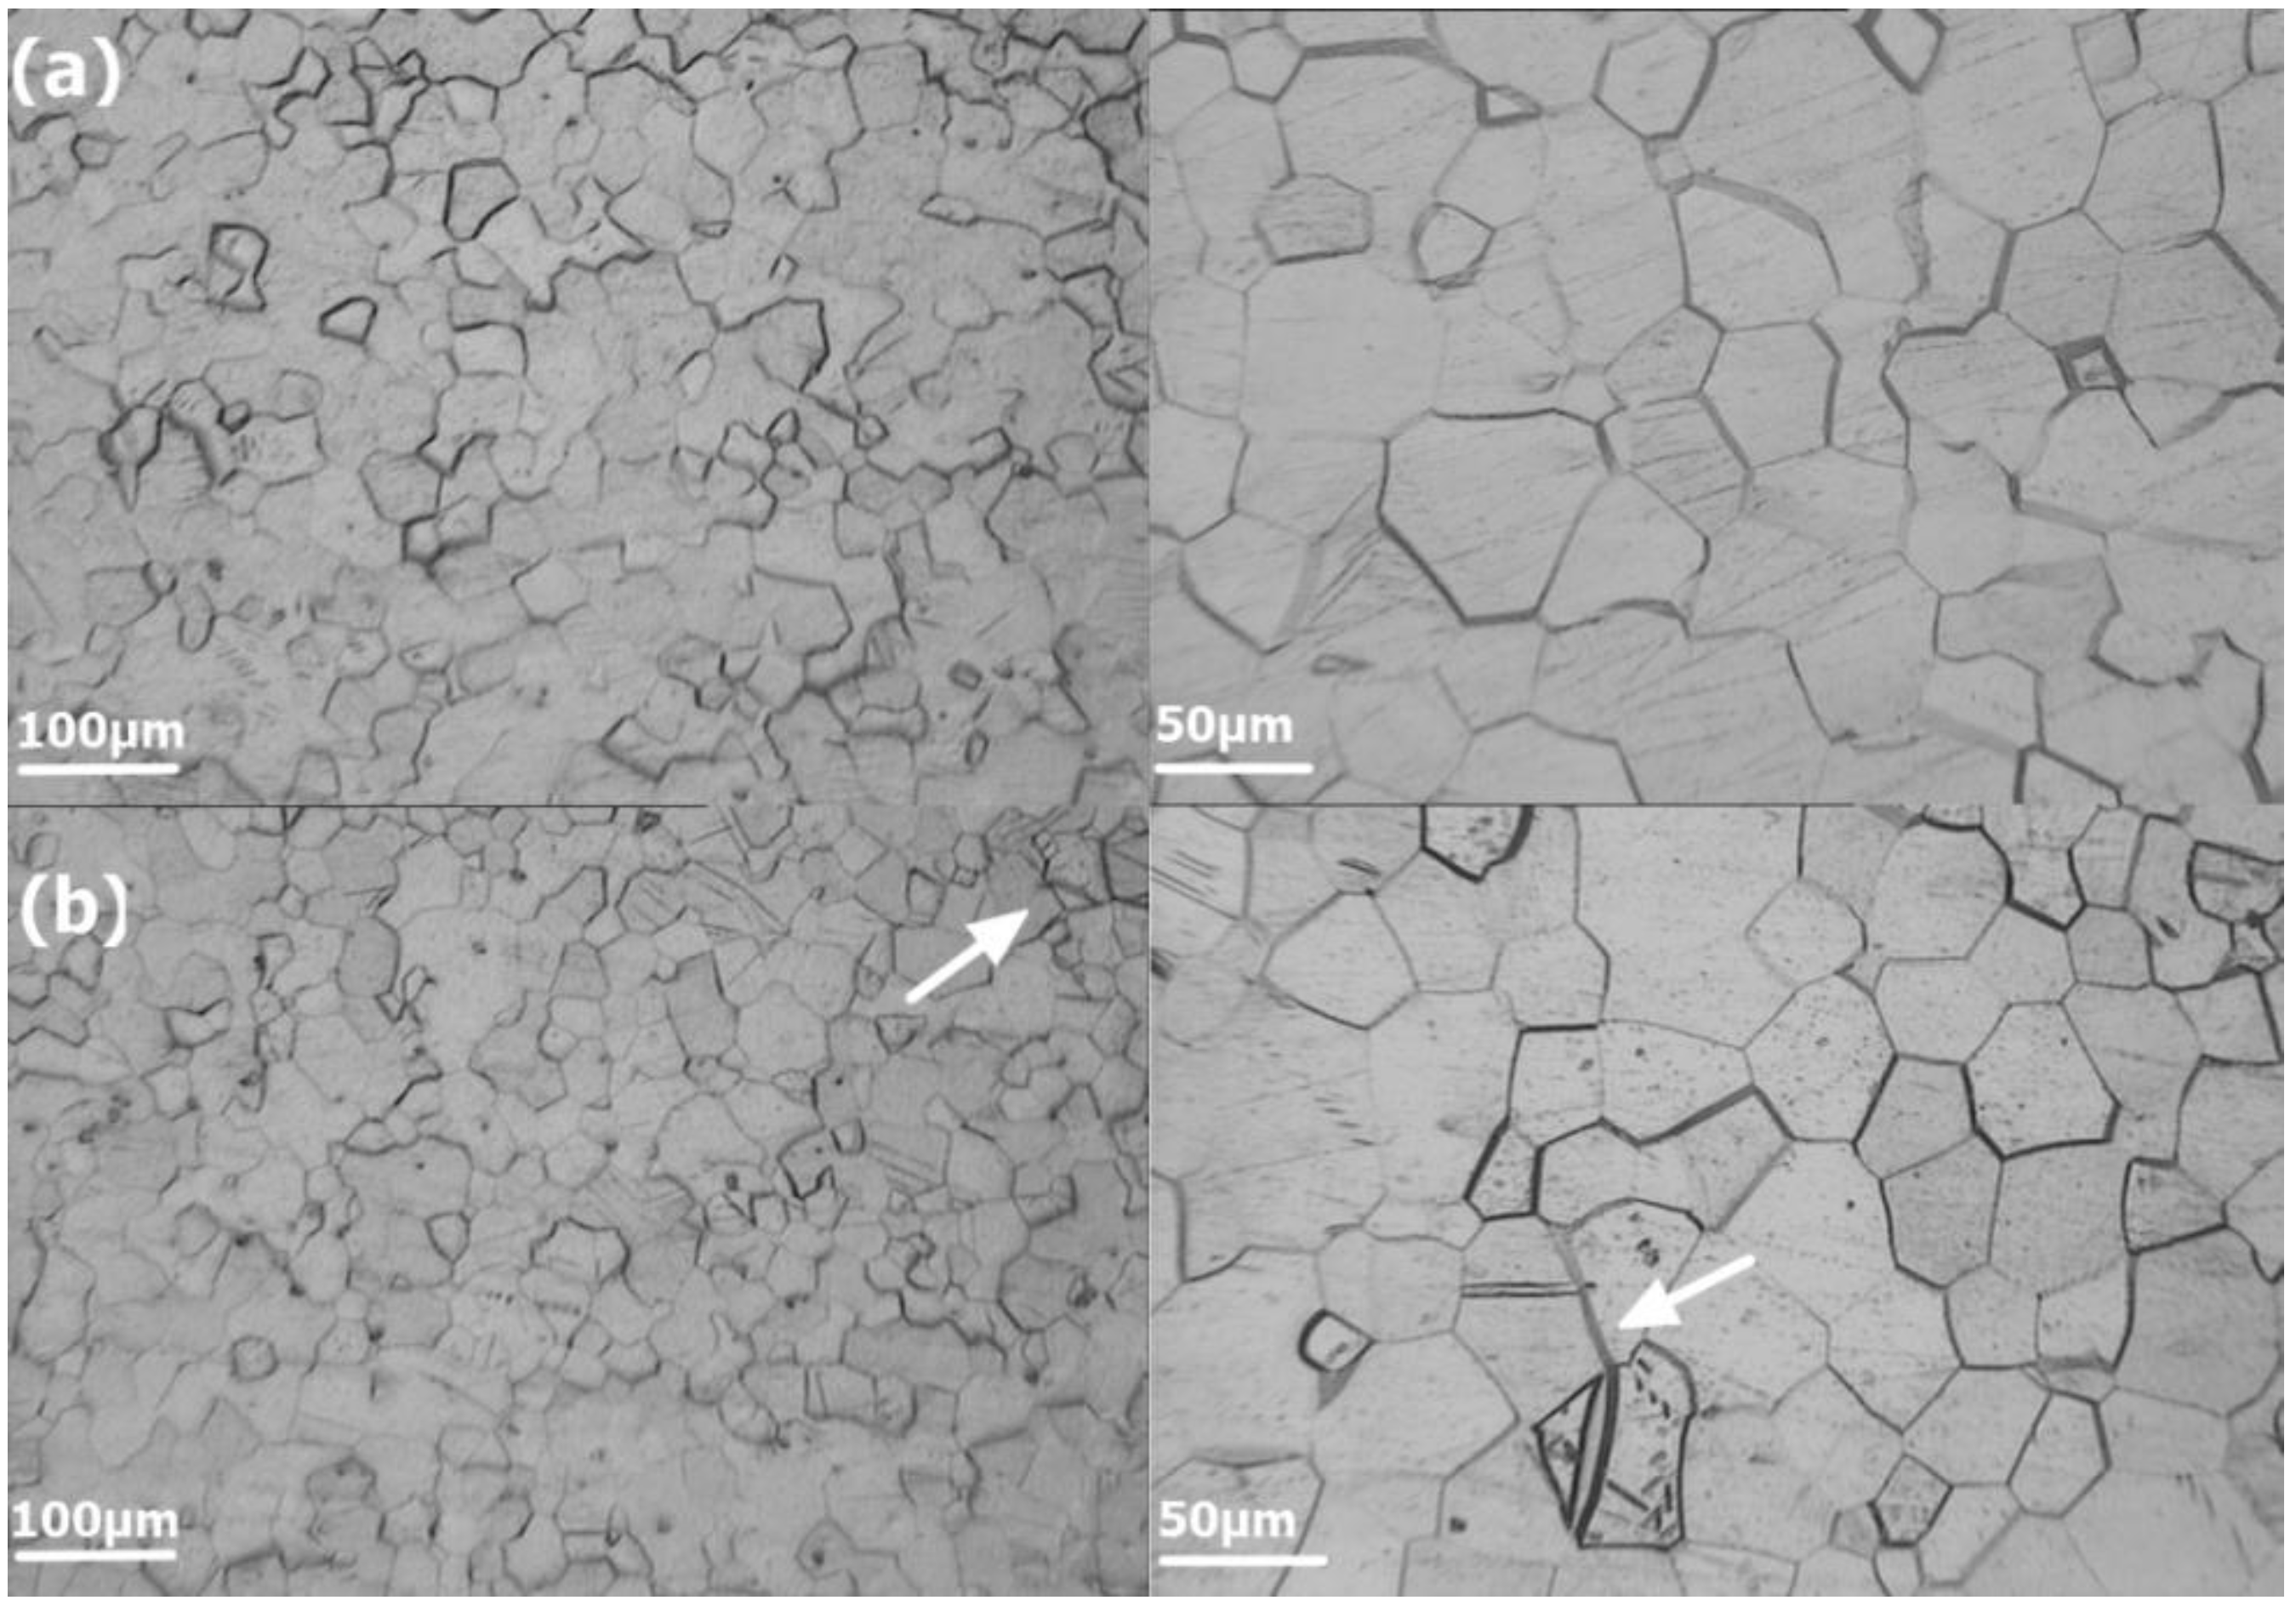
  • At the condition of prestrain higher than 3.5%, yield plateau is observed in the engineering stress–strain curves. Through metallographic observations and heat treatment, considerable number of dislocations produced in prestrain is determined as the factor account for the appearance of yield plateau during reloading.
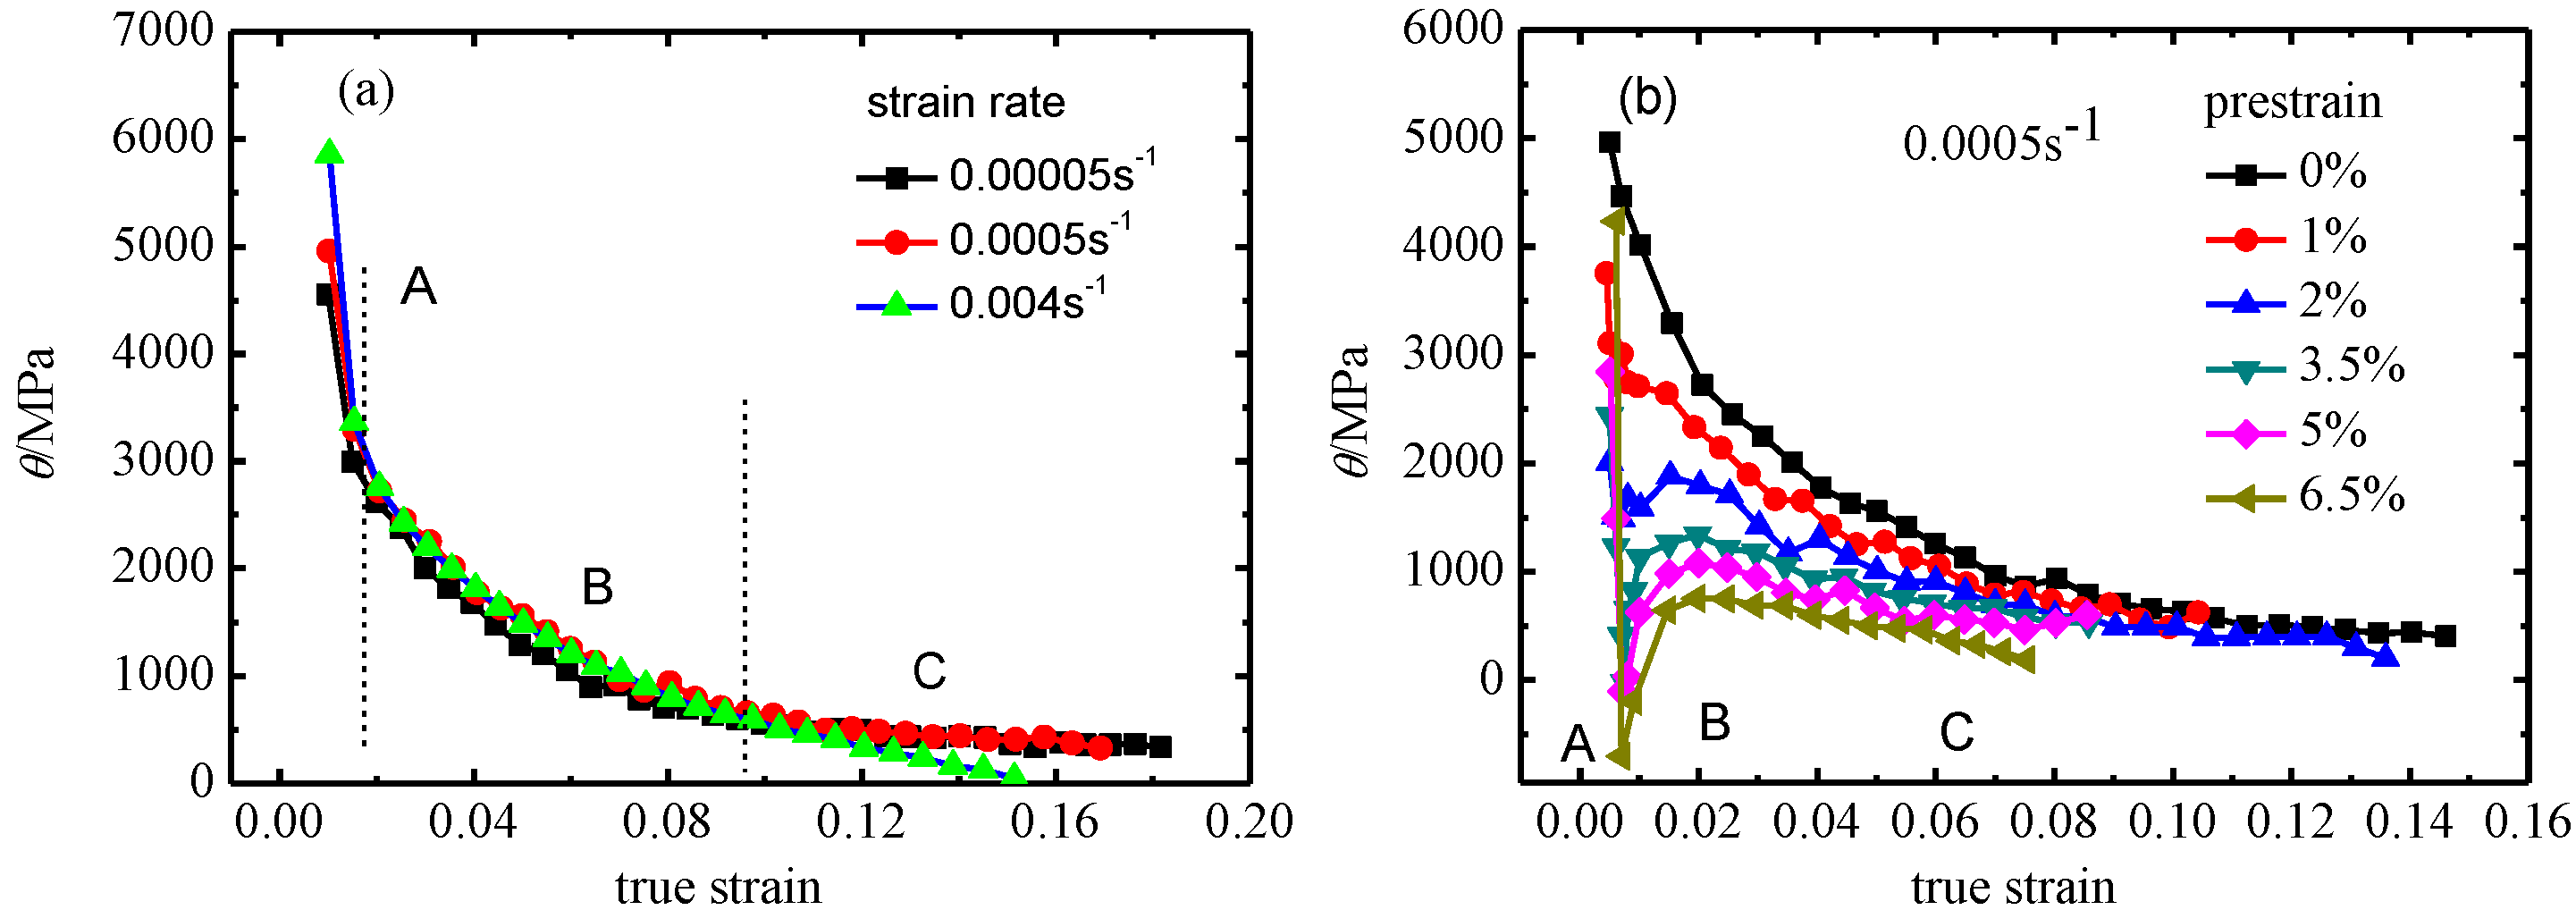
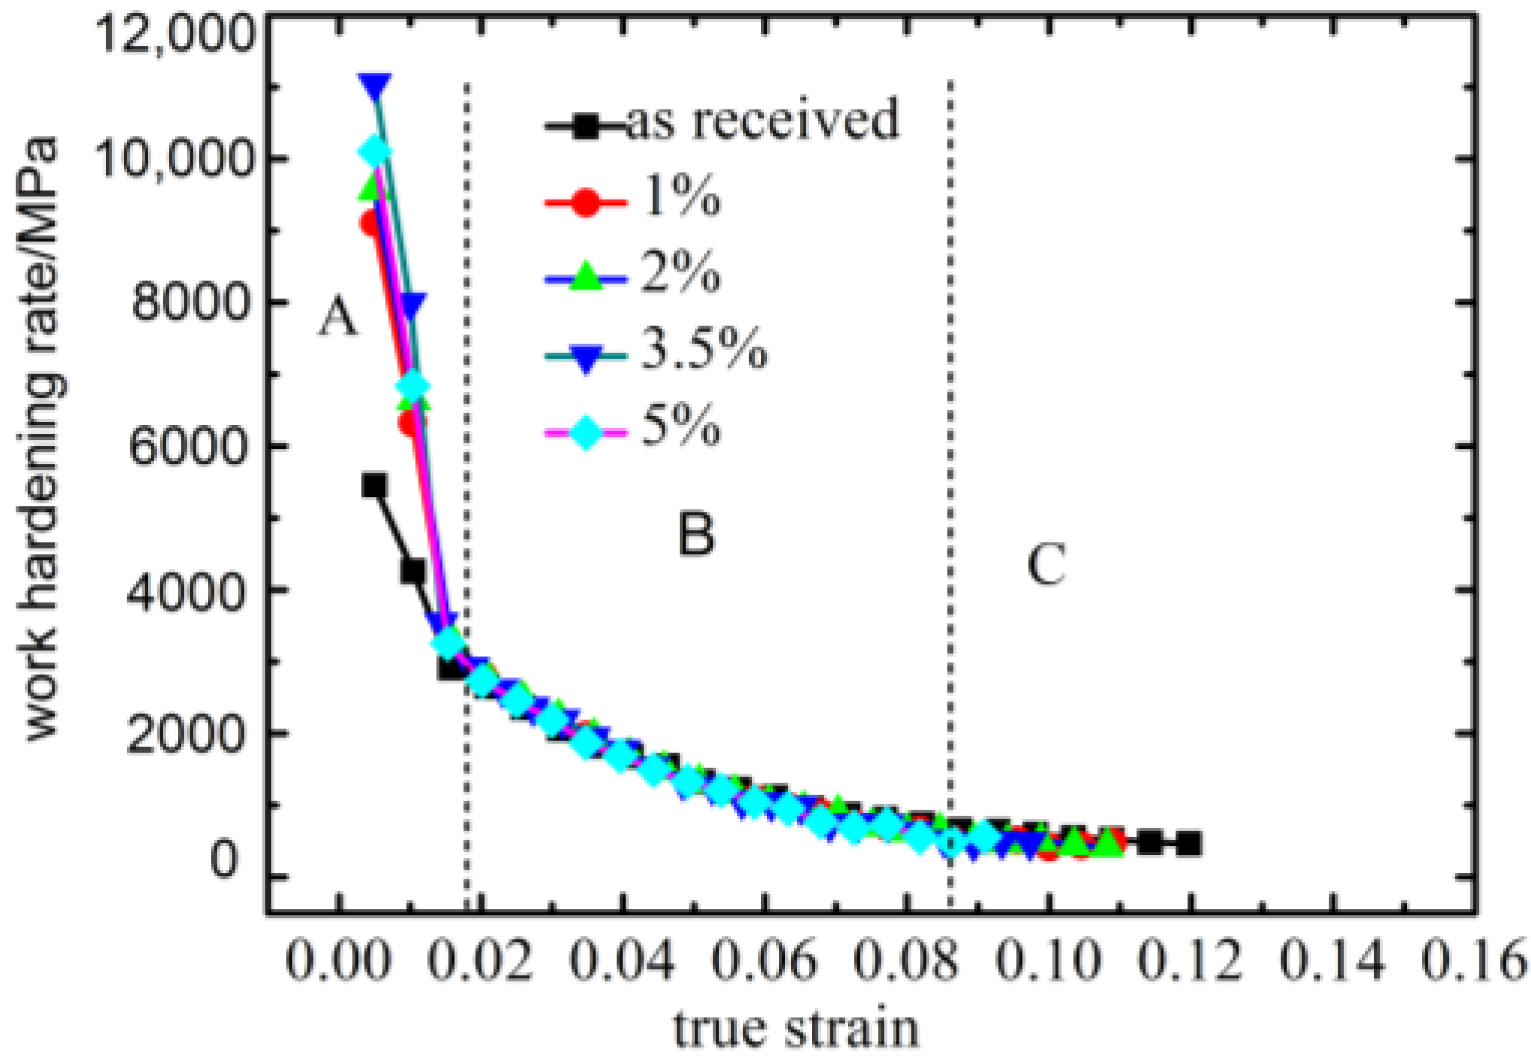
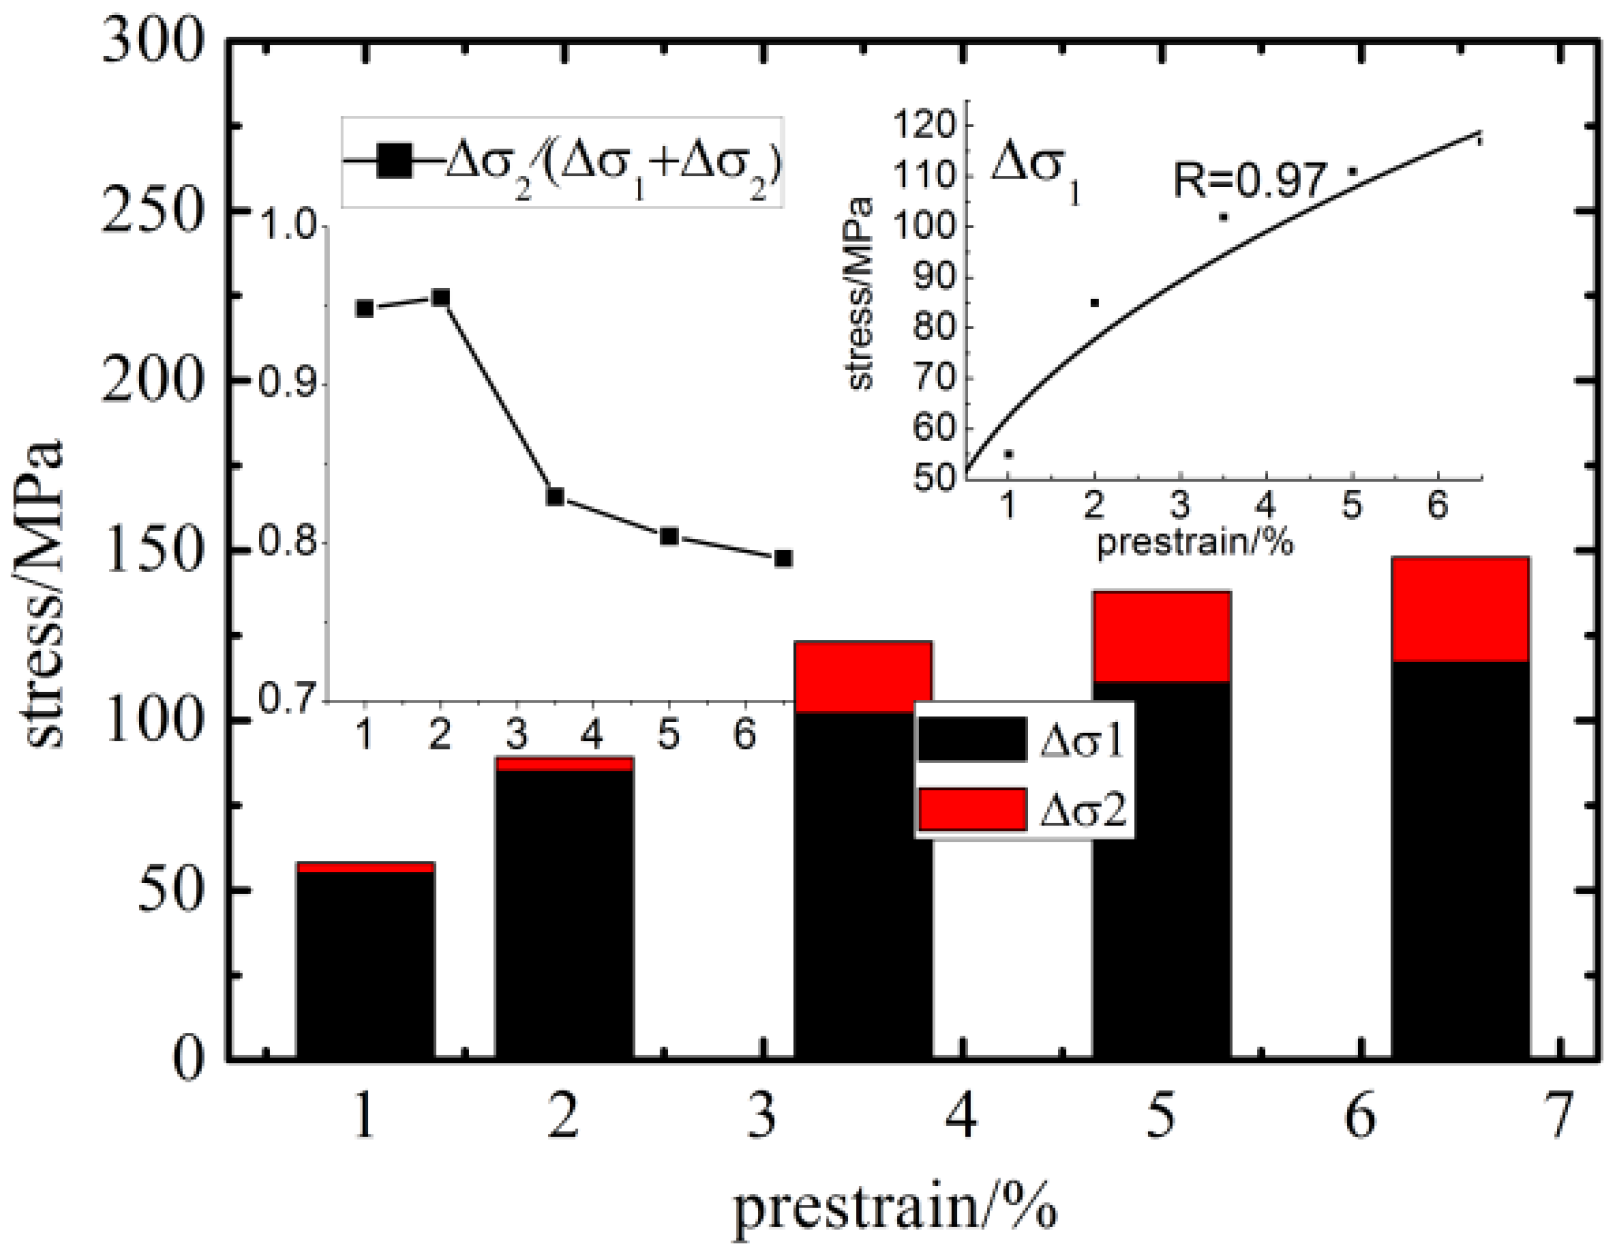
  • Dislocations play an important role in strain hardening along cold rolling direction tension. With the increase of strain, the contribution on strain hardening from both the dislocation-associated mechanisms and other mechanisms increases.
  • The strain rate sensitivity exponent, strain hardening exponent and strength coefficient decrease with the increase of prestrain. Flow stress of prestrained CP-Ti is predicted accurately by the modified Fields-Backofen model.
  • With annealing at 500 °C and 40 min, the 3.5% prestrained specimen shows the highest ductility, and its yield strength is enhanced. The more ductile deformation features on the fracture surfaces after annealing confirms that the ductility of prestrained CP-Ti can be improved by annealing.

Acknowledgments

The authors gratefully acknowledge the financial supports of the National Natural Science Foundation of China (51475223) and the Graduate Student Scientific Innovative Project of Jiangsu Province (KYLX15_0801).

Author Contributions

All contributed to the design of the experimental plan. Le Chang performed the experiments; Chang-Yu Zhou and Xiao-Hua He analyzed the data; Le Chang wrote the paper.

Conflicts of Interest

The authors declare no conflict of interest.

References

  1. Ahmed, I.I.; Grant, B.; Sherry, A.H.; Quinta, J. Deformation path effects on the internal stress development in cold worked austenitic steel deformed in tension. Mater. Sci. Eng. A 2014, 614, 326–337. [Google Scholar] [CrossRef]
  2. Zhang, L.C.; Timokhina, I.B.; La Fontaine, A.; Ringer, S.P.; Hodgson, P.D.; Pereloma, E.V. Effect of pre-straining and bake hardening on the microstructure and mechanical properties of CMnSi TRIP steels. Metall. Ital. 2009, 101, 49–55. [Google Scholar]
  3. Pereloma, E.; Beladi, H.; Zhang, L.C.; Timokhina, I. Understanding the behavior of advanced high-strength steels using atom probe tomography. Metall. Mater. Trans. A 2012, 43, 3958–3971. [Google Scholar] [CrossRef]
  4. Baeka, J.; Kim, Y.; Kim, C.; Kim, W.; Seok, C. Effects of pre-strain on the mechanical properties of API 5L X65 pipe. Mater. Sci. Eng. A 2010, 527, 1473–1479. [Google Scholar] [CrossRef]
  5. Robertson, L.T.; Hilditch, T.B.; Hodgson, P.D. The effect of prestrain and bake hardening on the low-cycle fatigue properties of TRIP steel. Int. J. Fatigue 2008, 30, 587–594. [Google Scholar] [CrossRef]
  6. Lee, W.S.; Lin, C.F. Effects of prestrain and strain rate on dynamic deformation characteristics of 304L stainless steel: Part 1—Mechanical behavior. Mater. Sci. Technol. 2002, 18, 869–876. [Google Scholar] [CrossRef]
  7. Lee, W.S.; Lin, C.F. Effects of prestrain and strain rate on dynamic deformation characteristics of 304L stainless steel: Part 2—Microstructural study. Mater. Sci. Technol. 2002, 18, 877–884. [Google Scholar] [CrossRef]
  8. Whittaker, M.T.; Evans, W.J. Effect of prestrain on the fatigue properties of Ti834. Int. J. Fatigue 2009, 31, 1751–1757. [Google Scholar] [CrossRef]
  9. Whittaker, M.; Jones, P.; Pleydell-Pearce, C.; Rugg, D.; Williams, S. The effect of prestrain on low and high temperature creep in Ti834. Mater. Sci. Eng. A 2010, 527, 6683–6689. [Google Scholar] [CrossRef]
  10. Song, Z.Y.; Sun, Q.Y.; Xiao, L.; Liu, L.; Sun, J. Effect of prestrain and aging treatment on microstructures and tensile properties of Ti–10Mo–8V–1Fe–3.5Al alloy. Mater. Sci. Eng. A 2010, 527, 691–698. [Google Scholar] [CrossRef]
  11. Werber, A.; Liewald, M. Measurement and analysis of differential work hardening behavior of pure titanium sheet using spline function. Int. J. Mater. Form. 2011, 4, 193–204. [Google Scholar]
  12. Wowk, D.; Pilkey, K. Effect of prestrain with a path change on the strain rate sensitivity of AA5754 sheet. Mater. Sci. Eng. A 2009, 520, 174–178. [Google Scholar] [CrossRef]
  13. Sarker, D.; Friedman, J.; Chen, D.L. Influence of pre-strain on de-twinning activity in an extruded AM30 magnesium alloy. Mater. Sci. Eng. A 2014, 605, 73–79. [Google Scholar] [CrossRef]
  14. Sarker, D.; Chen, D.L. Dependence of compressive deformation on pre-strain and loading direction in an extruded magnesium alloy: Texture, twinning and de-twinning. Mater. Sci. Eng. A 2014, 596, 134–144. [Google Scholar] [CrossRef]
  15. Hama, T.; Nagao, H.; Kuchinomachi, Y.; Takuda, H. Effect of pre-strain on work-hardening behavior of magnesium alloy sheets upon cyclic loading. Mater. Sci. Eng. A 2014, 591, 69–77. [Google Scholar] [CrossRef]
  16. Chen, L.; Li, J.; Zhang, Y.; Lu, W.; Zhang, L.C.; Wang, L.; Zhang, D. Effect of low-temperature pre-deformation on precipitation behavior and microstructure of a Zr-Sn-Nb-Fe-Cu-O alloy during fabrication. J. Nucl. Sci. Technol. 2016, 53, 496–507. [Google Scholar] [CrossRef]
  17. Zherebtsov, S.V.; Dyakonov, G.S.; Salem, A.A.; Malysheva, S.P.; Salishchev, G.; Semiatin, S.L. Evolution of grain and subgrain structure during cold rolling of commercial-purity titanium. Mater. Sci. Eng. A 2011, 528, 3474–3479. [Google Scholar] [CrossRef]
  18. Chun, Y.B.; Yu, S.H.; Semiatin, S.L.; Hwang, S.K. Effect of deformation twinning on microstructure and texture evolution during cold rolling of CP-titanium. Mater. Sci. Eng. A 2005, 398, 209–219. [Google Scholar] [CrossRef]
  19. Nasiri-Abarbekoh, H.; Ekrami, A.; Ziaei-Moayyed, A.A.; Shohani, M. Effects of rolling reduction on mechanical properties anisotropy of commercially pure titanium. Mater. Des. 2012, 34, 268–274. [Google Scholar] [CrossRef]
  20. Chichili, D.R.; Ramseh, K.T.; Hemker, K.J. The high-strain-rate response of alpha-titanium: Experiments, deformation mechanisms and modeling. Acta Mater. 1998, 46, 1025–1043. [Google Scholar] [CrossRef]
  21. Peng, J.; Zhou, C.Y.; Dai, Q.; He, X.H. The temperature and stress dependent primary creep of CP-Ti at low and intermediate temperature. Mater. Sci. Eng. A 2014, 611, 123–135. [Google Scholar] [CrossRef]
  22. Zhao, X.C.; Yang, X.R.; Liu, X.Y.; Wang, C.T.; Huang, Y.; Langdon, T.G. Processing of commercial purity titanium by ECAP using a 90 degrees die at room temperature. Mater. Sci. Eng. A 2014, 607, 482–489. [Google Scholar] [CrossRef]
  23. Sordi, V.L.; Ferrante, M.; Kawasaki, M.; Langdon, T.G. Microstructure and tensile strength of grade 2 titanium processed by equal-channel angular pressing. J. Mater. Sci. 2012, 47, 7870–7876. [Google Scholar] [CrossRef]
  24. Roodposhit, P.S.; Farahbakhsh, N.; Sarkar, A.; Murty, K.L. Microstructural approach to equal channel angular processing of commercially pure titanium—A review. T. Nonferr. Metal. Soc. 2015, 25, 1353–1366. [Google Scholar] [CrossRef]
  25. Salem, A.A.; Kalidindi, S.R.; Doherty, R.D. Strain hardening of titanium: Role of deformation twinning. Acta Mater. 2003, 51, 4225–4237. [Google Scholar] [CrossRef]
  26. Salem, A.A.; Kalidindi, S.R.; Doherty, R.D. Strain hardening regimes and microstructure evolution during large strain compression of high purity titanium. Scr. Mater. 2002, 46, 419–423. [Google Scholar] [CrossRef]
  27. Becker, H.; Pantleon, W. Work-hardening stages and deformation mechanism maps during tensile deformation of commercially pure titanium. Comp. Mater. Sci. 2013, 76, 52–59. [Google Scholar] [CrossRef]
  28. Hama, T.; Nagao, H.; Kobuki, A.; Fujimoto, H.; Takuda, H. Work-hardening and twinning behaviors in a commercially pure titanium sheet under various loading paths. Mater. Sci. Eng. A 2015, 620, 390–398. [Google Scholar] [CrossRef] [Green Version]
  29. Li, L.; Zhang, Z.; Shen, G. Effect of Grain Size on the Tensile Deformation Mechanisms of Commercial Pure Titanium as Revealed by Acoustic Emission. J. Mater. Eng. Perform. 2015, 24, 1975–1986. [Google Scholar] [CrossRef]
  30. Ghaderi, A.; Barnett, M. Sensitivity of deformation twinning to grain size in titanium and magnesium. Acta Mater. 2011, 59, 7824–7839. [Google Scholar] [CrossRef]
  31. Amouzou, K.E.A.; Richeton, T.; Roth, A.; Lebyodkin, M.A.; Lebedkina, T.A. Micromechanical modeling of hardening mechanisms in commercially pure α-titanium in tensile condition. Int. J. Plast. 2016, 80, 222–240. [Google Scholar] [CrossRef]
  32. Won, W.J.; Park, K.T.; Hong, S.G.; Lee, C.S. Anisotropic yielding behavior of rolling textured high purity titanium. Mater. Sci. Eng. A 2015, 637, 215–221. [Google Scholar] [CrossRef]
  33. Roth, A.; Lebyodkin, M.A.; Lebedkina, T.A.; Lecomte, J.S.; Richeton, T.; Amouzou, K.E.A. Mechanisms of anisotropy of mechanical properties of α-titanium in tension conditions. Mater. Sci. Eng. A 2014, 596, 236–243. [Google Scholar] [CrossRef]
  34. Barkia, B.; Doquet, V.; Couzini, J.; Guillot, I.; Hripre, E. In situ monitoring of the deformation mechanisms in titanium with different oxygen contents. Mater. Sci. Eng. A 2015, 636, 91–102. [Google Scholar] [CrossRef]
  35. Shi, J.; Sha, A.X. GJB 3763A. In Heat Treatment for Titanium and Titanium Alloys; Defense Science and Technology Industry Committee: Beijing, China, 2004. [Google Scholar]
  36. Fields, D.S.; Backofen, W.A. Determination of strain hardening characteristics by torsion testing. Proc. Am. Soc. Test. Mater. 1957, 57, 1259–1272. [Google Scholar]
  37. Chuluunbat, T.; Lu, C.; Kostryzhev, A.; Tieu, K. Investigation of X70 line pipe steel fracture during single edge-notched tensile testing using acoustic emission monitoring. Mater. Sci. Eng. A 2015, 640, 471–479. [Google Scholar] [CrossRef]
  38. Chauhan, A.; Litvinov, D.; Aktaa, J. High temperature tensile properties and fracture characteristics of bimodal 12Cr-ODS steel. J. Nucl. Mater. 2016, 468, 1–8. [Google Scholar] [CrossRef]
Figure 1. The geometry of the test specimens.
Metals 07 00099 g001
Figure 2. Engineering stress–strain curves of as-received CP-Ti.
Metals 07 00099 g002
Figure 3. Engineering stress–strain curves of different prestrained specimens. (a) 0%–15% prestrained CP-Ti and (b) the appearance of yield plateau.
Metals 07 00099 g003
Figure 4. The variation of work hardening rate with true strain. (a) As-received CP-Ti at different strain rates and (b) prestrained CP-Ti at 0.0005 s−1.
Metals 07 00099 g004
Figure 5. Metallographic figures of different prestrained samples: (a) as-received; (b) 2%; (c) 3.5%; (d) 5%; (e) 10% and (f) 15% prestrained specimens. Twins are indicated by white arrows in Figure 5df.
Metals 07 00099 g005
Figure 6. Variation of strength parameters.
Metals 07 00099 g006
Figure 7. Variation of ductility parameters with amount of prestrain.
Metals 07 00099 g007
Figure 8. Metallographic figures of different prestrained samples after heat-treatment (500 °C, 40 min): (a) two percent prestrain with annealing; (b) five percent prestrain with annealing. Twins are indicated by white arrows in Figure 8b.
Metals 07 00099 g008
Figure 9. Engineering stress–strain cures of prestrained specimens after annealing (500 °C, 40 min).
Metals 07 00099 g009
Figure 10. Three stages of work hardening rate in prestrained specimens after annealing: Sharp decrease in stage A, moderate decrease in stage B and slow decrease in stage C.
Metals 07 00099 g010
Figure 11. The quantified analysis of effects of dislocations associated mechanisms (Δσ1) and other mechanisms (Δσ2) on strain hardening.
Metals 07 00099 g011
Figure 12. Decline of ultimate tensile strength after annealing: σb-R, σb-R-A, Δσ represent tensile strength of prestrained specimens, prestrained specimens with annealing and the difference between prestrained and prestrained specimens with annealing.
Metals 07 00099 g012
Figure 13. Elongation of prestrained specimens with annealing.
Metals 07 00099 g013
Figure 14. Variation of parameters with prestrain: (a) Strain rate sensitivity; (b) strain hardening exponent and (c) strength coefficient.
Metals 07 00099 g014
Figure 15. Comparison between the experimental and predicted flow stress data from the modified Fields-Backofen model: (a) as-received CP-Ti; (b) 2% prestrained CP-Ti; (c) 3.5% prestrained CP-Ti; (d) 1%, 5%, 6.5% prestrained CP-Ti.
Metals 07 00099 g015
Figure 16. Micrographs of fractured surfaces of as-received CP-Ti with no prestrain: (a) macro view showing necking with microcracks and shear lip zone at the outer area; (b) magnified view of crack propagation region from central region in Figure 16a; (c) magnified image showing deep and large dimples from central region; (d) magnified image showing the shallow dimples at the shear-lip region.
Metals 07 00099 g016
Figure 17. Macro view of fractured surfaces of prestrained CP-Ti: (a) 1% prestrained; (b) 3.5% prestrained; (c) 6.5% prestrained; (d) 1% prestrained with annealing; (e) 3.5% prestrained with annealing; (f) 6.5% prestrained with annealing.
Metals 07 00099 g017
Figure 18. Micrographs of fractured surfaces of prestrained CP-Ti: (a) 1% prestrained; (b) 3.5% prestrained; (c) 6.5% prestrained; (d) 1% prestrained with annealing; (e) 3.5% prestrained with annealing; (f) 6.5% prestrained with annealing.
Metals 07 00099 g018
Table 1. Chemical composition of used commercial pure (CP)-titanium (wt. %).
ElementTiFeCNHO
CompositionBalance0.060.01<0.010.0010.12
Table 2. Annealing experimental scheme.
Prestrain (εpre)/%Annealing
500 °C, 30 min500 °C, 40 min500 °C, 60 min600 °C, 30 min
1-
2-
3.5
5-
6.5-

