
Measuring Plasticity with Orientation Contrast Microscopy in Aluminium 6061-T4


1
Materials Science and Engineering Department, Delft University of Technology, Mekelweg 2, 2628CD Delft, The Netherlands
2
EEMMeCS Department, Ghent University, Technologiepark 903, 9052 Zwijnaarde-Gent, Belgium
*
Author to whom correspondence should be addressed.
Metals 2017, 7(4), 108; https://doi.org/10.3390/met7040108
Submission received: 22 February 2017
/
Revised: 12 March 2017
/
Accepted: 17 March 2017
/
Published: 23 March 2017
Abstract
:Orientation contrast microscopy (i.e., electron backscattered diffraction, EBSD) was employed to monitor the plastic strain in loaded tensile samples of aluminium alloy Al6061 in T4 condition. The kernel average misorientation (KAM) is known to be an appropriate parameter in orientation contrast microscopy which has the potential to characterise the plastic strain by monitoring the local misorientations. This technique was applied here to gauge the extent of the plastic zone around a fatigue crack. To establish the magnitude of strain (which can be identified by the KAM parameter), a series of tensile samples were strained in the range of 1% to 25%. KAM maps were compared, and the average misorientations were related to the tensile strain values. The KAM distribution functions for all the strained samples were derived from a large scanned area. In addition, Vickers microhardness tests were conducted for these series of samples. This allowed the comparison of the mesoscopic plastic strain measured by Vickers microhardness with the micro plastic strain locally obtained by KAM. Noise was observed in the average KAM values up to a plastic strain of 1.5%. For the plastic strain exceeding 1.5%, noise no longer dominates the KAM map, and a positive—though not linear—correspondence between plastic strain and KAM was observed. The observed plastic zone at the tip of the fatigue crack by micro-Vickers hardness measurements was about an order of magnitude higher than the plastic zone observed on the KAM maps. In view of the calibration of KAM values on the tensile samples, it could be concluded that in the larger area of the plastic zone, the strain did not exceed the critical value of 1.5%.
1. Introduction
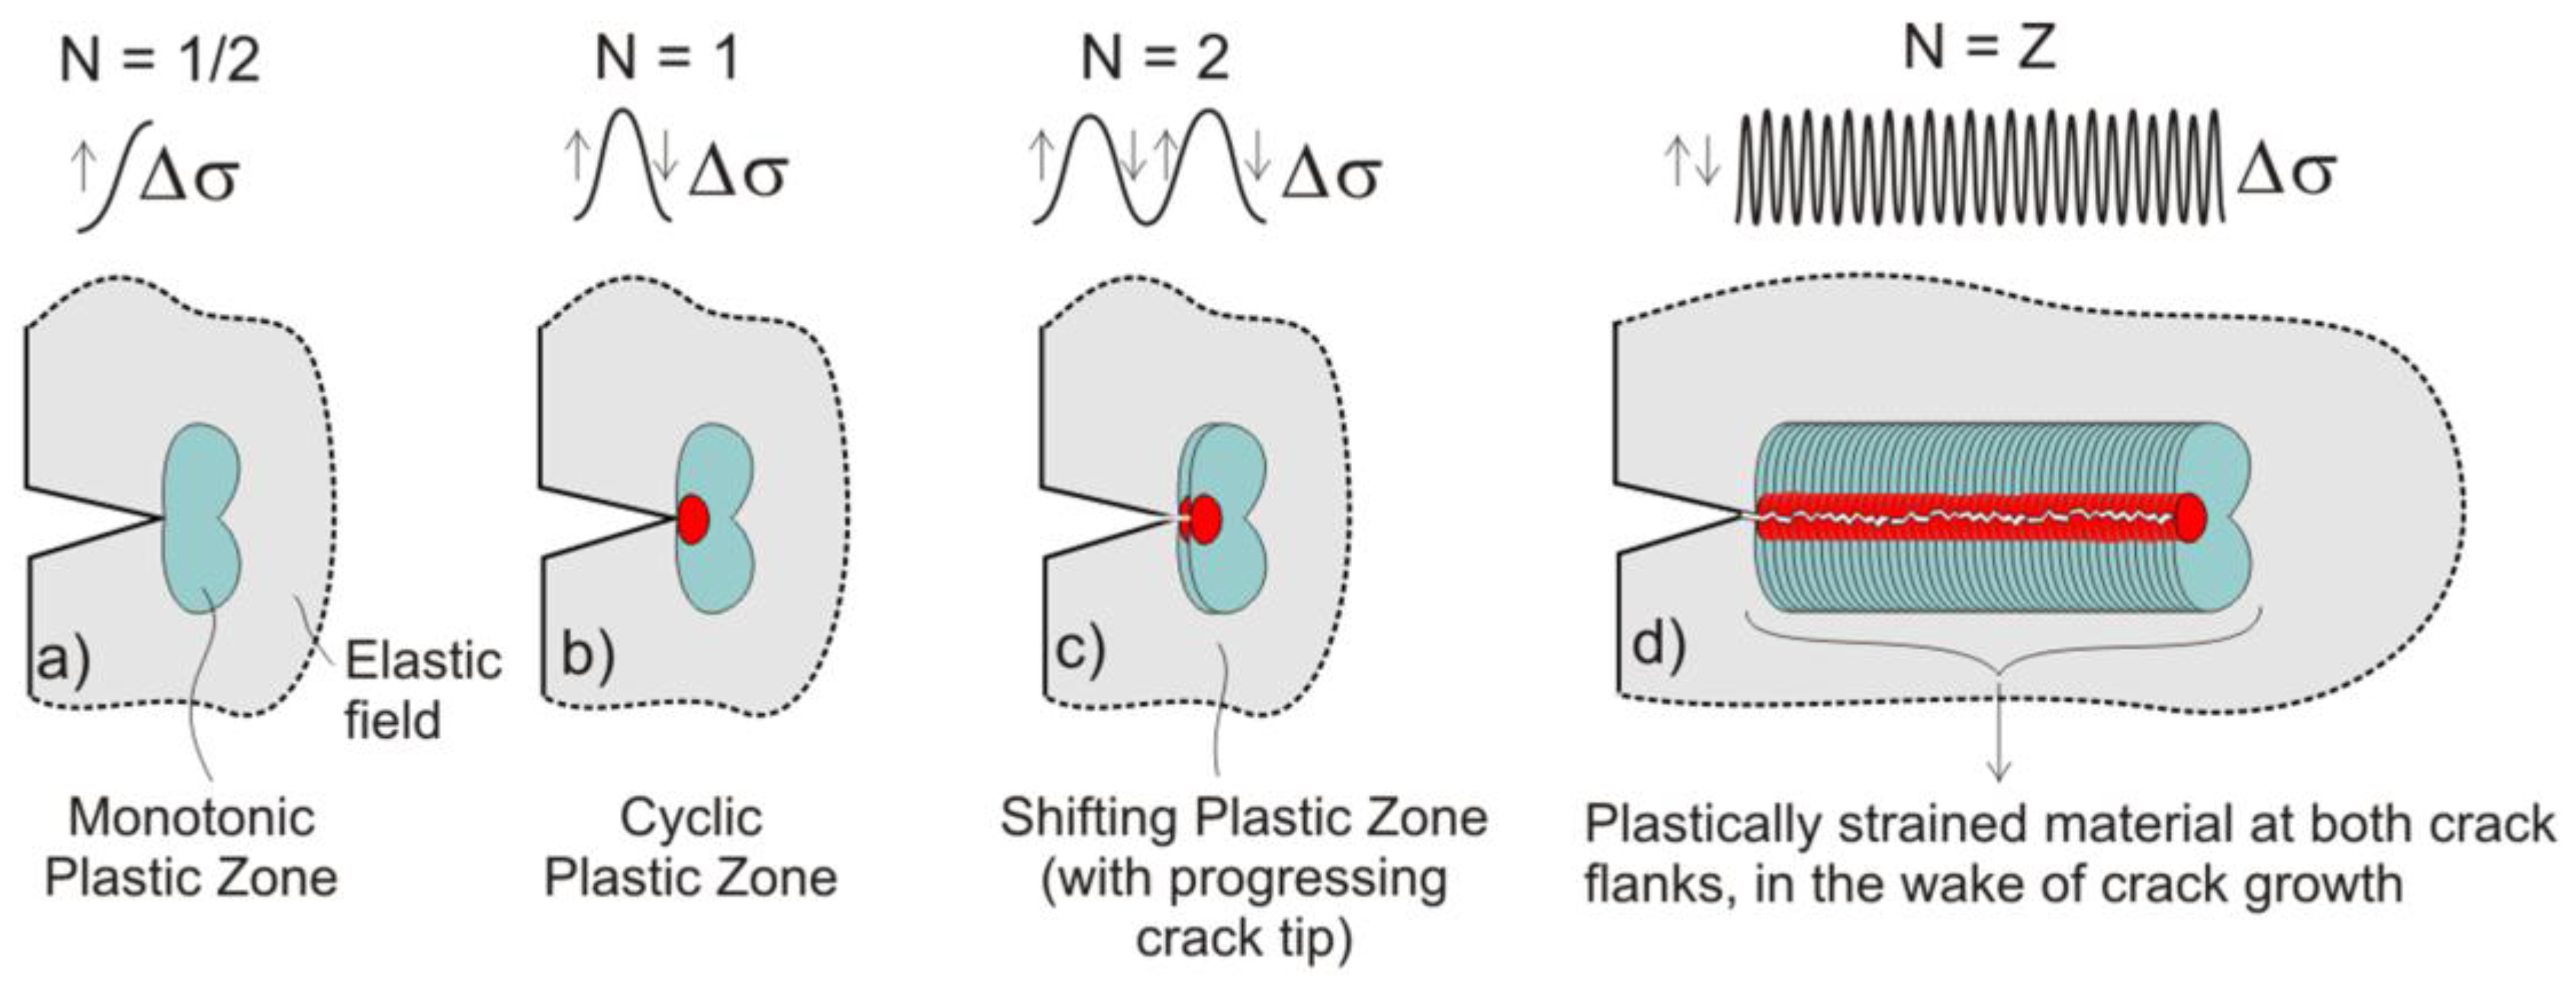
When a cycling loading is applied to a cracked body, a monotonic plastic zone (MPZ) forms at the crack tip in the first cycle. If linear elastic conditions apply during loading and ∆K stays as a valid crack tip parameter, compressive stress develops within the plastic zone during unloading by elastic unloading of the adjacent material. In a small region within the MPZ, the maximum compressive stress exceeds the yield strength, resulting in a reversing plastic flow called the cyclic plastic zone (CPZ) [1].
A schematic view of the formation of a plastic zone at the tip of a progressing fatigue crack showing the formation of the MPZ and CPZ is demonstrated in Figure 1a–d. As the crack grows, the plastic zone forms a wake of plastically strained material along both flanks of the crack (cf. Figure 1d).
An estimate of the MPZ for the plane stress condition made by Irwin [2] is given in the following Equation (1):
whereby 2ry is the plastic zone size according to Irwin, Kmax is the maximum applied stress intensity (at the peak of the fatigue load; σ = σmax), σYS is the materials’ yield stress, K is the applied stress intensity, σ the applied bulk stress, C a geometry factor [3], and a the crack length.
The mechanical properties of the material and the state of stress govern the size and shape of the plastic zone, as well as the distribution of stress and strain within the plastic zone itself. In general, the cyclic plastic zone is approximately one quarter of the size of the monotonic plastic zone [4].
How to quantitatively describe the propagation of cracks has been one of the most significant problems in fracture mechanics. The plastic zone size at the crack tip is a very important characteristic of the crack behaviour; it has obvious physical meaning, and can be directly observed in experiments.
There are various techniques that have been used to characterize the plastic zone size [4,5]. The microhardness technique is perhaps the most widely used. It is applicable when the plastic zone ahead of a fatigue crack is cyclically loaded, which leads to hardening or softening. This can be done by taking hardness indentations in front of and around the crack tip. Depending on the density and arrangement of dislocation and consequently on the strain history, hardness indentation can be used to reveal the plastic zone size. The monotonic plastic zone can be identified by a nearly constant hardness, while it increases parabolically in the cyclic plastic zone [4]. However, the spatial resolution of hardness measurements is very poor, and hence such local hardness measurements do not give any insight into the distribution of plastic strain around the crack tip.
Etching is another microstructural method that can be used to reveal the plastic zone. In a remarkable work of Hahn et al. [5], the shape and size of the plastic zone in Fe-3%Si Steel was determined. They could also confirm the plastic zone size by theoretical calculations. In this technique, specimens containing cracks were etched with an appropriate etchant. Because of the high amount of deformation and high dislocation density at the crack tip and wake, the microstructure responds differently to etching, and therefore the plastic zone can be easily observed as a dark- or light-etched region. One of the main challenges of this method is finding the proper etchant solution, and it is not applicable for all alloys.
Alternatively, orientation contrast microscopy can be used for gauging local plastic strain in the microstructure [6]. It has been widely recognized that when averaged in a small volume of material, dislocations can be categorized either as statistically stored dislocations (SSDs) with a net Burgers vector close to zero, and geometrically necessary dislocations (GNDs), which give rise to a non-zero closing vector when integrated over a local volume [7,8]. The GNDs are also known as non-redundant dislocations and involve a local crystal rotation, which may be determined by orientation contrast microscopy measurements, conventionally with an angular resolution of 0.5° to 1.0° (depending on material characteristics and the measurement setup). Therefore, the density of GNDs can be estimated by local orientation measurements on the condition that a material model is available that connects the local orientation gradients with the dislocation density.
A number of models have been proposed in the literature [9,10,11,12] which associate the local orientation gradient with the density of GNDs. This connection is generally based on the Nye dislocation tensor αij, which bears a linear connection with the lattice curvature tensor κij = ∂θi/∂xj, whereby θi is the misorientation in direction i. The total density of GNDs ρGND is given by . The in-plane components of the lattice curvature tensor κij (with j ≠ 3) can be derived from crystal orientation scans by electron backscattered diffraction (EBSD). Hence, EBSD may provide the potential to map localized plastic deformation at the microstructural length scale by monitoring the local orientation gradients [13,14]. It is the objective of the present paper to gauge whether this potential can be employed to quantitatively identify the plastic zone size around the tip of a fatigue crack in an aluminium alloy.
2. Materials and Methods
A 1-mm-thick sheet of Aluminium alloy 6061-T4 was used for this study. A static tensile test was applied, revealing that the material exhibited a yield strength of 130 MPa, a tensile strength of 270 MPa, and an elongation at fracture of 25%. Double edge notched specimens with dimensions of 220 mm × 30 mm × 1 mm were cut from the sheet. Notches with a depth of 6 mm were inserted halfway along the length of the sample to control the crack initiation point during a fatigue test. A stress-controlled high cycle fatigue experiment was carried out with a frequency of 30 Hz, a mean stress of 16.7 MPa, and a stress amplitude of 15 MPa.
After 43,000 cycles at the crack extension of 1.3 mm, the fatigue test was interrupted and the crack tip area was selected for microstructural investigation. Vickers hardness indentations of 98 mN were applied in the extension of the fatigue crack, starting at the crack tip with 16 μm spacing and processed with Ecos Workflow™ software (V.2.5.0, EMCO TEST Prüfmaschinen GmbH, Kuchl, Austria, 2007). Though 16 μm spacing does not conform with ASTM E 384 standards, it can be applied here, as absolute hardness values are not of interest, but rather the relative change in microhardness.
For metallographic purposes, conventional mechanical polishing up to 0.25 μm was applied with OPS (oxide polishing suspension), followed by electropolishing with A2 Struers® electrolyte (Maassluis, The Netherlands, 2011) with a voltage of 39 V and a flow rate of 9 for 15 s. Orientation contrast scans were carried out in a selected region around the crack tip with an EDAX-TSL® EBSD tool (EDAX Inc., Draper, UT, USA, 2012) attached to an FEI Quanta 450TM field emission gun (FEG)-SEM. Several grids with step sizes ranging from 0.3 to 2.0 μm were applied. The kernel average misorientation (KAM) parameter was considered as a measure of local orientation gradient. This parameter is calculated by considering for each pixel the average misorientation with the Nth neighbouring pixels (neighbouring pixels for which the misorientation exceeds 5° are not included in the average). Only the perimeter points of the kernel are included in the procedure (cf. Figure 2). The misorientation cut-off θc was set to 5°, as it is assumed that misorientations of more than 5° originate from grain boundaries, and were not induced by (micro-)plasticity around the crack tip.
3. Results
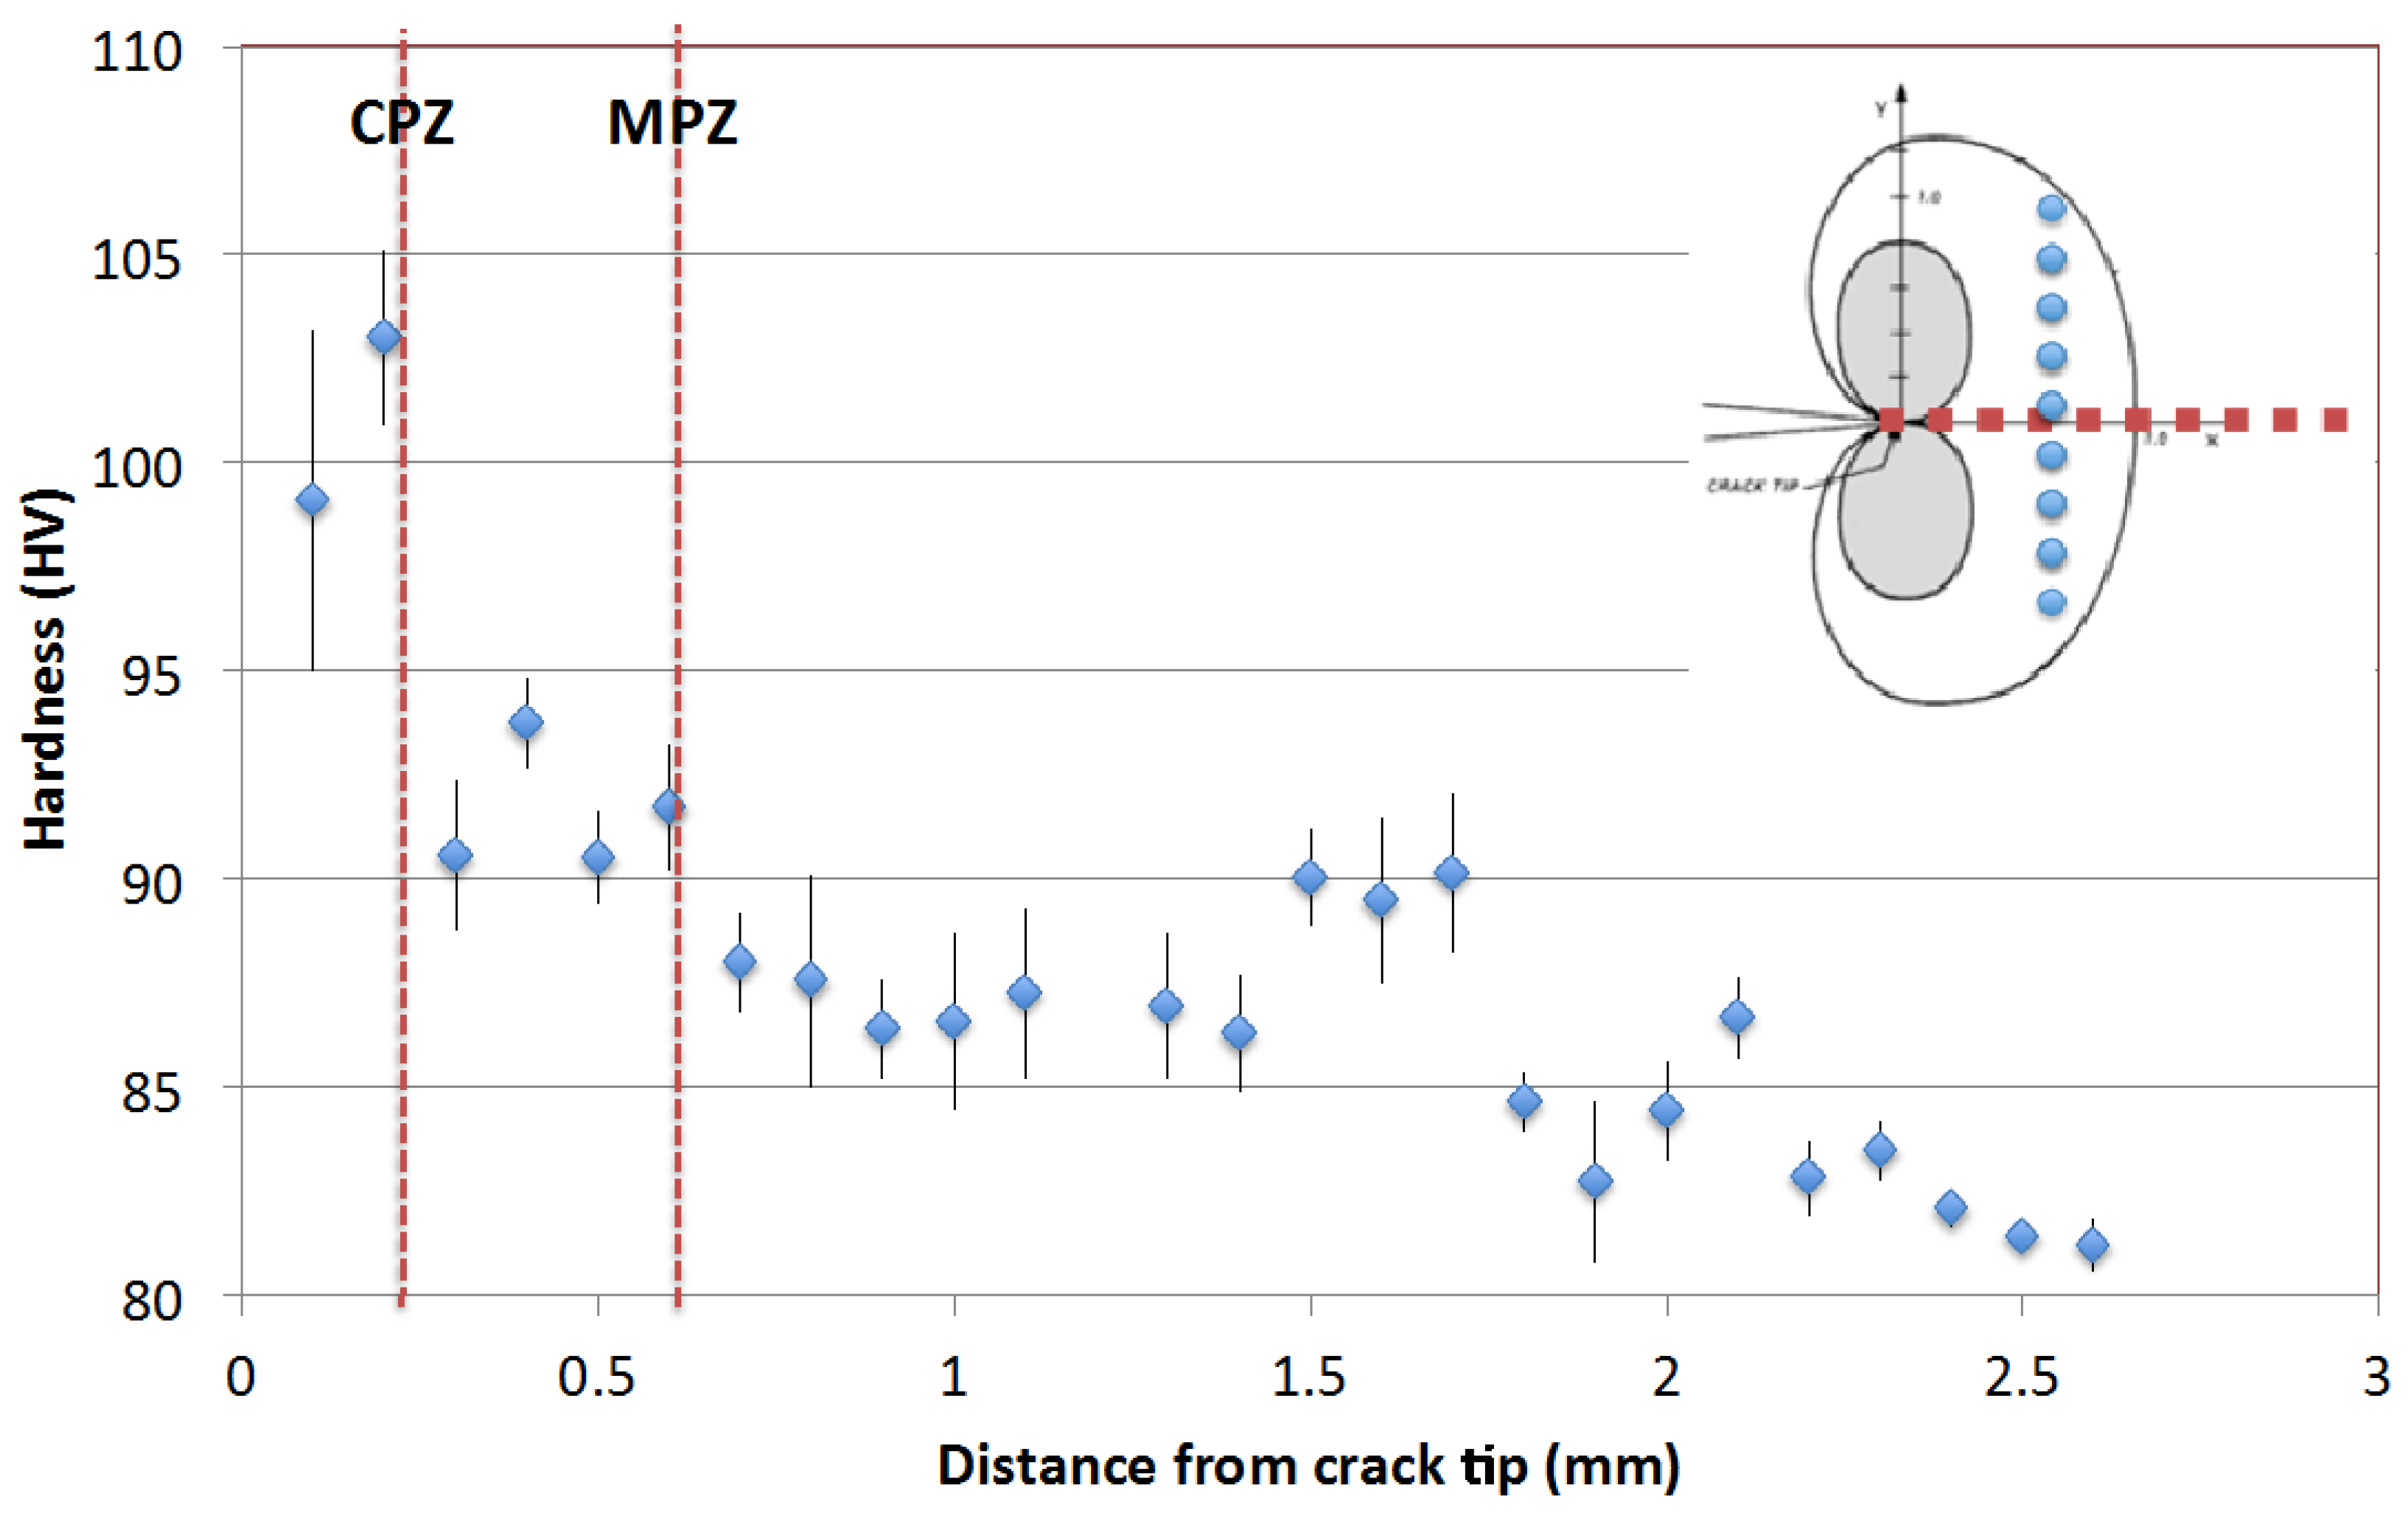
Figure 3 presents the hardness data along a line that extends along the crack tip. Each data point is the average of 10 data points along a line that is perpendicular to the crack tip (cf. insert in Figure 3). Based on these data, the plastic zone size was determined visually by two drops in Hv values, indicated by the vertical lines in Figure 3. It must be noted that Hv = 85 ± 2 is the hardness of the unstrained or base material. Vickers microhardness measurements indicate an MPZ and CPZ size of ~0.6 mm and ~0.2 mm, respectively (cf. Figure 3).
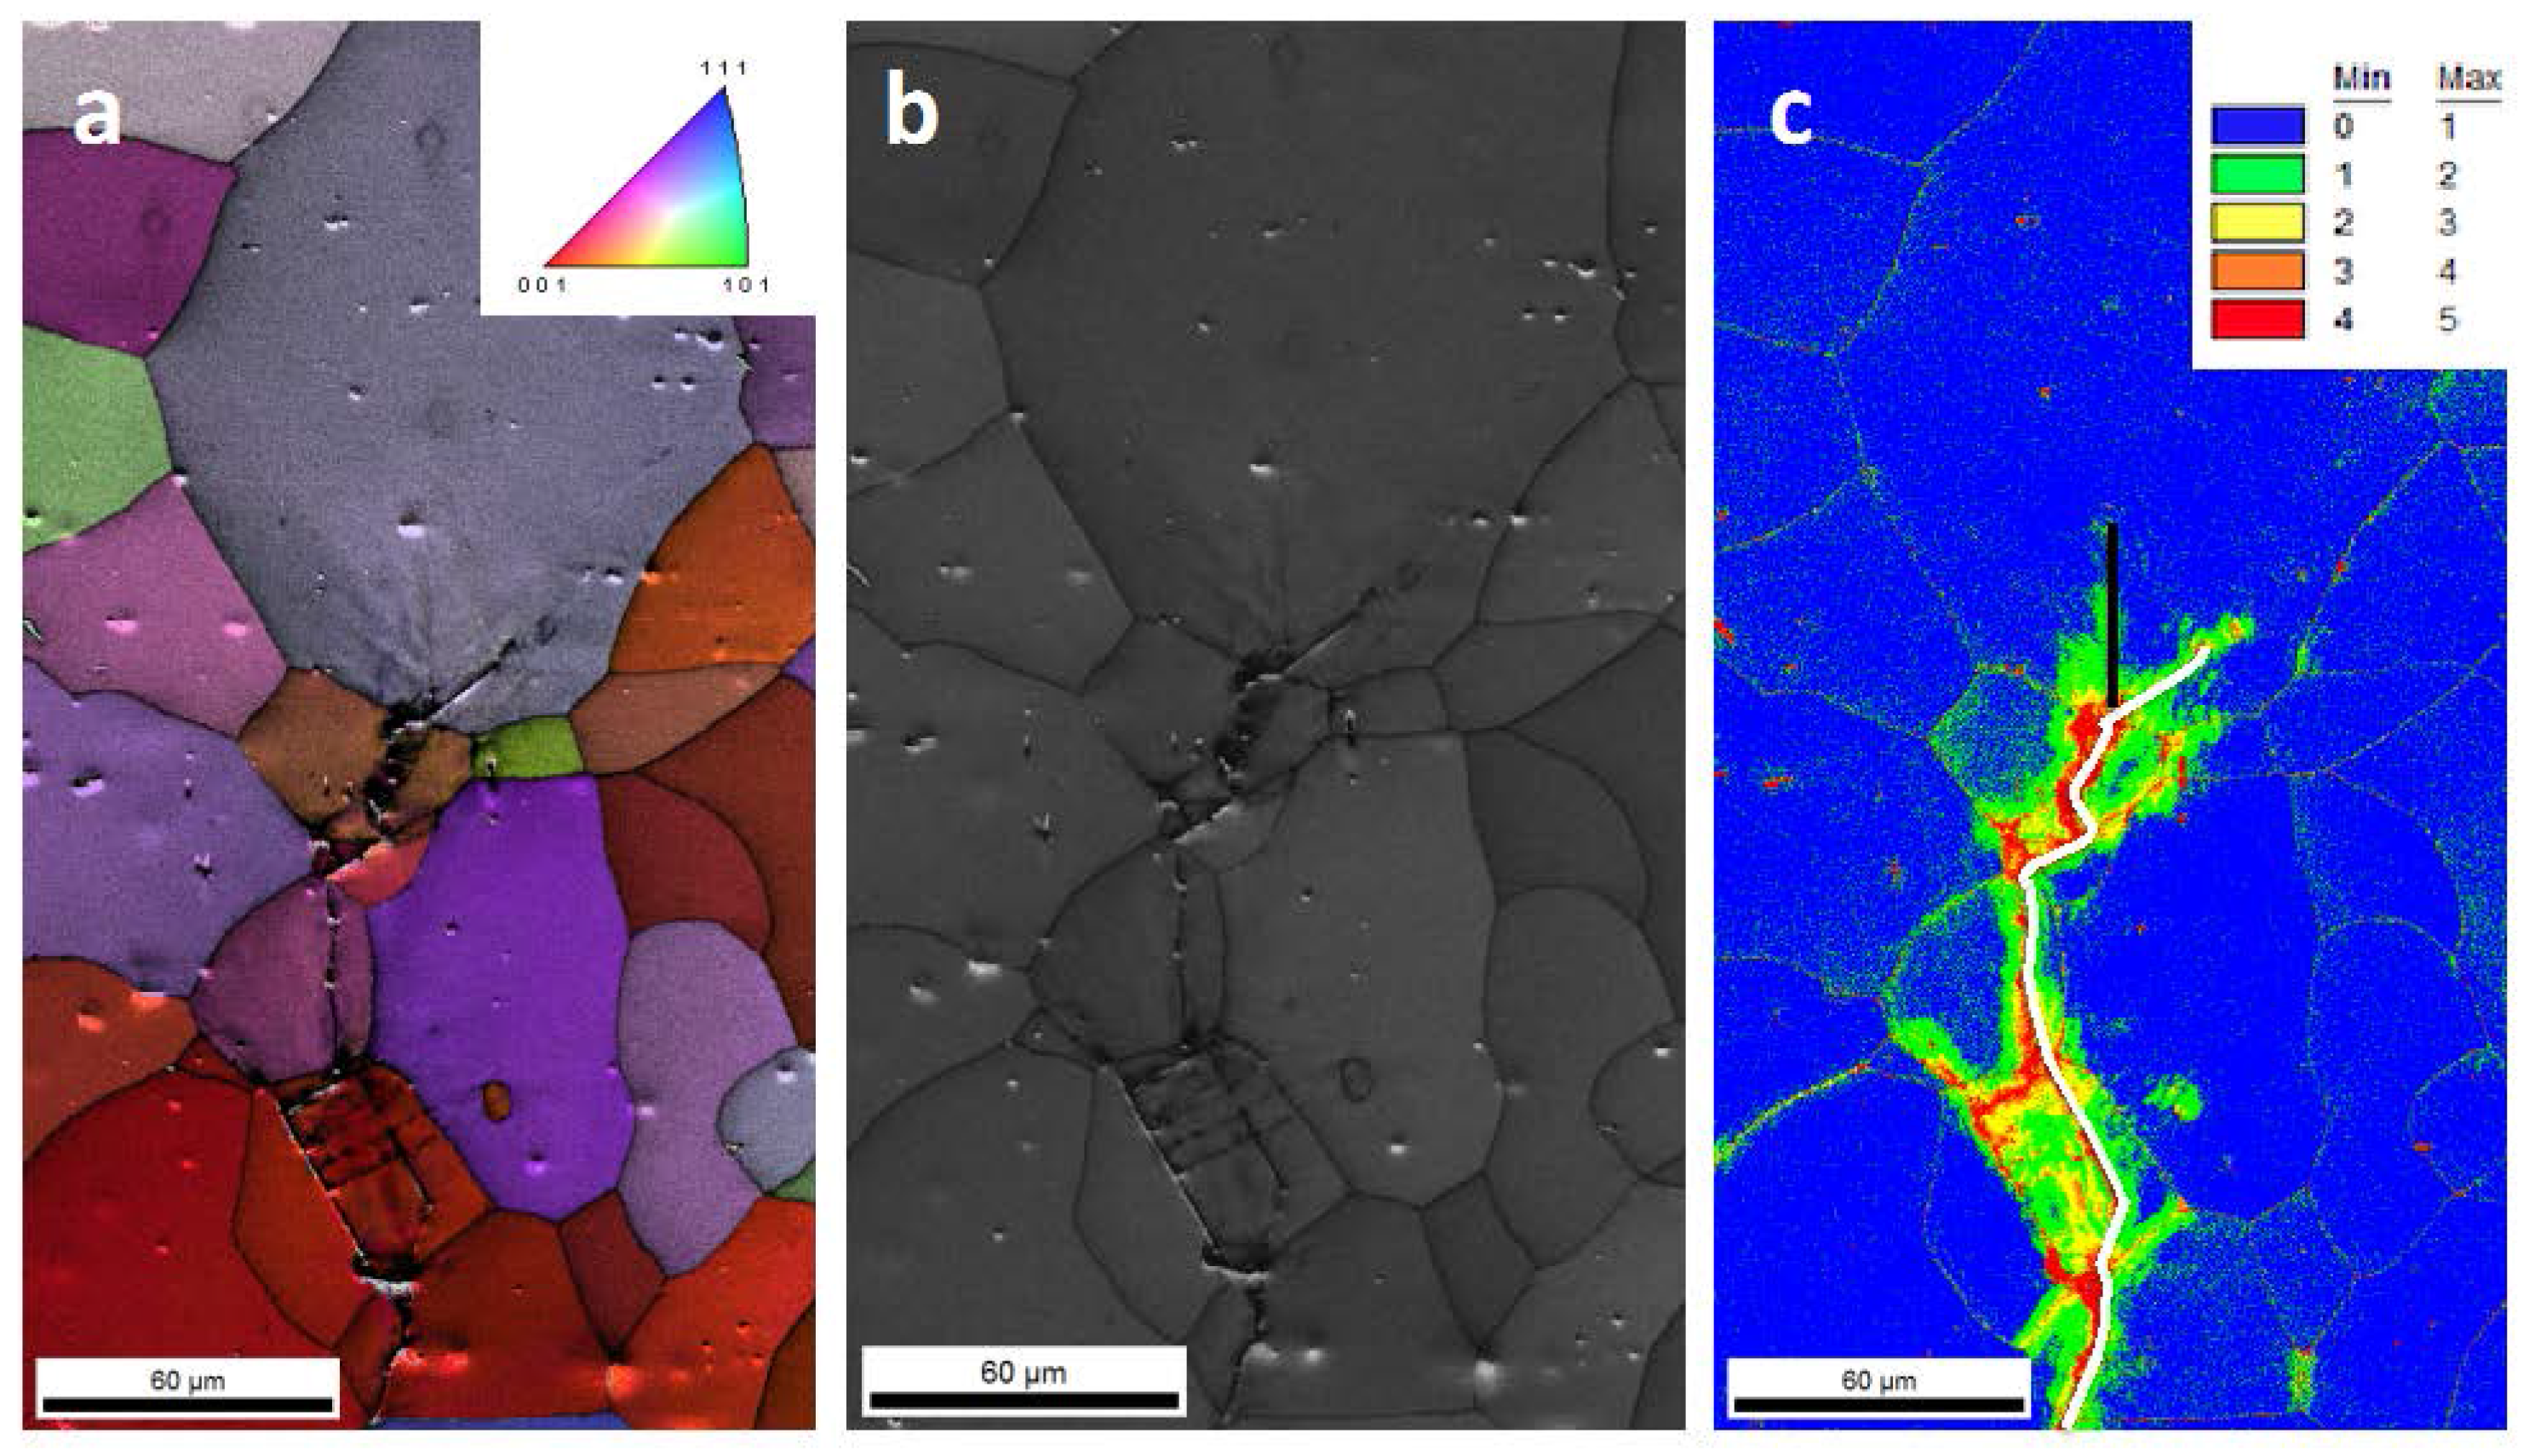
Figure 4 shows the orientation contrast scan of the crack tip area. In the inverse pole figure map of Figure 4a, it can be observed that the crack is predominantly of a transgranular nature. The scan also shows that there are many particles in the microstructure, which is normal for this type of aluminium grade alloyed with Si and Mg. It appears that the crack path morphology is affected by these particles. A similar phenomenon was observed in a previous study of cast iron with the graphite particles embedded in a pearlitic metal matrix during thermo-mechanical fatigue (TMF) testing [16]. Similar to the cast iron case, in the current material under investigation, the crack deviates towards the particles that exhibit a characteristic stress field. The tip of the crack splits in two branches; the one on the right-hand side (marked in white in Figure 4c) is more pronounced, whereas the one on the left-hand side (marked in black in Figure 4c) is less developed but appears to exhibit some deformation lines perpendicular to the crack path (cf. image quality (IQ) map of Figure 4b). However, it seems that this branch of the crack was stopped by a particle in its front.
As pointed out in the introduction, the kernel average misorientation approach has the potential to characterize the accumulated plastic strain by monitoring the local orientation gradients, of which it is well known that they bear a connection with the density of geometrically necessary dislocations (GNDs). As can be seen in the KAM map of the crack (cf. Figure 4c), there is a small trace of a plastically deformed zone in the immediate vicinity of the crack, with a size of approximately 30 μm. However, a textbook-type elliptic plastic zone at the crack tip cannot be discerned, even though the hardness data indicated a size of ~0.2 mm for the CPZ. It is interesting to note that the KAM map (cf. Figure 4c) shows a plastic wake, which is left behind by the propagating fatigue crack as would be expected from continuum fracture mechanics. This is due to the accumulation of plastic deformation by the progressing crack.
4. Discussion
Vickers microhardness measurements indicate the MPZ and CPZ size of ~0.6 mm and ~0.2 mm, respectively (cf. Figure 3). These values are in reasonable agreement with the theoretical estimated values of MPZ and CPZ size of 0.53 mm and 0.13 mm, respectively, as derived from Equation (1) with Kmax = 5.62 MPa √m and C = 1.17 [3], whereby CPZ = (1/4) *MPZ [4].
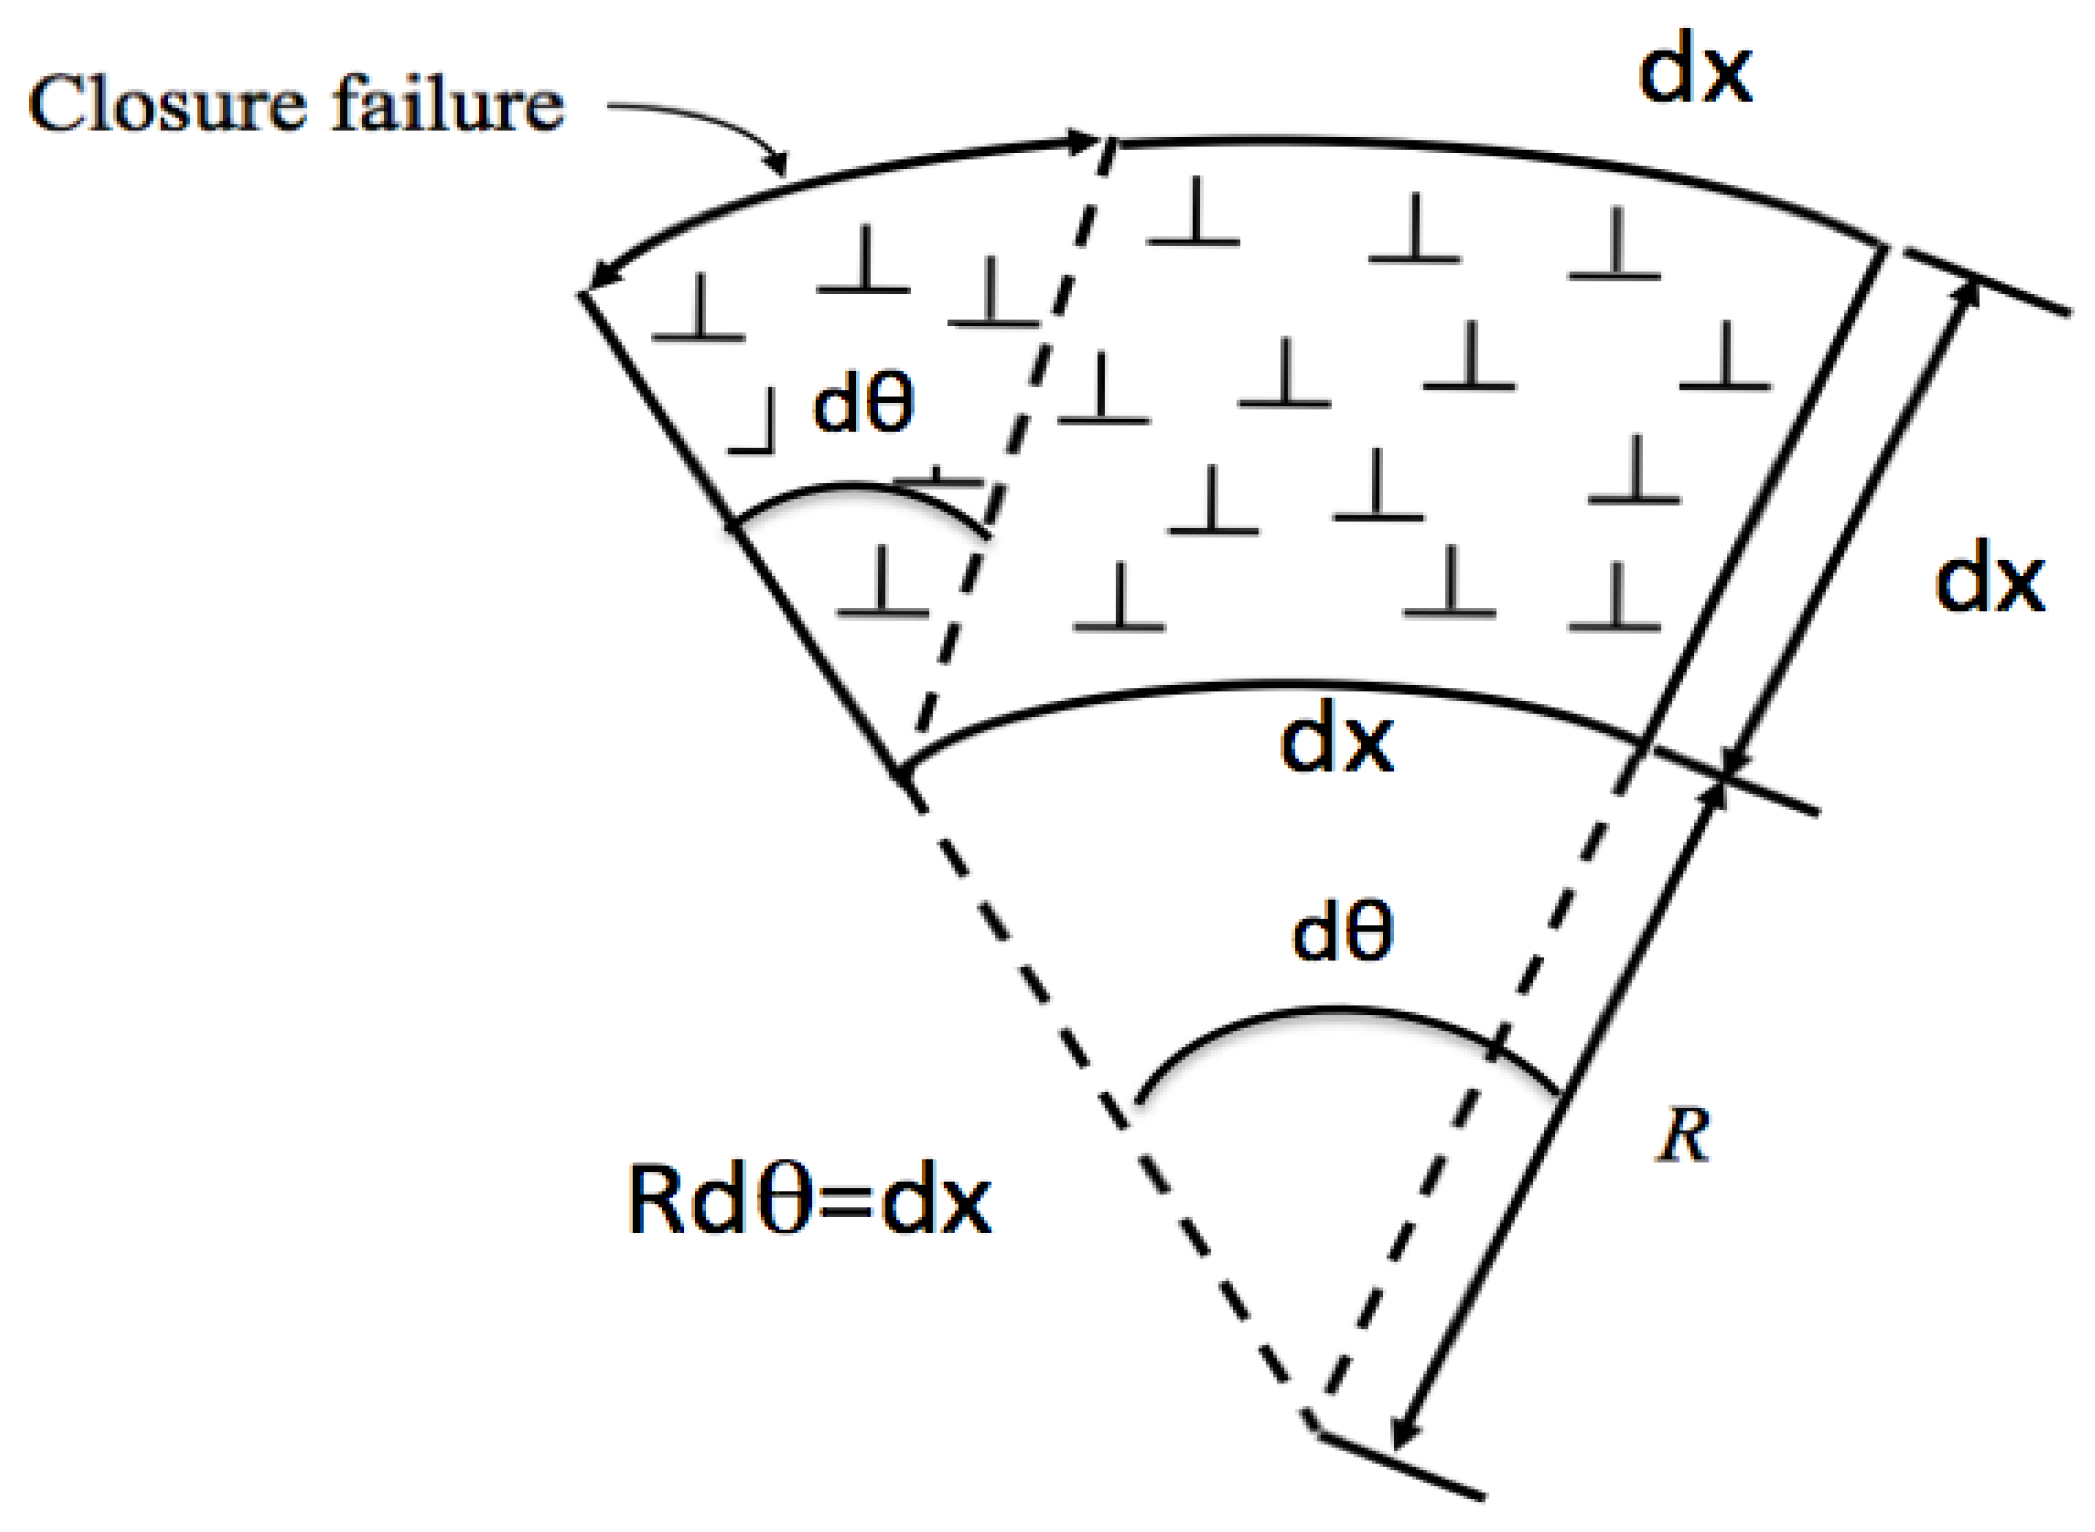
The Nye tensor connects the density of GNDs to the lattice curvature tensor. In a simplified one-dimensional (scalar) representation assuming only parallel edge dislocations of the same sign, this tensor relation can be expressed as (cf. Figure 5) [7]:
whereby κ is the lattice curvature dθ/dx, ρ the density of GNDs, and b the Burgers vector. On the simplified lattice geometry of Figure 5, it can be seen that the curvature κ = 1/R = dθdx. In a discrete representation, the local dθ/dx value can be approximated as ∆ < θ > /∆x, whereby ∆ < θ > is the local average misorientation as quantified by the KAM parameter in an EBSD measurement and ∆x is the distance over which the misorientation is evaluated.
Figure 5 equally shows that the shear strain tg(dθ) ≈ dθ is approximately equal to the local lattice misorientation dθ in the approximation of very small (shear) strains. If it is assumed that the angular resolution limit of EBSD is approximately equal to 1.0° (0.0174 rad), then this corresponds to a plastic shear detection limit of ~1.7%.
The misorientation corresponding to the plastic zone at the crack tip—as revealed by the KAM parameter—is shown in Figure 4c. This map suggests a plastic wake size of less than 30 μm, which is much smaller than the size obtained from the hardness measurements and theoretical calculations as mentioned above. Therefore, this can suggest that the magnitude of strain in the plastic zone is not high enough to be gauged with EBSD. Hence, the following experiment was performed to determine if the noise dominates the misorientation maps for strain levels below a critical threshold.
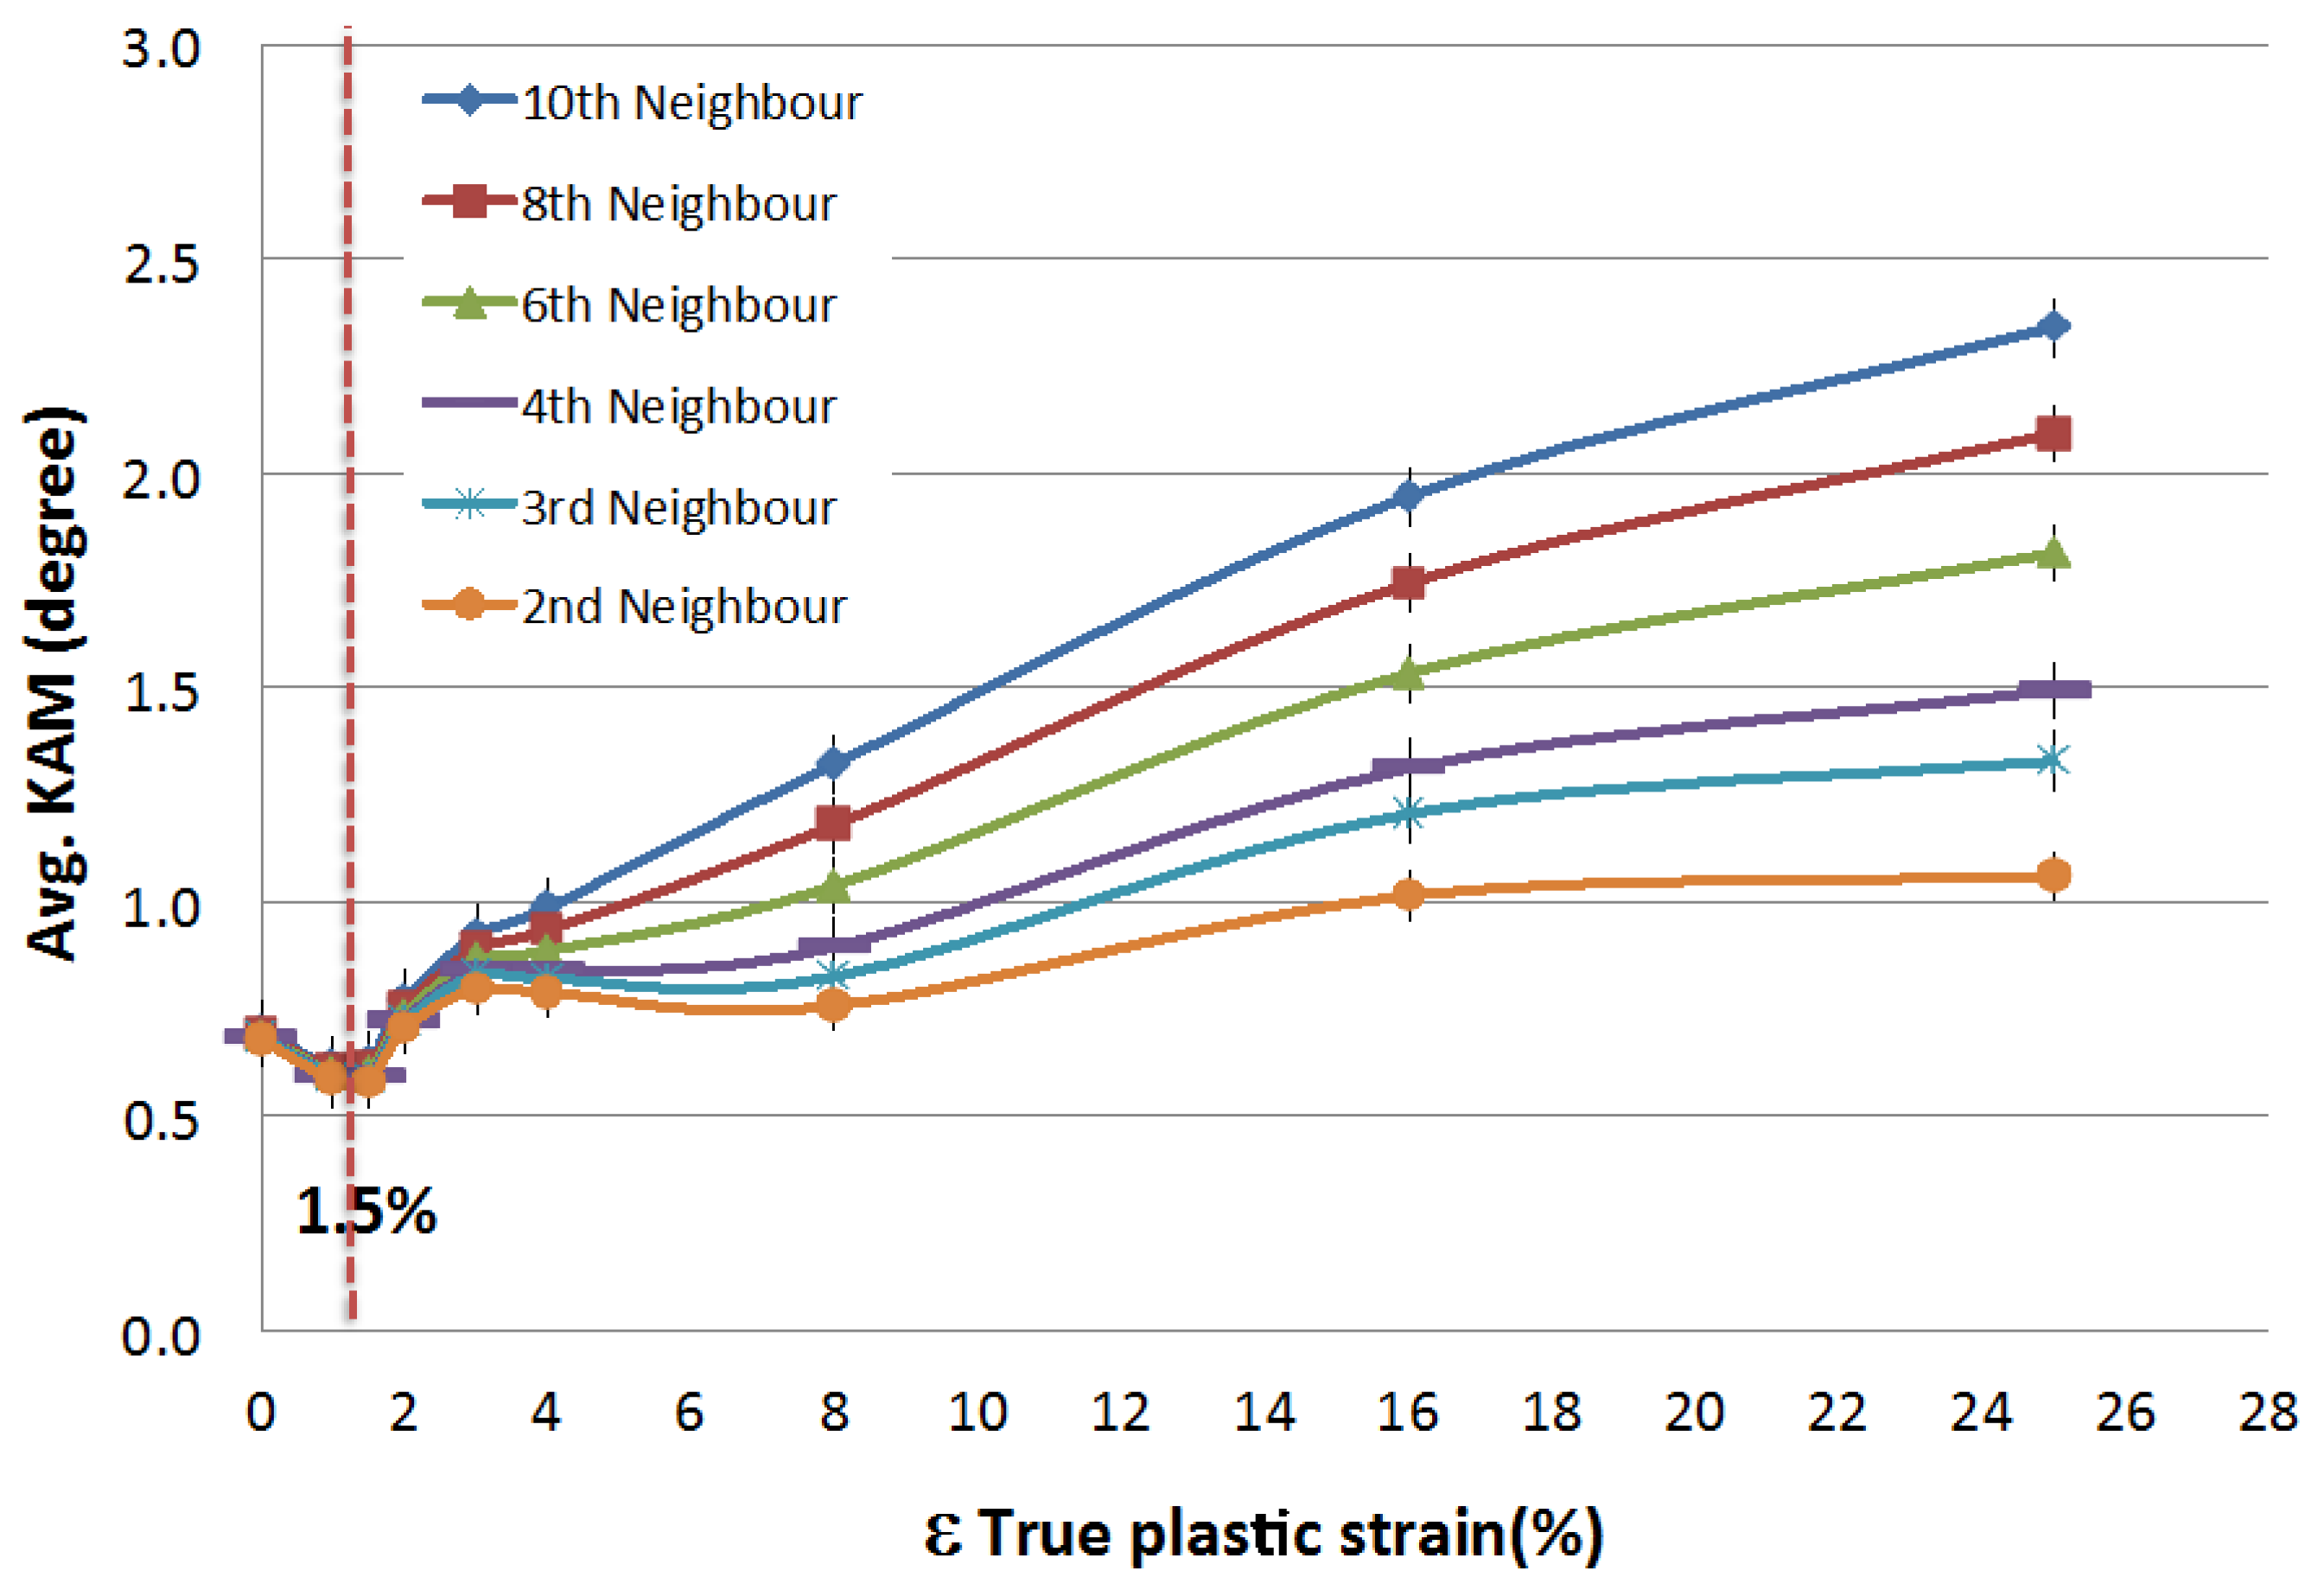
A plastic strain was applied to a tensile test sample of the same aluminium alloy with tensile strains ranging from 1% to 25% at fracture. Orientation contrast maps were measured with a step size of 0.3 μm on each of the tensile samples in four different locations (scanned area 200 × 300 μm2), and the scan average KAM value was extracted for each scan; thereafter, the average value and the standard deviation was determined for the set of four scans. The procedure was repeated for different values of nearest neighbours: 2nd, 3rd, 4th, 6th, 8th, and 10th nearest neighbours were considered. The dependence of the KAM value on the tensile plastic strain is shown in Figure 6.
According to the theoretical expectation, it was confirmed that no specific tendency could be observed up to a plastic strain level of ~1.5%, indicating that the accumulated plastic strain at the crack tip is less than the detectable limit. For plastic strains exceeding the critical value of ~1.5%, noise no longer determines the average KAM value, and there is an ascending correspondence between the KAM value and the plastic strain, which was also observed by Kamaya et al. [13].
The work of Besel et al. [17], in which they determined the plastic zone size with 3D numerical finite element method (FEM) simulations and digital image correlation (DIC), shows that the main part of the plastic zone also has strain values less than 1%. Therefore, the results of Besel et al. [17] are consistent with the present EBSD results. In Figure 4c it can be observed that only a small part (<30 μm) of the plastic zone exhibits intensified KAM values corresponding to strain values higher than 1.5%.
It should be noted that—according to the simplified model of Equation (2)—there is a linear relation between the GND dislocation density and the lattice curvature. Ignoring the simplifications of this model, it can be observed that the slope of this curve is positive but with descending second derivative, just as the predicted evolutions by theoretical dislocation balance equations [18,19].
5. Conclusions
The plastic zone size measured with Vickers microhardness was found to be in agreement with the theoretical values. However, the magnitude of plastic zone size distinguished on EBSD maps was not consistent with its real size, as the KAM parameter is not sufficiently sensitive to the strain level of the plastic zone. Therefore, it is concluded that orientation contrast microscopy is not an appropriate method to resolve the deformation structure of the plastic zone in the vicinity of a fatigue crack tip in a ductile Al6061-T4 alloy. In tensile test experiments, it was determined that plastic strains of more than 1.5% could be identified on KAM maps. Hence, it can be concluded that the plastic strain at the crack tip is lower than 1.5% in this material with the applied loading condition.
Supplementary Materials
Supplementary File 1Acknowledgments
The authors would like to acknowledge Hadi Pirgazi (Ghent University, Belgium) for his contribution to the EBSD measurements. Additionally acknowledged is a group of TU-Delft bachelor students (Casper G.J. Hügel, Sylvia L. Van Kreveld, Dirk V.A. Mutters and Bert J. Vogel), who collaborated in carrying out part of the experiments. The authors also are indebted to the Belgian IAP Inter-university attraction poles program P7/21 for financial support.
Author Contributions
This publication is a collective work of all co-authors, with shared responsibility for the text and content of the paper. Sepideh Ghodrat and Leo A.I. Kestens conceived and designed the experiments; Sepideh Ghodrat and Ton Riemslag performed the experiments; Sepideh Ghodrat and Leo A.I. Kestens analyzed the data; all authors contributed in writing the paper, based on an initial version drafted by the first author.
Conflicts of Interest
The authors declare no conflict of interest.
References
- Saxena, A.; Muhlstein, C.L. Fatigue Crack Growth Testing; ASM International, Member/Customer Service Center: Materials Park, OH, USA, 1996; Volume 19, pp. 410–412. [Google Scholar]
- Stephens, R.I.; Fatemi, A.; Stephens, R.R.; Fuchs, H.O. Metal Fatigue in Engineering; John Wiley & Sons, Inc.: New York, NY, USA, 2001. [Google Scholar]
- Tada, H.; Paris, P.C.; Irwin, G.R. The Stress Analysis of Cracks Handbook; ASM International, Member/Customer Service Center: Materials Park, OH, USA, 2000. [Google Scholar]
- Ugˇuz, A.; Martin, J.W. Plastic zone size measurement techniques for metallic materials. Mater. Charact. 1996, 37, 105–118. [Google Scholar] [CrossRef]
- Hahn, G.T.; Hoagland, R.G.; Rosenfield, A.R. Local Yielding Attending Fatigue Crack Growth. Metall. Trans. 1972, 3, 1189–1202. [Google Scholar] [CrossRef]
- Wright, S.I.; Nowell, M.M.; Field, D.P. A Review of Strain Analysis Using Electron Backscatter Diffraction. Microsc. Microanal. 2011, 17, 316–329. [Google Scholar] [CrossRef] [PubMed]
- Ashby, M.F. The deformation of plastically non-homogeneous materials. Philos. Mag. 1970, 21, 399–424. [Google Scholar] [CrossRef]
- Kuhlmann-Wilsdorf, D.; Hansen, N. Geometrically necessary, incidental and subgrain boundaries. Scr. Metall. Mater. 1991, 25, 1557–1562. [Google Scholar] [CrossRef]
- Hardin, T.J.; Adams, B.L.; Fullwood, D.T.; Wagoner, R.H.; Homer, E.R. Estimation of the full Nye’s tensor and its gradients by micro-mechanical stereo-inference using EBSD dislocation microscopy. Int. J. Plast. 2013, 50, 146–157. [Google Scholar] [CrossRef]
- El-Dasher, B.S.; Adams, B.L.; Rollett, A.D. Viewpoint: experimental recovery of geometrically necessary dislocation density in polycrystals. Scr. Mater. 2003, 48, 141–145. [Google Scholar] [CrossRef]
- Pantleon, W. Resolving the geometrically necessary dislocation content by conventional electron backscattering diffraction. Scr. Mater. 2008, 58, 994–997. [Google Scholar] [CrossRef]
- Ruggles, T.J.; Fullwood, D.T. Estimations of bulk geometrically necessary dislocation density using high resolution EBSD. Ultramicroscopy 2013, 133, 8–15. [Google Scholar] [CrossRef] [PubMed]
- Kamaya, M.; Wilkinson, A.J.; Titchmarsh, J.M. Measurement of plastic strain of polycrystalline material by electron backscatter diffraction. Nucl. Eng. Des. 2005, 235, 713–725. [Google Scholar] [CrossRef]
- Kamaya, M.; Wilkinson, A.J.; Titchmarsh, J.M. Quantification of plastic strain of stainless steel and nickel alloy by electron backscatter diffraction. Acta Mater. 2006, 54, 539–548. [Google Scholar] [CrossRef]
- Wright, S.I. EDAX-TSL® Software vs. 8 (2016), Users Manual; EDAX Inc.: Draper, UT, USA, 2016. [Google Scholar]
- Ghodrat, S. Thermo-Mechanical Fatigue of Compacted Graphite Iron in Diesel Engine Components. PhD Thesis, Delft University of Technology, Delft, The Netherlands, 10 June 2013. [Google Scholar]
- Besel, M.; Breitbarth, E. Advanced analysis of crack tip plastic zone under cyclic loading. Int. J. Fatigue 2016, 93, 92–108. [Google Scholar] [CrossRef]
- Bergström, Y. A dislocation model for the stress-strain behaviour of polycrystalline α-Fe with special emphasis on the variation of the densities of mobile and immobile dislocations. Mater. Sci. Eng. 1970, 5, 193–200. [Google Scholar] [CrossRef]
- Bergström, Y.; Granbom, Y.; Sterkenburg, D.; Sterkenburg, D.A. Dislocation-Based Theory for the Deformation Hardening Behavior of DP Steels: Impact of Martensite Content and Ferrite Grain Size. J. Metall. 2010, 2010, 1–16. [Google Scholar] [CrossRef]
Figure 1.
A schematic view of the formation of a plastic zone at the tip of a progressing fatigue crack with (a) Formation of a monotonic plastic zone at the moment of reaching the maximum nominal stress level (for the first time after crack initiation); (b) Formation of the cyclic plastic zone after unloading of step (a); (c) Shifting of the position of the plastic zone, along with the progressing crack tip; (d) Resulting areas of plastic deformation in the wake of crack growth, being the remnants of former plastic zones, in the earlier stage of crack growth.

Figure 2.
Kernel average misorientation (KAM) parameter used to characterize the accumulated plastic strain by monitoring the local orientation gradients [15].
Figure 2.
Kernel average misorientation (KAM) parameter used to characterize the accumulated plastic strain by monitoring the local orientation gradients [15].
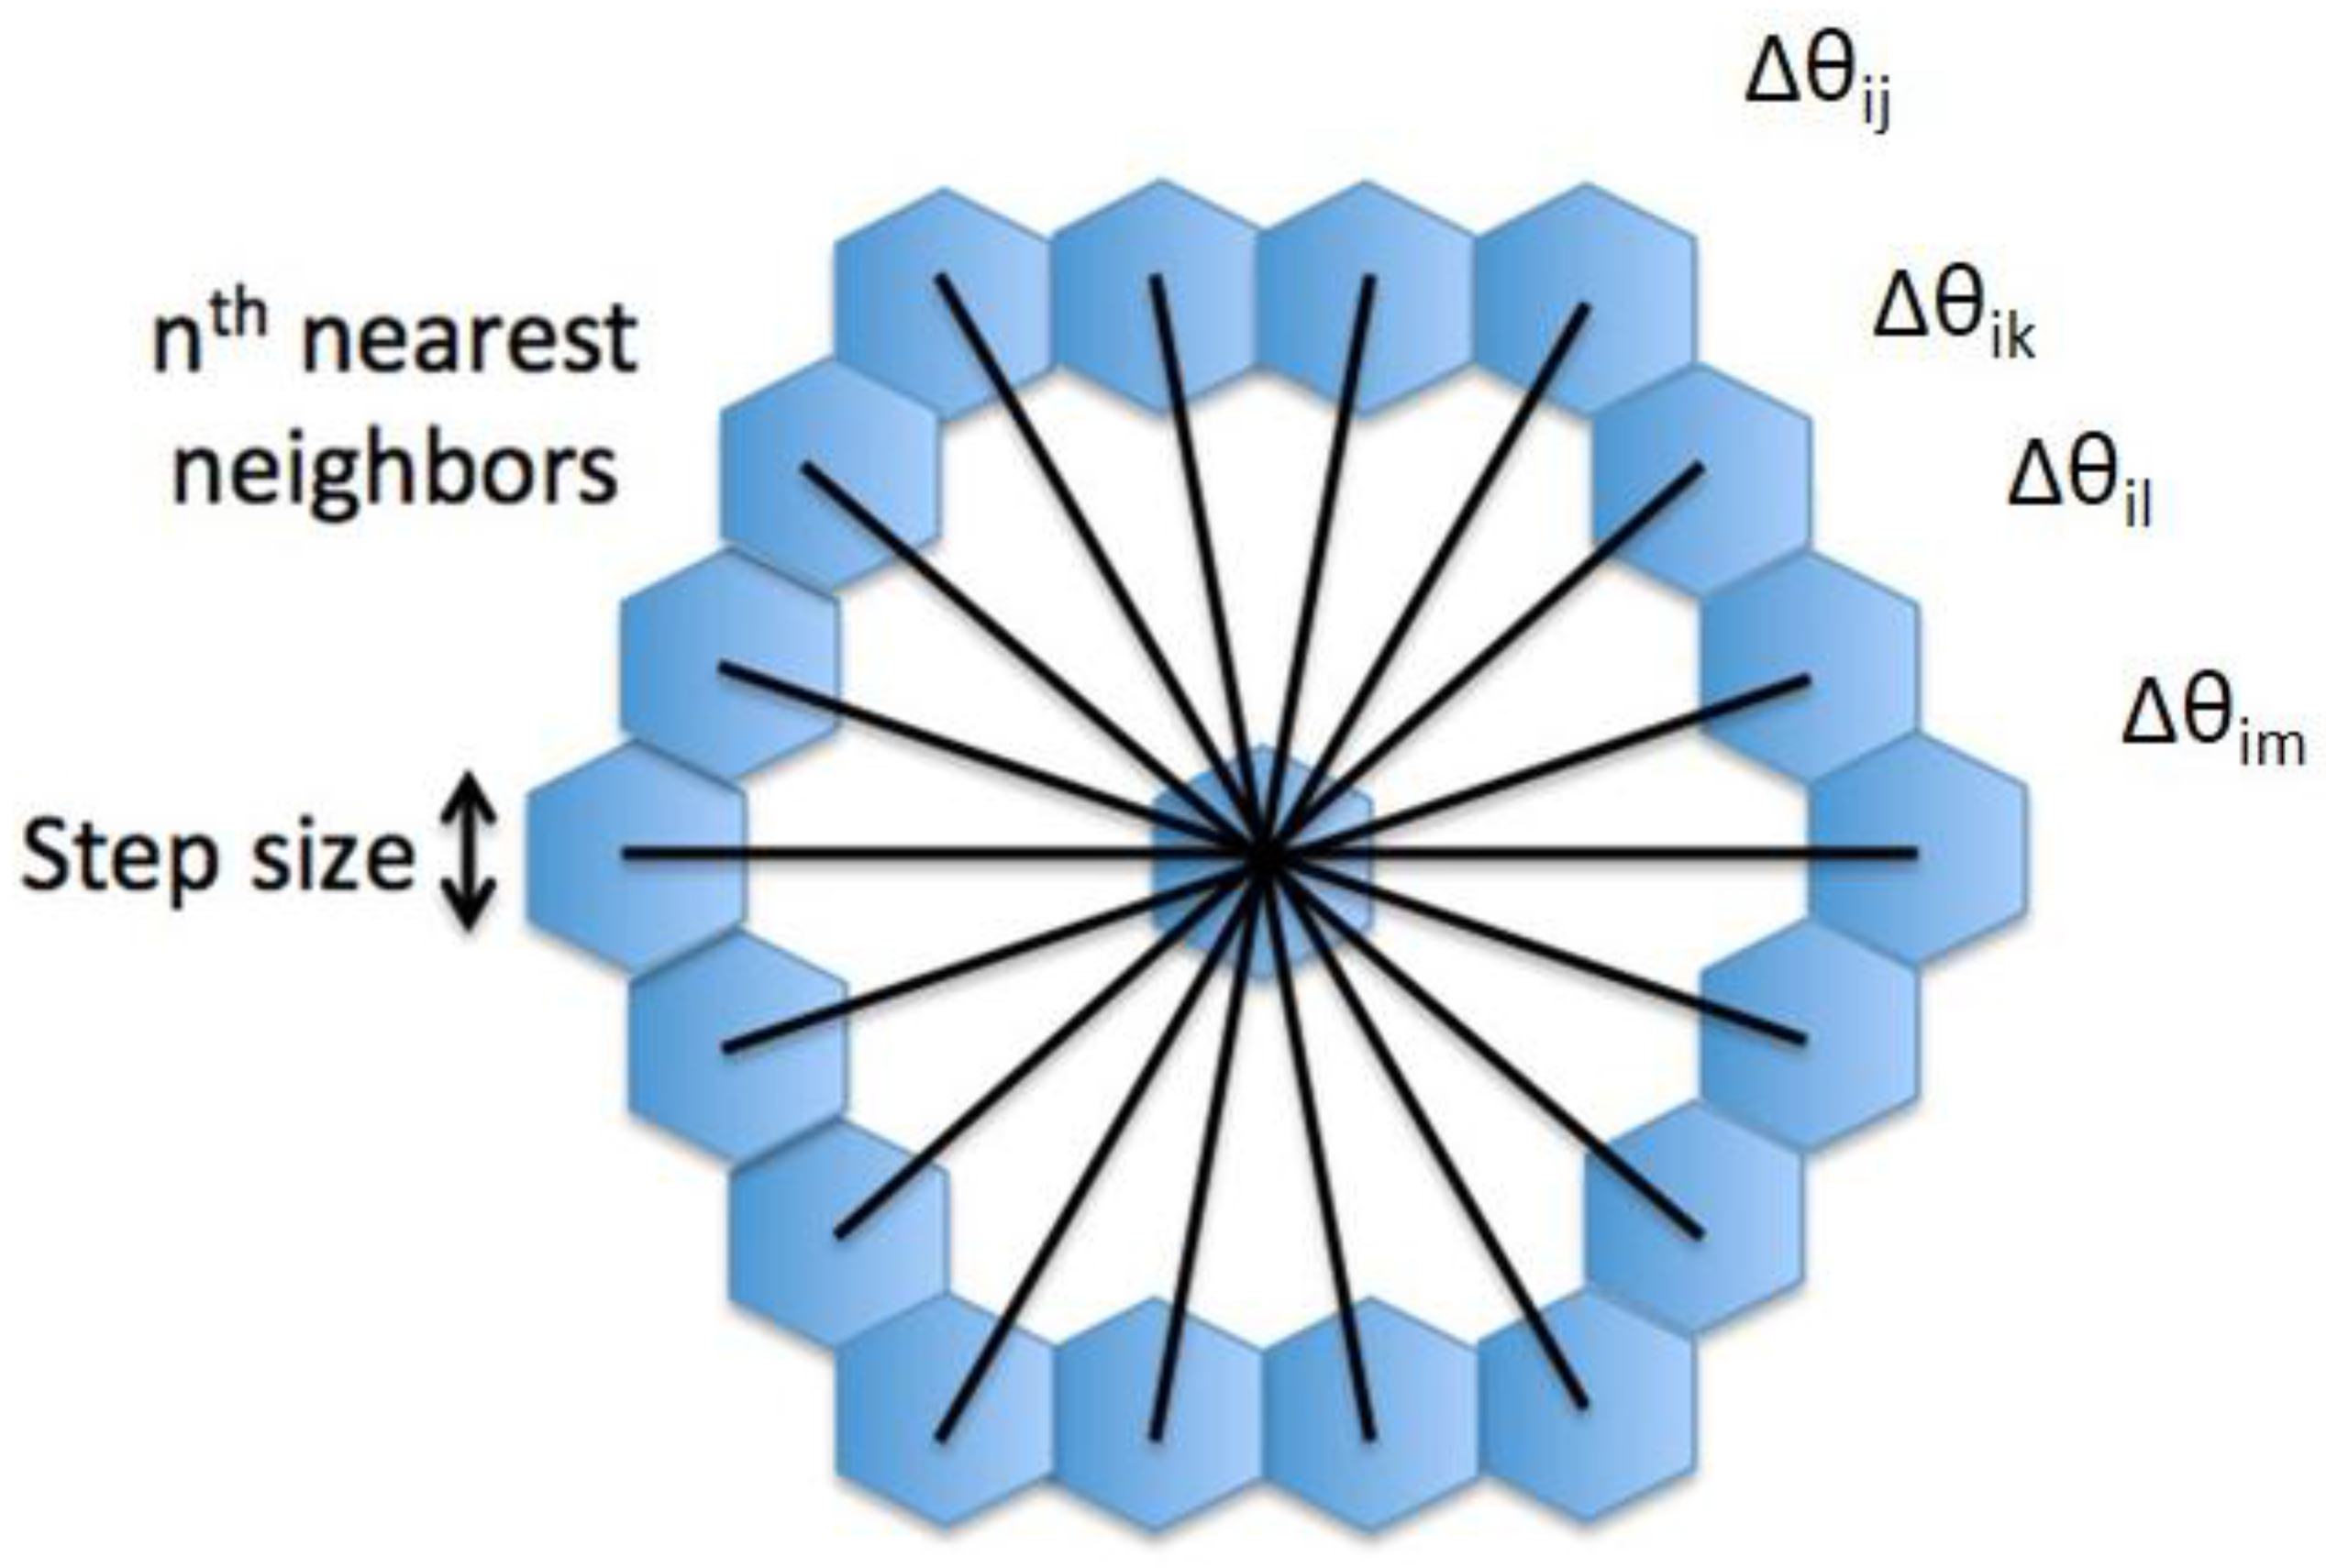
Figure 3.
Vickers Hardness (Hv) values along a line in the extension of the crack tip. Each data point is the average of ten data points along a line that is perpendicular to the crack tip (cf. insert). CPZ: cyclic plastic zone; MPZ: monotonic plastic zone.
Figure 3.
Vickers Hardness (Hv) values along a line in the extension of the crack tip. Each data point is the average of ten data points along a line that is perpendicular to the crack tip (cf. insert). CPZ: cyclic plastic zone; MPZ: monotonic plastic zone.

Figure 4.
Electron backscattered diffraction (EBSD) scan of the crack tip region: (a) Inverse pole figure map; (b) Image quality map; and (c) KAM map (colour legend in degrees).
Figure 4.
Electron backscattered diffraction (EBSD) scan of the crack tip region: (a) Inverse pole figure map; (b) Image quality map; and (c) KAM map (colour legend in degrees).

Figure 5.
Schematic representation of a one-dimension lattice curvature, inducing a shear strain dθ [7].
Figure 5.
Schematic representation of a one-dimension lattice curvature, inducing a shear strain dθ [7].

Figure 6.
Average KAM parameter vs. true strain observed in tensile experiments. The KAM parameter was evaluated for different values of nearest neighbours.
Figure 6.
Average KAM parameter vs. true strain observed in tensile experiments. The KAM parameter was evaluated for different values of nearest neighbours.

© 2017 by the authors. Licensee MDPI, Basel, Switzerland. This article is an open access article distributed under the terms and conditions of the Creative Commons Attribution (CC BY) license (http://creativecommons.org/licenses/by/4.0/).
Share and Cite
MDPI and ACS Style
Ghodrat, S.; Riemslag, A.C.; Kestens, L.A.I. Measuring Plasticity with Orientation Contrast Microscopy in Aluminium 6061-T4. Metals 2017, 7, 108. https://doi.org/10.3390/met7040108
AMA Style
Ghodrat S, Riemslag AC, Kestens LAI. Measuring Plasticity with Orientation Contrast Microscopy in Aluminium 6061-T4. Metals. 2017; 7(4):108. https://doi.org/10.3390/met7040108
Chicago/Turabian StyleGhodrat, Sepideh, Anton C. Riemslag, and Leo A. I. Kestens. 2017. "Measuring Plasticity with Orientation Contrast Microscopy in Aluminium 6061-T4" Metals 7, no. 4: 108. https://doi.org/10.3390/met7040108
Note that from the first issue of 2016, this journal uses article numbers instead of page numbers. See further details here.