
The Effect of Anchor Volume on the Mechanical Strengths of Orthodontic Micro-Implants
by
Yu-Chuan Tseng
1,2, 
Ju-Hui Wu
3,
Chun-Chan Ting
1,†,
Huang-Chi Wang
1,
Hong-Sen Chen
3 and
Chun-Ming Chen
1,4,*,† 1
School of Dentistry, College of Dental Medicine, Kaohsiung Medical University, Kaohsiung 807, Taiwan
2
Department of Orthodontics, Kaohsiung Medical University Hospital, Kaohsiung, Taiwan
3
Faculty of Oral Hygiene, College of Dental Medicine, Kaohsiung Medical University, Kaohsiung, Taiwan
4
Department of Oral and Maxillofacial Surgery, Kaohsiung Medical University Hospital, Kaohsiung, Taiwan
*
Author to whom correspondence should be addressed.
†
These authors contributed equally to this work.
Metals 2017, 7(4), 112; https://doi.org/10.3390/met7040112
Submission received: 20 January 2017
/
Revised: 10 March 2017
/
Accepted: 23 March 2017
/
Published: 25 March 2017
Abstract
:Anchor volume (AV) might be an important factor affecting mechanical strengths of micro-implant. To investigate the correlation between AV and three mechanical strengths (IT: insertion torque; RF: resonance frequency; HPS: horizontal pullout strength), 55 micro-implants (diameter 1.5 mm: Type A, B, C; diameter 1.3 mm: Type D and E) were driven into the artificial bones at a 7-mm depth. The RF, IT, HPS and AV were measured. One-way analysis of variance (ANOVA) with Tukey Honestly Significant Difference (HSD) post comparison and Pearson’s correlation were used to detect significant differences. Null hypothesis states that there was no statistically significant correlation between AV and these three forces (IT, RF, and HPS). Type A and Type D had the lowest IT (4.2 Ncm). Type C had the highest RF (9.9 KHz) in the stability test, and Type B had the greatest HPS (190.9 Ncm) in the resistance test. There was significant correlation between the IT and HPS. AV was significantly correlated with RF, IT, and HPS. The null hypothesis was rejected. In this study, each of these brands had its distinct advantages in the RF, IT, and HPS. Moreover, inner diameter/outer diameter ratio and AV affect the magnitude of HPS.
1. Introduction
Orthodontic appliances are used for applying appropriate force to aid in tooth movement and correct malocclusion. To control the direction of tooth movement, the strength and direction of the applied force should be controlled, and, more importantly, the anchorage should be stable. A stable anchorage can prevent undesirable tooth displacement caused by the antagonism between the applied force and the reaction force. Thus, the quality of anchorage is the key to the success of orthodontic treatment.
In recent years, the application of orthodontic implants for skeletal anchorage [1,2] has prevented unsatisfactory intraoral and extraoral anchorage in conventional orthodontic treatments. The diameters of orthodontic mini-implants and micro-implants used in clinical settings are ≥2 mm and <2 mm, respectively. This technology provides stable anchorage strength and improves the efficacy and outcomes of orthodontic treatments, making it possible to treat extremely difficult malocclusion cases. According to clinical research [3,4,5], the current success rate for mini-implants and micro-implants of various designs and sizes is >80%.
Orthodontic implants inserted into bones exhibit two types of stability: primary and secondary stability. Primary stability is the initial strength of the mechanical interlocking between the micro-implant and bone. Secondary stability is the biological osseointegration formed between the micro-implant and bone during the healing process. Orthodontic implants are typically loaded with orthodontic force within the first three weeks of application. Conversely, dental implants require at least four months for bone integration (secondary stability) to occur. Therefore, primary stability is the main concern in the application of micro-implants.
Many studies [6,7,8,9] have investigated the anchorage force and mechanical strength, including the insertion torque (IT) and pullout strength, of mini-implants and micro-implants. Currently, resonance frequency (RF) analysis is used clinically to measure the level of osseointegration and stability between a dental implant and alveolar bone. Studies [10,11,12] have evaluated dental implant stability through RF analysis. Accordingly, using RF analysis to investigate the stability of orthodontic implants is also feasible. The Osstell system (Integration Diagnostic AB, Goteborg, Sweden) is a harmonic response method that is commonly used for most measurements related to dental implant stability. This system requires a transducer (Smartpeg) specific for locking onto the top of the dental implant. However, most orthodontic implants do not have a device for locking into the Smartpeg. Therefore, we used the direct impulse force method, which is more suitable for measuring the RF of orthodontic implants. However, limited studies have determined the status and stability of orthodontic micro-implants through RF analysis (impulse force method). Therefore, in this study, we conducted intergroup comparisons of the IT, RF, and horizontal pullout strength (HPS) among three different brands of micro-implants, with a null hypothesis that no statistically significant correlation exists between the anchor volume (AV) and the three forces (IT, RF, and HPS).
2. Materials and Methods
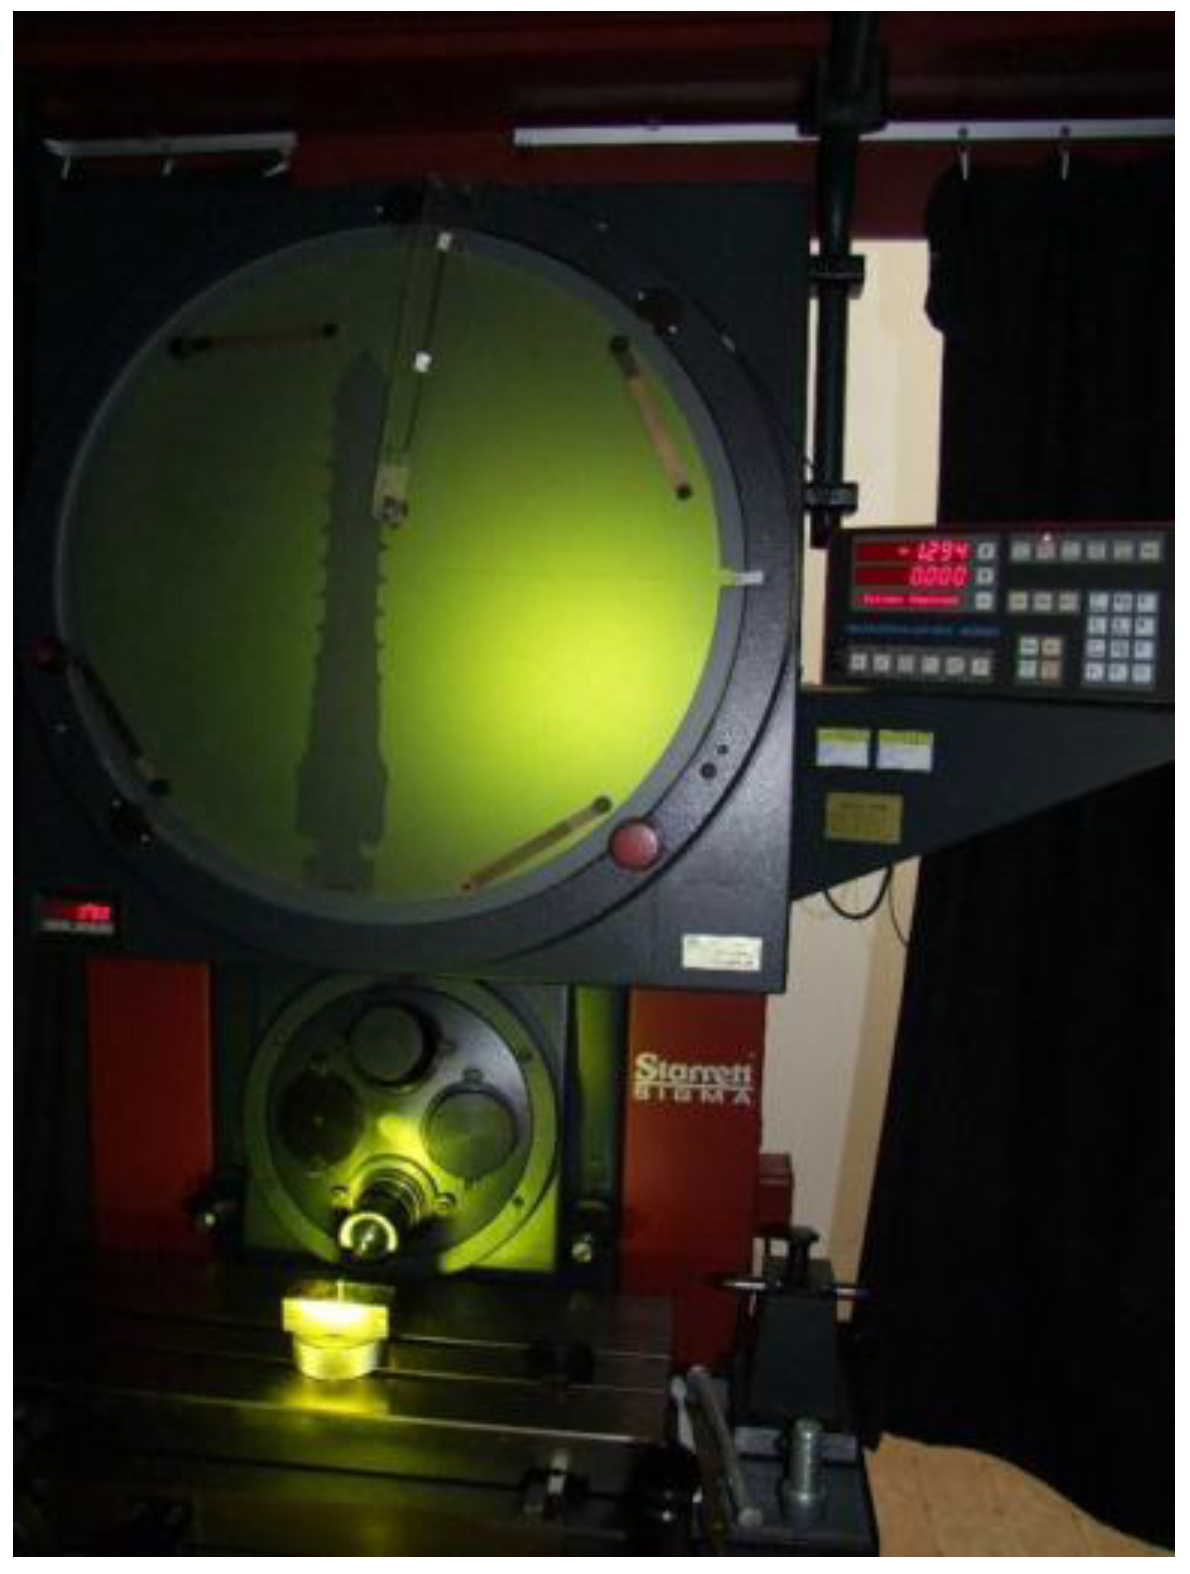
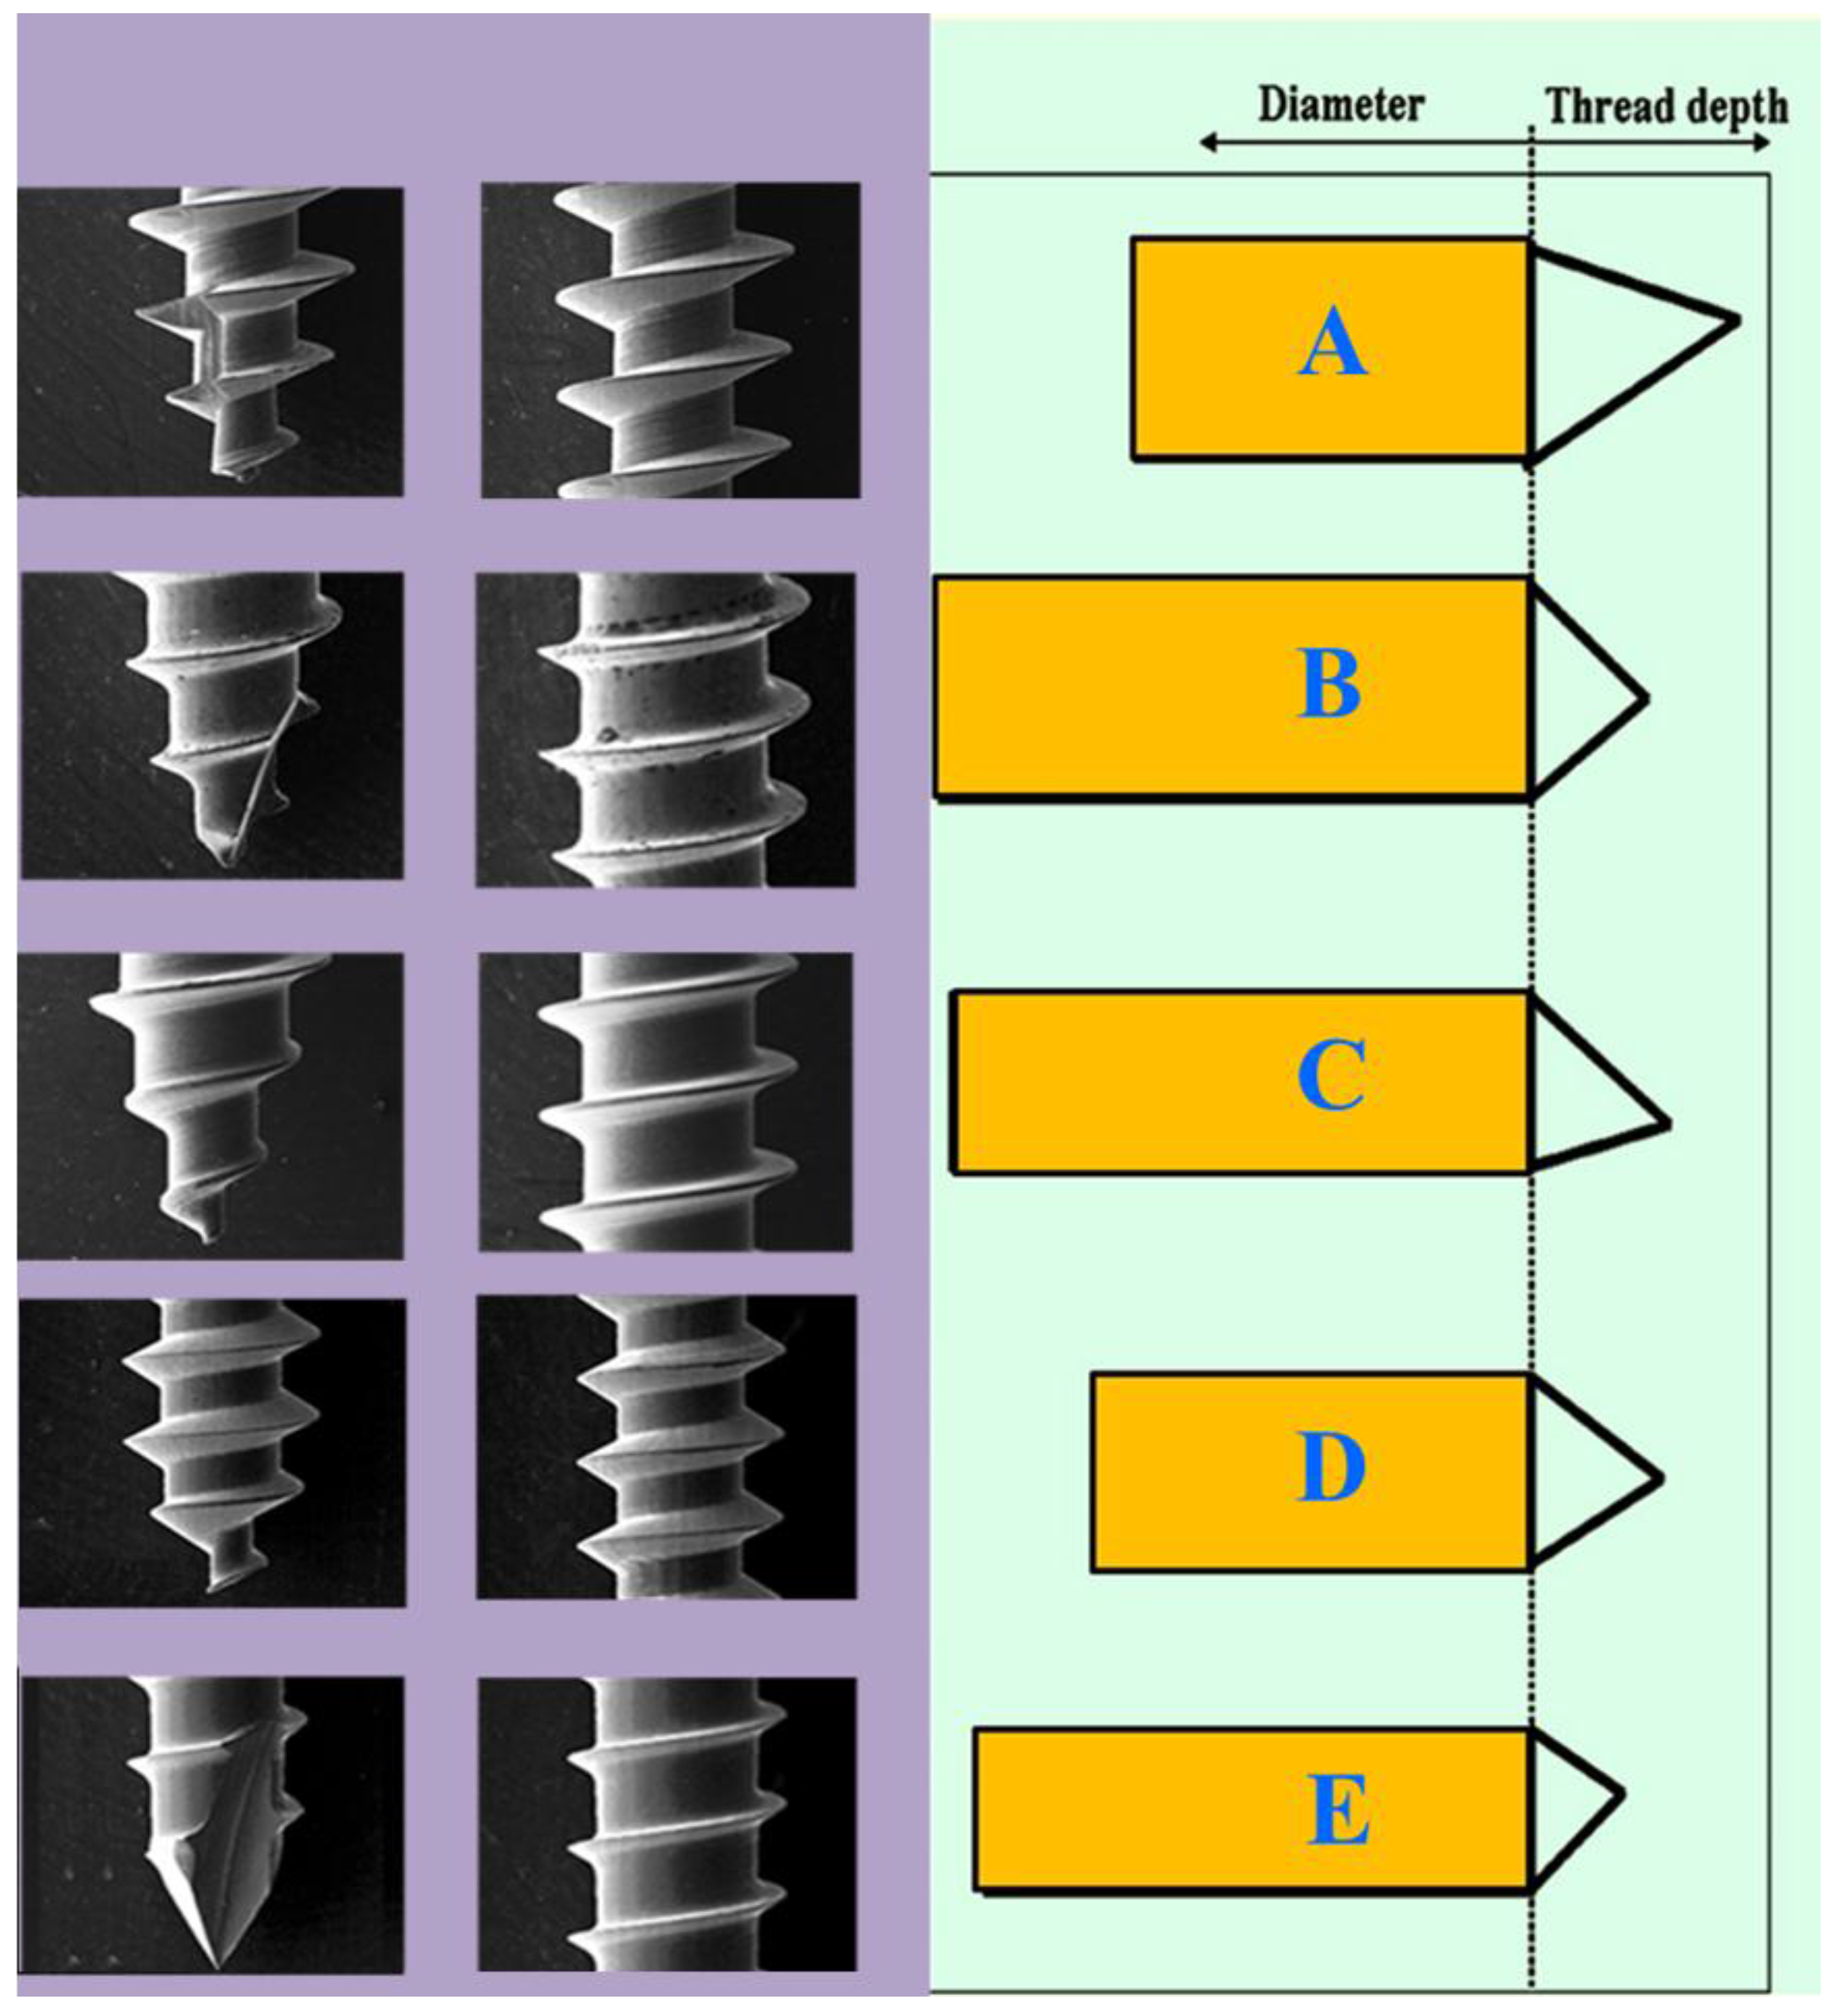
As shown in Figure 1, 55 micro-implants (25 for the IT and HP tests, 25 for AV, and 5 for the RF test) of Type A (1.5 mm diameter × 8 mm length: AbsoAnchor (Dentos Inc., Taegu, Korea)), Type B (1.5 mm diameter × 8 mm length: Bioray (Biotech Corp., Taipei, Taiwan)), Type C (1.5 mm diameter × 9 mm length: Lomas (Mondeal, Tuttlingen, Germany)), Type D (1.3 mm diameter × 8 mm length: AbsoAnchor (Dentos Inc., Taegu, Korea)), and Type E (1.3 mm diameter × 8 mm length: Bioray (Biotech Corp., Taipei, Taiwan)) were used in this study. A Starrett optical projector (Starrett, Athol, MA, USA) was used to measure the specifications of the micro-implants, including the thread diameter, base diameter, pitch, and thread depth (Figure 2 and Figure 3). These specifications were assessed twice, and if the difference between the two values for any length or angle exceeded 0.5 mm or 1°, respectively, the length or angle was registered a third time. The third registration was compared with the previous values, and the mean value was taken from the two closest values, whereas the outlier was excluded from the data. Scanning electron microscope analysis (Hitachi SU8010, Tokyo, Japan) was applied for the surface feature of the thread (Figure 4).
A synthetic bone (Sawbone, Pacific Research Laboratories Inc., Vashon Island, WA, USA) was developed from solid rigid polyurethane foam, with a 2-mm cortical bone [40 pound per cubic feet (pcf)] and bone marrow (20 pcf). Each micro-implant was directly inserted into the synthetic bone without predrilling at a depth of 7 mm and with consideration of 1–2-mm gingival thickness. For each micro-implant, a digital torque meter (Lutron, Taiwan) was used to measure the IT, following the implantation procedure. For the HPS test (Figure 5), a 0.018-inch orthodontic wire was fixed to the hole in the head of the micro-implant by using a material testing system (Lloyd, AMETEK, Inc., Largo, FL, USA). The maximum force was recorded when the micro-implant was pulled out.
An RF analyzer (Implomates, BioTech One, Inc., Taipei, Taiwan) using the impulse force method was applied to measure the RFs (Figure 6). For each type of mini-implant, five measurements were collected and the average was calculated. For investigating the AV (Figure 7), the micro-implants (five of each brand) were inserted into Teflon, as previously described for the IT. After the micro-implant was unscrewed from the Teflon plate, the hole left in the plate was filled with silicone oil (Dow Corning DC50, viscosity: 10cP) to calculate the AV.
In this study, statistical analysis was conducted using SPSS. p < 0.05 was considered statistically significant. One-way analysis of variance (ANOVA) with Tukey honest significant difference (HSD) post comparison was used to detect the differences in the three forces among the different brands of mini-implants. Pearson’s correlation coefficient used to test the null hypothesis that no statistically significant correlation exists between the AV and the three forces (IT, RF, and HPS) for all micro-implants.
3. Results
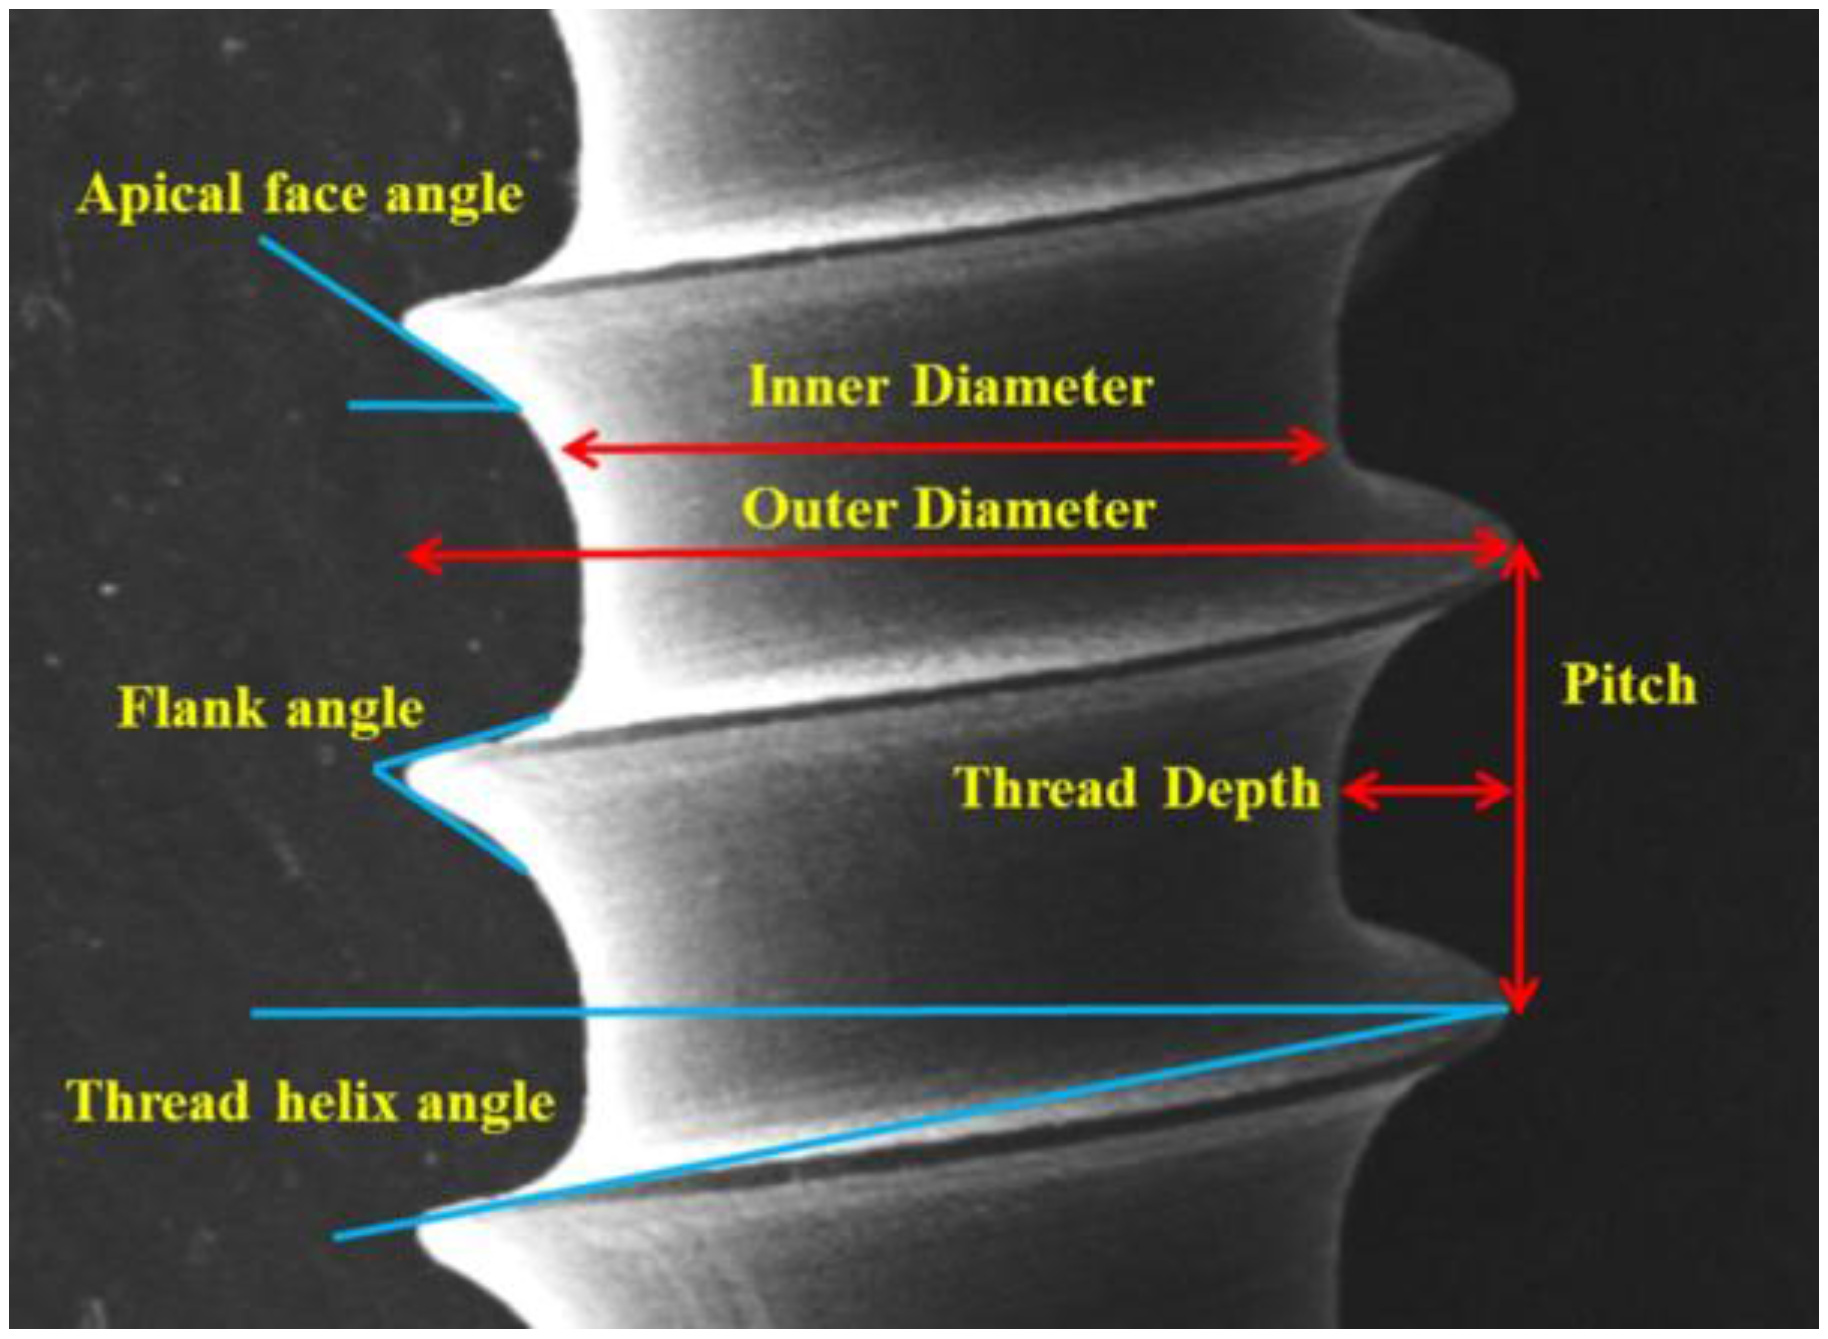
The dimensions for each mini-implant are shown in Table 1. Type E had the largest inner diameter (1.2 mm) and smallest thread depth (0.06 mm). Type A had the smallest inner diameter (0.84 mm) and deepest thread depth (0.33 mm). Therefore, Type E had three greatest inner diameter/outer diameter ratio (0.84) and Type A the smallest (0.56). The pitch of Type A was the largest (0.7 mm) and Type D was the smallest (0.5 mm). Type B had the smallest apical face angle (31.5°). Type D had the largest flank angle (58.5°). Type A had the greatest thread helix angle (20.5°).
The IT, RF, and HPS for each brand of micro-implant and the intergroup comparisons are listed in Table 2. One-way ANOVA with Tukey HSD post comparison (Table 2) was used to analyze the differences in these three forces. In the RF analysis, Type C (9.9 KHz) had a significantly higher RF than did Type A (9.0 KHz), Type B (8.4 KHz), Type E (7.1 KHz), and Type D (6.8 KHz). Regarding the RF, implants with a larger diameter (1.5 mm) had a significantly higher RF than did implants with a smaller diameter (1.3 mm). In the IT test, Type A (4.2 Ncm) and Type D (4.2 Ncm) had significantly lower IT values than did Type B (7.4 Ncm), Type C (7.1 Ncm), and Type E (6.9 Ncm). Type A had a higher RF along with the lowest IT value.
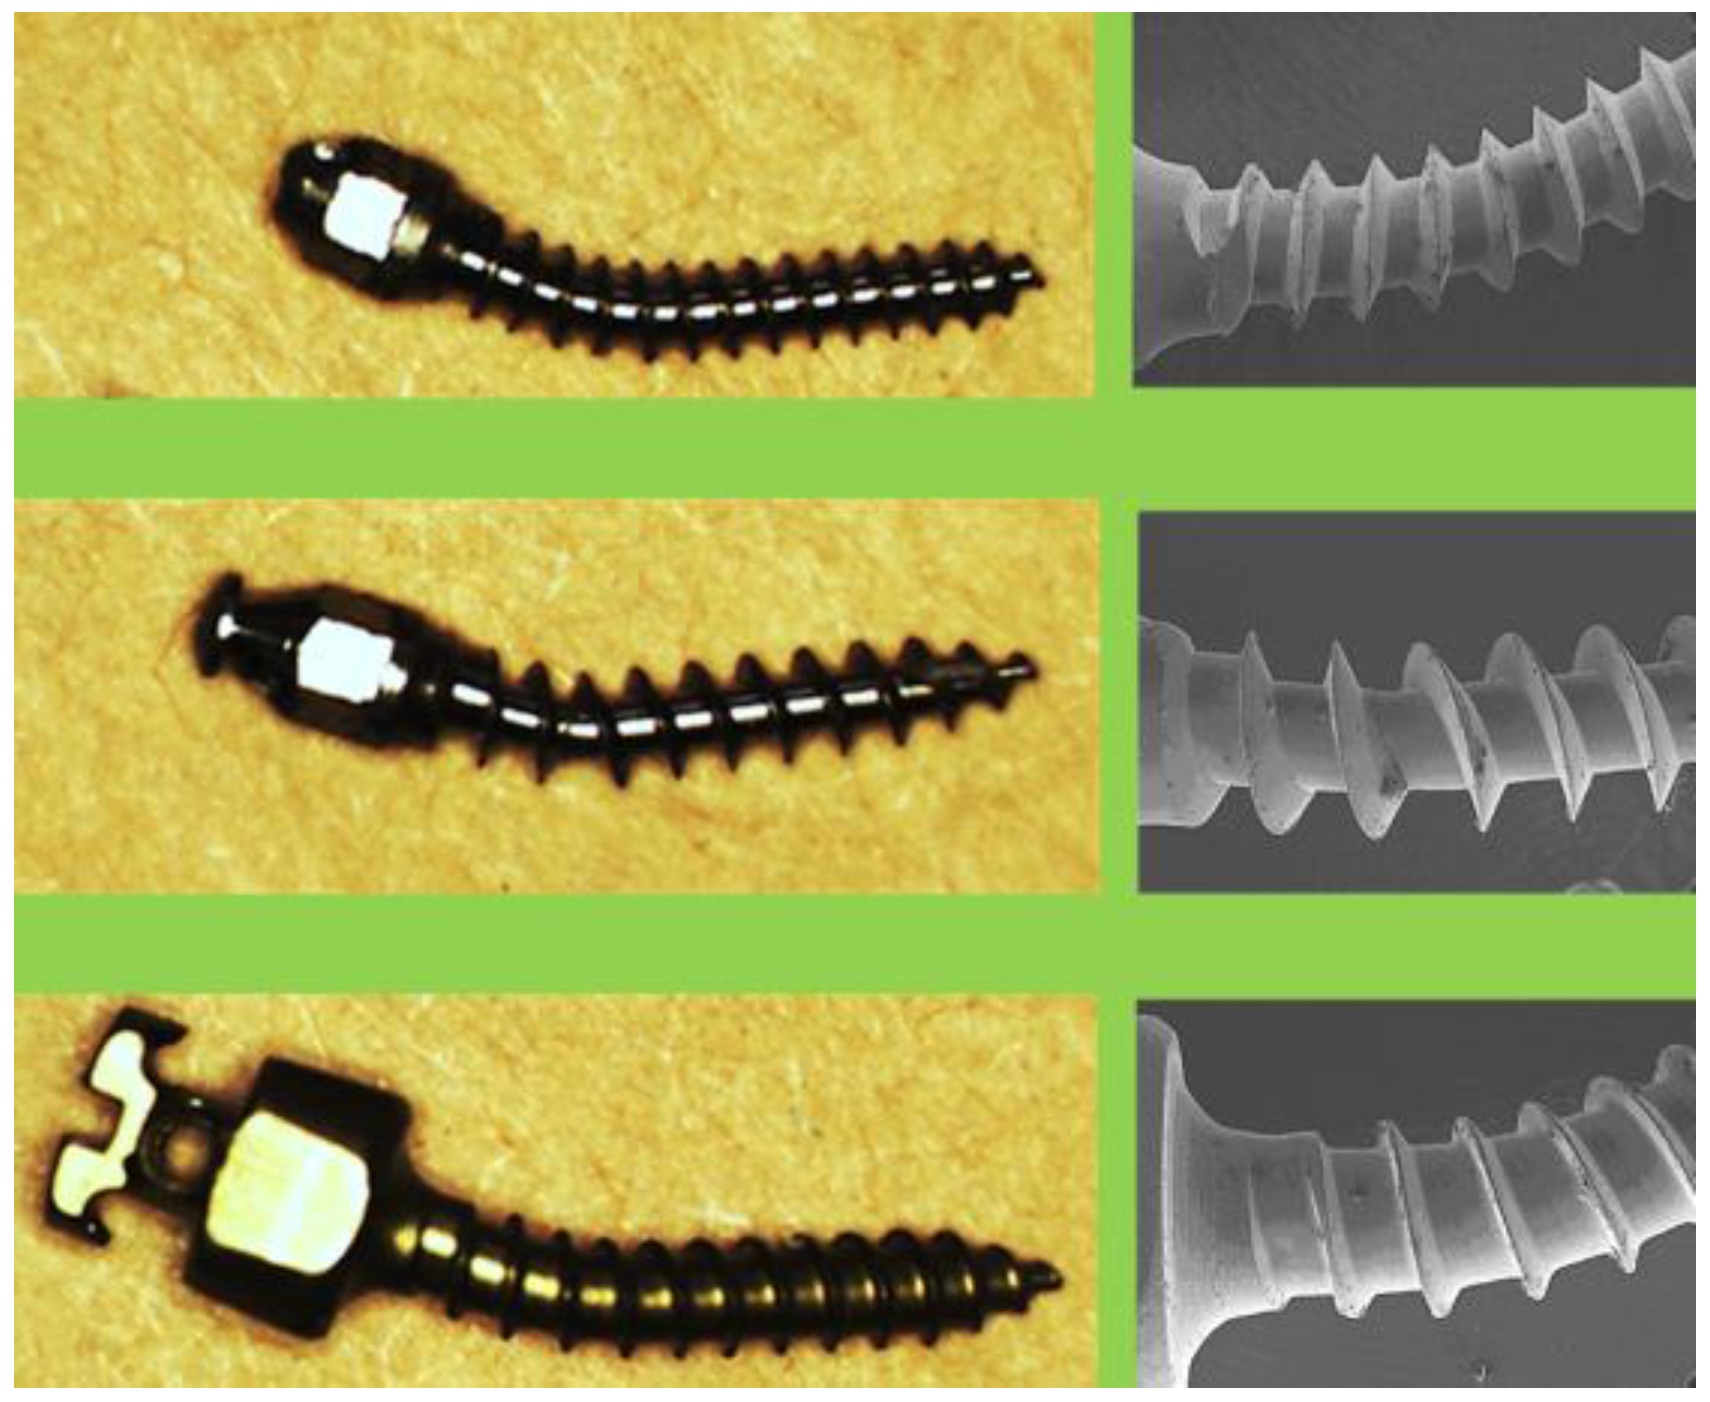
In the HPS test, Type B (190.9 Ncm) exhibited significantly greater values than did Type D (162.5 Ncm) and Type A (159.9 Ncm). The deformed micro-implants (Types A, C, and D) obtained after the HPS test are shown in Figure 8. Regarding the AV, Type D (3.5 mm3) had a significantly smaller AV than did Type B (7.6 mm3), Type C (7.3 mm3), Type E (6.8 mm3), and Type A (4.6 mm3). Type B had the largest AV and HPS. Regarding the IT and AV, Type E (1.3 mm) was similar to Type B (1.5 mm) and Type C (1.5 mm). Pearson’s correlation test was applied for the mechanical strength tests (Table 3). The IT was significantly correlated with the HPS (0.550). The AV presented a significant correlation with the RF (0.436), IT (0.742), and HPS (0.653). Therefore, the null hypothesis was rejected.
4. Discussion
When an implant is inserted into bone, the continuous resistance force created between the two is referred to as the IT. Orthodontic implants are developed using two types of materials, namely stainless steel and titanium alloy. Brown RN et al. [13] reported that stainless steel mini-implants had a significantly higher IT than did those made of titanium alloy. In our study, the Type B and E implants were made of stainless steel, whereas the Type A, C, and D implants were made of titanium alloy. Regarding the IT, no significant difference was observed between Types B and C. Therefore, we conclude that the IT cannot be estimated only on the basis of the material of the micro-implant. Yoo et al. [14] studied the shape of mini-implants and reported that the IT of tapered mini-implants was significantly higher than that of cylindrical mini-implants. In our study, Types A, C, and D were cylindrical, whereas Types B and E were tapered. However, no significant difference in the IT was observed between Types B and C. We therefore conclude that IT estimation based solely on the implant’s shape would lead to errors and inaccuracies. Yoo et al. [14] also reported that the clinical success rates for mini-implants of these two shapes were similar and exhibited no statistically significant difference.
Regarding thread inner diameters, Types A and D were the smallest among the five types of implants. Hence, their inner diameter/outer diameter ratios were also the lowest; accordingly, their IT values were significantly lower than those of the other three types. The significantly smaller IT values of Types A and D also indicate that they require less force during insertion. The IT of Type E (diameter: 1.3 mm) was significantly higher than that of Type A (diameter: 1.5 mm). This may have been due to the higher inner diameter/outer diameter ratio of Type E, which resulted in a similar IT to Types B (diameter: 1.5 mm) and C (diameter: 1.5 mm).
In the RF analysis, the 1.5-mm micro-implants (Types A, B, and C) had significantly higher values than did the 1.3-mm micro-implants (Types D and E). This means that the outer diameter was correlated with the RF; in other words, micro-implants with larger outer diameters had a larger RF. Moreover, the magnitude of the RF coincided with the value of the flank angle in the reverse order. This means that a smaller flank angle achieved a greater RF. In terms of the materials used in the micro-implants, the RF of titanium alloy was significantly higher than that of stainless steel. Concerning the shape of the micro-implants, the RF of the cylindrical (Types C and A) implants was significantly higher than that of the tapered (Type B) implants. Nevertheless, whether the RF is related to the material and shape of the micro-implant requires further investigation.
In the HPS comparison, Types A and D had significantly lower levels, which may have been due to their lower inner diameter/outer diameter ratios. Furthermore, our experiment revealed larger torsional deformation of Types A and D during the HPS test. Because Types A and D had the smallest inner diameter, and because they were more susceptible to torsion during pullout, the level of resistance to HPS was relatively low. Type B was a tapered stainless steel implant with a high inner diameter/outer diameter ratio; hence, Type B demonstrated the largest HPS, without torsional deformation. Although Type E (tapered shape) was only 1.3 mm, it also displayed virtually no deformation during the HPS test. This may have been because of both the higher inner diameter/outer diameter ratio and the type of material (stainless steel); therefore, its HPS level was not different from those of Types B and C (with a diameter of 1.5 mm). Therefore, the inner diameter/outer diameter ratio had the highest correlation with the HPS.
Regarding the material and shape of mini-implants, controversies surround the HPS. The HPS levels of Types B and E (stainless steel and tapered) were higher than those of Types A and E (titanium alloy and cylindrical). Indeed, the hardness of stainless steel is greater than that of titanium alloy, and the torsional deformation of the implants under stress is related to the horizontal resistance. Therefore, the material and shape of the micro-implants were the important factors affecting the HPS. Moreover, the magnitude of the HPS coincided with value of the thread helix angle in the reverse order. This means that the smaller the thread helix angle was, the more concentrated was the resistance to the pullout force, thus resulting in a greater HPS level. Types B, C, and E had smaller thread helix angles and higher HPS levels. By contrast, Type D had the largest thread helix angle and the lowest HPS.
Whether a significant correlation exists between the magnitude of the IT and RF is a focus of current research. Suzuki et al. [15] performed a human cadaver study to evaluate the stability of mini-implants. Their results revealed that the IT magnitude was strongly correlated with the RF. By contrast, Manuel et al. [16] reported that no significant correlation existed between the IT and RF. Our results are consistent with those of Manuel et al. [16]. Another finding of our study is that compared with Types B and C, Type A achieved a higher RF with very small IT. Type A had a larger thread depth than did Types B and C (Figure 4). This design allowed the physician to easily place micro-implants into the bone while achieving good stability.
Hung et al. [17] reported a significant correlation between the IT and vertical pullout strength in both high-density and low-density cortical bones. However, Salmória et al. [18] revealed contrary findings (i.e., no significant correlation existed between the IT and pullout strength). Nevertheless, orthodontic force is usually applied in the horizontal direction and not the vertical direction. Therefore, we performed the HPS test in the present study. Our study identified a significant correlation between the IT and HPS. In addition, our study identified no significant correlation between the RF and HPS.
Regarding the AV, Types D and A had significantly lower values than did the other types. Types D and A had lower inner diameter/outer diameter ratios and larger thread helix angles. Moreover, among the five types of micro-implants, Types A and D had the least two values in the IT and HPS tests. In Pearson’s correlation coefficient test, the AV exhibited a positive significant correlation with the IT, RF, and HPS. Therefore, the AV was the important factor among the features of micro-implants (including thread depth, thread pitch, thread angle, and inner and outer diameters) that impacted the mechanical strength. According to our findings, we recommend that a micro-implant with a larger AV and thread helix angle is useful for clinical applications.
5. Conclusions
In this study, Type A had the lowest IT, Type C had the highest RF in the stability test, and Type B had the highest resistance in the HPS test. Moreover, the inner diameter/outer diameter ratio and thread helix angle affected the HPS magnitude. The AV also exhibited a positive significant correlation with the IT, RF, and HPS. However, osseointegration is the most important factor for the long-term stability of implants. Therefore, a limitation of the present study was the use of synthetic bone, which could not stimulate the osseointegration process.
Author Contributions
Tseng Y.C. and Chen C.M. contributed to the design of the study, the collection and analysis of data and drafted the manuscript. Wu J.H. and Wang H.C. performed the experiments. Ting C.C. and Chen H.S. performed analysis and interpretation of data. Tseng Y.C., Ting C.C. and Chen C.M. provided critical revision. All authors have read and approved the final manuscript.
Conflicts of Interest
The authors declare no conflict of interest.
References
- Kanomi, R. Mini-implant for orthodontic anchorage. J. Clin. Orthod. 1997, 31, 763–767. [Google Scholar] [PubMed]
- Park, H.S. The skeletal cortical anchorage using titanium microscrew implants. Kor. J. Orthod. 1999, 29, 699–706. [Google Scholar]
- Tseng, Y.C.; Hsieh, C.H.; Chen, C.H.; Shen, Y.S.; Huang, I.Y.; Chen, C.M. The application of mini-implants for orthodontic anchorage. Int. J. Oral Maxillofac. Surg. 2006, 35, 704–707. [Google Scholar] [CrossRef] [PubMed]
- Wu, T.Y.; Kuang, S.H.; Wu, C.H. Factors associated with the stability of mini-implants for orthodontic anchorage: A study of 414 samples in Taiwan. J. Oral Maxillofac. Surg. 2009, 67, 1595–1599. [Google Scholar] [CrossRef] [PubMed]
- Rodriguez, J.C.; Suarez, F.; Chan, H.L.; Padial-Molina, M.; Wang, H.L. Implants for orthodontic anchorage: Success rates and reasons of failures. Implant Dent. 2014, 23, 155–161. [Google Scholar] [CrossRef] [PubMed]
- Chen, C.M.; Wu, J.H.; Lu, P.C.; Wang, H.C.; Lee, H.E.; Wang, C.H.; Du, J.K. Horizontal pull-out strength of orthodontic infrazygomatic mini-implant: An in vitro study. Implant Dent. 2011, 20, 139–145. [Google Scholar] [CrossRef] [PubMed]
- Meira, T.M.; Tanaka, O.M.; Ronsani, M.M.; Maruo, I.T.; Guariza-Filho, O.; Camargo, E.S.; Maruo, H. Insertion torque, pull-out strength and cortical bone thickness in contact with orthodontic mini-implants at different insertion angles. Eur. J. Orthod. 2013, 35, 766–771. [Google Scholar] [CrossRef] [PubMed]
- Pithon, M.M.; Figueiredo, D.S.; Oliveira, D.D. Mechanical evaluation of orthodontic mini-implants of different lengths. J. Oral Maxillofac. Surg. 2013, 71, 479–486. [Google Scholar] [CrossRef] [PubMed]
- Chang, J.Z.; Chen, Y.J.; Tung, Y.Y.; Chiang, Y.Y.; Lai, E.H.; Chen, W.P.; Lin, C.P. Effects of thread depth, taper shape, and taper length on the mechanical properties of mini-implants. Am. J. Orthod. Dentofac. Orthop. 2012, 141, 279–288. [Google Scholar] [CrossRef] [PubMed]
- Al-Juboori, M.J.; AbdulRahaman, S.B.; Hassan, A. The correlation between crestal bone resorption and implant stability during healing period using resonance frequency analysis. Implant Dent. 2013, 22, 351–355. [Google Scholar] [CrossRef] [PubMed]
- Makary, C.; Rebaudi, A.; Sammartino, G.; Naaman, N. Implant primary stability determined by resonance frequency analysis: Correlation with insertion torque, histologic bone volume, and torsional stability at 6 weeks. Implant Dent. 2012, 21, 474–480. [Google Scholar] [CrossRef] [PubMed]
- Fuster-Torres, M.Á.; Peñarrocha-Diago, M.; Peñarrocha-Oltra, D.; Peñarrocha-Diago, M. Relationships between bone density values from cone beam computed tomography, maximum insertion torque, and resonance frequency analysis at implant placement: A pilot study. Int. J. Oral Maxillofac. Implants 2011, 26, 1051–1056. [Google Scholar] [PubMed]
- Brown, R.N.; Sexton, B.E.; Gabriel Chu, T.M.; Katona, T.R.; Stewart, K.T.; Kyung, H.M.; Liu, S.S. Comparison of stainless steel and titanium alloy orthodontic miniscrew implants: A mechanical and histologic analysis. Am. J. Orthod. Dentofac. Orthop. 2014, 145, 496–504. [Google Scholar] [CrossRef] [PubMed]
- Yoo, S.H.; Park, Y.C.; Hwang, C.J.; Kim, J.Y.; Choi, E.H.; Cha, J.Y. A comparison of tapered and cylindrical miniscrew stability. Eur. J. Orthod. 2014, 36, 557–562. [Google Scholar] [CrossRef] [PubMed]
- Suzuki, E.Y.; Suzuki, B.; Aramrattana, A.; Harnsiriwattanakit, K.; Kowanich, N. Assessment of miniscrew implant stability by resonance frequency analysis: A study in human cadavers. J. Oral Maxillofac. Surg. 2010, 68, 2682–2689. [Google Scholar] [CrossRef] [PubMed]
- Nienkemper, M.; Wilmes, B.; Pauls, A.; Drescher, D. Mini-implant stability at the initial healing period: A clinical pilot study. Angle Orthod. 2014, 84, 127–133. [Google Scholar] [CrossRef] [PubMed]
- Hung, E.; Oliver, D.; Kim, K.B.; Kyung, H.M.; Buschang, P.H. Effects of pilot hole size and bone density on miniscrew implants’ stability. Clin. Implant Dent Relat. Res. 2012, 14, 454–460. [Google Scholar] [CrossRef] [PubMed]
- Salmória, K.K.; Tanaka, O.M.; Guariza-Filho, O.; Camargo, E.S.; de Souza, L.T.; Maruo, H. Insertional torque and axial pull-out strength of mini-implants in mandibles of dogs. Am. J. Orthod. Dentofac. Orthop. 2008, 133, e15–e22. [Google Scholar] [CrossRef] [PubMed]
Figure 1.
From left to right: Type A (1.5 × 9 mm), Type B (1.5 × 8 mm), Type C (1.5 × 8 mm), Type D (1.3 × 8 mm), and Type E (1.3 × 8 mm).
Figure 1.
From left to right: Type A (1.5 × 9 mm), Type B (1.5 × 8 mm), Type C (1.5 × 8 mm), Type D (1.3 × 8 mm), and Type E (1.3 × 8 mm).
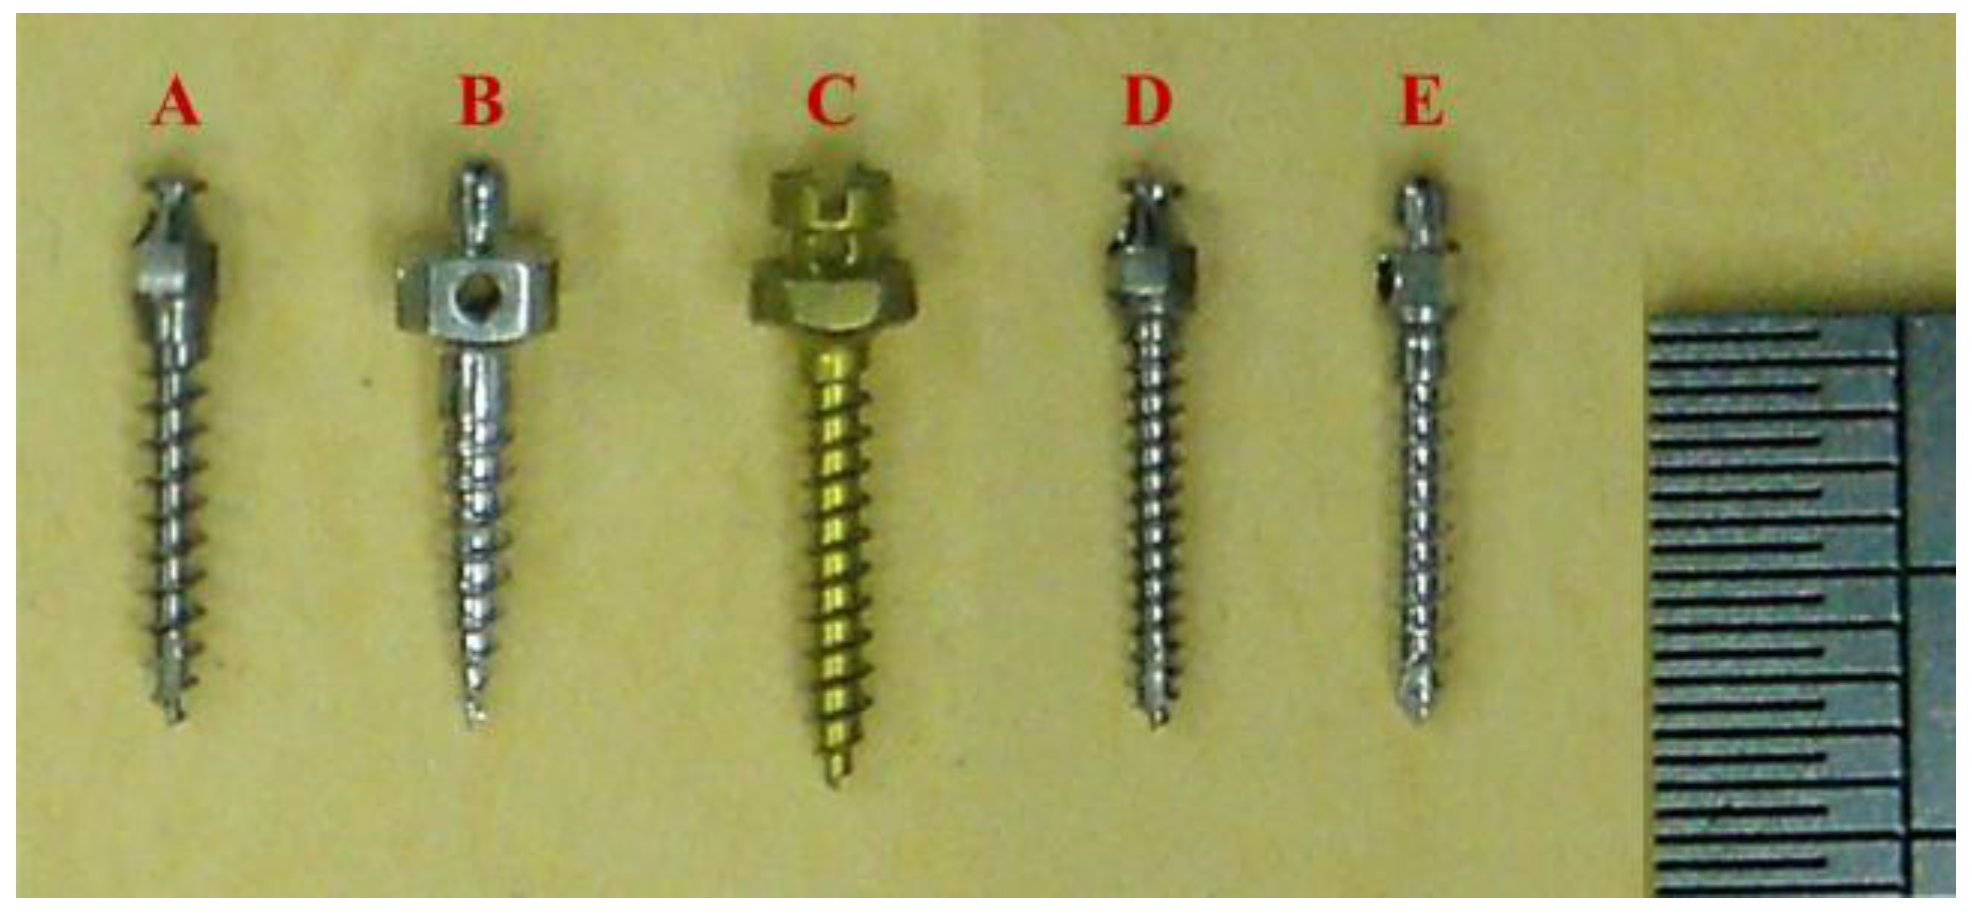
Figure 2.
The Starrett optical projector (Starrett, Athol, MA, USA) was used to measure the specifications of micro-implants.
Figure 2.
The Starrett optical projector (Starrett, Athol, MA, USA) was used to measure the specifications of micro-implants.

Figure 3.
The dimensions of micro-implant.

Figure 4.
Thread in apical and middle portions of micro-implants were magnified by scanning electron microscope.
Figure 4.
Thread in apical and middle portions of micro-implants were magnified by scanning electron microscope.

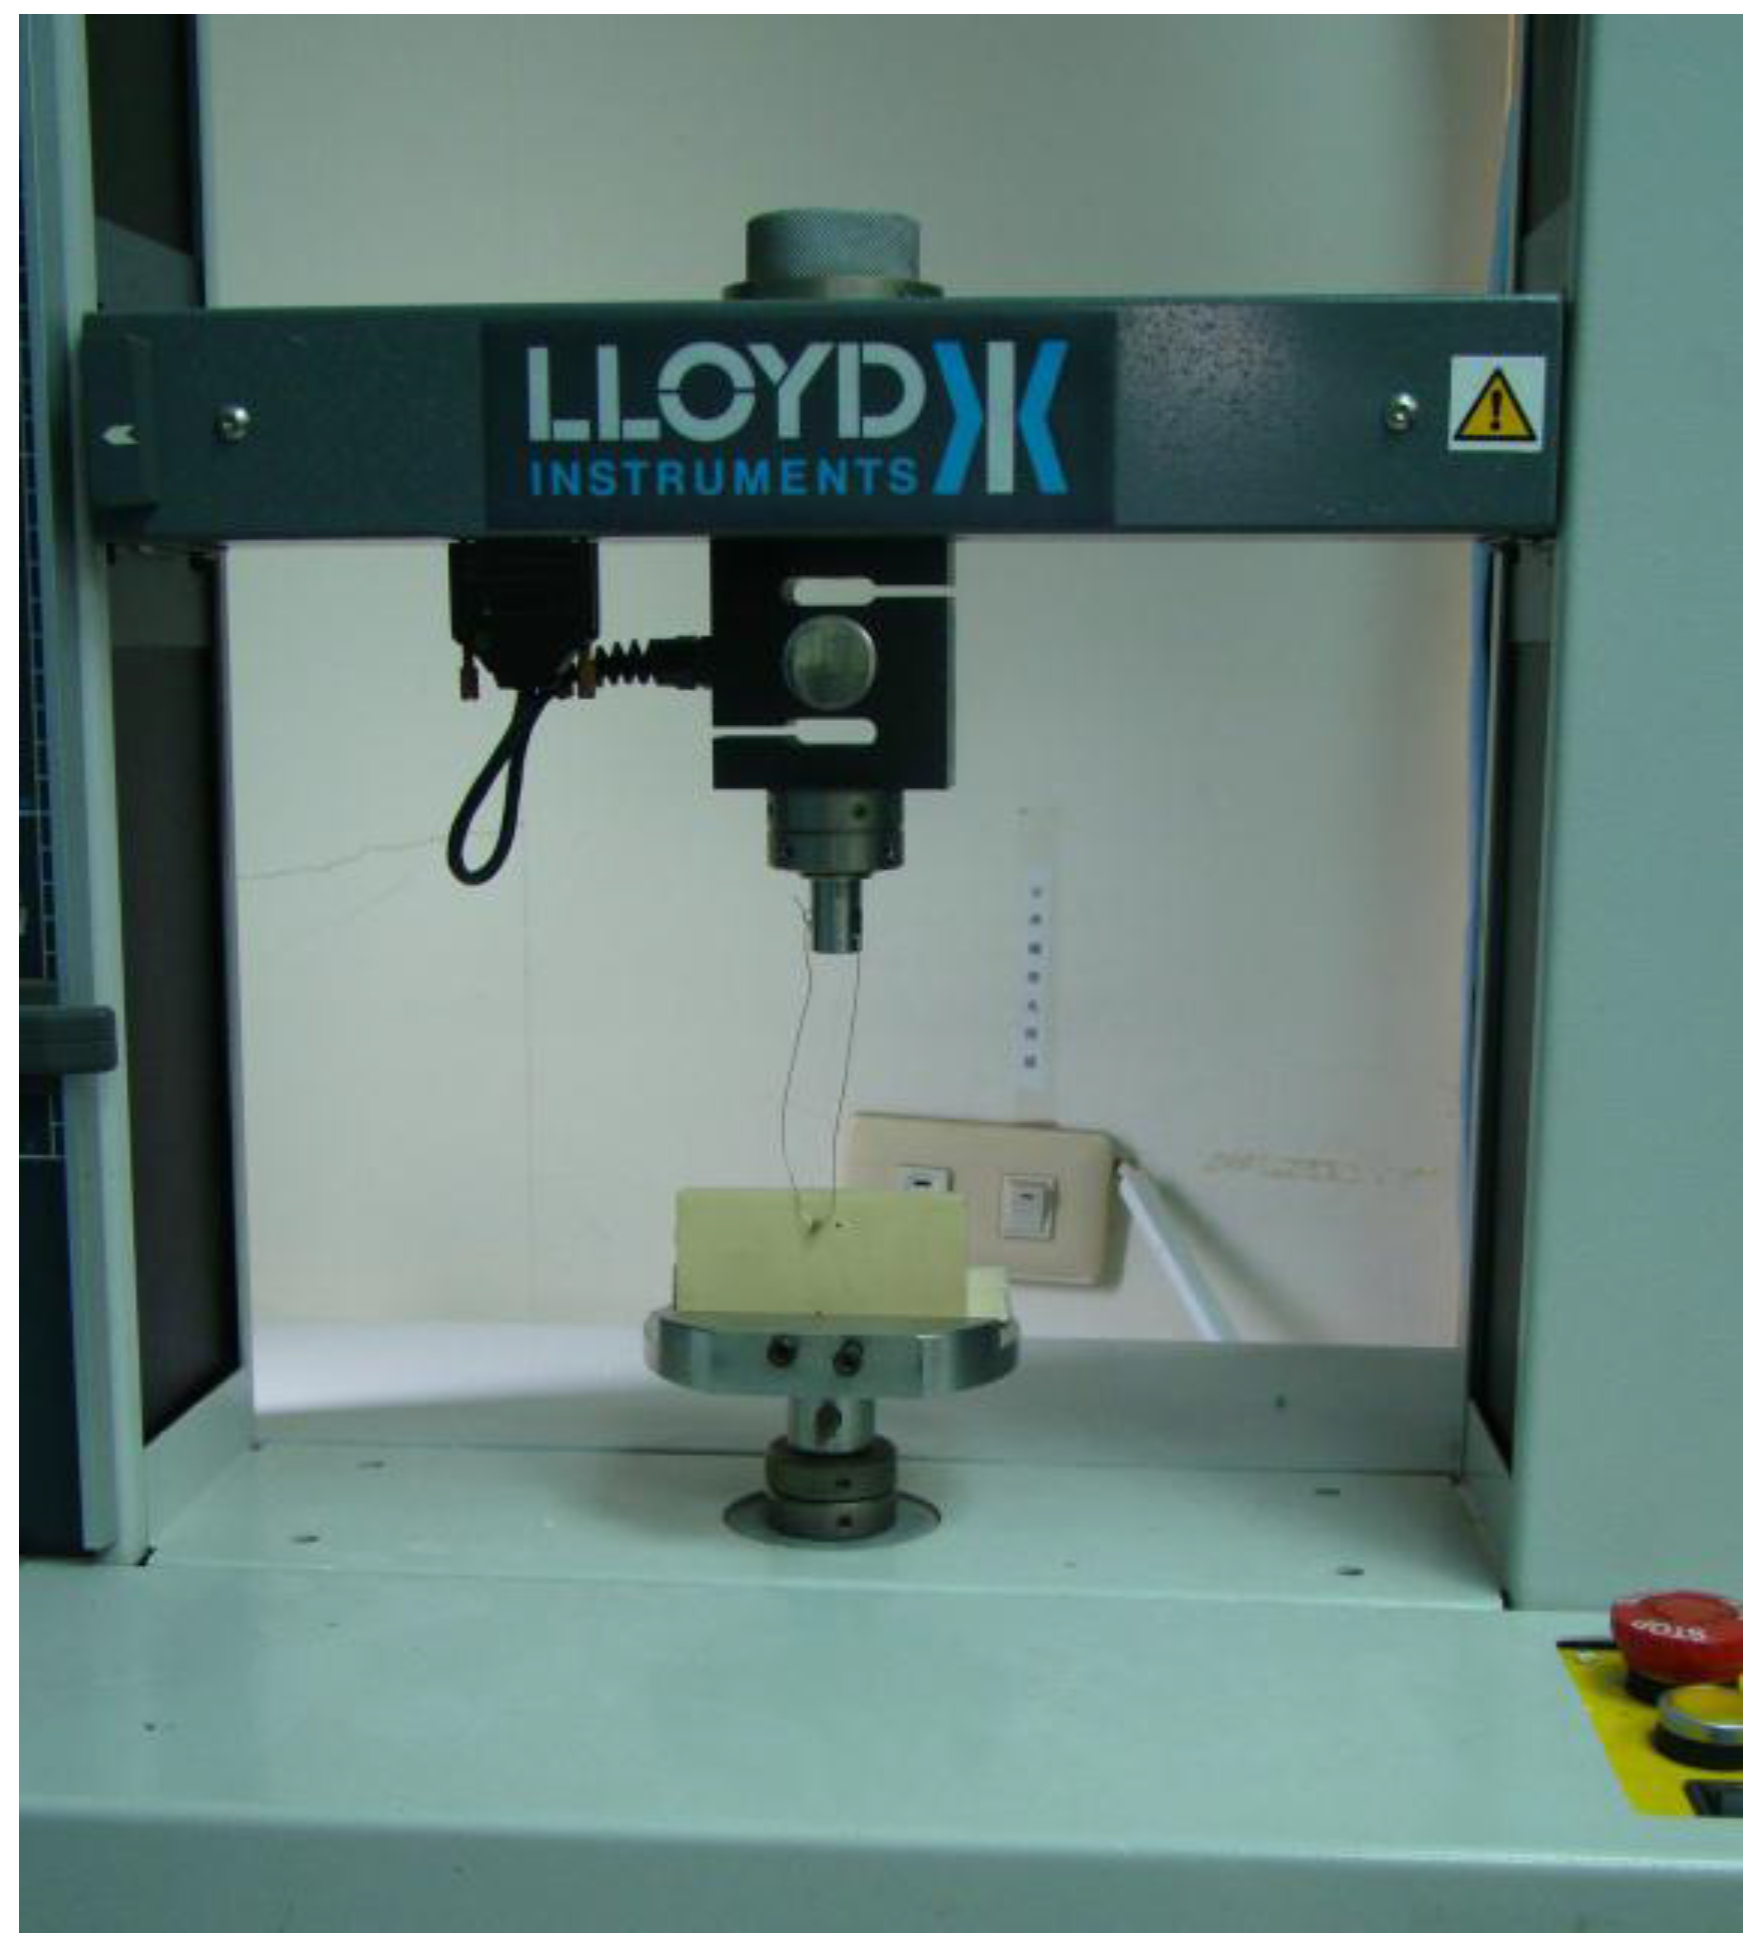
Figure 5.
A micro-implant was inserted into the artificial bone (Sawbone®; Pacific Research Laboratories Inc., Vashon Island, WA, USA). An orthodontic wire (0.018) was passed through the hole of micro-implant, and then tied into the material testing machine (Lloyd®, AMETEK, Inc., Largo, FL, USA) for the horizontal pullout strength test.

Figure 6.
Resonance frequency analysis (Implomate®; BioTech One, Inc., Taipei, Taiwan).
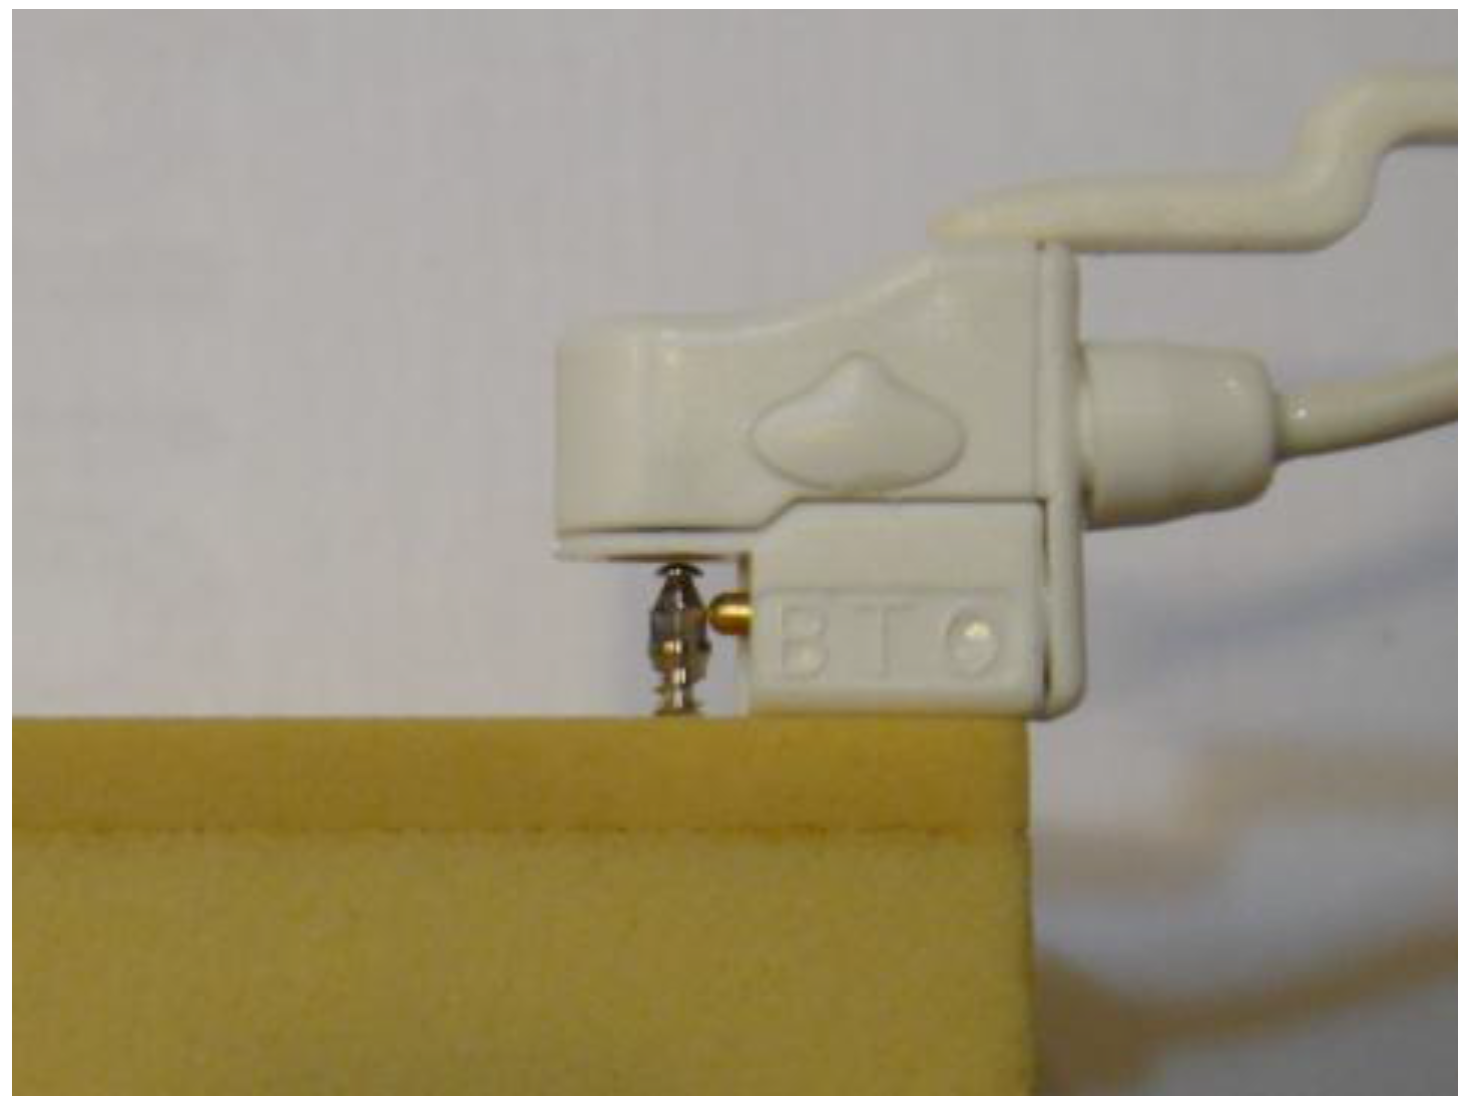
Figure 7.
Anchor volume (yellow line) of micro-implants in the Sawbones® (insertion from left to right as follow: Type A, B, C, D, and E.).
Figure 7.
Anchor volume (yellow line) of micro-implants in the Sawbones® (insertion from left to right as follow: Type A, B, C, D, and E.).
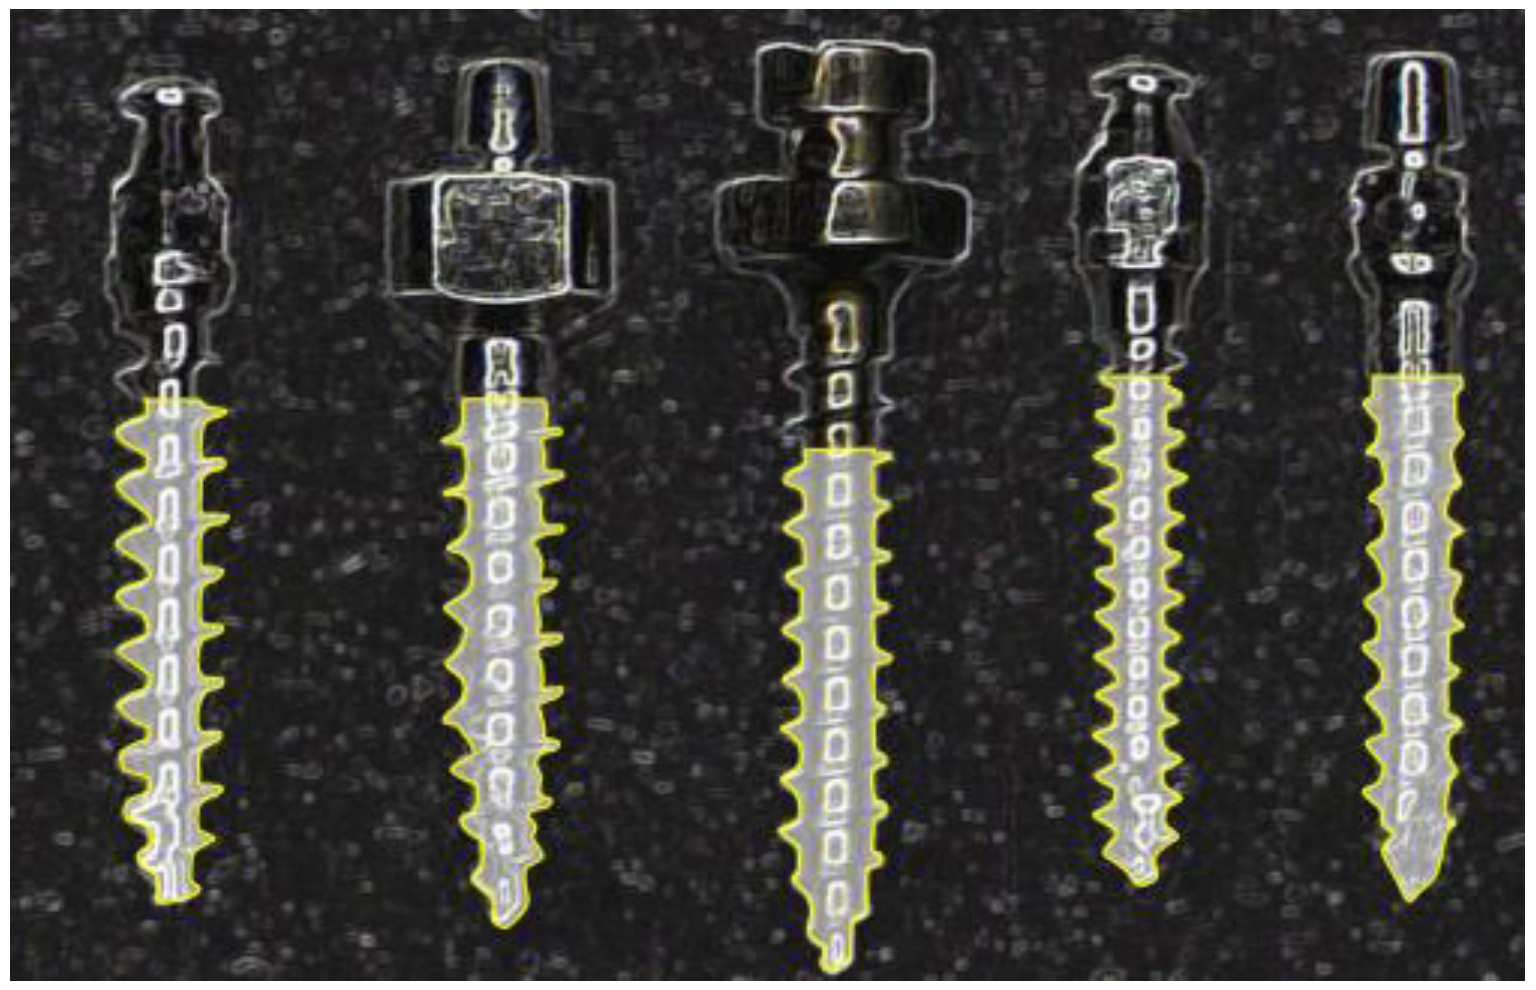
Figure 8.
The deformed micro-implants after HPS test. From top to bottom: Type D, A, and C.


Table 1.
The parameters (mm) of micro-implants.
| Micro-implant | A | B | C | D | E |
|---|---|---|---|---|---|
| Inner diameter | 0.84 | 1.11 | 1.02 | 0.87 | 1.20 |
| Outer diameter | 1.50 | 1.57 | 1.50 | 1.33 | 1.33 |
| Inner diameter/ | 0.56 | 0.71 | 0.68 | 0.65 | 0.84 |
| Outer diameter | |||||
| Thread pitch | 0.70 | 0.68 | 0.65 | 0.50 | 0.60 |
| Thread depth | 0.33 | 0.23 | 0.24 | 0.23 | 0.06 |
| Thread angle (degree) | |||||
| Apical face angle | 33.00 | 31.50 | 32.00 | 32.00 | 33.00 |
| Flank angle | 49.00 | 57.00 | 46.00 | 58.50 | 56.50 |
| Thread helix angle | 20.50 | 11.50 | 12.00 | 14.50 | 11.50 |
Table 2.
Insertion torque (Ncm), resonance frequency (KHz), horizontal pullout strength (Ncm), and anchor volume (mm3) analysis of micro-implants.
Table 2.
Insertion torque (Ncm), resonance frequency (KHz), horizontal pullout strength (Ncm), and anchor volume (mm3) analysis of micro-implants.
| Micro-Implant | Resonance Frequency | Insertion Torque | Horizontal Pullout | Anchor Volume | ||||
|---|---|---|---|---|---|---|---|---|
| Mean | SD | Mean | SD | Mean | SD | Mean | SD | |
| A | 9.0 | 0.02 | 4.2 | 0.82 | 159.9 | 13.91 | 4.6 | 0.40 |
| B | 8.4 | 0.28 | 7.4 | 2.26 | 190.9 | 14.93 | 7.6 | 0.39 |
| C | 9.9 | 0.21 | 7.1 | 1.86 | 180.0 | 15.53 | 7.3 | 0.22 |
| D | 6.8 | 0.30 | 4.2 | 0.38 | 162.5 | 6.48 | 3.5 | 0.92 |
| E | 7.1 | 0.18 | 6.9 | 0.82 | 183.7 | 11.17 | 6.8 | 0.49 |
| Intergroup | C > A, C > B, C > E | B > A, B > D, C > A | B > A, B > D | B > A, B > D, C > A | ||||
| Comparison * | C > D, A > B, A > E | C > D, E > A, E > D | C > D, E > A, E > D | |||||
| A > D, B > E, B > D | A > D | |||||||
* Statistical significance (p ˂ 0.05) in the Tukey HSD post comparison.
Table 3.
The mechanical strengths by Pearson’s correlation coefficient test.
| Variables | Correlation Coefficient | |||
|---|---|---|---|---|
| RF | IT | HPS | AV | |
| RF | 1.000 | 0.026 | 0.069 | 0.436 * |
| IT | 0.026 | 1.000 | 0.550 * | 0.742 * |
| HPS | 0.069 | 0.550 * | 1.000 | 0.653 * |
| AV | 0.436 * | 0.742 * | 0.653 * | 1.000 |
* Statistical significance, p ˂ 0.05.
© 2017 by the authors. Licensee MDPI, Basel, Switzerland. This article is an open access article distributed under the terms and conditions of the Creative Commons Attribution (CC BY) license (http://creativecommons.org/licenses/by/4.0/).
Share and Cite
MDPI and ACS Style
Tseng, Y.-C.; Wu, J.-H.; Ting, C.-C.; Wang, H.-C.; Chen, H.-S.; Chen, C.-M. The Effect of Anchor Volume on the Mechanical Strengths of Orthodontic Micro-Implants. Metals 2017, 7, 112. https://doi.org/10.3390/met7040112
AMA Style
Tseng Y-C, Wu J-H, Ting C-C, Wang H-C, Chen H-S, Chen C-M. The Effect of Anchor Volume on the Mechanical Strengths of Orthodontic Micro-Implants. Metals. 2017; 7(4):112. https://doi.org/10.3390/met7040112
Chicago/Turabian StyleTseng, Yu-Chuan, Ju-Hui Wu, Chun-Chan Ting, Huang-Chi Wang, Hong-Sen Chen, and Chun-Ming Chen. 2017. "The Effect of Anchor Volume on the Mechanical Strengths of Orthodontic Micro-Implants" Metals 7, no. 4: 112. https://doi.org/10.3390/met7040112
Note that from the first issue of 2016, this journal uses article numbers instead of page numbers. See further details here.