
The Influence of FeO on the Reaction between Fe–Al–Ca Alloy and Al2O3–CaO–FeO Oxide during Heat Treatment at 1473 K


1
The State Key Laboratory of Refractories and Metallurgy, Wuhan University of Science and Technology, Wuhan 430081, China
2
School of Metallurgical and Ecological Engineering, University of Science and Technology Beijing, Beijing 100083, China
*
Author to whom correspondence should be addressed.
Metals 2017, 7(4), 129; https://doi.org/10.3390/met7040129
Submission received: 12 March 2017
/
Revised: 29 March 2017
/
Accepted: 5 April 2017
/
Published: 7 April 2017
Abstract
:Oxygen diffusion from oxides to an alloy during heat treatment could influence the properties of the alloy and oxides. To clarify the influence of FeO on the solid-state reactions between Al2O3–CaO–FeO oxide and Fe–Al–Ca alloy during heat treatment at 1473 K, three diffusion couples with different FeO concentrations in the oxide were produced. The diffusion couples were subjected to several procedures successively including an oxide pre-melting experiment using a confocal scanning laser microscope to obtain good contact between the alloy and oxide, vacuum sealing to protect the specimens from oxidation, heat treatment, and electron probe X-ray microanalysis. The effects of the FeO content in the oxide on the morphology of the interface between the alloy and oxide, change of elements in the alloy, widths of the particle precipitation zone (PPZ) and aluminum-depleted zone (ADZ), and size distribution of the particles in the alloy, were investigated and discussed. Based on the Wagner equation of internal oxidation of metals, a modified dynamic model to calculate the PPZ width was established to help understand the mechanism of the solid-state reactions and element diffusion between the Fe–Al–Ca alloy and Al2O3–CaO–FeO oxide with different FeO concentrations.
1. Introduction
Accurate control of the physicochemical characteristics of non-metallic inclusions is beneficial to effectively improve the cleanliness of molten steel and quality of steel products [1,2]. With the development of the iron and steel industry, modern production processes for clean steel are becoming mature and standardized. However, control and removal of non-metallic inclusions in steel require further improvement. Exploration of new processes to produce the steel with the desired cleanliness and quality currently attracts considerable attention [3,4].
Use of heat treatment processes to modify and optimize the physicochemical characteristics of non-metallic inclusions in steel is on the stage of continuous development [5,6,7]. Takahashi et al. [8] reported that as the heat treatment temperature and time increased, the quantities of spherical MnO–SiO2 inclusions and crystalline MnO–Cr2O3 inclusions decreased and increased, respectively, and had close relationships with the Mn and Si concentrations of the steel. Shibata and co-workers [9] confirmed that the critical Si content where the stable oxide changed from MnO–SiO2 to MnO–Cr2O3 during heat treatment was approximately 0.3 wt % for 10 wt % Cr steel. High Si content in the alloy inhibited the modification of MnO–SiO2–type inclusions. Choi et al. [10] proved that, in the steels of Fe-0.0341 wt % Al-0.0444 wt % Ti and Fe-0.0162 wt % Al-0.29 wt % Ti, various original stable inclusions including Al2O3, TiOx, FeOx, and Fe–Ti–O gradually changed to Fe–Al–O and Fe–Al–Ti–O–type inclusions, and in the case of Fe-0.028% Ti, initial Ti–O inclusions changed to Fe–Ti–O inclusions and their sizes clearly became smaller after heat treatment at 1473 K. Kim et al. [11] investigated the reaction between MnO–SiO2–FeO oxide and Fe–Mn–Si solid alloy during heat treatment. Results showed that fine Mn–Si–type oxide particles and fine metal particles formed near the interface in the alloy and in the bulk oxide, respectively. Based on their experimental results, an improved method using a confocal scanning laser microscope (CSLM) to produce a diffusion couple has been developed for revealing precise reactions between the alloy and oxide during heating at 1473 K [12]. It was found that during heating, oxygen in the oxide diffused into the alloy and reacted with Mn and Si, which caused the Mn and Si concentrations to decrease and the precipitation of MnO–SiO2–type particles in the alloy near the alloy–oxide interface. Diffusion of oxygen was suppressed by the decrease in FeO content in the MnO–SiO2–FeO oxides, which caused a shorter particle precipitation zone (PPZ) and manganese depleted zone (MDZ) in the Fe–Mn–Si alloy [13].
In this state, Al2O3–CaO type inclusions are commonly observed in steels deoxidized by Al after calcium treatment. The effect of FeO on the solid-state reactions between Al2O3–CaO–FeO oxide and Fe–Al–Ca solid alloy during heat treatment is still unclear. In this study, three diffusion couples with different FeO concentrations in the oxide are produced and then investigated by heating at 1473 K. The mechanism of the solid-state reactions and element diffusion between the alloy and oxide are further revealed and discussed. From the experimental results, a modified dynamic model to calculate the PPZ width based on the Wagner equation is established. This model is helpful to understand the influence of FeO on solid-state reactions between Fe–Al–Ca alloy and Al2O3–CaO–FeO oxide.
2. Experimental Methods
Initial compositions of Fe–Al–Ca alloy and Al2O3–CaO–FeO oxide that were used for heat treatment at 1473 K are shown in Table 1. The FeO concentrations of the oxides in diffusion couple G0, G1, and G2 were 0.5 wt %, 1.0 wt %, and 3.0 wt %, respectively. Fe–Al–Ca alloy was fabricated by melting electrolytic iron, pure aluminum and pure calcium in a vacuum induction melting furnace (Jinzhou electric Co., Ltd., Jinzhou, China) at 1873 K for 0.5 h. Al2O3–CaO–FeO oxide was prepared by mixing chemical pure Al2O3, CaO, and FeO in a high temperature tube furnace (Jinzhou electric Co., LTD, Jinzhou, China) at 1973 K for 0.5 h. The chemical compositions of Fe–Al–Ca alloy and Al2O3–CaO–FeO oxide were measured by electron probe X–ray microanalysis (EPMA) (JXA8230, JEOL, Tokyo, Japan) and inductively–coupled plasma optical emission spectrometry (ICP–OES) (iCAP 7000 Plus, Thermo Fisher Scientific, Waltham, MA, USA), respectively. Integral experimental processes involved successive oxide pre-melting using confocal scanning laser microscopy (CSLM) (VL2000DX-SVF17SP, Lasertec, Yokohama, Japan), vacuum sealing, heat treatment, and analysis by EPMA, and so on.
(1) Oxide pre-melting experiment using CSLM. To simulate the existing state of inclusions in the alloy, good contact between the Fe–Al–Ca alloy and Al2O3–CaO–FeO oxide needed to be achieved. In this study, CSLM was used to melt the oxide to produce diffusion couples. A small circular hole (Φ1.5 mm) was made in the surface of the alloy sample (Φ5.0 × 3.0 mm) to contain the oxide power. The alloy and oxide were placed into an Al2O3 crucible (Jidong Porcelain Factory, Tangshan, China) with a piece of Ti foil around it to decrease the oxygen partial pressure at high temperature. After the overall pressure in the chamber of CSLM reached 5.0 × 10⁻³ Pa, Ar gas (99.9%) was introduced to prevent oxidation of the samples. The temperature was increased from room temperature to about 1700 K (20 K higher than the melting point of the oxide). As soon as the oxide melted, the samples were immediately quenched by helium gas. Heating and cooling rates were approximately 100 and 1000 K/min, respectively. Figure 1 shows the experimental setup for melting the oxide contained in the alloy cylinder in the CSLM.
(2) Vacuum sealing experiment. After the oxide pre-melting experiment, each diffusion couple, along with a piece of Ti foil and a block of alloy of the same composition, was sealed in a quartz tube filled with pure Ar gas. The quartz tube was first evacuated to 1.0 × 10⁻² Pa by vacuum pumping (Partulab Technology Co. Ltd., Wuhan, China), then Ar gas was introduced to fill the tube to a pressure of 2 × 10⁴ Pa. The experimental setup is shown in Figure 2.
(3) Heat treatment experiment and sample analysis. The quartz tube was subjected to heat treatment following the designed temperature profile in a high-temperature tube furnace, and then quenched by water. The holding times were set at 10 and 50 h. The whole temperature curve of the heat treatment process for the diffusion couple is shown in Figure 3. Here, Gx-0, Gx-10, and Gx-50 are the samples obtained after the oxide pre-melting experiment, and after heat treatment for 10 and 50 h, respectively, where x = 0, 1, or 2, indicating the corresponding diffusion couple with different FeO concentrations in the oxide. A vertical section of each diffusion couple was ground with SiC sand paper, polished using Al2O3 polishing paste, and then observed by a metallographic microscope to confirm the analysis position. After that, the sample surfaces of diffusion couples were coated by carbon powder for conduction. Compositions and phases of the Fe–Al–Ca alloy and Al2O3–CaO–FeO oxide at each alloy–oxide interface were then measured and analyzed by EPMA. Measurement conditions are as follows: accelerating voltage 25 kV, electric current 4.5 nA, beam diameter 1 μm. To lower the error, elements in the alloy were calibrated using standard samples before analysis each time. Weight fractions of Al2O3, CaO, and FeO were obtained by direct conversion from the analyzed amounts of Al, Ca, and Fe in the oxide, respectively.
3. Results
Figure 4 shows morphology of the interface between the alloy and oxide in diffusion couple G0, G1, and G2 after the oxide pre-melting experiment. According to the observation by EPMA, in all cases, good contact was obtained between the alloy and oxide. Some Al2O3 particles (points 1 and 2 in Figure 4a–c) precipitated in the alloy and a narrow PPZ was found near the alloy–oxide interface, which indicated that slight chemical reaction occurred between the alloy and oxide. Oxygen diffused from the oxide into the alloy and reacted with the elemental Al in the alloy. The method used to calculate PPZ width was the same as that defined in the previous work. PPZ was defined as the zone with more than two particles counted in a rectangular area 50 μm parallel to the interface and 5 μm perpendicular to the interface [12]. Although the FeO content in the oxide was different in diffusion couple G0, G1, and G2, after heating at 1700 K, the oxides were similarly composed of gray and white phases. According to the EPMA results, the composition of the gray phases was close to 12CaO·7Al2O3. The concentrations of FeO in the 12CaO·7Al2O3 phase were about 0.6 wt %, 1.0 wt %, and 2.8 wt % in diffusion couple G0-0, G1-0, and G2-0, respectively. The white phase was composed of Al2O3, CaO, and relatively higher FeO content compared with that of the gray 12CaO·7Al2O3 phase. The amount of white phase increased with the initial FeO content in the oxide of the diffusion couples.
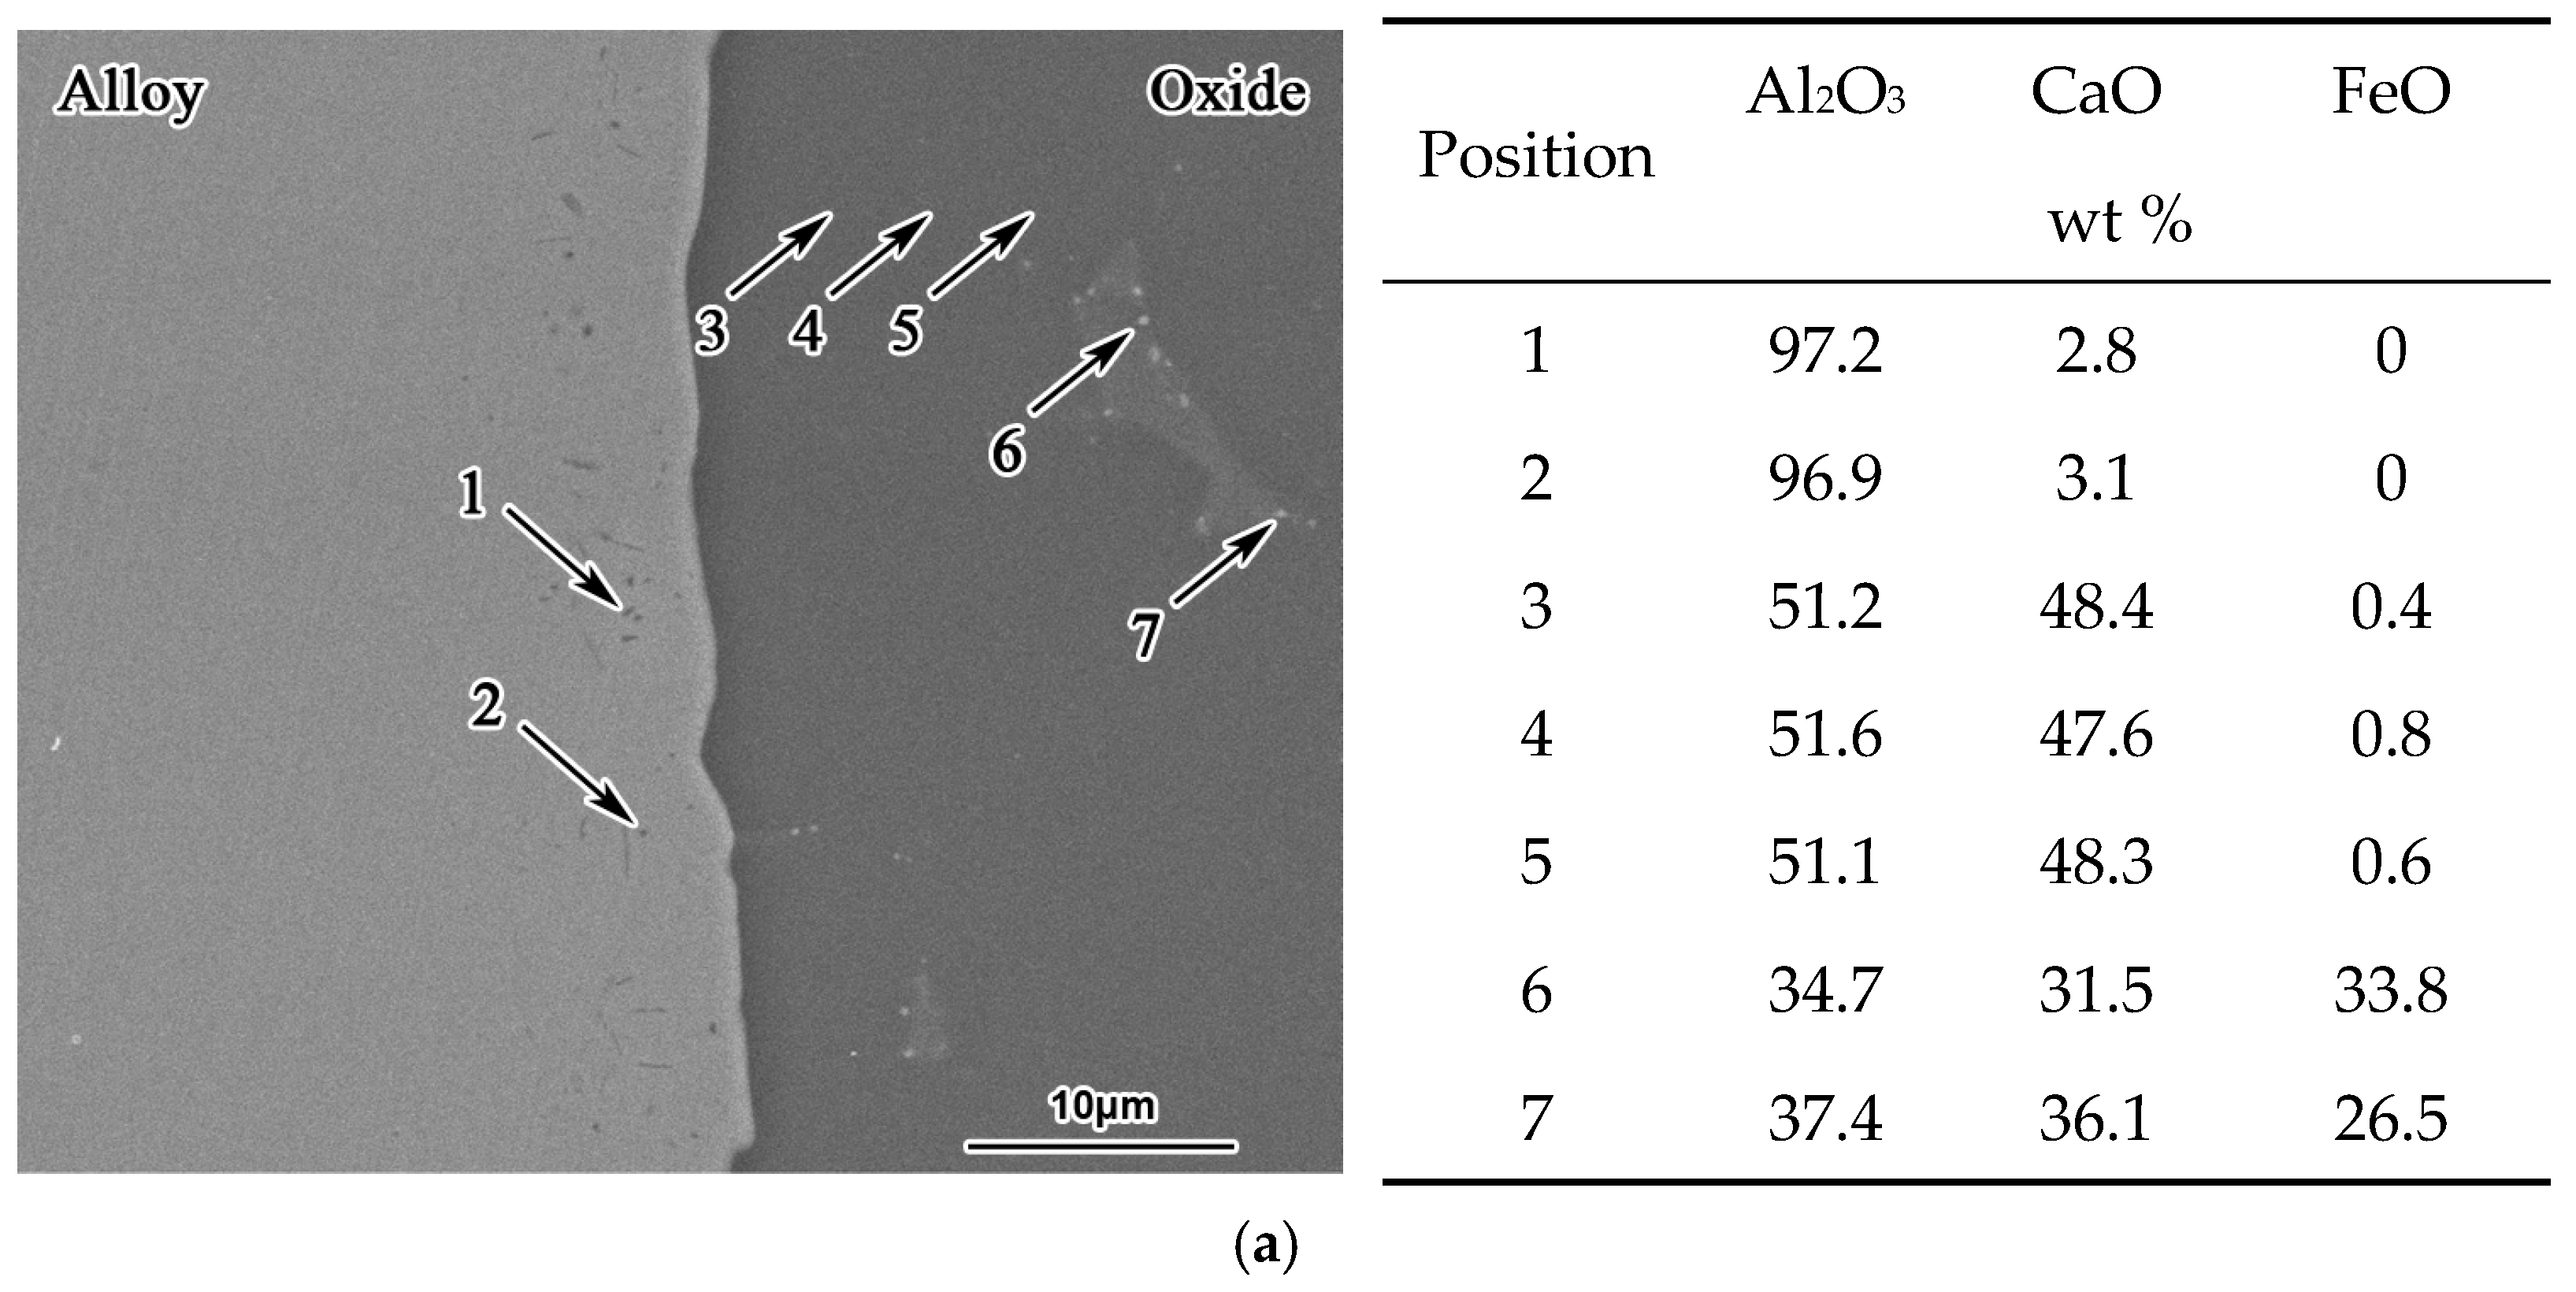
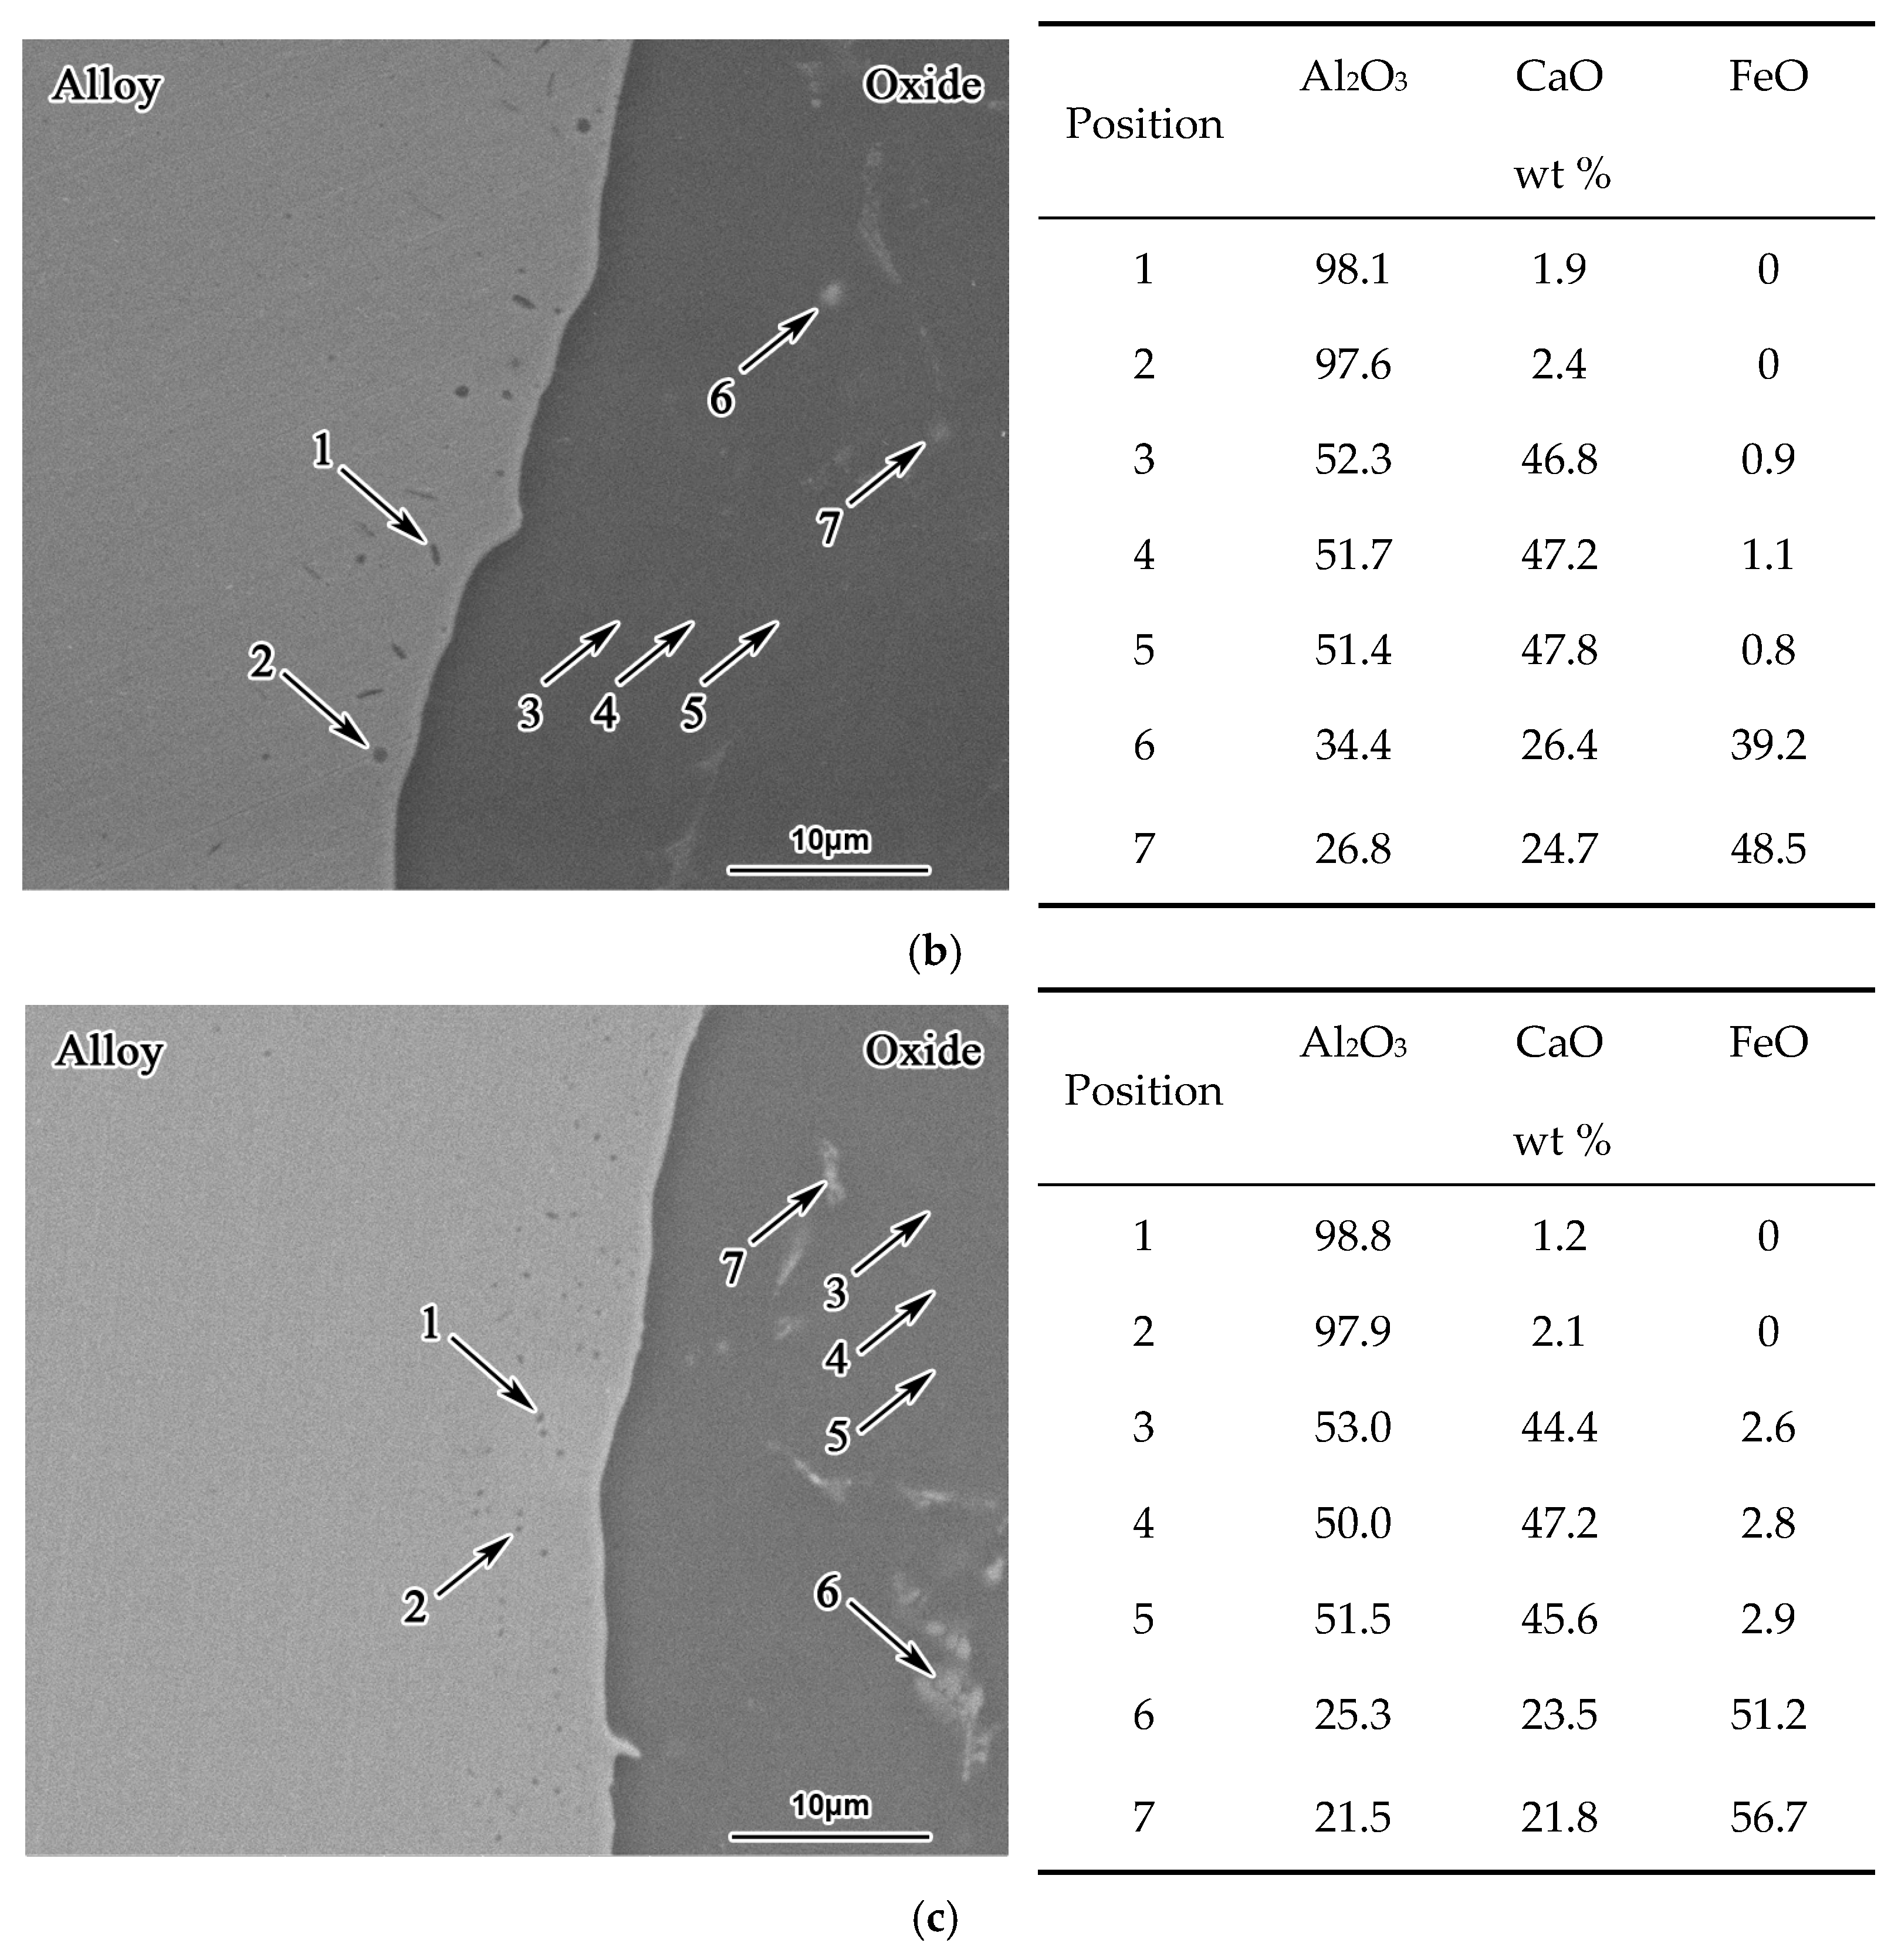
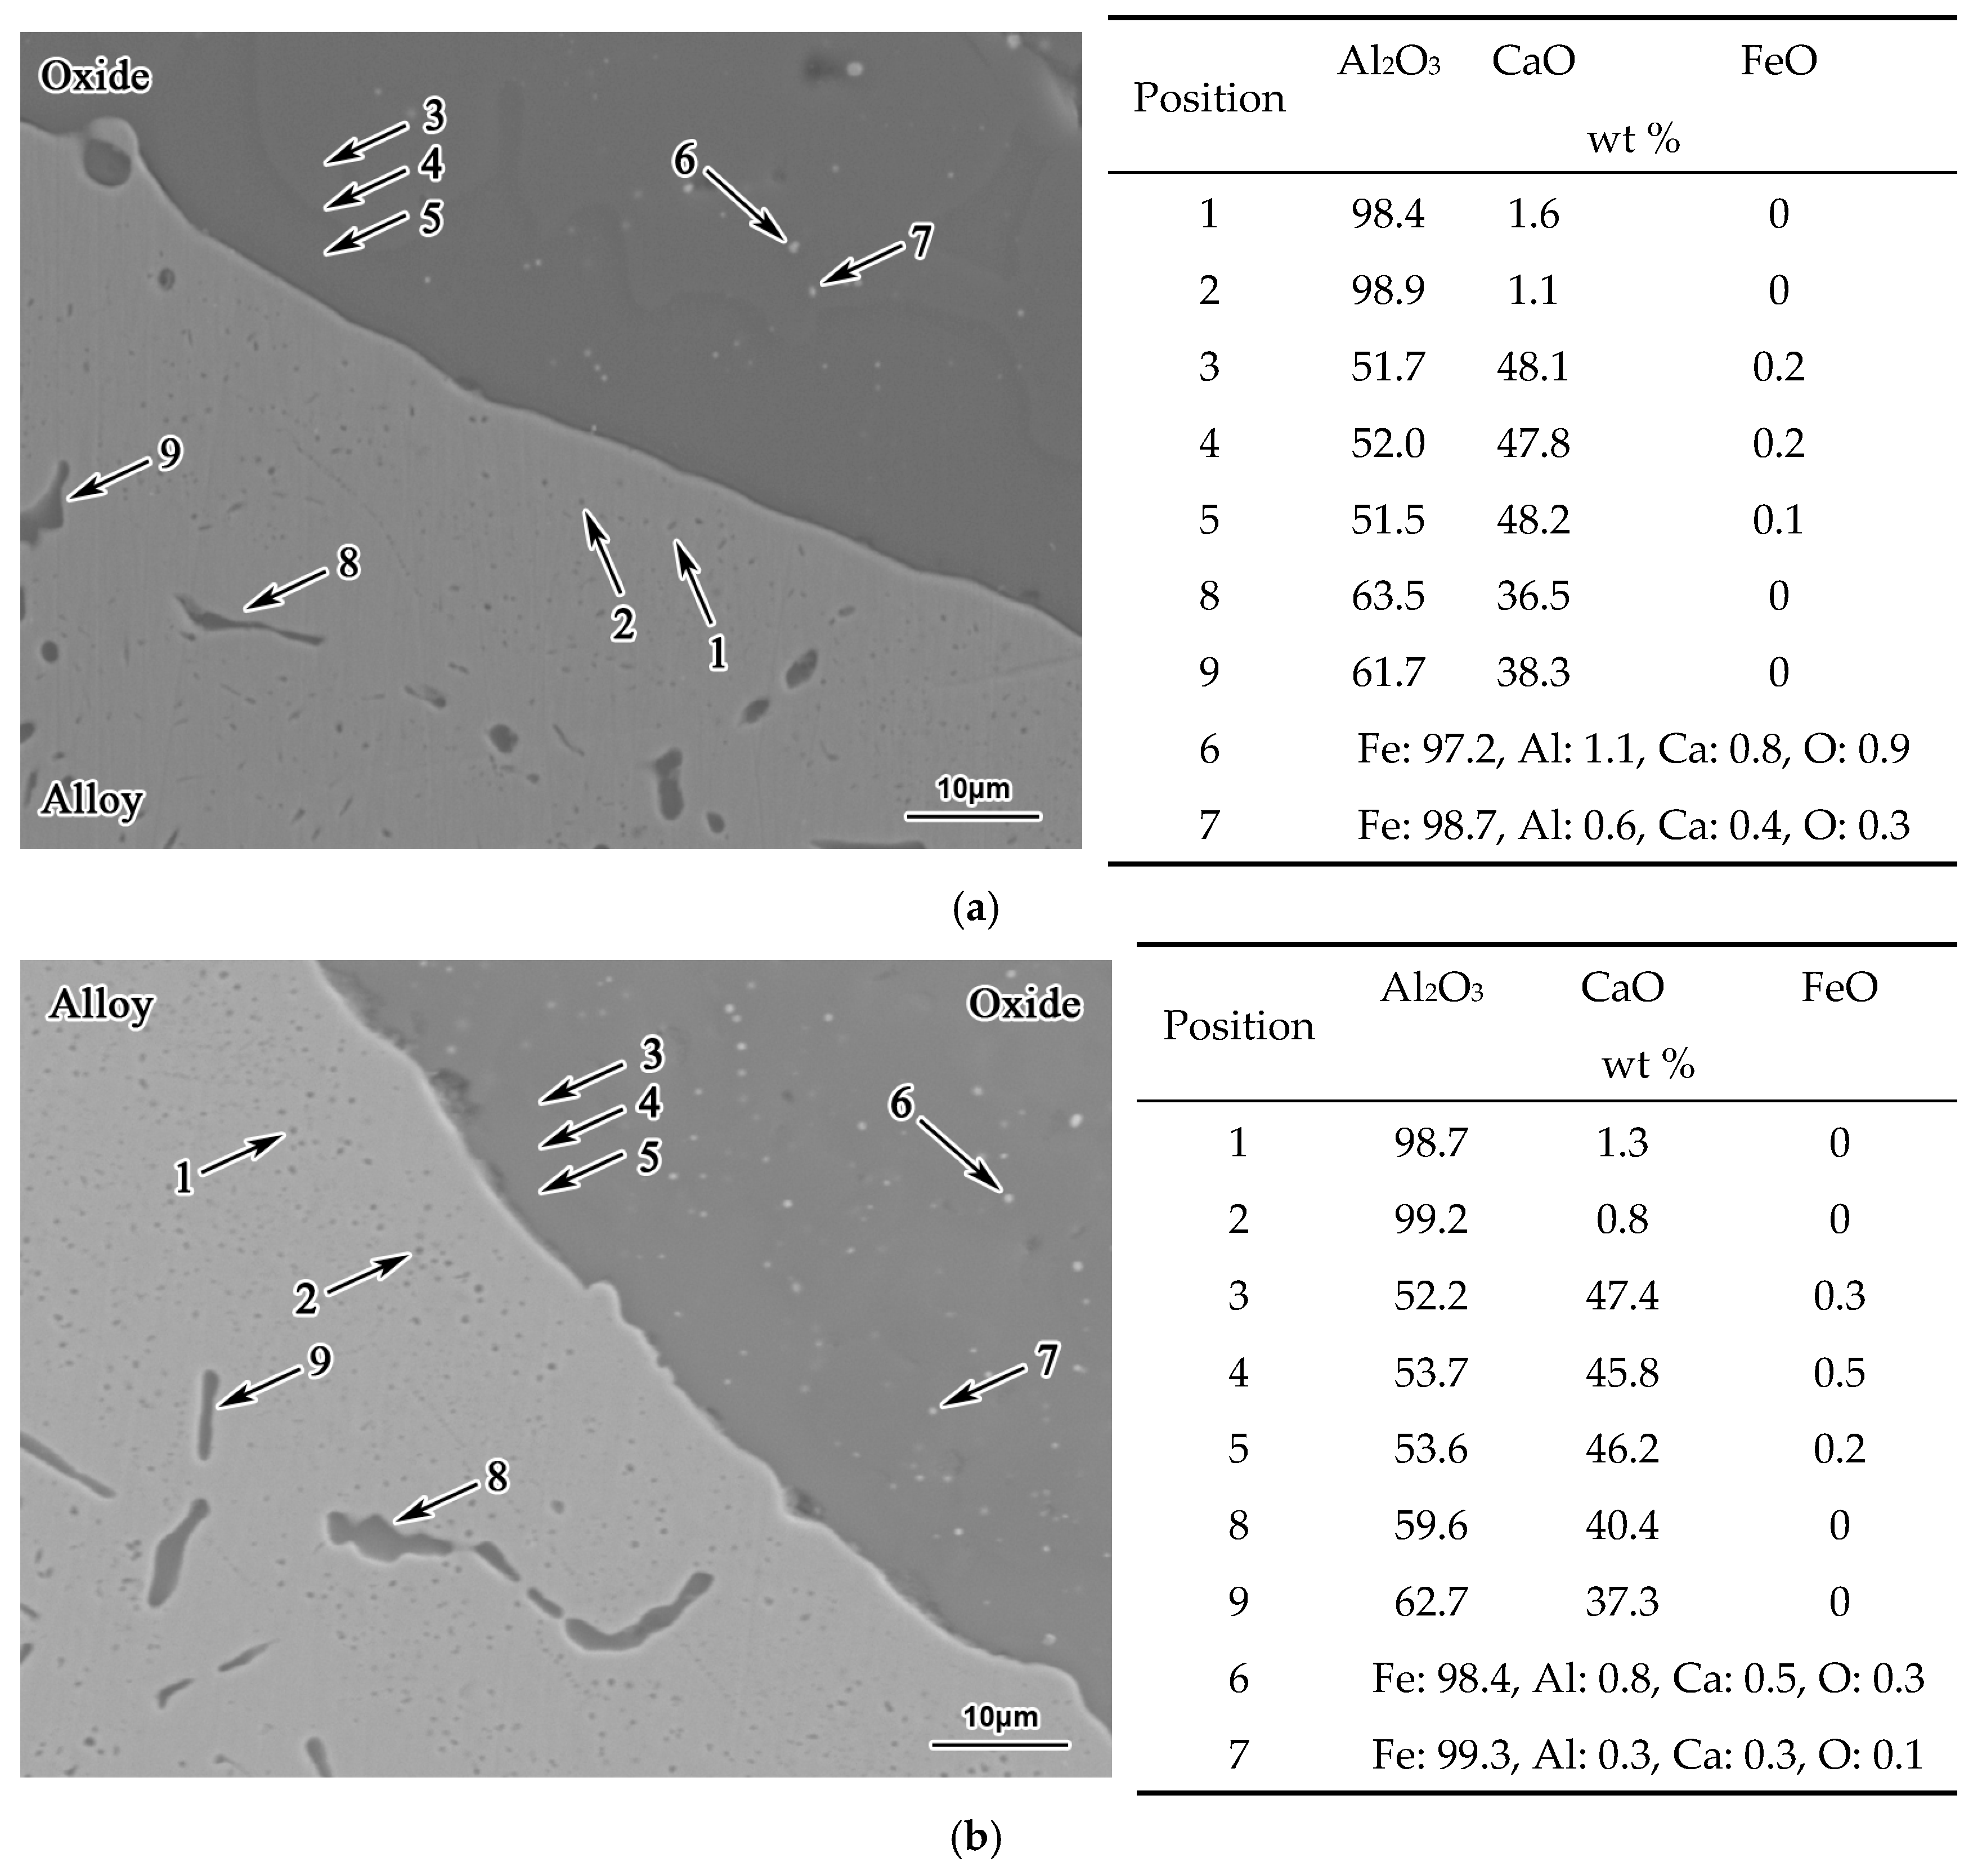
Figure 5 depicts the morphology of the interface between the alloy and oxide in diffusion couples G0, G1, and G2 after heat treatment at 1473 K for 10 h. In the case of G0-10 (Figure 5a), besides Al2O3 particles (points 1 and 2), some branch inclusions also precipitated in the alloy near the alloy–oxide interface. The composition of these branch inclusions was close to CaO·Al2O3 according to EPMA. After heat treatment for 10 h, the white phase in the oxide of G0-0 turned into white metallic particles with Fe content higher than 94 wt % in G0-10 (points 6 and 7 in Figure 5b). Moreover, the composition of the main gray phase was still around 12CaO·7Al2O3 with approximately 0.3 wt % FeO, which decreased a little compared with that in G0-0. For G1-10 and G2-10 with initial FeO concentrations in their oxides of 1.0 and 3.0 wt %, respectively, there was no obvious precipitation of branch inclusions in the alloy near the alloy–oxide interface, except for Al2O3 particles, as shown in Figure 5b,c. The main phase in the oxide was also 12CaO·7Al2O3. In addition, more and larger metallic particles were observed in the oxides of G1-10 and G2-10 than in that of G0-10 because of their higher initial FeO content.
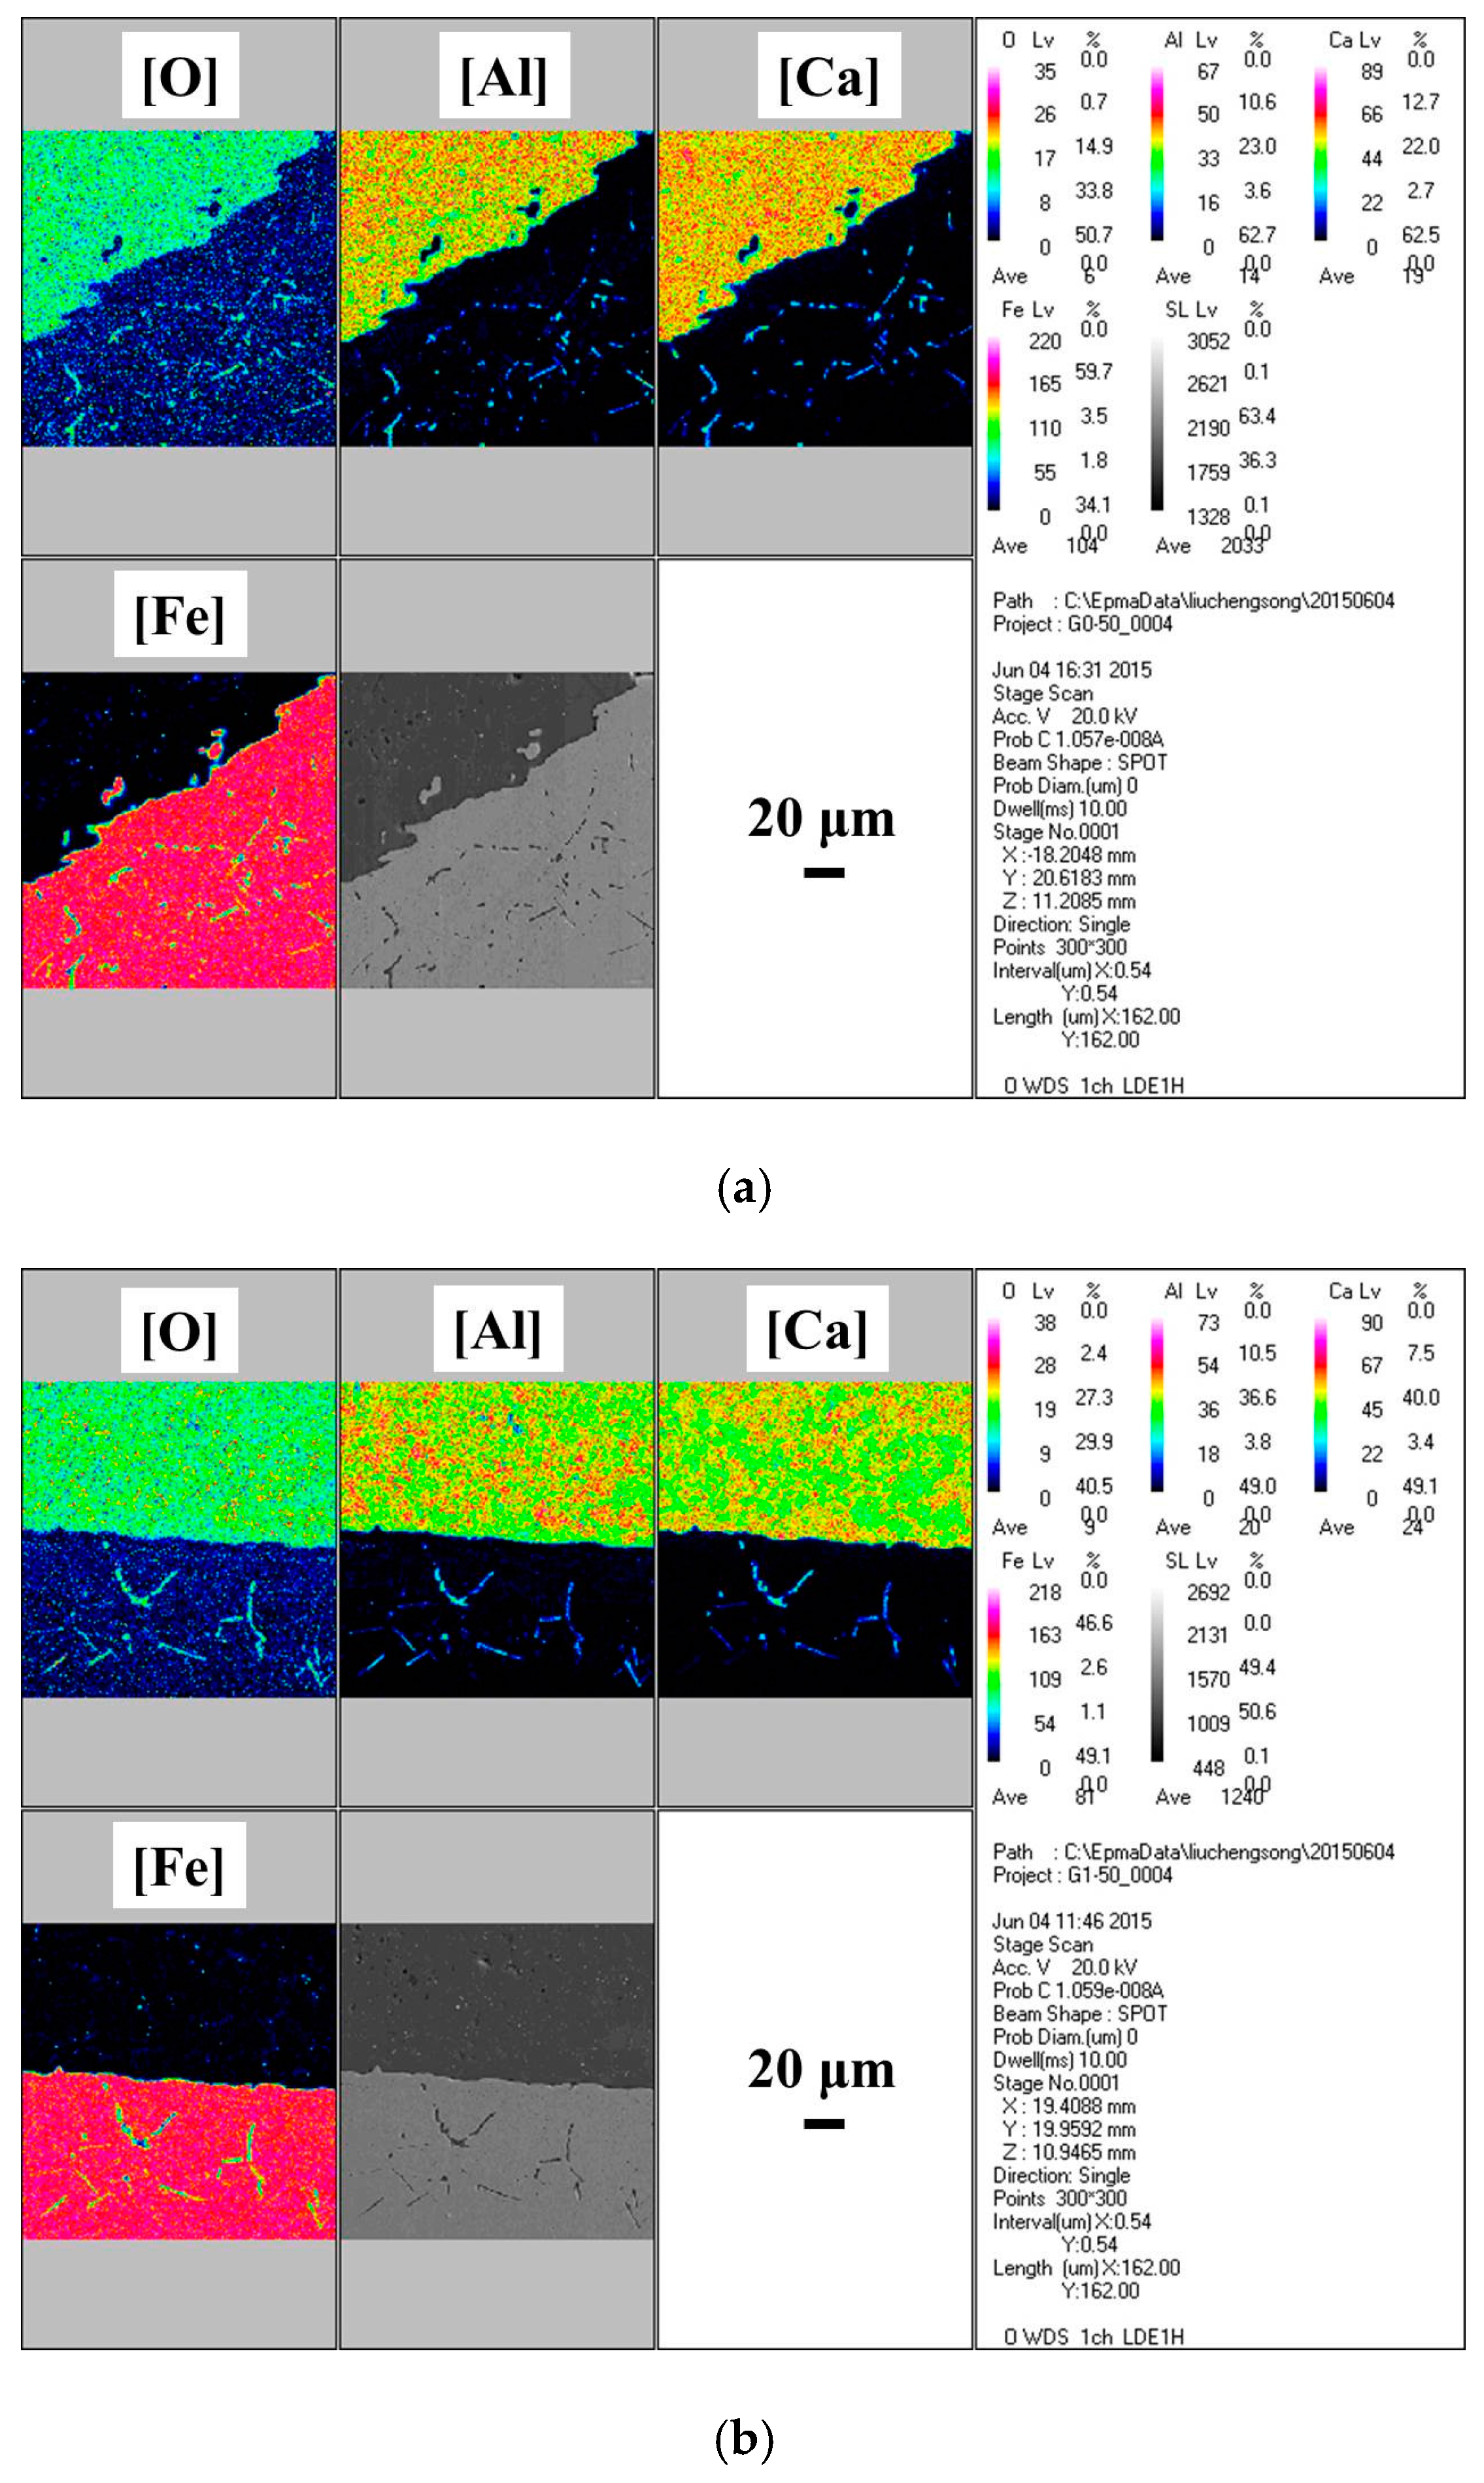
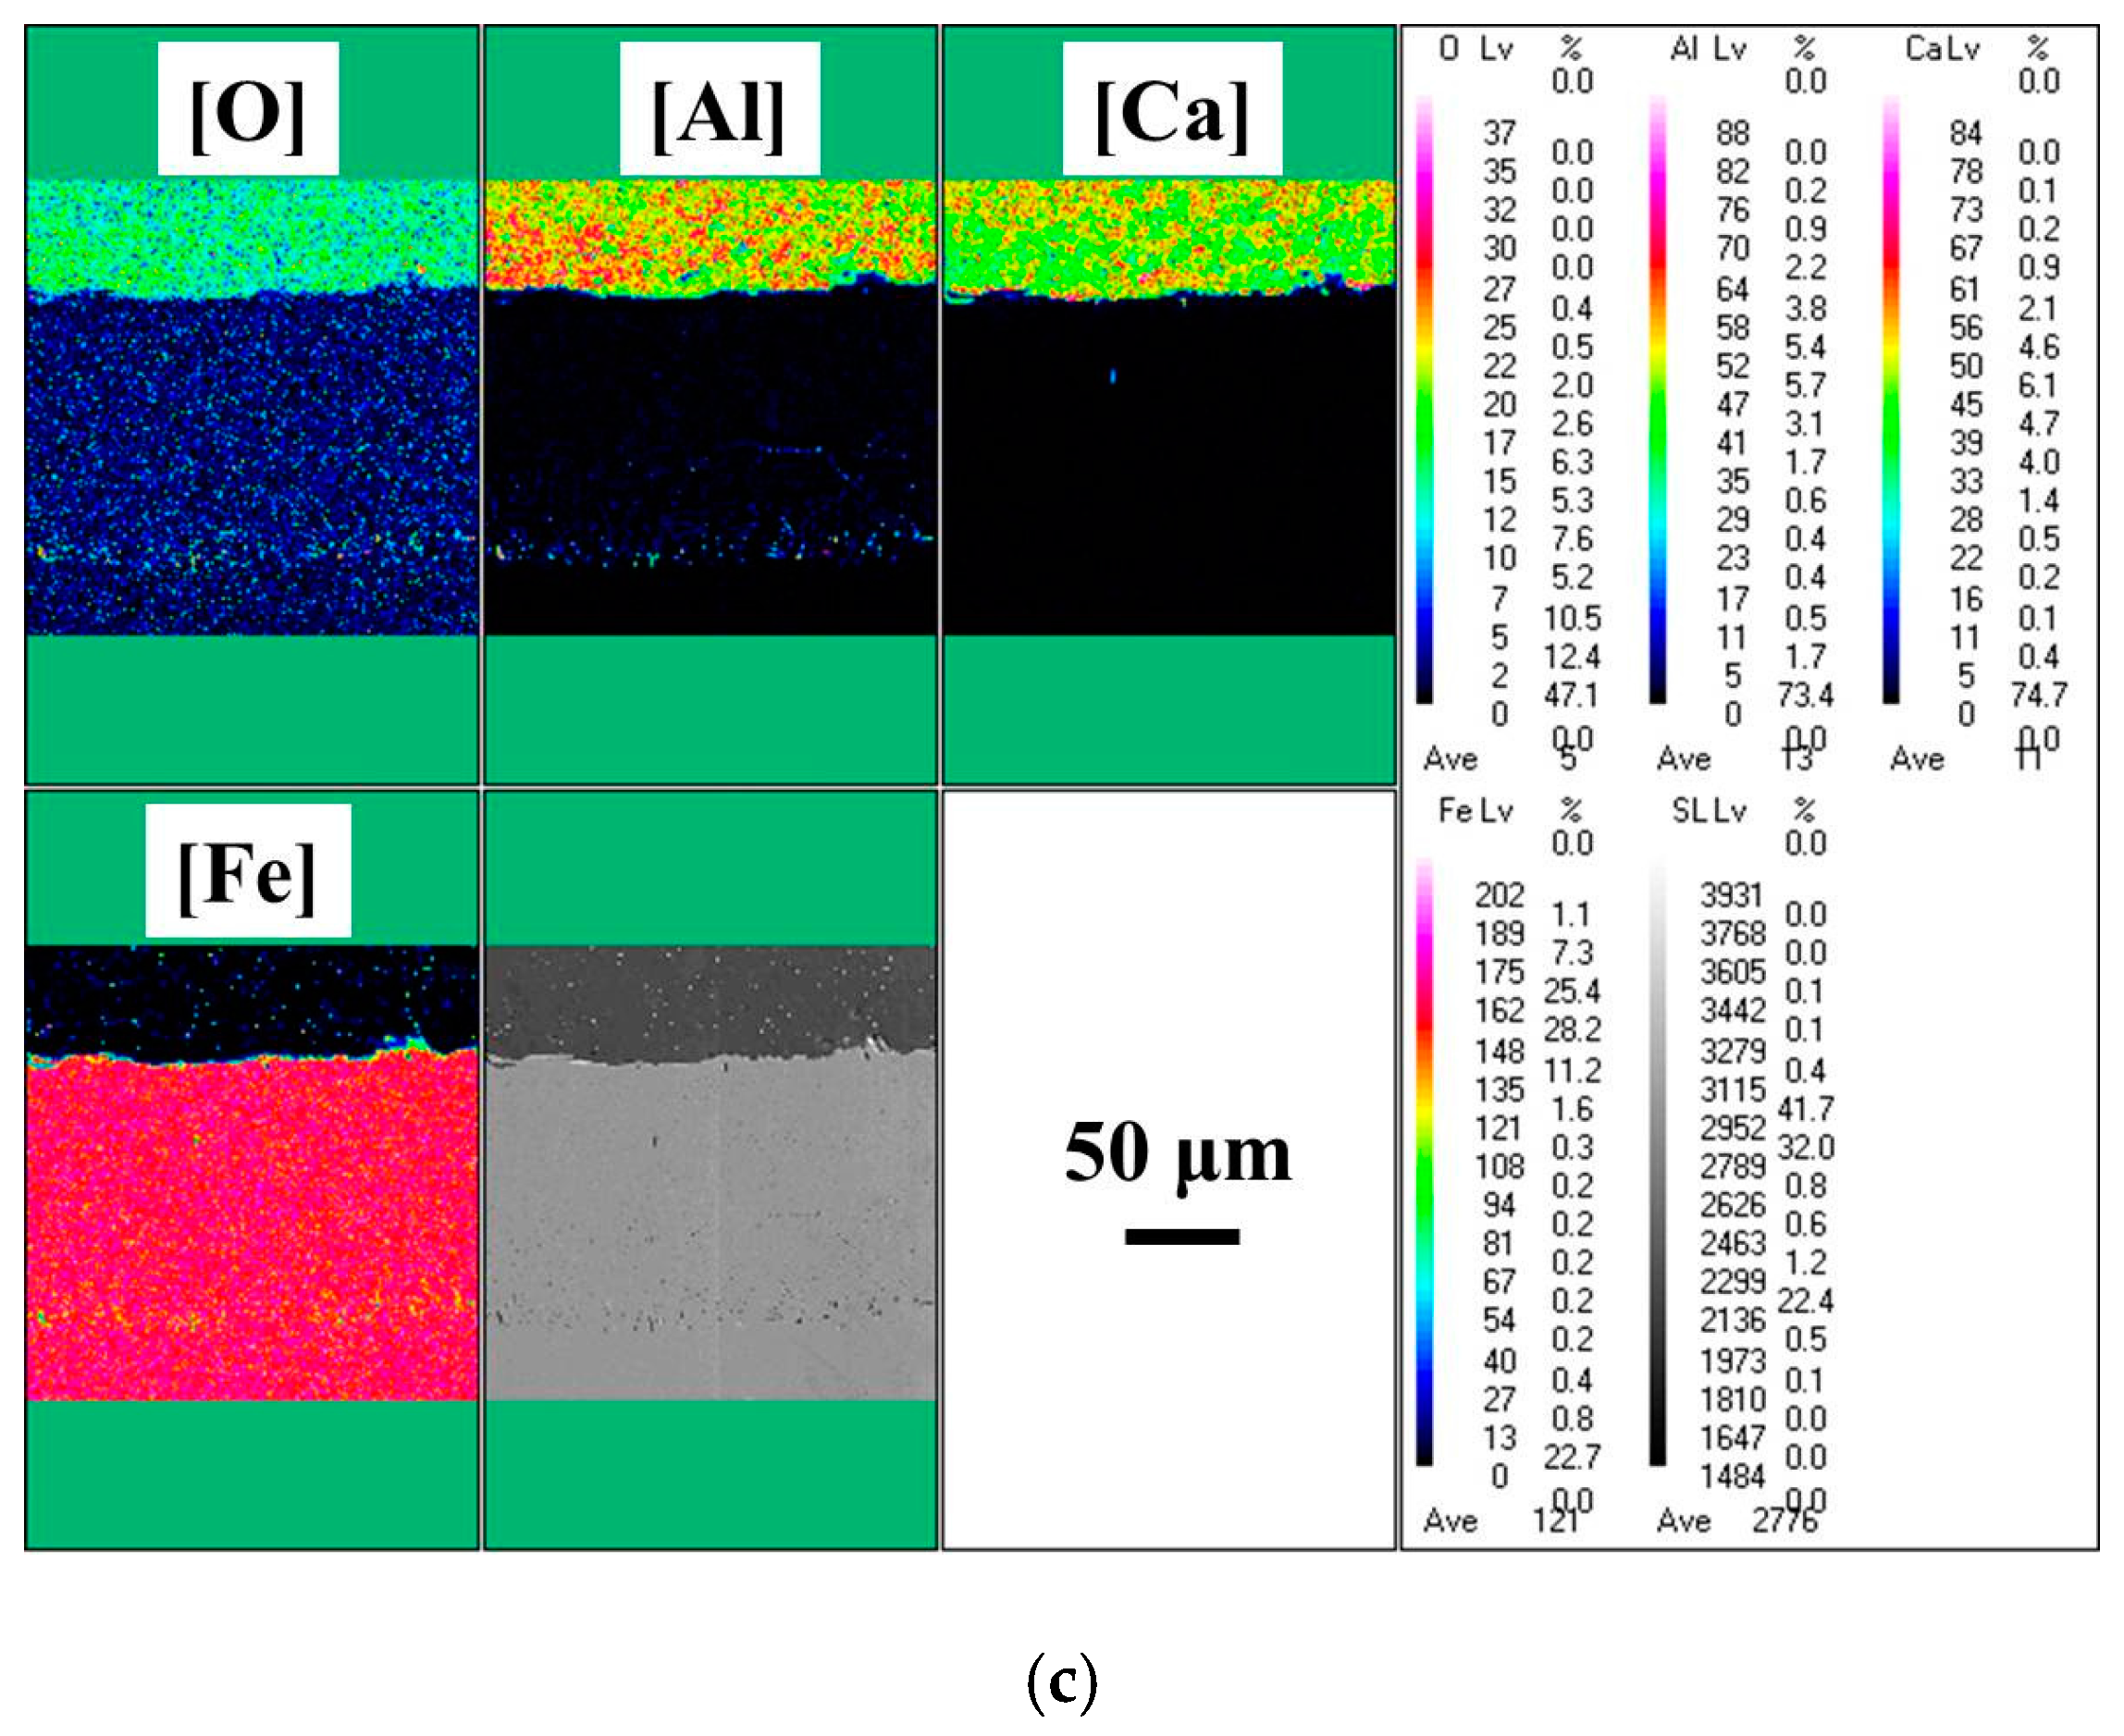
Figure 6 illustrates the morphology of the interface between the alloy and oxide in diffusion couples G0, G1, and G2 after heat treatment at 1473 K for 50 h. EPMA images and measured distributions of O, Fe, Al, and Ca near the interface between the alloy and oxide in diffusion couple G0-50, G1-50, and G2-50 are presented in Figure 7. In the case of G0-50 and G2-50, as shown in Figure 6a,c, respectively, similar experiment results were obtained to those for G0-10 and G2-10, respectively, and FeO concentrations in the oxide decreased to approximately 0.2 and 1.5 wt %, respectively. Figure 7a,c, respectively, reveal that CaO·Al2O3 branch inclusions interwoven with Al2O3 particles precipitated in the PPZ of G0-50 and no CaO·Al2O3 branch inclusions, but just Al2O3 particles precipitated in the PPZ of G2-50. In addition, Figure 7c indicates that the Al2O3 particles precipitating at the end of the PPZ were relatively larger than those located close to the interface between the alloy and oxide. However, in the case of G1-50, as shown in Figure 6b and Figure 7b, the FeO content in the oxide decreased from 0.5 wt % to about 0.3 wt % and some CaO·Al2O3 branch inclusions with Al2O3 particles also precipitated in the alloy near the alloy–oxide interface. It could be inferred that the generation of CaO·Al2O3 branch inclusions in the alloy is strongly related with the FeO content in the oxide, which will be discussed later.
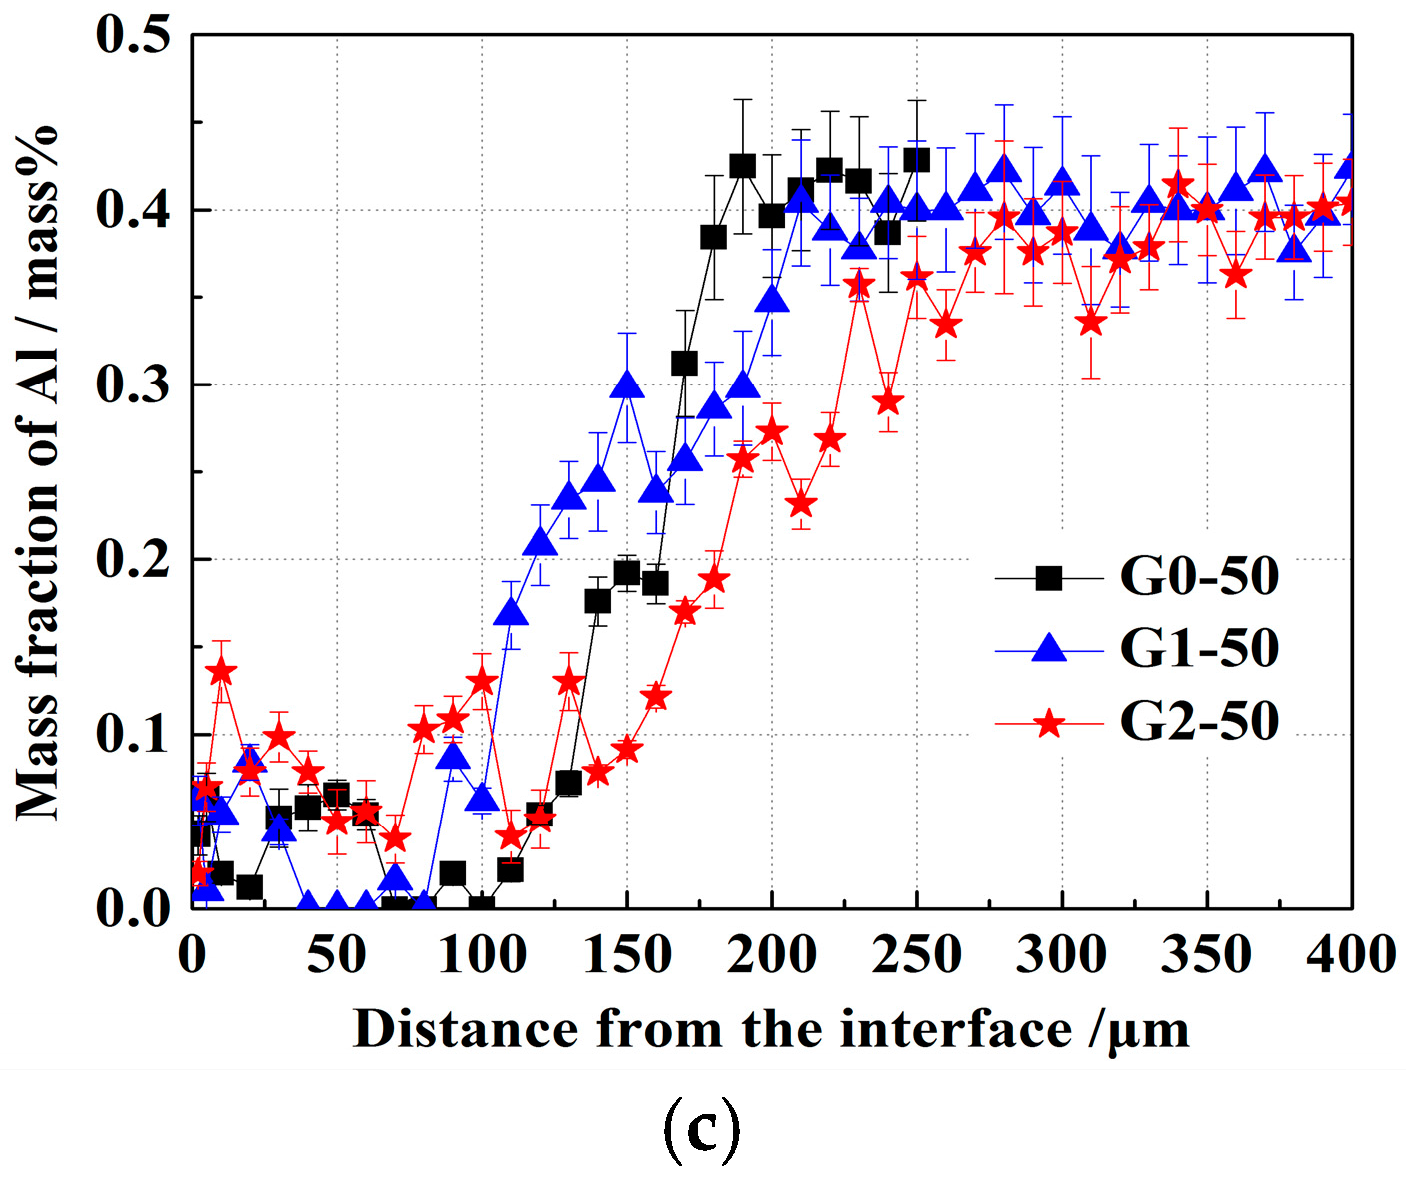
Figure 8 presents the effect of FeO content in the oxide on Al content in the alloy of diffusion couple G0, G1, and G2 before and after heat treatment at 1473 K. In all cases, after heating at 1700 K, because of the slight reaction between the alloy and oxide, the Al content in the alloy close to the alloy–oxide interface decreased to about 0.2 wt %, as shown in Figure 8a. In this study, the region in which the Al content is lower than that in the bulk alloy is also defined as the Al-depleted zone (ADZ). Similarly the region in which the Ca content is higher than that in the bulk alloy is defined as the Ca-accumulated zone (CAZ) [12]. The widths of the ADZ after the oxide pre-melting experiment were 8 μm or less in diffusion couple G0, G1, and G2. As illustrated in Figure 8b, after heat treatment at 1473 K for 10 h, Al concentrations in the alloy of G0, G1, and G2 gradually decreased toward the alloy–oxide interface from an initial value of 0.40 wt % to 0.08, 0.09, and 0.10 wt %, respectively. The ADZ width showed positive correlations with heat treatment time and initial FeO content in the oxide of the diffusion couples. After heat treatment at 1473 K for 50 h, similar influences of heat treatment time and initial FeO content on the Al content in the alloy and ADZ width were confirmed, as shown in Figure 8c. The lowest Al concentrations in the alloy of G0, G1, and G2 were 0, 0, and 0.02 wt %, respectively.
The effect of FeO content in the oxide on Ca content in the alloy of diffusion couples G0, G1, and G2 before and after heat treatment at 1473 K is shown in Figure 9. In diffusion couples G0, G1, and G2, after the oxide pre-melting experiment, Ca concentrations in the alloy near the alloy–oxide interface increased from an initial value of 0.004 wt % to 0.29, 0.22, and 0.26 wt %, respectively. The widths of the CAZ were about 20 μm, as illustrated in Figure 9a. After heat treatment, as indicated in Figure 9b,c, the highest Ca content in the alloy roughly increased with extending heat treatment time and decreasing initial FeO content in the oxide, respectively. For example, as heat treatment time lengthened from 0 to 10 to 50 h, the highest Ca content in the alloy of diffusion couple G1 increased from 0.22 to 0.26 to 0.32 wt %, respectively. After heat treatment for 50 h, as the initial FeO content in the oxide increased from 0.5 wt % (G0) to 1.0 wt % (G1) to 3.0 wt % (G2), the highest Ca content in the alloy increased from 0.22 wt % (G0) to 0.32 wt % (G1) to 0.29 wt % (G2). However, the CAZ width in all cases was rather stable and remained at about 20 μm.
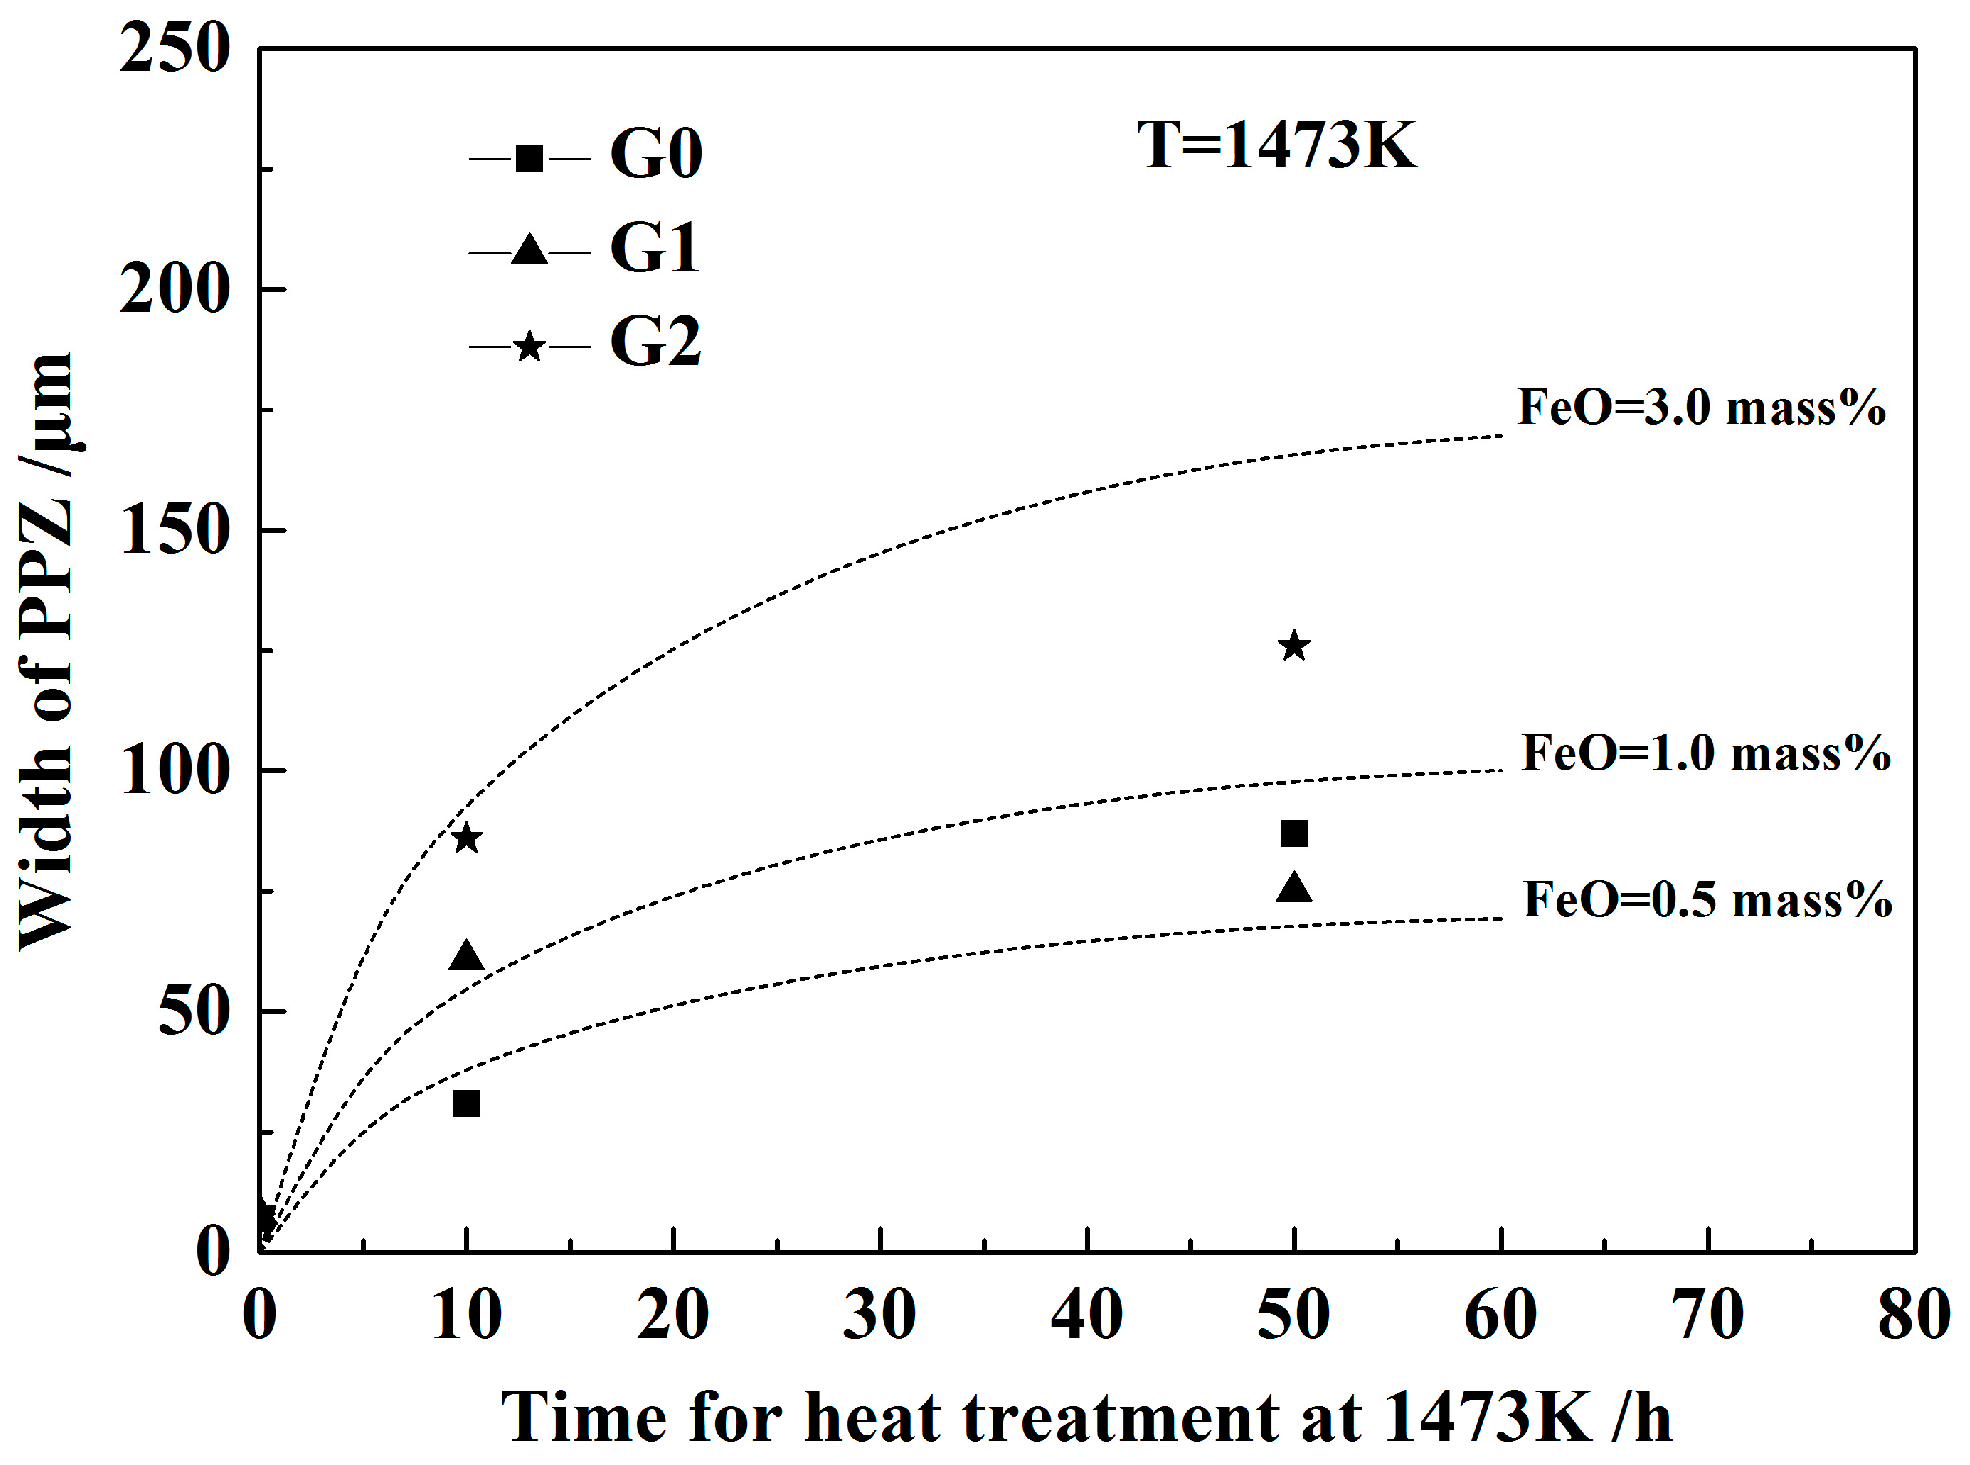
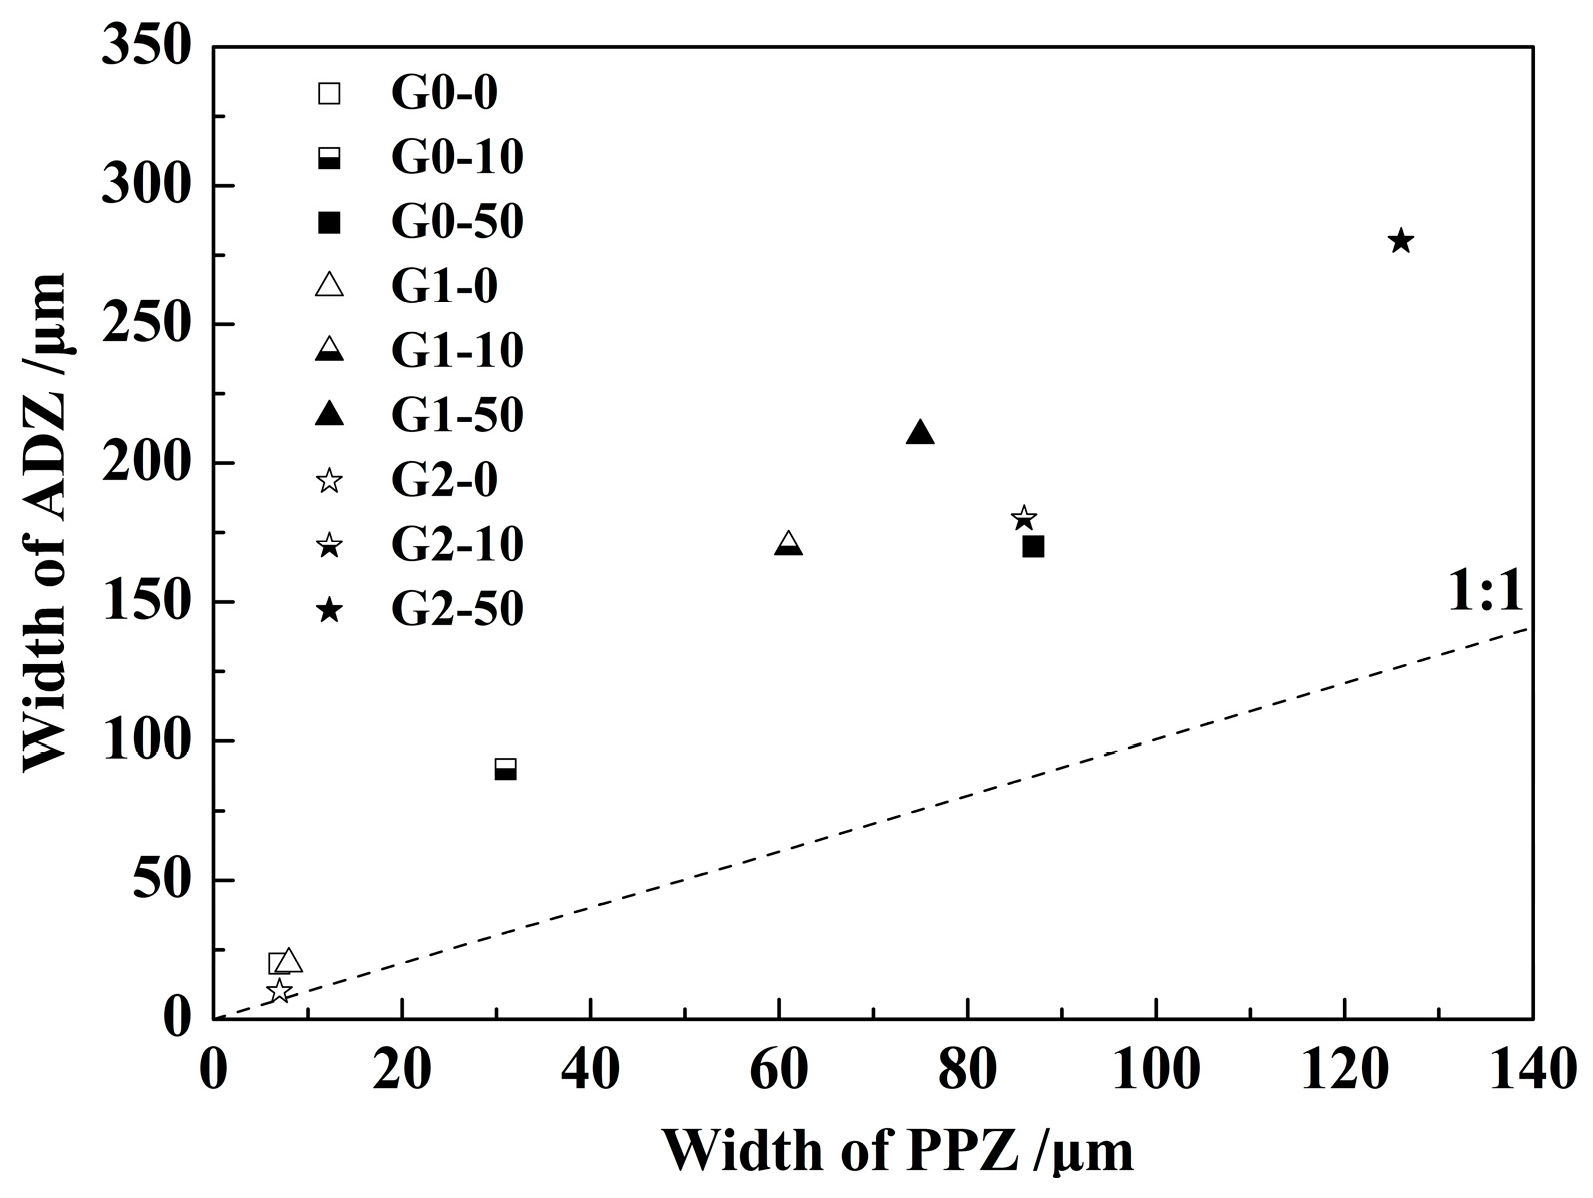
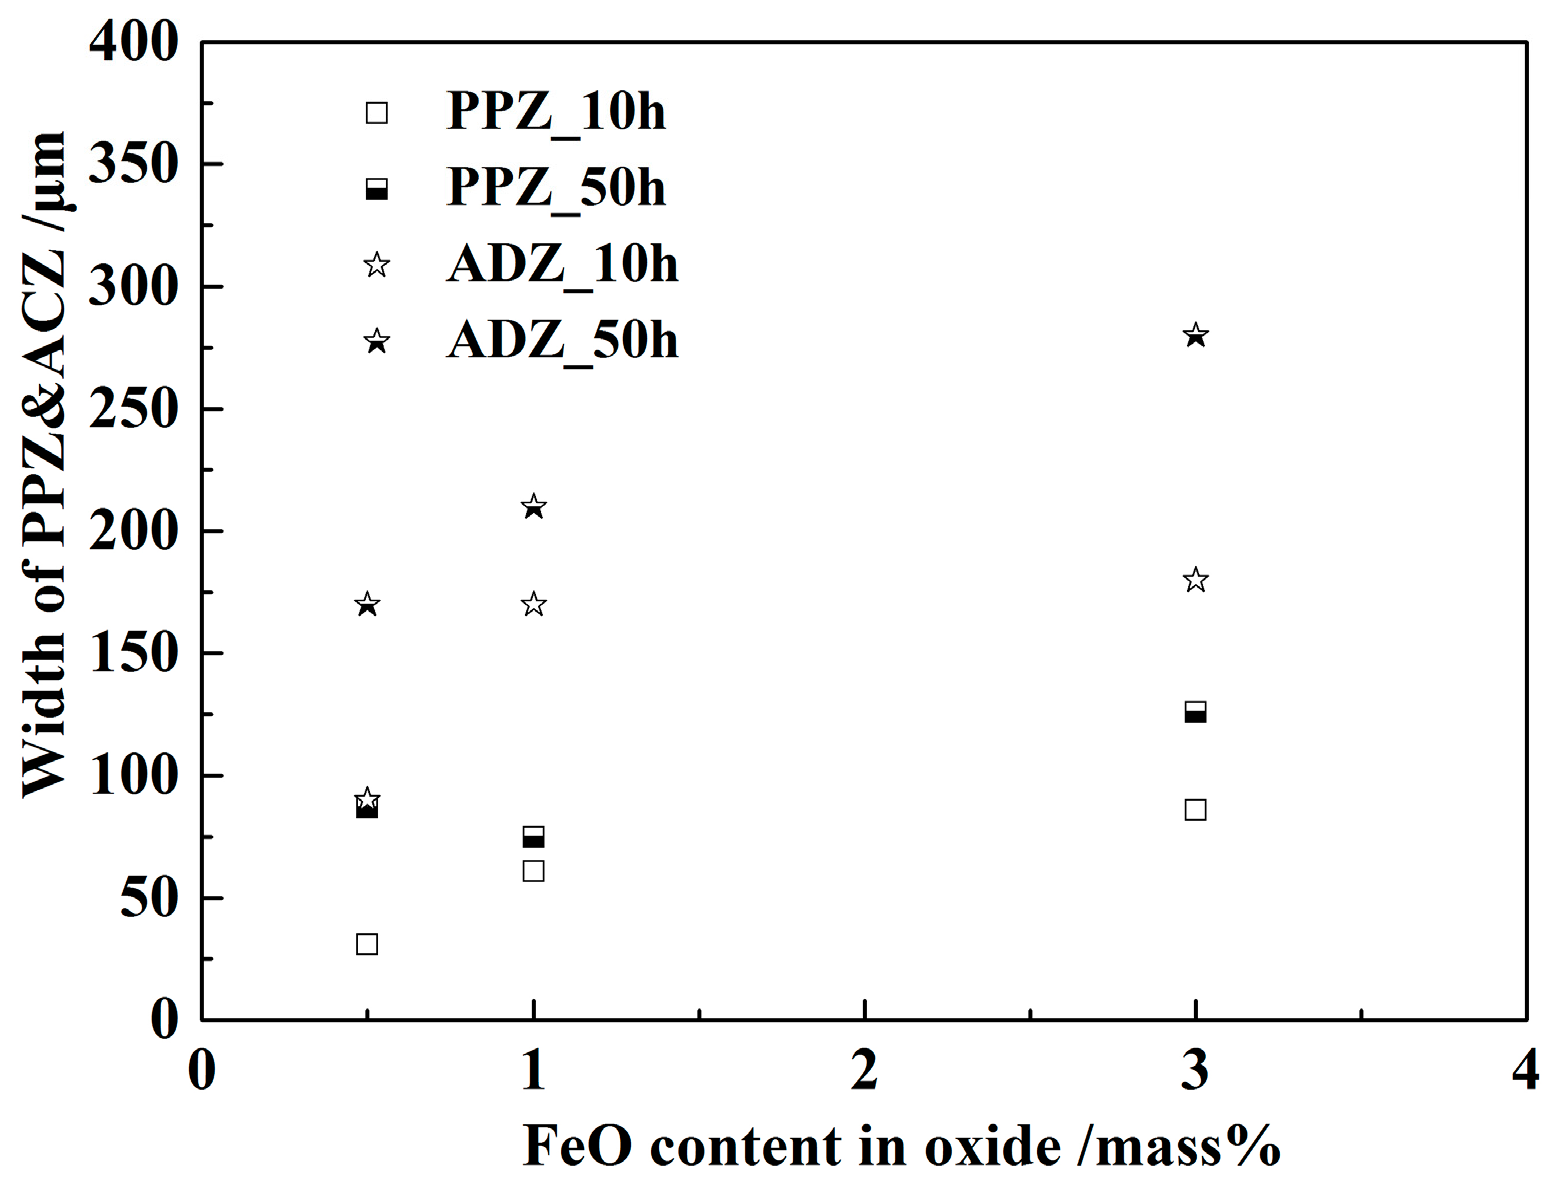
Figure 10 displays the relationship between PPZ and ADZ widths in diffusion couples G0, G1, and G2 before and after heat treatment at 1473 K. There was an approximately linear positive correlation between PPZ and ADZ widths. In all cases, the ADZ width was always larger than the PPZ width. Figure 11 shows the influence of initial FeO content in the oxide on the widths of PPZ and ADZ. As the initial FeO content in the oxide increased, the widths of PPZ and ADZ basically tended to increase, indicating that solid-state reaction at the interface between the alloy and oxide was promoted. For instance, after heat treatment at 1473 K for 10 h, as the FeO content in the oxide increased from 0.5 wt % (G0) to 1.0 wt % (G1) to 3.0 wt % (G2), PPZ width increased from 31 μm (G0-10) to 61 μm (G1-10) to 86 μm (G2-10), and ADZ width increased from 90 μm (G0-10) to 170 μm (G1-10) to 180 μm (G2-10). In addition, for diffusion couple G1, the predominant factor determining PPZ width, was the precipitation of fine Al2O3 particles and CaO·Al2O3 branch inclusions in the alloy of G1-10 and G1-50, respectively, which caused the PPZ width of G1-50 to be narrower than that of G0-50.
The size distributions of the particles in the PPZ of diffusion couples G0, G1, and G2 before and after heat treatment at 1473 K are depicted in Figure 12. In this study, the sizes of branch inclusions that precipitated in the alloy near the alloy–oxide interface were converted into equivalent diameters according to their areas determined by EPMA. The Al2O3 particles were assumed to be spherical. As shown in Figure 12a, after the oxide pre-melting experiment, only particles smaller than 1.0 μm precipitated in the PPZ of diffusion couple G0-0, G1-0, and G2-0; the numbers of particles per 2500 μm2 were similar for these couples. Figure 12b,c indicate that after heat treatment for 10 h, the number of particles smaller than 0.5 μm per 2500 μm2 increased compared with that before heat treatment in all cases and increased further after heat treatment for 50 h. The number of particles smaller than 1.0 μm also increased with the initial FeO content in the oxide. In addition, comparison of the larger particles (>1.0 μm) in diffusion couple G1-10, G0-50, and G1-50 revealed that the number (and size) of branch inclusions also showed positive and negative correlations with heat treatment time and initial FeO content in the oxide, respectively.
4. Discussion
4.1. Influence Mechanism of FeO on the Solid-State Reaction
Our results suggest that when the initial FeO content in the oxide was relatively high, such as that in diffusion couple G2, at first, the dominant solid-state reaction occurred between elemental Al in the alloy and excess oxygen that was generated by the decomposition of FeO in the oxide and diffused to the alloy. Reaction products were small Al2O3 particles that precipitated in the alloy near the alloy–oxide interface. That is defined as I-type reaction as shown in Equation (1):
O(oxide) + Al(alloy) = (Al2O3)(Particle).
It was reported [14] that, in the period of secondary refining, decomposition of CaO in the steel slag with high basicity would occur at the molten steel/slag interface. Excess [Ca] diffused into the molten steel and reacted with Al2O3 inclusions to form calcium aluminate, which was defined as another approach of calcium treatment. In this study, CaO concentrations in the Al2O3–CaO–FeO oxides were higher than 45 wt %. Similar decomposition of CaO was induced by the heat treatment at 1473 K for 10 h and 50 h. Diffusion of elemental Ca caused the increase of Ca content in the Fe–Al–Ca alloy near the interface. That is defined as II-type reaction, which can be expressed by Equations (2)–(4):
CaO(oxide) = Ca(oxide) + O(oxide)
Ca(oxide) + O(oxide) → Ca(alloy) + O(alloy)
Ca(alloy) + O(alloy) + Al(alloy) = (CaO·Al2O3)(branch).
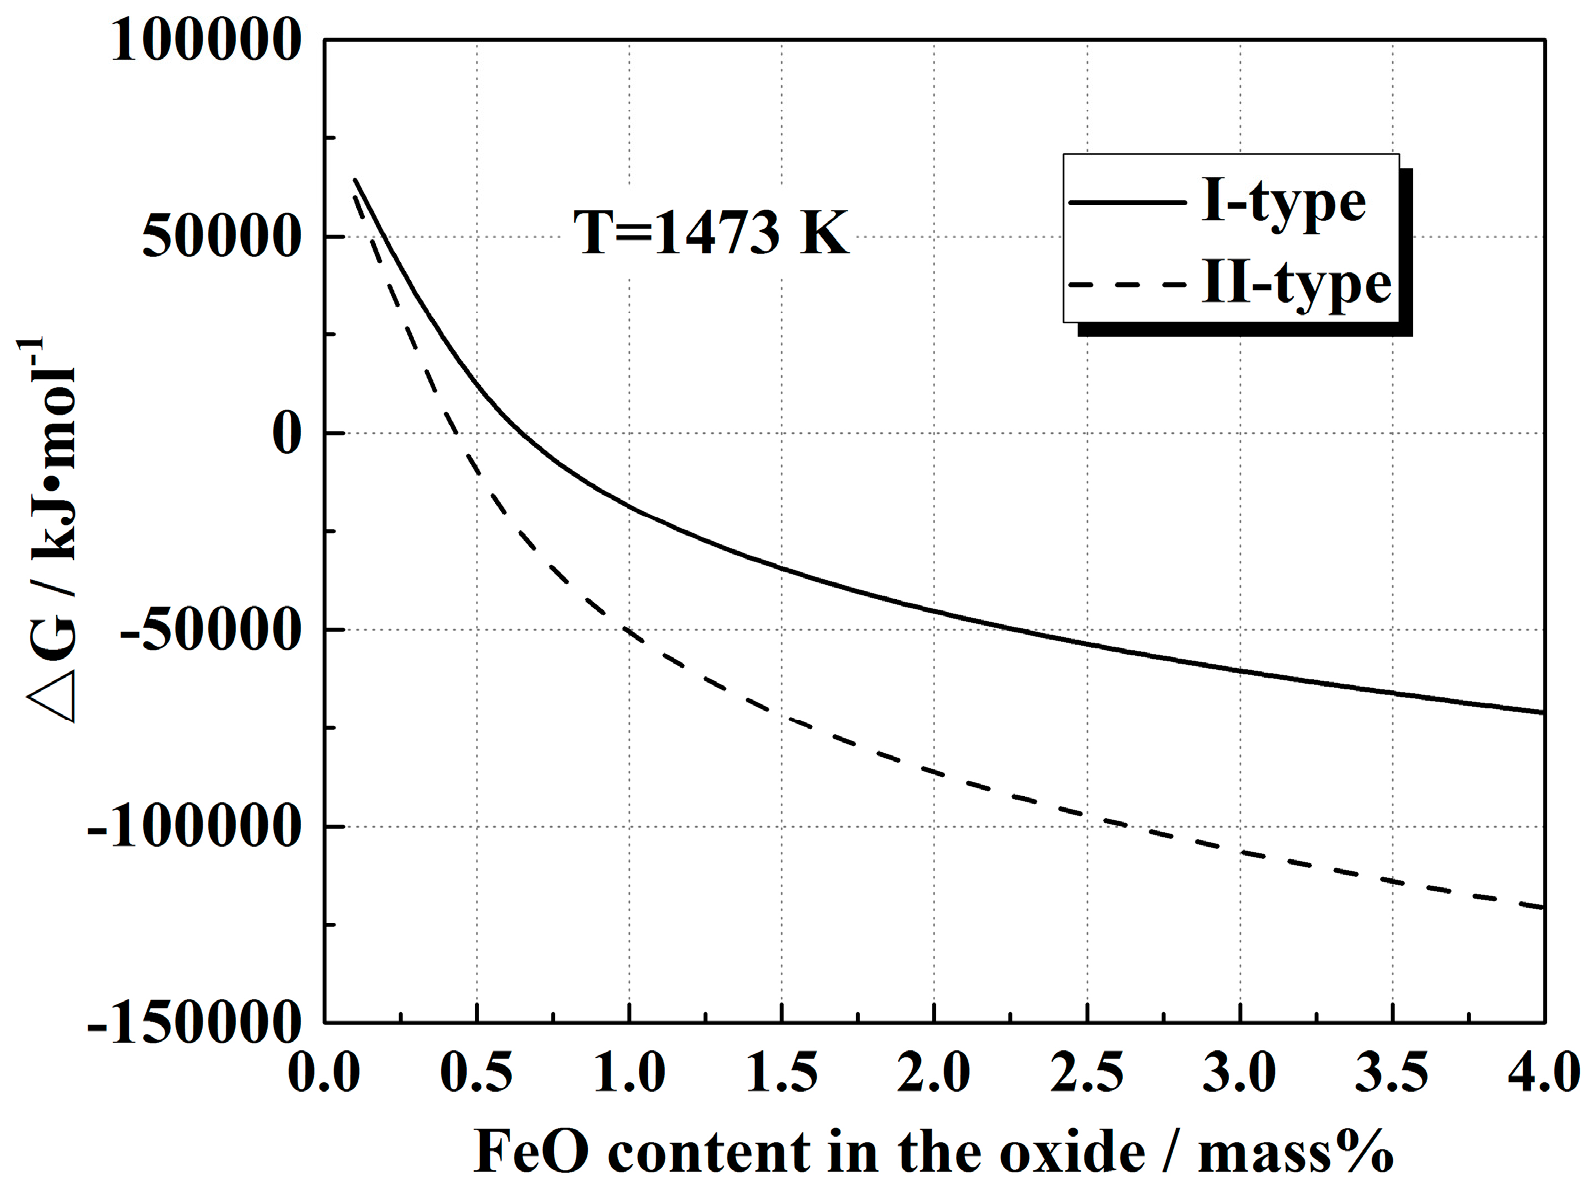
In this experiment, during the heat treatment process, the FeO content in the oxide gradually decreased and an I-type reaction between Al and O elements was suppressed because of the decrease of oxygen diffusion from the oxide to the alloy. Thus, the II-type reaction between the 12CaO·7Al2O3 phase and elemental Al became dominant. In addition to the precipitation of CaO·Al2O3 branch inclusions in the alloy near the alloy–oxide interface, Al and Ca concentrations in the alloy further decreased and increased, respectively, in the II-type reaction. I-type and II-type reactions were also estimated by thermodynamic calculations using Equations (5)–(8) [15,16]. Figure 13 shows the effect of original FeO content in the oxide on the Gibbs energy change of the I-type and II-type reactions during heat treatment at 1473 K. In this calculation, Al and Ca concentrations were assumed to be constant which were 0.4 wt % and 0.004 wt %, respectively, as shown in Table 1. The activity coefficients of Al, Ca, Al2O3 and CaO·Al2O3 were assumed to be unity. It could be inferred that, generally, both of the two reactions could spontaneously occur at the temperature of 1473 K, although these equations are not adequate to be extrapolated to this temperature. With the increase of original FeO content in the oxide from 0.5 wt % to 4.0 wt %, the Gibbs energy of I-type and II-type reactions become negative and show the downtrend. However, the II-type reaction was also restricted to the diffusion of elemental Ca from the oxide to alloy, the generation of Al2O3 particles, and the reaction interface between CaO and Al2O3, etc., although its Gibbs energy was lower than that of the I-type reaction. These limited dynamic conditions resulted in the II-type reaction being inhibited at the beginning of heat treatment.
Al2O3(s) = 2[Al] + 3[O], logK1 = −47,400/T + 12.32
CaO(s) = [Ca] + [O], logK2 = −7220/T − 3.29
CaO(s) + Al2O3(s) = CaO·Al2O3, △G0f = −17,910 − 17.38T
2[Al] + [Ca] + 4[O] = CaO·Al2O3, △G0f = −1,063,538 + 155.49T
Figure 14 exhibits the solid-state reaction mechanism of the alloy and oxide in diffusion couples G0, G1, and G2. The II-type reaction occurred after sufficient I-type reaction between the Fe–Al–Ca alloy and Al2O3–CaO–FeO oxide. Figure 5a–c and Figure 6a–c show that CaO·Al2O3 branch inclusions gradually disappeared after heat treatment as the initial FeO content in the oxide increased. It was inferred that the higher relative oxygen diffusion with increasing FeO content suppressed the II-type reaction. Elemental Al in the alloy reacted with elemental O prior to the formation of CaO·Al2O3.
4.2. Modified Dynamic Calculation Model
Therefore, the PPZ width was mainly determined by the I-type reaction during the early stage of heat treatment, similar to internal oxidation in steel [17]. A rough dynamic calculation model for estimating PPZ width has been modified and proposed based on Wagner theoretical equation for calculating subscale layer thickness around surface cracks of steel products [18], as shown in Equations (9)–(11). The counter-diffusion of elemental Al in the Fe–Al–Ca alloy has also been taken into account.
where
and
ξ = [2NO × DO × F(z) × t/(ν × NB)]1/2
F(z) = π1/2 × exp(z2) × erfc(z)
z = ξ/[2(DB × t)1/2]
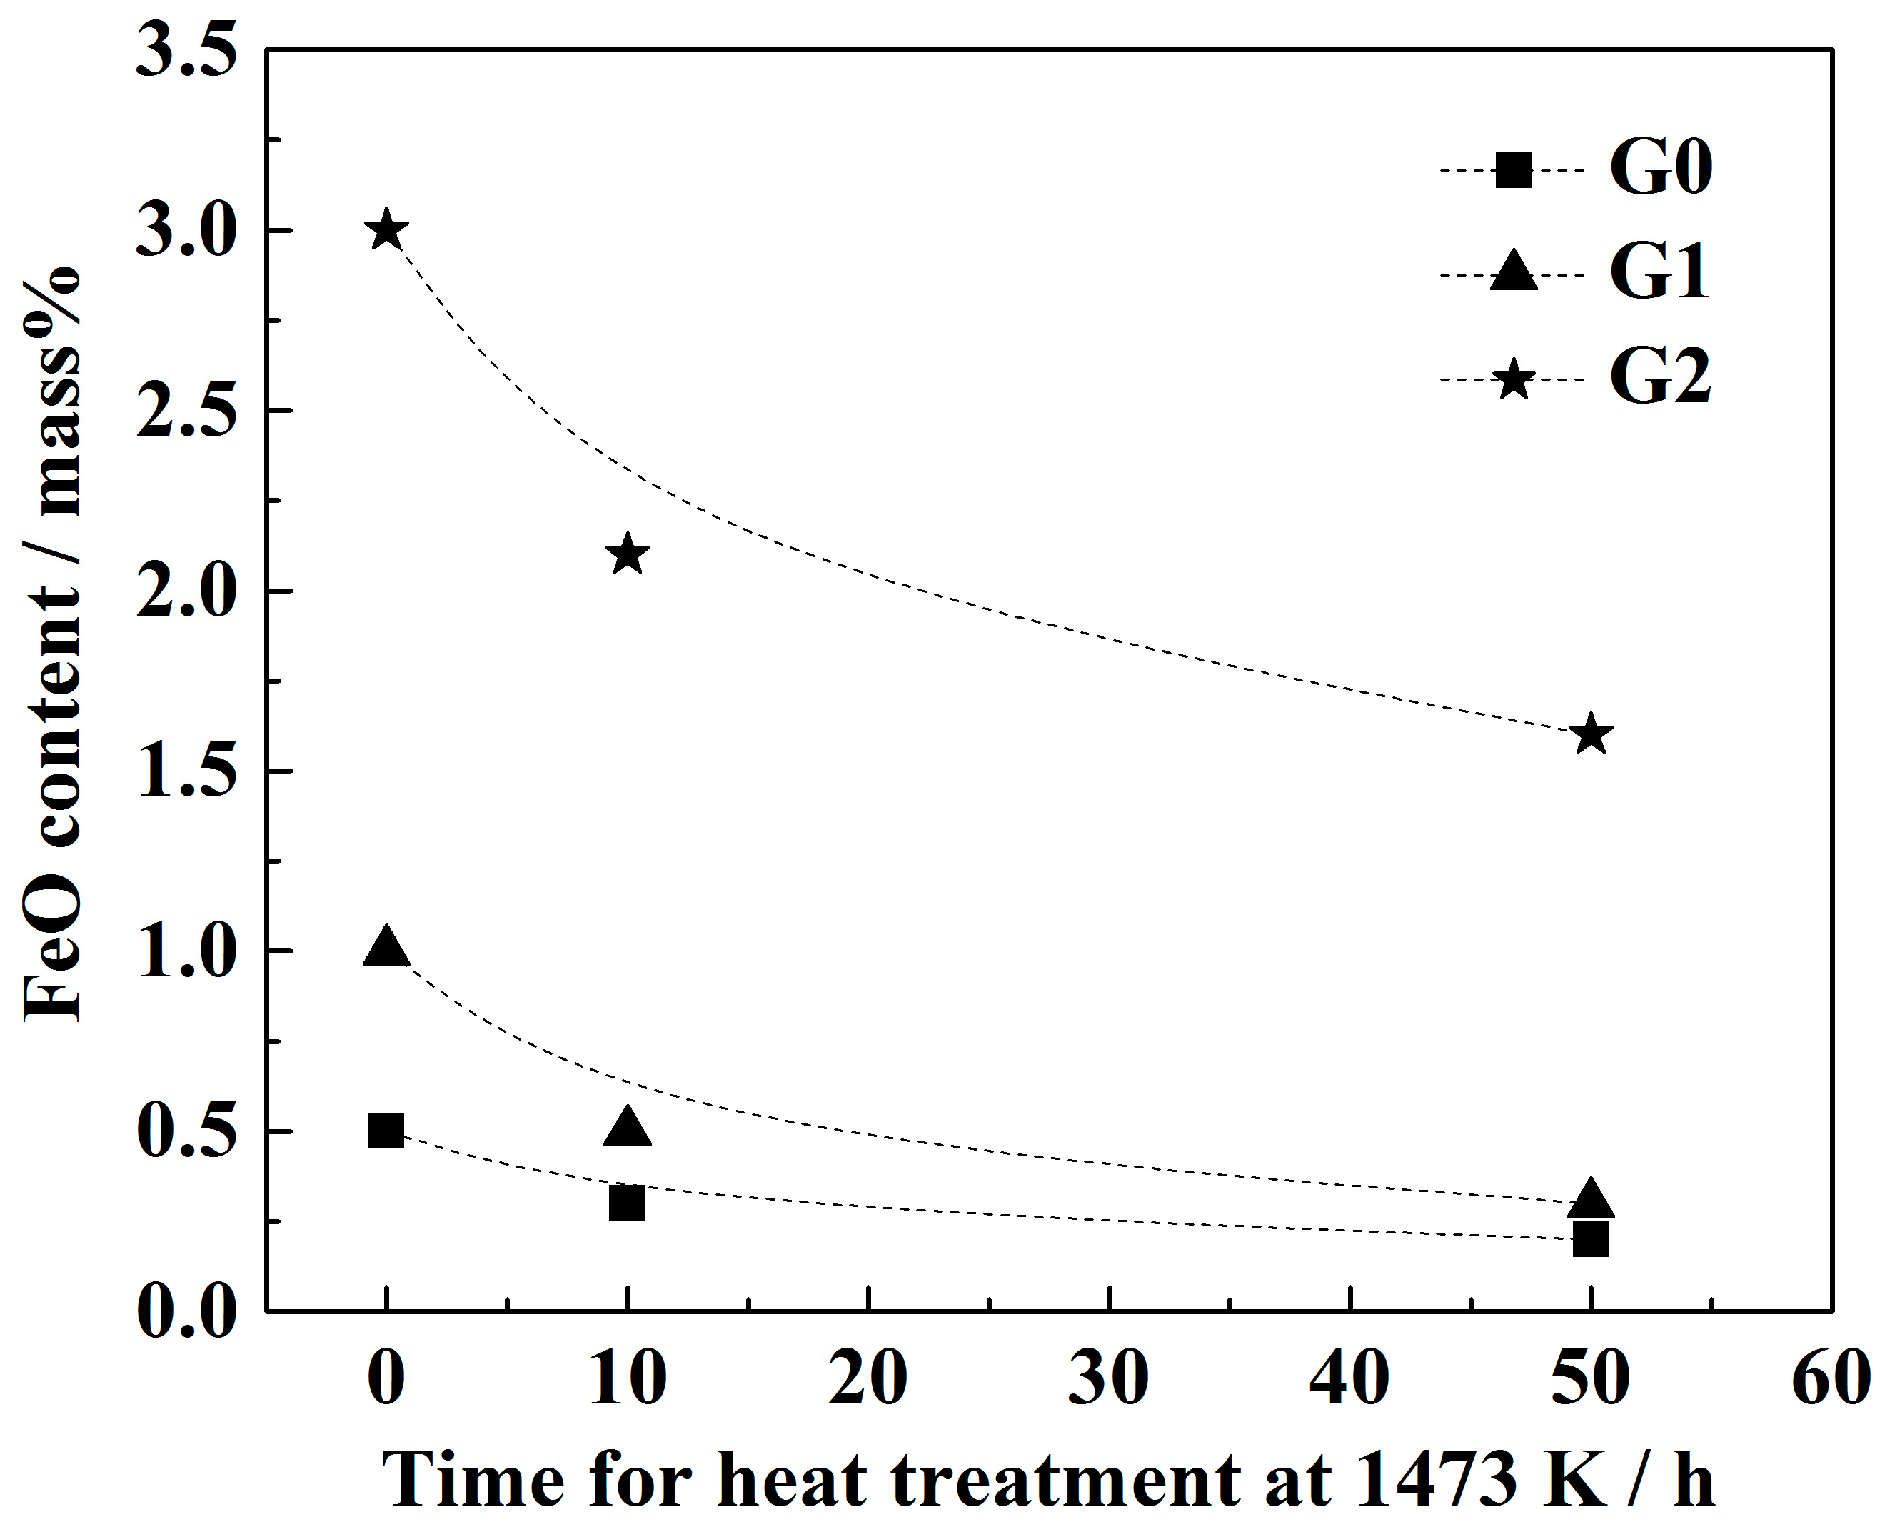
In these equations, ξ indicates the depth of the internal oxidation zone; NO indicates mole fraction of oxygen in the alloy; DO represents the diffusivity of oxygen in the alloy which was calculated using Equation (12) for γ-iron at each temperature [19]; ν represents the number of oxygen atoms per A atom in AOx oxide; NB is the mole fraction of the solute element in the alloy; DB is the diffusion coefficient of the solute element in the alloy; t is reaction time. In this study, NO was determined by the FeO content in the oxide near the alloy–oxide interface during heat treatment. Therefore, according to our experimental results, NO varied with heat treatment time, as shown in Figure 15. With lengthening heat treatment time, the FeO content in the oxide gradually decreased. The activity coefficient of FeO was obtained using Equation (13) [20]. NO was calculated using Equations (14) and (15). ν was calculated by assuming that only pure Al2O3 particles were generated without considering the precipitation of CaO·Al2O3 branch inclusions. NB was calculated from the composition of the alloy used in this experiment, which was 0.00824. DB was calculated according to the method proposed by Madelung [21].
logDO = −8820/T + 0.76
2Fe(l) + O2(g) = 2FeO(l), ΔG0f = −465,400 + 90.31T
O2(g) = 2[O], ΔG° = −23,404 − 5.77T
Figure 16 presents the change of the PPZ width with heat treatment time and initial FeO content in diffusion couples G0, G1, and G2 before and after heat treatment for the experiment and calculation model. After the oxide pre-melting experiment and heat treatment for 10 h, the observed PPZ widths in all cases showed good agreement with the results calculated by the dynamic model. Since the duration of the reaction between the alloy and oxide at 1700 K was very short and the PPZ widths in all cases were no more than 10 μm, in the calculation model, the reaction time and PPZ width after heating at 1700 K were assumed to be 0 s and 0 μm, respectively. During heat treatment at 1473 K for 10 h, the I-type reaction between elemental Al in the alloy and excess oxygen played a dominant role in determining the PPZ width. However, as the heat treatment time extended to 50 h, the I-type reaction was limited by the decrease of FeO content in the oxide and the II-type reaction in diffusion couples G0 and G1 gradually became dominant. As a result, more CaO·Al2O3 branch inclusions appeared in the alloy as the heat treatment time lengthened. Although the decrease of FeO content in the oxide during heat treatment as shown in Figure 15 has already been included in the model, deviation between the calculated and experimental results still existed. Moreover, for the diffusion couple G2-50, because of the decrease of FeO content in the oxide during heat treatment, measured PPZ width was relatively lower than the line for 3 wt % FeO. However, this dynamic model to calculate PPZ width still contributed to understanding the influence of FeO on solid-state reactions between Fe–Al–Ca alloy and Al2O3–CaO–FeO oxide to some extent.
5. Conclusions
Three diffusion couples with different FeO concentrations in the oxide were produced. The influence of FeO on the solid-state reactions between Al2O3–CaO–FeO oxide and Fe–Al–Ca alloy during heat treatment at 1473 K was clarified. The following conclusions can be drawn based on the experimental results of this study.
- With the same heat treatment time at 1473 K, when the initial FeO content in the oxide was relatively low, fine Al2O3 particles and CaO·Al2O3 branch inclusions precipitated in the alloy near the alloy–oxide interface. With increasing initial FeO content in the oxide, in the PPZ where Al2O3 particles formed, CaO·Al2O3 branch inclusions gradually disappeared.
- Due to the two types of solid-state reactions and element diffusion between the alloy and oxide, Al and Ca concentrations in the alloy near the alloy–oxide interface tended to decrease and increase, respectively. An approximately linear positive correlation was confirmed between the PPZ and ADZ widths, both of which increased with the initial FeO content in the oxide.
- The I-type reaction between elemental Al in the alloy and oxygen generated by the decomposition of FeO in the oxide played a dominant role in the early stage of heat treatment in all cases. As the heat treatment time lengthened and initial FeO content in the oxide decreased, the II-type reaction between the 12CaO·7Al2O3 phase and elemental Al gradually became important.
- When the heat treatment time was relatively short, good agreement was obtained between the measured results of the PPZ width and the results calculated using a modified dynamic calculation model established based on the Wagner equation, which contributed to understanding the influence of FeO on the solid-state reactions between Fe–Al–Ca alloy and Al2O3–CaO–FeO oxide.
Acknowledgments
This work was supported by the National Natural Science Foundation of China (Nos. 51604201 and 51574020) and the China Postdoctoral Science Foundation (No. 2016M602377). The authors also thank Shin-ya Kitamura, Hiroyuki Shibata, Kyung-Ho Kim, and Xu Gao (Institute of Multi-Disciplinary Research for Advanced Materials, Tohoku University, Sendai, Japan) for their generous help and valuable discussion.
Author Contributions
Chengsong Liu and Shufeng Yang conceived and designed the experiments; Chengsong Liu and Xueliang Zhang performed the experiments; Chengsong Liu, Shufeng Yang, Jingshe Li, and Hongwei Ni analyzed the data; Jingshe Li and Hongwei Ni contributed reagents/materials/analysis tools; Chengsong Liu wrote the paper.
Conflicts of Interest
The authors declare no conflict of interest. The funding sponsors had no role in the design of the study; in the collection, analyses, or interpretation of data; in the writing of the manuscript; or in the decision to publish the results.
References
- Wu, Z.; Zheng, W.; Li, G.; Matsuura, H.; Tsukihashi, F. Effect of Inclusions’ Behavior on the Microstructure in Al–Ti Deoxidized and Magnesium-Treated Steel with Different Aluminum Contents. Metall. Mater. Trans. B 2015, 46, 1226–1241. [Google Scholar] [CrossRef]
- Zhou, M.; Xu, G.; Hu, H.; Yuan, Q.; Tian, J. The Morphologies of Different Types of Fe2SiO4–FeO in Si-Containing Steel. Metals 2017, 7, 8. [Google Scholar] [CrossRef]
- Zheng, W.; Wu, Z.; Li, G.; Zhang, Z.; Zhu, C. Effect of Al Content on the Characteristics of Inclusions in Al–Ti Complex Deoxidized Steel with Calcium Treatment. ISIJ Int. 2014, 54, 1755–1764. [Google Scholar] [CrossRef]
- Sasaki, R.; Ueda, S.; Kim, S.; Gao, X.; Kitamura, S. Reaction Behavior between B4C, 304 Grade of Stainless Steel and Zircaloy at 1473 K. J. Nucl. Mater. 2016, 477, 205–214. [Google Scholar] [CrossRef]
- Taniguchi, T.; Satoh, N.; Saito, Y.; Kubota, K.; Kumagai, A.; Tamura, Y.; Miki, T. Investigation of Compositional Change of Inclusions in Martensitic Stainless Steel during Heat Treatment by Newly Developed Analysis Method. ISIJ Int. 2011, 51, 1957–1966. [Google Scholar] [CrossRef]
- Shao, X.; Wang, X.; Ji, C.; Li, H.; Yang, C.; Zhu, G. Effect of Heat Treatment Conditions on Shape Control of Large-sized Elongated MnS Inclusions in Resulfurized Free-cutting Steels. Int. J. Min. Met. Mater. 2015, 22, 483–491. [Google Scholar] [CrossRef]
- Yuan, Q.; Xu, G.; Zhou, M.; He, B.; Hu, H. The Effect of P on the Microstructure and Melting Temperature of Fe2SiO4 in Silicon-Containing Steels Investigated by In Situ Observation. Metals 2017, 7, 37. [Google Scholar] [CrossRef]
- Takahashi, I.; Sakae, T.; Yoshida, T. Changes of the Nonmetallic Inclusion by Heating. Tetsu Hagané 1967, 53, 168–173. [Google Scholar]
- Shibata, H.; Kimura, K.; Tanaka, T.; Kitamura, S. Mechanism of Change in Chemical Composition of Oxide Inclusions in Fe–Cr Alloys Deoxidized with Mn and Si by Heat Treatment at 1473 K. ISIJ Int. 2011, 51, 1944–1950. [Google Scholar] [CrossRef]
- Choi, W.; Matsuura, H.; Tsukihashi, F. Changing Behavior of Non-metallic Inclusions in Solid Iron Deoxidized by Al–Ti Addition during Heating at 1473 K. ISIJ Int. 2011, 51, 1951–1956. [Google Scholar] [CrossRef]
- Kim, K.; Kim, S.; Shibata, H.; Kitamura, S. Reaction between MnO–SiO2–FeO Oxide and Fe–Mn–Si Solid Alloy during Heat Treatment. ISIJ Int. 2014, 54, 2144–2153. [Google Scholar] [CrossRef]
- Liu, C.; Kim, K.; Kim, S.; Li, J.; Ueda, S.; Gao, X.; Shibata, H.; Kitamura, S. Reaction between MnO–SiO2–FeO Solid Oxide with Solid Steel Deoxidized by Si and Mn during Heat Treatment at 1473K (1200 °C). Metall. Mater. Trans. B 2015, 46, 1875–1884. [Google Scholar] [CrossRef]
- Liu, C.; Yang, S.; Kim, K.; Li, J.; Shibata, H.; Kitamura, S. Influence of FeO and Sulfur on the Reaction between MnO–SiO2–FeO Oxides with Fe–Mn-Si Solid Alloy during Heat Treatment at 1473K. Int. J. Min. Met. Mater. 2015, 22, 811–819. [Google Scholar] [CrossRef]
- Zhang, L. Several Important Scientific Research Points of Non-metallic Inclusions in Steel. Steelmaking 2016, 32, 1–16. (In Chinese) [Google Scholar]
- Hino, M.; Ito, K. Thermodynamic Data for Steelmaking, 1st ed.; Tohoku University Press: Sendai, Japan, 2010; pp. 10–16. [Google Scholar]
- Nagata, K.; Tanabe, J.; Goto, K.S. Standard Free Energies of Formation of CaO–Al2O3 Intermediate Compounds by Means of EMF Measurement of Galvanic Cells. Tetsu Hagané 1989, 75, 2023–2030. [Google Scholar]
- Ohba, Y.; Yamashita, Y.; Ohno, K.; Maeda, T.; Nishioka, K.; Shimizu, M. Formation Mechanism of Oxide Particles in Subscale Layer around Surface Cracks of Steel. Tetsu Hagané 2009, 95, 531–540. [Google Scholar] [CrossRef]
- Takada, J.; Yamamoto, S.; Kikuchi, S.; Adachi, M. Determination of Diffusion Coefficient of Oxygen in γ-iron from Measurements of Internal Oxidation in Fe–Al Alloys. Metall. Mater. Trans. A 1986, 17, 221–229. [Google Scholar] [CrossRef]
- Swisher, J.; Turkdogan, E. Soubility, Permeability, and Diffusivity of Oxygen in Solid Iron. Trans. Met. Soc. AIME 1967, 239, 426–431. [Google Scholar]
- Ban-Ya, S. Mathematical Expression of Slag-Metal Reactions in Steelmaking Process by Quadratic Formalism Based on the Regular Solution Model. ISIJ Int. 1993, 33, 2–11. [Google Scholar] [CrossRef]
- Madelung, O. Diffusion in Solid Metals, 1st ed.; Springer: Berlin, Germany, 1990; pp. 124–130. [Google Scholar]
Figure 1.
Experimental setup for oxide pre-melting experiment using a confocal scanning laser microscope (CSLM).
Figure 1.
Experimental setup for oxide pre-melting experiment using a confocal scanning laser microscope (CSLM).
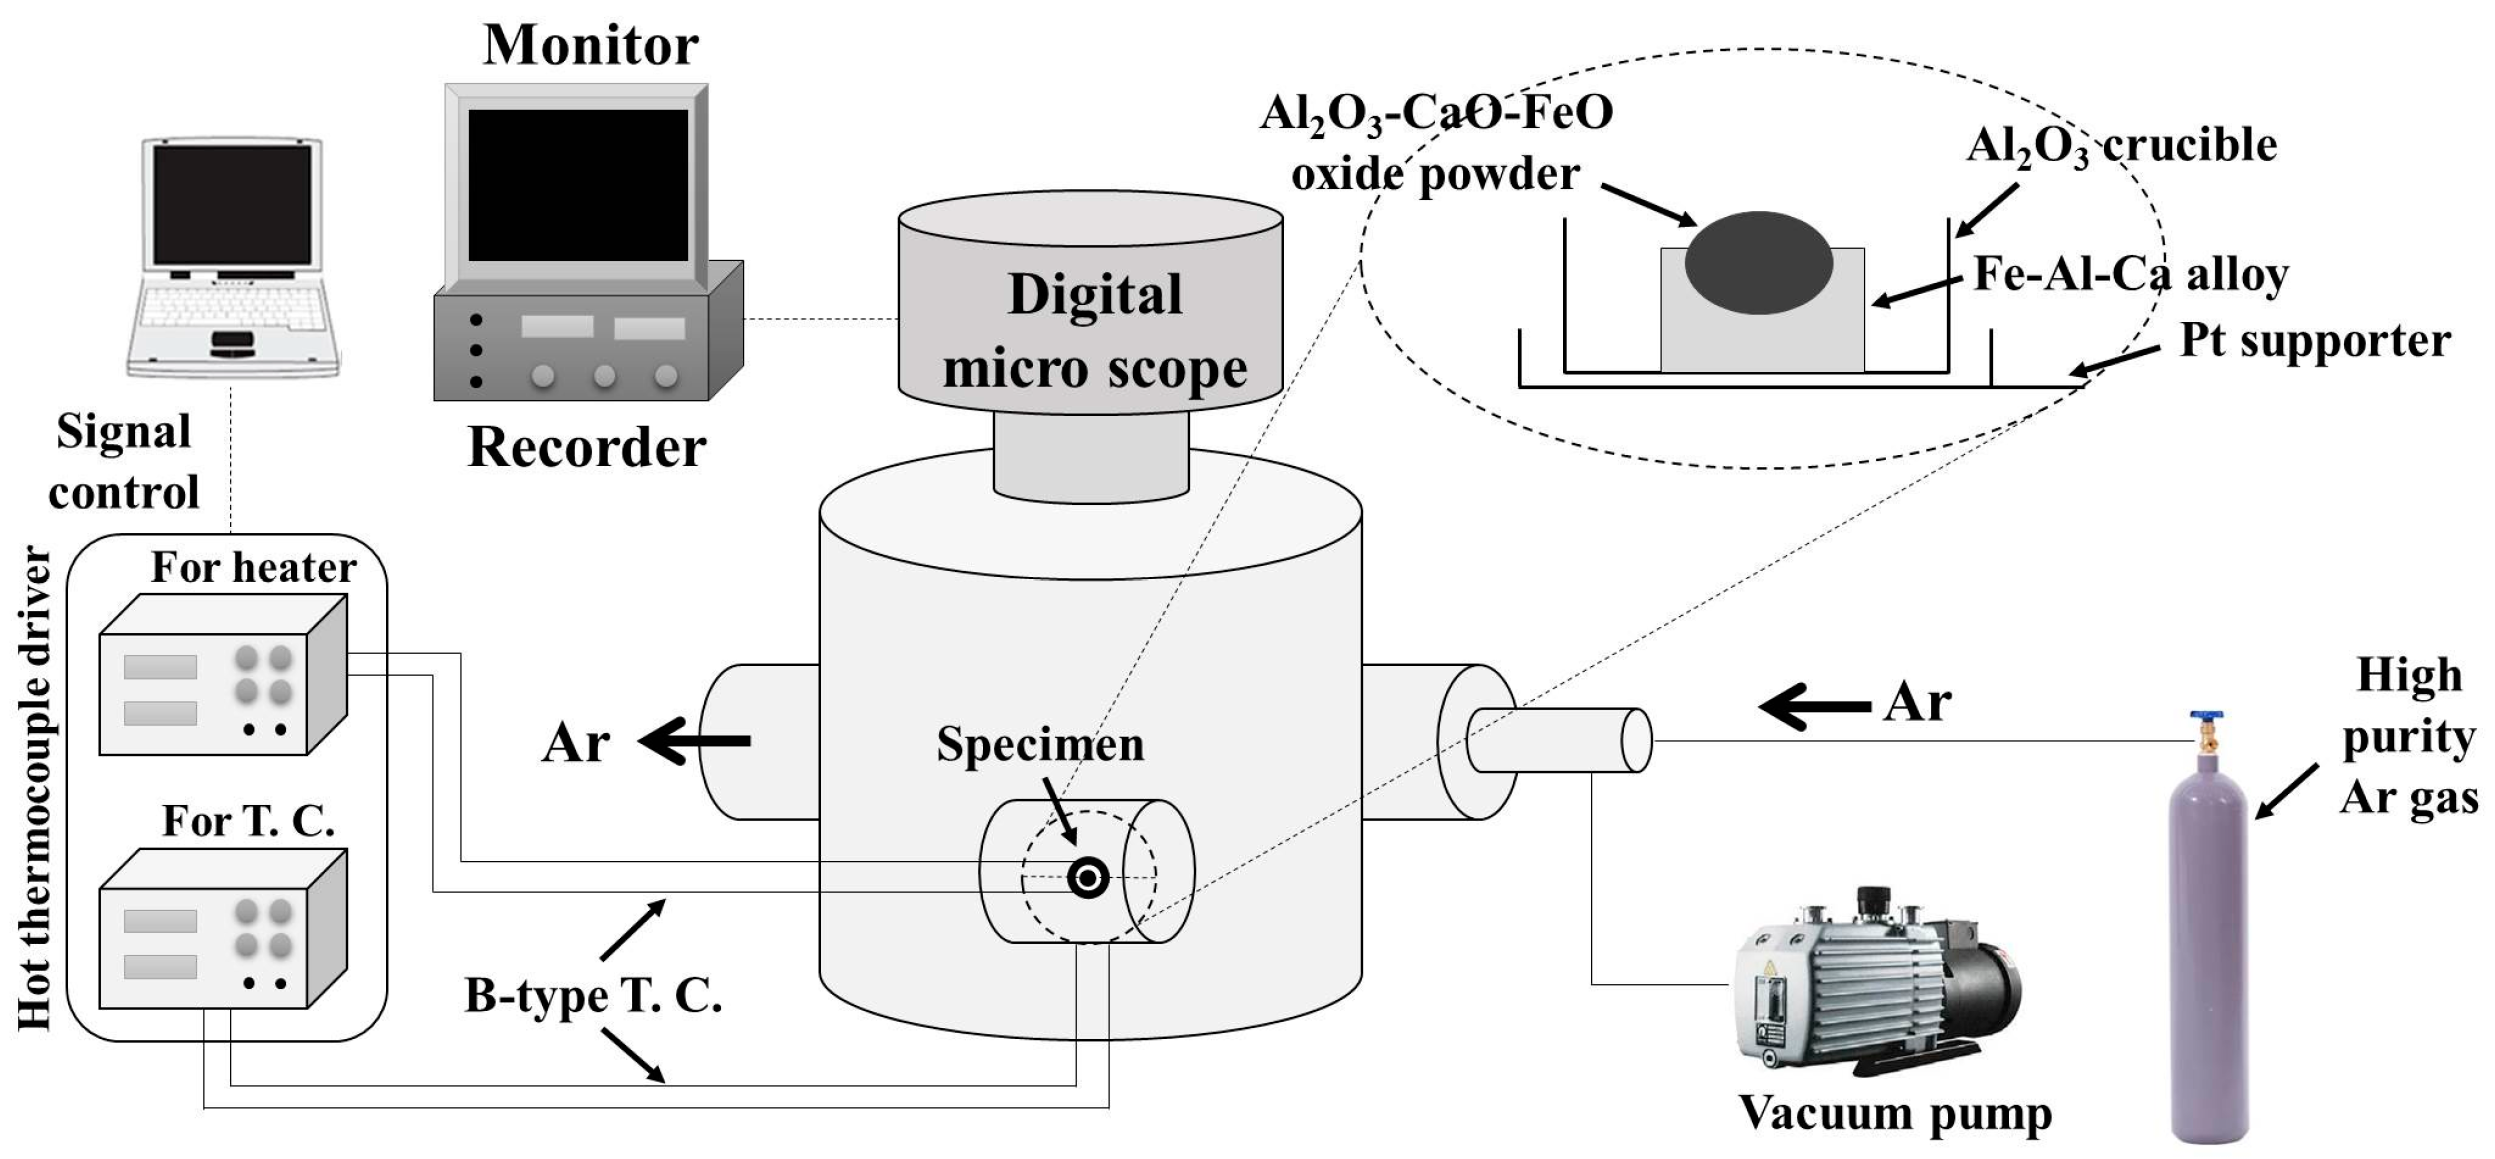
Figure 2.
Schematic of the vacuum sealing process.
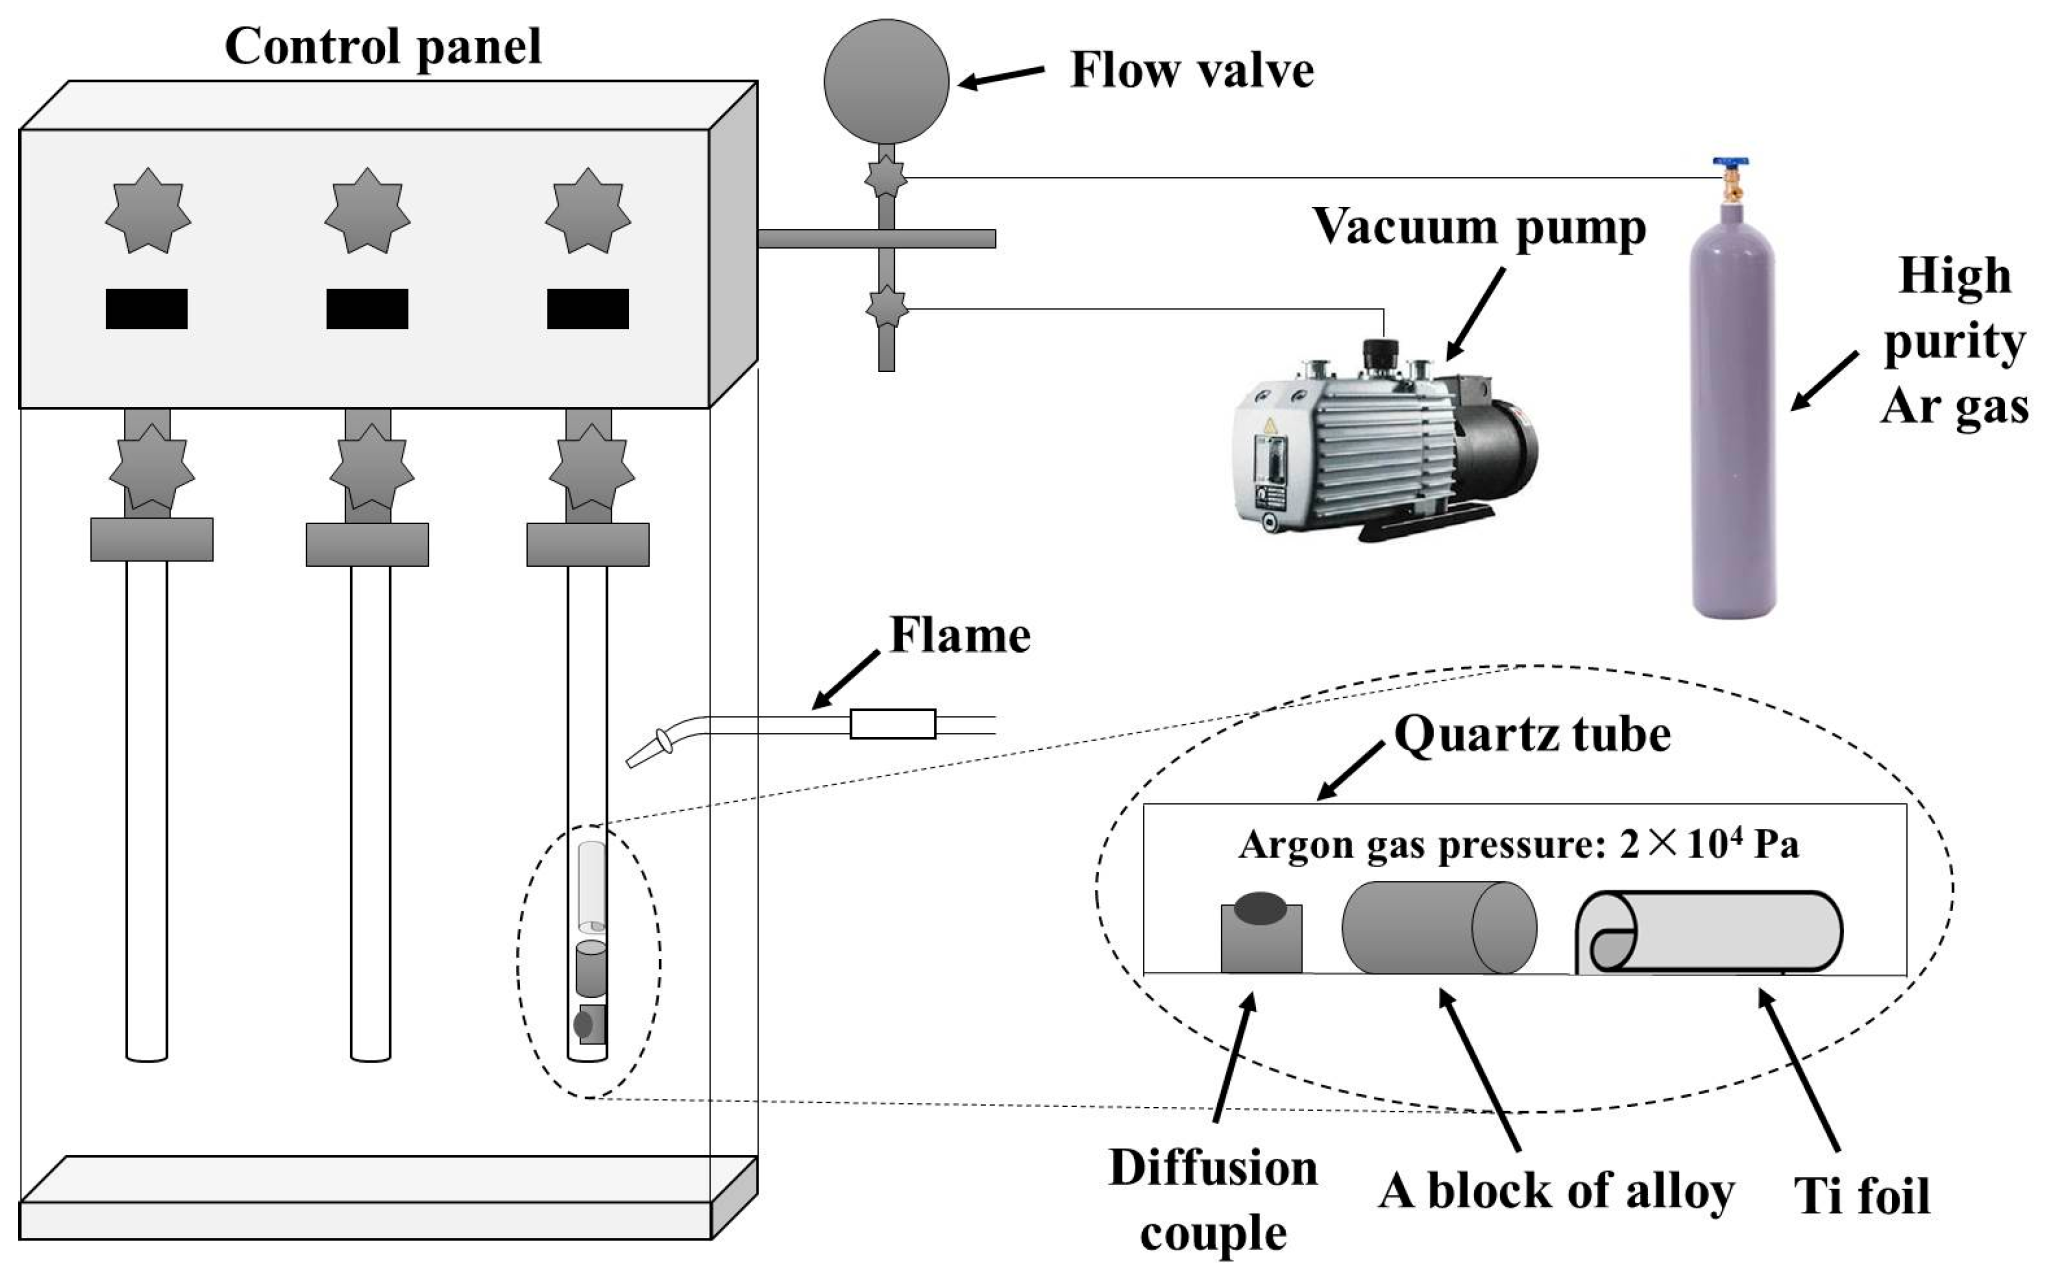
Figure 3.
Temperature curve of the heat treatment for the diffusion couple specimens.
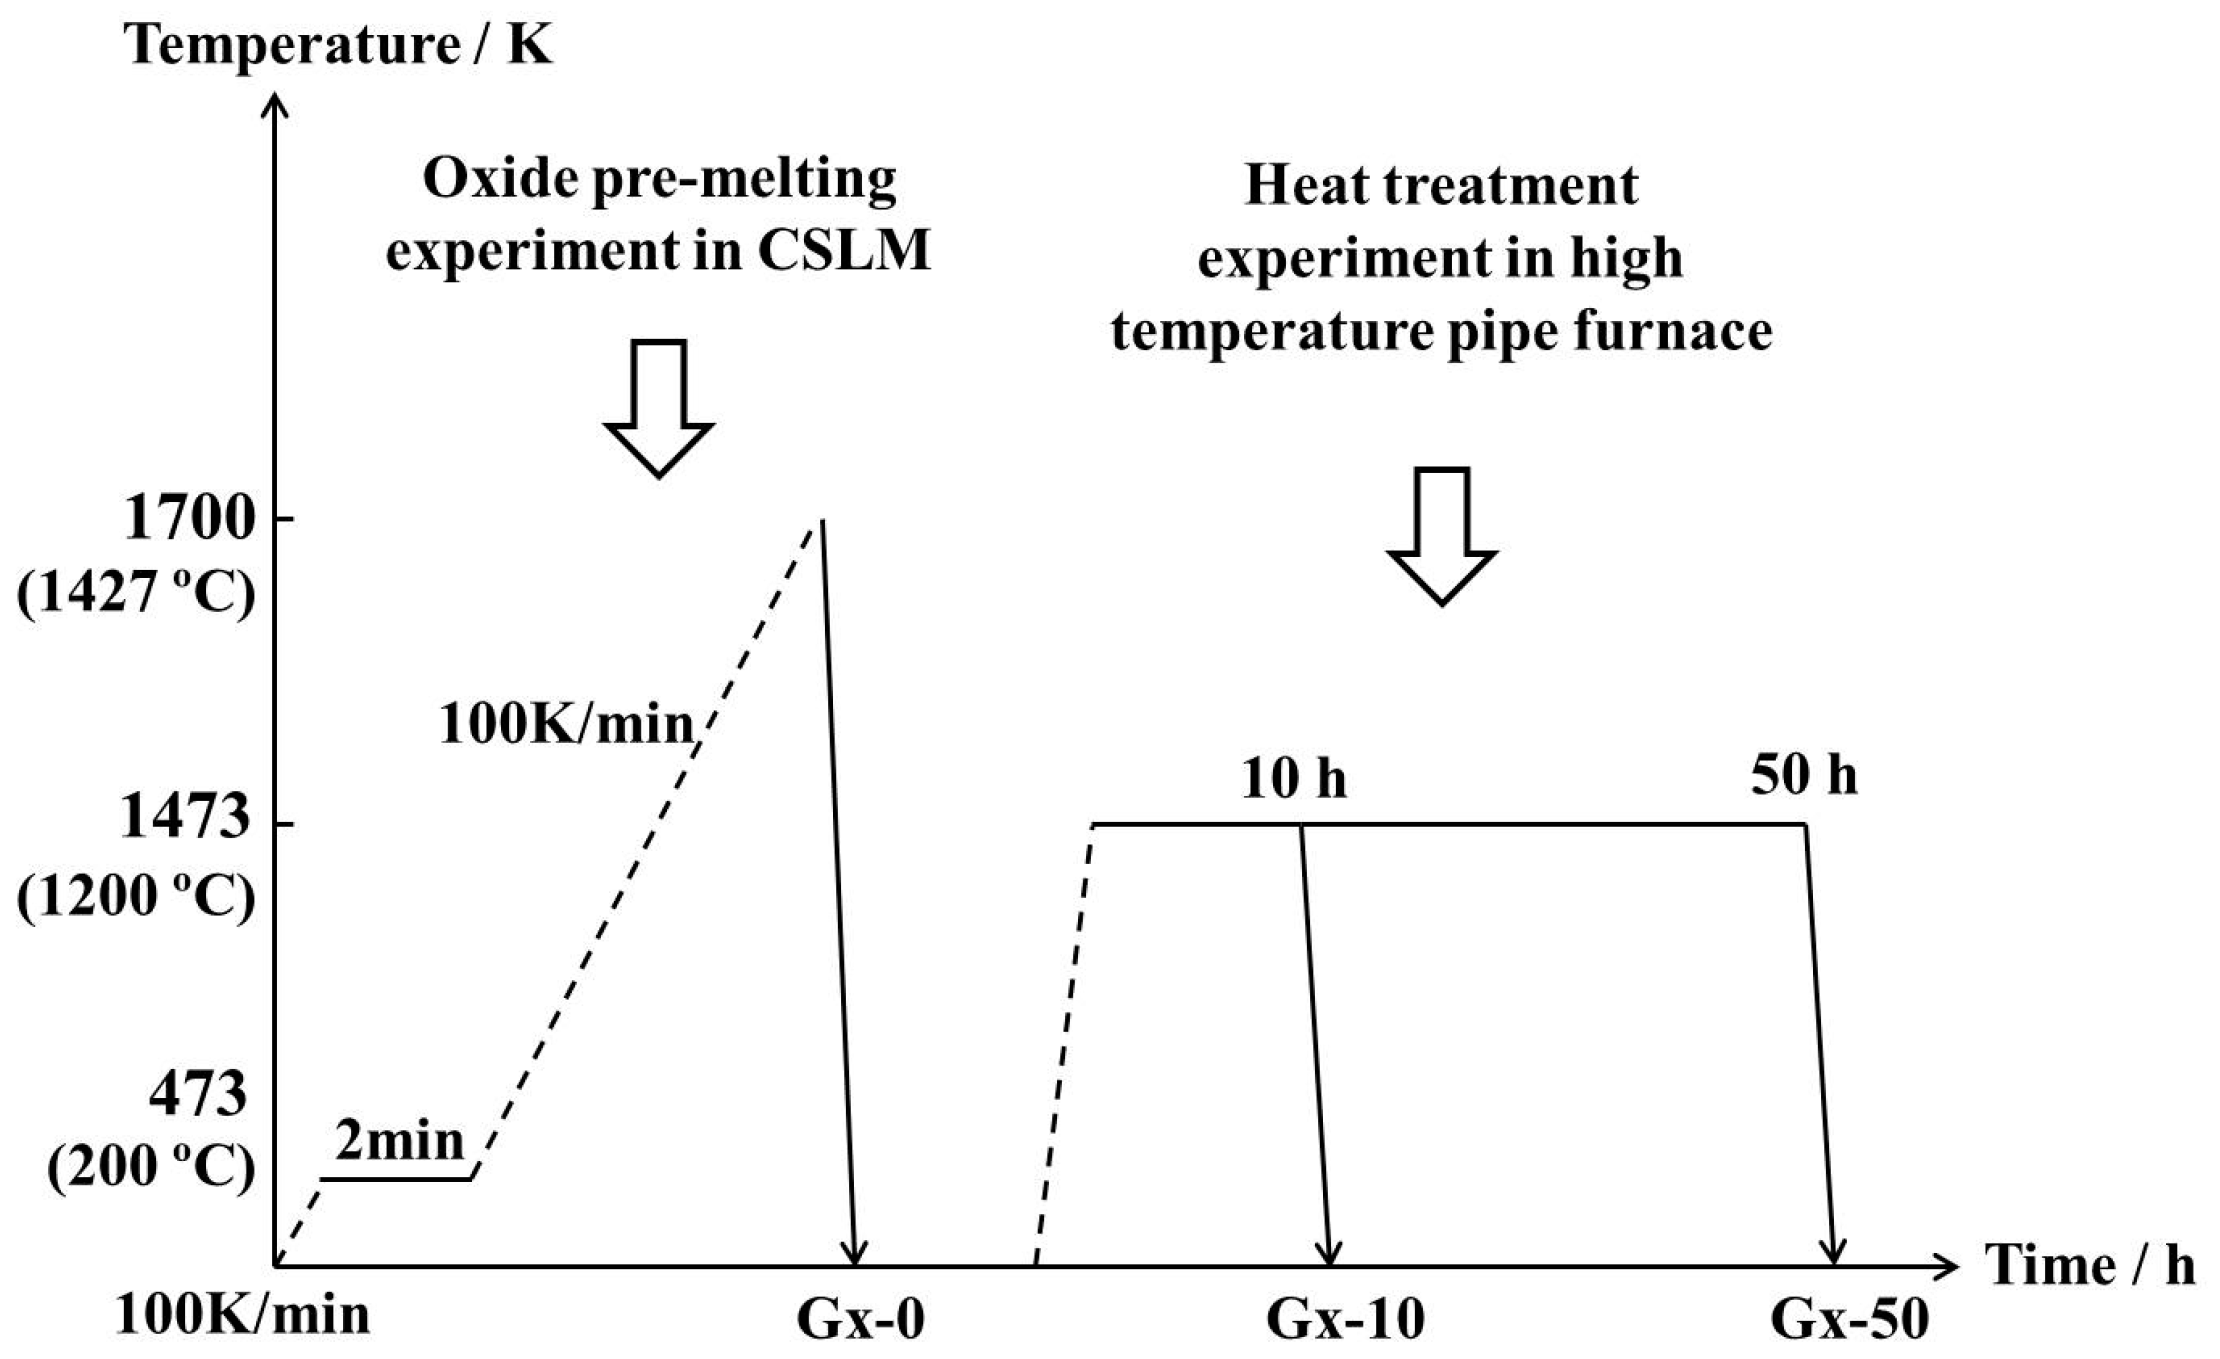
Figure 4.
Morphology of interface between the alloy and oxide in the diffusion couple of G0, G1, and G2 after the oxide pre-melting experiment: (a) G0-0; (b) G1-0; (c) G2-0.
Figure 4.
Morphology of interface between the alloy and oxide in the diffusion couple of G0, G1, and G2 after the oxide pre-melting experiment: (a) G0-0; (b) G1-0; (c) G2-0.


Figure 5.
Morphology of interface between the alloy and oxide in the diffusion couple of G0, G1, and G2 after the heat treatment at 1473 K for 10 h: (a) G0-10; (b) G1-10; (c) G2-10.
Figure 5.
Morphology of interface between the alloy and oxide in the diffusion couple of G0, G1, and G2 after the heat treatment at 1473 K for 10 h: (a) G0-10; (b) G1-10; (c) G2-10.
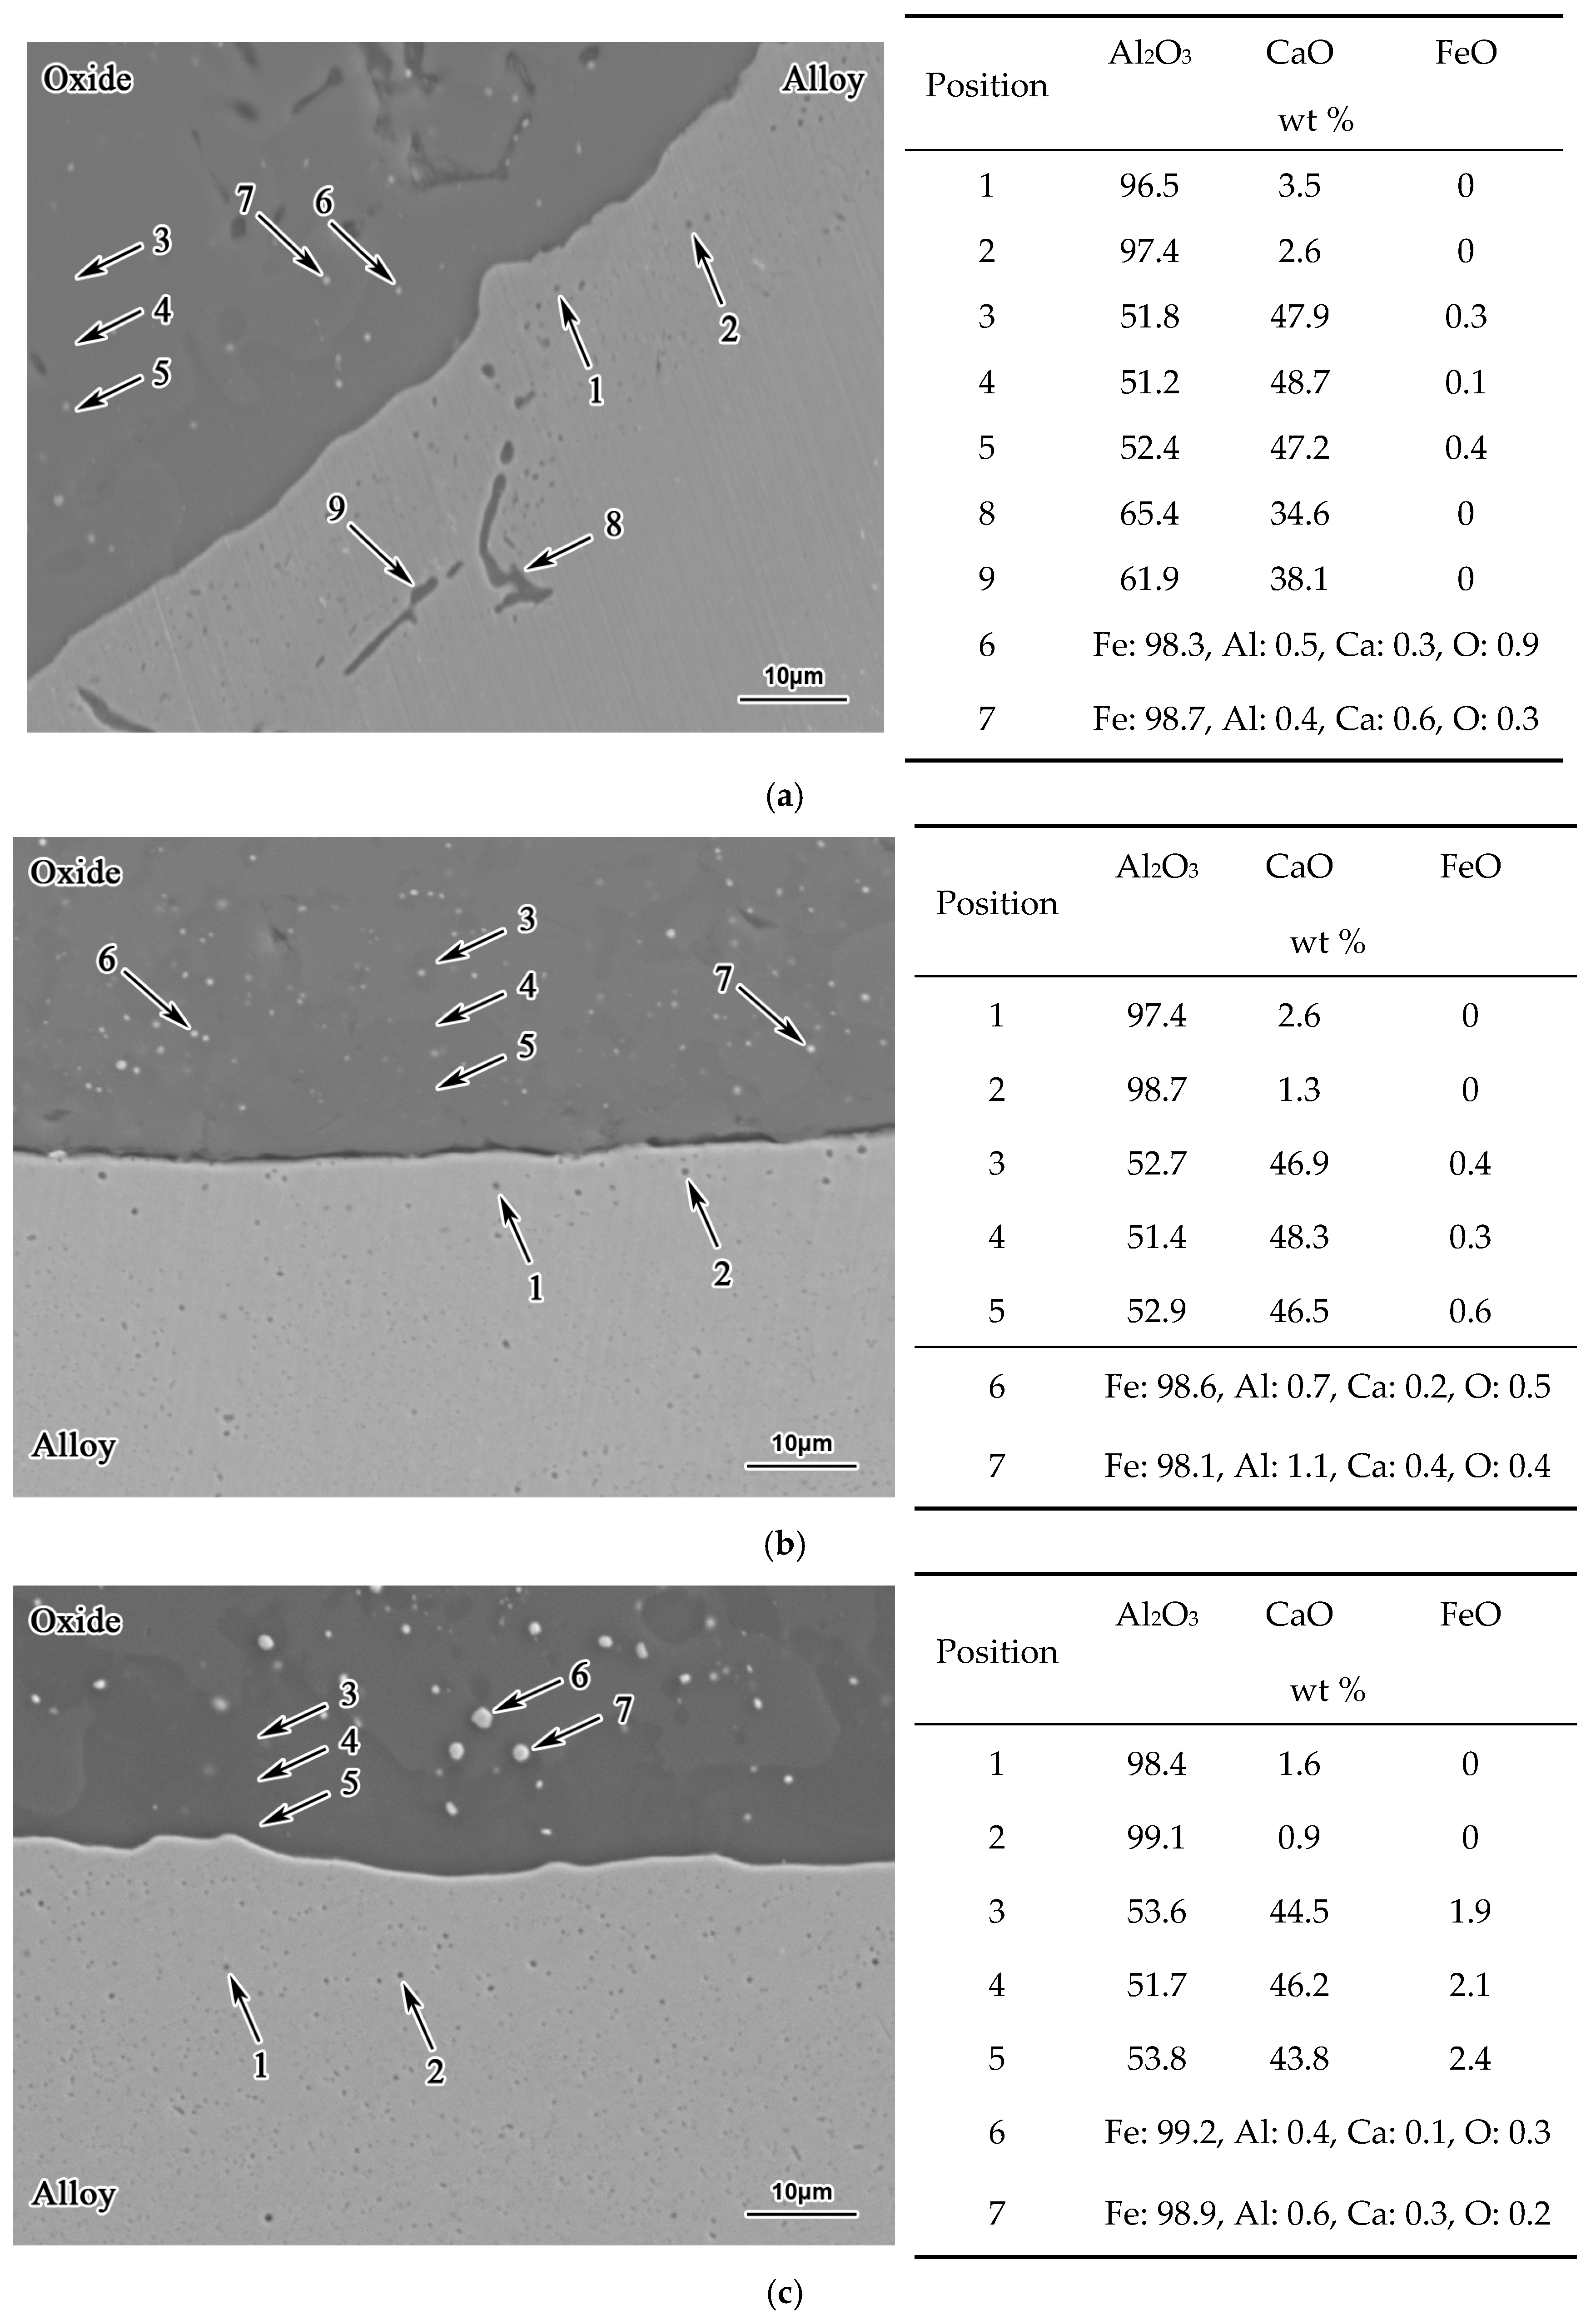
Figure 6.
Morphology of interface between the alloy and oxide in the diffusion couple of G0, G1, and G2 after the heat treatment at 1473 K for 50 h: (a) G0-50; (b) G1-50; (c) G2-50.
Figure 6.
Morphology of interface between the alloy and oxide in the diffusion couple of G0, G1, and G2 after the heat treatment at 1473 K for 50 h: (a) G0-50; (b) G1-50; (c) G2-50.

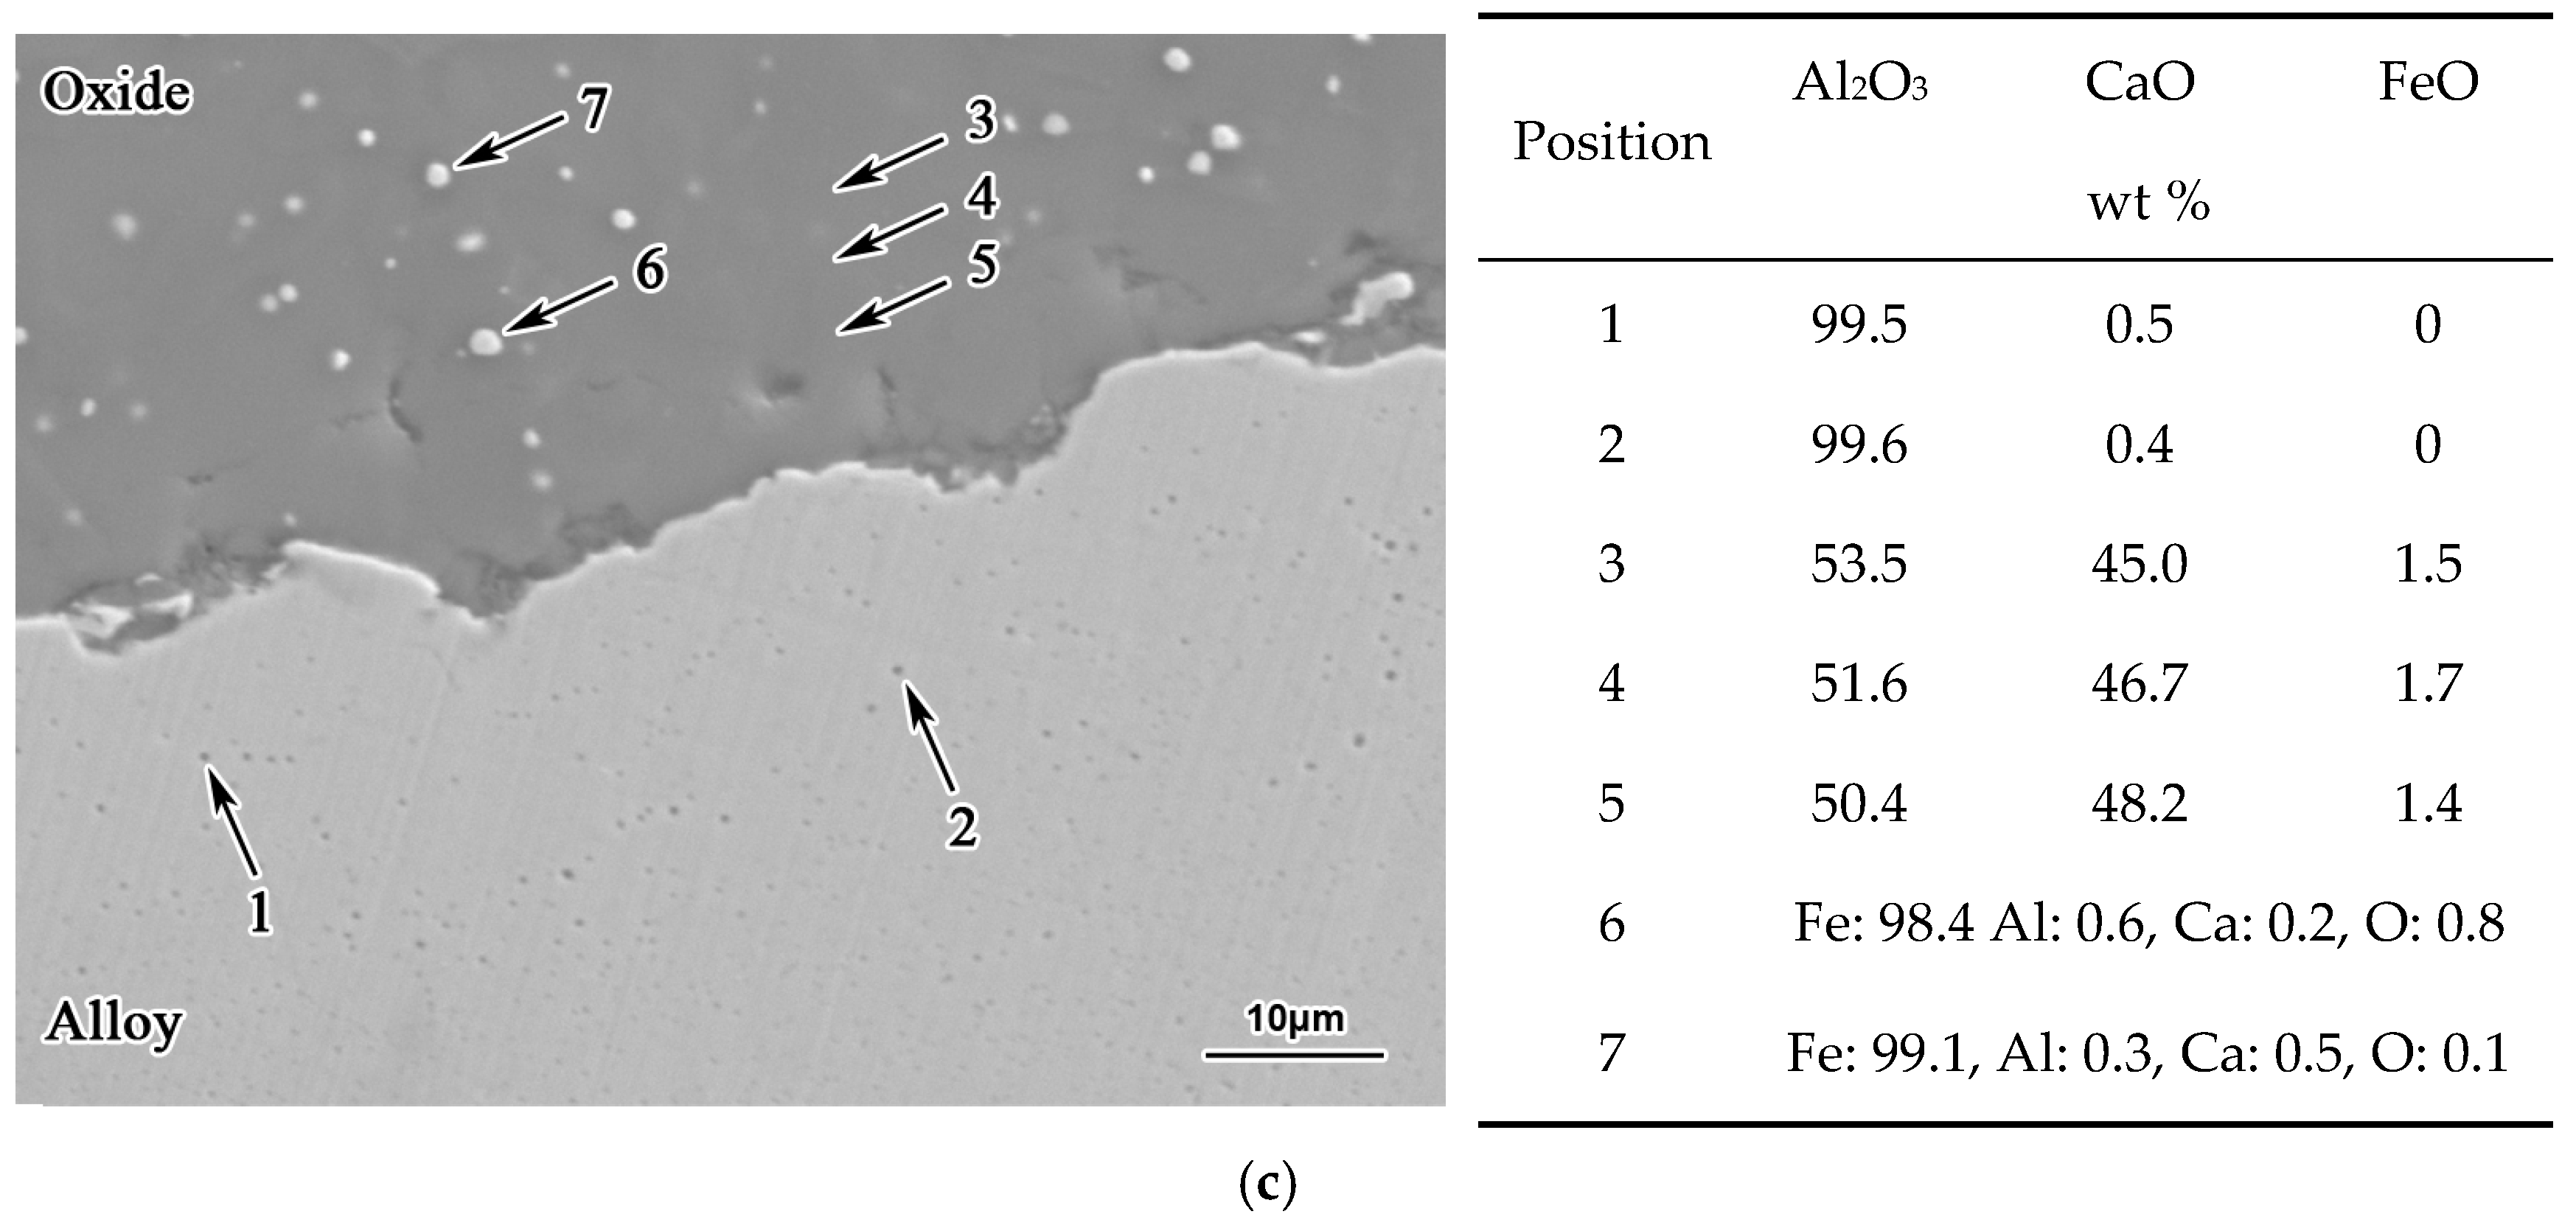
Figure 7.
SEM images and measured distributions of O, Fe, Al, and Ca at the vicinity of the interface between the alloy and oxide in the diffusion couple of G0-50, G1-50, and G2-50: (a) G0-50; (b) G1-50; (c) G2-50.
Figure 7.
SEM images and measured distributions of O, Fe, Al, and Ca at the vicinity of the interface between the alloy and oxide in the diffusion couple of G0-50, G1-50, and G2-50: (a) G0-50; (b) G1-50; (c) G2-50.


Figure 8.
Effect of FeO content in the oxide on Al content in the alloy of diffusion couple G0, G1, and G2 before and after heat treatment at 1473 K: (a) after oxide pre-melting experiment; (b) after heat treatment for 10 h; (c) after heat treatment for 50 h.
Figure 8.
Effect of FeO content in the oxide on Al content in the alloy of diffusion couple G0, G1, and G2 before and after heat treatment at 1473 K: (a) after oxide pre-melting experiment; (b) after heat treatment for 10 h; (c) after heat treatment for 50 h.
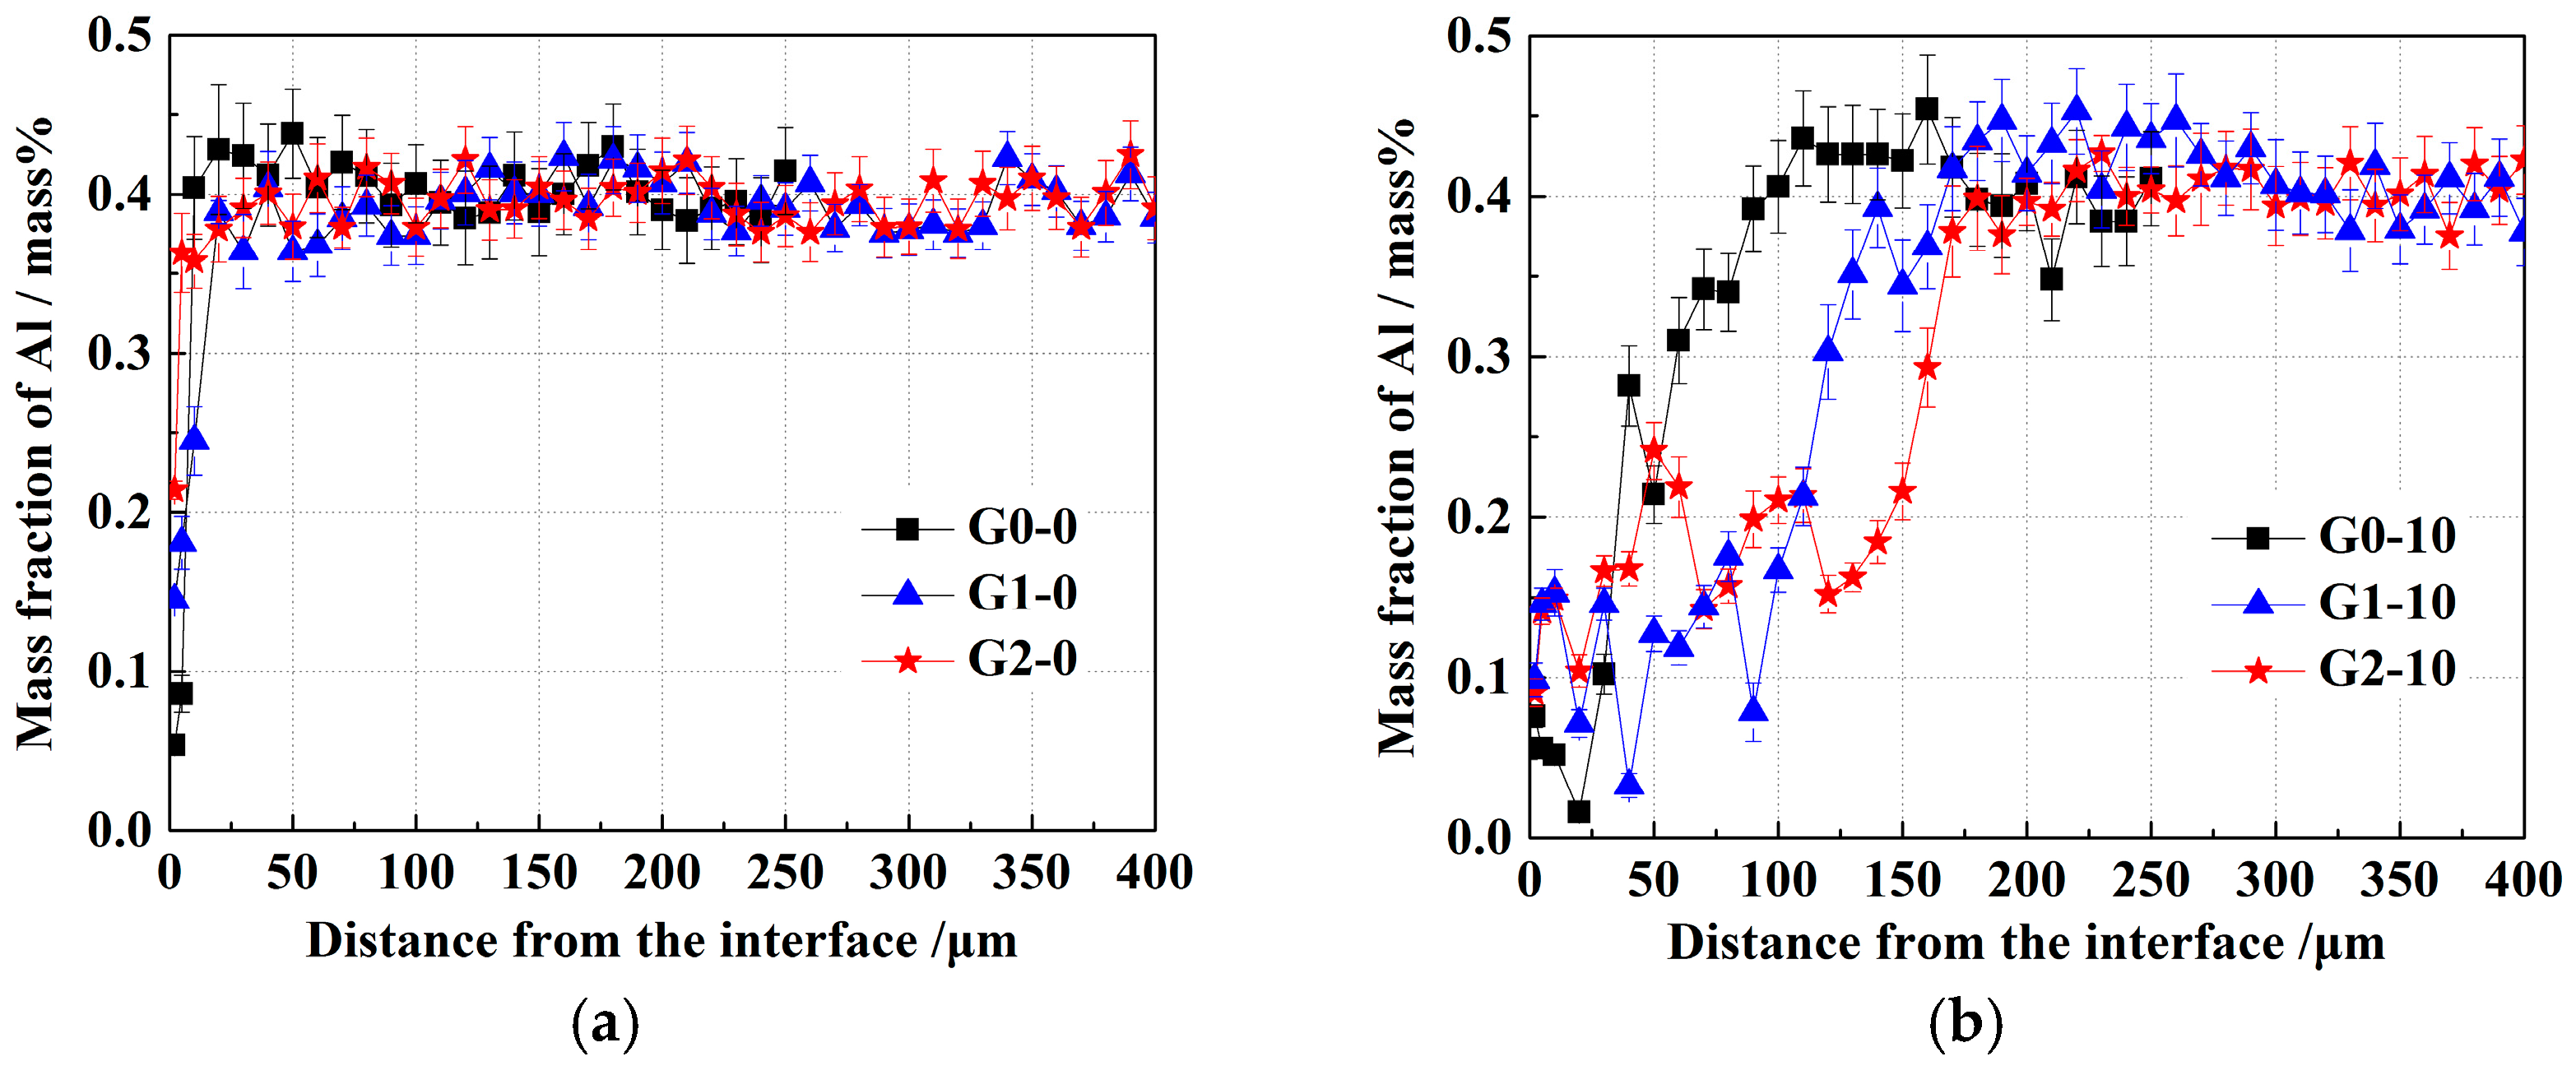

Figure 9.
Effect of FeO content in the oxide on Ca content in the alloy of diffusion couple G0, G1, and G2 before and after heat treatment at 1473 K: (a) after oxide pre-melting experiment; (b) after heat treatment for 10 h; (c) after heat treatment for 50 h.
Figure 9.
Effect of FeO content in the oxide on Ca content in the alloy of diffusion couple G0, G1, and G2 before and after heat treatment at 1473 K: (a) after oxide pre-melting experiment; (b) after heat treatment for 10 h; (c) after heat treatment for 50 h.
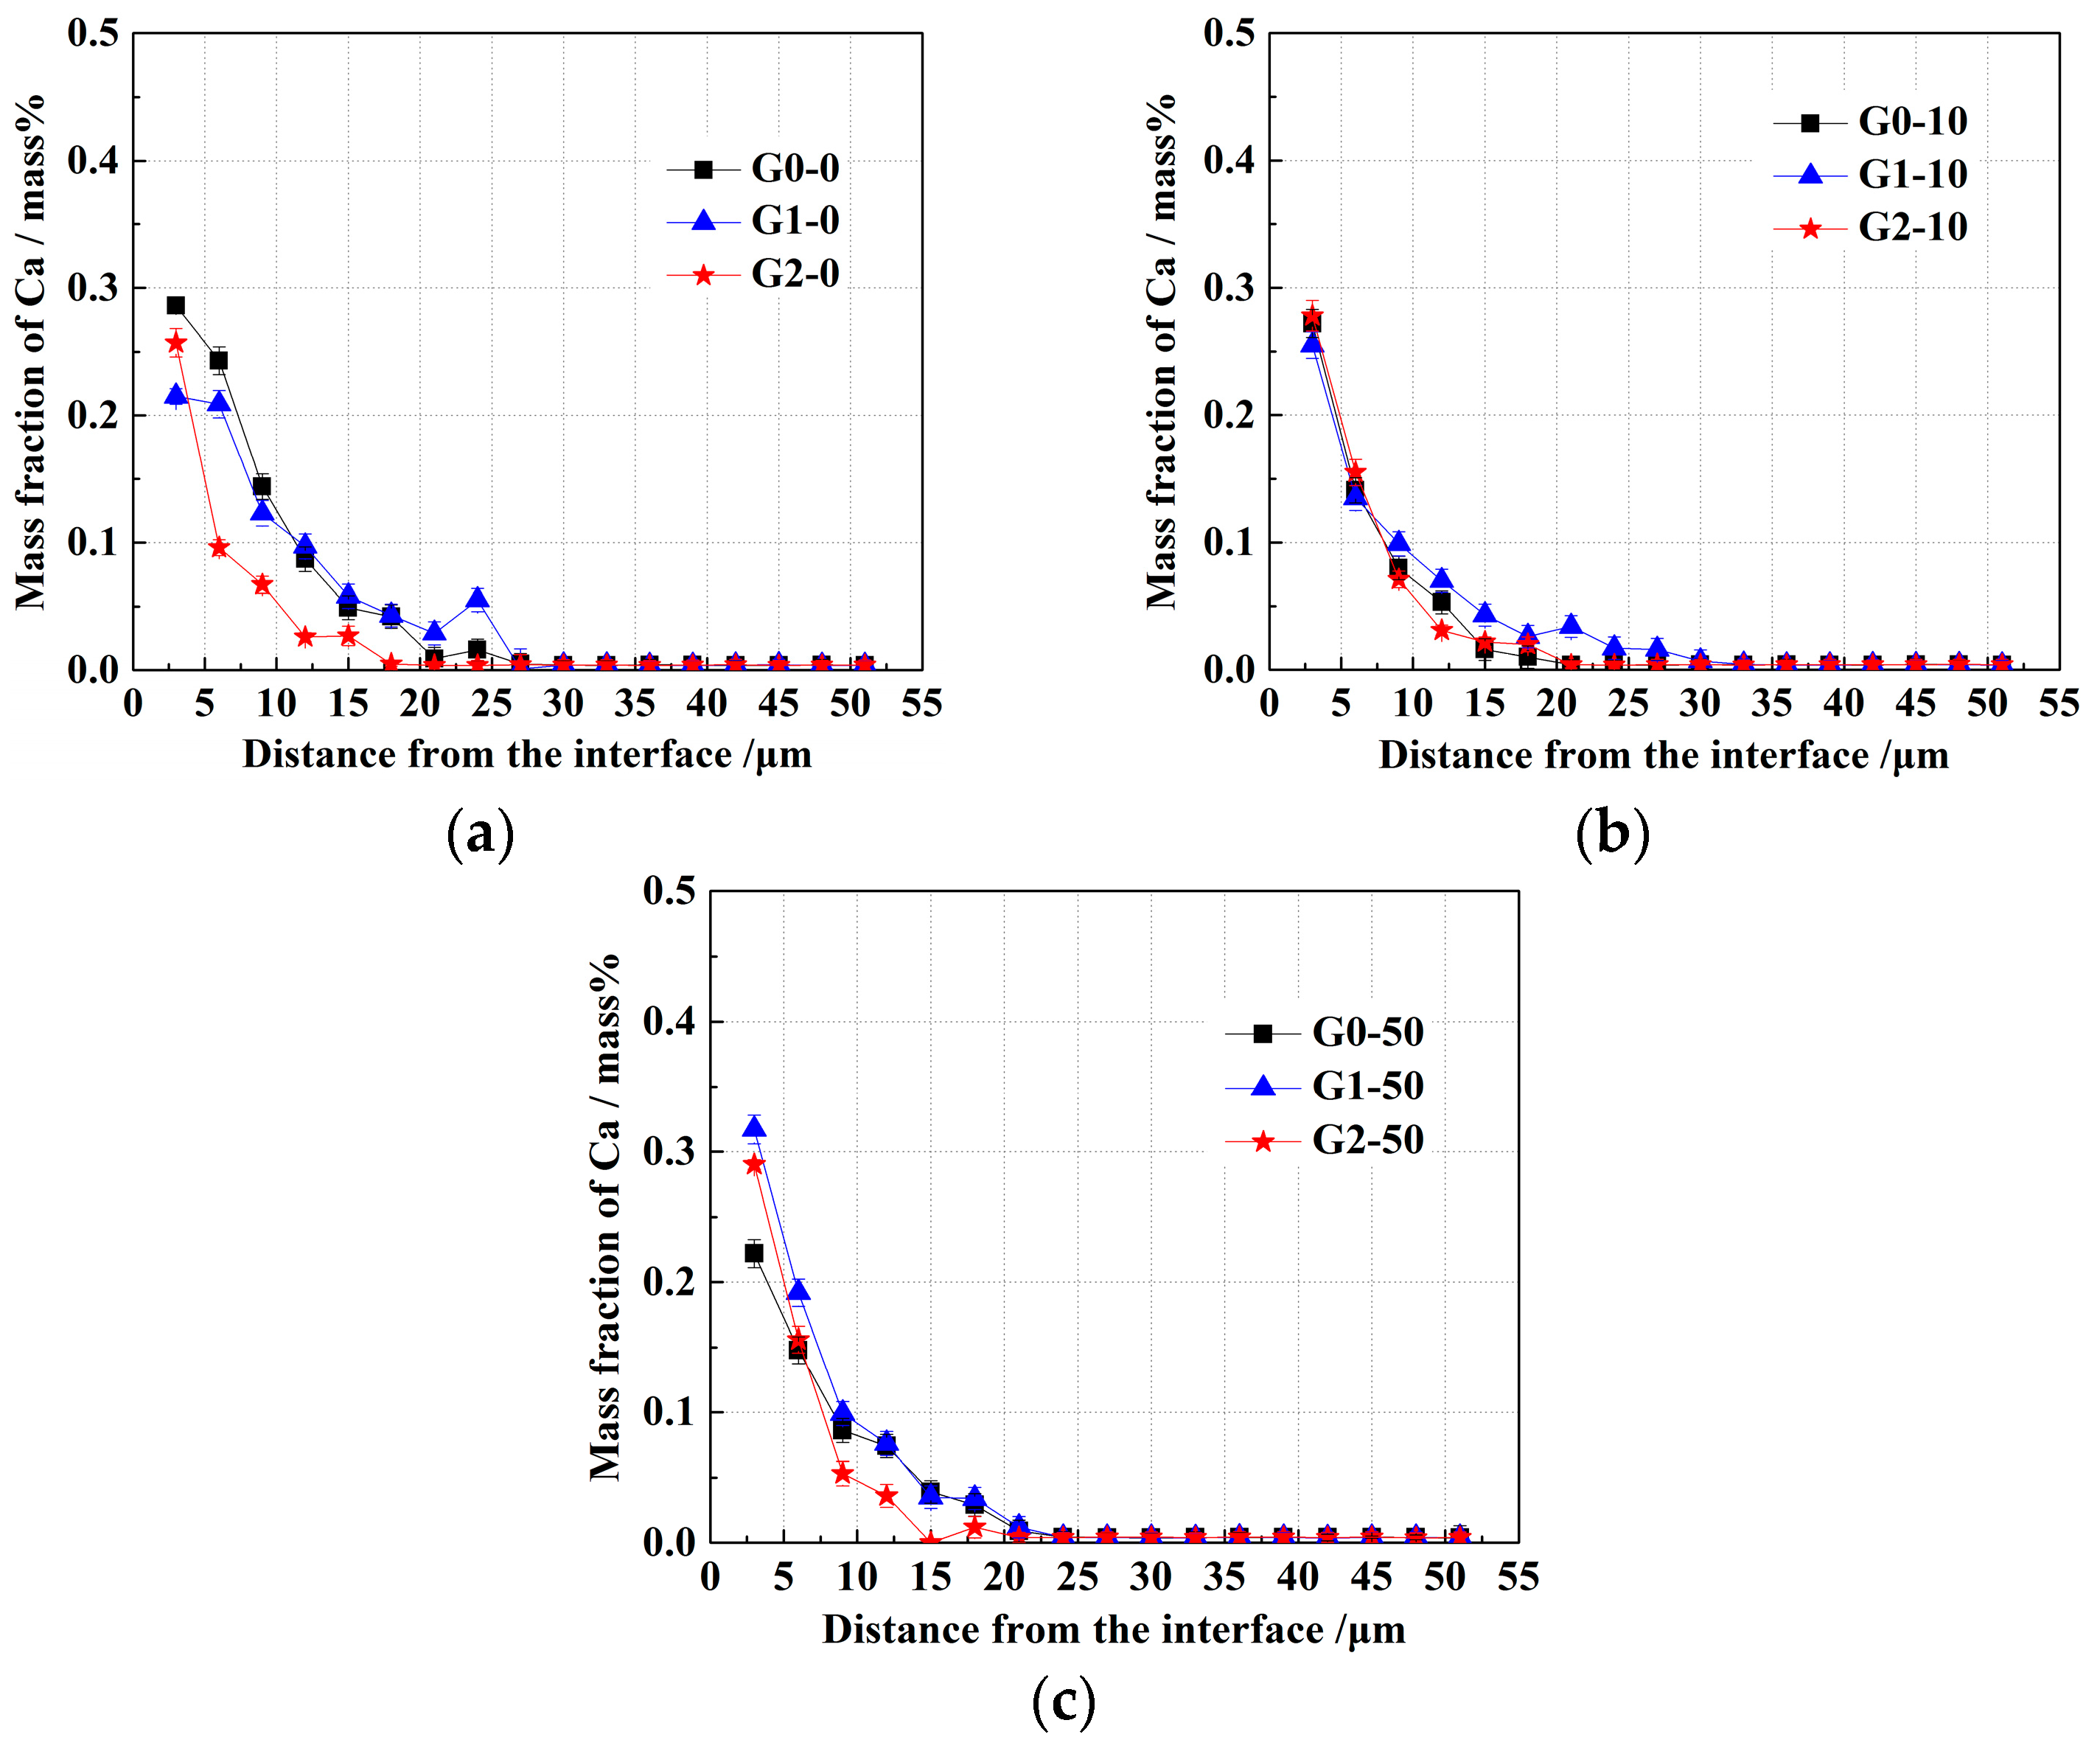
Figure 10.
Relationship between the particle precipitation zone (PPZ) and the aluminum-depleted zone (ADZ) in the diffusion couple of G0, G1, and G2 before and after heat treatment at 1473 K.
Figure 10.
Relationship between the particle precipitation zone (PPZ) and the aluminum-depleted zone (ADZ) in the diffusion couple of G0, G1, and G2 before and after heat treatment at 1473 K.

Figure 11.
Influence of initial FeO content in the oxide on the widths of PPZ and ADZ.

Figure 12.
Size distributions of the particles which precipitated in the PPZ of diffusion couples G0, G1, and G2 before and after heat treatment at 1473 K: (a) before heat treatment (after oxide pre-melting experiment); (b) after heat treatment for 10 h; (c) after heat treatment for 50 h.
Figure 12.
Size distributions of the particles which precipitated in the PPZ of diffusion couples G0, G1, and G2 before and after heat treatment at 1473 K: (a) before heat treatment (after oxide pre-melting experiment); (b) after heat treatment for 10 h; (c) after heat treatment for 50 h.
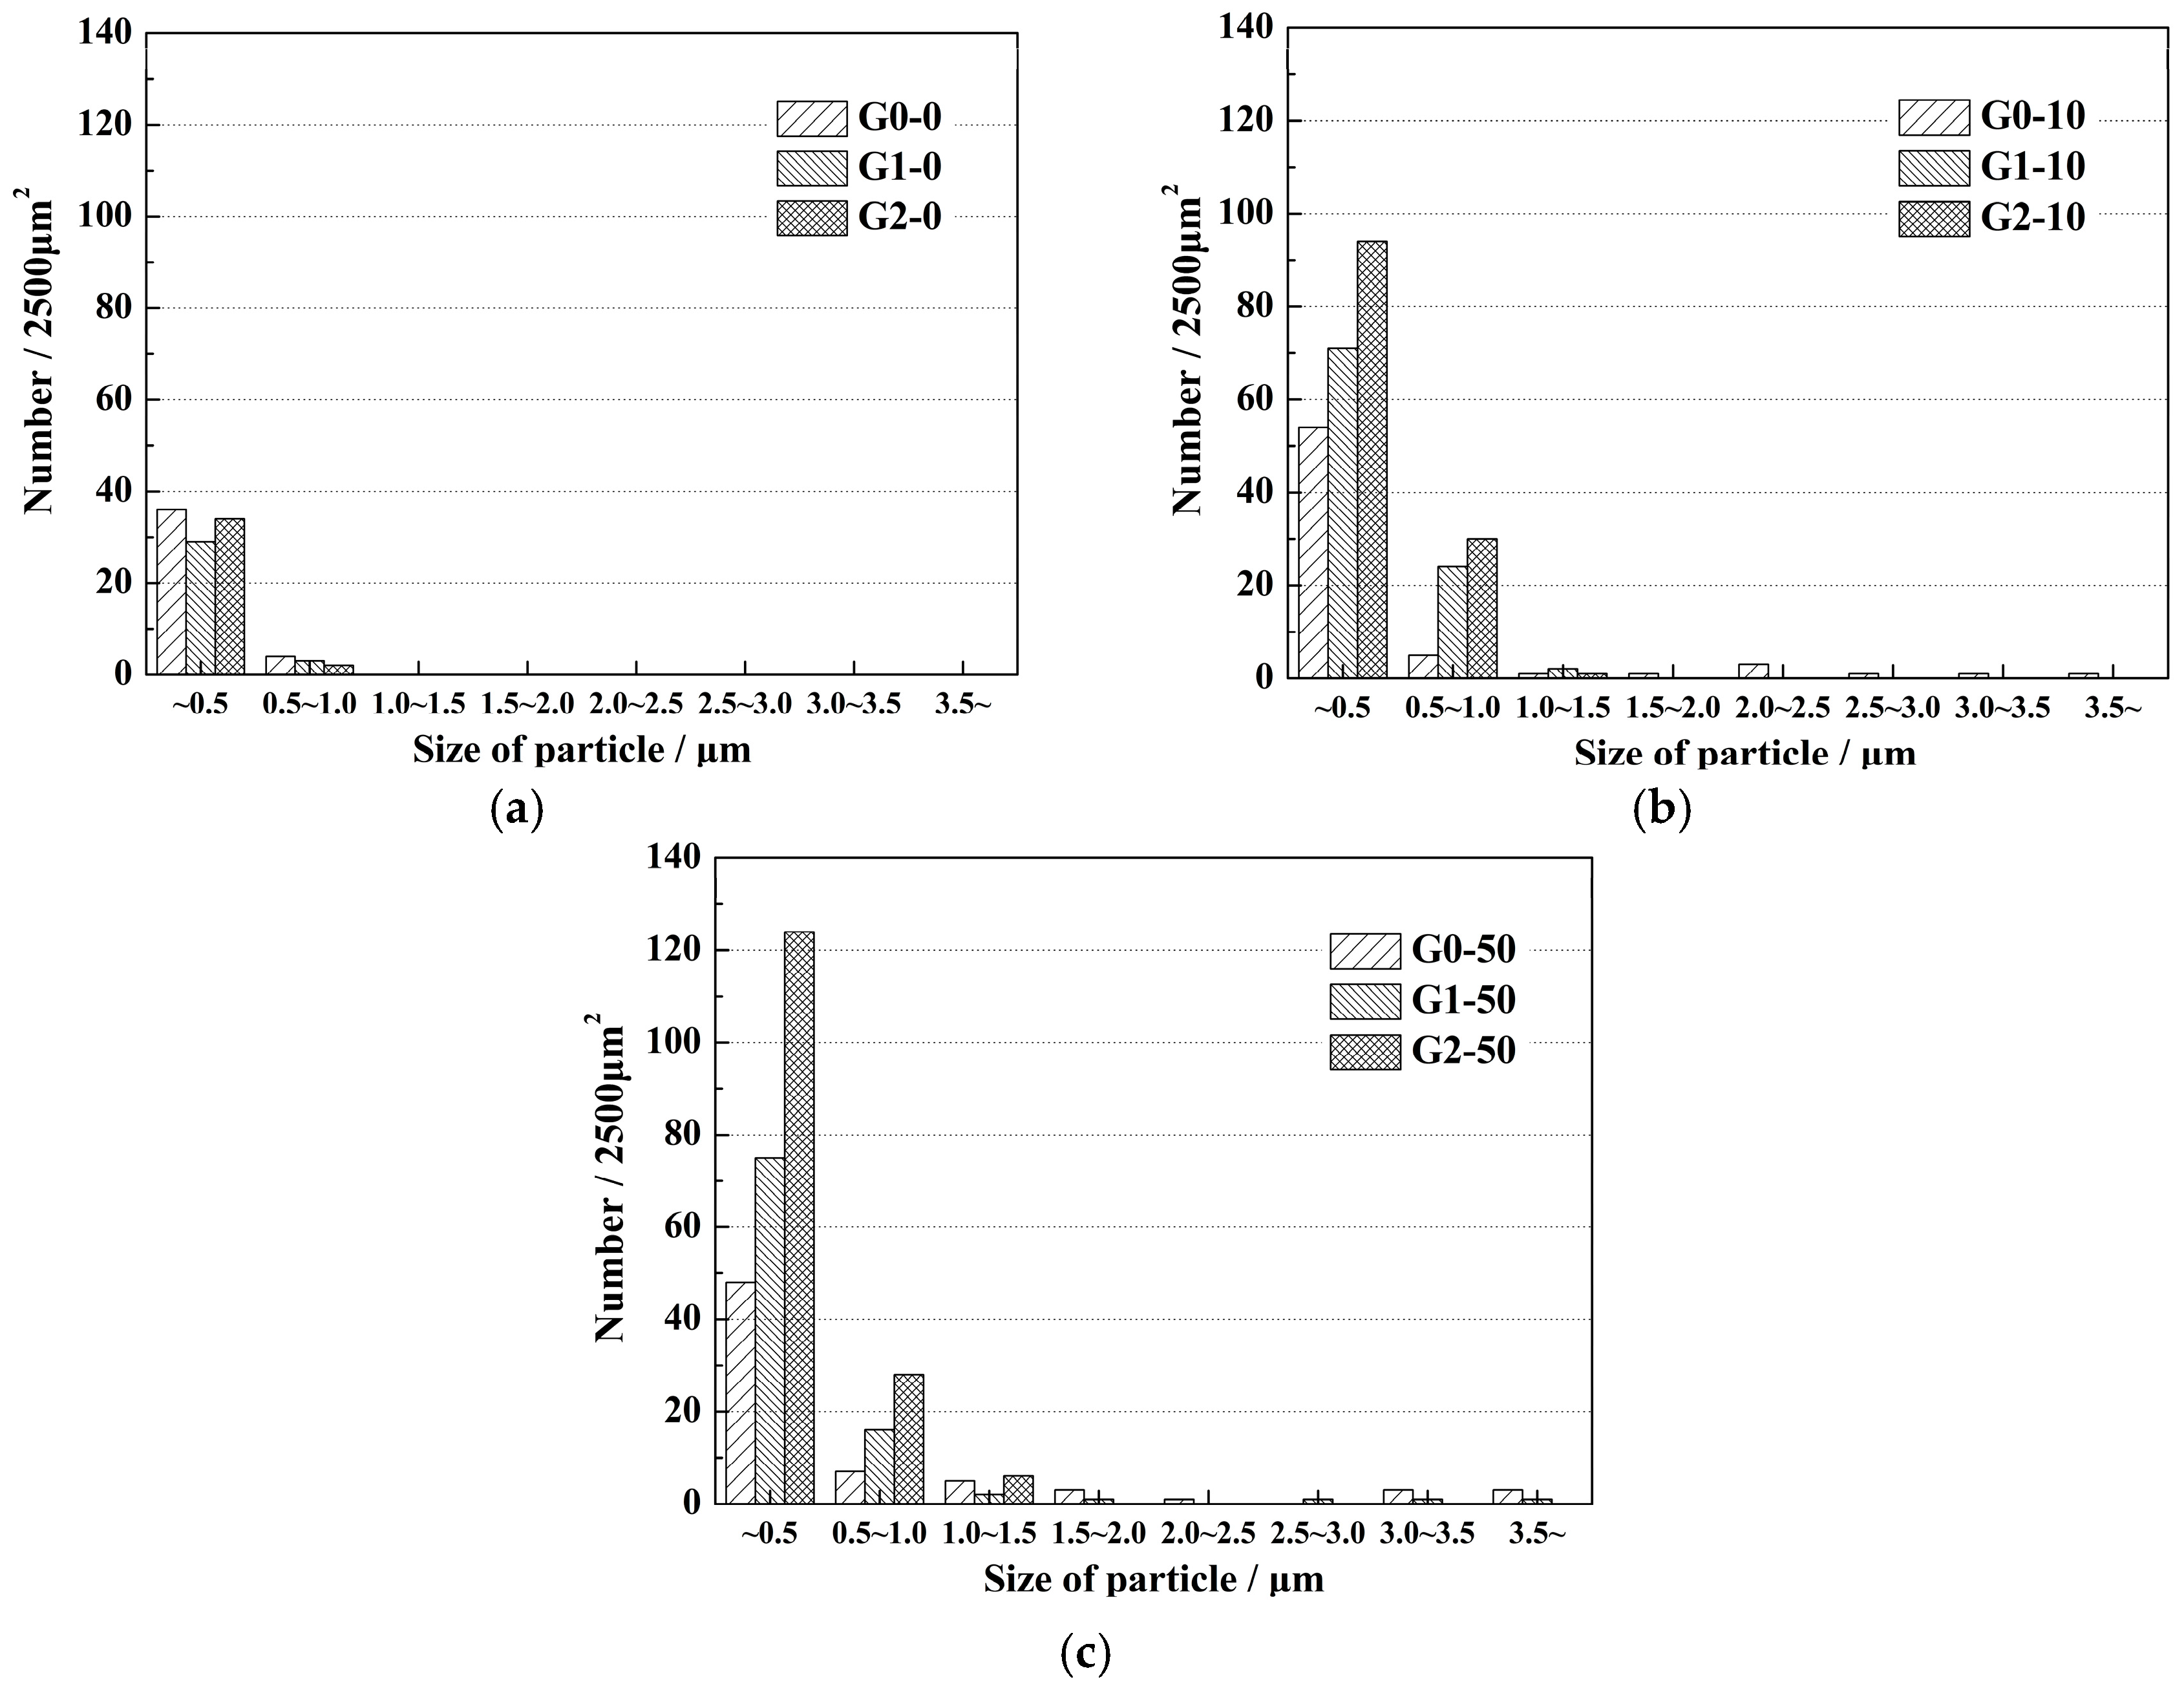
Figure 13.
Effect of the original FeO content in the oxide on the Gibbs energy change of the I-type and II-type reactions during heat treatment at 1473 K.
Figure 13.
Effect of the original FeO content in the oxide on the Gibbs energy change of the I-type and II-type reactions during heat treatment at 1473 K.

Figure 14.
Mechanism of the solid-state reaction at the interface between the Fe–Al–Ca alloy and Al2O3–CaO–FeO oxide in diffusion couples G0, G1, and G2: (a) G0 and G1; (b) G2.
Figure 14.
Mechanism of the solid-state reaction at the interface between the Fe–Al–Ca alloy and Al2O3–CaO–FeO oxide in diffusion couples G0, G1, and G2: (a) G0 and G1; (b) G2.
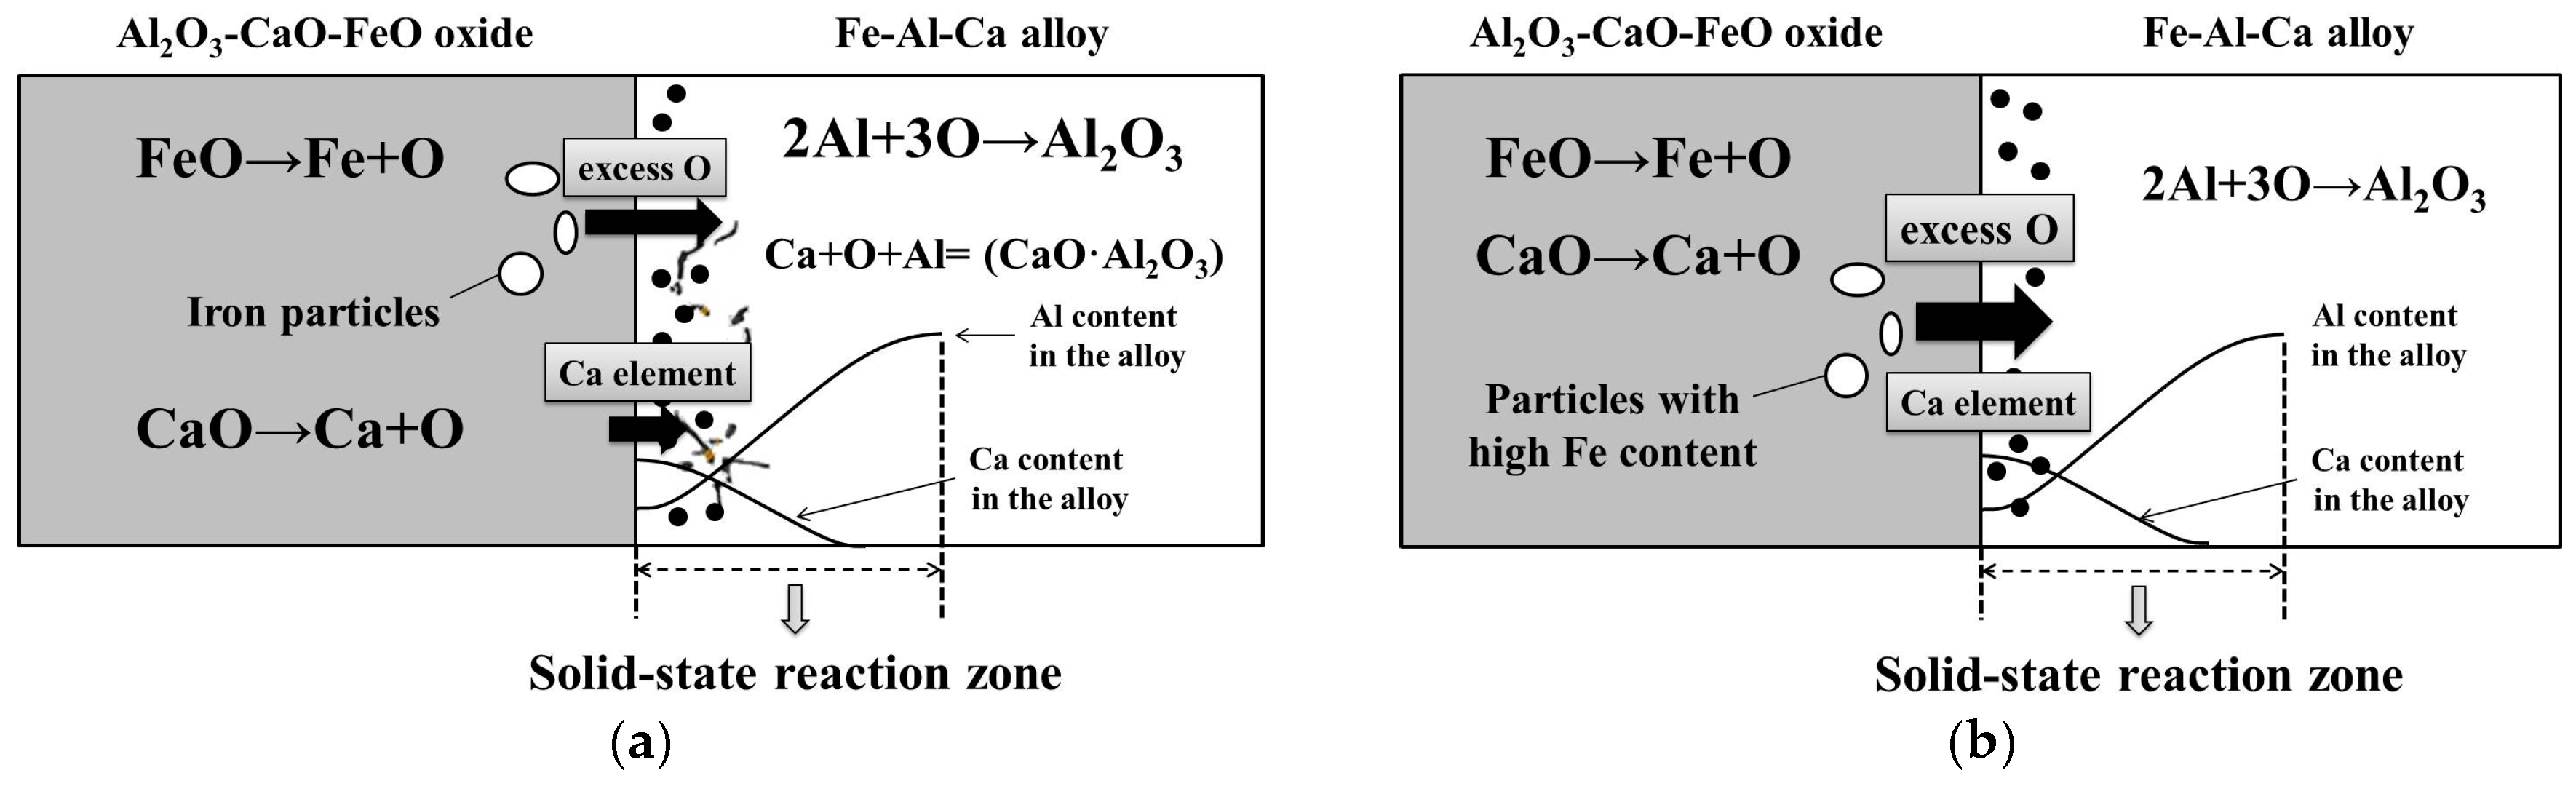
Figure 15.
FeO content in the oxide near the interface varying with heat treatment time.

Figure 16.
Change of PPZ width with heat treatment time and FeO content in diffusion couple G0, G1, and G2 before and after heat treatment in the experiment and calculation model.
Figure 16.
Change of PPZ width with heat treatment time and FeO content in diffusion couple G0, G1, and G2 before and after heat treatment in the experiment and calculation model.

Table 1.
Initial compositions of the Fe–Al–Ca alloy and Al2O3–CaO–FeO oxide used in the heat treatment experiment at 1473 K.
Table 1.
Initial compositions of the Fe–Al–Ca alloy and Al2O3–CaO–FeO oxide used in the heat treatment experiment at 1473 K.
| Diffusion Couple | Fe–Al–Ca Alloy | Al2O3–CaO–FeO Oxide | PO2/Pa | ||||
|---|---|---|---|---|---|---|---|
| Fe | Al | Ca | Al2O3 | CaO | FeO | ||
| G0 (Equilibrium) | Bal. | 0.4 | 0.004 | 51.26 | 48.24 | 0.5 | 1.4 × 10⁻¹³ |
| G1 | 51 | 48 | 1.0 | ||||
| G2 | 50 | 47 | 3.0 | ||||
© 2017 by the authors. Licensee MDPI, Basel, Switzerland. This article is an open access article distributed under the terms and conditions of the Creative Commons Attribution (CC BY) license (http://creativecommons.org/licenses/by/4.0/).
Share and Cite
MDPI and ACS Style
Liu, C.; Yang, S.; Li, J.; Ni, H.; Zhang, X. The Influence of FeO on the Reaction between Fe–Al–Ca Alloy and Al2O3–CaO–FeO Oxide during Heat Treatment at 1473 K. Metals 2017, 7, 129. https://doi.org/10.3390/met7040129
AMA Style
Liu C, Yang S, Li J, Ni H, Zhang X. The Influence of FeO on the Reaction between Fe–Al–Ca Alloy and Al2O3–CaO–FeO Oxide during Heat Treatment at 1473 K. Metals. 2017; 7(4):129. https://doi.org/10.3390/met7040129
Chicago/Turabian StyleLiu, Chengsong, Shufeng Yang, Jingshe Li, Hongwei Ni, and Xueliang Zhang. 2017. "The Influence of FeO on the Reaction between Fe–Al–Ca Alloy and Al2O3–CaO–FeO Oxide during Heat Treatment at 1473 K" Metals 7, no. 4: 129. https://doi.org/10.3390/met7040129
Note that from the first issue of 2016, this journal uses article numbers instead of page numbers. See further details here.