Article

Microstructure, Texture Evolution and Mechanical Properties of VT3-1 Titanium Alloy Processed by Multi-Pass Drawing and Subsequent Isothermal Annealing

1
Institute of Metal Research, Chinese Academy of Sciences, 72 Wenhua Road, Shenyang 110016, China
2
Institute of Metal Research, University of Chinese Academy of Sciences, Beijing 100049, China
3
School of Engineering, Edith Cowan University, 270 Joondalup Drive, Joondalup, Perth, WA 6027, Australia
*
Authors to whom correspondence should be addressed.
Metals 2017, 7(4), 131; https://doi.org/10.3390/met7040131
Submission received: 22 March 2017 / Revised: 31 March 2017 / Accepted: 3 April 2017 / Published: 10 April 2017

Abstract

:
Microstructure, texture evolution, and mechanical properties of Ti–6Al–1.5Cr–2.5Mo–0.5Fe–0.3Si (VT3-1) titanium alloy processed by multi-pass drawing and subsequent isothermal annealing were systematically investigated. A fiber-like microstructure is formed after warm drawing at 760 °C with 60% area reduction. After isothermal annealing, the samples deformed to different amounts of area reduction show a similar volume fraction (80%) of α phase, while the sample deformed to 60% exhibits a homogeneous microstructure with a larger grain size (5.8 μm). The major texture component of α phase developed during warm drawing is centered at a position of {φ1 = 10°, φ = 65°, φ2 = 0°}. The textures for annealed samples are almost along the orientation of original deformation textures and show significant increases in orientation density and volume fraction compared with their deformed states. In addition, for the drawn samples, the ultimate tensile strength increases but the ductility decreases with increasing drawing deformation. A negative slope of yield strength of annealed samples versus grain size (d−1/2) is found due to the difference between texture softening for as-rolled + annealed state and texture hardening for drawn + annealed state. The mechanical properties of annealed samples are found to be strongly dependent on grain size and texture, resulting in the balance of the strength and ductility.

Graphical Abstract

1. Introduction

Titanium alloys have been used in the aircraft industry and marine engineering due to their high strength-to-weight ratio, good ductility, excellent fatigue properties, and corrosion resistance. In particular, two-phase titanium alloys are widely used as structural materials owing to their high strength and adequate ductility [1,2,3,4]. Among them, the Ti–6Al–1.5Cr–2.5Mo–0.5Fe–0.3Si alloy (known as VT3-1) is a typical two-phase titanium alloy, mainly used for gas turbine blades and fasteners owing to the balance of strength and ductility, toughness, and temperature capability up to 400–450 °C [5,6].
In general, α and α + β titanium alloys, as well as other hexagonal close-packed (HCP) metals such as magnesium alloys [7], exhibit distinct textures and a pronounced anisotropy in mechanical properties as a result of the inherent deformation mechanism of the hexagonal crystal structure [8,9,10,11,12,13,14]. It was reported that there exists a cluster of α phases with sharp local texture called macrozones in semi-finished products such as billets [15,16]. It was also revealed that the evolution of microstructure and crystallographic texture are associated with primary recrystallization in titanium alloys [1,17,18]. So, in principle, thermo-mechanical processing routes determine the types of texture components together with the microstructures. Although a series of systematical studies have been performed on the texture of titanium alloys in the process of deformation and post-deformation heat treatment [19,20,21,22,23,24,25], limited literature is available on texture evolution of VT3-1 titanium alloys fabricated by multi-pass warm drawing and subsequent isothermal annealing.
To achieve the desired mechanical properties of bar materials, a comprehensive understanding of the relationship between microstructure, texture, and mechanical properties during drawing and subsequent heat treatment is needed. In particular, an extra opportunity of designing the properties of titanium alloys may be offered by understanding and manipulating various microstructures and crystallographic textures. In this work, the microstructure and texture evolution of VT3-1 titanium alloy during multi-pass warm drawing and subsequent isothermal annealing were systematically investigated. Furthermore, the influences of the microstructures and textures of deformation/recrystallization on its mechanical properties were also discussed.

2. Materials and Methods

The material used for the current study was a commercial Ti–6Al–1.5Cr–2.5Mo–0.5Fe–0.3Si (VT3-1) alloy with a chemical composition composed of 5.98% Al, 1.48% Cr, 2.57% Mo, 0.52% Fe, 0.30% Si, and Ti balance (wt %). The β transus temperature measured by the metallographic method was ~965 °C. When this alloy was heated at 960 °C for 1 h followed by water quenching, its microstructure was composed of martensite and a small amount of primary α phase; yet when this alloy was treated at 970 °C for 1 h followed by water quenching, its microstructure was only composed of martensite. The received rolled bar of 25 mm diameter was drawn to 16 mm in diameter at 760 °C (in the α + β phase field) by 11 passes. The accumulated strain during warm drawing was calculated by:
ε = ln(D0/D1)2
where D0 was the initial diameter of bar and D1 was the diameter after drawing. Three groups of bars with different area reductions of 0%, ~30%, and ~60% were selected to examine the microstructure and texture. The details of the bars are listed in Table 1. Furthermore, all drawn samples were treated at 880 °C for 2 h followed by furnace cooling to 650 °C, and then isothermally held for 2 h followed by air cooling to room temperature. Three isothermally annealed (IA) groups were selected and hereafter named as follows: as-received + IA bar, 30% warm-drawn + IA bar and 60% warm-drawn + IA bar.
In order to eliminate the effect of heterogeneity of the edge region caused by the drawing process [26,27], all the tested samples were obtained from the center of the bar, as schematically outlined in Figure 1.
The microstructural characterizations were carried out using a Shimadzu SSX-550 scanning electron microscope (SEM) (Shimadzu Corporation, Tokyo, Japan). The specimens used for microstructure observation were grinded with SiC papers up to 2000 grits, polished with SiO2 emulsion and finally etched for 8 s in a solution of 5% HF, 10% HNO3, and 85% water. The mean grain size of the primary α phase was measured using the linear intercept method and the volume fraction of the α phase was estimated using image analysis from SEM images [28,29]. A D8 Discover X-ray diffractometer (XRD) with Cu K-α radiation (Bruker AXS GmbH, Karlsruhe, Germany) was used to examine the phase components and characterize the macrotexture. The specimens used for the XRD experiments were grinded with SiC papers up to 1500 grits and polished with SiO2 emulsion. The (10 1 ¯ 0), (0002), and (10 1 ¯ 1) incomplete pole figures of the α phase (c/a = 1.587) were measured first. The texture analysis was carried out with the TEXEval V2.0 software package (Bruker AXS GmbH, Karlsruhe, Germany, 2000). Then, the inverse pole figures (IPFs) were calculated based on an assumption, namely, geometric symmetry was indexed in the orthorhombic mmm system. The orientation distribution functions (ODFs) with the Bunge system (φ1–φ–φ2) were calculated by using the harmonic method [30]. The tensile specimens had a gauge diameter of 10 mm and a gauge length of 60 mm according to the standard of ISO 6892-1:2009. The tensile axis was parallel to the drawing direction. Room temperature tensile tests were performed at a constant cross-head speed of 1 mm/min on a SANS-CMT 5205 testing machine (MTS Systems Corporation, Shenzhen, China). The strain rate of tensile specimens was 0.00028 s1.

3. Results and Discussion

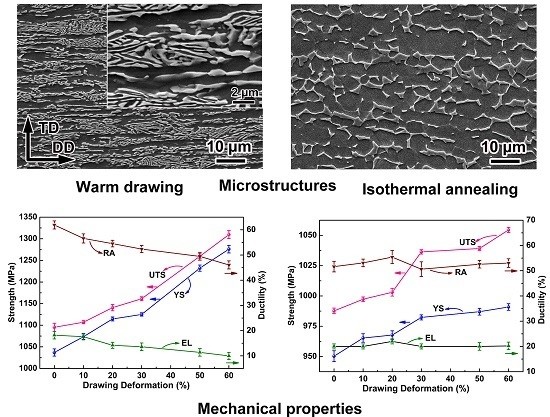
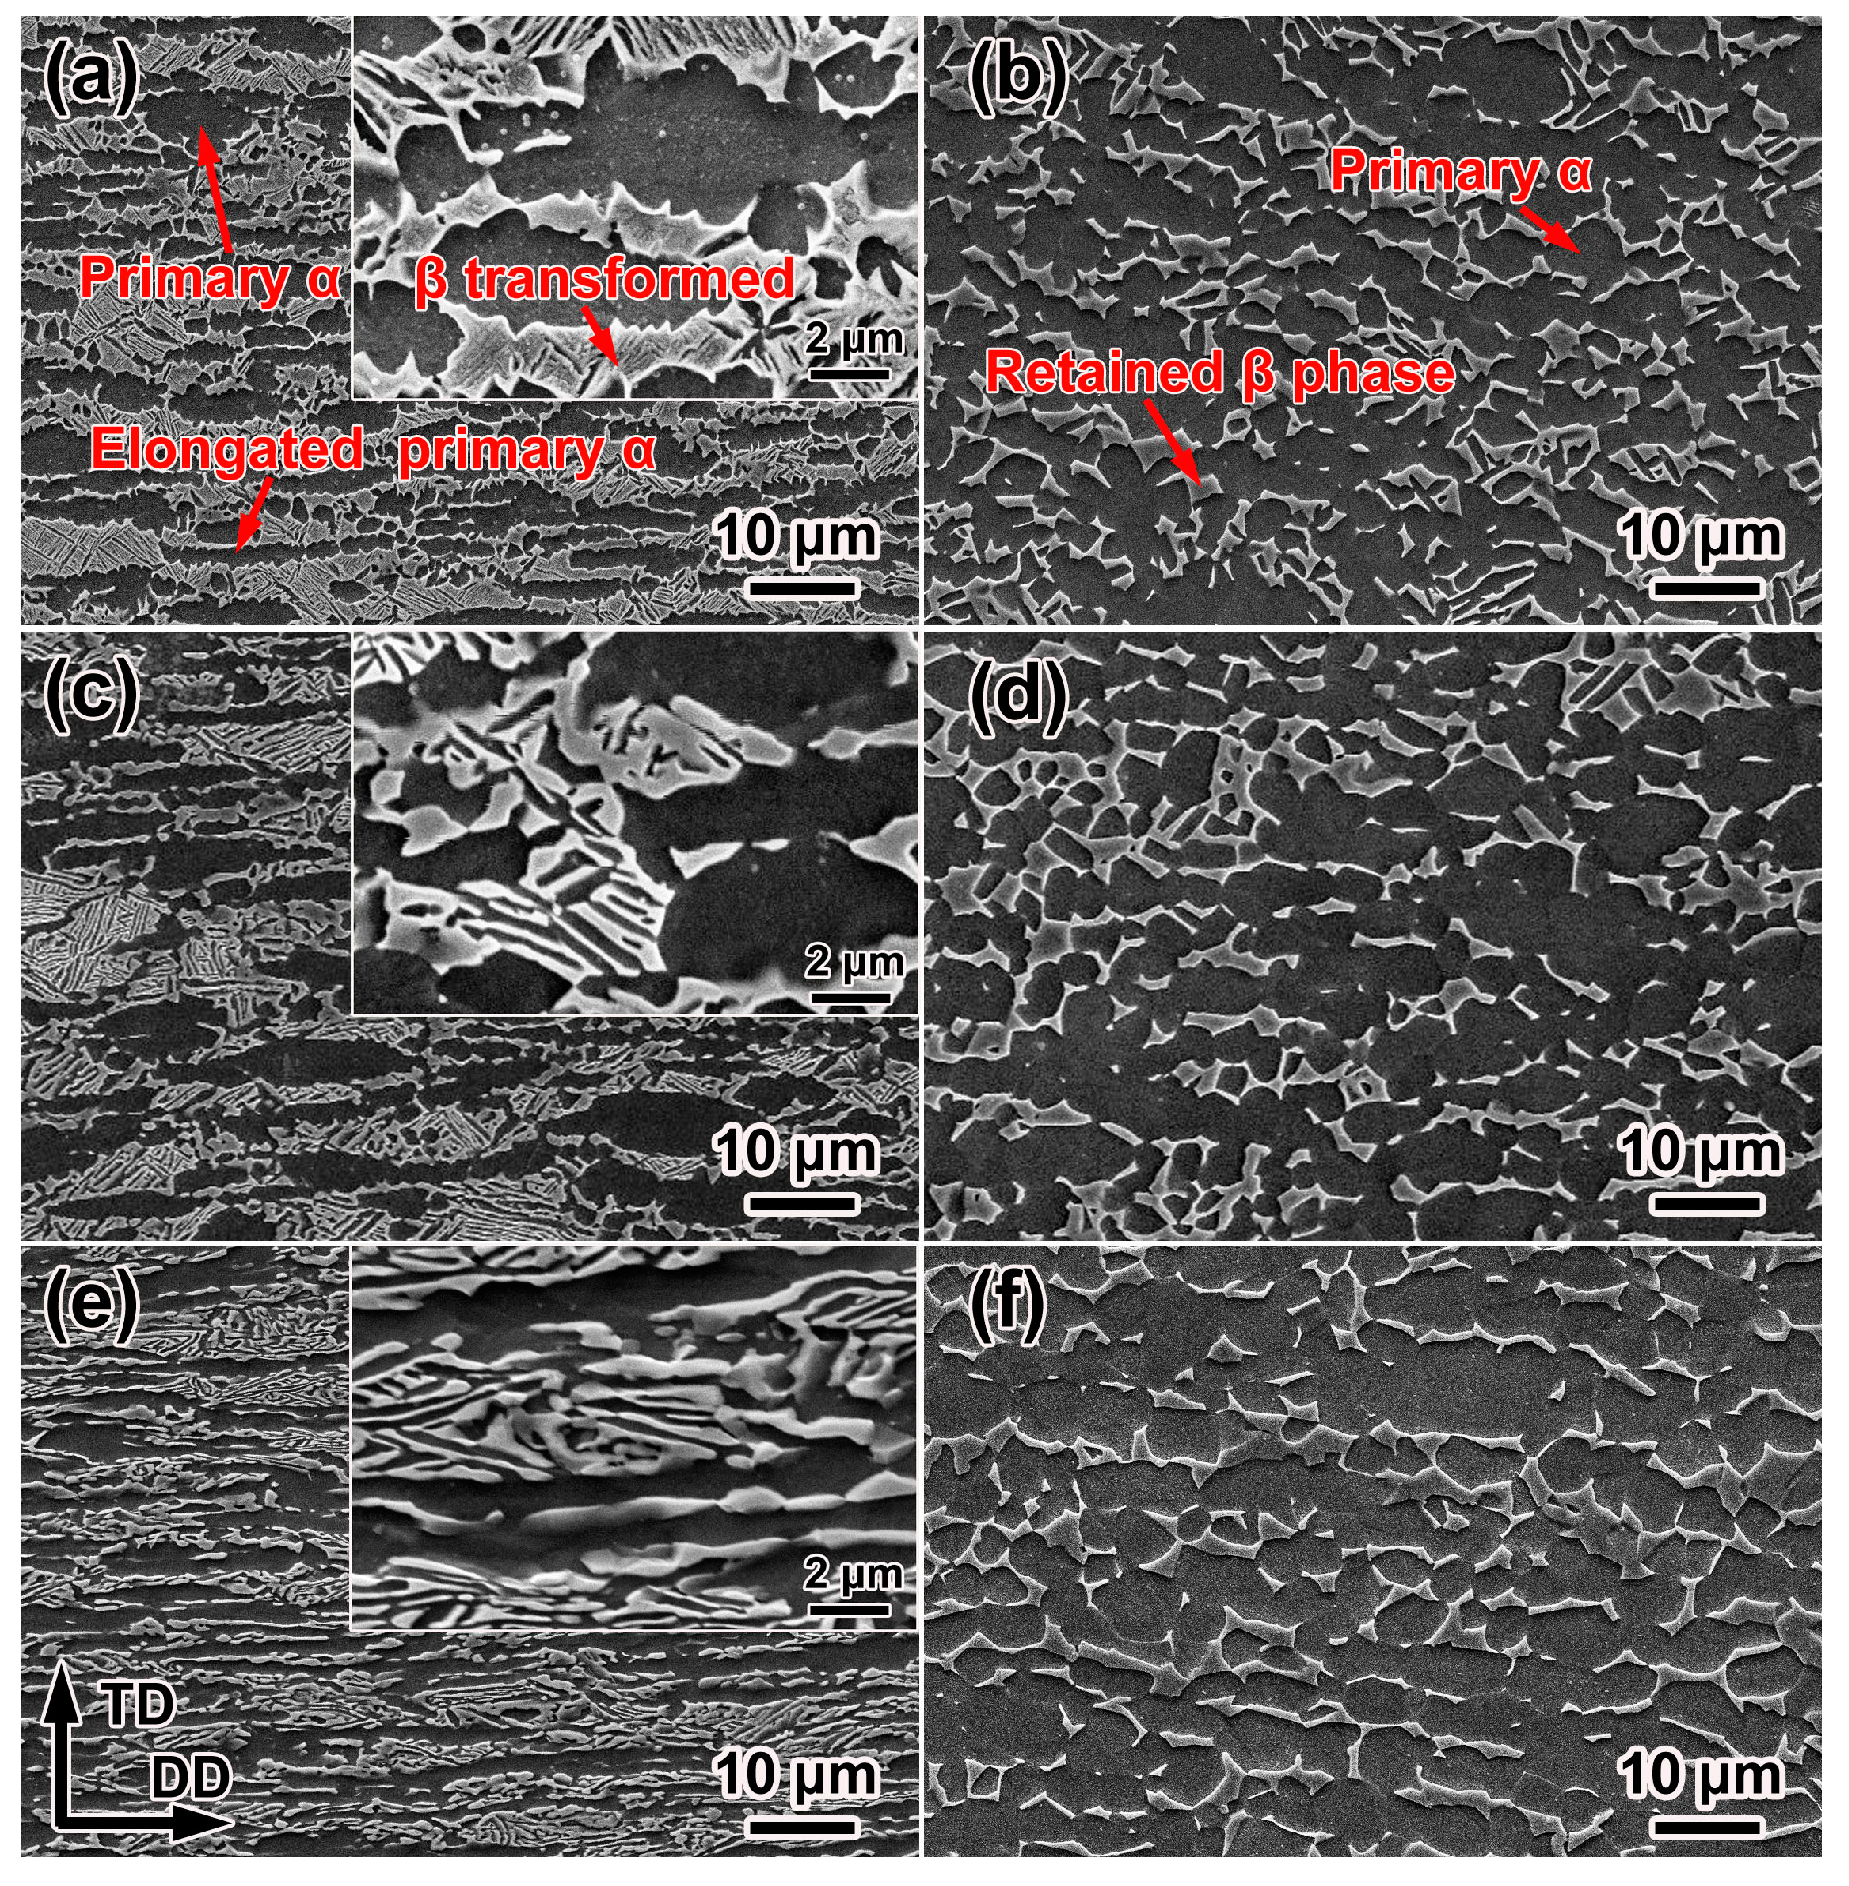
3.1. Microstructure Characteristics

Figure 2 compares the SEM micrographs of VT3-1 alloy after warm drawing and isothermal annealing. Figure 2a,c,e show the microstructures of as-received, 30%, and 60% warm-drawn samples, respectively, and their corresponding microstructures of IA states are shown in Figure 2b,d,f, respectively. The as-received sample contains elongated primary α, equiaxed primary α, and β transformed microstructures (Figure 2a). The α grains are gradually elongated with increasing drawing ratio (Figure 2c) and they are almost deformed into a fiber-like microstructure after 60% drawing deformation (Figure 2e). The mean primary α grain sizes (along the transverse direction (TD)) of as-received, 30%, and 60% warm-drawn samples are 3.7, 2.9, and 1.9 μm, respectively, and their corresponding length/width ratios are 2.2, 5.8, and 15.2, respectively. Moreover, the morphology of secondary α phase in the β transformed microstructure changes from acicular shape to platelet shape (Figure 2a,c,e). Simultaneously, the volume fraction of the total α phase is ~55% for the as-received sample and increases up to ~68% for the 30% warm-drawn sample, then grows slowly to ~70% for the 60% warm-drawn sample. These microstructural changes can be attributed to the drawing deformation and the β → α phase transformation.
After isothermal annealing, the mean primary α grain sizes (along TD) of 0%, 30%, and 60% warm-drawn samples are 4.6, 5.1, and 5.8 μm, respectively, and the volume fraction of the primary α phase in all these samples is maintained as ~80%, as shown in Figure 2b,d,f. The retained β phase is distributed mostly in the α grain boundaries and grain triple points, but the globularization process of the secondary α phase is not yet complete for the as-received + IA sample. Furthermore, the microstructure becomes more homogeneous with increasing drawing deformation. The differences in microstructure for IA samples drawn to different deformations are attributed to the changes in crystal defect and strain energy which can promote the recrystallization and growth of grains during subsequent heat treatment.

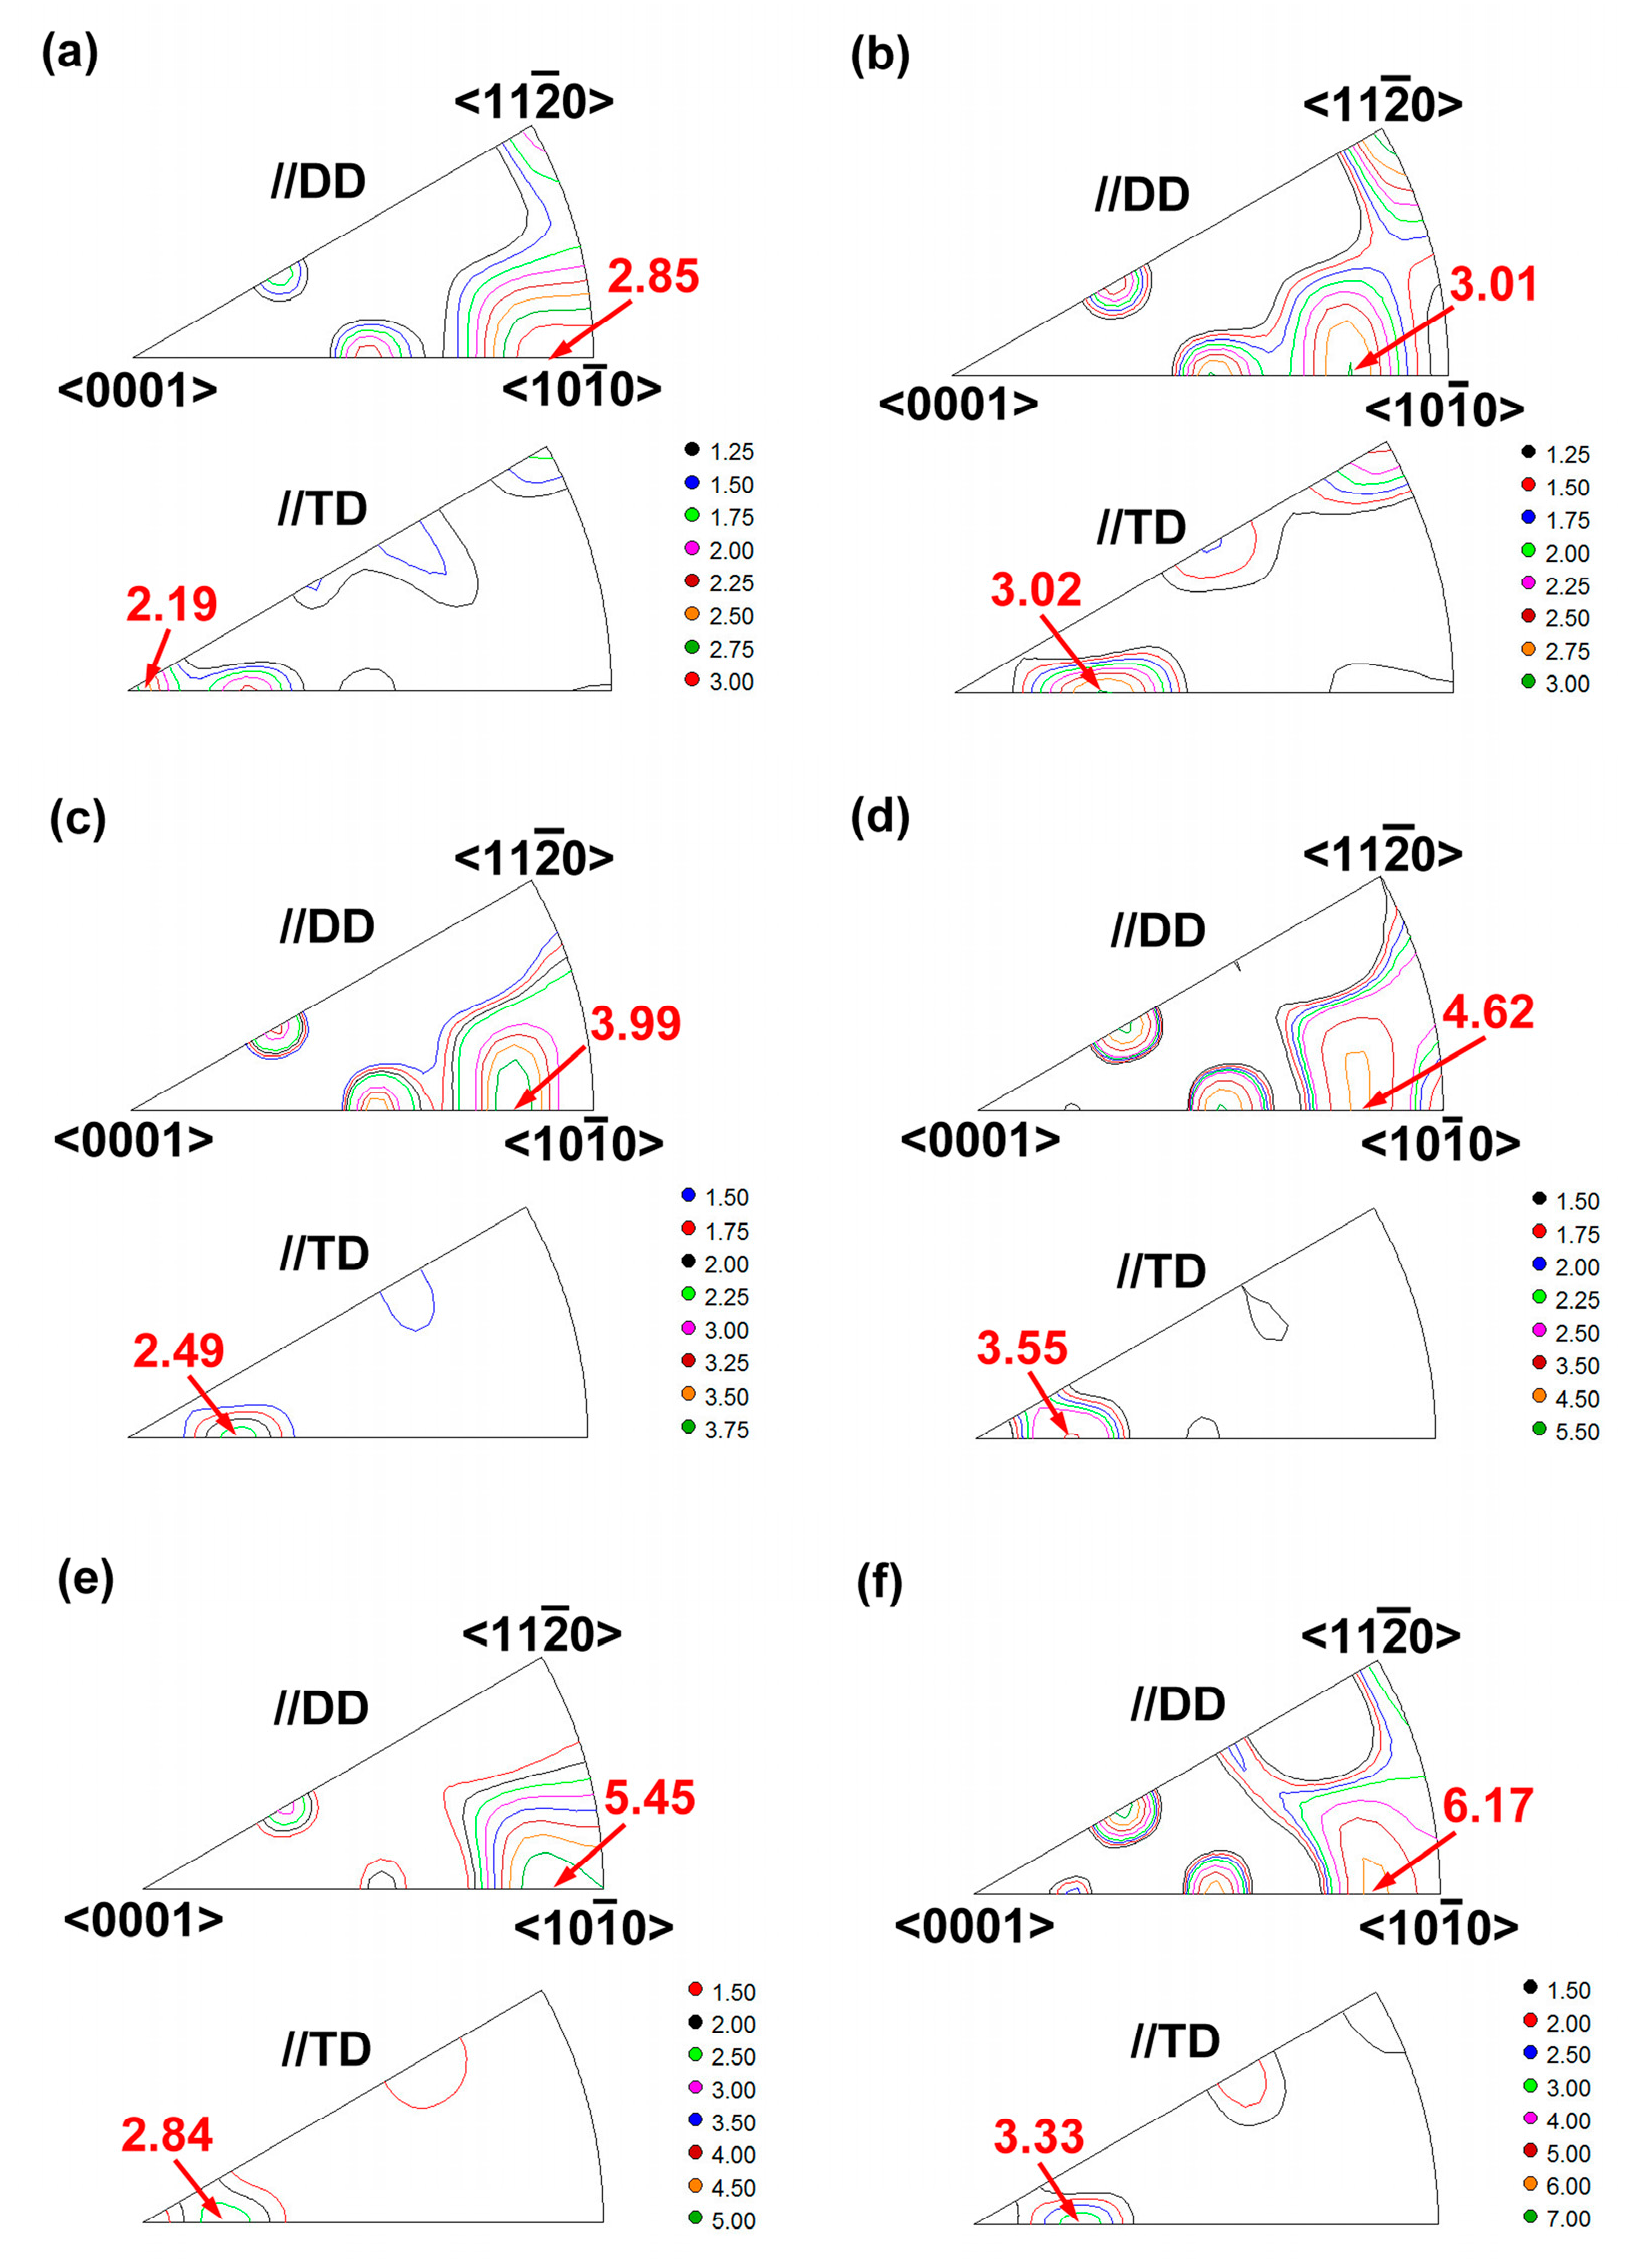
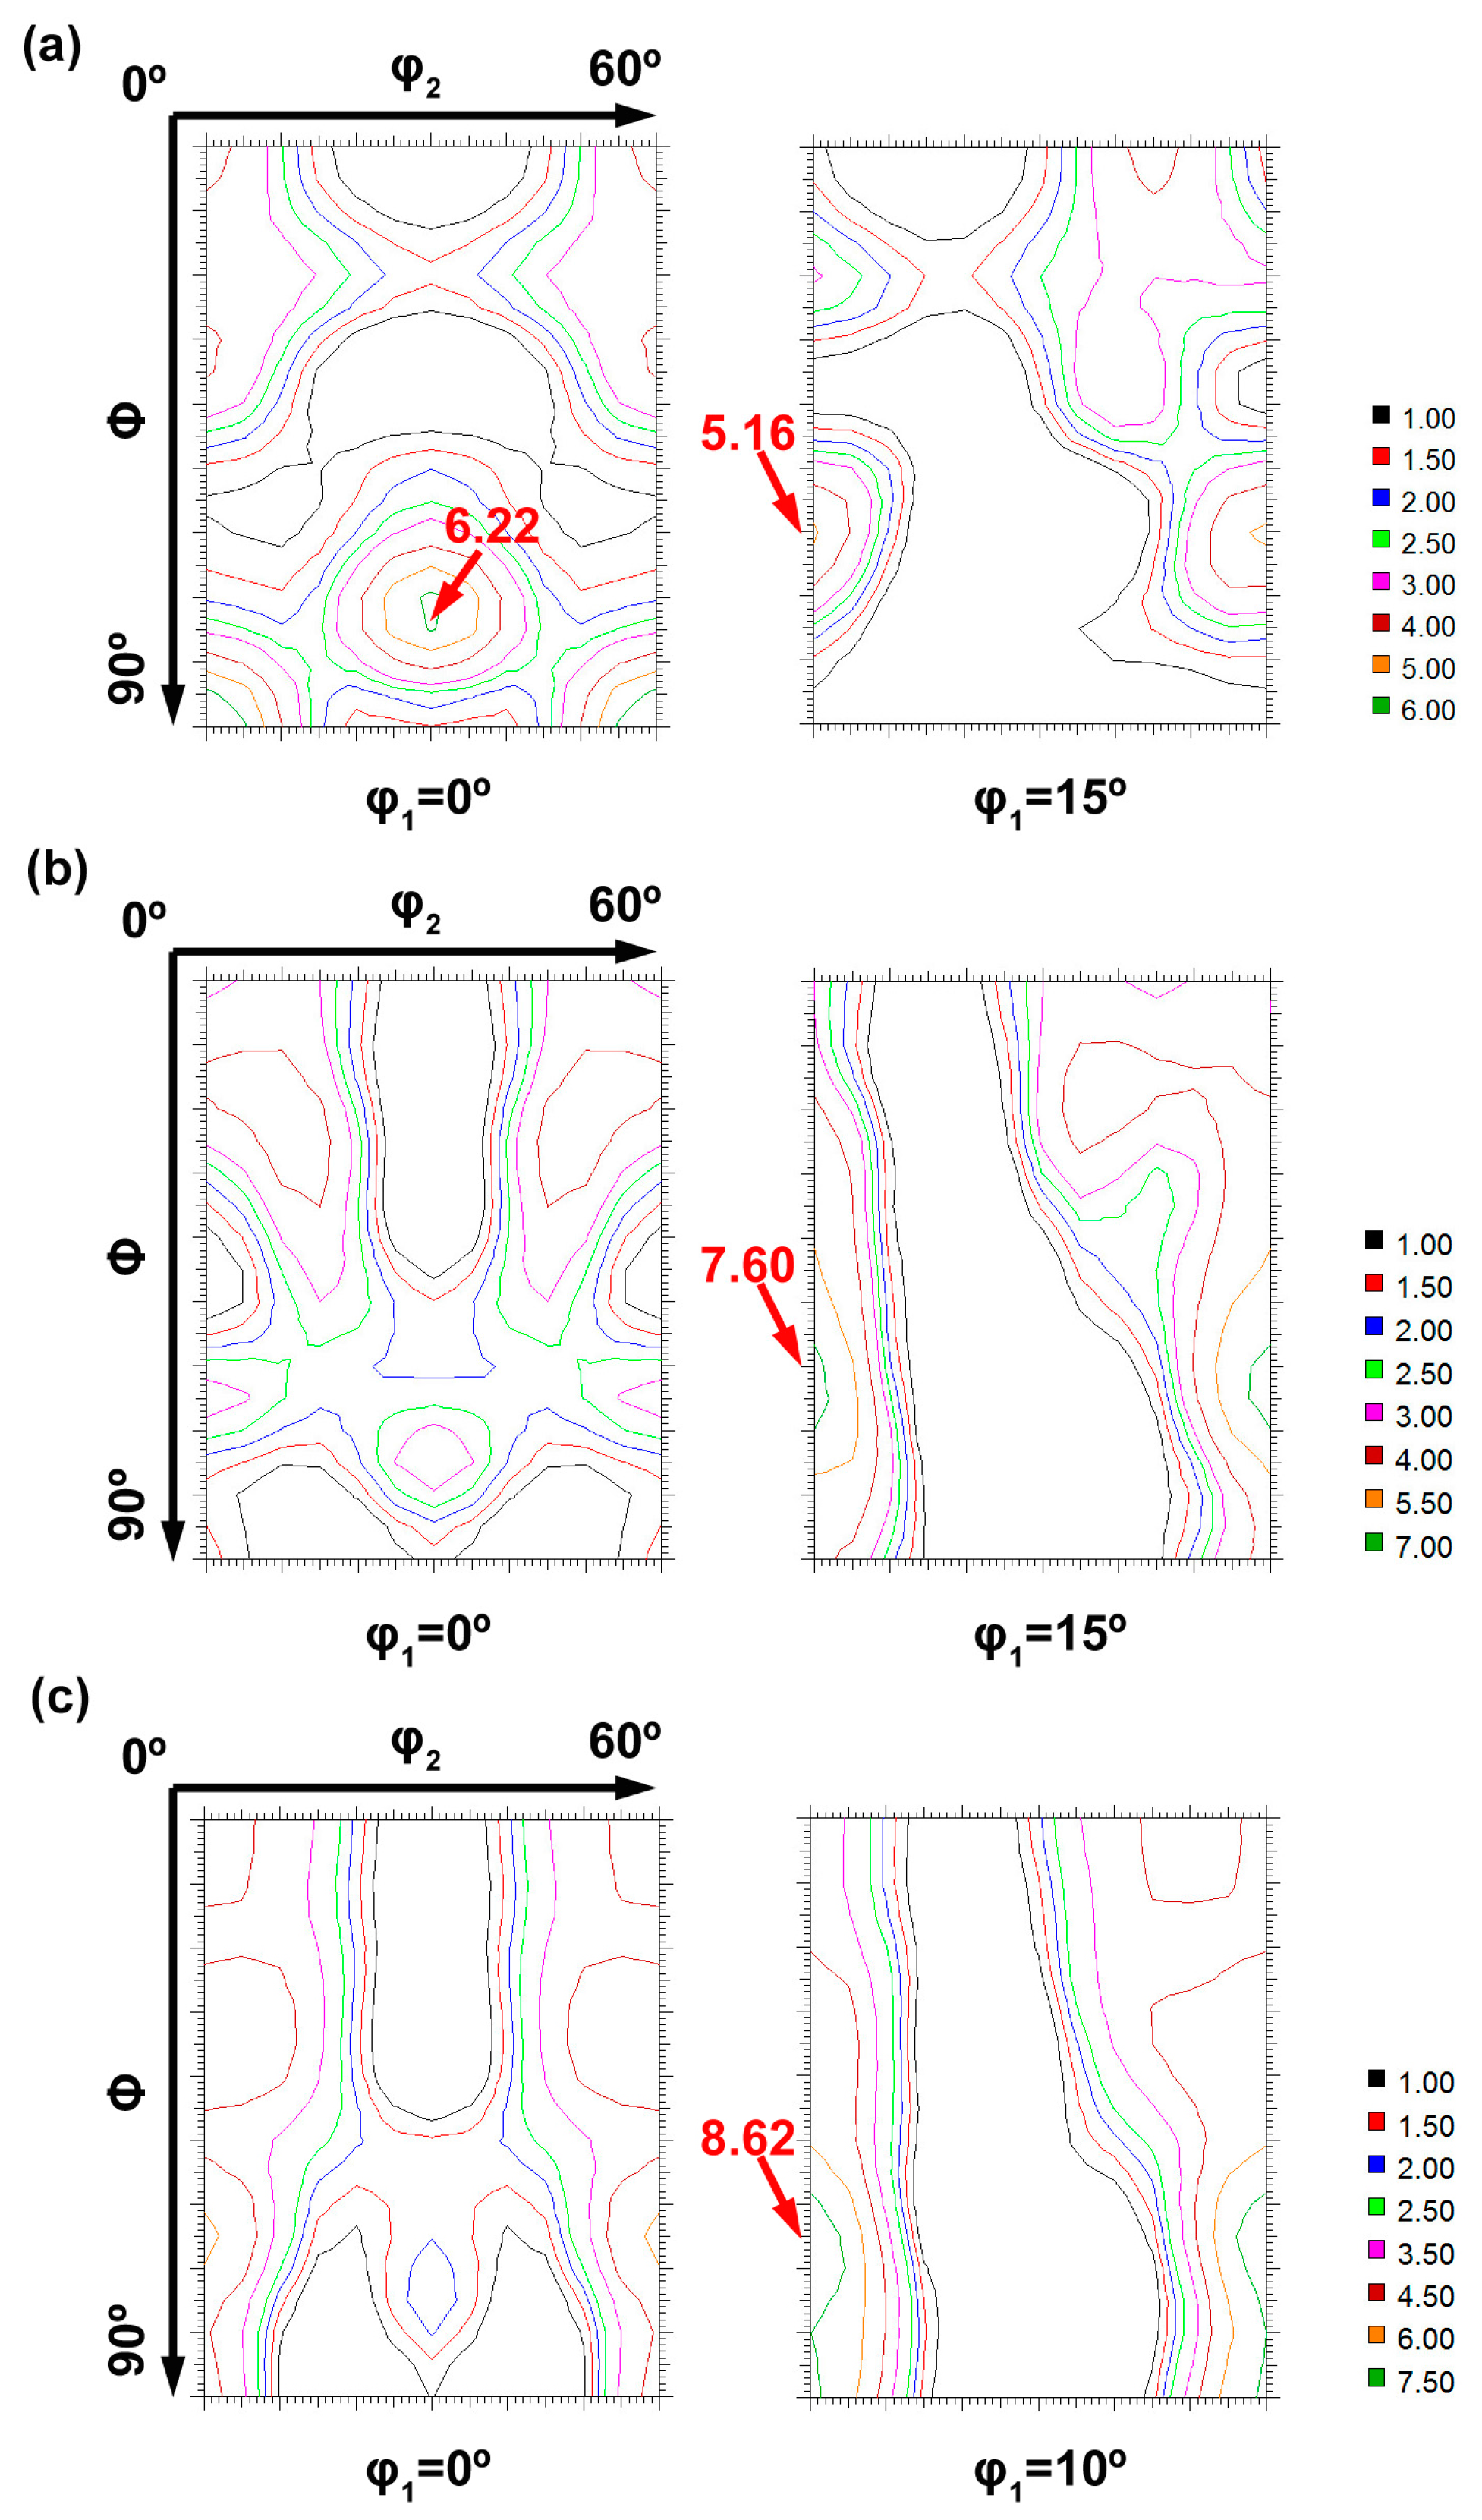
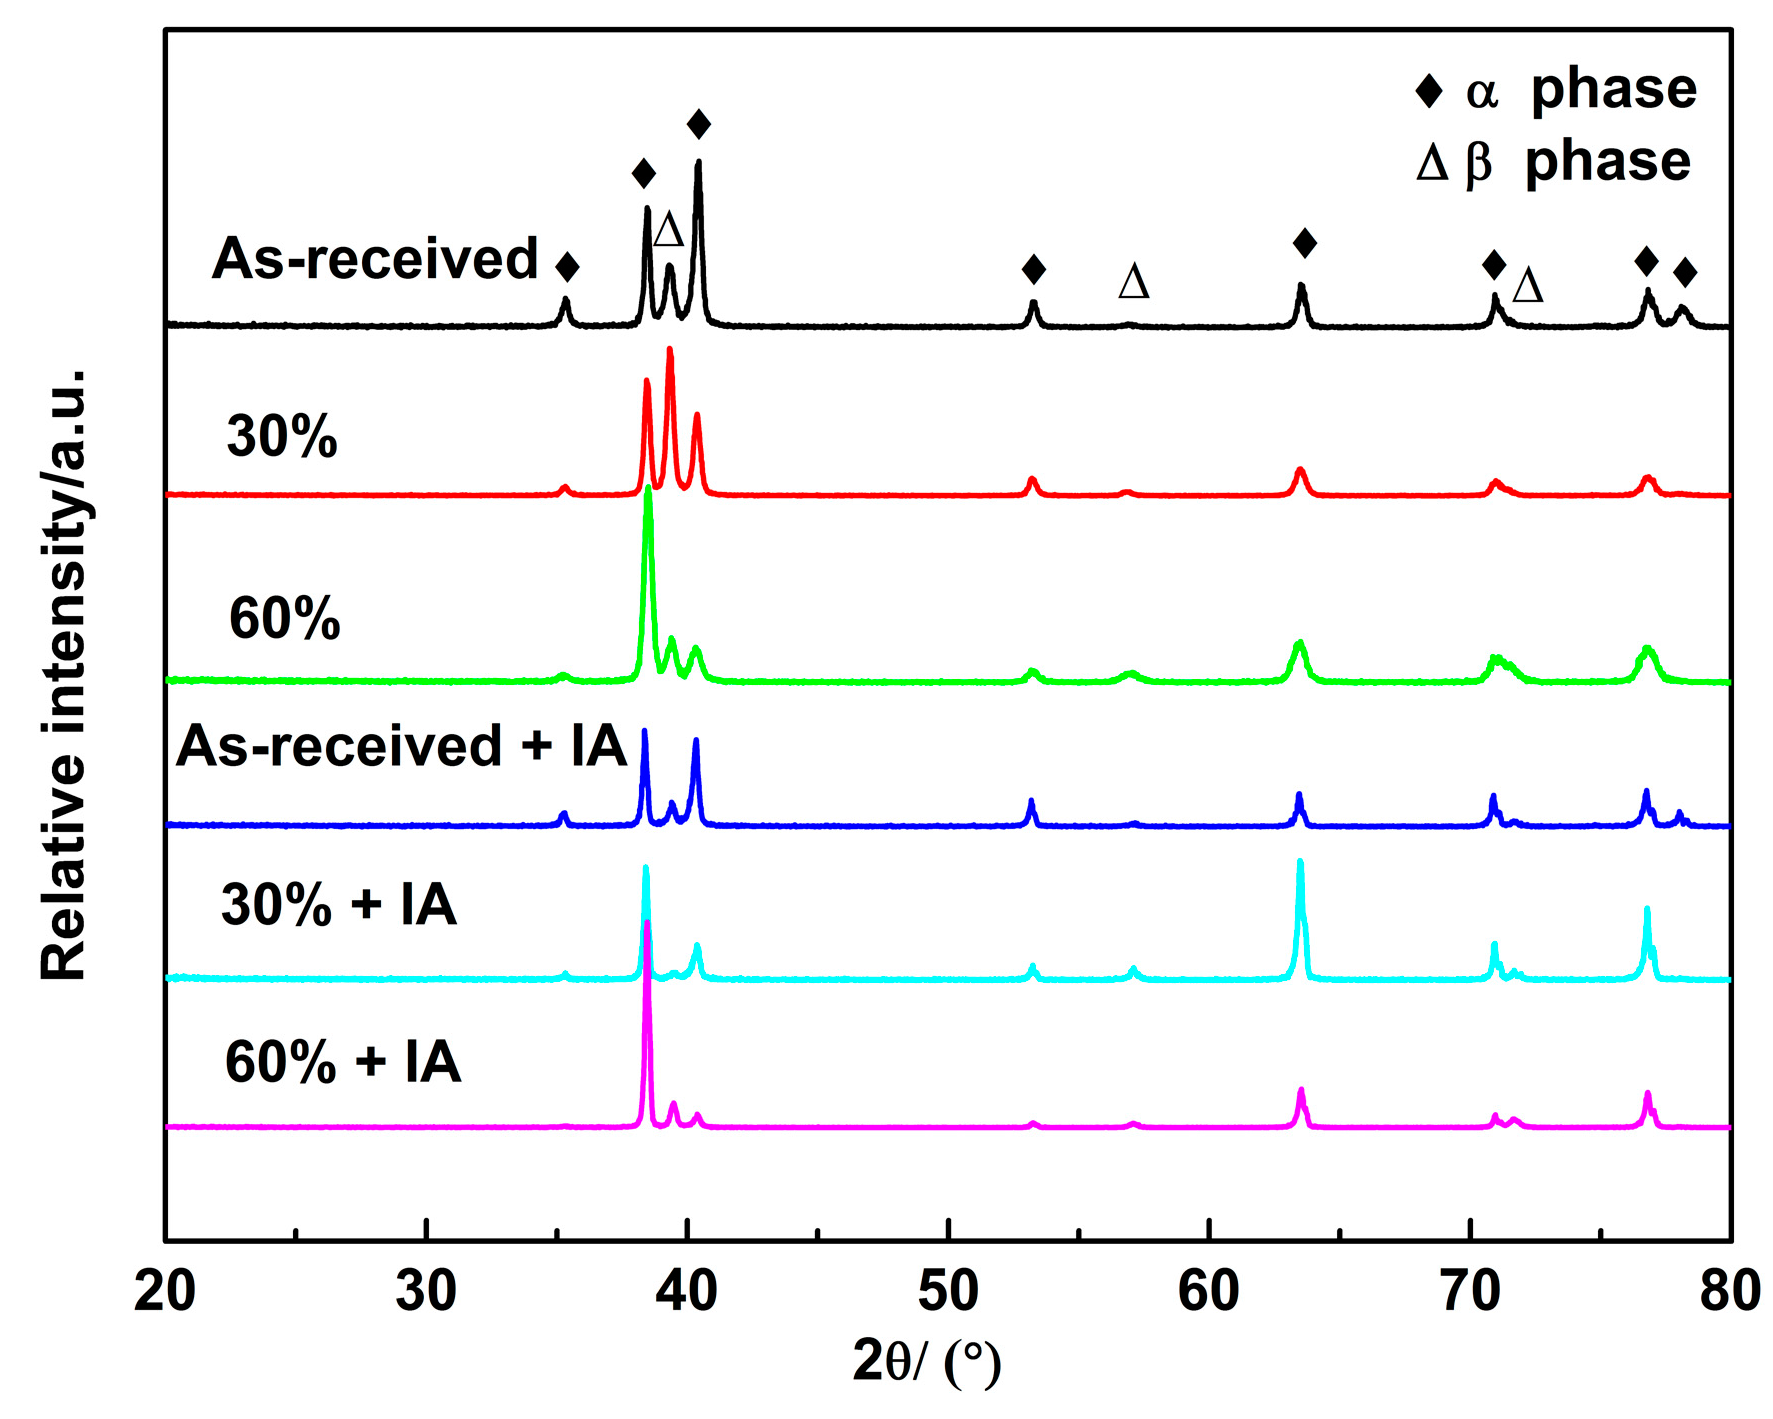
3.2. X-ray Diffraction (XRD) and Texture Analysis

Figure 3 depicts the XRD patterns of VT3-1 alloy under different processing conditions. It can be seen that all samples are composed of α and β phases. Due to the low intensity of β phase peaks and their positions being close to α phase peaks, it was difficult to record pole figures (PFs) of β phase, and, thus, only the texture of α phase was studied in this work.
In order to examine the complete macrotexture features of the α phase (primary α phase and secondary α phase), IPFs and ODFs were obtained and presented. For a bar material, the fiber texture can be characterized by means of IPFs, namely the distributions of the crystal orientation relative to drawing direction (DD) and transverse direction (TD) [31]. The main textures usually can be seen in the first section (φ1 = 0°) of the ODF for titanium alloys [17], and, thus, the first section as well as relevant sections containing the maximum of the ODF are presented to describe the texture clearly.
Figure 4 presents the IPFs of the alloy after warm drawing and isothermal annealing. For the as-received state (Figure 4a), crystallographic directions of <10 1 ¯ 0> and <11 2 ¯ 0> are most likely parallel to the DD, and the <10 1 ¯ 0>//DD pair with an intensity of 2.85 is the main component. Meanwhile, the observed pair for the TD is <0001>//TD (i.e., crystallographic c-axis//TD) with an intensity of 2.19. Similar orientations can be observed in 30% (Figure 4c) and 60% (Figure 4e) warm-drawn samples, but with the following differences. First, the intensity of the <10 1 ¯ 0>//DD pair is increasing and crystals are tilted from the <11 2 ¯ 0> toward <10 1 ¯ 0> with increasing drawing deformation. Second, the c-axis//TD pair has been tilted approximately 10°–15° from the <0001> towards <10 1 ¯ 0>. Such changes in orientation can be attributed to the increased number of grains and the grain rotations during drawing. After 60% warm drawing, the maximum intensity is obtained, i.e., <10 1 ¯ 0>//DD pair with an intensity of 5.45 and c-axis//TD pair with an intensity of 2.84. The two basic texture types, i.e., the basal texture (B-texture) and the transversal texture (T-texture) [32] where the (0001) planes are parallel to the deformation plane and perpendicular to the deformation plane, respectively, are used to describe α deformation textures for rolled sheets. In this work, the T-texture for the drawn bar is referenced when the c-axis is perpendicular to the drawing direction (DD). There is a strong quasi T-fiber texture (i.e., the c-axis aligned with the TD) during warm drawing. After isothermal annealing, no significant change in orientation distribution is identified but the intensity of texture increases with increasing drawing deformation (Figure 4b,d,f), which indicates that the crystal growth including initially deformed grains and newly recrystallized grains during isothermal annealing depends on the initial preferred orientations [17].
Figure 5 shows the ODF sections corresponding to warm-drawn states. For as-received state (Figure 5a), the high orientation densities are obtained at φ1 = 0° and φ1 = 15° sections. The maximum of the ODFs reaches 6.22 at the position of {φ1 = 0°, φ = 70°, φ2 = 30°}, i.e., close to (01 1 ¯ 1)[2 1 ¯ 1 ¯ 0], which belongs to quasi T-texture (with c-axis titled ~30° from TD to normal direction (ND)). Meanwhile, the second highest orientation density of 5.16 is observed around the position of {φ1 = 15°, φ = 60°, φ2 = 0°}, i.e., close to ( 1 ¯ 2 1 ¯ 2)[10 1 ¯ 0]. Compared with {φ1 = 0°, φ = 70°, φ2 = 30°}, c-axis of {φ1 = 15°, φ = 60°, φ2 = 0°} is titled ~15° and is rotated 30°. A comparison of the 30% warm-drawn state (Figure 5b) with as-received state shows that the center of the main peak changes into {φ1 = 15°, φ = 65°, φ2 = 0°} with the orientation density of 7.60. Similarly, there is a significant increase in orientation density near the position of {φ1 = 10°, φ = 65°, φ2 = 0°} (Figure 5c) for 60% warm-drawn state and this orientation density reaches 8.62. Therefore, the main texture component is near {φ1 = 10°, φ = 65°, φ2 = 0°} for warm-drawn state.
Figure 6 shows the ODF sections corresponding to post-deformation IA states. For as-received + IA state (Figure 6a), the maximum value of ODFs reaches 7.23 at the position of {φ1 = 15°, φ = 60°, φ2 = 0°} with a large spread around it, and a secondary peak around the position of {φ1 = 0°, φ = 65°, φ2 = 30°} reaches 6.58. A comparison of the as-received state with its subsequent IA state indicates that recrystallization strengthens the deformation textures in orientation density, but there is only fairly limited change in its main texture components (Figure 5a and Figure 6a). It indicates that the textures during recrystallization are attributed to preferential grain growth which is influenced by the inheritance of deformation texture. A similar trend is observed in the 30% warm-drawn + IA sample (Figure 6b). The maximum orientation density reaches 10.75 at the position of {φ1 = 10°, φ = 65°, φ2 = 0°}. However, in the case of 60% warm-drawn + IA state, a large number of grains have slightly changed their orientations along φ, and the main component is characterized by another high density (Figure 6c) around the position of {φ1 = 15°, φ = 45°, φ2 = 0°}, i.e., close to ( 1 ¯ 2 1 ¯ 3)[10 1 ¯ 0]. Meanwhile, other types of textures also occur and increase orientation density, such as {φ1 = 0°, φ = 10°, φ2 = 0°} and {φ1 = 0°, φ = 60°, φ2 = 30°}. Thus, the texture evolution during recrystallization with increasing drawing deformation can be roughly depicted as the following two stages. In the first stage, the texture is strengthened and the main texture components undergo limited change within 30% drawing deformation, since the oriented nucleation and growth of grains become dominant during subsequent isothermal annealing. It is worth noting that, even though an additional ~15% of β phase has transformed to α phase, new texture has not been formed in this stage. In the second stage, the main texture during recrystallization in this alloy, initially deformed by 60% warm drawing, has been shifted into a new component, i.e., {φ1 = 15°, φ = 45°, φ2 = 0°}.
Based on the ODFs data, the main observed texture components for the α phase with corresponding volume fraction (misorientation tolerance of 15°) and texture index are summarized in Table 2. Overall, the texture index is increasing with increasing drawing deformation but the texture increases nonlinearly. It can be seen that there is a sharp increase after 30% drawing deformation (from 2.51 to 4.25), while a slight increase from 4.25, corresponding to 30% drawing deformation, to 4.53, corresponding to 60% drawing deformation. A similar trend on texture index is observed in post-deformation IA samples. It suggests that the texture index for deformed and annealed states is more sensitive to the drawing deformation in the first stage.

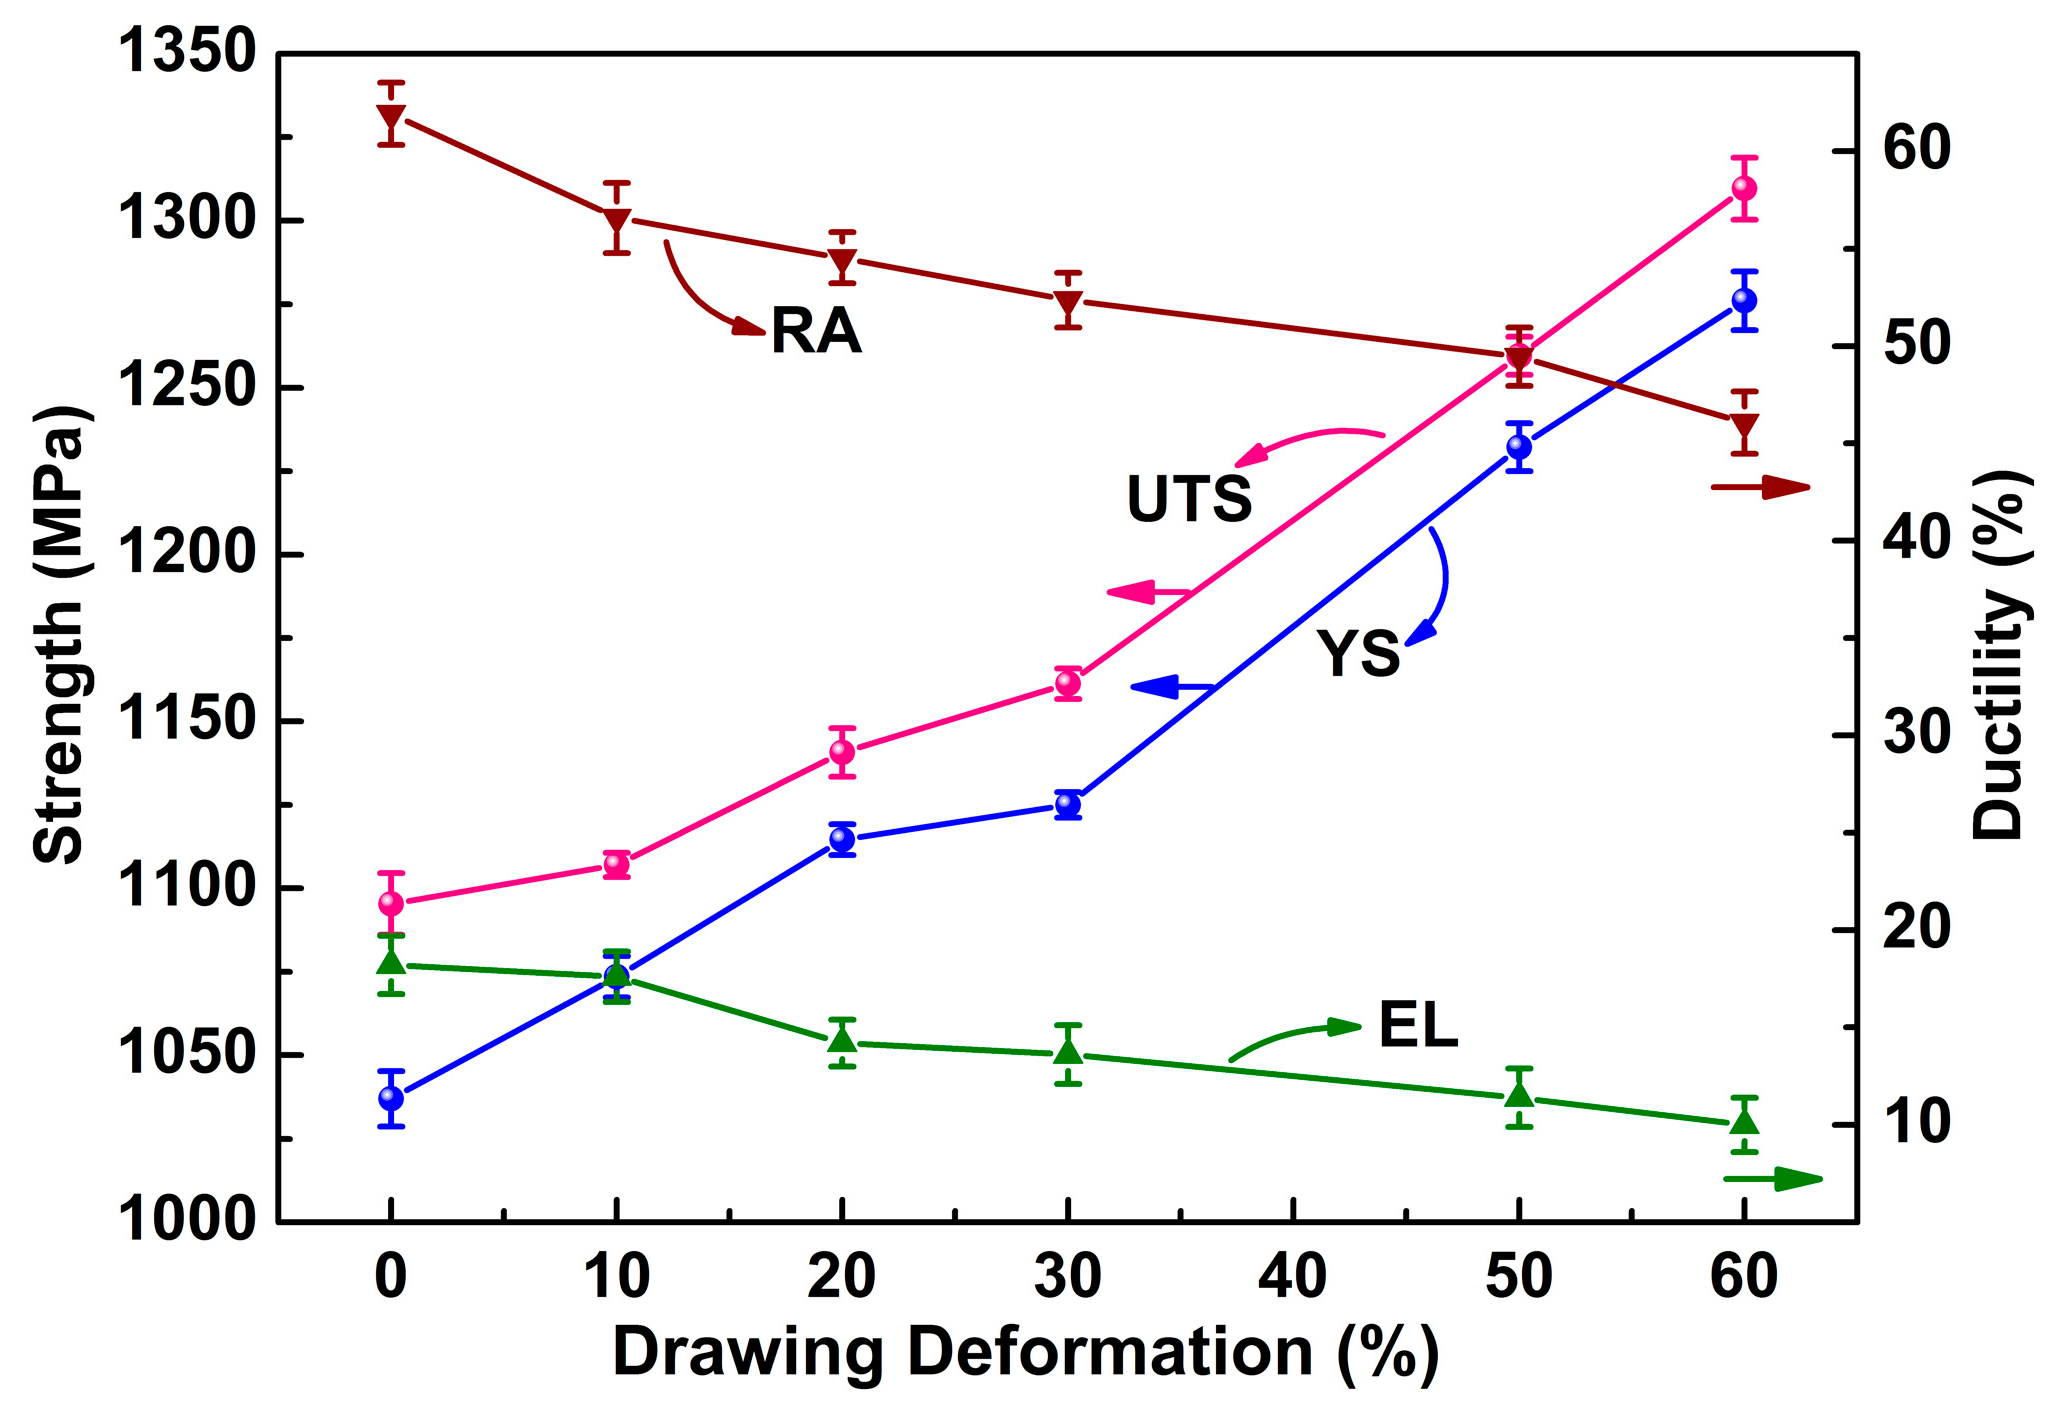
3.3. Mechanical Properties

It is generally known that mechanical properties of titanium alloys are affected by grain size, degree of work hardening, texture, etc. [4,14,33]. In order to test these effects, tensile properties (i.e., UTS: ultimate tensile strength, YS: yield strength, RA: reduction in area, and EL: elongation) for VT3-1 alloy in various states were evaluated.
The variation of tensile properties of drawn states as a function of drawing deformation is shown in Figure 7. The YS and UTS increase from 1037 MPa and 1096 MPa for as-received state to 1277 MPa and 1310 MPa for the 60% warm-drawn state, respectively, which can directly result from grain refinement (Figure 2) and work hardening (dislocation density). However, the RA and EL drop from 61.9% and 18.2% for as-received state to 46.1% and 10.1% for 60% warm-drawn state, respectively.
Figure 8 shows the variation of tensile properties of IA states as a function of drawing deformation. It can be observed that the IA samples show much higher and more stable ductility though the strength decreases compared with their deformed state, which results from recovery and recrystallization during isothermal annealing. Meanwhile, the strength of IA samples increases with increasing drawing deformation. Because the retained β phase is dispersed at triple points of α phase and α phase bears a large fraction of total deformation [2,4], the similar volume fraction of equiaxed α grains (~80%) for IA samples is chosen to assess the mechanical properties. The Hall-Petch equation has been described for several classes of two-phase alloys [34,35]:
σ = σ 0 + K d 1 / 2
where σ is the strength, σ0 and K are constants for the metal, and d is the mean diameter of the grains. As shown in Figure 9, the values of YS and UTS for IA states are plotted against d−1/2. The experimental values of strength are basically in line with fitted curve but show a different variation which disagrees with the standard Hall-Petch relationship (positive slope). For example, the YS of as-received + IA sample with mean grain size of 4.6 μm is 950 MPa, while the YS of 60% + IA sample with 5.8 μm is 991 MPa. It was mentioned previously that α phase develops sharp texture during drawing and annealing owing to a limited number of slip systems of HCP materials at room temperature, which may result in texture hardening or softening. So, texture modification during isothermal annealing is considered to be responsible for this trend (negative slope).
The Schmid factor (m value), as an important parameter of dislocation slip mechanism based on crystallographic model, can be applied to understand the effect of texture on yield-stress behavior:
m = cos θ cos λ
where θ is the angle between the loading direction and the normal direction to slip plane, and λ is the angle between the loading direction and slip direction. There are 24 possible activated slip systems (four types of slip systems), including 3 basal <a>, 3 prismatic <a>, 6 pyramidal <a> and 12 pyramidal <c + a> slip systems, which are the most important deformation systems in the hexagonal α phase for α/β titanium alloy [25,36,37,38,39]. The m values for uniaxial tension are calculated based on the major texture components as shown in Table 3. Overall, basal <a> slip can hardly be activated because all the m values for basal <a> slip are small, while prismatic <a>, pyramidal <a> and pyramidal <c + a> slips with higher m values are activated preferentially.
The Sachs model [25] was used to analyze the effect of crystal orientation and deformation mode on mechanical properties. This model assumes that polycrystalline materials can be treated as an arrangement of isolated single crystals without the effects of boundaries and other neighboring grains; meanwhile, homogeneous deformation occurs throughout each grain which bears the same external stress. Under these ideal conditions, crystal orientation is the only factor for activating slip systems. In a single grain, the Schmid law is given as:
σ y = τ C R S S × ( 1 M c )
where τ C R S S is critical resolved shear stress, Mc is comprehensive Schmid factor, and σy is yield strength. The Mc can be calculated from the following equation:
M c = i = 1 k m ( g i ) × f ( g i )
where m(gi) is Schmid factor of the characteristic orientation gi and f(gi) is the volume fraction of gi for the whole orientation space k. In Equation (5), the m(gi) is determined by the highest value of 24 possible activated slip systems. For polycrystalline materials, assuming that the only slip system would be activated in a single grain and no texture area has equal contribution to stress, an estimation of the effect of orientation on yield stress can be made. Combining Equations (4) and (5), the calculated yield stress (σc) is defined as follows:
σ c = i 3 [ ( τ i m i ) × f ( i ) ] + ( 1 i 3 f ( i ) ) × σ *
where τ i is the τ C R S S for activated slip systems (two or three observed preferred orientations for one state in Table 2), f(i) is the volume fraction of preferred orientations, and σ* is the normalized yield stress. However, there is the lack of consensus on τ C R S S and their ratios for different deformation systems in polycrystalline metals. Based on some previous experimental and simulated estimations on τ C R S S [10,25,37,40], the parameters including τ C R S S of 270 MPa, σ* of 877.8 MPa, and the τ C R S S ratios of 1:1:3 for prismatic <a>:pyramidal <a>:pyramidal <c + a> are employed in this work. The calculated yield stresses under different processing conditions are listed in Table 4. The change in σc is limited in drawn samples compared to other factors, while IA samples are more likely to be affected by texture due to the increase of texture index. Interestingly, the varying trend of the calculated yield stress is in agreement with the experimental values, and the negative slope of the Hall-Petch relationship is found as displayed in Figure 9. Therefore, the textures for IA samples play a critical role in determining the yield stress besides the grain size. For the as-received + IA sample, the slight texture softening occurs because the soft orientation (highest m value for prismatic <a> with low τ C R S S ) has a larger volume fraction than some hard orientations. However, the 30% + IA and 60% + IA samples exhibit texture hardening owing to {φ1 = 10°, φ = 65°, φ2 = 0°} and {φ1 = 15°, φ = 45°, φ2 = 0°}, respectively, which are the hard orientations with the highest m values for pyramidal <c + a> with high τ C R S S .
In summary, grain size and texture synergistically govern the strength level of drawn and annealed Ti–6Al–1.5Cr–2.5Mo–0.5Fe–0.3Si alloy. In order to obtain the balance of strength and ductility for α + β titanium alloys, the warm-drawing process is worth exploring not only for the grain refinement but also for texture hardening.

4. Conclusions

Microstructure and texture evolution of Ti–6Al–1.5Cr–2.5Mo–0.5Fe–0.3Si (VT3-1) alloy during multi-pass warm drawing and subsequent isothermal annealing have been systematically investigated and correlated with the mechanical properties. The main conclusions can be summarized as follows.
(1)
For drawn samples, α grains are gradually elongated along the drawing direction with increasing deformation, and a fiber-like microstructure is formed after 60% warm-drawing deformation. After isothermal annealing, the microstructure is more homogeneous with increasing deformation, although the volume fraction of the α phase is similar.
(2)
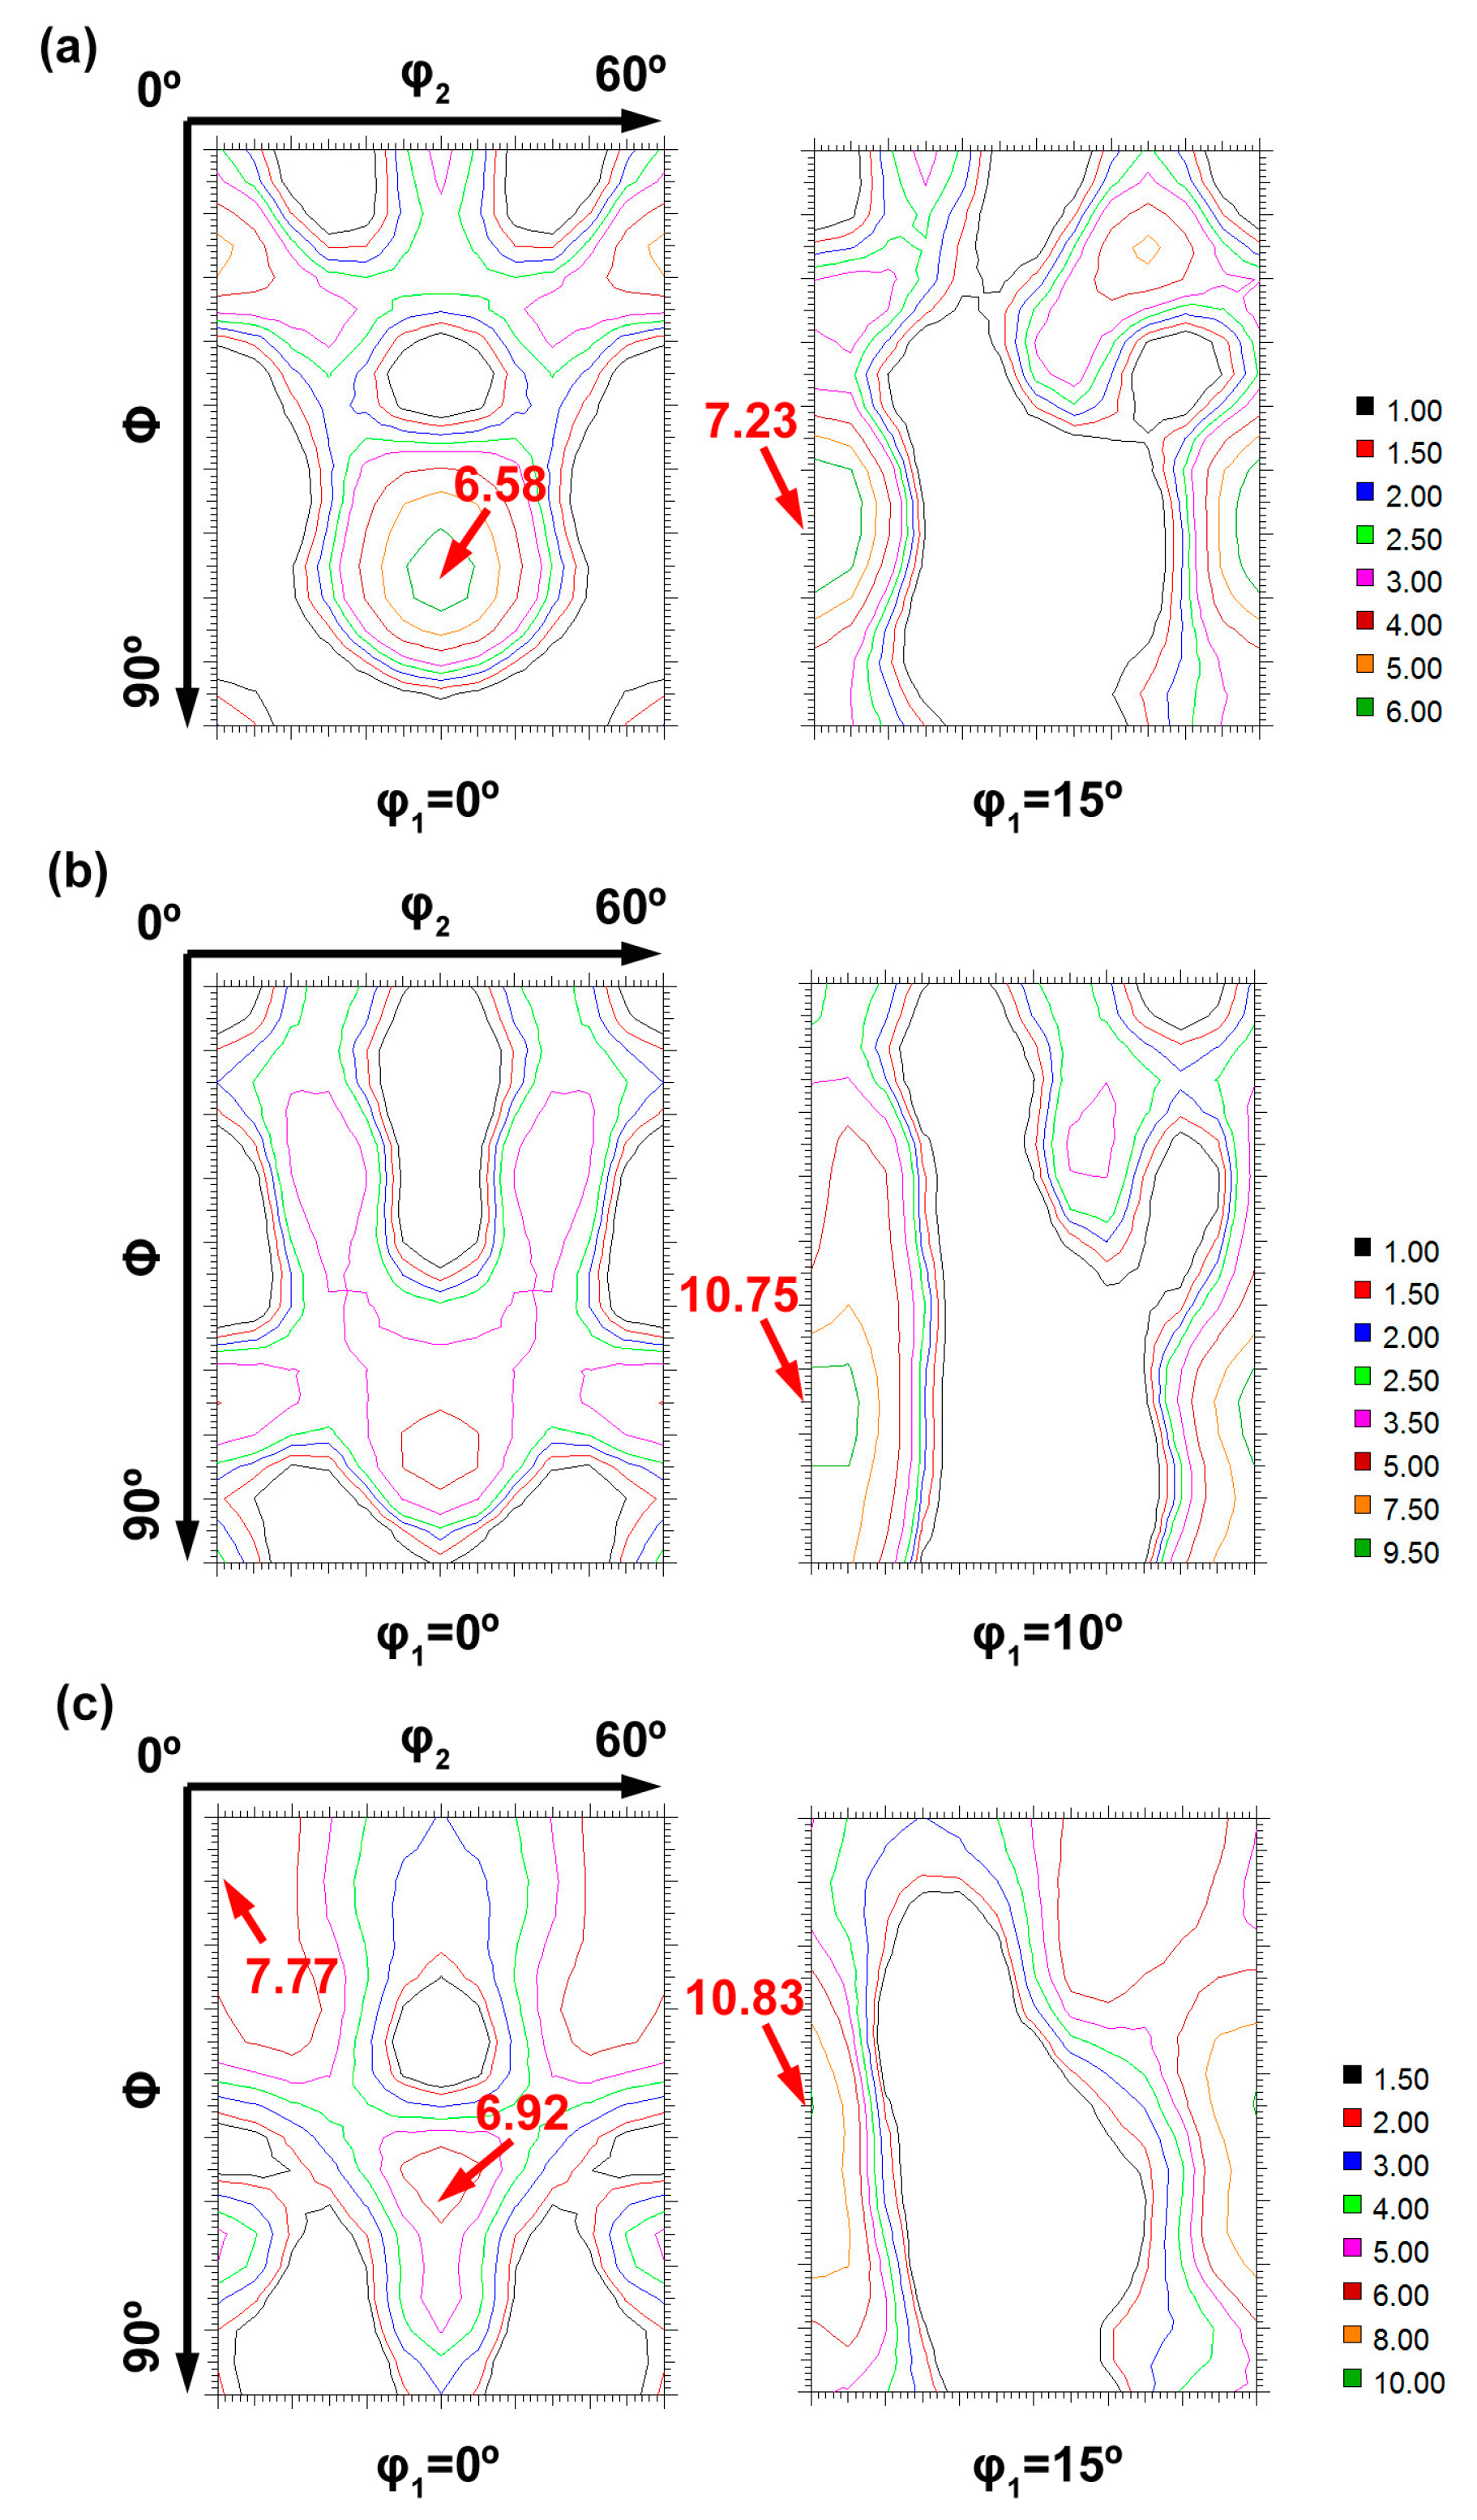
The fiber texture with orientations around the position of {φ1 = 10°, φ = 65°, φ2 = 0°}, i.e., close to ( 1 ¯ 2 1 ¯ 2)[10 1 ¯ 0], gradually becomes the major and stable type of texture during warm drawing. For IA samples, the textures during recrystallization show significant increases in texture intensity and in volume fraction compared to their deformed states due to a preferential grain growth along the orientation of original deformation textures. However, for the 60% + IA samples, the major orientation has been shifted into a new one with c-axis titled ~20° compared with {φ1 = 10°, φ = 65°, φ2 = 0°}. The texture indices for deformed and annealed states are sensitive within the 30% drawing deformation.
(3)
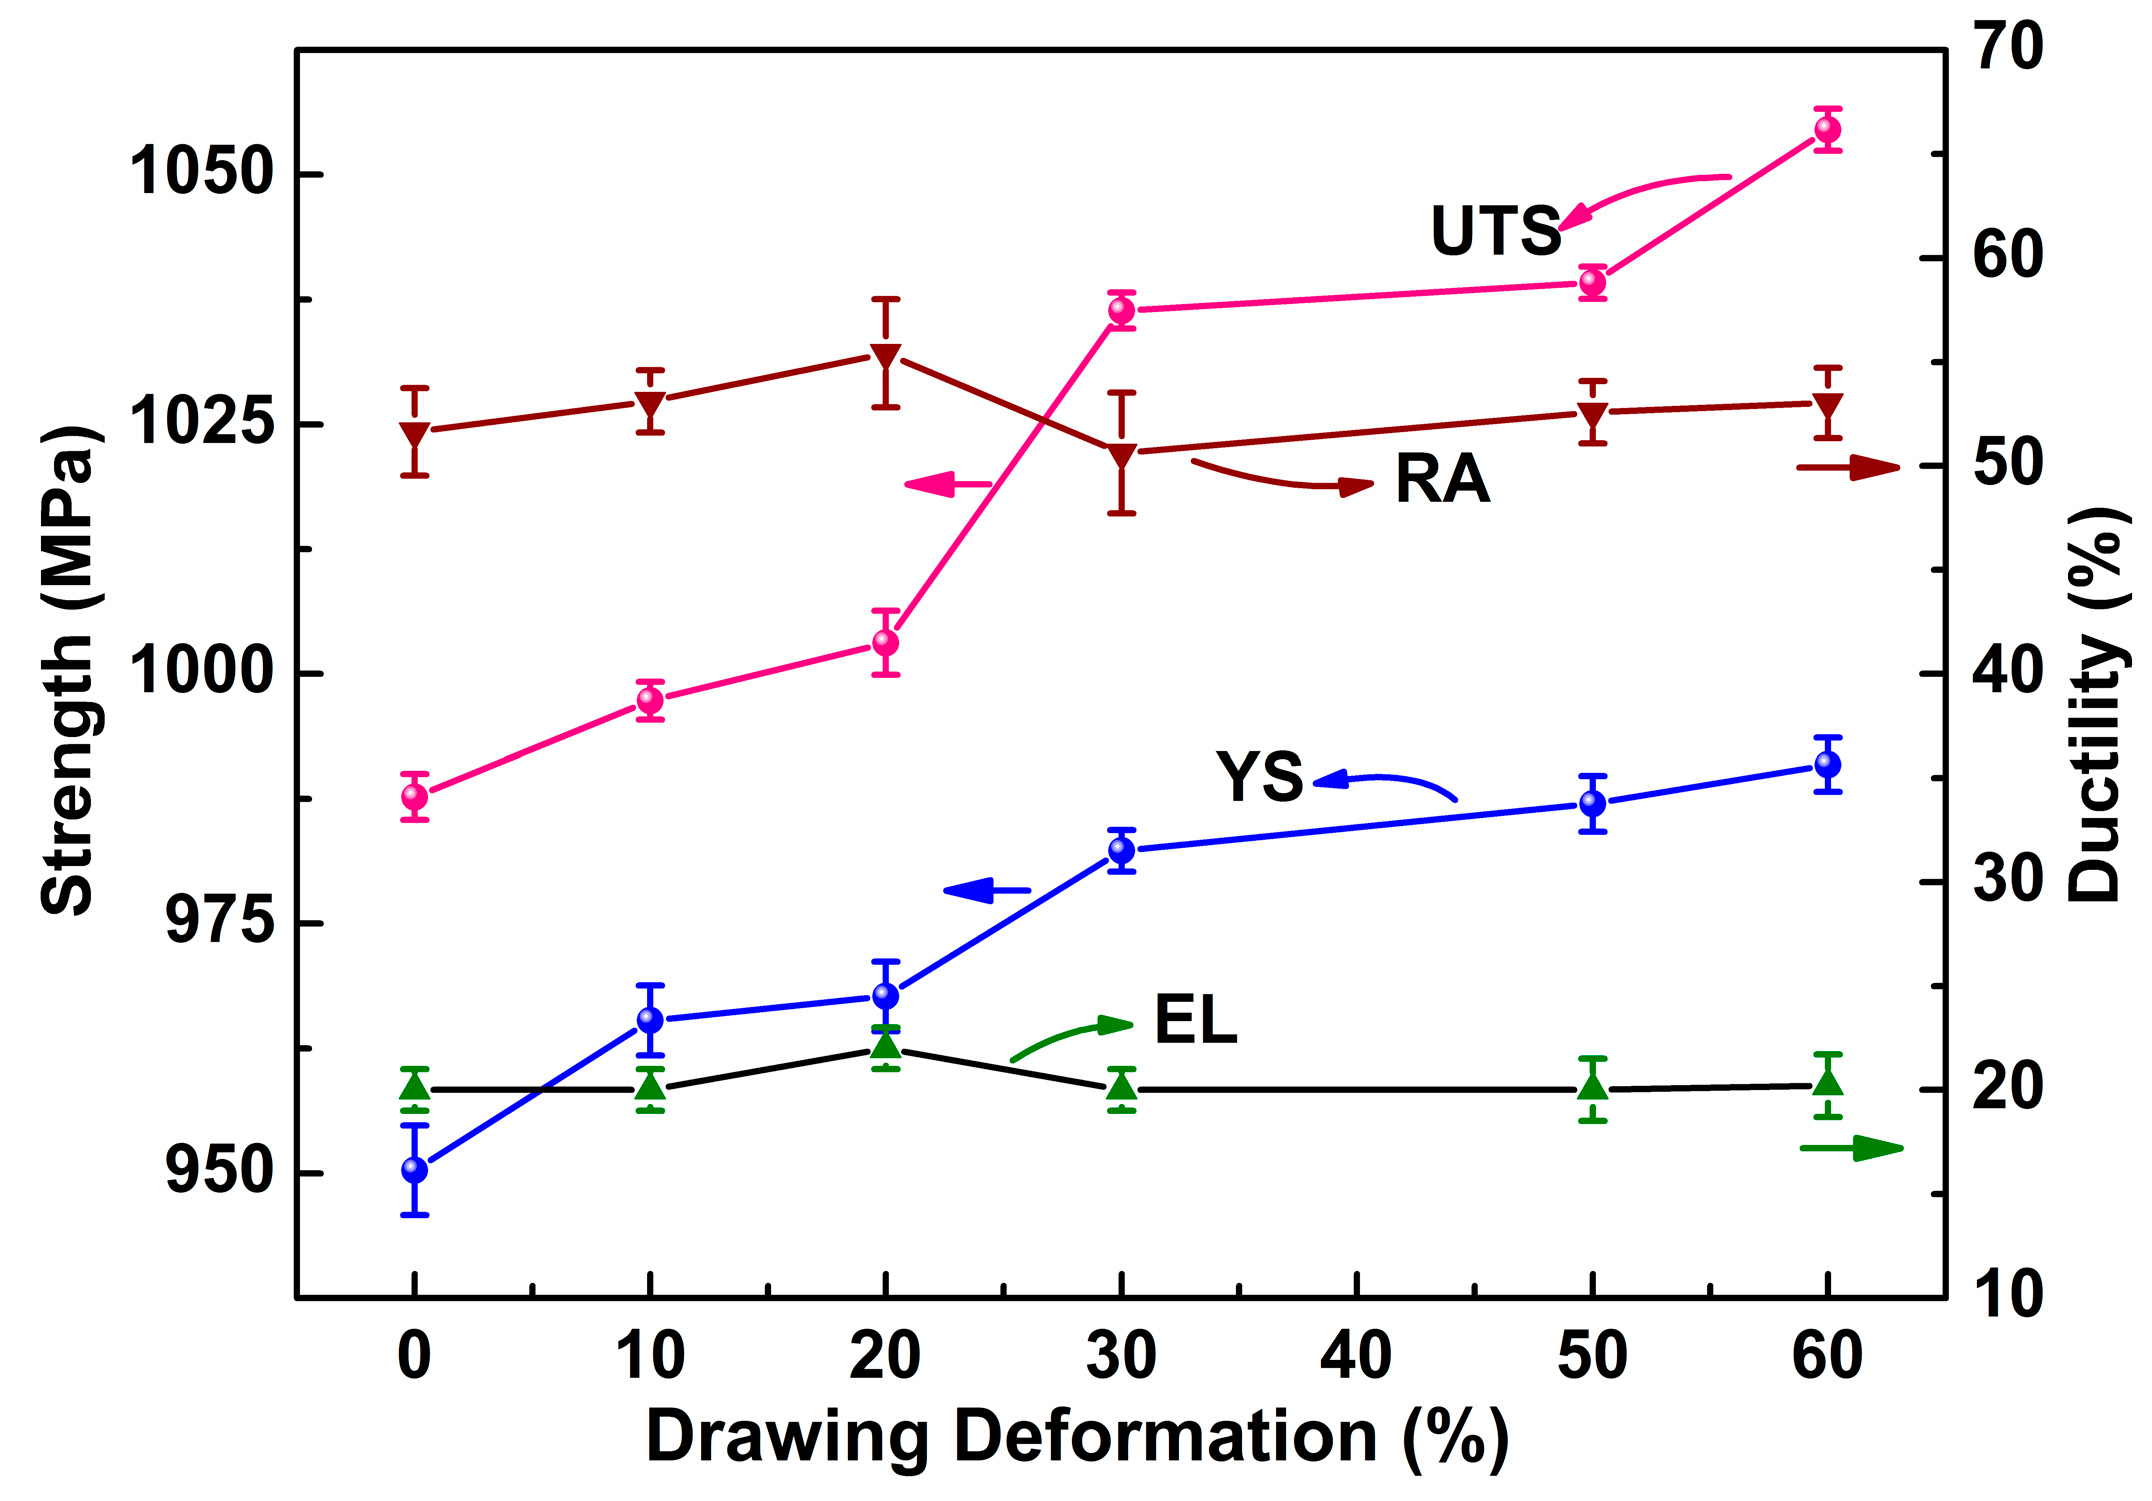
The samples processed by multi-pass warm drawing exhibit high strength and low ductility owing to significant grain refinement and work hardening. For IA samples, a high and stable ductility is obtained. Moreover, a negative slope of yield strength versus d−1/2 is observed as a result of texture softening in as-received + IA samples but texture hardening in drawn + IA samples. The relationship between texture and yield strength indicates that texture developed during drawing is beneficial to improving strength of IA states.

Author Contributions

Xiaofei Lei and Limin Dong conceived and designed the experiments; Zhiqiang Zhang and Xiaofei Lei performed the experiments; Yujing Liu, Lai-Chang Zhang, and Yulin Hao analyzed and discussed the data; Xiaofei Lei wrote the paper; Rui Yang did the revision and direction of the work.

Conflicts of Interest

The authors declare no conflict of interest.

References

  1. Lütjering, G.; Williams, J.C. Titanium, 2nd ed.; Springer: Berlin/Heidelberg, Germany, 2007; pp. 203–250. [Google Scholar]
  2. Liu, Y.J.; Li, X.P.; Zhang, L.C.; Sercombe, T.B. Processing and properties of topologically optimised biomedical Ti–24Nb–4Zr–8Sn scaffolds manufactured by selective laser melting. Mater. Sci. Eng. A 2015, 642, 268–278. [Google Scholar] [CrossRef]
  3. Cui, C.; Hu, B.M.; Zhao, L.; Liu, S. Titanium alloy production technology, market prospects and industry development. Mater. Des. 2011, 32, 1684–1691. [Google Scholar] [CrossRef]
  4. Ehtemam-Haghighi, S.; Liu, Y.J.; Cao, G.; Zhang, L.C. Influence of Nb on the β → α martensitic phase transformation and properties of the newly designed Ti–Fe–Nb alloys. Mater. Sci. Eng. C 2015, 60, 503–510. [Google Scholar] [CrossRef] [PubMed]
  5. Li, M.; Xiong, A.; Huang, W.; Wang, H.; Su, S.; Shen, L. Microstructural evolution and modelling of the hot compression of a TC6 titanium alloy. Mater. Charact. 2002, 49, 203–209. [Google Scholar] [CrossRef]
  6. Ghasemi, E.; Zarei-Hanzaki, A.; Moemeni, S.; Ghambari, M.; Rezaee, M. An investigation into the warm deformation behavior of Ti–6Al–1.5Cr–2.5Mo–0.5Fe–0.3Si alloy. Mater. Sci. Eng. A 2016, 654, 264–270. [Google Scholar] [CrossRef]
  7. Kim, W.J.; Hong, S.I.; Kim, Y.S.; Min, S.H.; Jeong, H.T.; Lee, J.D. Texture development and its effect on mechanical properties of an AZ61 Mg alloy fabricated by equal channel angular pressing. Acta Mater. 2003, 51, 3293–3307. [Google Scholar] [CrossRef]
  8. Zhang, L.C.; Attar, H. Selective Laser Melting of Titanium Alloys and Titanium Matrix Composites for Biomedical Applications: A Review. Adv. Eng. Mater. 2016, 18, 463–475. [Google Scholar] [CrossRef]
  9. Zhao, A.M.; Yang, H.; Fan, X.G.; Gao, P.F.; Zuo, R.; Meng, M. The flow behavior and microstructure evolution during (α + β) deformation of β wrought TA15 titanium alloy. Mater. Des. 2016, 109, 112–122. [Google Scholar] [CrossRef]
  10. Bieler, T.R.; Semiatin, S.L. The origins of heterogeneous deformation during primary hot working of Ti–6Al–4V. Int. J. Plast. 2002, 18, 1165–1189. [Google Scholar] [CrossRef]
  11. Bridier, F.; Villechaise, P.; Mendez, J. Analysis of the different slip systems activated by tension in a α/β titanium alloy in relation with local crystallographic orientation. Acta Mater. 2005, 53, 555–567. [Google Scholar] [CrossRef]
  12. Ehtemam-Haghighi, S.; Liu, Y.J.; Cao, G.; Zhang, L.C. Phase transition, microstructural evolution and mechanical properties of Ti–Nb–Fe alloys induced by Fe addition. Mater. Des. 2016, 97, 279–286. [Google Scholar] [CrossRef]
  13. Fizanne-Michel, C.; Cornen, M.; Castany, P.; Péron, I.; Gloriant, T. Determination of hardness and elastic modulus inverse pole figures of a polycrystalline commercially pure titanium by coupling nanoindentation and EBSD techniques. Mater. Sci. Eng. A 2014, 613, 159–162. [Google Scholar] [CrossRef]
  14. Wang, Y.N.; Huang, J.C. Texture analysis in hexagonal materials. Mater. Chem. Phys. 2003, 81, 11–26. [Google Scholar] [CrossRef]
  15. Germain, L.; Gey, N.; Humbert, M.; Bocher, P.; Jahazi, M. Analysis of sharp microtexture heterogeneities in a bimodal IMI 834 billet. Acta Mater. 2005, 53, 3535–3543. [Google Scholar] [CrossRef]
  16. Gey, N.; Bocher, P.; Uta, E.; Germain, L.; Humbert, M. Texture and microtexture variations in a near-α titanium forged disk of bimodal microstructure. Acta Mater. 2012, 60, 2647–2655. [Google Scholar] [CrossRef]
  17. Wagner, F.; Bozzolo, N.; Landuyt, O.V.; Grosdidier, T. Evolution of recrystallisation texture and microstructure in low alloyed titanium sheets. Acta Mater. 2002, 50, 1245–1259. [Google Scholar] [CrossRef]
  18. Bozzolo, N.; Dewobroto, N.; Grosdidier, T.; Wagner, F. Texture evolution during grain growth in recrystallized commercially pure titanium. Mater. Sci. Eng. A 2005, 397, 346–355. [Google Scholar] [CrossRef]
  19. Warwick, J.L.W.; Jones, N.G.; Bantounas, I.; Preuss, M.; Dye, D. In situ observation of texture and microstructure evolution during rolling and globularization of Ti–6Al–4V. Acta Mater. 2013, 61, 1603–1615. [Google Scholar] [CrossRef]
  20. Hayama, A.O.F.; Lopes, J.F.S.C.; Silva, M.J.G.D.; Abreu, H.F.G.; Caram, R. Crystallographic texture evolution in Ti–35Nb alloy deformed by cold rolling. Mater. Des. 2014, 60, 653–660. [Google Scholar] [CrossRef]
  21. Cojocaru, V.D.; Raducanu, D.; Gloriant, T.; Gordin, D.M.; Cinca, I. Effects of cold-rolling deformation on texture evolution and mechanical properties of Ti–29Nb–9Ta–10Zr alloy. Mater. Sci. Eng. A 2013, 586, 1–10. [Google Scholar] [CrossRef]
  22. Prakash, D.G.L.; Honniball, P.; Rugg, D.; Withers, P.J.; Fonseca, J.Q.D.; Preuss, M. The effect of β phase on microstructure and texture evolution during thermomechanical processing of α + β Ti alloy. Acta Mater. 2013, 61, 3200–3213. [Google Scholar] [CrossRef]
  23. Du, Z.; Xiao, S.; Liu, J.; Lv, S.; Xu, L.; Kong, F.; Chen, Y. Hot deformation behavior of Ti–3.5Al–5Mo–6V–3Cr–2Sn–0.5Fe alloy in α + β field. Metals 2015, 5, 216–227. [Google Scholar] [CrossRef]
  24. Lium, Y.J.; Lim, S.J.; Wangm, H.L.; Houm, W.T.; Haom, Y.L.; Yangm, R.; Sercombem, T.B.; Zhang, L.C. Microstructure, defects and mechanical behavior of beta-type titanium porous structures manufactured by electron beam melting and selective laser melting. Acta Mater. 2016, 113, 56–67. [Google Scholar]
  25. Zaefferer, S. A study of active deformation systems in titanium alloys: Dependence on alloy composition and correlation with deformation texture. Mater. Sci. Eng. A 2003, 344, 20–30. [Google Scholar] [CrossRef]
  26. Zhao, T.Z.; Zhang, G.L.; Song, H.W.; Cheng, M.; Zhang, S.H. Crystallographic texture difference between center and sub-surface of thin cold-drawn pearlitic steel wires. J. Mater. Eng. Perform. 2014, 23, 3279–3284. [Google Scholar] [CrossRef]
  27. Lee, J.W.; Baek, H.M.; Sun, K.H.; Son, I.H.; Bae, C.M.; Im, Y.T. The effect of the multi-pass non-circular drawing sequence on mechanical properties and microstructure evolution of low-carbon steel. Mater. Des. 2014, 55, 898–904. [Google Scholar] [CrossRef]
  28. Dai, N.; Zhang, L.C.; Zhang, J.; Chen, Q.; Wu, M. Corrosion behaviour of selective laser melted Ti–6Al–4V alloy in NaCl solution. Corros. Sci. 2016, 102, 484–489. [Google Scholar] [CrossRef]
  29. Zhang, L.C.; Das, J.; Lu, H.B.; Duhamel, C.; Calin, M.; Eckert, J. High strength Ti–Fe–Sn ultrafine composites with large plasticity. Scr. Mater. 2007, 57, 101–104. [Google Scholar] [CrossRef]
  30. Dahms, M.; Bunge, H.J. The iterative series-expansion method for quantitative texture analysis. I. General outline. J. Appl. Crystallogr. 1989, 22, 439–447. [Google Scholar] [CrossRef]
  31. Robertson, S.W.; Gong, X.Y.; Ritchie, R.O. Effect of product form and heat treatment on the crystallographic texture of austenitic Nitinol. J. Mater. Sci. 2006, 41, 621–630. [Google Scholar] [CrossRef]
  32. Schillinger, W.; Bartels, A.; Gerling, R.; Schimansky, F.P.; Clemens, H. Texture evolution of the γ- and the α/α2-phase during hot rolling of γ-TiAl based alloys. Intermetallics 2006, 14, 336–347. [Google Scholar] [CrossRef]
  33. Ghamarian, I.; Hayes, B.; Samimi, P.; Welk, B.A.; Fraser, H.L.; Collins, P.C. Developing a phenomenological equation to predict yield strength from composition and microstructure in β processed Ti–6Al–4V. Mater. Sci. Eng. A 2016, 660, 172–180. [Google Scholar] [CrossRef]
  34. Leyens, C.; Peters, M. Titanium and Titanium Alloys: Fundamentals and Applications, 1st ed.; Wiley-VCH Verlag GmbH: Weinheim, Germany, 2003; pp. 112–114. [Google Scholar]
  35. Kumar, S.S.S.; Priyasudha, K.; Rao, M.S.; Raghu, T. Deformation homogeneity, mechanical behaviour and strain hardening characteristics of titanium severe plastically deformed by cyclic channel die compression method. Mater. Des. 2016, 101, 117–129. [Google Scholar] [CrossRef]
  36. Nan, X.L.; Wang, H.Y.; Zhang, L.; Li, J.B.; Jiang, Q.C. Calculation of Schmid factors in magnesium: Analysis of deformation behaviors. Scr. Mater. 2012, 67, 443–446. [Google Scholar] [CrossRef]
  37. Li, H.; Mason, D.E.; Bieler, T.R.; Boehlert, C.J.; Crimp, M.A. Methodology for estimating the critical resolved shear stress ratios of α-phase Ti using EBSD-based trace analysis. Acta Mater. 2013, 61, 7555–7567. [Google Scholar] [CrossRef]
  38. Liu, Y.J.; Wang, H.L.; Li, S.J.; Wang, S.G.; Wang, W.J.; Hou, W.T.; Hao, Y.L.; Yang, R.; Zhang, L.C. Compressive and fatigue behavior of beta-type titanium porous structures fabricated by electron beam melting. Acta Mater. 2017, 126, 58–66. [Google Scholar] [CrossRef]
  39. Liu, Y.J.; Li, S.J.; Hou, W.T.; Wang, S.G.; Hao, Y.L.; Yang, R.; Sercombe, T.B.; Zhang, L.C. Electron beam melted beta-type Ti–24Nb–4Zr–8Sn porous structures with high strength-to-modulus ratio. J. Mater. Sci. Technol. 2016, 32, 505–508. [Google Scholar] [CrossRef]
  40. Fundenberger, J.J.; Philippe, M.J.; Wagner, F.; Esling, C. Modelling and prediction of mechanical properties for materials with hexagonal symmetry (zinc, titanium and zirconium alloys). Acta Mater. 1997, 45, 4041–4055. [Google Scholar] [CrossRef]
Figure 1. A schematic diagram of sampling location in VT3-1 alloy bars. The DD, ND and TD represent the drawing direction, normal direction and transverse direction, respectively. SEM: scanning electron microscopy; XRD: X-ray diffraction.
Metals 07 00131 g001
Figure 2. SEM micrographs of VT3-1 alloy after warm drawing and isothermal annealing: (a) as-received state; (b) as-received + isothermally annealed (IA) state; (c) 30% warm-drawn state; (d) 30% warm-drawn + IA state; (e) 60% warm-drawn state; (f) 60% warm-drawn + IA state.
Metals 07 00131 g002
Figure 3. XRD patterns of VT3-1 alloy under different processing conditions.
Metals 07 00131 g003
Figure 4. Representation of inverse pole figures (IPFs) corresponding to warm-drawn and IA states: (a) as-received state; (b) as-received + IA state; (c) 30% warm-drawn state; (d) 30% warm-drawn + IA state; (e) 60% warm-drawn state; (f) 60% warm-drawn + IA state.
Metals 07 00131 g004
Figure 5. Representation of orientation distribution function (ODF) sections at constant φ1 corresponding to warm-drawn states: (a) as-received state: φ1 = 0° and φ1 = 15°; (b) 30% warm-drawn state: φ1 = 0° and φ1 = 15°; (c) 60% warm-drawn state: φ1 = 0° and φ1 = 10°.
Metals 07 00131 g005
Figure 6. Representation of ODF sections at constant φ1 corresponding to IA states: (a) as-received + IA state: φ1 = 0° and φ1 = 15°; (b) 30% warm-drawn + IA state: φ1 = 0° and φ1 = 10°; (c) 60% warm-drawn + IA state: φ1 = 0° and φ1 = 15°.
Metals 07 00131 g006
Figure 7. Variation of tensile properties of warm-drawn states as a function of drawing deformation. RA: reduction in area; UTS: ultimate tensile strength; YS: yield strength; EL: elongation.
Metals 07 00131 g007
Figure 8. Variation of tensile properties of IA states as a function of drawing deformation.
Metals 07 00131 g008
Figure 9. Yield strength (YS) and ultimate tensile strength (UTS) against grain size (d−1/2) for IA states.
Metals 07 00131 g009
Table 1. Experimental data of the Ti–6Al–1.5Cr–2.5Mo–0.5Fe–0.3Si (VT3-1) alloy bar samples.
Sample StateDiameter, mmArea Reduction, %Accumulated Strain
As received25.4000
30% warm-drawn20.9032.30.39
60% warm-drawn16.1859.40.90
Table 2. Obtained texture characteristics in the alloy after warm drawing and isothermal annealing.
Sample StateEuler Angles, °Orientation DensityTexture Component, ~(hkil)[uvtw]Volume Fraction, %Texture Index
φ1φφ2
As-received070306.22(01 1 ¯ 1)[2 1 ¯ 1 ¯ 0]2.672.51
156005.16( 1 ¯ 2 1 ¯ 2)[10 1 ¯ 0]2.87
0004.36(0001)[10 1 ¯ 0]3.90
30% warm-drawn156507.60( 1 ¯ 2 1 ¯ 2)[10 1 ¯ 0]4.464.25
025104.69( 1 ¯ 3 2 ¯ 9)[10 1 ¯ 0]3.89
60% warm-drawn106508.62( 1 ¯ 2 1 ¯ 2)[10 1 ¯ 0]5.294.53
03505.53( 1 ¯ 2 1 ¯ 5)[10 1 ¯ 0]5.16
As-received + IA156007.23( 1 ¯ 2 1 ¯ 2)[10 1 ¯ 0]2.943.77
065306.58(01 1 ¯ 1)[2 1 ¯ 1 ¯ 0]3.17
01505.36(0001)[10 1 ¯ 0]3.76
30% + IA1065010.75( 1 ¯ 2 1 ¯ 2)[10 1 ¯ 0]6.128.09
070306.04(01 1 ¯ 1)[2 1 ¯ 1 ¯ 0]4.91
60% + IA1545010.83( 1 ¯ 2 1 ¯ 3)[10 1 ¯ 0]8.3910.95
01007.77(0001)[10 1 ¯ 0]7.16
060306.92(01 1 ¯ 1)[2 1 ¯ 1 ¯ 0]4.64
Table 3. Schmid factor values based on obtained major texture components and main slip systems.
Texture Component, ~(hkil)[uvtw]Schmid Factor
Basal <a>, {0001}<11 2 ¯ 0>Prismatic <a>, {10 1 ¯ 0}<11 2 ¯ 0>Pyramidal <a>, {10 1 ¯ 1}<11 2 ¯ 0>Pyramidal <c + a>, {10 1 ¯ 1}<11 2 ¯ 3>
(01 1 ¯ 1)[2 1 ¯ 1 ¯ 0]0; 0; 00.43 *; 0.43; 00; 0; 0.38; 0.38; 0.38; 0.380.2; 0.4; 0.2; 0.4; 0.4; 0.2; 0; 0; 0; 0; 0; 0
( 1 ¯ 2 1 ¯ 2)[10 1 ¯ 0]0.13; 0.12; 0.140.45; 0.07; 0.380.30; 0.37; 0.01; 0.14; 0.44; 0.360.05; 0.19; 0.07; 0.25; 0.32; 0.28; 0.48 *; 0.45; 0.08; 0.14; 0.03; 0.17
(0001)[10 1 ¯ 0]0; 0; 00.43; 0; 0.43 *0.38; 0.38; 0; 0; 0.38; 0.380; 0.2; 0; 0.2; 0.4; 0.4; 0.4; 0.4; 0; 0.2; 0; 0.2
( 1 ¯ 3 2 ¯ 9)[10 1 ¯ 0]0; 0; 00.49 *; 0.17; 0.320.28; 0.28; 0.15; 0.15; 0.43; 0.430.05; 0.28; 0.05; 0.28; 0.43; 0.35; 0.43; 0.35; 0.03; 0.12; 0.03; 0.12
( 1 ¯ 2 1 ¯ 5)[10 1 ¯ 0]0; 0; 00.43 *; 0; 0.430.38; 0.38; 0; 0; 0.38; 0.380; 0.2; 0; 0.2; 0.4; 0.4; 0.4; 0.4; 0; 0.2; 0; 0.2
( 1 ¯ 2 1 ¯ 3)[10 1 ¯ 0]0.14; 0.03; 0.170.47; 0.18; 0.30.24; 0.29; 0.07; 0.24; 0.47; 0.360.04; 0.22; 0.12; 0.31; 0.32; 0.22; 0.49 *; 0.42; 0.09; 0.09; 0.01; 0.11
Values with “*” are the highest m values.
Table 4. Calculated yield stresses under different processing conditions.
Sample StateCalculated Yield Stress, MPa
As-received884.6
30% warm-drawn901.2
60% warm-drawn907.7
As-received + IA875.5
30% + IA910.6
60% + IA913.4

