
Precipitation Behavior of ωo Phase in Ti-37.5Al-12.5Nb Alloy


1
State Key Laboratory for Advanced Metals and Materials, University of Science and Technology Beijing, Beijing 100083, China
2
State Key Laboratory of Solidification Processing, Northwestern Polytechnical University, Xi’an 710072, China
3
Institute for Advanced Materials and Technology, University of Science and Technology Beijing, Beijing 100083, China
*
Authors to whom correspondence should be addressed.
Metals 2017, 7(6), 192; https://doi.org/10.3390/met7060192
Submission received: 27 April 2017
/
Revised: 18 May 2017
/
Accepted: 19 May 2017
/
Published: 26 May 2017
Abstract
:Mutual transformation between α2 and ωo phases has been an interesting topic in recent years. In this study, martensitic α2 was obtained by air-cooling from 1250 °C in Ti-37.5Al-12.5Nb (at%) alloy while four ωo variants formed in the βo phase matrix during the cooling process. Nonetheless, only one ωo variant was observed at the periphery of the α2 plates in the βo phase and the orientation relationship between these two phases was [] α2//[] ωo; () α2//(0002) ωo. Thin γ plates precipitated within the α2 phase and were thought to be related to the appearance of ωo phase. The redistribution of the compositions during the phase transformations was studied by energy dispersive X-ray spectroscopy analysis. The corresponding mechanisms of the phase transformations mentioned above are discussed.
1. Introduction
High Nb-containing TiAl (Nb-TiAl) alloys have been considered as potential materials for high-temperature applications due to their low density, high strength, good oxidation resistance, and creep properties [1,2,3]. Recently, Stark et al. showed that the amount of ωo phase increased with the content of Nb in high Nb-TiAl alloy [4,5]. Meanwhile, Nb is a β phase stabilizer that extends the β phase field and facilitates the ordered ω (ωo) phase transitions in the βo phase in high Nb-TiAl alloys [6,7,8,9]. Numerous studies have reported the ωo phase transformations in high Nb-TiAl alloys, indicating that the ωo phase is stable at 700–900 °C [10,11]. However, these studies have mainly focused on the transition process between the βo and ωo phases [6,7,8,9,10,11,12,13] or the α2 to βo phase [14,15,16]. Recently, some reports concentrated on the precipitation of the ωo phase in α2 laths during aging and studied the relationship between the α2 and ωo phases [10,17,18,19,20]. To summarize, there are two different thoughts regarding the precipitation of ωo from α2 phase. First, Huang et al. reported the perpendicular decomposition of coarse α2 laths in Ti-44Al-8Nb-B alloy and suggested that the α2 to βo(ω) transformation occurred after exposing at 700 °C in air for up to 10,000 h, indicating the occurrence of α2→βo→ωo transformation [17]. Similar cases of α→β→ω transformation in titanium alloys had been reported by Vohra et al. [18] and Gupta et al. [19]. Second, Bystrzanowski et al. observed that the applied stress could enhance the ωo precipitation and suggested that the ωo precipitation was directly transformed from the α2 phase [20]. Furthermore, Song et al. observed the direct α2 to ωo phase transformation in Ti-45Al-9Nb alloy after aging at 900 °C [10]. Although these studies discussed the transformation process and orientation relationships (ORs) between the ωo and α2 phases, few reports focused on the nucleation sites of the ωo phase and the preferential ORs between the ωo and α2 phases. Moreover, the nucleation behavior of ωo particles associated with α2 phase in βo phase has scarcely been reported. In this work, the precipitation of ωo phase in Ti-37.5-12.5Nb alloy was examined. The preferential OR between the ωo and α2 phases was evaluated. The corresponding mechanisms were also discussed.
2. Materials and Methods
An ingot of the Ti-37.5Al-12.5Nb (at%) used in this study was prepared using induction levitation melting. The ingot was flipped and remelted three times to ensure compositional homogeneity. Table 1 lists the chemical compositions measured via wet chemical analysis. Specimens with sizes of 10 × 10 × 10 mm were cut from the center of the ingot by electric-discharge machining. The specimens were heat treated at 1250 °C for 2 h followed by air cooling with a cooling rate of approximately 20 K/s. The microstructures after heat treatments were examined using a Zeiss Supra 55 scanning electron microscope (SEM) in back-scattered electron (BSE) mode. Thin foils used for transmission electron microscopy (TEM) observation were prepared by twin-jet electro-polishing in a solution of 65 vol% methanol, 30 vol% butanol, and 5 vol% perchloric acid at 30 V and −30 °C. TEM analysis was conducted on a Tecnai G2 F30 field emission transmission electron microscope operating at 300 kV. The compositions were obtained by energy dispersive X-ray spectroscopy (EDS) on TEM. Each parameter was an average value of more than five results measured at different locations.
3. Results
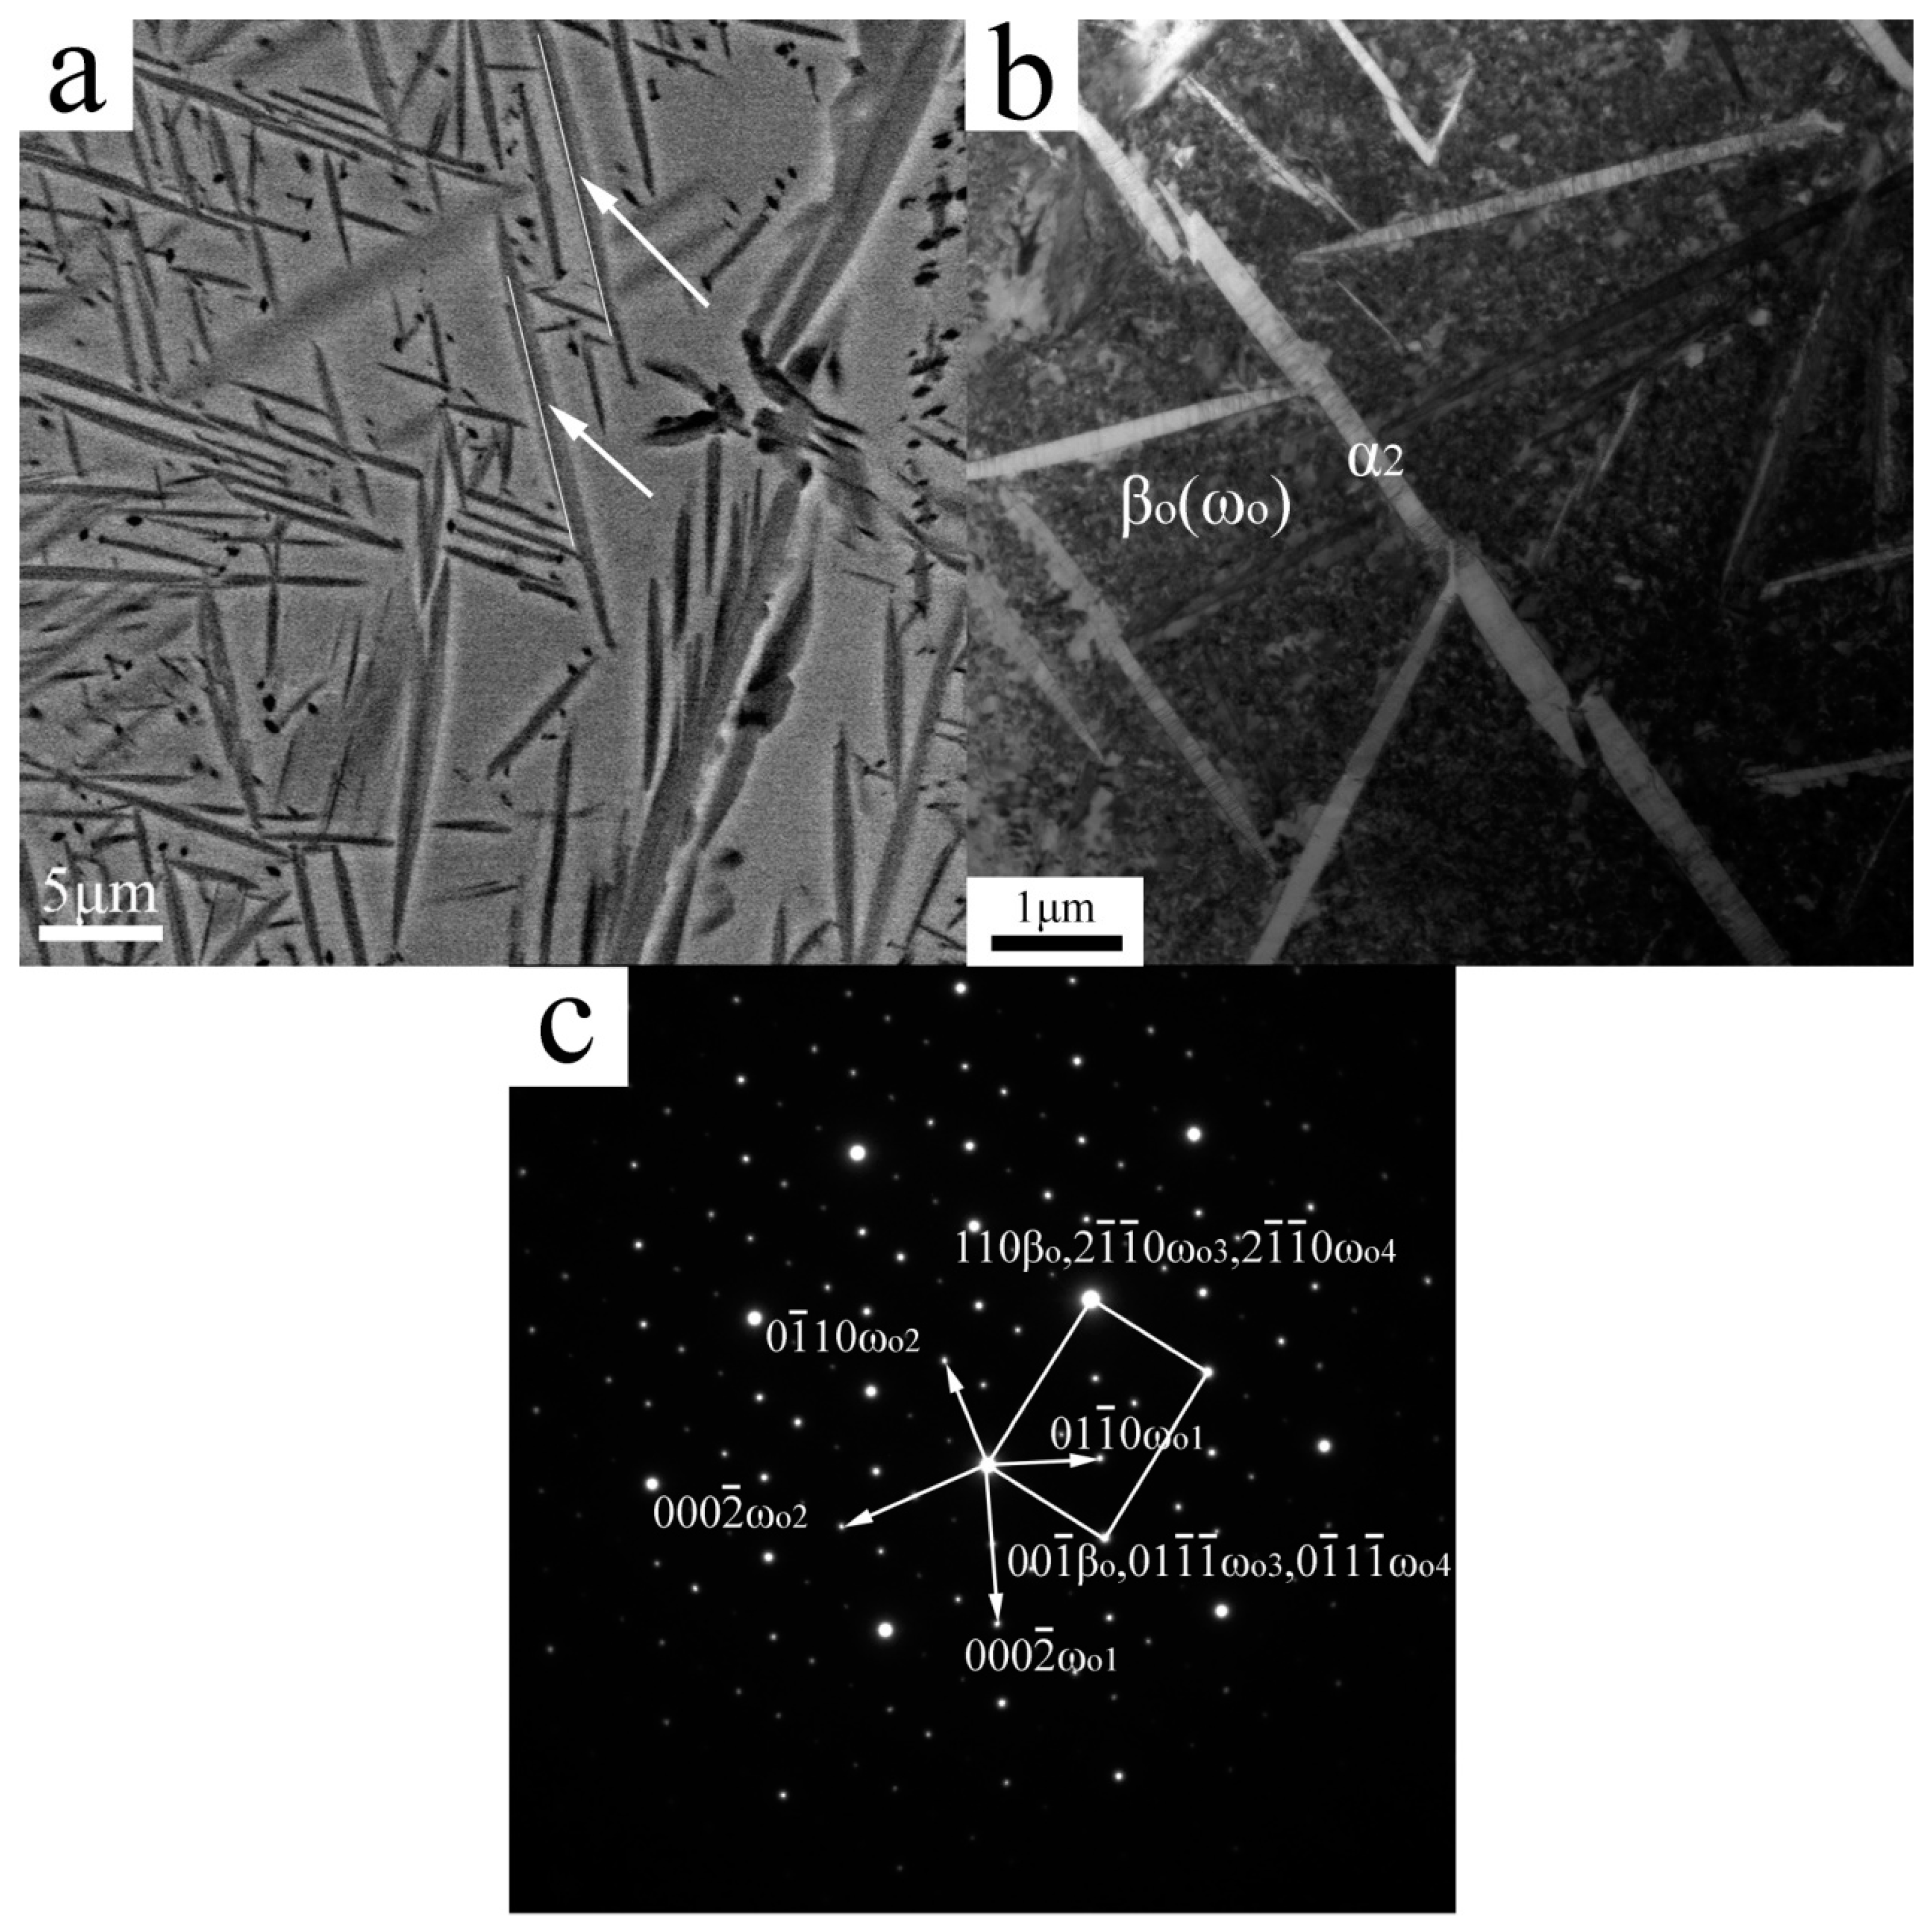
The actual composition of the alloy is Ti-37.0Al-13.0 Nb, as obtained by chemical analyses, which is close to the nominal composition. Figure 1a shows the BSE image of the Ti-37.5Al-12.5Nb alloy after air-cooling. The microstructure is composed of α2 plates and βo matrix which can be identified by TEM as in Figure 1b and Figure 2b. The well-defined dark lines (arrowed in Figure 1a) observed in α2 plates are believed to be the midribs of the martensite, which is similar to the result for the α2 phase form from the β phase by iced-brine quenching in Ti-44Al-4Nb-4Hf-0.1Si [21]. It is difficult to distinguish whether the ωo phase exists in the βo region or not from the SEM image. Thus, the precipitation behavior of the ωo phase can be studied by using TEM. Figure 1b shows the bright-field TEM image of the air-cooled sample. Some particles with sizes of tens of nanometers distribute uniformly in the βo region. The corresponding selected area diffraction (SAD) pattern of the βo region is shown in Figure 1c, indicating that βo phase can readily transform to ωo phase during air cooling in this alloy.
Commonly, the observed ωo phase in high Nb-TiAl alloys can form from the “ω-collapse” in βo phase [6], i.e., the {111} βo layers “collapse” and the “-A-B-A-B-A-B-A-” stacking sequence in βo phase transforms into “-A-B/A-B-A/B-A-”. There are four equivalent {111} βo layers so that four possible ωo variants can form in one βo grain. Considering the ORs between these four ωo variants and βo phase, the {} ωo diffraction spots of two ωo variants (denoted as “ωo1” and “ωo2” in Figure 1c) can be observed at 1/3{112} βo under the zone axes: <110> βo//<> ωo1, ωo2. However, the <> zone axes of “ωo3” and “ωo4” are parallel with <110> βo thus the diffraction patterns of these zone axes are overlapped completely. As a result, the intensities of the superposition spots of the ωo and βo phases are significantly increased in Figure 1c.
Figure 2a shows the bright-field image of the α2 plates. The circled area in Figure 2a demonstrates an almost precipitate-free region except for some particles that precipitate at the boundary of the α2 phase. The corresponding SAD pattern of this area is shown in Figure 2b. Only one {} ωo spot exists at 1/3{112} βo under the same beam direction as Figure 1c, which indicates that only one ωo variant exists at the α2/βo boundary. The OR between these phases is obtained as:
Figure 2c is the corresponding dark field image taken by using the diffraction spot of the ωo variant, as circled in the SAD pattern in Figure 2b. It is indicated that the precipitates at the α2/βo boundary are of one kind of ωo variants. The compositions of the different phases (denoted in Figure 2a) were obtained by EDS equipped on TEM in Table 2. The results show that the ωo precipitates at the periphery of the α2 phase are more concentrated in Nb than βo-martix and α2 phase. This case can be interpreted in that Nb is a stabilizing element of the ωo phase rather than of the βo and α2 phases [22,23,24]. Thus, ωo precipitations at the α2/βo boundary are more concentrated in Nb than βo and α2 phases because of the expulsion of Nb in the βo and α2 phases during the cooling process.
Figure 3 shows the High-resolution TEM (HRTEM) image of the α2/βo interface obtained under [0001] α2 direction. The fast Fourier transformation (FFT) images of the ωo and βo areas are shown in Figure 3b,c respectively. It is demonstrated that ωo phases sized about a few tens of nanometers nucleate at the α2 boundary in Figure 3a. This indicates that the preferential ωo phase can nucleate at the boundary of α2 phase and keep a certain OR with α2 phase.
Further studies on the interior of the α2 phase reveal that there are a few stacking faults in it. Figure 4a shows some fine-scale planar defects within the α2 phase, indicating certain phase transformations occur, as also suggested by the distortions at the boundary of the α2 plate. Figure 4b is the HRTEM image of the interface between the α2 and βo phase. The βo region and an ωo precipitate nucleated at the α2 boundary are observed (the corresponding FFT images are shown in Figure 4c,d). It is worth pointing out that although the beam direction is [] α2 and the ωo precipitate is under [0001] ωo direction, the OR between these two phases is as same as those obtained in Figure 2 and Figure 3. The magnified image of Figure 4b is shown in Figure 4e, the atomic stacking sequence of the α2 phase changes from “-ABAB-” to “-ABCABC-” (FCC-stacking) due to Shockley partial dislocations moving on alternate basal plane (0001) α2 planes. Repeating this mechanism every two basal planes of the hexagonal matrix leads to the crystal structure change, thus, the stacking faults can act as the nucleus of the γ phase [25,26]. Moreover, it has also been reported that γ phase precipitated in this alloy after annealing at 700 °C for 26 days [6]. However, the γ phase observed in [6] consists of γ grains precipitated directly from the matrix and not thin γ laths transformed from the α2 phase. Despite the different morphologies, these facts suggest that the γ phase is an equilibrium phase.
4. Discussion
4.1. Single ωo Variant Nucleated at the α2 Boundary
Transformation matrices are useful for calculating the ORs between the precipitation and matrix phase, which has been widely used in calculating the habit-planes and misorientations [27,28,29,30]. As described above, four possible ωo variants exist in the βo phase. The ORs between the ωo variants and βo phase and between the ωo and α2 phases are calculated by using the transformation matrices. The transformation matrices B for βo to ωo phases are shown in Table 3 (see Appendix A.1 for details). According to the Burgers OR between the α2 and βo phases: {110} βo//() α2; <> βo//<> α2, six βo variants can form from the α2 phase and the transformation matrices C for these variants are shown in Table 4 (see Appendix A.2 for details). The hypothesis is that the ORs between the α2 and ωo phases can be transferred by the relationships between α2 to βo and βo to ωo. The OR between the α2 and ωo phases (matrices T) can be readily obtained by
Tα2→ωo = B × C
L is the transformation matrix from the crystallographic coordinate system to the orthogonal coordinate system (see Appendix A). By using Equation (1), the matrices T for α2 to ωo phases are obtained, deriving the arbitrary parallel crystallographic directions between the α2 and ωo phases. According to these results, only four ωo variants have good lattice matching and two ORs between the α2 and ωo phases are obtained (see Appendix A.2 for details):
ORII can be also expressed as <>α2//<>ωo; {} α2//{} ωo by using a superimposed stereographic projection. Thus, both ORs calculated from the transformation matrices are the same as the results obtained by edge-to-edge matching calculation in Ti-45Al-9Nb alloy [10]. According to the results, the selection of OR between the α2 and ωo phases is essentially based on which ωo variant has good lattice matching with α2 phase. It was reported that the misfit between the α2 and ωo phases had a minimum value if ORI was formed [10]. Thus, it is believed that only one ωo variant nucleated at the α2 boundary.
Moreover, according to the EDS results in Table 2, the composition of the ωo particle nucleated at the boundary of the α2 phase is more concentrated in Nb than the βo matrix. It is suggested that the ωo phase primarily nucleates at the boundary of the α2 phase and enriches in Nb during growth. Thus, the untransformed area of the periphery of the α2 phase is depleted in Nb so that the precipitate-free regions are observed.
4.2. Thin γ Plates Precipitated within the α2 Phase
Because of the misfit matching between the α2 and ωo phases, distortions at the interface are expected. The interplanar spacings of the (0002) α2 and () ωo planes measured by HRTEM and SAD software are 0.233 nm and 0.229 nm, respectively. That is a 1.7% mismatch in the interplanar spacing when ORI is formed between the α2 and ωo phases. It means that α2 phase may have an extra (0002) α2 plane after successive stacking of 59 pairs of () ωo and (0002) α2 planes. The interplanar spacing of (111) γ is 0.232 nm is smaller than that of the (0002) α2 but larger than () ωo. Thus, the fine γ plates may relieve the distortion at the interface of the ωo and α2 phases (Figure 4e). It has been reported that the precipitation of γ in α2 is simply a HCP→FCC structure change which can be brought about if a/6 <> type Shockley partials move on alternate basal plane (0001) α2 planes [31,32]. As mentioned above, an extra (0002) α2 plane exists after successive stacking of 59 pairs of () ωo and (0002) α2 planes. This case may cause the distorted-region separated along the α2 and ωo interface. As a consequence, the sliding of the partial dislocations in the distorted-region can produce separated fine γ plates at certain intervals. Moreover, the interplanar spacing of 59 (0002) α2 planes is approximate 13.7 nm, which is consistent with the average spacing of the γ laths, which is approximate 12 nm as obtained from Figure 4a.
5. Conclusions
In this work, the precipitation of ωo phase in Ti-37.5Al-12.5Nb alloy was examined mainly by TEM. The ORs between different phases were calculated. The main results are summarized as follows:
- Only one ωo variant preferentially nucleates at the α2 boundaries. This is because the minimum misfit exists at the α2/ωo interface if the OR between these two phases is: <> α2//<0001> ωo; {} α2//{} ωo.
- Precipitate-free regions are observed at the α2 boundaries. EDS results indicate that the ωo precipitates are more concentrated in Nb than βo-matrix. The preferred nucleation of the ωo variant causes solute depletion surrounding the α2 plates, which inhibits the nucleation and growth of new ωo precipitates in the un-precipitated regions.
- Thin γ plates precipitate within the α2 phase. These fine γ plates can relieve the distortion caused by the mismatch at the α2/ωo interface.
Acknowledgments
This research was supported by the National Natural Science Foundation of China under Contract Nos. 51671016, 51601146 and 51271016.
Author Contributions
Lin Song and Junpin Lin conceived and designed the experiments; Teng Ye, Maohua Quan and Jianping He performed the experiments; Teng Ye analyzed the data and wrote the paper.
Conflicts of Interest
The authors declare no conflict of interest.
Appendix A
Because ωo and α2 phases have a hexagonal structure, we can define an orthogonal coordinate system with ‘x’ axis is [] direction, ‘y’ axis is [] direction and ‘z’ axis is [0001] direction. Then, the transformation matrix from the crystallographic coordinate system to the orthogonal coordinate system can be written as:
here ‘a’ and ‘c’ are lattice parameters.
In order to calculate the ORs between these phases, the indices of the crystallographic direction [uvtw] and the crystallographic face (hkil) in the four-index vector must transform into a three-index vector [uhvhwh] and (hhkhlh) in the hexagonal coordinate system, e.g.,
and
uh = 2u + v; vh = u + 2v; wh = w
hh = h; kh = k; lh = l
Considering a hexagonal structure, the indices of the normal of the crystallographic face [hh’kh’lh’] in the hexagonal coordinate system are: [2h + k·h + 2k·3l (a/c)2/2]. Thus, the index vector [u’v’w’] and [h’k’l’] in the orthogonal coordinate system can be obtained by L [uhvhwh]T and L [hh’kh’lh’], the relationship between the [u’v’w’] and [uvtw] is:
and
Similarly, the relationship between the [h’k’l’] and [hkil] is:
and
Appendix A.1. Transformation Matrices B from βo to ωo
The observed ωo phase in high Nb-TiAl alloys can be formed from ‘ω-collapse’ in the (111) βo plane. The OR between ωo and βo phase can be described as:
There are four different crystallographic equivalent <111> βo directions in βo lattice. Thus, four possible ωo variants exist in the βo phase with specific ORs between ωo and βo phases.
It is convenient to describe the ORs by using ‘(hkl) [uvw]’ matrix, which is written as:
All the vectors have been normalized and the orientation matrix A of the βo phase can be written as in Table A1.

Table A1.
The orientation matrix A of the βo phase.
| Variants | Orientation Relationship | Orientation Matrix A of the βo Phase |
|---|---|---|
| A1 | (111)βo//(0001)ωo; [] βo//[] ωo | |
| A2 | ()βo//(0001)ωo; [] βo//[] ωo | |
| A3 | ()βo//(0001)ωo; [] βo//[] ωo | |
| A4 | ()βo//(0001)ωo; [] βo//[] ωo |
Thus, the transformation matrices B from βo to ωo can be obtained by inverse matrices of A: B = A−1, (see Table 3 in the article).
Having noted that the calculated crystal directions of the ωo phase are described in the orthogonal coordinate, thus, they can be transformed from orthogonal coordinate to crystal coordinate by using the Equation (A4).
Appendix A.2. Transformation Matrices C from α2 to βo
According to the so-called Burgers OR between the α2 and βo phases: {110} βo//() α2; <> βo//<> α2, six βo variants can form from the α2 phase (see Table A2). As described above, we can obtain the transformation matrices C from α2 to βo. However, variants 3 and 4 indicate that the direction of [] α2 parallels the ‘x’ axis in the reference coordinate system (which means the crystal coordinate rotates 120° counterclockwise around the [0001] α2). Thus, the transformation matrices should be multiplied by the three-fold rotation matrix under the [0001] axis:
Moreover, variant 5 and 6 must be multiplied by the three-fold rotation matrix twice because the crystal coordinate rotates 240° counterclockwise around the [0001] α2. Thus, the transformation matrices C from α2 to βo can be obtained by L and R. (see Table 4 in the article).
Then, we can calculate the transformation matrices T from α2 to ωo, T = B C. As described above, the calculated crystal directions of the ωo phase should be transformed from orthogonal coordinate to crystal coordinate by using the Equation (A2).
For instance, when the view direction is [] α2 and [] α2, the paralleled crystallographic directions of ωo are shown in Table A2 and Table A3 (Moreover, the parallel crystallographic plane can be obtained from the normal of the crystal face by using Equation (A3)).
Table A2.
The paralleled crystallographic directions of different ωo variants under [] α2 direction.
Table A2.
The paralleled crystallographic directions of different ωo variants under [] α2 direction.
| B1 | B2 | B3 | B4 | |
|---|---|---|---|---|
| [uvtw] | [uvtw] | [uvtw] | [uvtw] | |
| C1 | 0.54 | 0 | 0 | 0.54 |
| −0.54 | −0.54 | 0 | −0.54 | |
| 0 | 0.54 | 0 | 0 | |
| 0.277 | −0.28 | 0.83 | −0.28 | |
| C2 | 0.54 | 0 | 0 | 0.54 |
| 0 | 0 | −0.54 | 0 | |
| −0.54 | 0 | 0.54 | −0.54 | |
| −0.28 | −0.83 | 0.28 | 0.28 | |
| C3 | −0.61 | 0 | 0 | −0.61 |
| 0.11 | 0.11 | 0.50 | 0.11 | |
| 0.50 | −0.11 | −0.50 | 0.50 | |
| 0.20 | 0.82 | −0.42 | −0.20 | |
| C4 | 0.06 | 0 | 0 | 0.06 |
| −0.50 | −0.50 | 0.44 | −0.50 | |
| 0.44 | 0.50 | −0.44 | 0.44 | |
| 0.48 | 0.42 | 0.54 | −0.48 | |
| C5 | 0.06 | 0 | 0 | 0.06 |
| 0.44 | 0.44 | −0.50 | 0.44 | |
| −0.50 | −0.44 | 0.50 | −0.50 | |
| −0.48 | −0.54 | −0.42 | 0.48 | |
| C6 | −0.61 | 0 | 0 | −0.61 |
| 0.50 | 0.50 | 0.11 | 0.50 | |
| 0.11 | −0.50 | −0.11 | 0.11 | |
| −0.20 | 0.42 | −0.82 | 0.20 |
Table A3.
The paralleled crystallographic directions of different ωo variants under [0001] α2 direction.
Table A3.
The paralleled crystallographic directions of different ωo variants under [0001] α2 direction.
| B1 | B2 | B3 | B4 | |
|---|---|---|---|---|
| [uvtw] | [uvtw] | [uvtw] | [uvtw] | |
| C1 | 0 | 0.67 | 0.67 | 0 |
| 0.33 | −0.33 | −0.33 | −0.33 | |
| −0.33 | −0.33 | −0.33 | 0.33 | |
| 0.68 | 0 | 0 | 0.68 | |
| C2 | 0 | 0.67 | 0.67 | 0 |
| 0.33 | −0.33 | −0.33 | −0.33 | |
| −0.33 | −0.33 | −0.33 | 0.33 | |
| 0.68 | 0 | 0 | 0.68 | |
| C3 | 0 | 0.67 | 0.67 | 0 |
| 0.33 | −0.33 | −0.33 | −0.33 | |
| −0.33 | −0.33 | −0.33 | 0.33 | |
| 0.68 | 0 | 0 | 0.68 | |
| C4 | 0 | 0.67 | 0.67 | 0 |
| 0.33 | −0.33 | −0.33 | −0.33 | |
| −0.33 | −0.33 | −0.33 | 0.33 | |
| 0.68 | 0 | 0 | 0.68 | |
| C5 | 0 | 0.67 | 0.67 | 0 |
| 0.33 | −0.33 | −0.33 | −0.33 | |
| −0.33 | −0.33 | −0.33 | 0.33 | |
| 0.68 | 0 | 0 | 0.68 | |
| C6 | 0 | 0.67 | 0.67 | 0 |
| 0.33 | −0.33 | −0.33 | −0.33 | |
| −0.33 | −0.33 | −0.33 | 0.33 | |
| 0.68 | 0 | 0 | 0.68 |
References
- Kim, Y.W. Gamma titanium aluminides: Their status and future. JOM 1995, 47, 39–42. [Google Scholar] [CrossRef]
- Paul, J.D.H.; Appel, F.; Wagner, R. The compression behaviour of niobium alloyed γ-titanium alumindies. Acta Mater. 1998, 46, 1075–1085. [Google Scholar] [CrossRef]
- Liu, Z.C.; Lin, J.P.; Li, S.J.; Chen, G.L. Effect of Nb and Al on the microstructures and mechanical properties of high Nb containing TiAl base alloys. Intermetallics 2002, 10, 653–659. [Google Scholar] [CrossRef]
- Stark, A.; Bartels, A.; Clemens, H.; Schimansky, F.P. On the Formation of Ordered ω-phase in High Nb Containing γ-TiAl Based Alloys. Adv. Eng. Mater. 2008, 10, 929–934. [Google Scholar] [CrossRef]
- Stark, A.; Oehring, M.; Pyczak, F.; Schreyer, A. In situ observation of various phase transformation paths in Nb-rich TiAl alloys during quenching with different rates. Adv. Eng. Mater. 2011, 13, 700–704. [Google Scholar] [CrossRef]
- Kainuma, R.; Fujita, Y.; Mitsui, H.; Ohnuma, I.; Ishida, K. Phase equilibria among α (hcp), β (bcc) and γ (L10) phases in Ti–Al base ternary alloys. Intermetallics 2000, 8, 855–867. [Google Scholar] [CrossRef]
- Chen, G.L.; Xu, X.J.; Teng, Z.K.; Wang, Y.L.; Lin, J.P. Microsegregation in high Nb containing TiAl alloy ingots beyond laboratory scale. Intermetallics 2007, 15, 625–631. [Google Scholar] [CrossRef]
- Bendersky, L.A.; Boettinger, W.J.; Burton, B.P.; Biancaniello, F.S.; Shoemaker, C.B. The formation of ordered ω-related phases in alloys of composition Ti4Al3Nb. Acta Metall. Mater. 1990, 38, 931–943. [Google Scholar] [CrossRef]
- Song, L.; Zhang, L.Q.; Xu, X.J.; Sun, J.; Lin, J.P. Omega phase in as-cast high-Nb-containing TiAl alloy. Scr. Mater. 2013, 68, 929–932. [Google Scholar] [CrossRef]
- Song, L.; Xu, X.J.; You, L.; Liang, Y.F.; Wang, Y.L.; Lin, J.P. Ordered α2 to ωo phase transformations in high Nb-containing TiAl alloys. Acta Mater. 2015, 91, 330–339. [Google Scholar] [CrossRef]
- Schloffer, M.; Rashkova, B.; Schöberl, T.; Schwaighofer, E.; Zhang, Z.; Clemens, H.; Mayer, S. Evolution of the ωo phase in a β-stabilized multi-phase TiAl alloy and its effect on hardness. Acta Mater. 2014, 64, 241–252. [Google Scholar] [CrossRef]
- Huang, Z.W. Ordered ω phases in a 4Zr–4Nb-containing TiAl-based alloy. Acta Mater. 2008, 56, 1689–1700. [Google Scholar] [CrossRef]
- Jiang, H.; Hu, D.; Wu, X. Thermal stability of the omega phase in Zr-containing TiAl alloys. J. Alloys Compd. 2009, 475, 134–138. [Google Scholar] [CrossRef]
- Gil, I.; Morris, M.A.; Morris, D.G. The effect of heat treatments on the microstructural stability of the intermetallic Ti–46.5Al–2W–0.5Si. Intermetallics 2001, 9, 373–385. [Google Scholar] [CrossRef]
- Zhou, L.Z.; Lupinc, V.; Guo, J.T. Microstructural stability of the intermetallic Ti–45Al–2W–0.5Si–0.5B in the 800–980 °C temperature range. Mater. Sci. Eng. A 2003, 354, 97–105. [Google Scholar] [CrossRef]
- Yin, W.M.; Lupinc, V.; Battezzati, L. Microstructural study of a γ-TiAl based alloy containing W and Si. Mater. Sci. Eng. A 1997, 239–240, 713–721. [Google Scholar] [CrossRef]
- Huang, Z.W. Thermal stability of Ti–44Al–4Nb–4Hf–0.2Si–1B alloy. Intermetallics 2013, 37, 11–21. [Google Scholar] [CrossRef]
- Vohra, Y.K.; Sikka, S.K.; Menon, E.S.K.; Krishnan, R. Direct evidence of intermediate state during alpha-omega transformation in Ti–V alloy. Acta Metall. 1980, 28, 683–685. [Google Scholar] [CrossRef]
- Gupta, S.C.; Sikka, S.K.; Chidambaram, R. On orientation relations between α and ω phases in Zr by texture studies using neutron diffraction method. Scr. Metall. 1985, 19, 1167–1169. [Google Scholar] [CrossRef]
- Bystrzanowski, S.; Bartels, A.; Stark, A.; Gerling, R.; Schimansky, F.P.; Clemens, H. Evolution of microstructure and texture in Ti–46Al–9Nb sheet material during tensile flow at elevated temperatures. Intermetallics 2010, 18, 1046–1055. [Google Scholar] [CrossRef]
- Hu, D.; Jiang, H. Martensite in a TiAl alloy quenched from beta phase field. Intermetallics 2015, 56, 87–95. [Google Scholar] [CrossRef]
- Song, L.; Xu, X.J.; You, L.; Liang, Y.F.; Lin, J.P. Phase transformation and decomposition mechanisms of the βo(ω) phase in cast high Nb containing TiAl alloy. J. Alloys Compd. 2014, 616, 483–491. [Google Scholar] [CrossRef]
- Klein, T.; Rashkova, B.; Holec, D.; Clemens, H.; Mayer, S. Silicon distribution and silicide precipitation during annealing in an advanced multi-phase γ-TiAl based alloy. Acta Mater. 2016, 110, 236–245. [Google Scholar] [CrossRef]
- Ye, T.; Song, L.; Gao, S.B.; Liang, Y.F.; Wang, Y.L.; Lin, J.P. Precipitation behavior of the ωo phase in an annealed high Nb–TiAl alloy. J. Alloys Compd. 2017, 701, 882–891. [Google Scholar] [CrossRef]
- Zhang, L.C.; Cheng, T.T.; Aindow, M. Nucleation of the lamellar decomposition in a Ti–44Al–4Nb–4Zr alloy. Acta Mater. 2004, 52, 191–197. [Google Scholar] [CrossRef]
- Denquin, A.; Naka, S. Phase transformation mechanisms involved in two-phase TiAl-based alloys—I. Lambellar structure formation. Acta Mater. 1996, 44, 343–352. [Google Scholar] [CrossRef]
- Mayer, S.; Petersmann, M.; Fischer, F.D.; Clemens, H.; Waitz, T.; Antretter, T. Experimental and theoretical evidence of displacive martensite in an intermetallic Mo-containing γ-TiAl based alloy. Acta Mater. 2016, 115, 242–249. [Google Scholar] [CrossRef]
- Wang, S.C.; Aindow, M.; Starink, M.J. Effect of self-accommodation on α/α boundary populations in pure titanium. Acta Mater. 2003, 51, 2485–2503. [Google Scholar] [CrossRef]
- Liu, H.W.; Luo, C.P.; Yuan, Y.; Liu, J.M.; Liu, Z.G. Interpretation of the morphology and crystallography of precipitate γ1-Ti4Nb3Al9 in L10-TiAl(Nb)-based intermetallics by invariant line theory. Intermetallics 2007, 15, 1497–1503. [Google Scholar] [CrossRef]
- Chen, W.; Zhang, J.Y.; Cao, S.; Pan, Y.; Huang, M.D.; Hu, Q.M.; Sun, Q.Y.; Xiao, L.; Sun, J. Strong deformation anisotropies of ω-precipitates and strengthening mechanisms in Ti–10V–2Fe–3Al alloy micropillars: Precipitates shearing vs precipitates disordering. Acta Mater. 2016, 117, 68–80. [Google Scholar] [CrossRef]
- Zhang, Y.G.; Tichelaar, F.D.; Schapink, F.W.; Xu, Q.; Chen, C.Q. An evidence of stress-induced α2→γ transformation in a γ-TiAl based alloy. Scr. Metall. 1995, 32, 981–985. [Google Scholar] [CrossRef]
- Wang, J.G.; Zhang, L.C.; Chen, G.L.; Ye, H.Q.; Nieh, T.G. Deformation-induced γ ↔ α2 phase transformation in a hot-forged Ti–45Al–10Nb alloy. Mater. Sci. Eng. A 1997, 239–240, 287–292. [Google Scholar] [CrossRef]
Figure 1.
Microstructure of the Ti-37.5Al-12.5Nb alloy after annealing at 1250 °C for 2 h followed by air cooling: (a) back-scattered electron (BSE) image; (b) bright-field transmission electron microscopy (TEM) image; (c) the corresponding selected area diffraction (SAD) pattern of the βo region in (b).

Figure 2.
TEM images of (a) bright-field image of the α2/βo boundary; (b) the corresponding SAD pattern at the α2/βo boundary; (c) dark-field image of the same area obtained by taking the spot of the ωo phase circled in the SAD pattern in (b).
Figure 2.
TEM images of (a) bright-field image of the α2/βo boundary; (b) the corresponding SAD pattern at the α2/βo boundary; (c) dark-field image of the same area obtained by taking the spot of the ωo phase circled in the SAD pattern in (b).
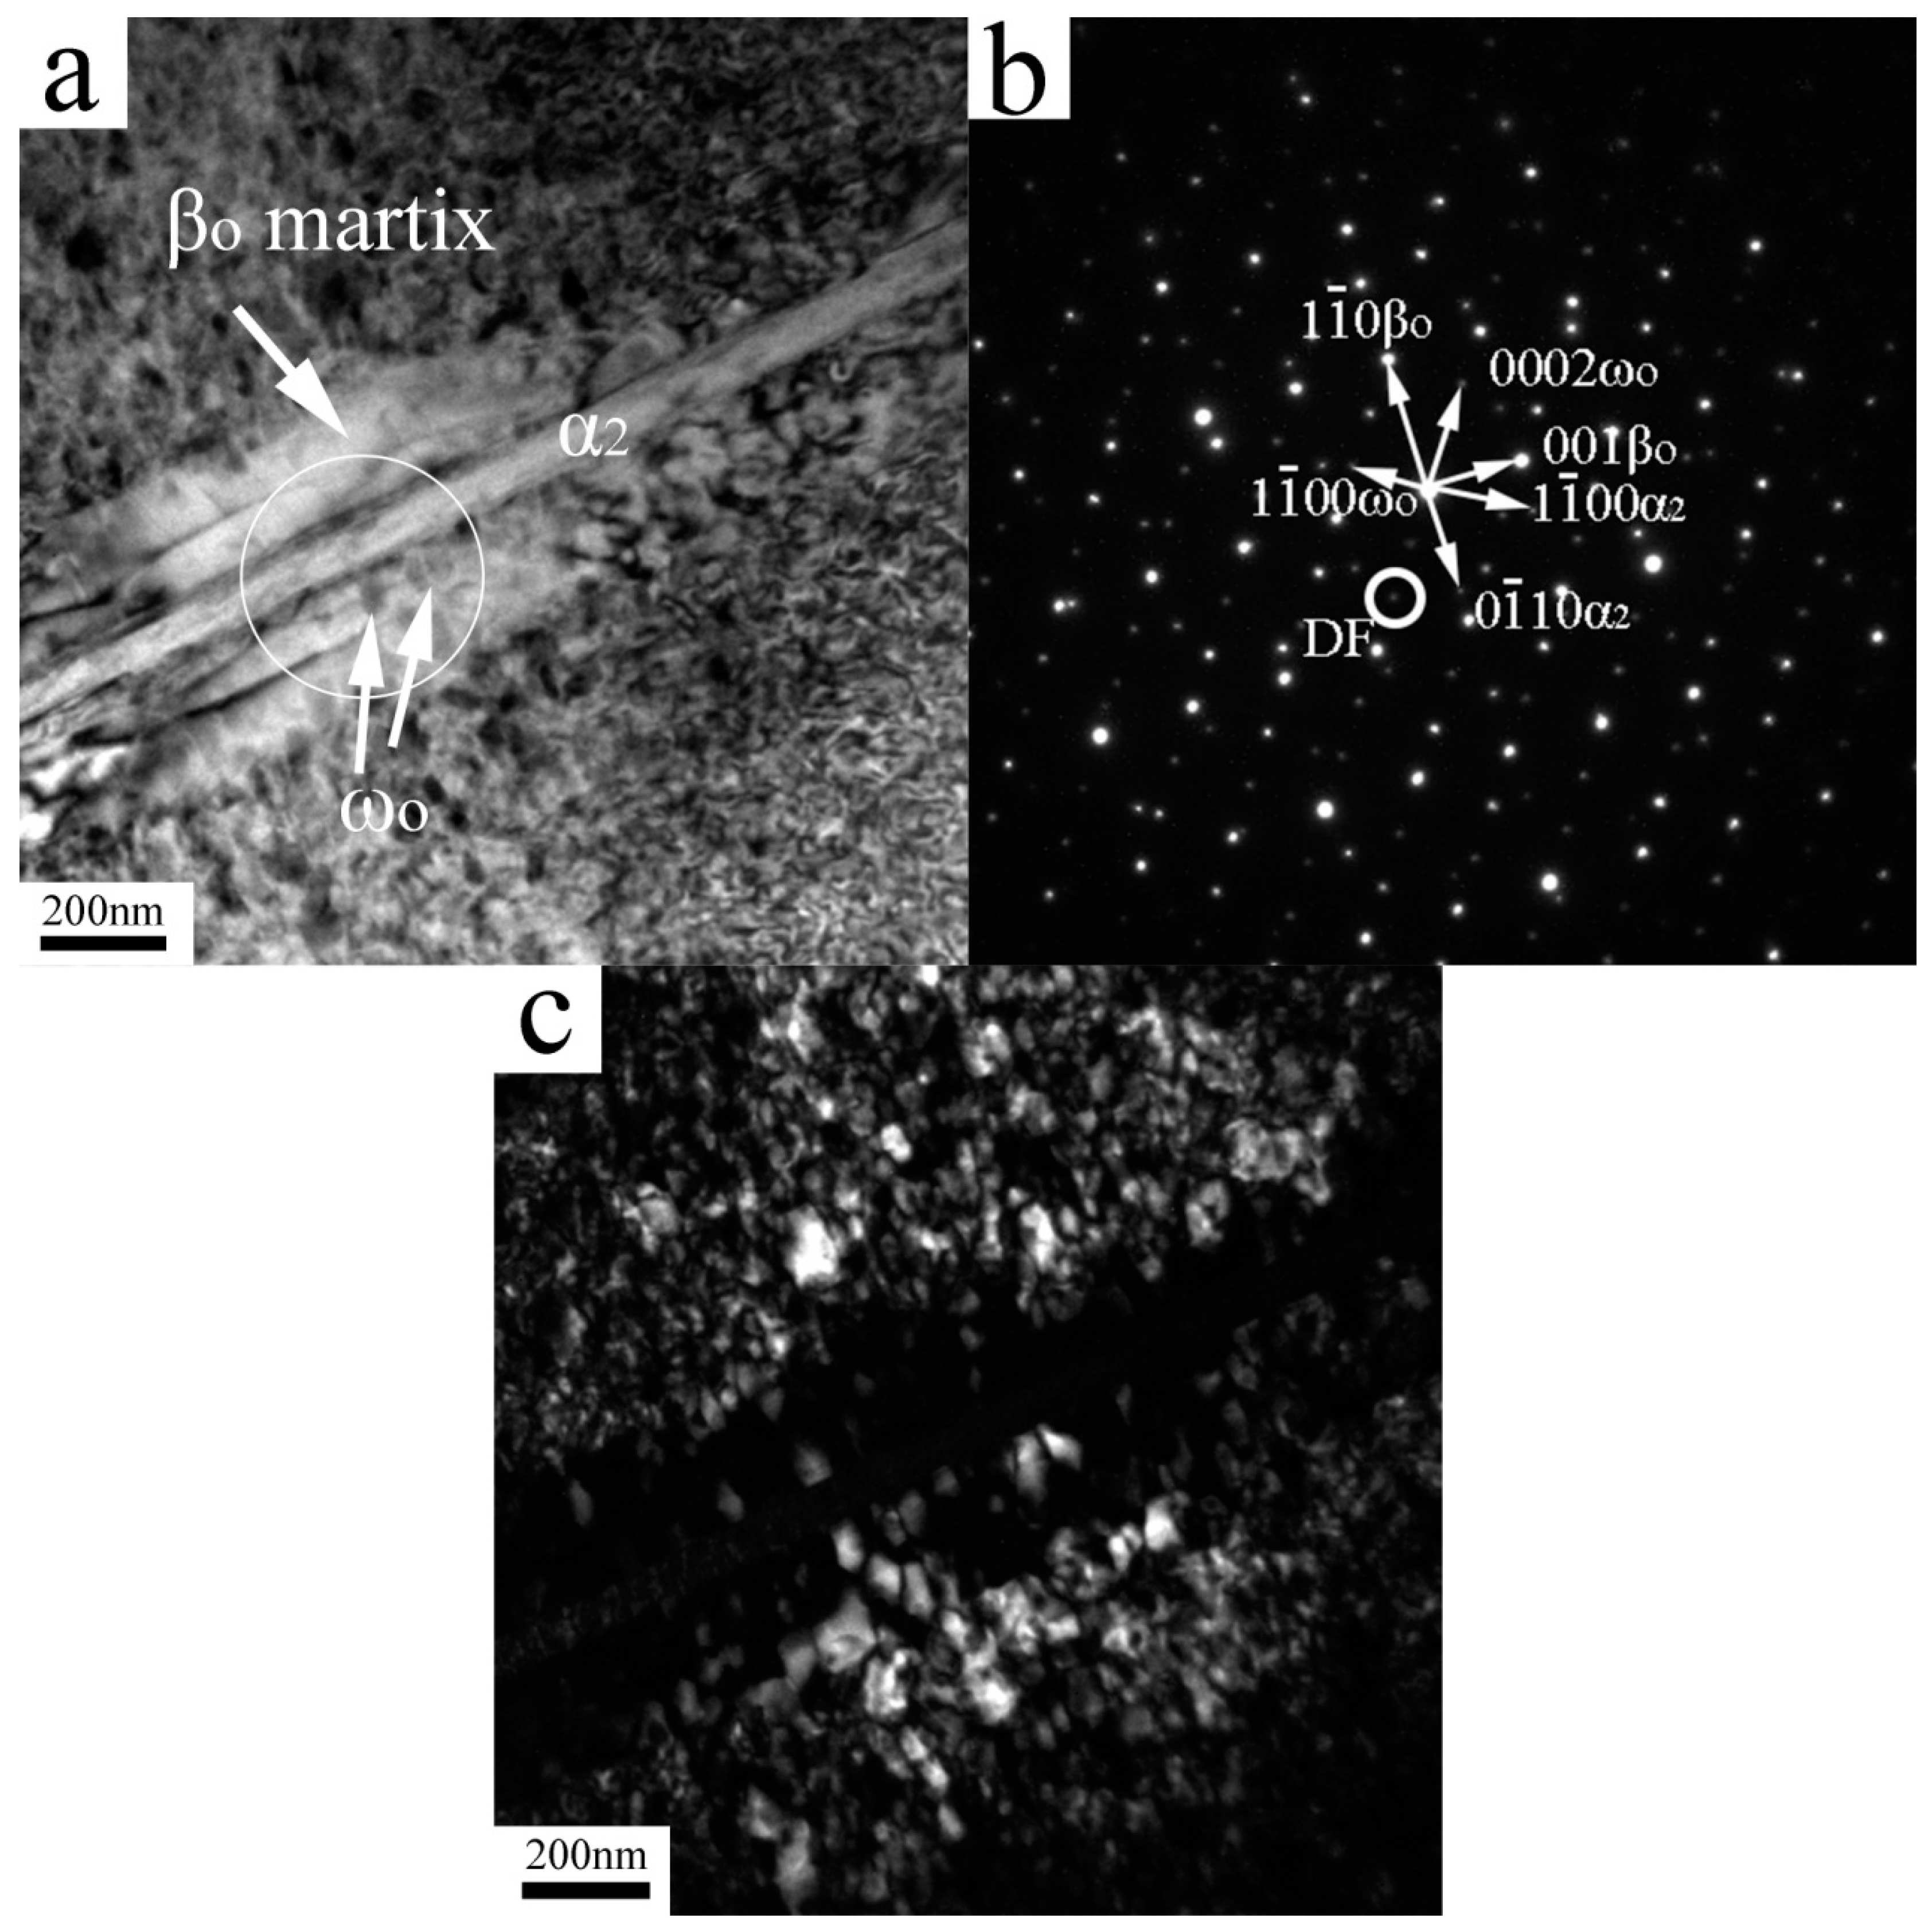
Figure 3.
(a) High resolution TEM (HRTEM) image of the α2/βo interface, the corresponding fast Fourier transformation (FFT) images of ωo and βo areas denoted in (a) are shown in (b,c) respectively.
Figure 3.
(a) High resolution TEM (HRTEM) image of the α2/βo interface, the corresponding fast Fourier transformation (FFT) images of ωo and βo areas denoted in (a) are shown in (b,c) respectively.
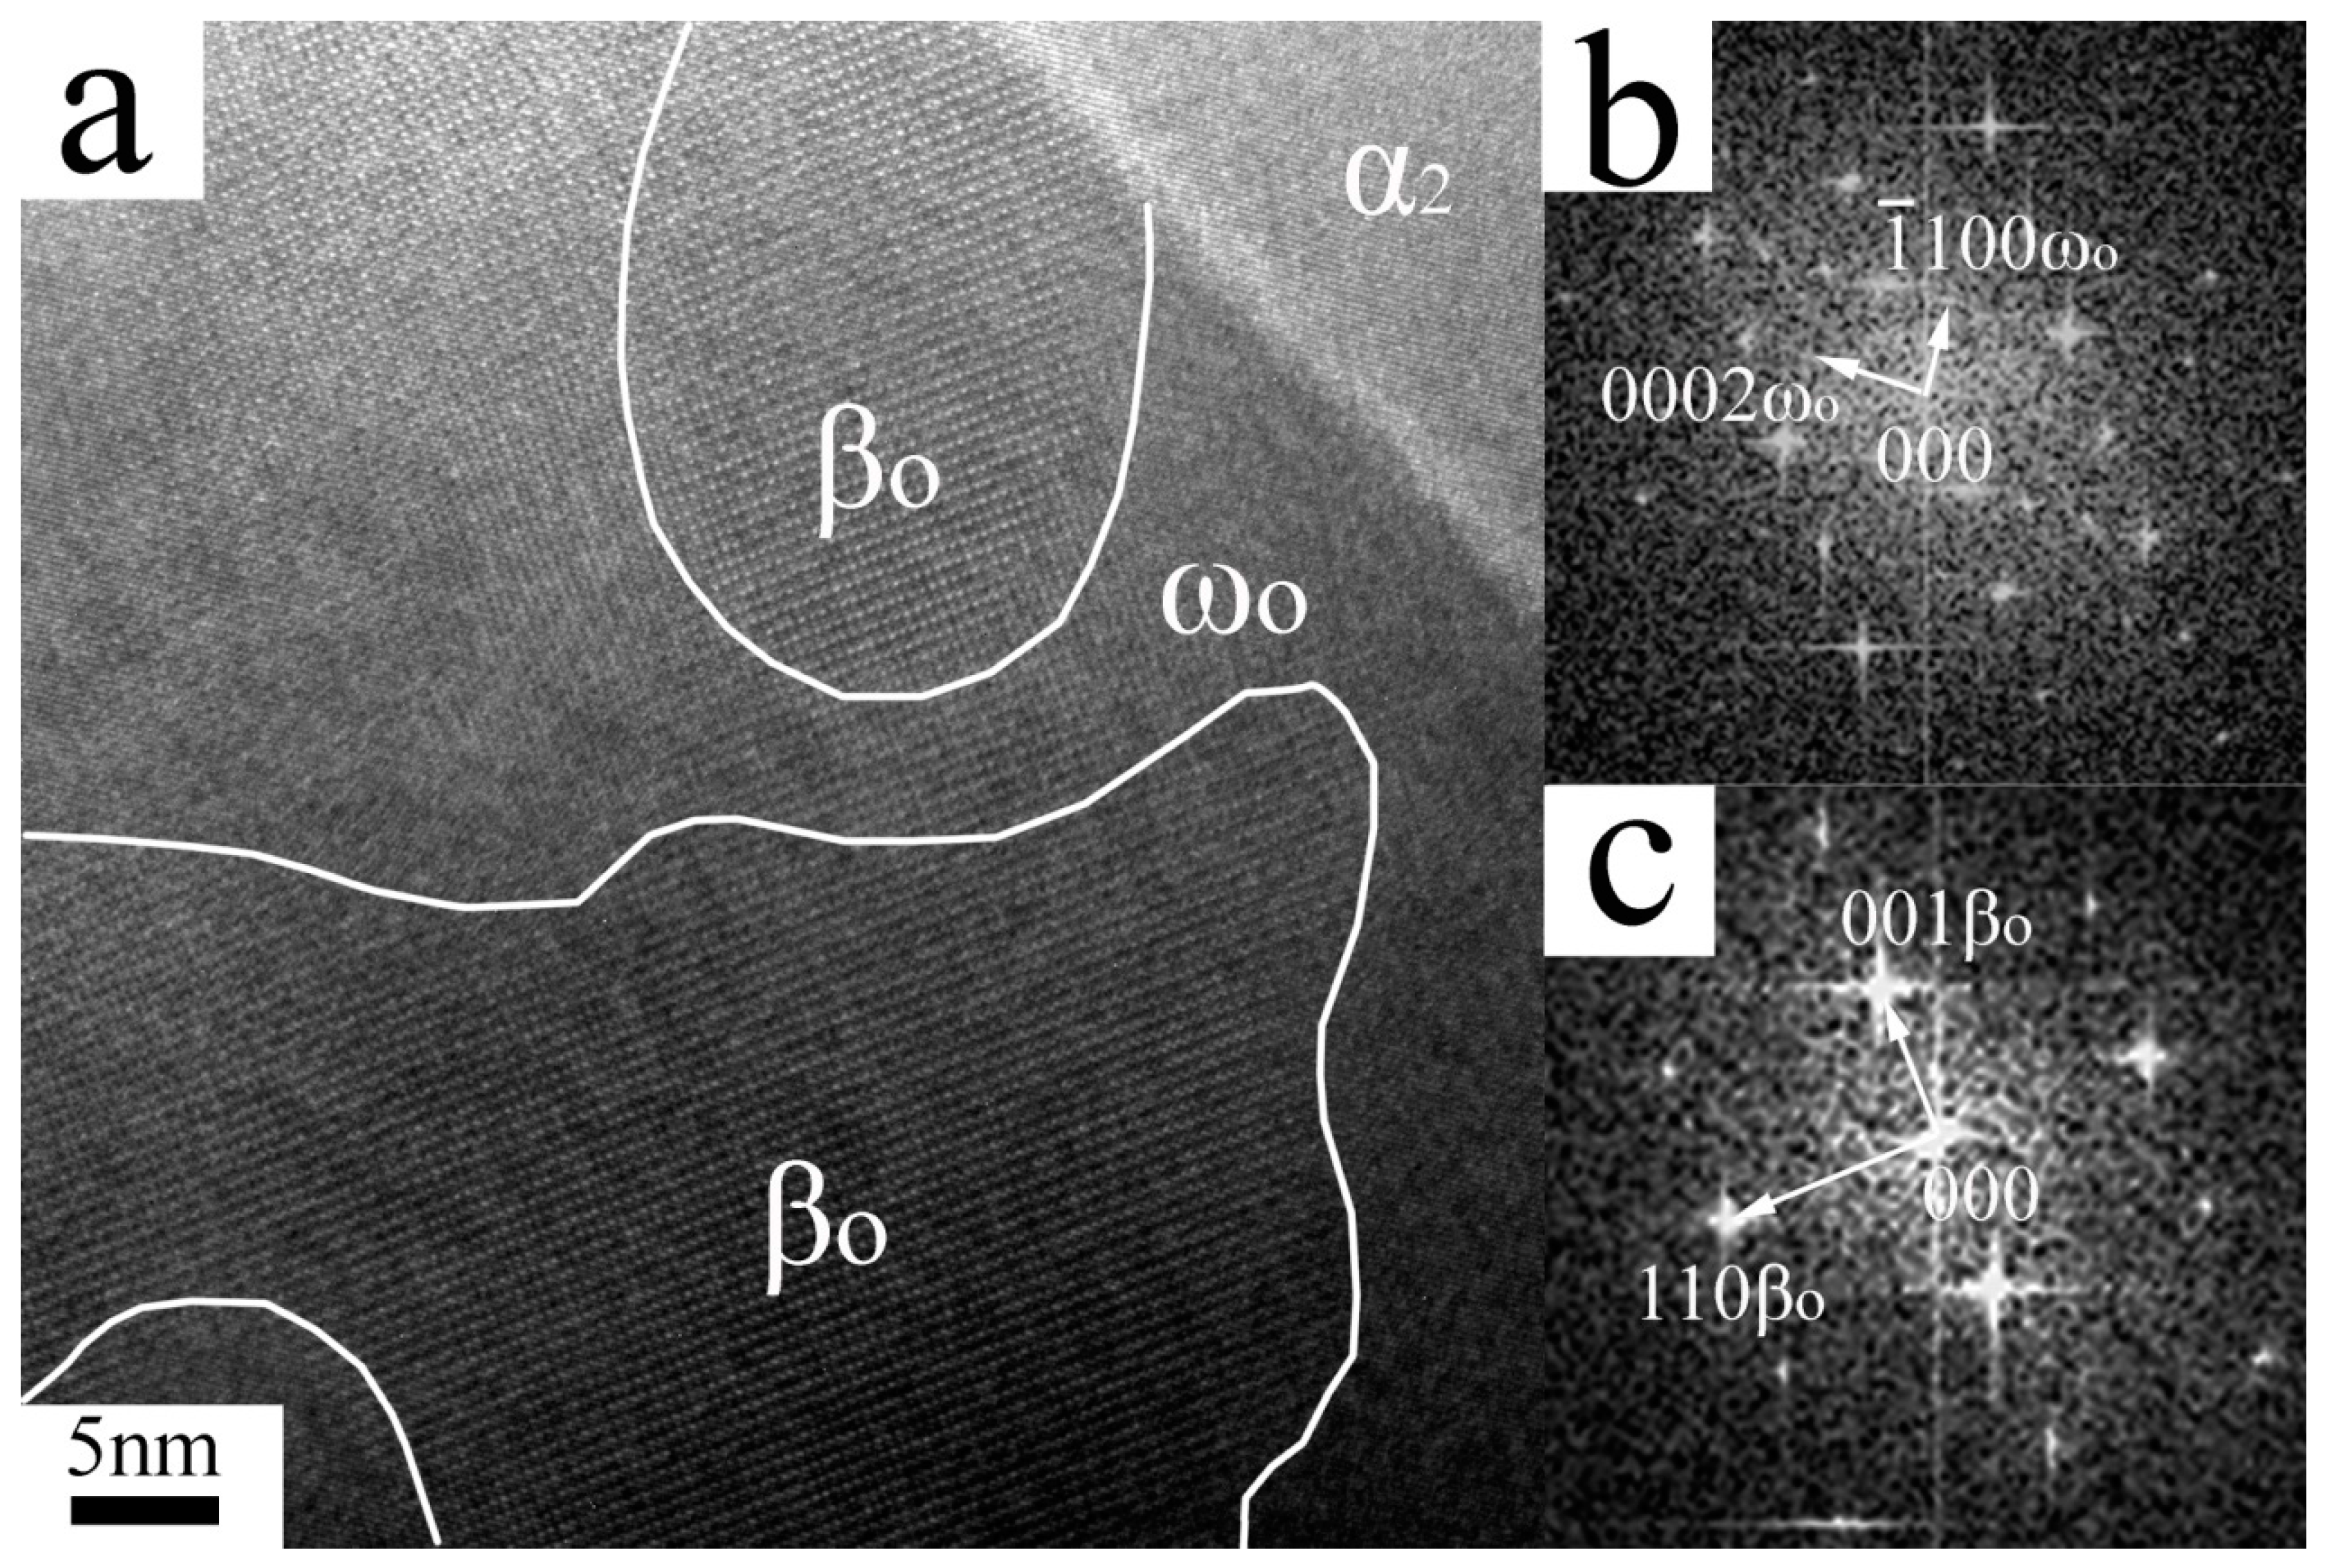
Figure 4.
(a) TEM image of the α2 plate; (b) HRTEM image of the α2 boundary; (c,d) the corresponding FFT images transformed from the ωo and βo regions in (b); (e) the magnified image of (b) at the α2/ωo interface.
Figure 4.
(a) TEM image of the α2 plate; (b) HRTEM image of the α2 boundary; (c,d) the corresponding FFT images transformed from the ωo and βo regions in (b); (e) the magnified image of (b) at the α2/ωo interface.
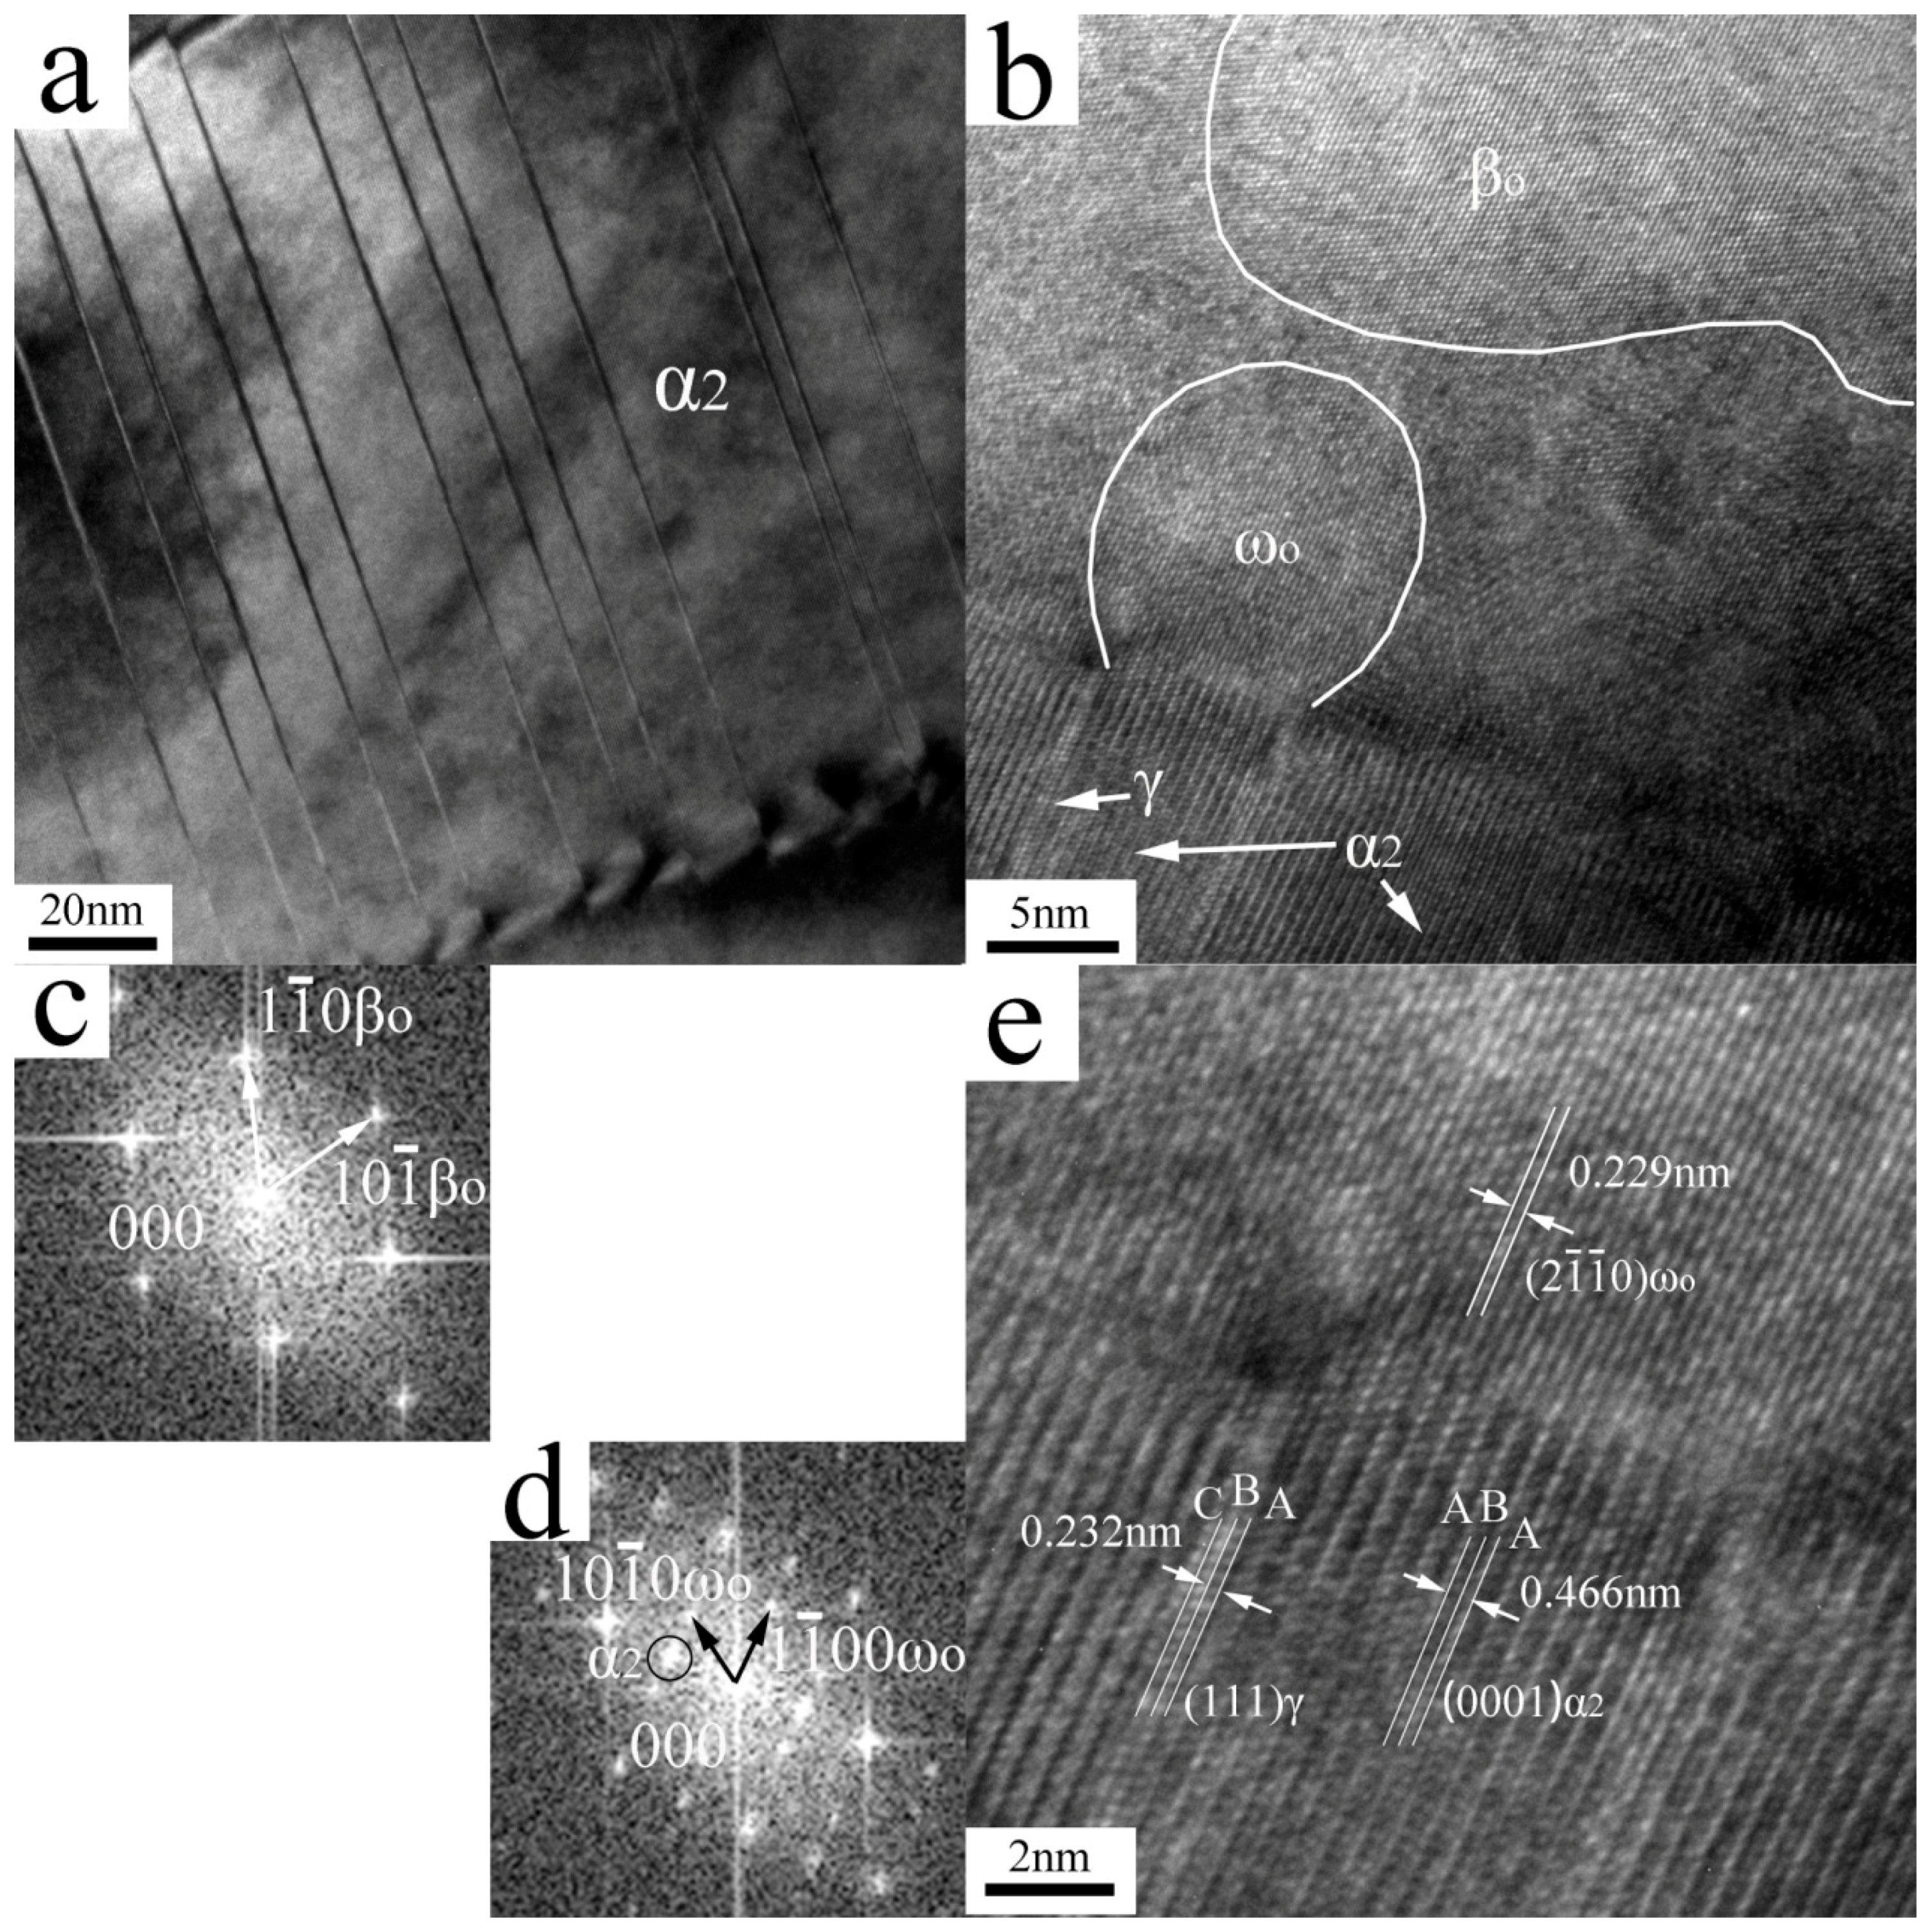
Table 1.
Chemical composition of the as-cast material.
| Elements | Ti | Al (at%) | Nb (at%) | O (wt%) | N (wt%) |
|---|---|---|---|---|---|
| Composition | Bal. | 37.0 | 13.0 | 0.018 | 0.0086 |
Table 2.
Energy dispersive X-ray spectroscopy (EDS) results of different phases.
| Regions | Composition (at %) | ||
|---|---|---|---|
| Ti | Al | Nb | |
| βo martix | 49.9 ± 0.8 | 38.5 ± 0.5 | 11.6 ± 0.8 |
| ωo | 49.5 ± 0.7 | 36.7 ± 0.5 | 13.8 ± 0.8 |
| α2 plate | 51.1 ± 0.8 | 38.1 ± 0.5 | 10.8 ± 0.8 |
Table 3.
The transformation matrices B for four ωo variants from the βo phase.
| Variants | Orientation Relationship | Transformation Matrices B for βo to ωo |
|---|---|---|
| B1 | (111) βo//(0001) ωo; [] βo//[] ωo | |
| B2 | () βo//(0001) ωo; [] βo//[] ωo | |
| B3 | () βo//(0001) ωo; [] βo//[] ωo | |
| B4 | () βo//(0001) ωo; [] βo//[] ωo |
Table 4.
The transformation matrices C for six βo variants from the α2 phase.
| Variants | Orientation Relationship | Transformation Matrices C for α2 to βo |
|---|---|---|
| C1 | (110) βo//(0001) α2; [] βo//[] α2 | |
| C2 | (110) βo//(0001) α2; [] βo//[] α2 | |
| C3 | (110) βo//(0001) α2; [] βo//[] α2 | |
| C4 | (110) βo//(0001) α2; [] βo//[] α2 | |
| C5 | (110) βo//(0001) α2; [] βo//[] α2 | |
| C6 | (110) βo//(0001) α2; [] βo//[] α2 |
© 2017 by the authors. Licensee MDPI, Basel, Switzerland. This article is an open access article distributed under the terms and conditions of the Creative Commons Attribution (CC BY) license (http://creativecommons.org/licenses/by/4.0/).
Share and Cite
MDPI and ACS Style
Ye, T.; Song, L.; Quan, M.; He, J.; Lin, J. Precipitation Behavior of ωo Phase in Ti-37.5Al-12.5Nb Alloy. Metals 2017, 7, 192. https://doi.org/10.3390/met7060192
AMA Style
Ye T, Song L, Quan M, He J, Lin J. Precipitation Behavior of ωo Phase in Ti-37.5Al-12.5Nb Alloy. Metals. 2017; 7(6):192. https://doi.org/10.3390/met7060192
Chicago/Turabian StyleYe, Teng, Lin Song, Maohua Quan, Jianping He, and Junpin Lin. 2017. "Precipitation Behavior of ωo Phase in Ti-37.5Al-12.5Nb Alloy" Metals 7, no. 6: 192. https://doi.org/10.3390/met7060192
Note that from the first issue of 2016, this journal uses article numbers instead of page numbers. See further details here.