Low Field Magnetic and Thermal Hysteresis in Antiferromagnetic Dysprosium
by
 , and
, and
Iuliia Liubimova
1, 
Miguel Lluís Corró Moyà
2,
Joan Torrens-Serra
2,
Vicente Recarte
3,
José Ignacio Pérez-Landazábal
3 and
and
Sergey Kustov
1,2,* 1
Department of Modern Functional Materials, ITMO University, 49 Kronverkskiy av., St. Petersburg 197101, Russia
2
Department of Physics, University of Balearic Islands, Cra. Valldemossa km 7.5, 07122 Palma de Mallorca, Spain
3
Departamento de Física, Universidad Pública de Navarra (UPNA), Campus Arrosadia, 31006 Pamplona, Spain
*
Author to whom correspondence should be addressed.
Metals 2017, 7(6), 215; https://doi.org/10.3390/met7060215
Submission received: 3 May 2017
/
Revised: 31 May 2017
/
Accepted: 7 June 2017
/
Published: 12 June 2017
Abstract
:Magnetic and thermal hysteresis (difference in magnetic properties on cooling and heating) have been studied in polycrystalline Dy (dysprosium) between 80 and 250 K using measurements of the reversible Villari effect and alternating current (AC) susceptibility. We argue that measurement of the reversible Villari effect in the antiferromagnetic phase is a more sensitive method to detect magnetic hysteresis than the registration of conventional B(H) loops. We found that the Villari point, recently reported in the antiferromagnetic phase of Dy at 166 K, controls the essential features of magnetic hysteresis and AC susceptibility on heating from the ferromagnetic state: (i) thermal hysteresis in AC susceptibility and in the reversible Villari effect disappears abruptly at the temperature of the Villari point; (ii) the imaginary part of AC susceptibility is strongly frequency dependent, but only up to the temperature of the Villari point; (iii) the imaginary part of the susceptibility drops sharply also at the Villari point. We attribute these effects observed at the Villari point to the disappearance of the residual ferromagnetic phase. The strong influence of the Villari point on several magnetic properties allows this temperature to be ranked almost as important as the Curie and Néel temperatures in Dy and likely also for other rare earth elements and their alloys.
1. Introduction
Dy (dysprosium) and other rare earth elements have unique physical and chemical characteristics which make them indispensable in numerous existing and innovative applications. Dy exhibits a transition at the Néel temperature, TN = 178 K, between the paramagnetic (PM) and helical-type antiferromagnetic (AFM) structure and an antiferro-ferromagnetic (FM) transition near 85 K on cooling (Curie temperature, TC) [1,2,3]. The latter is a first order magnetostructural transition, since the high-temperature hexagonal lattice undergoes orthorhombic distortions [4,5]. Rare earth metals and their alloys have been the subject of intense studies [6,7,8,9,10,11,12], in particular, due to the complexity of their temperature–field phase diagrams. Several magnetic structures have been reported in Dy between 90 and 178 K: fan [13,14,15], quasi 2D vortex [16], collinear ferromagnetic [17], vortex [18,19], and angle ferromagnetic [19]. A related problem pending interpretation is the difference in behavior of Dy and other rare earths and their alloys in the AFM state for cooling and heating from the FM phase [20,21,22,23]. This effect is usually referred to as thermal hysteresis. Del Moral et al. [20] ascribed the difference between the susceptibility on cooling and heating to different sizes of spiral spin domain walls (DW). The same idea was employed by Palmer to account for the thermal hysteresis of elastic and anelastic properties of Dy and other rare earth alloys [21,22]. Two possible types of DWs in the helical phase were considered [22]. Type I DWs are perpendicular to the c-axis of the hexagonal lattice and separate domains with opposite senses of spin rotation. These DWs represent kinds of thin ferromagnetic layers. Type II DWs are parallel to the c-axis, have a complex meshing of spins, and probably do not possess net magnetic moment. DWs of type I were supposed to be inherited from ferromagnetic DWs and, hence, were considered as the origin of the thermal hysteresis in rare earths and their alloys [22,23]. Later on, McKenna et al. applied the so-called transient enhancement and temperature modulation methods in order to study hysteretic phenomena in the FM and AFM phases of Dy [9,11]. Due to limited resolution, the transient enhancement was studied up to 120 K for heating scans [11]. Temperature modulation revealed temperature hysteresis up to approximately 170 K. This temperature agreed with observations of a minor effect in the real part of the alternating current (AC) susceptibility [9]. The authors speculated that at a temperature around 170 K the spiral spin domains disappear in the AFM phase or demonstrate some “reduced effect” [11]. Kobayashi [23] directly observed magnetic hysteresis loops (HL) in the AFM phase of polycrystalline Dy during heating from the FM phase. Due to limitations in resolution, the hysteresis was detected on heating only up to 130 K and could not be discerned on cooling [23]. The magnetic hysteresis was accounted for, as in previous studies, by spiral spin DWs (of type I) inherited from the ferromagnetic DWs [23]. Chen et al. [24] reported fluctuations of the AFM domain wall structure in 500 nm thick epitaxial Dy layers, detected by X-ray photon correlation spectroscopy. They concluded that the DW structure undergoes long-term fluctuations in a relatively narrow temperature range below the Néel temperature. According to [24], the DW fluctuations freeze out some 10 K below TN, quite close to the temperature where the thermal hysteresis vanishes in Dy.
Recently, a complete loss of low field magnetoelastic coupling in polycrystalline Dy was reported at the temperature of the Villari point (TVP) around 166 K [25]. A long-term relaxation of the reversible inverse magnetostriction (reversible Villari effect, RVE) during heating from the FM phase was found below the TVP, pointing to a non-equilibrium state of the magnetic structure. The thermal hysteresis of the Villari effect vanished at the TVP simultaneously with the disappearance of the time dependence, indicating an abrupt transition of polycrystalline Dy to the equilibrium state at this temperature. The change of the sign of magnetoelastic coupling at the TVP was ascribed [25] to a possible existence of vortex AFM structure [16,18,19] between the TN and the TVP. Observation of the long-term relaxation below the TVP [25] seems to be at variance with the reported stability of the DW structure over the same temperature range [24]. Therefore, the abrupt transition from the non-equilibrium to the equilibrium magnetic state of AFM dysprosium at the TVP [25] revealed by means of RVE studies calls for independent confirmation. In the present work high-resolution measurements of the RVE were combined with measurements of conventional AC susceptibility. We found that the data on AC susceptibility are in excellent agreement with the results of the previous RVE studies [25]. We deduced a simple relationship between the width of conventional loops and the RVE hysteresis under periodic field. This solution allows us to derive the temperature dependence of the coercive force over the entire range of the existence of the AFM phase and correlate it with the behavior of the magnetic susceptibility. Based on the experimental results obtained, we suggest that the thermal hysteresis in Dy, and probably other rare earths and their alloys, is related to the residual FM phase, stabilized by lattice defects.
2. Materials and Methods
Mechanomagnetic spectroscopy is a method to detect the RVE at ultrasonic frequencies [26,27,28]. The technique employs a classical three component resonant Piezoelectric Ultrasonic Composite Oscillator [29,30] with an additional channel to register periodic flux density induced in a sample by oscillatory stress/strain. The samples usually are half-wave length rods performing longitudinal resonant oscillations in the fundamental mode. The strain in the middle section of the sample (stress/strain antinode) is:
where is the angular frequency, and is the peak value of strain (referred to hereafter as strain amplitude). The oscillatory flux density induced in this section of the sample and detected by means of a small pickup coil placed around the sample is:
where and are the real and imaginary components of the flux density amplitude, respectively. Only the real part of the RVE amplitude, , will be considered hereafter, since << .
The experimental setup operated at a frequency around 90 kHz, covering the ranges of between 10−7 and 10−4, temperature T from 77 to 400 K and the axial magnetic field H up to 18 kA/m. A description of the method and experimental setup can be found elsewhere [27,28,29,30]. In the present work continuous spectra were registered between 250 and 80 K (cooling the sample below TC) and between 250 and 95 K (thermal cycle in the AFM phase) for constant values of H, and
fixed at 10−5. The cooling/heating rate was 2 K/min.
hysteresis was registered at different selected temperatures during interruptions of cooling/heating. The frequency of the saw-tooth magnetic field cycles was 0.001 Hz. Each loop contained 150 experimental points. The temperature dependence of the real and imaginary components of the AC magnetic susceptibility (frequencies 2 and 20 Hz, 3.5 Oe excitation field) was registered using a MPMS XL-7 SQUID magnetometer (Quantum Design Inc., San Diego, CA, USA). Samples with dimensions of 1.0 × 1.3 × 12.2 mm3 were prepared by spark erosion from a sheet of polycrystalline dysprosium of 99.9 wt % purity, supplied by Sigma Aldrich (St. Louis, MS, USA).
3. Results
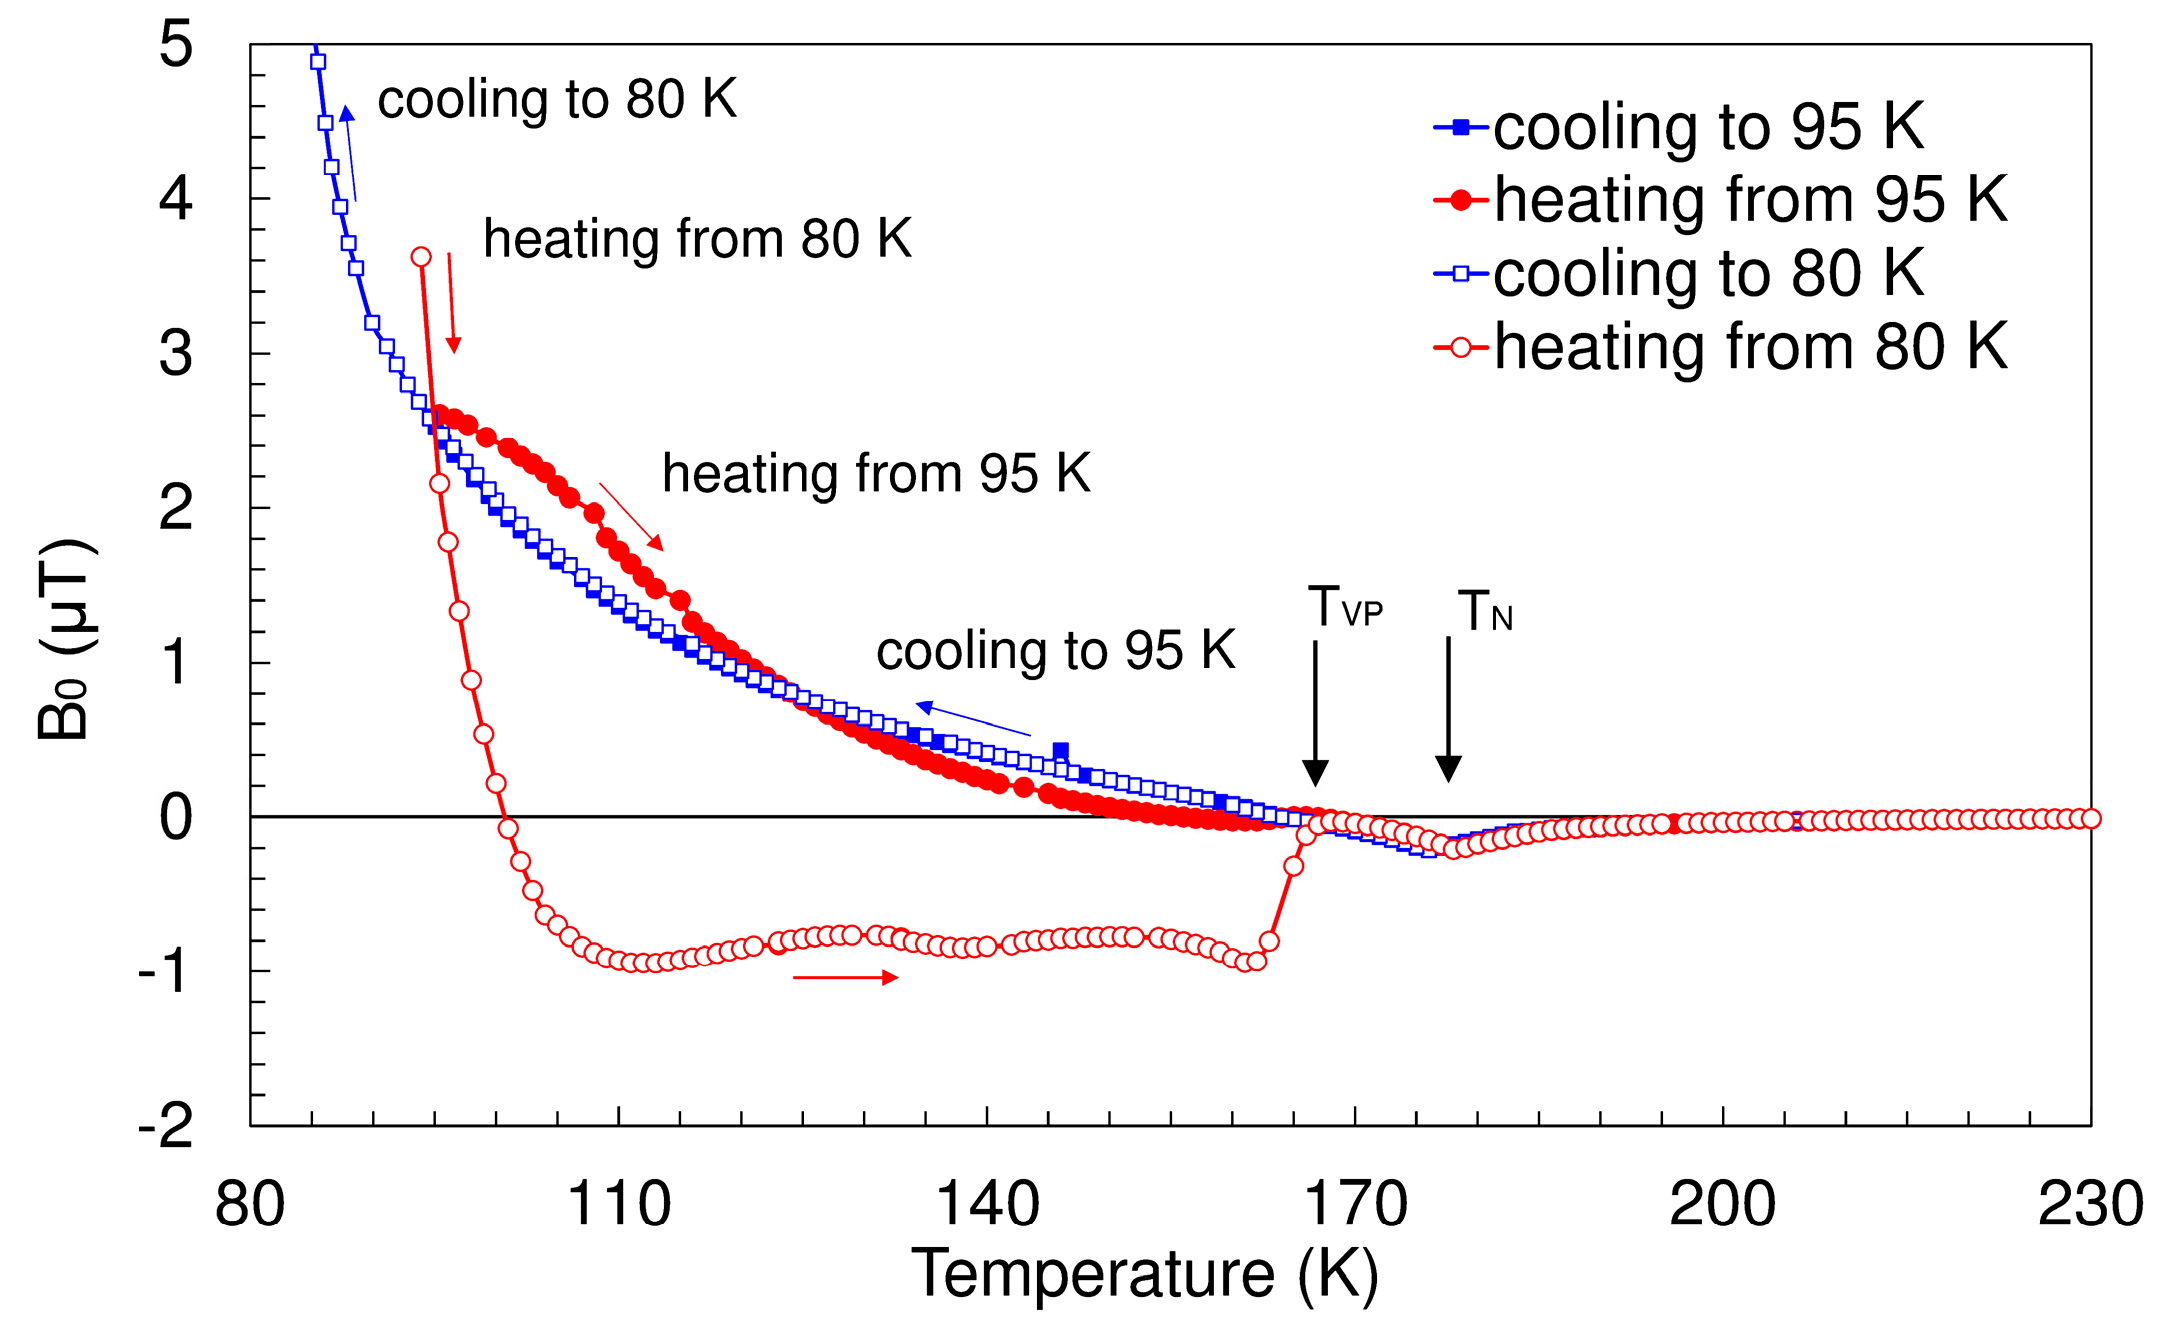
Continuous spectra registered in thermal cycles between 250 and 80 K and between 250 and 95 K are shown in Figure 1. We note that all spectra coincide perfectly down to TVP = 166 K. The RVE is negative over this temperature range. The Néel temperature is clearly detected at 178 K as a RVE minimum (maximum of the RVE absolute value).
Further, cooling scans are undistinguishable for the two cycles. Despite quantitative differences in heating scans, they show the same qualitative features. First, the two dependences demonstrate a cross-over effect: values are higher on heating than on cooling immediately after the start of heating, but become lower at 95 and 126 K for cycles to 80 and 95 K, respectively. The data only above Tc are shown for the cycle 280–80–250 K, the results above and below Tc were compared in [25]. Second, changes sign on heating at around 100 and 150 K for cycles to 80 and 95 K, respectively. Thus, a decrease of the lowest temperature of the cycle shifts towards lower values the cross-over temperature of the thermal hysteresis and the temperature where . We emphasize here that the point with variable temperature, where on heating, is not necessarily the Villari point. Indeed, the condition in general marks only an extremum in the dependence. Field dependences , which are used to identify the Villari point [28], cannot be registered over the temperature range where , since the magnetic state of Dy during heating from the FM phase is strongly non-equilibrium and relaxes towards positive values [25].
Figure 2a–c shows hysteresis loops (HLs) at selected temperatures in the AFM phase. Each HL was registered for the thermally demagnetized state of the sample. Measurements were taken during (a) interruptions of cooling from above the Néel temperature, interruptions of heating from 95 K (b) and from 80 K (c). Before each measurement the sample was held for 20 min at constant temperature. As was shown in [25], negative values registered on continuous heating show intense relaxation after interruptions of heating. During relaxation, changes sign to positive. Therefore, measurements of after relaxation at constant temperature yield positive RVE at 140 K despite negative registered during continuous temperature scans; Figure 1. HLs change the slope to negative above TVP = 166 K, see e.g., the HLs at 173 K in Figure 2, in agreement with the temperature spectra in Figure 1. These regularities are in full agreement with previous results [25].
The loops on heating and cooling are similar for corresponding temperatures for cycling within the AFM phase, Figure 2a,b. A slight difference in values for cooling and heating is due to the weak temperature hysteresis of RVE, Figure 1. On the other hand, the results obtained during heating from the FM phase are qualitatively different, Figure 2c. The most prominent feature provoked by the excursion into the FM state is a strong increase of the HL width, as compared to the thermal cycle in the AFM phase, Figure 2b. The difference between the HL width and shape persists up to the temperature of the Villari point, TVP = 166 K [25]. The HLs in Figure 2c recover their shape, typical for cooling, above TVP, see e.g., the HL at 173 K and temperature spectra in Figure 1.
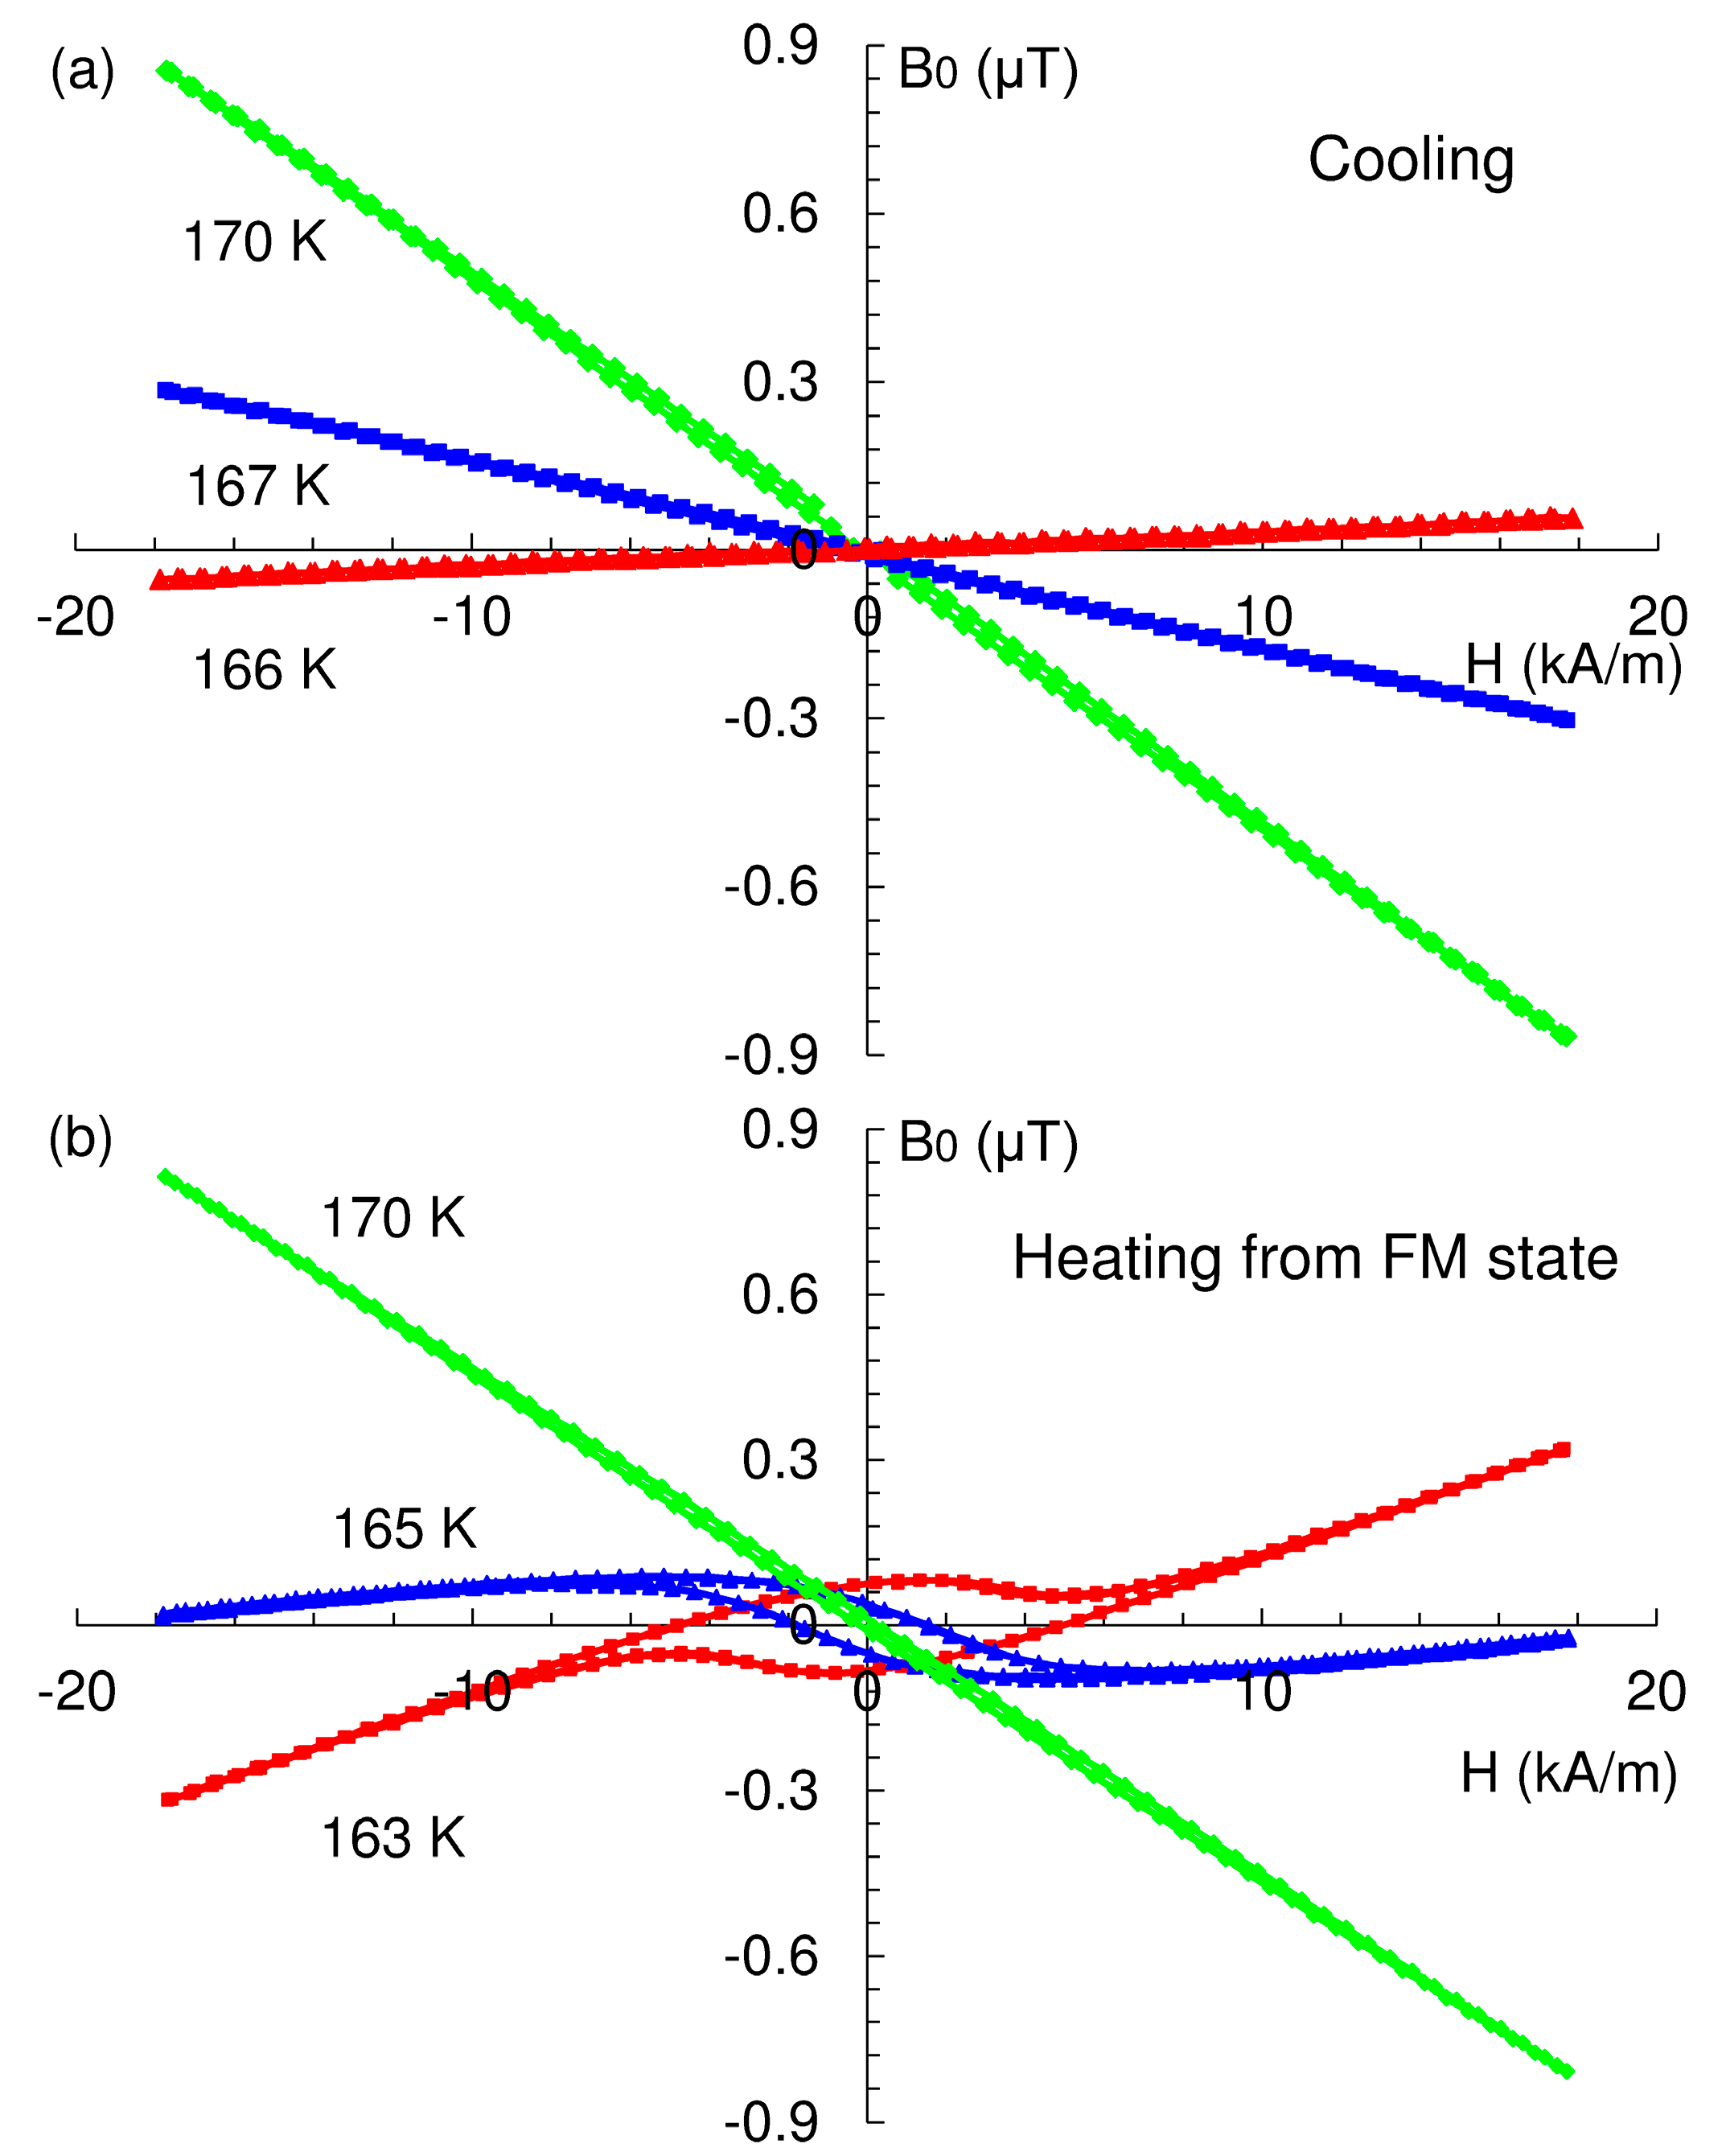
The abrupt change at around 166 K of the loops registered during heating from the FM phase is illustrated by Figure 3. An unusual feature is the formation of central hysteresis for heating scans for temperatures slightly below TVP, Figure 3b. Similar behavior has been found close to the Villari point in ferromagnetic Ni-Fe-Ga-Co alloys [28].
In the present work two characteristics of the loops were quantified: their width and area. The area of the HLs was calculated using numerical integration:
The relative loop area, was determined as:
with the maximum value of in a field cycle and the area under each half of a HL.
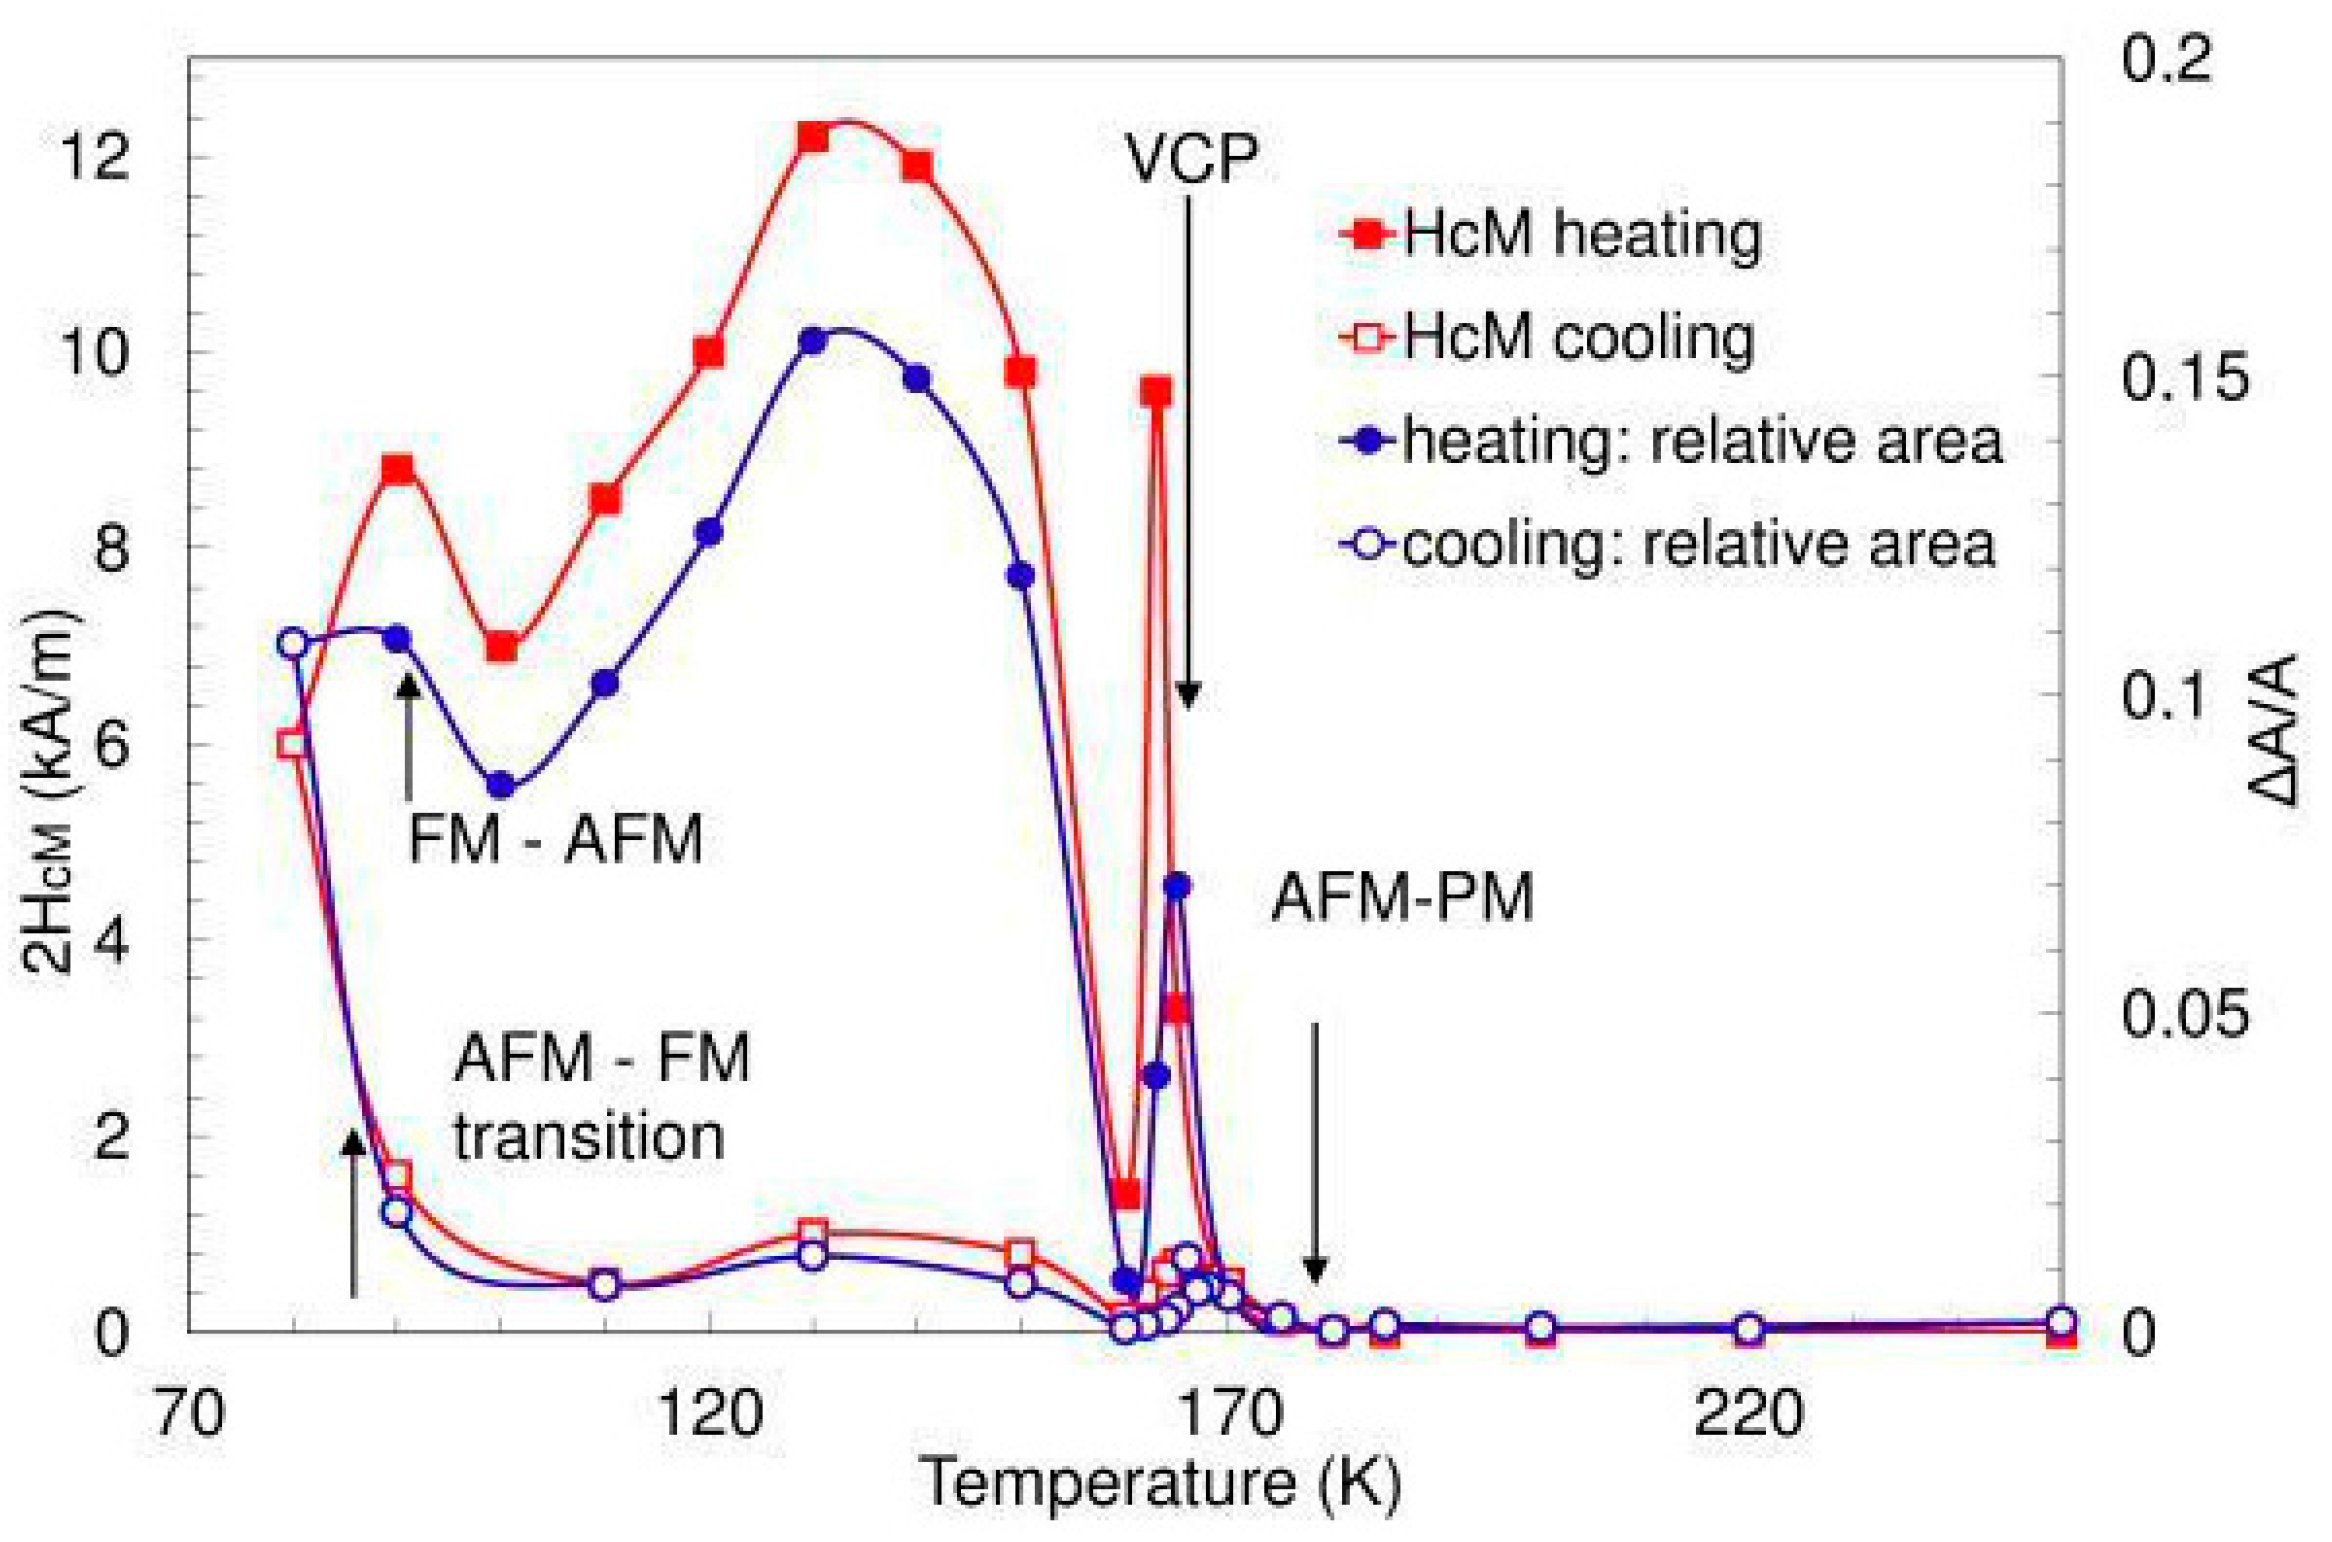
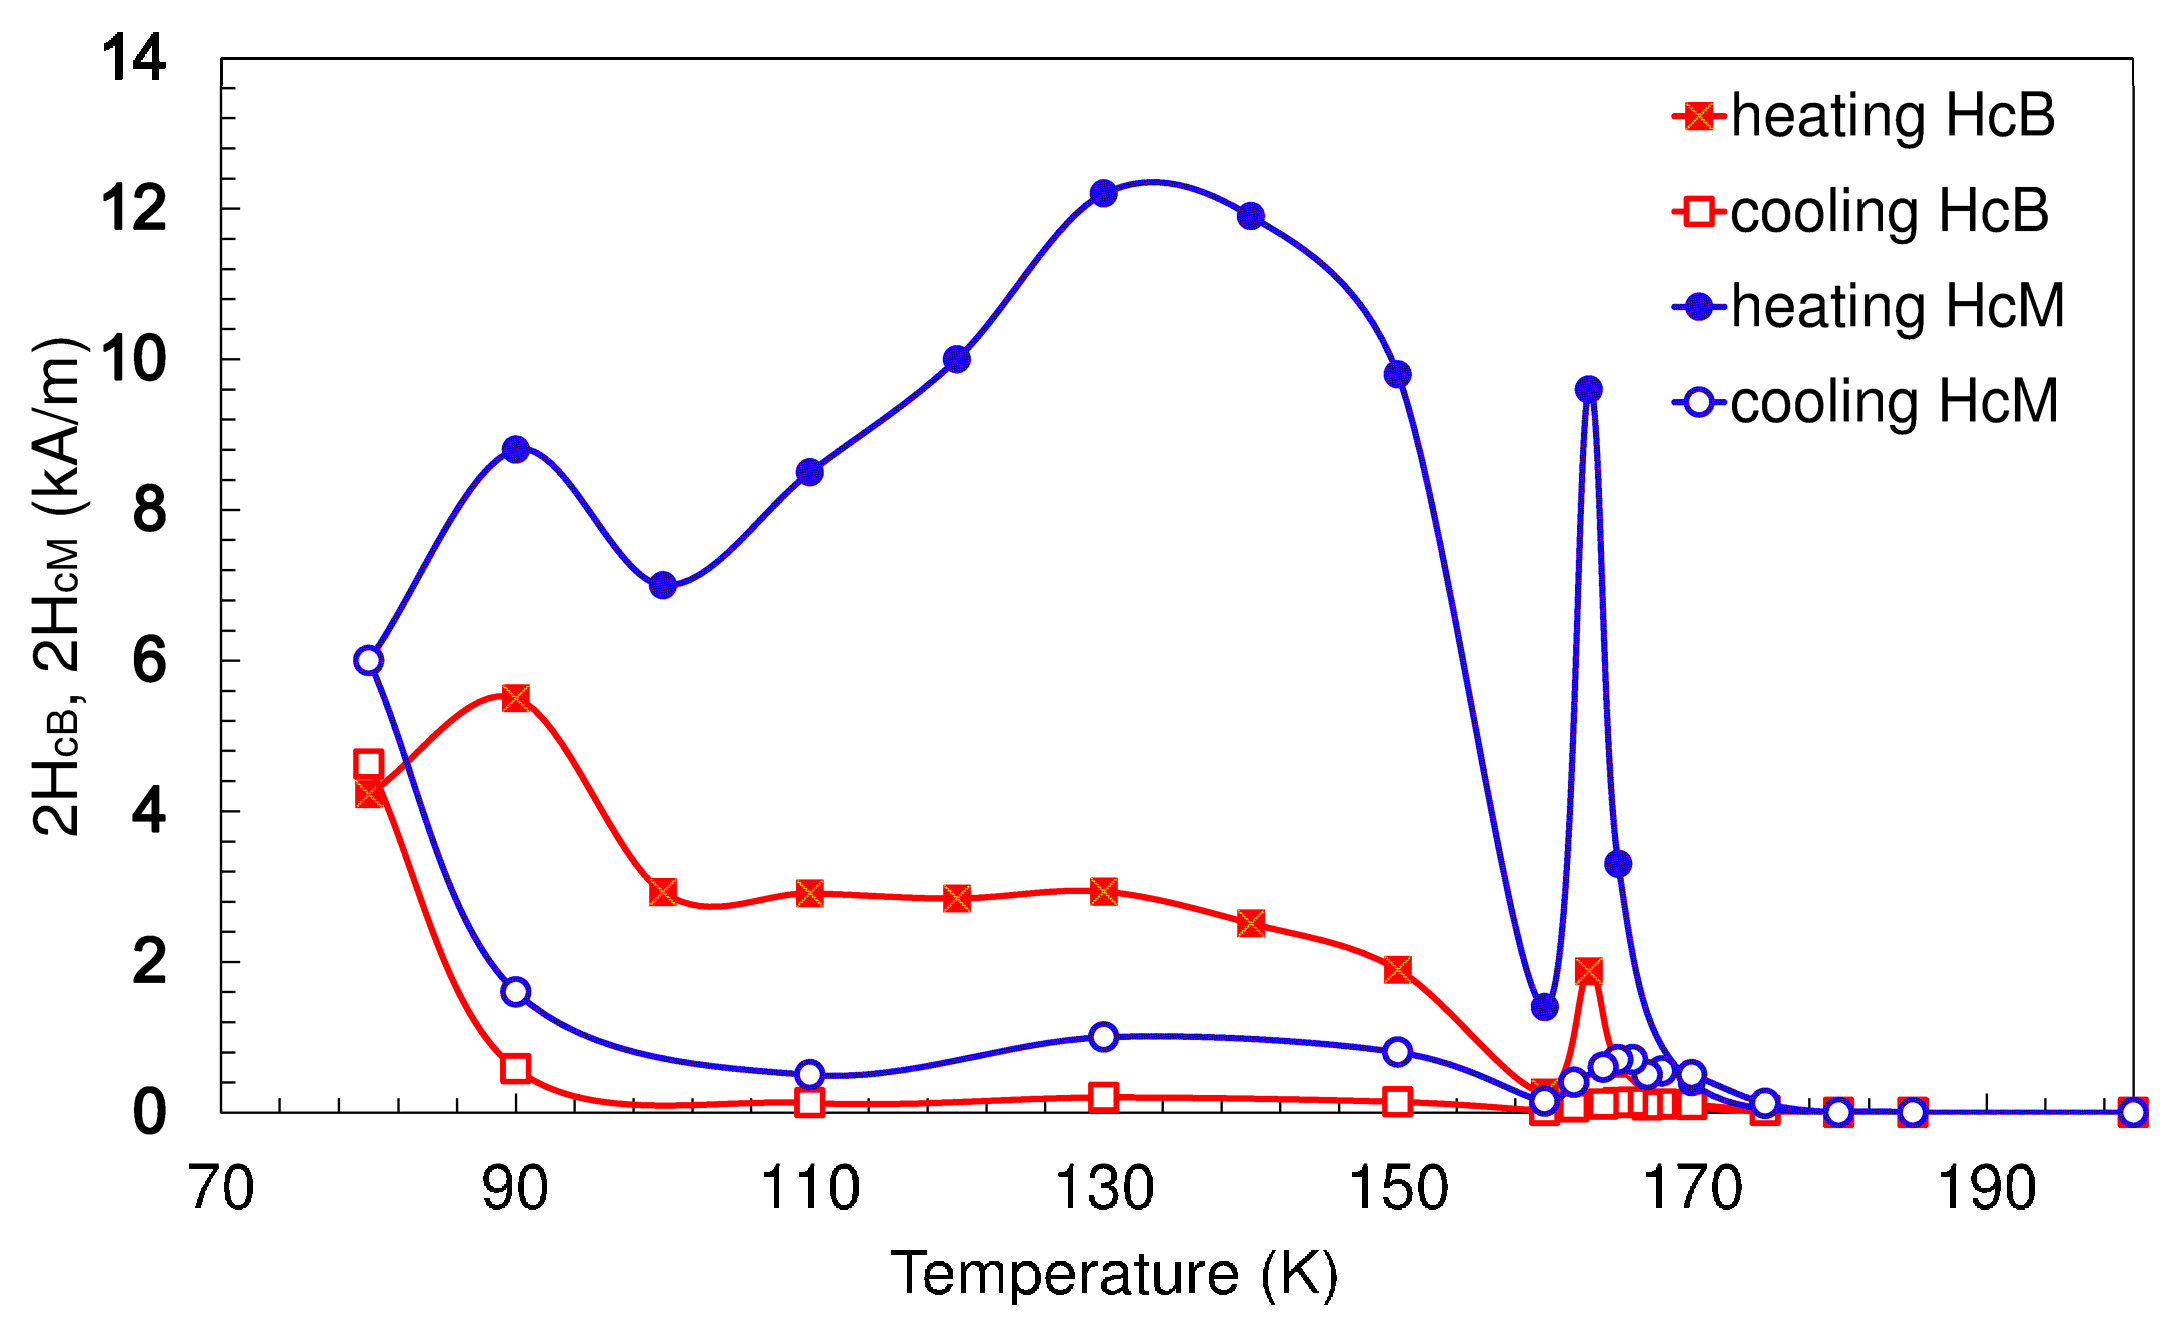
Figure 4 shows temperature dependences of the width of the HLs, ( is the HL semiwidth) and determined in the thermal cycle down to 80 K. As expected from the analysis of HLs depicted in Figure 2, both parameters show a strong difference between cooling and heating, which reflects the thermal hysteresis. Other central observations are: − and can be detected not only for heating from the FM phase, but also for cooling, in contrast to the experiments with conventional hysteresis [23]; and become very low and cannot be resolved for temperatures above TN; − and show a smooth maximum in the AFM phase centered around 130 K; above this temperature both parameters decline rapidly until 160 K and then show a very sharp peak, a singularity, close to the Villari point at 166 K.
Zero values of and detected above TN, Figure 4, despite persistence of RVE, Figure 1, confirm that the hysteresis declines during the transition to the PM phase due to disappearance of DWs. The sharp peaks in and around 166 K, Figure 4, are related to the change of sign of the magnetoelastic coupling at the Villari point. Figure 3 shows that, close to this point, the HLs rotate and tend to align along the field axis both during cooling (a) and during heating from the FM phase (b). Such a rotation results in the increase of the loop width measured along the H axis, The sharp increase of the relative area at the Villari point stems mostly from an abrupt decrease of the area beneath the loop, .
The real, , and imaginary, , components of the AC susceptibility for a sample of the same polycrystalline alloy are depicted in Figure 5a,b. The data on are in full agreement with previous studies, see e.g., [9,20,23]. in the AFM phase is 2–3 orders of magnitude lower than , and its contribution to the absolute value can be neglected. We are not aware of any detailed study of the temperature dependence of in the AFM phase of Dy, and the present study reveals important peculiarities of around the Villari point. Firstly, both and , as for RVE, demonstrate thermal hysteresis for T < TVP, which vanishes abruptly at TVP. The hysteresis is much more pronounced for than for . Secondly, is strongly frequency dependent for T < TVP, implying time-dependence and relaxational phenomena over this temperature range. The curves on heating and cooling for different frequencies all collapse just above the TVP. The frequency dependence is not discerned in the real part of the susceptibility, inset in Figure 5a.
4. Discussion
4.1. Relationship Between the Width of and Hysteresis
The RVE registered in the present work represents the reversible inverse magnetostriction. At the limit of negligible hysteresis (narrow HL), the RVE is proportional also to the slope of the dependence, , and, in virtue of the Maxwell relation, to the slope of the magnetostriction hysteresis loop . The relationship between conventional hysteresis and the hysteresis of the slope of the magnetostriction loop is not easy to establish. Nevertheless, certain standard characteristics can be derived from the hysteresis.
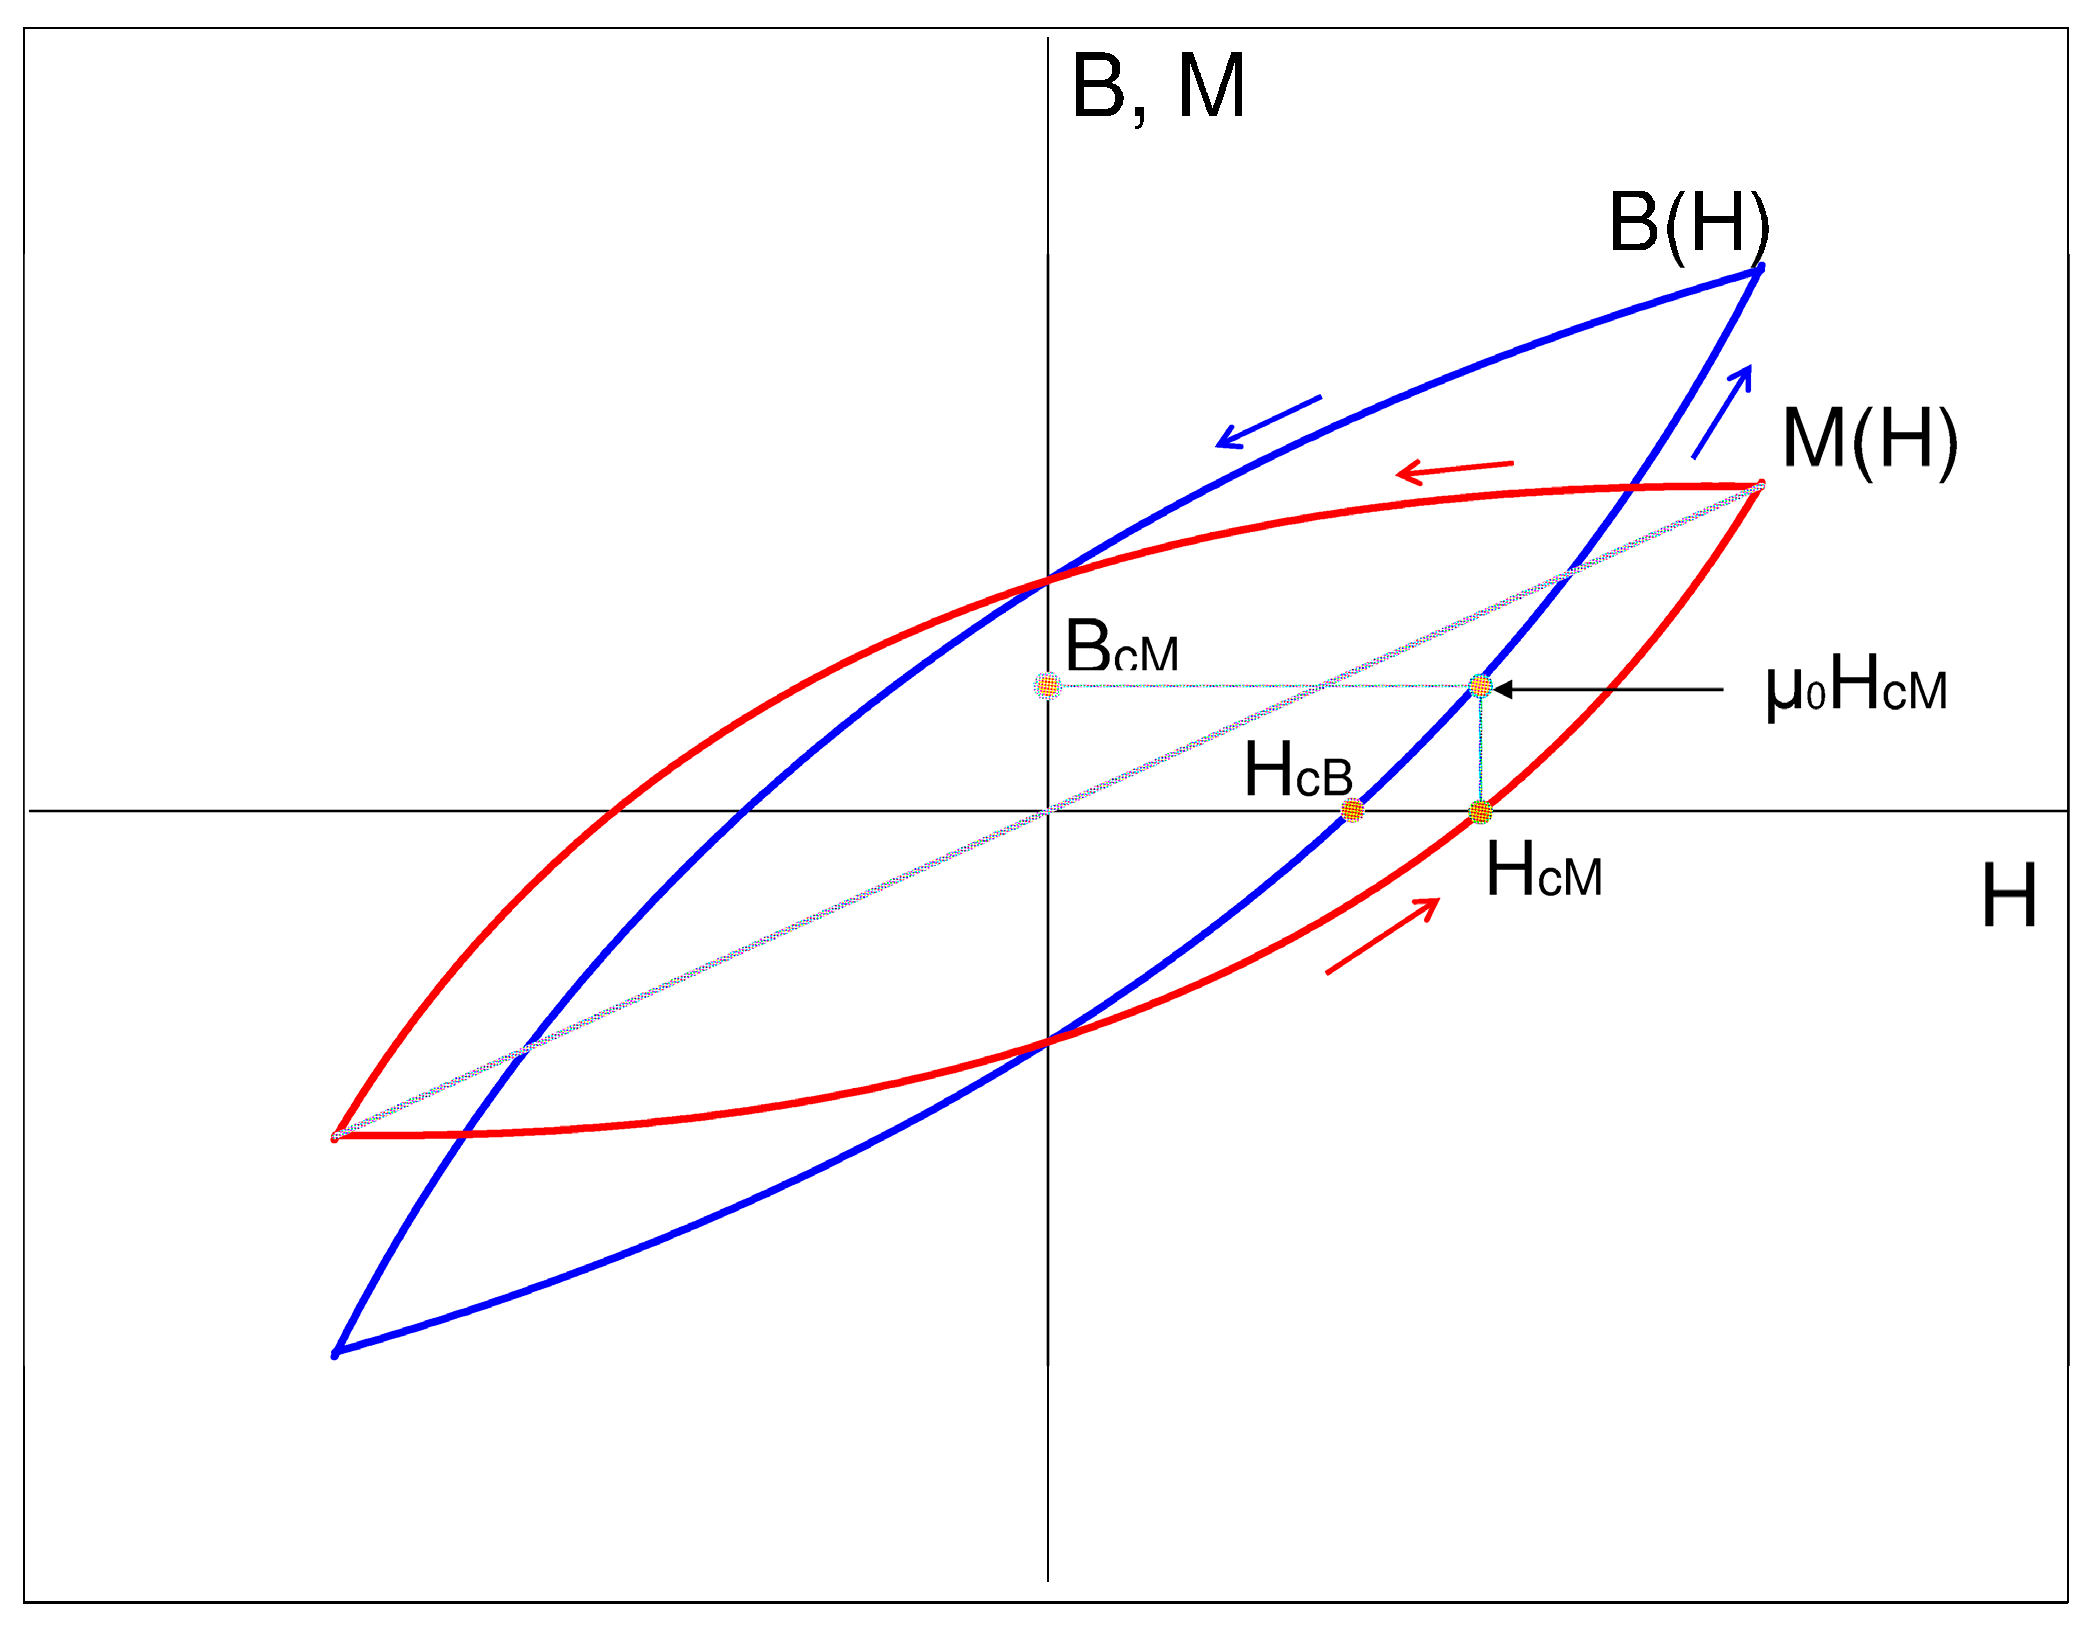
For an isotropic ferromagnetic bar-shaped sample under axial stress, the Villari effect vanishes when the net magnetization, , along the sample is zero, see e.g., [31,32]. We assume that the condition = 0 if = 0 holds for the spiral AFM phase of Dy. Then the width of a HL is the width of the loop for the same field amplitude .
We derive now an approximate relationship between the semiwidths of and HLs, shown schematically in Figure 6. We denote by the semiwidth of the hysteresis. For the loop, when (or = 0),
From the triangle , taking into account Equation (5), one obtains
where is the differential susceptibility at .
Equation (6) shows that the difference between the width of the and loops is negligible in FM materials if . However, this difference becomes substantial in the AFM state when . If , . This result explains why the width of hysteresis in the AFM phase of Dy is much easier to obtain from experiments than the width of conventional loops.
4.2. Temperature Dependence of the Magnetic Hysteresis Width
We use Equation (6) to calculate from dependence shown in Figure 2. The AC susceptibility from Figure 5 can be used in Equation (6) instead of the differential one, since hysteresis in the AFM phase of Dy is narrow [23], and no detectable effect on χ of a bias field 800 A/m (which is close to the [23]) was found in the present study. The results shown in Figure 6 confirm that calculated from Equation (6), is indeed substantially lower than . The broad maximum of around 130 K has disappeared in , since this maximum resulted mostly from the susceptibility decline on heating from the FM phase, followed by a minimum around 150 K, Figure 5.
As a consequence, calculated values are nearly temperature independent in the AFM phase during heating, and then drop rapidly close to the TVP. Finally, it should be mentioned that the relationship between and given by Equation (6) does not hold close to the singularity at the VP at 166 K: on cooling, the HLs align along the H axis. On heating, the shape of the hysteresis is very much changed due to the formation of unusual central hysteresis, Figure 3b. In both cases the elementary model of Figure 6, resulting in Equation (6), becomes inapplicable. Therefore, a small maximum of remaining at T ≈ TVP, Figure 7, is probably a spurious effect.
4.3. Thermal Hysteresis and Relaxation in the Helical Phase
The origin of thermal hysteresis in antiferromagnetic Dy is a long-standing unresolved issue [9,10,11,15,18,20,22,23,25,33]. One of the most comprehensive studies of thermal hysteresis is that undertaken by McKenna et al. [9]. Using two different experimental techniques—susceptibility measurements and temperature modulation—they showed that the thermal hysteresis in two independent characteristic parameters vanishes at the same temperature somewhat below 170 K [9]. Ultrasonic studies of absorption and elastic constants in Dy and other rare earth alloys were not precise enough to track in detail the thermal hysteresis of absorption. Nevertheless, the hysteresis in C33 elastic constant was found to vanish in Dy and Tb-Ho alloy at a temperature of 165 K [22]. The present data on are also in full agreement with the results of McKenna et al. [9], showing only a minor drop at TVP on the order of only a few percent, inset in Figure 5a. Thus, our study of RVE showing that the thermal hysteresis vanishes at TVP = 166 K [25] does not contradict previous studies. The novelty of the present results is that we relate the disappearance of thermal hysteresis with the change of sign of the magnetoelastic coupling.
Important new information, also confirming the crucial role of the Villari point, is the behavior of . remains nearly temperature-independent upon heating from the FM phase and shows an abrupt nearly 5-fold drop around 166 K, inset in Figure 5b. This trend is identical to temperature spectra on heating, Figure 7. Hence, both properties likely reflect the same dissipative processes in the AFM phase, which undergo an abrupt change at the Villari point. The observation of qualitatively similar (but of different intensity) thermal hysteresis for cycles below (80 K) and above TC (95 K) helps to shed light on the origin of the thermal hysteresis. The conventional point of view seems to be that thermal hysteresis between cooling and heating from the FM phase is due to the existence/modification of the spiral spin type I DWs inherited from the DWs in the FM phase [22]. Observations of thermal hysteresis during heating from 95 K, the temperature which is 10 K above TC on cooling, indicate that the origin of the hysteresis cannot be spiral spin DWs inherited from the domain walls of the FM phase. On the other hand, the intensity of thermal hysteresis for two thermal cycling protocols is substantially different: cooling the sample to lower temperatures and, eventually, below the TC, promotes thermal hysteresis. A feasible explanation might imply the existence on heating of a certain FM phase well above the TC, which disappears only at TVP due to the change of sign of the magnetoelastic coupling. A number of additional arguments supporting this hypothesis can be suggested.
The qualitative change of the shape of the RVE hysteresis at T = TVP, is shown in Figure 3b. Upon approaching TVP from low temperatures, HLs have a shape typical for ferromagnets close to the Villari point [28]. Immediately above TVP the hysteresis becomes typical for the AFM phase, cf. Figure 3a,b.
The ratio in the AFM phase is much higher for heating than for cooling, Figure 5. For the AFM phase on cooling , whereas in the FM phase . Much stronger thermal hysteresis of than in , see the insets in Figure 5, might also point to the contribution of residual FM phase to AC susceptibility.
The detection of certain thermal hysteresis in cycles to 95 K, the temperature which is some 10 K above the TC on cooling, indicates that nuclei of the FM phase can be stabilized on subsequent heating. Much more intense thermal hysteresis after cooling to the FM phase points to a higher content of the residual FM phase in the AFM state under this protocol. According to the data on and , residual FM phase strongly enhances dissipation in the AFM phase. Two feasible mechanisms of this enhancement can be suggested:
- direct contribution of the FM phase to the dissipation;
- pinning of the AFM domain walls by residual FM phase in addition to the direct contribution of the latter to the dissipation.
The present results do not allow us to distinguish between these two scenarios.
A number of properties of the residual FM phase can be traced from the present and previous results [25]. Firstly, relaxation of the RVE and strong frequency dependence of indicate that the residual FM phase is not in the equilibrium state during heating. Secondly, the disappearance of the residual FM phase at the Villari point might indicate that it is associated with lattice defects, possessing intense elastic strain fields, like lattice dislocations. In the AFM phase, core regions of dislocations can possess local FM order [34]. Then, the disappearance and the change of sign of the magnetoelastic coupling at TVP probably changes the local magnetic properties of the dislocations.
5. Conclusions
- (1)
- We showed that mechanomagnetic spectroscopy is much more sensitive to magnetic hysteresis in the AFM phase than the conventional experimental method based on registration of hysteresis.
- (2)
- A number of regularities in magnetic properties of polycrystalline Dy in the spiral AFM phase, including the crucial role of the Villari point at 166 K, revealed by means of RVE measurements, were confirmed by using studies of AC susceptibility:
- Thermal hysteresis persists in AC susceptibility, and is most intense in its imaginary part. The thermal hysteresis in AC susceptibility vanishes at the temperature of the Villari point at 166 K, as is the case for the thermal hysteresis in the reversible Villari effect.
- The imaginary part of the AC susceptibility is strongly frequency dependent in the helical antiferromagnetic phase during heating from the ferromagnetic state. The frequency dependence disappears at the Villari point. This behavior is consistent with the previously reported relaxation in the reversible Villari effect.
- (3)
- We suggest that thermal hysteresis in polycrystalline Dy, other rare earth elements, and their alloys, is related to the ferromagnetic phase, stabilized in the antiferromagnetic structure by lattice defects, possessing intense strain fields, like lattice dislocations.
- (4)
- Since the Villari point at 166 K controls several magnetic properties of Dy, this temperature can be ranked to be nearly as important as the TN and TC. Keeping in mind similar behavior of thermal hysteresis in Dy and other rare earth elements and their alloys, the effects reported in the present work should be generic for a wide range of helical antiferromagnets.
Acknowledgments
This work was supported by the Spanish Ministerio de Economía y Competitividad, project MAT2014-56116-C04-01-R and by the Government of the Russian Federation (Grant 074-U01) through the ITMO Fellowship and Professorship Program.
Author Contributions
Sergey Kustov and Miguel Lluís Corró Moyà conceived and designed the experiments. Iuliia Liubimova, Sergey Kustov, Miguel Lluís Corró Moyà, Joan Torrens-Serra, Vicente Recarte, José Ignacio Pérez-Landazábal performed the experiments and analyzed the data. Iuliia Liubimova and Sergey Kustov wrote the paper.
Conflicts of Interest
The authors declare no conflict of interest.
References
- Elliott, J.; Legvold, S.; Spedding, F.H. Some magnetic properties of Dy metal. Phys. Rev. 1954, 94, 1143–1145. [Google Scholar] [CrossRef]
- Griffel, M.; Skochdopole, R.E.; Spedding, F.H. Heat capacity of dysprosium from 15 to 300°k. J. Chem. Phys. 1956, 25, 75–79. [Google Scholar] [CrossRef]
- Wilkinson, M.K.; Koehler, W.C.; Wollan, E.O.; Cable, J.W. Neutron diffraction investigation of magnetic ordering in dysprosium. J. Appl. Phys. 1961, 32, 48S–49S. [Google Scholar] [CrossRef]
- Darnell, F.J. Temperature dependence of lattice parameters for Gd, Dy, and Ho. Phys. Rev. 1963, 130, 1825–1828. [Google Scholar] [CrossRef]
- Darnell, F.J.; Moore, E.P. Crystal structure of dysprosium at low temperatures . J. Appl. Phys. 1963, 34, 1337–1338. [Google Scholar] [CrossRef]
- Rosen, M. Elastic moduli and ultrasonic attenuation of gadolinium, terbium, dysprosium, holmium, and erbium from 4.2 to 300°k. Phys. Rev. 1968, 174, 504–514. [Google Scholar] [CrossRef]
- Belov, K.P.; Levitin, R.Z.; Nikitin, S.A.; Ped'ko, A.V. Magnetic and magnetoelastic properties of dysprosium and gadolinium. Soviet Phys. JETP 1961, 13, 1096–1101. [Google Scholar]
- Doerr, M.; Rotter, M.; Lindbaum, A. Magnetostriction in rare-earth based antiferromagnets. Adv. Phys. 2005, 54, 1–66. [Google Scholar] [CrossRef]
- McKenna, T.J.; Campbell, S.J.; Chaplin, D.H.; Wilson, G.V.H. Temperature modulation and temperature hysteresis studies of dysprosium. Phys. Status Solidi (A) 1983, 75, 421–432. [Google Scholar] [CrossRef]
- Amitin, E.B.; Bessergenev, W.G.; Kovalevskaya, Y.A.; Paukov, I.E.J. Thermodynamic properties of dysprosium from 7 to 300 K. Chem. Thermodyn. 1983, 15, 181–188. [Google Scholar] [CrossRef]
- McKenna, T.J.; Campbell, S.J.; Chaplin, D.H.; Wilson, G.V.H. Domain effects near the order-disorder and order-order ferromagnetic transitions in Gd and Dy. J. Magn. Magn. Mater. 1980, 20, 207–211. [Google Scholar] [CrossRef]
- Arzhavitin, V.M.; Derevyanko, V.V.; Sukhareva, T.V.; Finkel, V.A. Anomalies of kinetic, magnetic and relaxation properties of dysprosium in the region of helicoidal antiferromagnetic structure. Funct. Mater. 2006, 13, 30–34. [Google Scholar]
- Herz, E.; Kronmuller, H. Field-induced phase transitions in the helical state of dysprosium. Phys. Status Solidi (A) 1978, 47, 451–458. [Google Scholar] [CrossRef]
- Isci, C.; Palmer, S.B. An ultrasonic study of the magnetic phases of dysprosium. J. Phys. F 1978, 8, 247–260. [Google Scholar] [CrossRef]
- Chernyshov, A.S.; Mudryk, Y.; Pecharsky, V.K.; Gschneidner, K.A., Jr. Temperature and magnetic field-dependent x-ray powder diffraction study of dysprosium. Phys. Rev. B 2008, 77, 094132. [Google Scholar] [CrossRef]
- Amitin, E.B.; Bessergenev, V.G.; Kovalevskaya, Y.A. Features of the thermodynamic properties of dysprosium as a quasi-two-dimensional magnetic system. Zh. Eksp. Teor. Fiz 1983, 84, 205–214. [Google Scholar]
- Andrianov, A.V.; Gaidukov, Y.P.; Vasil’ev, A.N.; Fawcett, E. The magnetic phase diagrams of dysprosium. J. Magn. Magn. Mater. 1991, 97, 246–250. [Google Scholar] [CrossRef]
- Chernyshov, A.S.; Tsokol, A.O.; Tishin, A.M.; Gschneidner, Jr.K.A.; Pecharsky, V.K. Magnetic and magnetocaloric properties and the magnetic phase diagram of single-crystal dysprosium. Phys. Rev. B 2005, 71, 184410. [Google Scholar] [CrossRef]
- Alkhafaji, M.T.; Ali, N. Magnetic phase diagram of dysprosium. J. Alloys Compd. 1997, 250, 659–661. [Google Scholar] [CrossRef]
- Del Moral, A.; Lee, E.W. The reversible susceptibilities of dysprosium and terbium. J. Phys. F 1974, 4, 280–290. [Google Scholar] [CrossRef]
- Palmer, S.B.; Lee, E.W. The elastic constants of dysprosium and holmium. In Proceedings of the Royal Society of London A: Mathematical, Physical and Engineering Sciences, London, UK, 25 April 1972. [Google Scholar]
- Palmer, S.B. Antiferromagnetic domains in rare earth metals and alloys. J. Phys. F 1975, 5, 2370–2378. [Google Scholar] [CrossRef]
- Kobayashi, S. Universal hysteresis scaling for incommensurate magnetic order in dysprosium. Phys. Rev. Lett. 2011, 106, 057207. [Google Scholar] [CrossRef] [PubMed]
- Chen, S.-W.; Guo, H.; Seu, K.A.; Dumesnil, K.; Roy, S.; Sinha, S.K. Jamming behavior of domains in a spiral antiferromagnetic systems. Phys. Rev. Lett. 2013, 110, 217201. [Google Scholar] [CrossRef] [PubMed]
- Corró, M.L.; El Hichou, A.; Cesari, E.; Kustov, S. Study of magnetic transitions in Dy by means of reversible Villari effect. J. Phys. D 2016, 49, 015001. [Google Scholar] [CrossRef]
- Kustov, S.; Masdeu, F.; Cesari, E. Mechanomagnetic spectroscopy of phase transitions in ferromagnetic shape memory alloys. Appl. Phys. Lett. 2006, 89, 061917. [Google Scholar] [CrossRef]
- Kustov, S.; Corró, M.L.; Cesari, E. Mechanomagnetic spectroscopy of ferromagnetic shape memory alloys. Mater. Sci. Eng. A 2009, 521, 194–200. [Google Scholar] [CrossRef]
- Kustov, S.; Corró, M.L.; Cesari, E.; Pérez-Landazábal, J.I.; Recarte, V. Peculiarities of magnetoelastic coupling in Ni–Fe–Ga–Co ferromagnetic martensite. J. Phys. D 2010, 43, 175002. [Google Scholar] [CrossRef]
- Kustov, S.; Golyandin, S.; Ichino, A.; Gremaud, G. A new design of automated piezoelectric composite oscillator technique. Mater. Sci. Eng. A 2006, 442, 532–537. [Google Scholar] [CrossRef]
- Robinson, W.H.; Edgar, A. The piezoelectric method of determining mechanical damping at frequencies of 30 to 200 kHz. IEEE Trans. Sonics Ultrason. 1974, 21, 98–105. [Google Scholar] [CrossRef]
- Bozorth, R.M. Ferromagnetism; Wiley-IEEE Press: Hoboken, NJ, USA, 2003; Chapter 13; pp. 595–712. [Google Scholar]
- Gignoux, D.; Schlenker, M.; de Lacheisserie, É.D. T. Magnetism: Fundamentals; Springer: New York, NY, USA, 2005; Chapter 12; pp. 351–397. [Google Scholar]
- Corró, M.L.; El Hichou, A.; Kustov, S. A review of mechanomagnetic spectroscopy. Case study: Dy polycrystals. J. Magn. Magn. Mater. 2016, 400, 141–144. [Google Scholar]
- Sugiyama, I.; Shibata, N.; Wang, Z.; Kobayashi, S.; Yamamoto, T.; Ikuhara, Y. Ferromagnetic dislocations in antiferromagnetic NiO. Nat. Nanotechnol. 2013, 8, 266–270. [Google Scholar] [CrossRef] [PubMed]
Figure 1.
Temperature dependences of the real part of the amplitude of the stress-induced flux density, during thermocycling in the antiferromagnetic phase (250–95–250 K) and below the Curie temperature (250–80–250 K). Magnetic field = 3 kA/m, oscillatory strain amplitude = 10−5.
Figure 1.
Temperature dependences of the real part of the amplitude of the stress-induced flux density, during thermocycling in the antiferromagnetic phase (250–95–250 K) and below the Curie temperature (250–80–250 K). Magnetic field = 3 kA/m, oscillatory strain amplitude = 10−5.

Figure 2.
Real part of the amplitude of the stress-induced flux density, versus periodic field with amplitude of 18 kA/m at several selected temperatures, T = 100, 140 and 173 K: (a) cooling; (b) heating from 95 K (thermal cycling within the antiferromagnetic phase); (c) heating from 80 K (from the ferromagnetic phase). Oscillatory strain amplitude = 10−5, frequency of the periodic magnetic field 0.001 Hz.
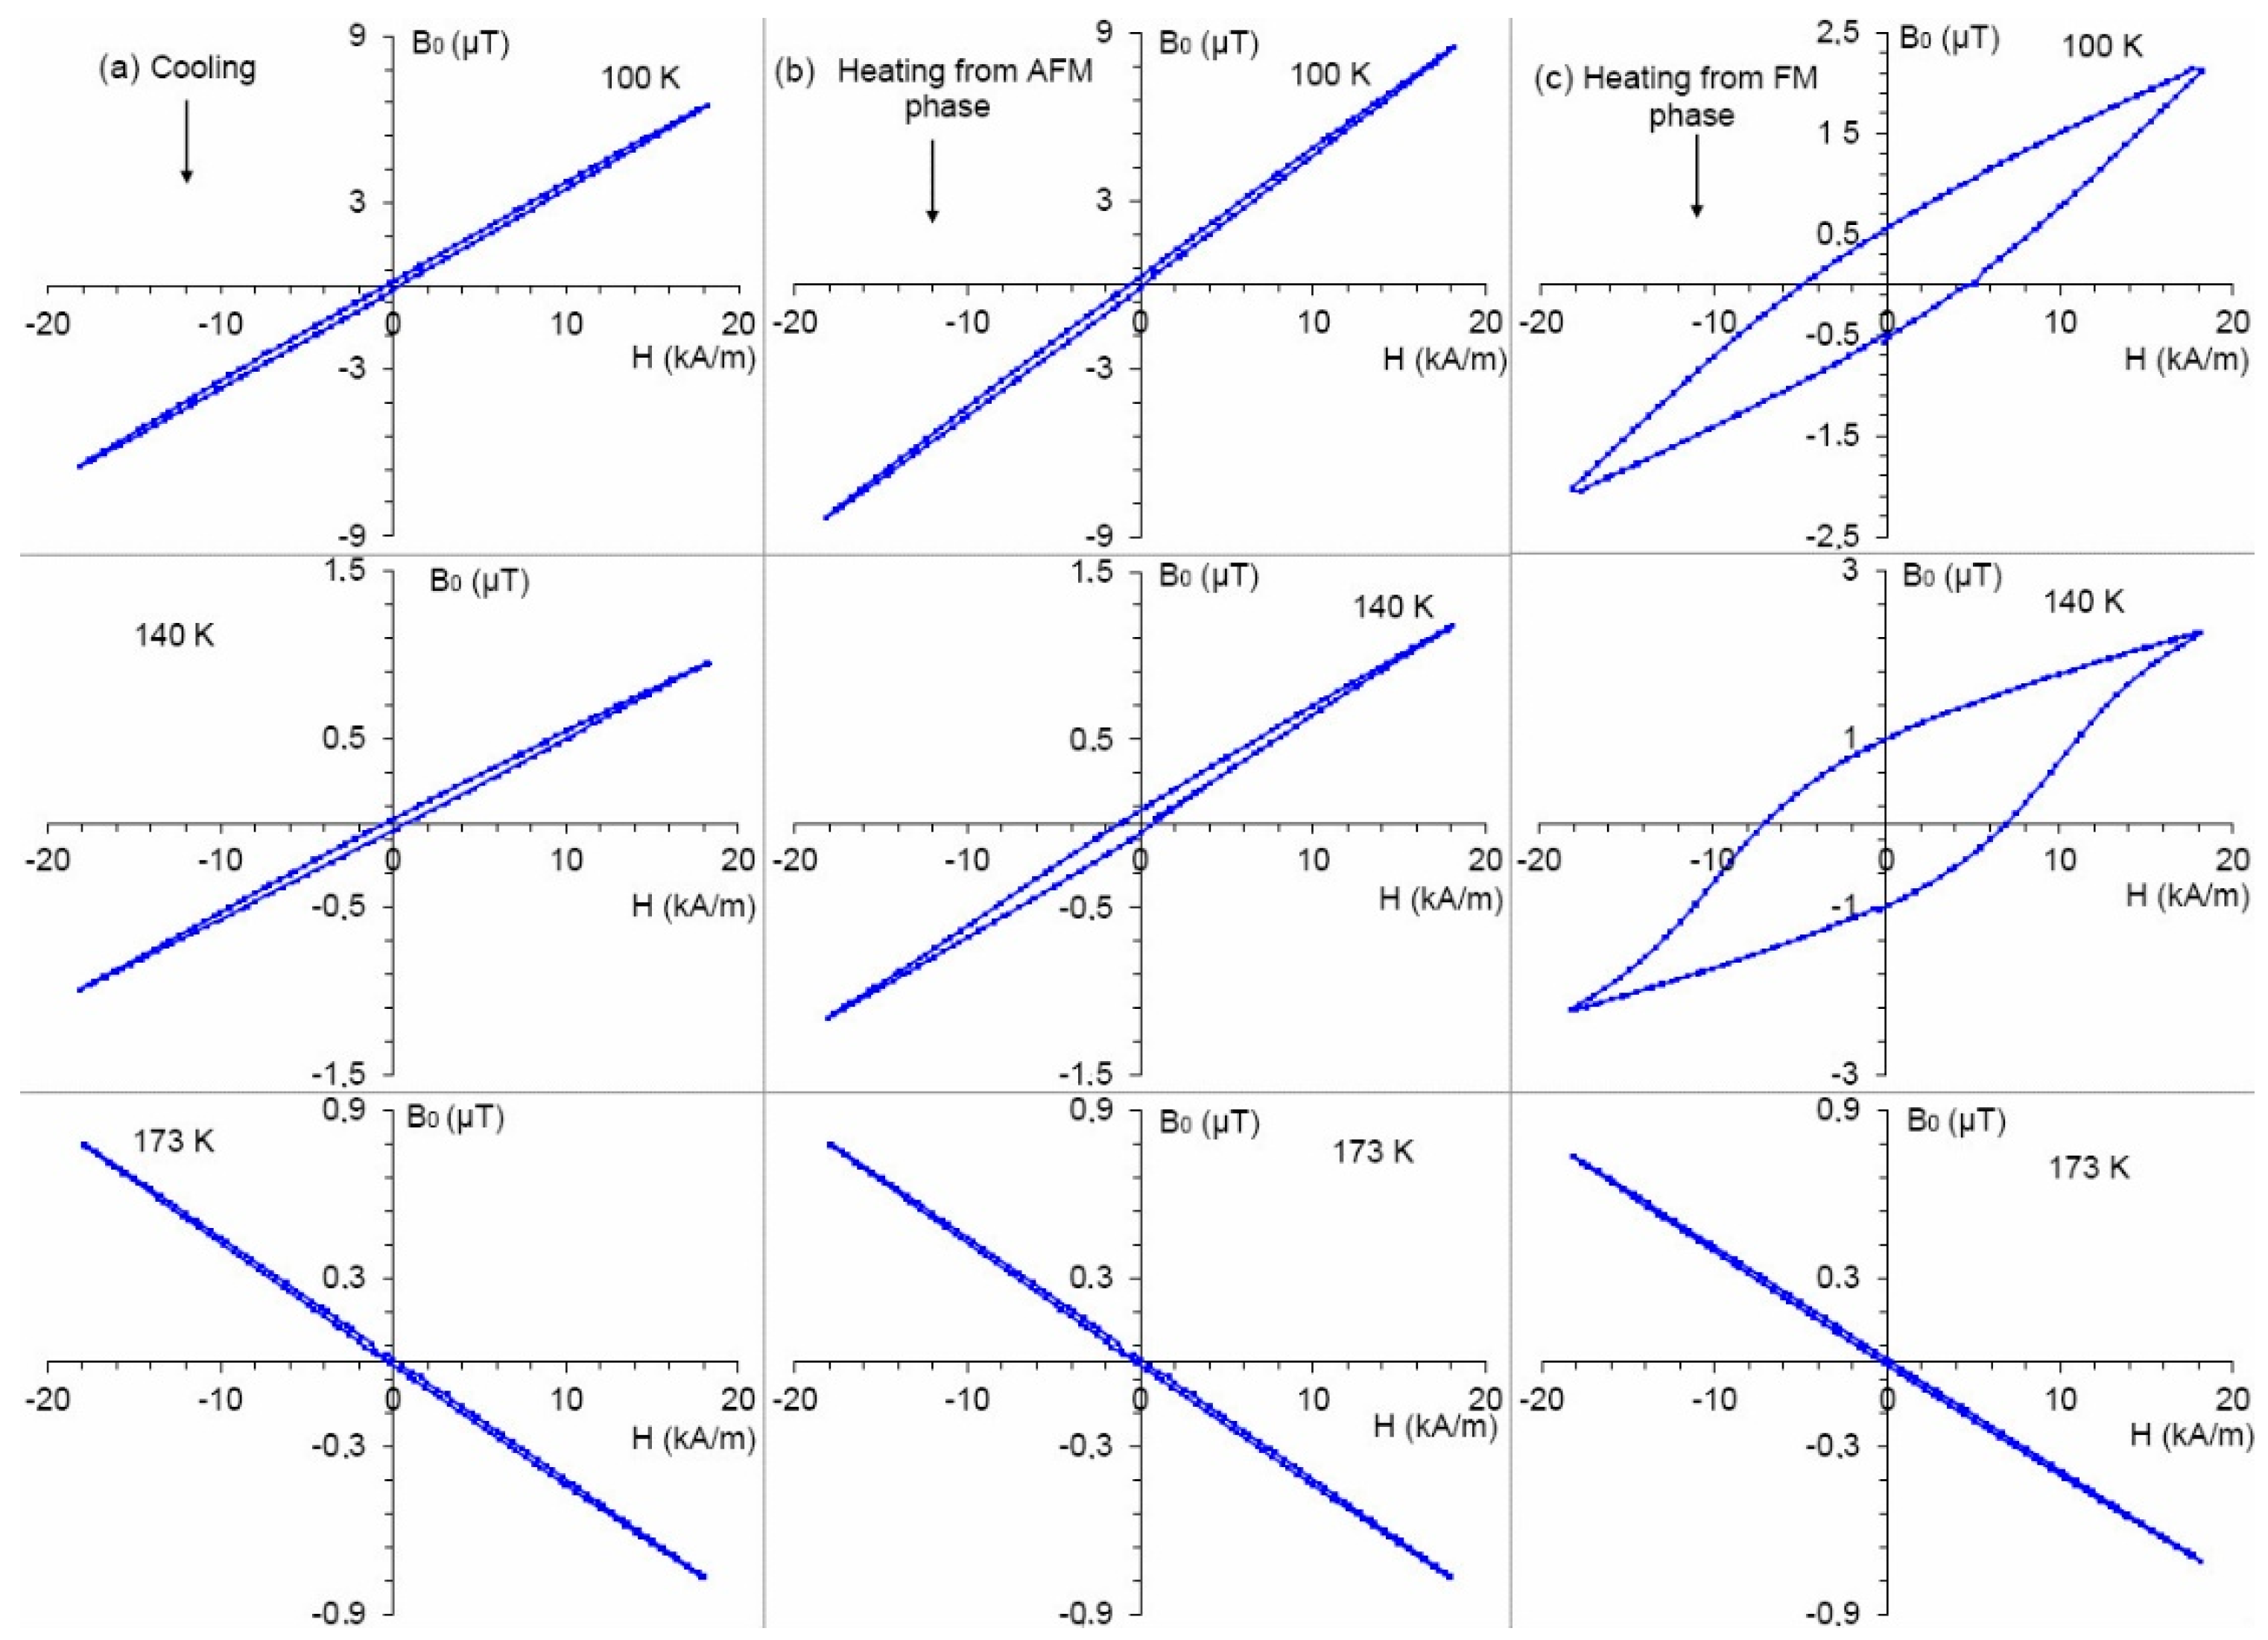
Figure 3.
hysteresis loops on cooling (a) and heating from ferromagnetic state (b) in the vicinity of the Villari point around 166 K. Oscillatory strain amplitude = 10−5, frequency of the periodic magnetic field 0.001 Hz.
Figure 3.
hysteresis loops on cooling (a) and heating from ferromagnetic state (b) in the vicinity of the Villari point around 166 K. Oscillatory strain amplitude = 10−5, frequency of the periodic magnetic field 0.001 Hz.

Figure 4.
Temperature dependence of the width, , and of the relative area, , of the hysteresis loops on cooling and on heating from 80 K (from the FM phase). Oscillatory strain amplitude = 10−5, amplitude of the applied magnetic field = 18 kA/m, frequency 0.001 Hz.
Figure 4.
Temperature dependence of the width, , and of the relative area, , of the hysteresis loops on cooling and on heating from 80 K (from the FM phase). Oscillatory strain amplitude = 10−5, amplitude of the applied magnetic field = 18 kA/m, frequency 0.001 Hz.

Figure 5.
Real (a) and imaginary (b) components of the alternating current (AC) magnetic susceptibility on cooling and heating from 9 K under excitation field with amplitude of 3.5 Oe and frequencies 20 Hz and 2 Hz. The insets show components of magnetic susceptibility on an expanded scale between 120 and 200 K.
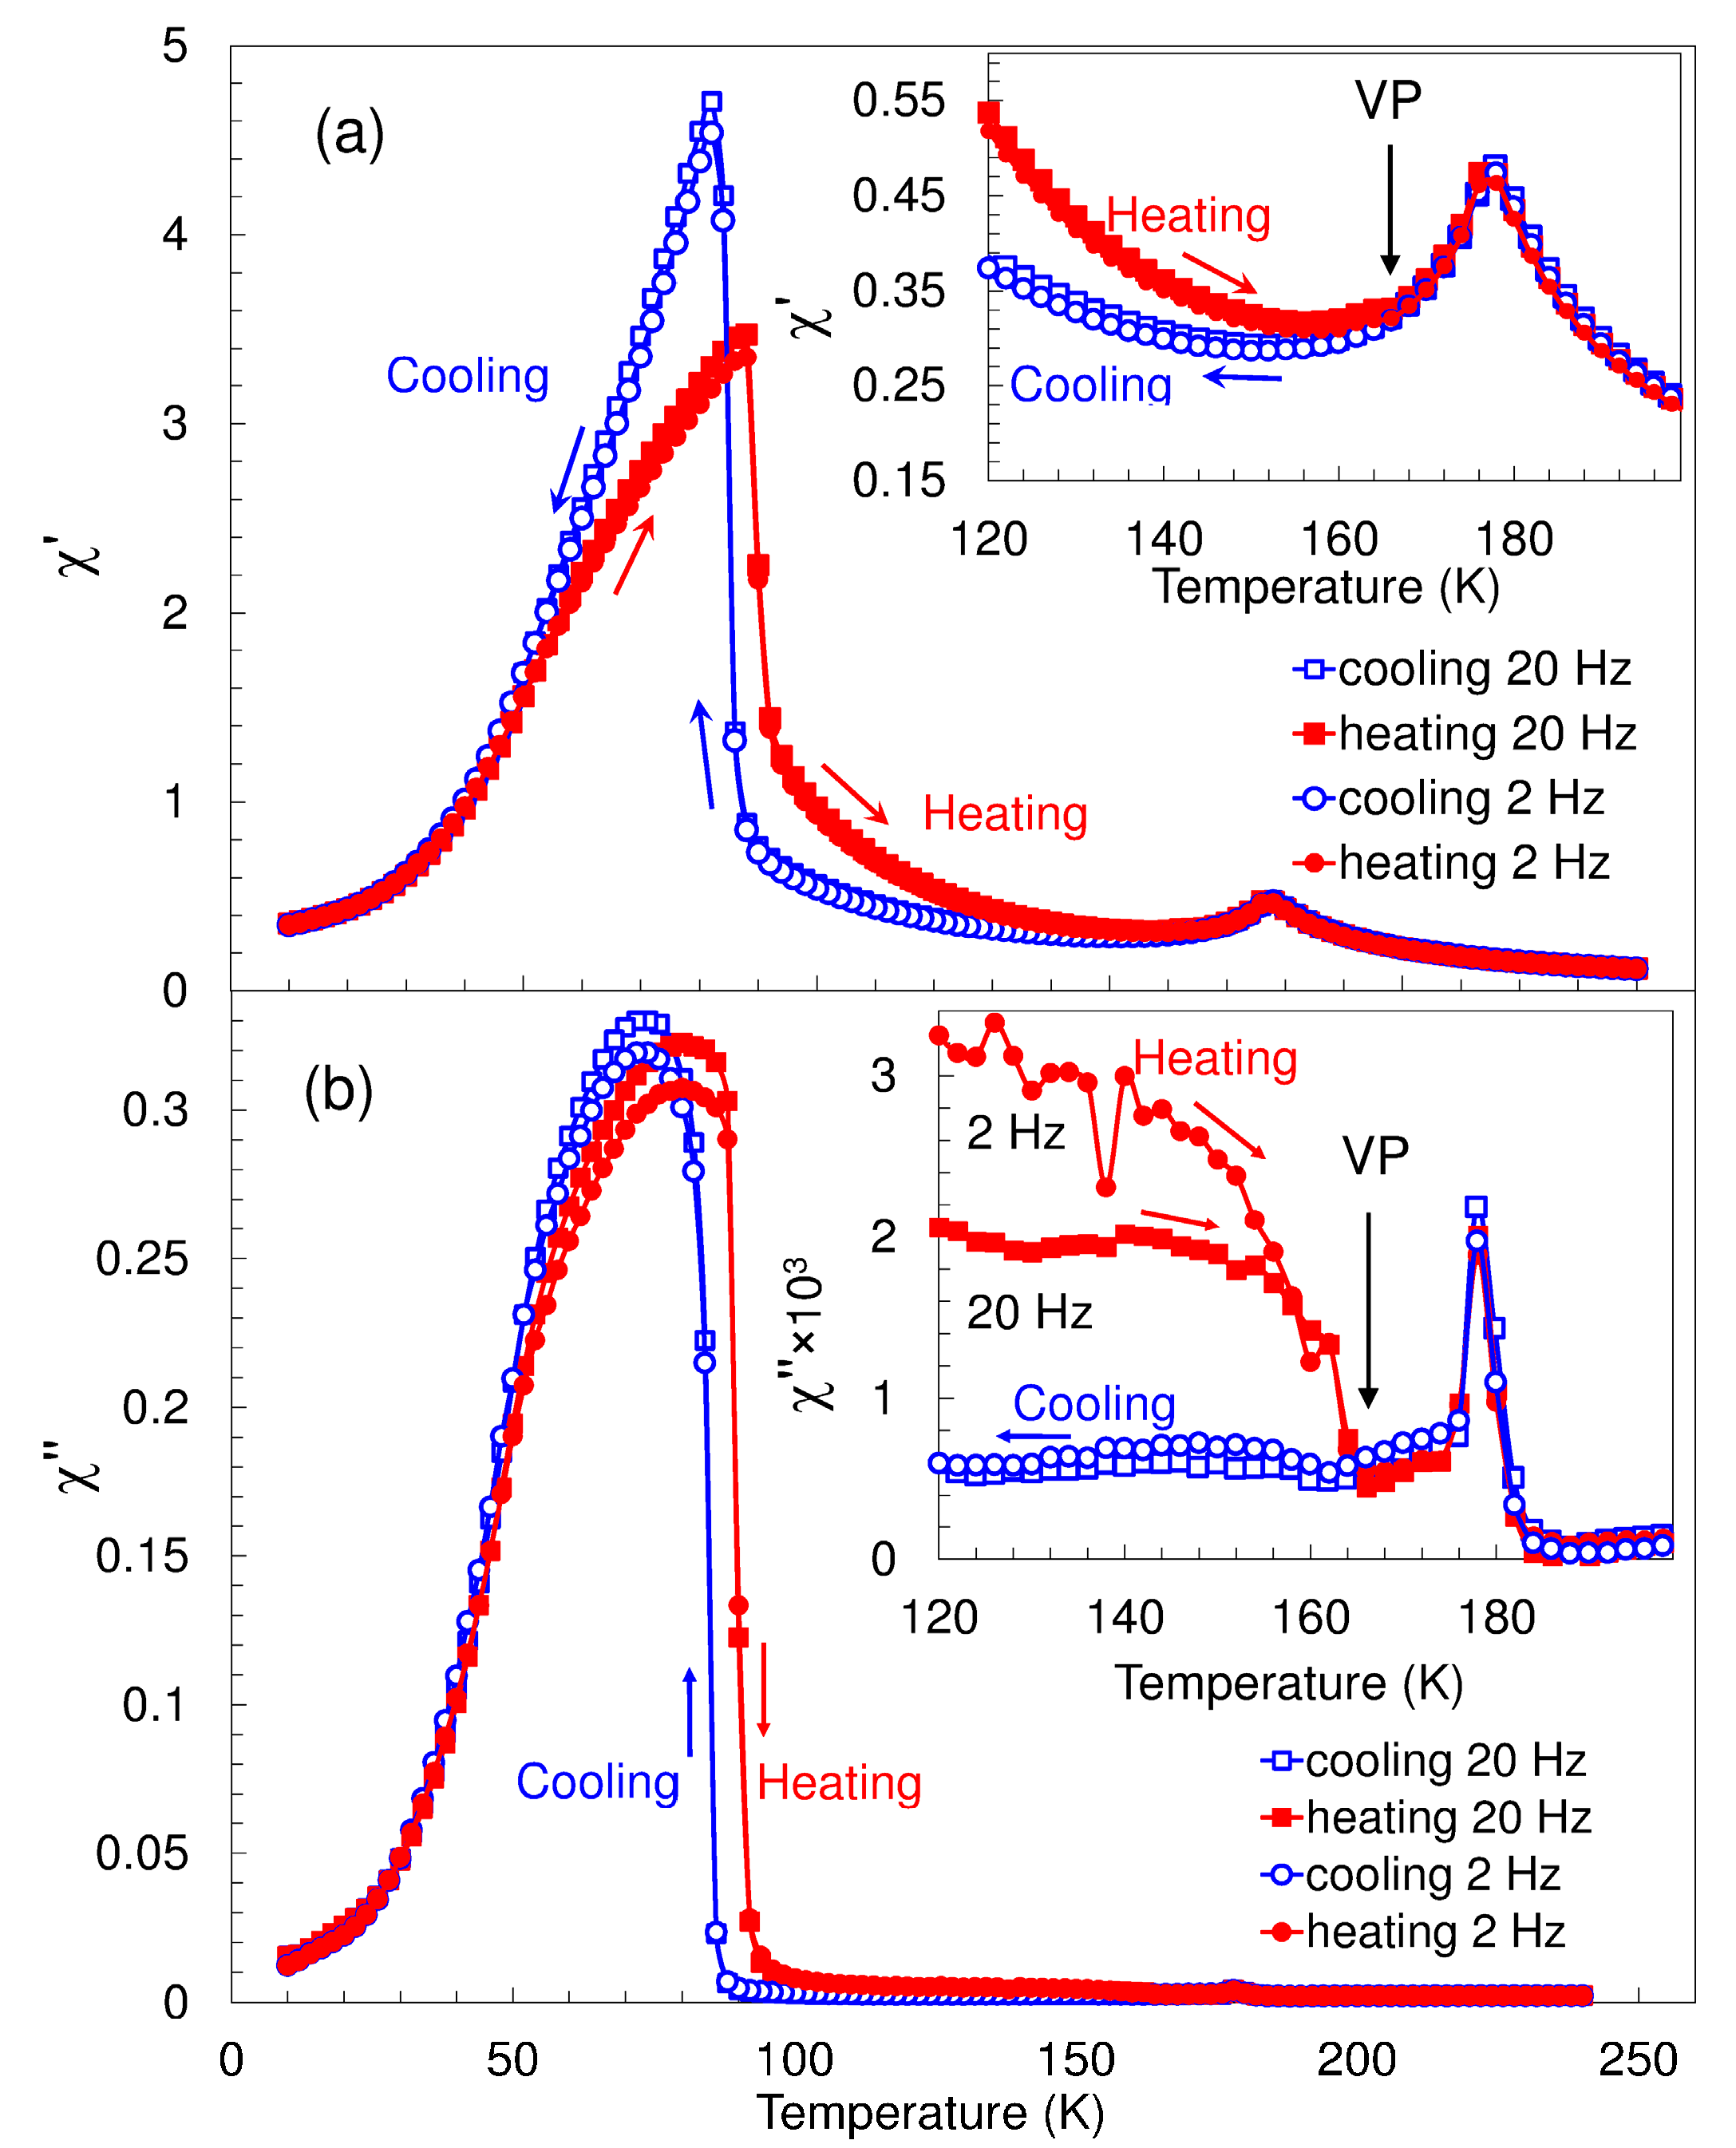
Figure 6.
Parameters of the and hysteresis loops. —semiwidth of the hysteresis loop at zero magnetization , —semiwidth of the hysteresis loop at zero induction = 0, —induction corresponding to the applied field (i.e., when magnetization = 0).
Figure 6.
Parameters of the and hysteresis loops. —semiwidth of the hysteresis loop at zero magnetization , —semiwidth of the hysteresis loop at zero induction = 0, —induction corresponding to the applied field (i.e., when magnetization = 0).

Figure 7.
Temperature dependence of the width of hysteresis, , obtained in the experiment and of the width of the hysteresis, , calculated from Equation (7), on cooling and heating from 80 K (from the ferromagnetic phase). Data on are taken from Figure 4.
Figure 7.
Temperature dependence of the width of hysteresis, , obtained in the experiment and of the width of the hysteresis, , calculated from Equation (7), on cooling and heating from 80 K (from the ferromagnetic phase). Data on are taken from Figure 4.

© 2017 by the authors. Licensee MDPI, Basel, Switzerland. This article is an open access article distributed under the terms and conditions of the Creative Commons Attribution (CC BY) license (http://creativecommons.org/licenses/by/4.0/).
Share and Cite
MDPI and ACS Style
Liubimova, I.; Corró Moyà, M.L.; Torrens-Serra, J.; Recarte, V.; Pérez-Landazábal, J.I.; Kustov, S. Low Field Magnetic and Thermal Hysteresis in Antiferromagnetic Dysprosium. Metals 2017, 7, 215. https://doi.org/10.3390/met7060215
AMA Style
Liubimova I, Corró Moyà ML, Torrens-Serra J, Recarte V, Pérez-Landazábal JI, Kustov S. Low Field Magnetic and Thermal Hysteresis in Antiferromagnetic Dysprosium. Metals. 2017; 7(6):215. https://doi.org/10.3390/met7060215
Chicago/Turabian StyleLiubimova, Iuliia, Miguel Lluís Corró Moyà, Joan Torrens-Serra, Vicente Recarte, José Ignacio Pérez-Landazábal, and Sergey Kustov. 2017. "Low Field Magnetic and Thermal Hysteresis in Antiferromagnetic Dysprosium" Metals 7, no. 6: 215. https://doi.org/10.3390/met7060215
Note that from the first issue of 2016, this journal uses article numbers instead of page numbers. See further details here.