Article

Effects of Q&P Processing Conditions on Austenite Carbon Enrichment Studied by In Situ High-Energy X-ray Diffraction Experiments

by
Sébastien Yves Pierre Allain
1,*,
Guillaume Geandier
1,
Jean-Christophe Hell
2,
Michel Soler
2,
Frédéric Danoix
3 and
Mohamed Gouné
4
1
Institut Jean Lamour, UMR CNRS-UL 7198, 54011 Nancy, France
2
Maizières Automotive Products, Arcelormittal Maizières Research SA, 57283 Maizières les Metz, France
3
Groupe de Physique des Matériaux, UMR 6634, Normandie University, UNIVROUEN, INSA Rouen, CNRS, 76801 Rouen, France
4
Institut de Chimie de la Matière Condensée de Bordeaux, UPR 9048, 33608 Pessac, France
*
Author to whom correspondence should be addressed.
Metals 2017, 7(7), 232; https://doi.org/10.3390/met7070232
Submission received: 13 May 2017 / Revised: 10 June 2017 / Accepted: 16 June 2017 / Published: 22 June 2017
(This article belongs to the Special Issue Bainite and Martensite: Developments and Challenges)

Abstract

:
We report the first ultra-fast time-resolved quantitative information on the quenching and partitioning process of conventional high-strength steel by an in situ high-energy X-ray diffraction (HEXRD) experiment. The time and temperature evolutions of phase fractions, their carbon content, and internal stresses were determined and discussed for different process parameters. It is shown that the austenite-to-martensite transformation below the martensite start temperature Ms is followed by a stage of fast carbon enrichment in austenite during isothermal holding at both 400 and 450 °C. The analysis proposed supports the concurrent bainite transformation and carbon diffusion from martensite to austenite as the main mechanisms of this enrichment. Furthermore, we give evidence that high hydrostatic tensile stresses in austenite are produced during the final quenching, and must be taken into account for the estimation of the carbon content in austenite. Finally, a large amount of carbon is shown to be trapped in the microstructure.

Graphical Abstract

1. Introduction

Quenching & Partitioning (Q&P) is a new annealing route proposed to produce third generation advanced high-strength steels (AHSS) for the automotive sector. The Q&P annealing cycle consists, after an austenitic soaking, of an interrupted quenching at a temperature—the quenching temperature (QT), lower than the martensite start temperature Ms, but higher than the martensite finish temperature Mf—to reach a partial martensitic transformation. This quench is followed by an isothermal holding at a temperature called the partitioning temperature (PT). During this second step, it was unambiguously shown that carbon can diffuse from martensite to untransformed austenite, from measurements at the atomic scale [1,2]. In a seminal article in 1960 published in Nature, Matas S. and Hehemann M. F. had already shown that the tempering of martensite leads to a carbon-enriched austenite [3]. In common steels, this process is largely inhibited by carbide precipitation (the so-called tempering process). A judicious choice of alloying elements (Si, Al) and partitioning temperatures permits reduction of transition carbide, and even cementite, precipitation, depending on the holding temperature [4,5,6]. As a result, austenite can be significantly enriched in carbon and thus stabilized at room temperature (RT). This is the so-called partitioning process. The cycle ends with a cooling sequence, during which a certain amount of fresh martensite can form again. Accordingly, Q&P steels are thus nanostructured austenite/martensite duplex steels with a recovered/tempered martensitic matrix. In most cases, they can show an efficient transformation induced plasticity (TRIP) effect upon straining. A typical Q&P annealing cycle is mainly characterized by its QT and its PT, as depicted in Figure 1. It should be mentioned that the PT is not necessarily higher than the QT, and that carbon partitioning can take place along various time–temperature schemes, including isothermal holding at the QT and even during continuous cooling [7].
As in more conventional TRIP steels with a ferritic matrix, the key to benefiting from an efficient TRIP effect relies on the thermo-mechanical stability of retained austenite islands [8]. Their stabilities primarily depend on their local carbon content [9,10], but also depend on their size, environment, and residual internal stress [11]. The question of austenite carbon enrichment remains of prime interest for the final properties of the steel. Recent studies highlight that it cannot be simply deduced from the sole partitioning process between austenite and martensite, but that at least two additional mechanisms must be considered, as they both potentially affect the carbon distribution between phases in Q&P steels—namely carbide precipitation and bainite formation.
The first mechanism is carbide precipitation, as it is now well admitted that precipitation of carbides interacts strongly with partitioning processes [6]. For HajyAkbary et al. [12], ε carbides are necessary for complete carbon partitioning, as they prevent possible bainitic transformations. On similar alloys, Pierce et al. [13] on the contrary have recently reported precipitation of η carbides during the partitioning process, which has been identified by transmission electron microscopy (TEM) and Mossbauer spectroscopy (MS). For Toji et al. [14], carbides appearing during partitioning are θ carbides (cementite), based on atom probe tomography (APT) results. Their observations are sustained with an original reassessed thermo-kinetic model. Carbon clustering in martensite has also been reported by Thomas et al. [15] in a highly-alloyed system. Even if the nature of the carbide remains the bone of contention, all these recent studies lead to the conclusion that a certain fraction of carbon must also be trapped in recovered martensitic laths, preventing a complete carbon partitioning between martensite and austenite, thus limiting austenite carbon enrichment.
Secondly, the partitioning step of the Q&P process is often conducted at temperatures which enable bainite formation in retained austenite [6,16,17,18]. The formation of bainite could explain, to some extent, carbon enrichment in austenite, as in carbide-free bainitic steels [19,20,21]. Using in situ HEXRD (high-energy X-ray diffraction) experiments, Nishiwaka et al. observed an evolution of the fraction of bainite during the partitioning step in hypereutectoid steels [22]. On more conventional TRIP steels, the same group showed how the bainitic transformation could be hindered by a prior deformation of austenite at a high temperature [10]. HajyAkbary et al. also reported on volume changes using a dilatometer during partitioning, which they attributed to bainitic transformations [12]. They claimed that this latter transformation was in fact unavoidable in the studied Q&P steels, and correlated it with possible ε carbide precipitation. In a recent paper, the present authors investigated the Q&P process in low-carbon TRIP steels by in situ HEXRD experiments coupled with a diffusion model [23]. Carbon enrichment in austenite was shown to be the result of the competition between the direct partitioning process and the carbide-free bainitic transformation. They also showed that a significant fraction of carbon remains trapped in martensite, supporting the conclusions of Thomas et al. [15].
Q&P microstructures are thus intricate, resulting from the conjunction of different mechanisms (two martensitic transformations, carbon precipitation and segregation in martensite, partitioning between martensite and austenite, possible bainitic transformation, etc.), which depend on the processing conditions. The respective kinetics of these elementary mechanisms affect the final microstructures and thus are of prime interest for final properties [8,10,16]. In this paper, the effect of the Q&P processing conditions were investigated by means of in situ HEXRD experiments, as in the prior works of [24] or [10], and further analyzed on the basis of the unbiased carbon mass balance allowed by this method [23].

2. Materials and Methods

2.1. Studied Alloy

The studied steel was Fe–0.295 C–2.52 Mn–1.43 Si–0.81 Cr (wt %, as for all compositions given in this paper). The same alloy has been used in previous studies on carbide-free bainitic transformations by Hell et al. [19,20], and on Q&P [23]. All the details about the sample preparation can be found in these prior papers. The Ms value of the studied steel, 295 °C, was measured during the in situ investigations, and was consistent with the value calculated with the model developed by Van Bohemen (298 °C) [25,26].

2.2. Diffraction Set-Up and Data Processing

The HEXRD experiments were carried out on the European Synchrotron Radiation Facility (ESRF) ID15B line (Grenoble, France) under powder diffraction configuration. The high-energy monochromatic beam (E = 87 keV, λ = 0.14 nm) allowed working in transmission mode, and the association with a fast 2D Perkin-Elmer detector (PerkinElmer, Waltham, MA, USA) enabled high acquisition rates (10 Hz) needed to study “real-time” processes on bulk samples. The detector was positioned about 1 m behind the sample, giving access to full Debye-Scherrer rings with a maximum 2θ angle of 12°.
The 2D diffraction patterns produced during the experiments were integrated circularly using Fit2D software [27]. The deduced 1D diffractograms (intensity vs. 2θ) were analyzed with a full Rietveld refinement procedure. Diffraction peaks were modeled by pseudo-Voigt functions using FullProf software [28] with 16 degrees of freedom for each record (background, phase fraction, lattice parameters, shape of peaks, and temperature effects). An example of such post-treatment is detailed in [23].
For all the different experimental spectra, two phases could be unambiguously identified on diffraction patterns: a face-centered cubic (fcc) phase, corresponding to austenite; and a body-centered (bc) phase. The latter could correspond to either body-centered tetragonal (bct) martensite or body-centered cubic (bcc) bainitic ferrite. As it is was not yet possible to isolate the possible contribution of each based on tetragonal distortion, they were both considered as body-centered cubic. As a consequence, during Rietveld refinement procedures, the lattices of the two phases were considered as cubic (Fm3m for austenite, and Im3m for martensite/bainite). Therefore, only mean volume effects of the composition or hydrostatic stress evolutions in phases were analyzed so far. The carbon mass balances were established considering the sole austenite lattice parameter evolutions.
The careful study of main diffraction peak shoulders revealed the possible presence of a third phase after the first martensitic transformation. The corresponding minor peaks were similar to those reported recently by [29] in nanobainitic steels, and could correspond to η carbides [30] (characteristic single and isolated diffraction peak located at about 5.08°). The precipitation of such carbides in Q&P steels has already been suggested by [13] on the basis of MS and TEM experiments. Other kinds of carbides (cementite or epsilon carbide in particular) were not able to explain the experimental diffraction patterns. However, because of the signal-to-noise ratio, it has not been possible to conclude definitively on the nature of the phase, nor to quantify it. These carbides were thus neglected in the following data processing procedure.
All additional details about the diffraction set-up and data processing can be found in [23], as the experiments were realized under the same conditions.

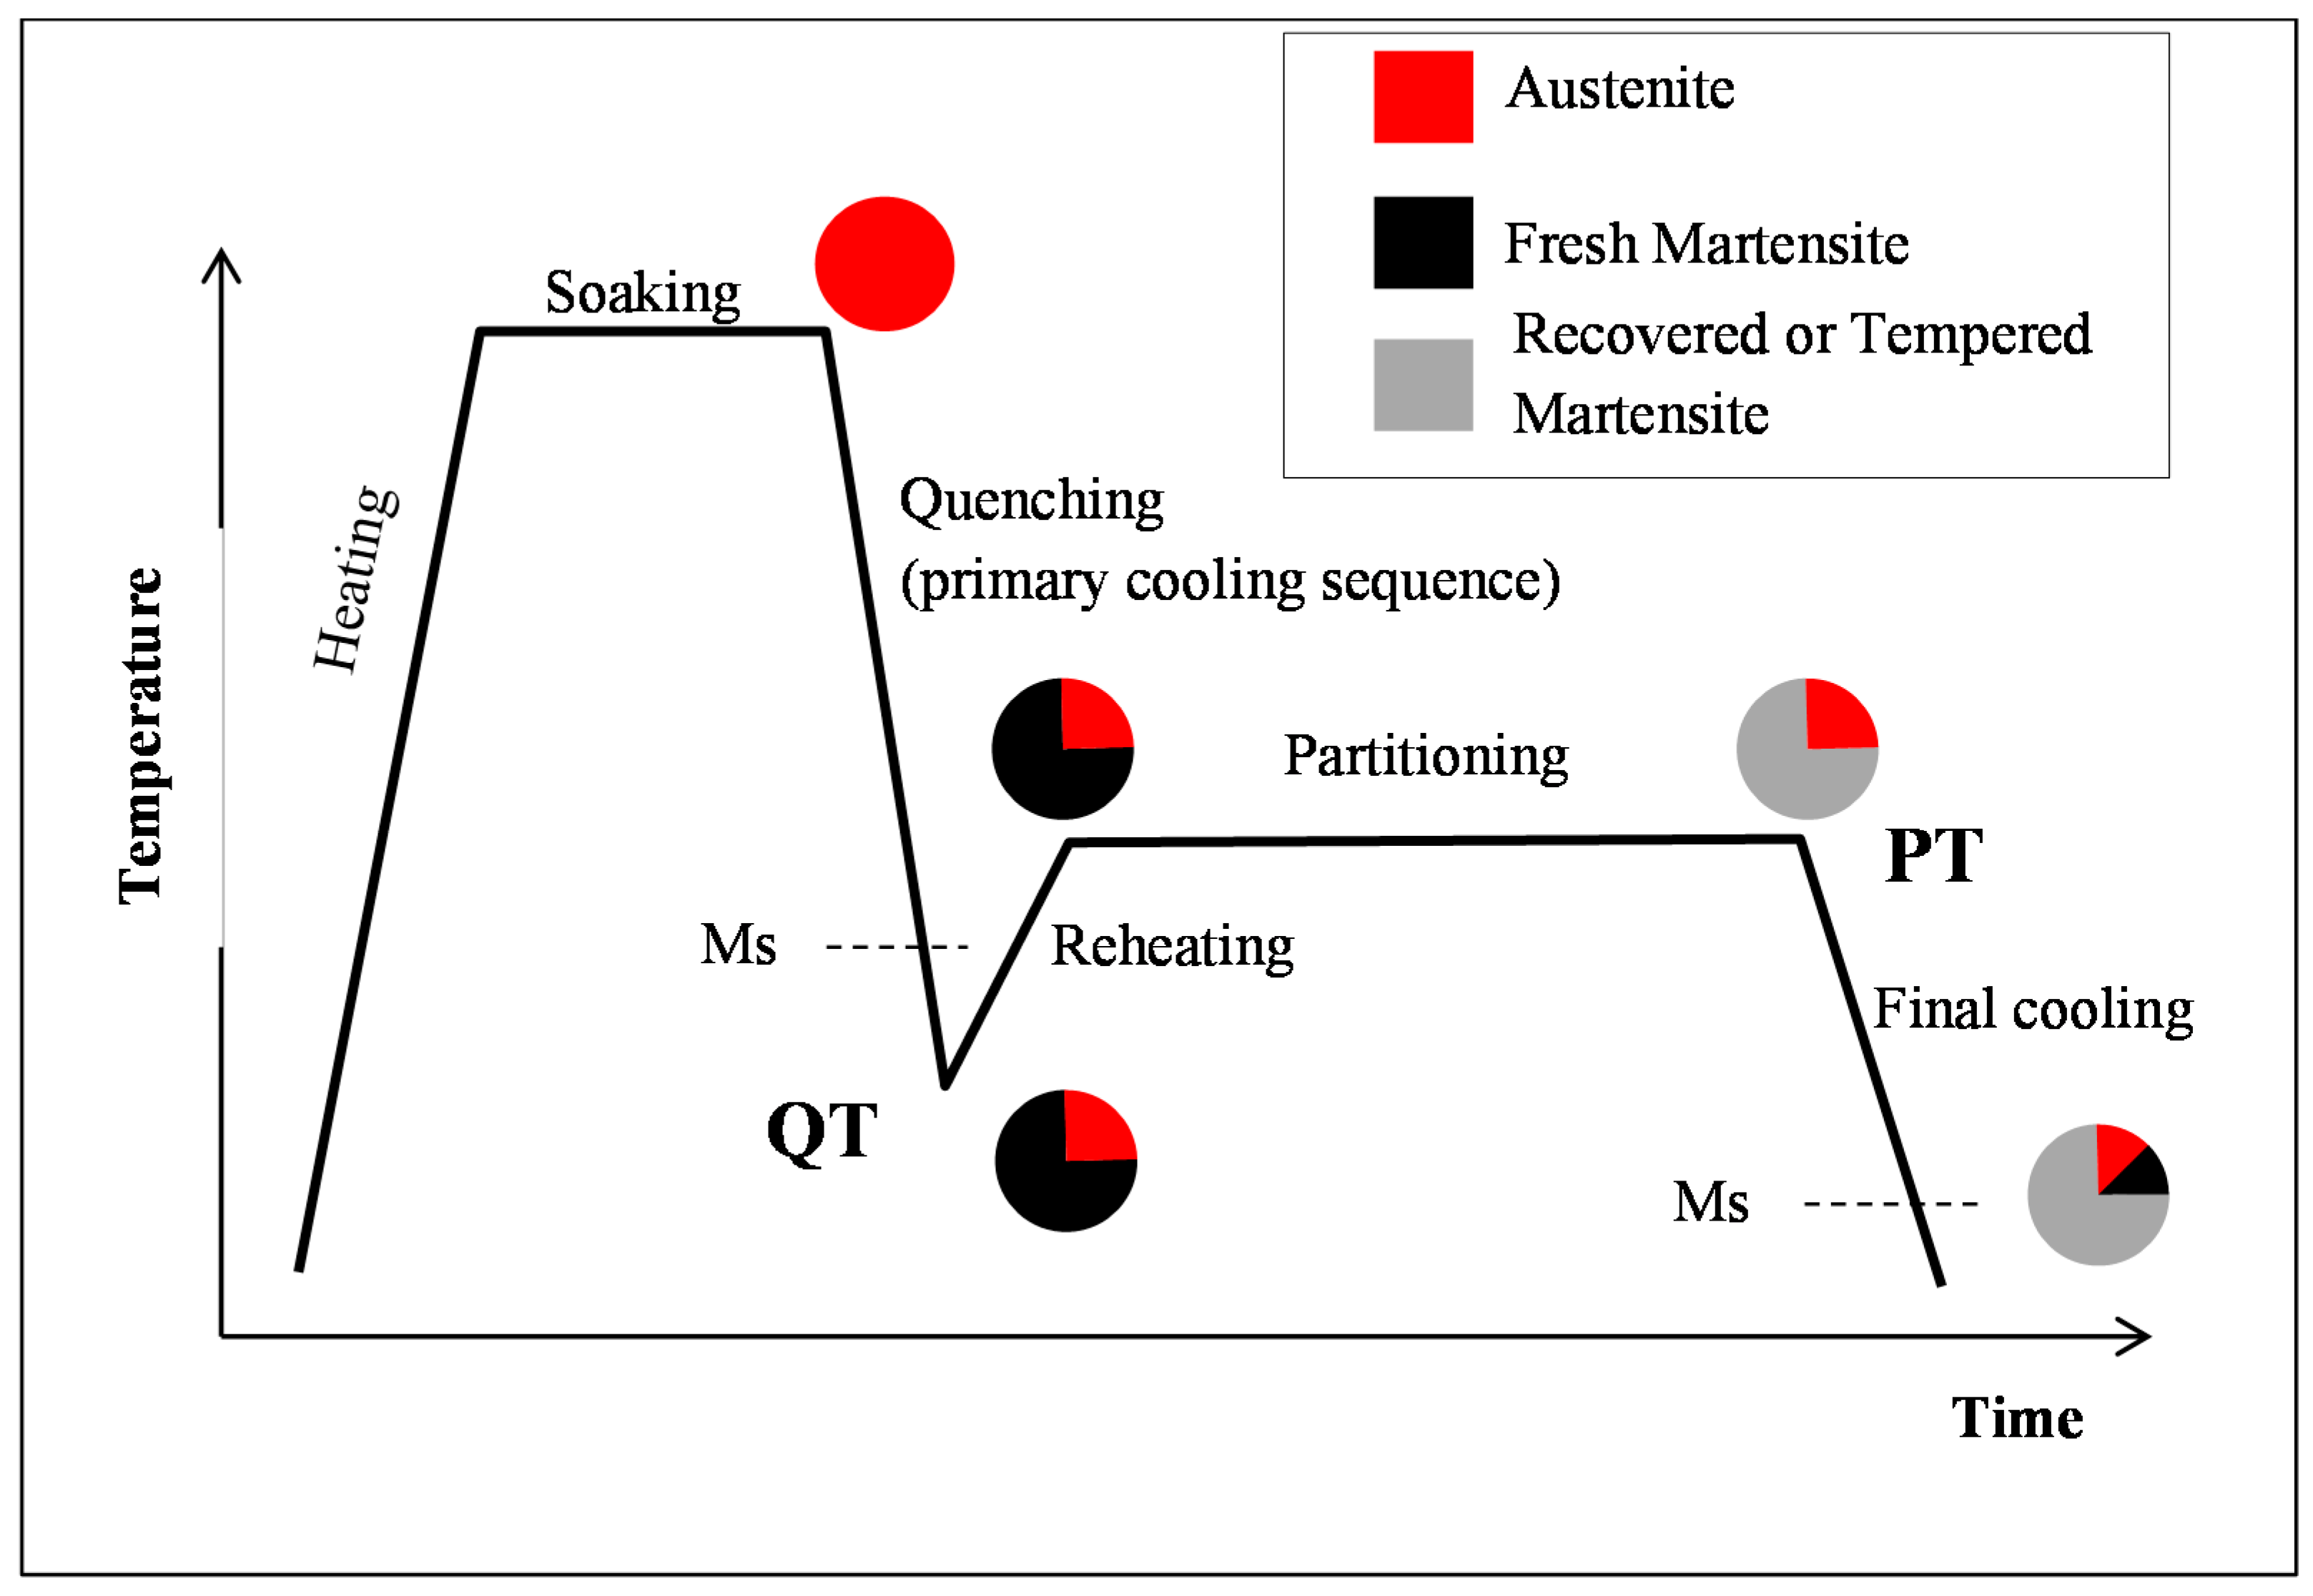
2.3. Quenching & Partitioning (Q&P) Processing Conditions

The Q&P cycles were conducted using a commercial Instron electro-thermal mechanical testing (ETMT) (Instron, Norwood, MA, USA) thermomechanical device. The samples were heated up by the Joule effect and naturally cooled down through cold jaws. This explained, to some extent, transient regimes observed when changing heating or cooling rates. Temperature was measured and regulated with a thermocouple welded on the sample as close as possible to the analyzed region. This particular set-up permitted measuring microstructure evolutions all along the cycle, and capturing fast phenomena, especially close to the primary cooling sequence and during reheating (about 1500 2D X-ray diffraction spectra were acquired for each Q&P cycle).
Three different Q&P cycles, with a different QT and PT, as discussed below, were investigated. The samples were first heated at 900 °C for 200 s with a heating rate of 10 °C/s to reach a fully austenitic state. They were then cooled rapidly at an initial cooling rate of 50 °C/s in order to avoid pro-eutectoid ferritic and bainitic transformations before primary martensitic transformation, as shown by Hell et al. [19,20]. Due to the cooling method, a slight change in the cooling rate was observed at the Ms temperature because of the latent transformation heat.
Two different QTs were chosen to optimize the fraction of retained austenite, according to the original approach of Speer et al. [4,5,6]. For the investigated alloy, the predicted retained austenite fraction as a function of the QT after the long partitioning time is represented in Figure 2. The calculation relied on a Carbon Constraint Equilibrium (CCE) assumption and the empirical Van Bohemen et al. [25,26] equations for martensitic transformations (initial and final). The CCE is an interface condition between martensite and austenite assuming that only the chemical potential of carbon must be equilibrated in both phases, and that the interface is fixed as a consequence [4,5,6]. The validity of such mean-field calculations is often discussed in the literature [16] and is considered as an upper-bound by some authors [12]. The treatment QT = 230 °C/PT = 400 °C was considered as the reference in the following, as it corresponded to the higher retained austenite amount (22%). Note that this treatment has already been studied and discussed by Allain et al. [23]. In the present paper, two additional Q&P cycles were investigated for comparison. The first (second cycle) had a lower QT (QT = 200 °C/PT = 400 °C), for which the Speer et al. approach predicted a lower fraction of retained austenite (12%) with a higher carbon content, and thus higher stability. The second (third cycle) had a higher PT (QT = 230 °C/PT = 450 °C), where the predicted retained austenite fraction at RT was similar to the reference cycle after long partitioning [16]. As differences in bainitic transformations were expected [12], the final experimental austenite fractions may have differred, highlighting the influence of the bainitic transformation, if present, on the final microstructure at RT. For all considered cycles, the duration of the partitioning step was about 250 s, and the final cooling achieved with a mean cooling rate of 20 °C/s.

3. Results

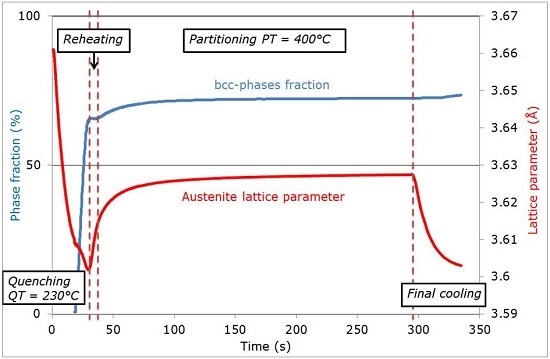
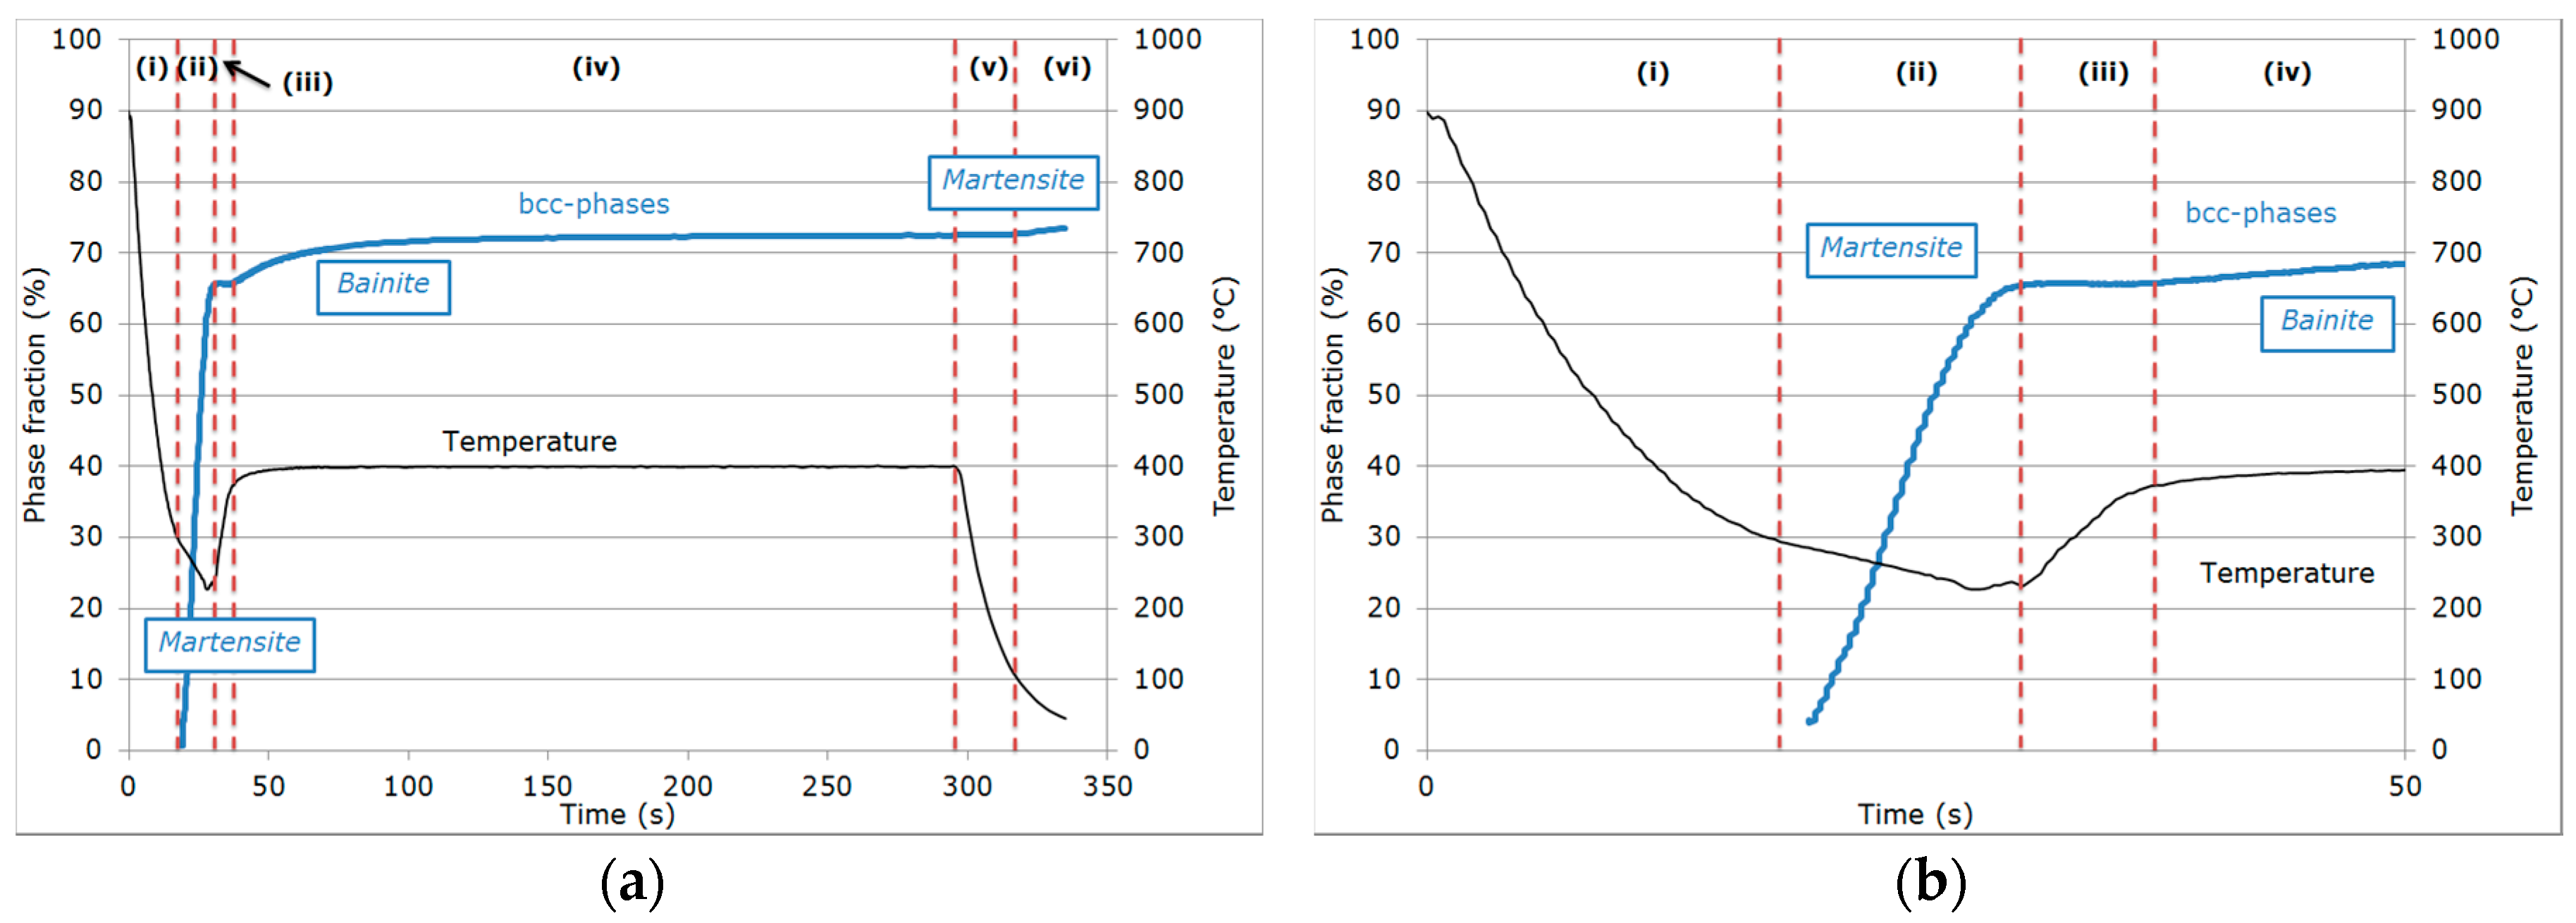
3.1. Evolution of Phase Fractions
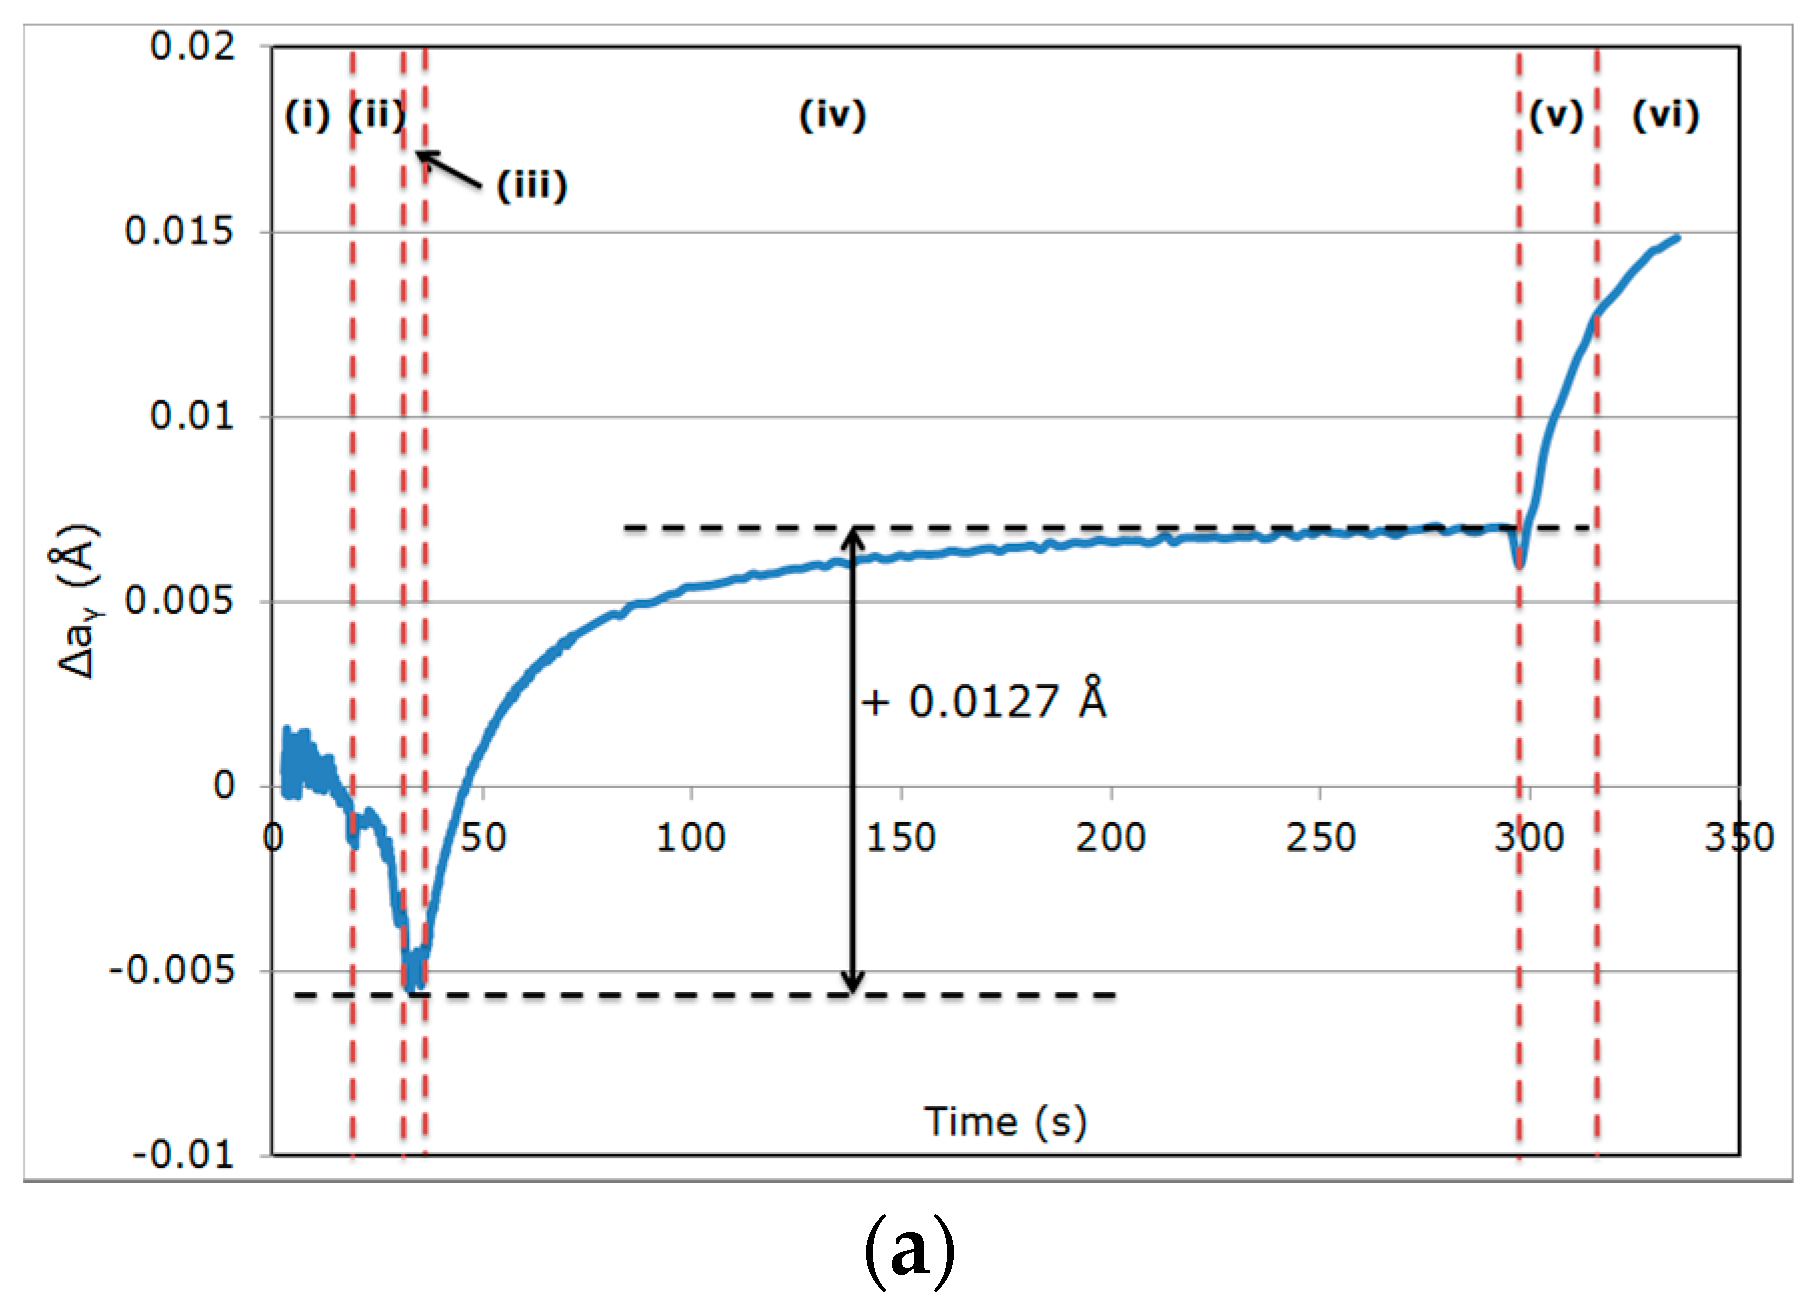
Figure 3a shows the evolution of the temperature and measured phase fractions as a function of time for the reference cycle: QT = 230 °C/PT = 400 °C. The figure is restricted to the most interesting part of the cycle, i.e., austenite decomposition after soaking. The evolution can be decomposed into six steps, which have been described in [23], and are separated in Figure 3 by red dashed lines (for clarity, the first 50 s have been detailed in Figure 3b):
(i)
During the first cooling step, the alloy remained fully austenitic above Ms.
(ii)
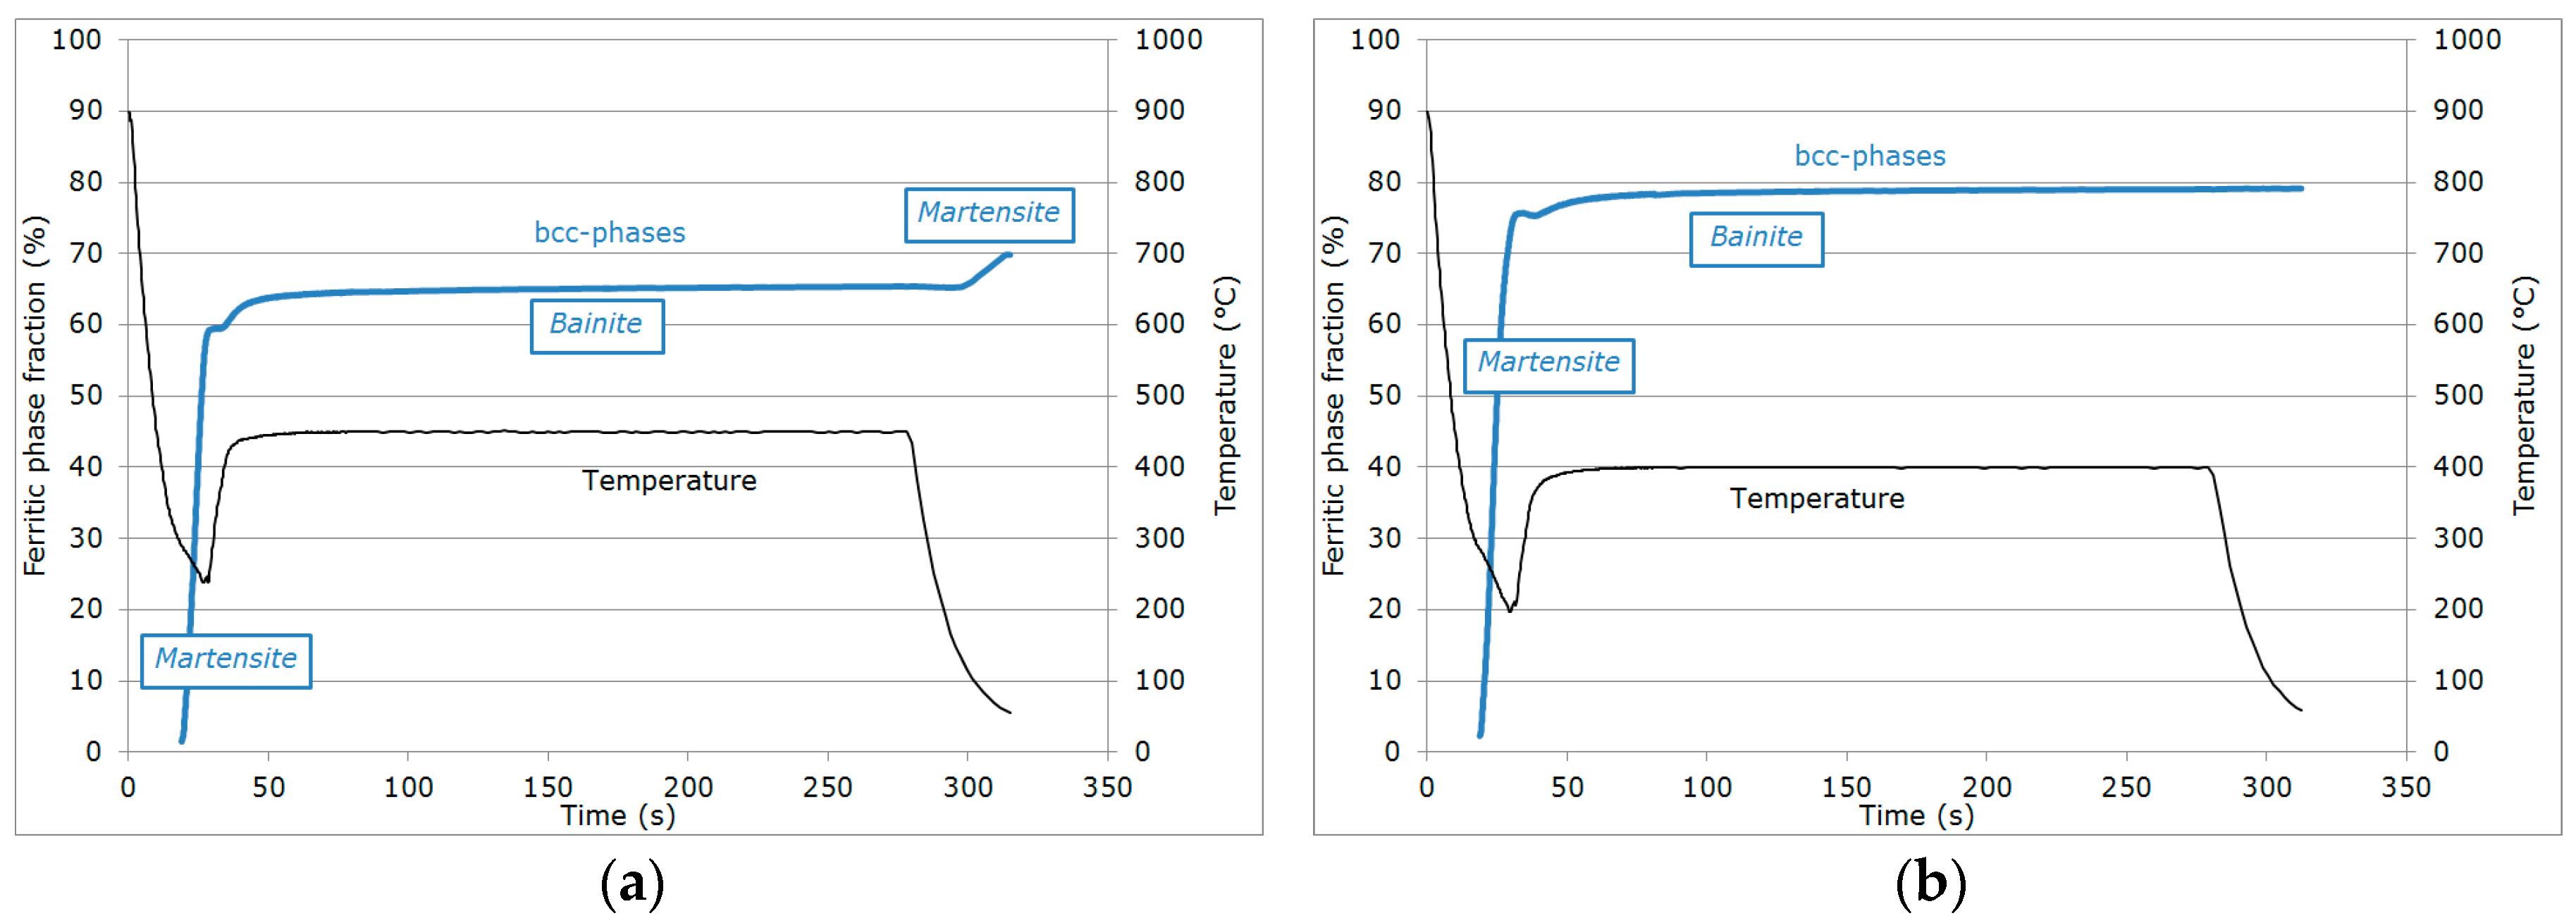
Primary martensitic transformation below initial Ms: The initial Ms temperature was estimated to be 295 °C from an extrapolation of the transformation kinetics. The final fraction of martensite before reheating was 65% (note that at this stage, the bcc phase was implicitly but obviously identified as martensite).
(iii)
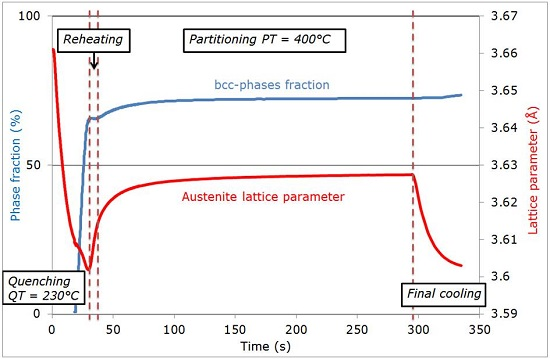
Reheating step, with a duration of a few seconds, because of the regulation procedures of the heating device: The duration of this transient regime was lower than 5 s, before temperature stabilization for the partitioning step. Figure 3b reveals that during the reheating step, the phase fractions remained constant. For all studied conditions, the phase fractions remained constant during reheating up to about 370 °C.
(iv)
Partitioning step: Above 370 °C, a significant increase in the bcc phase fraction was observed during the partitioning step. The kinetics were initially fast during the first 50 s, progressively slowing down. Due to the experimental limitations in revealing tetragonality, the exact nature of this bcc phase was debatable as it could have corresponded to either bainite and/or athermal martensite. Indeed, there was strong evidence of both bainite and athermal martensite formation below Ms [7,31,32]. It was even stated that this isothermal product was neither purely martensitic nor purely bainitic [33]. One could even consider the simultaneous formation of both athermal martensite and bainite as an alternative. Indeed, the formation of athermal martensite could have a strong accelerating effect on the subsequent bainite formation by providing a higher density of potential nucleation sites. As a consequence, below Ms, the nature of the transformation products during isothermal holding was unclear. In addition, lower bainite and athermal martensite exhibited morphological similarities. The morphological criteria used by Somani et al. to distinguish bainite from athermal martensite (laths with wavy boundaries and ledge-like protrusions) [7] was discussed very recently by [34] in a convincing way. According to their analysis, below Ms, the driving force for bainite nucleation is so high that small units of bainite may grow from the initial martensite laths in the form of ledge-liked protrusions. Furthermore, bainitic ferrite can grow from the prior athermal martensite, maintaining a similar orientation relationship that could have contributed to the formation of the ledge-like protrusions that could have, in turn, given rise to a wavy appearance of the boundaries.
In the present study, it is worth noting that the austenite-to-martensite transformation below Ms was followed by a stagnant stage during re-heating, during which no phase transformation occurred until 370 °C. The growth of the bcc phase started at around 370 °C, a temperature which was much higher than the Ms temperature (295 °C). It was thus difficult to imagine that athermal martensite could be formed above 370 °C, and not between Ms and 370 °C, where the driving force for athermal transformation was much higher. Furthermore, it was shown that ferritic bainite formation is favoured at high partitioning temperatures above 400 °C [7,34]. That is why the bcc phase formed during the partitioning step was considered as bainite.
(v)
During the first part of the final cooling step, the fraction of the bcc phase identified as bainite remained constant down to 120 °C.
(vi)
Final martensitic transformation, evidenced by a 2% increase in the bcc phase fraction below 120 °C: Note that again, similarly to step (ii), the increase in the bcc phase was obviously attributed to martensite formation. The final fraction of retained austenite at RT was about 27%.
Similar evolutions were observed at a higher PT or at a lower QT. Figure 4 shows the evolution of bcc phase fractions and temperature as a function of time measured along the two other Q&P cycles (defined by: QT = 230 °C/PT = 450 °C and QT = 200 °C/PT = 400 °C).
Compared to the reference cycle, the bainite fraction formed was similar (+7%) at a higher PT (PT = 450 °C). Nevertheless, the initial martensitic fraction was slightly lower (58%), as the QT reached was slightly higher (237 °C). Due to the fast transformation kinetics, a minor deviation in the QT can have a significant effect on phase fractions. As the secondary martensitic transformation started at 150 °C, the final martensite fraction (+5%) was higher than in the reference case. Finally, the final fraction of retained austenite at RT was about 30%.
At a lower QT (200 °C), the bainite fraction formed during partitioning was lower (+2%). No final martensitic transformation was observed during final cooling (steps (v) and (vi)). The absence of a final martensitic transformation was expected from the model of Speer et al. The final fraction of retained austenite at RT was about 21% for the cycle.

3.2. Evolution of Austenite Lattice Parameter

The evolution of the austenite lattice parameter is complex along a Q&P cycle, as the lattice thermal expansion varies all along the thermal cycle. This thermal expansion was not constant as in studies carried out on isothermal carbide-free bainitic transformations, for instance. Other possible mechanisms affecting the lattice parameter evolution, such as changes in stress state and in chemical compositions, were thus partially screened. To overcome this intricacy, the expected contribution of thermal expansion needed to be subtracted from the raw measurements (as previously done in [23,24,35]). This permitted isolating the mechanical and chemical effects on the lattice parameters. To do so, the mean thermal expansion coefficient was measured during the primary cooling between 800 and 320 °C (step (i)). In this temperature range, the alloy was fully austenitic and could be considered as stress-free and homogeneous with the nominal chemical composition. The experimental value found for the reference cycle (2.526 × 10⁻⁵·K−1) was close to the value reported by Lu et al. (2.326 × 10⁻⁵·K−1) [36] for pure austenitic iron.
The austenite lattice parameter minus the thermal expansion contribution along the cycle will be referred to as Δaγ in the following. For the reference cycle, the evolution of Δaγ is represented in Figure 5a as a function of time. By doing so, it was assumed implicitly in this work that the thermal expansion coefficient determined above could be extrapolated at lower temperatures (i.e., considered as independent of any possible chemical composition change, despite the work of [37]) and as independent also of temperature despite the work of [38]). For the studied carbon enrichments and partitioning temperature ranges, these non-linear effects would not affect carbon balances between phases. Nevertheless, they would lead to overestimating the hydrostatic stresses measured in austenite at RT, as discussed below.
By construction, Δaγ was thus constant in step (i), i.e., during initial cooling down to Ms temperature (295 °C at t ~ 18 s). Below Ms, in step (ii), a drop in Δaγ was observed during the martensitic transformation. Bruneseaux et al. [39] had already reported such a drop, and related it to second-order internal compressive stresses in austenite, induced by the martensitic transformation (above about 30% martensite). The total decrease in the lattice parameter due to the compressive stress state was −0.0055 Å. As the austenite lattice parameter was 3.6163 Å at t ~ 35 s at the end of step (ii), the relative lattice volume change was about −0.50%. At 230 °C, this corresponded to a hydrostatic pressure of about −750 MPa, assuming a bulk modulus K = 150 GPa (after the extrapolations of Ghosh and Olson) [40].
During reheating (step (iii)), Δaγ remained constant again, indicating that the austenite lattice parameter increased only because of thermal expansion.
During partitioning (step (iv)), Δaγ increased rapidly. This revealed mechanical and/or composition evolutions in austenite. The increase was fast during the first 50 s of partitioning and then sluggish during the rest of the step. The total increase in the lattice parameter was about +0.0127 Å after 250 s, as indicated in Figure 5a. As discussed in our previous work [23], this increase was likely to be due only to carbon enrichment. The relaxation of internal stresses during reheating was ruled out from the analysis as so far, the expected kinetics of such a process were far slower than the observed evolution [41]. Moreover, the full width at half maximums (FWHMs) of austenite peaks, regardless of their Bragg’s angles, did not evolve during the partitioning step, which confirmed a low plastic activity during this stage, contrary to what happened in steps (ii) and (iv).
Considering Equation (1) from [23] derived from the work of Toji et al. [18], the relative increase in the carbon content in austenite was estimated at 0.40%. As the initial austenite composition was 0.30% (nominal composition of the alloy), the final carbon content was thus 0.70% at the end of the partitioning step. The new Ms temperature of the austenite was then 170 °C, which was consistent with the value observed in Figure 3a (about 120 °C). As explained in [23], the increase in the austenite lattice parameter was strongly time-correlated to the evolution of the bainitic phase fraction. Nevertheless, the transformation was not sufficient alone to explain the measured carbon enrichment in austenite. Both the partitioning and bainitic transformations were thus responsible for this increase.
During final cooling (steps (v) and (vi)), the austenite lattice parameters Δaγ kept increasing with temperature. To the authors’ knowledge, such an increase has never been reported so far in the literature. Accounting for the fast final cooling rate, it is unlikely to be explained by a diffusion controlled mechanism, i.e., by an evolution of the austenite composition. On the contrary, as the microstructure was heterogeneous, the difference in thermal expansion coefficients between the bcc phases and austenite (eigenstrain) could induce second-order internal stresses. This mechanism is well known in composites with a metal or polymer matrix [42,43]. At RT, the total increase in the austenite lattice parameter during final cooling was +0.0078 Å, which corresponded to an additional hydrostatic stress state of about 1175 MPa, assuming a bulk modulus of 177 GPa. As this calculation was based on a linear coefficient of thermal expansion over the whole range of temperatures, this estimation was probably overestimated. At RT, Δaγ was 0.0148 Å. As 0.0127 Å could be explained by the sole carbon enrichment in austenite, the total residual stress in austenite was only about 295 MPa. This corresponded to the sum of the internal stresses generated during the initial martensitic transformation (compression) and final cooling (tension).
The austenite lattice parameter at RT was thus affected by three different mechanisms in Q&P steels. First, the initial martensitic transformation during step (ii) induced compressive hydrostatic stresses in austenite. Second, carbon enrichment during step (iv) caused a dilatation of the lattice. At last, during final cooling (steps (v) and (vi)), differences in thermal expansion coefficients between the different phases induced additional tensile hydrostatic stresses. It must be emphasized that these three different contributions cannot be discriminated without in situ experiments, such as the ones presented here.
Similar behaviors were observed at a higher PT or lower QT; only experimental thermal expansion coefficients were reassessed for each experiment (2.575 × 10⁻⁵ K−1 for PT = 450 °C; 2.673 × 10⁻⁵ K−1 for QT = 200 °C). The respective evolutions of Δaγ are represented in Figure 5b,c. For the sake of comparison, Table 1 summarizes the full variations in Δaγ during steps (ii), (iv) and (vi) for the three tested conditions.
Compressive states were observed after the initial martensitic transformation (step (ii)) for all studied cases. The lower the QT, the higher the pressure, as expected from Bruneseaux et al. [39]. Nevertheless, the measured differences were weak between experiments. During the partitioning step (iv), an increase was always observed, which could be attributed to carbon enrichment. For QT = 230 °C/PT = 450 °C and QT = 200 °C/PT = 400 °C cycles, the estimated carbon contents at the end of the partitioning step were about 0.67% and 0.80%, respectively. These estimates were again consistent with the Ms temperatures observed (or not) during final cooling.

4. Discussion

4.1. Carbon Mass Balances

The distribution of carbon between the austenitic and bcc phases was calculated by a direct carbon mass balance for the three studied Q&P conditions. The total carbon content in the bcc phases at RT was C0Fγ × Cγ, where Fγ was the final austenite fraction measured at RT, Cγ was the austenite carbon composition measured at PT (assumed to be unchanged at RT), and C0 was the nominal carbon content. Table 2 summarizes these values for the three studied cycles.
As already highlighted by HajyAkbari et al. [12] and Thomas et al. [15], carbon content remaining trapped in the bcc phases (martensite and bainite) was far from being negligible, which jeopardized the possibility of verifying strictly the original Speer’s assumption (almost carbon-free bcc phases). The measured phase fractions are plotted in Figure 6 as functions of the QT and are compared to the calculations of Figure 2. The experimental data were higher than values expected by the model. Nevertheless, the effect of the QT seemed well captured: a lower QT led to a lower fraction of more stable austenite.

4.2. Critical Assessment of the Methods for Estimating Austenite Carbon Enrichment

The analyses presented above are based on an estimation of the carbon content derived from the experimental austenite lattice parameter measured at the end of the partitioning step. Using the procedure proposed by Toji et al. [18], with a lattice parameter value measured at RT at the end of the complete cycle, would have led to different conclusions, as illustrated in Table 3. This “post mortem” method led to significantly overestimating the carbon content in austenite for all the studied cycles; it did not allow accounting for the contribution of the hydrostatic internal stresses induced by the final martensitic transformation (as discussed by [18]) and thermal eigenstrains occurring during the final quench [42]. The carbon content in austenite obtained using the Toji approach was shown to be too high to explain the Ms temperatures observed during the final cooling, in contrast to what was observed using the lattice parameter value at the end of the partitioning step. Another consequence of this overestimation, highlighted in Table 3, was the resulting underestimation of the carbon content trapped in martensite (segregated or precipitated), which was still available for further carbide precipitation.
Nevertheless, this method, which is commonly used when only post-mortem XRD measurements [15,16,18] are available, grants access to relevant trends, as the hydrostatic internal stresses inherited from martensitic phase transformations and thermal eigenstrains are not very sensitive to processing conditions (please refer to Table 1).

5. Conclusions

In situ high-energy X-ray diffraction investigations of different Q&P cycles have demonstrated that:
-
After the first martensitic transformation during cooling down to the QT, no significant evolution is observed during the re-heating step-up to the PT.
-
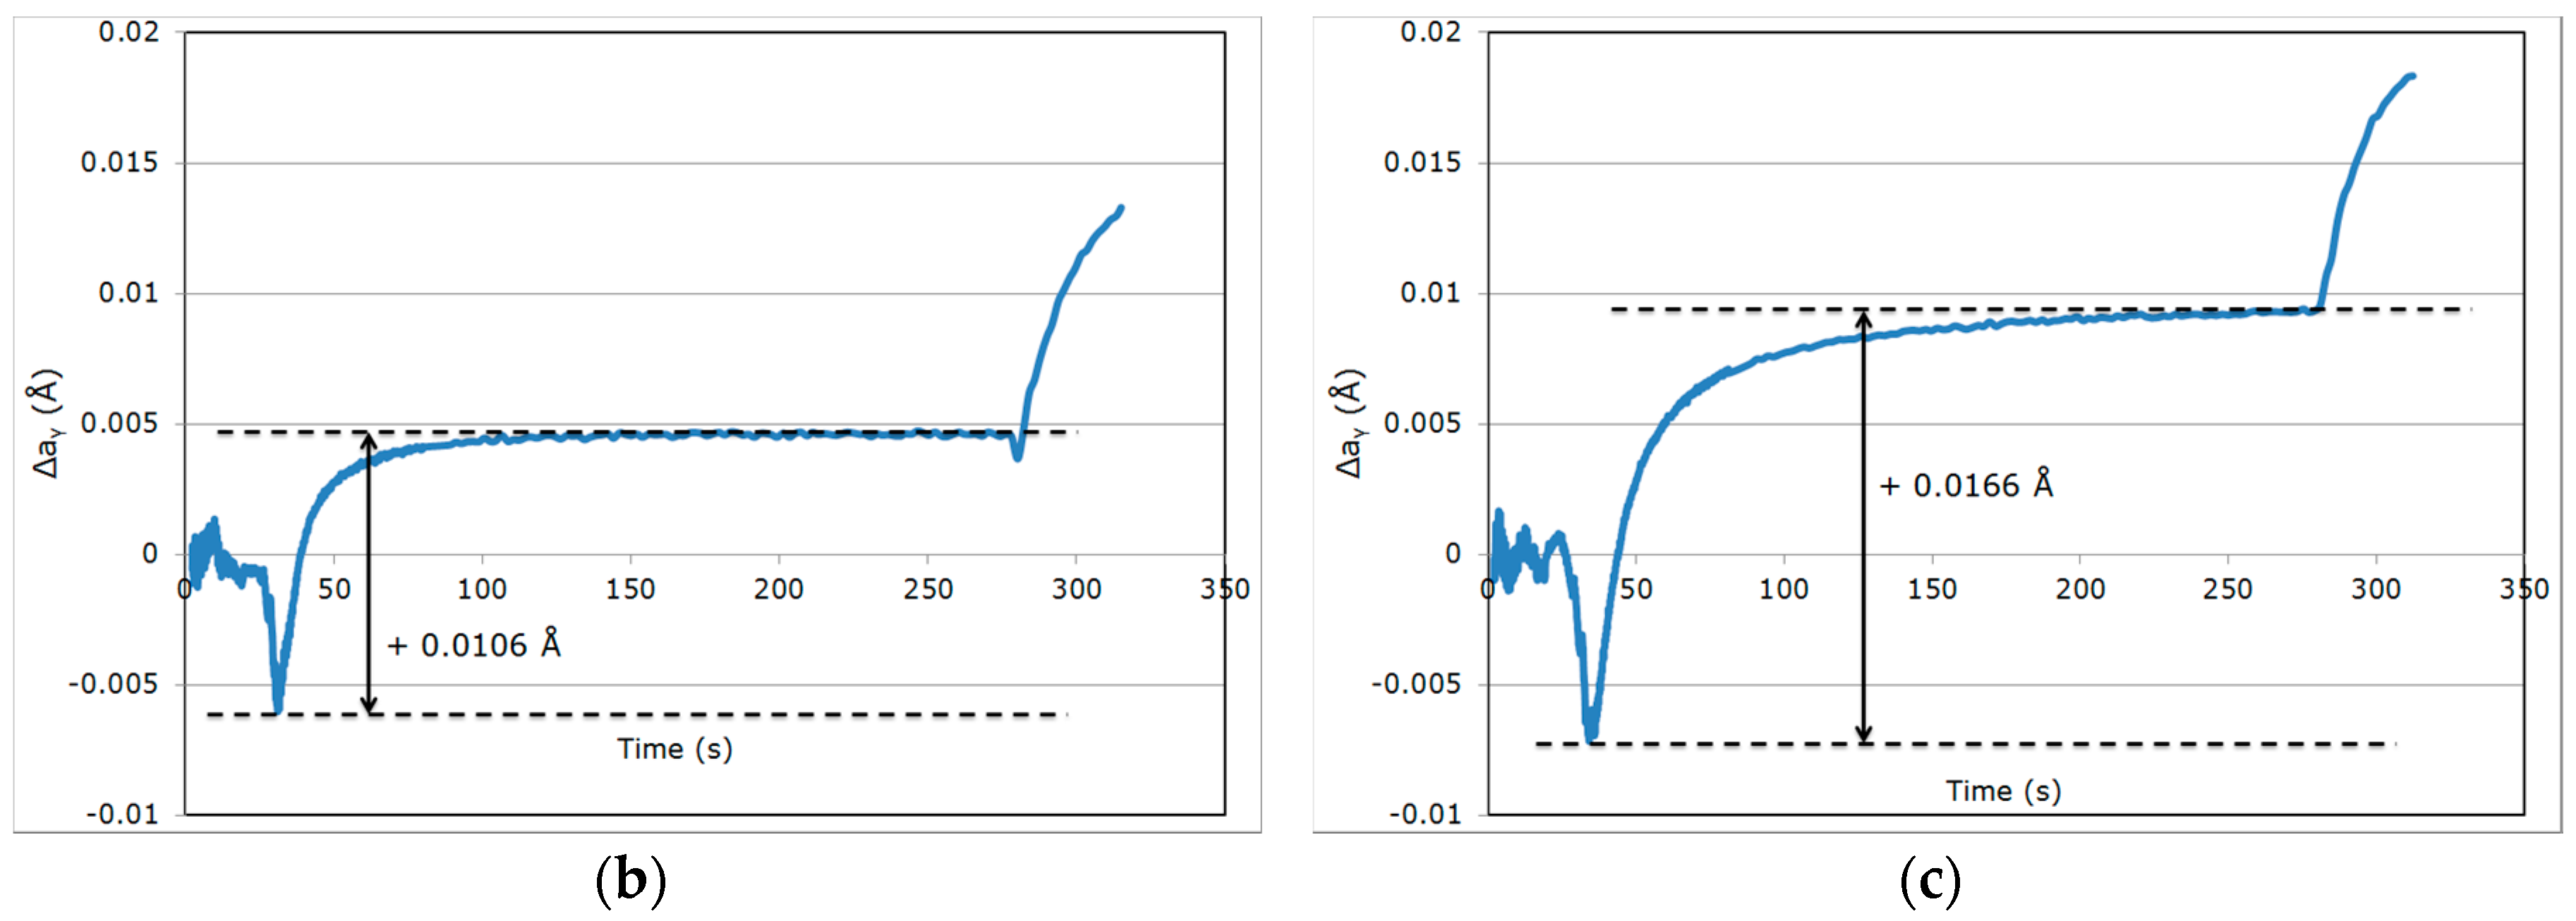
During holding at the PT, an increase in the austenite lattice parameter is observed, resulting from the carbon redistribution from martensite and formation of ferritic bainite.
-
A final increase of the austenite lattice parameter is observed during the final quench, attributed to internal stresses resulting from differences in the thermal expansion between the different phases present (and potentially improving the TRIP ability of the steel).
Due to this additional internal stress, the austenite carbon content cannot be estimated from its final lattice parameter, but from its value at the end of the partitioning step. A comparison of the carbon mass balances shows that using the RT lattice parameter leads to an underestimation, by a factor of 2, of the amount of carbon trapped in the bcc phases formed.

Acknowledgments

This work was supported by the French State through the project CAPNANO (ANR-14-CE07-0029) operated by the National Research Agency (ANR). The synchrotron experiments were realized in December 2014, under the MA2305 grant at the ESRF in Grenoble, which is fully acknowledged. The authors would like also to thank MATERIALIA cluster and the LABEX DAMAS (ANR-11-LABX-0008-01) from Lorraine for their support.

Author Contributions

Sébastien Yves Pierre Allain, Guillaume Geandier and Jean-Christophe Hell conceived and performed the experiments at ESRF; the data were analyzed with the help of Michel Soler, Mohamed Gouné and Frédéric Danoix, especially for the discussions about mass balances; Sébastien Yves Pierre Allain wrote the paper.

Conflicts of Interest

The authors declare no conflict of interest.

References

  1. Barnard, S.J.; Smith, G.D.W.; Sarikaya, M.; Thomas, G. Carbon atom distribution in a dual phase steel: An atom probe study. Scr. Metall. 1981, 15, 387–392. [Google Scholar] [CrossRef]
  2. Gouné, M.; Danoix, F.; Allain, S.; Bouaziz, O. Unambiguous carbon partitioning from martensite to austenite in Fe–C–Ni alloys during quenching and partitioning. Scr. Mater. 2013, 68, 1004–1007. [Google Scholar] [CrossRef]
  3. Matas, S.; Hehemann, M.F. Retained Austenite and the Tempering of Martensite. Nature 1960, 187, 685–686. [Google Scholar] [CrossRef]
  4. Speer, J.G.; Edmonds, D.V.; Rizzo, F.C.; Matlock, D.K. Partitioning of carbon from supersaturated plates of ferrite, with application to steel processing and fundamentals of the bainite transformation. Curr. Opin. Solid State Mater. Sci. 2004, 8, 219–237. [Google Scholar] [CrossRef]
  5. Speer, J.; Matlock, D.K.; De Cooman, B.C.; Schroth, J.G. Carbon partitioning into austenite after martensite transformation. Acta Mater. 2003, 51, 2611–2622. [Google Scholar] [CrossRef]
  6. Edmonds, D.V.; He, K.; Rizzo, F.C.; De Cooman, B.C.; Matlock, D.K.; Speer, J.G. Quenching and partitioning martensite—A novel steel heat treatment. Mater. Sci. Eng. A 2006, 438–440, 25–34. [Google Scholar] [CrossRef]
  7. Somani, M.C.; Porter, D.A.; Karjalainen, L.P.; Misra, R.D.K. On Various Aspects of Decomposition of Austenite in a High-Silicon Steel During Quenching and Partitioning. Metall. Mater. Trans. A 2014, 45, 1247–1257. [Google Scholar] [CrossRef]
  8. De Moor, E.; Speer, J.G.; Matlock, D.K.; Kwak, J.H.; Lee, S.B. Quenching and Partitioning of CMnSi Steels Containing Elevated Manganese Levels. Steel Res. Int. 2012, 83, 322–327. [Google Scholar] [CrossRef]
  9. Xiong, X.C.; Chen, B.; Huang, M.X.; Wang, J.F.; Wang, L. The effect of morphology on the stability of retained austenite in a quenched and partitioned steel. Scr. Mater. 2013, 68, 321–324. [Google Scholar] [CrossRef]
  10. Ariza, E.A.; Nishikawa, A.S.; Goldenstein, H.; Tschiptschin, A.P. Characterization and methodology for calculating the mechanical properties of a TRIP-steel submitted to hot stamping and quenching and partitioning (Q&P). Mater. Sci. Eng. A 2016, 671, 54–69. [Google Scholar] [CrossRef]
  11. Zhao, H.S.; Li, W.; Zhu, X.; Lu, X.H.; Wang, L.; Zhou, S.; Jin, X.J. Analysis of the relationship between retained austenite locations and the deformation behavior of quenching and partitioning treated steels. Mater. Sci. Eng. A 2016, 649, 18–26. [Google Scholar] [CrossRef]
  12. HajyAkbary, F.; Sietsma, J.; Miyamoto, G.; Furuhara, T.; Santofimia, M.J. Interaction of carbon partitioning, carbide precipitation and bainite formation during the Q&P process in a low C steel. Acta Mater. 2016, 104, 72–83. [Google Scholar] [CrossRef]
  13. Pierce, D.T.; Coughlin, D.R.; Williamson, D.L.; Clarke, K.D.; Clarke, A.J.; Speer, J.G.; De Moor, E. Characterization of transition carbides in quench and partitioned steel microstructures by Mössbauer spectroscopy and complementary techniques. Acta Mater. 2015, 90, 417–430. [Google Scholar] [CrossRef]
  14. Toji, Y.; Miyamoto, G.; Raabe, D. Carbon partitioning during quenching and partitioning heat treatment accompanied by carbide precipitation. Acta Mater. 2015, 86, 137–147. [Google Scholar] [CrossRef]
  15. Thomas, G.A.; Danoix, F.; Speer, J.G.; Thompson, S.W.; Cuvilly, F. Carbon Atom Re-Distribution during Quenching and Partitioning. ISIJ Int. 2014, 54, 2900–2906. [Google Scholar] [CrossRef]
  16. Clarke, A.J.; Speer, J.G.; Miller, M.K.; Hackenberg, R.E.; Edmonds, D.V.; Matlock, D.H.; Rizzo, F.C.; Clarke, K.D.; De Moor, E. Carbon partitioning to austenite from martensite or bainite during the quench and partition (Q&P) process: A critical assessment. Acta Mater. 2008, 56, 16. [Google Scholar] [CrossRef]
  17. Santofimia, M.J.; Nguyen-Minh, T.; Zhao, L.; Petrov, R.; Sabirov, I.; Sietsma, J. New low carbon Q&P steels containing film-like intercritical ferrite. Mater. Sci. Eng. A 2010, 527, 6429–6439. [Google Scholar] [CrossRef]
  18. Toji, Y.; Matsuda, H.; Herbig, M.; Choi, P.P.; Raabe, D. Atomic-scale analysis of carbon partitioning between martensite and austenite by atom probe tomography and correlative transmission electron microscopy. Acta Mater. 2014, 65, 215–228. [Google Scholar] [CrossRef]
  19. Hell, J.C.; Dehmas, M.; Allain, S.; Prado, J.M.; Hazotte, A.; Chateau, J.P. Microstructure–Properties Relationships in Carbide-free Bainitic Steels. ISIJ Int. 2011, 51, 1724–1732. [Google Scholar] [CrossRef]
  20. Hell, J.C. Aciers Bainitiques Sans Carbure: Caractérisations Microstructurale Multi-Echelle et In Situ de la Transformation Austénite-Bainite et Relations Entre Microstructure et Comportement Mécanique. Ph.D. Thesis, Université Paul Verlaine, Metz, France, 10 November 2011. [Google Scholar]
  21. Caballero, F.G.; Allain, S.; Cornide, J.; Puerta Velásquez, J.D.; Garcia-Mateo, C.; Miller, M.K. Design of cold rolled and continuous annealed carbide-free bainitic steels for automotive application. Mater. Des. 2013, 49, 667–680. [Google Scholar] [CrossRef]
  22. Nishikawa, L.; Ogata, P.; Nishikawa, A.; Ramirez, M.; Goldenstein, H. Tempering Behaviour of a Quenched Microalloyed Pipeline Steel. In Proceedings of the TMS 2016 Conference, Nashville, TN, USA, 14–18 February 2016. [Google Scholar]
  23. Allain, S.Y.P.; Geandier, G.; Hell, J.C.; Soler, M.; Danoix, F.; Gouné, M. In-situ investigation of quenching and partitioning by High Energy X-Ray Diffraction experiments. Scr. Mater. 2017, 131, 15–18. [Google Scholar] [CrossRef]
  24. Epp, J.; Hirsch, T.; Curfs, C. In situ X-Ray Diffraction Analysis of Carbon Partitioning during Quenching of Low Carbon Steel. Metall. Mater. Trans. A 2012, 43, 2210–2217. [Google Scholar] [CrossRef]
  25. Van Bohemen, S.M.C. Modeling Start Curves of Bainite Formation. Metall. Mater. Trans. A 2010, 41, 285–296. [Google Scholar] [CrossRef]
  26. Van Bohemen, S.M.C. Bainite and martensite start temperature calculated with exponential carbon dependence. Mater. Sci. Technol. 2012, 28, 487–495. [Google Scholar] [CrossRef]
  27. The FIT2D Home Page. Available online: http://www.esrf.eu/computing/scientific/FIT2D/ (accessed on 11 April 2017).
  28. Rodriguez-Carvajal, J. Recent advances in magnetic structure determination by neutron powder diffraction. Physica B 1993, 192, 55. [Google Scholar] [CrossRef]
  29. Rementeria, R.; Jimenez, J.A.; Allain, S.Y.P.; Geandier, G.; Poplawsky, J.D.; Guo, W.; Urones-Garrote, E.; Garcia-Mateo, C.; Caballero, F.G. Quantitative assessment of carbon allocation anomalies in low temperature bainite. Acta Mater. 2017, 133, 333–345. [Google Scholar] [CrossRef]
  30. Hirotsu, Y.; Nagakura, S. Crystal structure and morphology of the carbide precipitated from martensitic high carbon steel during the first stage of tempering. Acta Metall. 1972, 20, 846. [Google Scholar] [CrossRef]
  31. Van Bohemen, S.M.C.; Santofimia, M.J.; Sietsma, J. Experimental evidence for bainite formation below Ms in Fe–0.66C. Scr. Mater. 2008, 58, 488–491. [Google Scholar] [CrossRef]
  32. Kolmskog, P.; Borgenstam, A.; Hillert, M.; Hedstrom, P.; Babu, S.S.; Terasaki, H.; Komizo, Y.I. Direct Observation that Bainite can Grow Below Ms. Metall. Mater. Trans. A 2012, 43A, 4984–4988. [Google Scholar] [CrossRef]
  33. Kim, D.; Lee, S.J.; De Cooman, B.C. Microstructure of Low C Steel Isothermally Transformed in the Ms to Mf Temperature Range. Metall. Mater. Trans. A 2012, 43A, 4967–4983. [Google Scholar] [CrossRef]
  34. Navarro-López, A.; Hidalgo, J.; Sietsma, J.; Santofimia, M.J. Characterization of bainitic/martensitic structures formed in isothermal treatments below the Ms temperature. Mater. Charact. 2017, 128, 248–256. [Google Scholar] [CrossRef]
  35. Bigg, T.D.; Edmonds, D.V.; Eardley, E.S. Real-time structural analysis of quenching and partitioning (Q&P) in an experimental martensitic steel. J. Alloys Compd. 2013, 577, 695–698. [Google Scholar] [CrossRef]
  36. Lu, X.G.; Selleby, M.; Sundman, B. Assessments of molar volume and thermal expansion for selected bcc, fcc and hcp metallic elements. Calphad 2005, 29, 68–89. [Google Scholar] [CrossRef]
  37. Onink, M.; Brakrnan, C.M.; Tichelaar, F.D.; Mittemeijer, E.J.; Van der Zwaag, S. The lattice parameters of austenite and ferrite in FeC alloys as functions of carbon concentration and temperature. Scr. Metall. Mater. 1993, 29, 1011–1016. [Google Scholar] [CrossRef]
  38. Van Bohemen, S.C.M. The nonlinear lattice expansion of iron alloys in the range 100–1600 K. Scr. Mater. 2013, 69, 315–318. [Google Scholar] [CrossRef]
  39. Bruneseaux, F. Apport de la Diffraction des Rayons X à Haute Energie sur les Transformations de Phases, Application aux Alliages de Titanes. Ph.D. Thesis, The National Polytechnic Institute of Lorraine (INPL), Nancy, France, 16 May 2008. [Google Scholar]
  40. Ghosh, G.; Olson, G.B. The isotropic shear modulus of multicomponent Fe-base solid solutions. Acta. Mater. 2002, 50, 2655–2675. [Google Scholar] [CrossRef]
  41. Manjoine, M.J.; Voorhees, H.R. Compilation of Stress-Relaxation Data for Engineering Alloy; ASTM Data Series Publication DS 60; ASTM International: West Conshohocken, PA, USA, 1982. [Google Scholar]
  42. Arsenault, R.J.; Taya, M. Thermal residual stress in metal matrix composite. Acta Metall. 1987, 35, 651–659. [Google Scholar] [CrossRef]
  43. Lu, P. Further studies on Mori–Tanaka models for thermal expansion coefficients of composites. Polymer 2013, 54, 1691–1699. [Google Scholar] [CrossRef]
Figure 1. Typical time–temperature scheme to produce Quenching & Partitioning (Q&P) Transformation Induced Plasticity (TRIP) steels after a full austenitic soaking, and corresponding microstructures, according to [4,5,6]. The quench temperature (QT) and the partitioning temperature (PT) characterizing the cycle are positioned on the cycle.
Metals 07 00232 g001
Figure 2. Retained austenite at room temperature (RT) after Q&P as a function of QT in the studied steel according to the classical approach of Speer at al. (Carbon Constraint Equilibrium (CCE) assumption and model of Van Bohemen et al. for martensitic transformation kinetics) [4,5,6,25,26]. The dashed lines represent both QTs addressed in the present study.
Metals 07 00232 g002
Figure 3. (a) Evolution of phase fractions and temperature as a function of time measured along the reference cycle: QT = 230 °C/PT = 400 °C. (b) Focus is on the first 50 s, covering the first four steps detailed in the text. As discussed in [23], the maximum error made on fraction measurements was about ±1%.
Metals 07 00232 g003
Figure 4. Evolution of phase fractions and temperatures as a function of time measured along two different Q&P cycles defined by: (a) QT = 230 °C/PT = 450 °C, and (b) QT = 200 °C/PT = 400 °C.
Metals 07 00232 g004
Figure 5. Evolution of Δaγ as a function of time: (a) Q&P reference cycle, (b) QT = 230 °C/PT = 450 °C cycle, and (c) QT = 200 °C/PT = 400 °C cycle. The different steps discussed in the text are indicated in Figure 5a. In each figure, the increase in the lattice parameter during step (iv) is reported. This increase was attributed to a carbon enrichment in austenite due to both partitioning and bainitic transformations. The error made on the lattice parameter measurements was about ±0.0002 Å after Fullprof analysis.
Metals 07 00232 g005aMetals 07 00232 g005b
Figure 6. Retained austenite fractions at RT for the three studied conditions compared to the calculations presented in Figure 2. The error bars for phase fraction measurements are fixed to ±1%, as discussed in [23].
Metals 07 00232 g006
Table 1. Variations in Δaγ for the three tested conditions during steps (ii) and (iv) and final cooling.
Variation in ΔaγReference Cycle QT = 230 °C/PT = 400 °CHigh Partitioning Temperature (PT) QT = 230 °C/PT = 450 °CLow Quenching Temperature (QT) QT = 200 °C/PT = 400 °C
End of step (ii)−0.0055 Å−0.0060 Å−0.0072 Å
During step (iv)+0.0127 Å +0.0106 Å+0.0166 Å
During step (vi)+0.0078 Å+0.0087 Å+0.0089 Å
Table 2. Carbon mass balances in austenite and in the bcc phases at RT after studied cycles. The phase fractions were deduced from Figure 3 and Figure 4. The carbon contents in austenite were measured using the relative change in the lattice parameter in step (iv) given in Table 1.
Studied CyclesReference Cycle QT = 230 °C/PT = 400 °CHigh PT QT = 230 °C/PT = 450 °CLow QT QT = 200 °C/PT = 400 °C
Fγ (%)273021
Cγ (wt %)0.700.670.80
Fγ × Cγ (wt %)0.190.200.17
C0Fγ × Cγ (wt %)0.110.100.13
Table 3. Carbon mass balances in austenite and in the bcc phases at room temperature (RT) after the different studied cycles. The carbon contents in austenite were deduced from the measured austenite lattice parameter at RT using the Toji et al. formula [18].
Studied CyclesReference Cycle QT = 230 °C/PT = 400 °CHigh PT QT = 230 °C/PT = 450 °CLow QT QT = 200 °C/PT = 400 °C
aγ (Å) at RT3.60303.60133.6054
Cγ (wt % using the Toji et al. formula)0.920.870.99
C0Fγ × Cγ (wt %)0.050.040.09

