Effect of Anode Pulse-Width on the Microstructure and Wear Resistance of Microarc Oxidation Coatings

School of Mechatronics Engineering, Harbin Institute of Technology, Harbin 150001, China
*
Author to whom correspondence should be addressed.
Metals 2017, 7(7), 243; https://doi.org/10.3390/met7070243
Submission received: 3 May 2017
/
Revised: 27 June 2017
/
Accepted: 27 June 2017
/
Published: 30 June 2017
(This article belongs to the Special Issue Light Weight Alloys: Processing, Properties and Their Applications)
Abstract
:Microarc oxidation (MAO) coatings were prepared on 2024-T4 aluminum alloys using a pulsed bipolar power supply at different anode pulse-widths. After the MAO coatings were formed, the micropores and microcracks on the surface of the MAO coatings were filled with Fluorinated ethylene propylene (FEP) dispersion for preparing MAO self-lubricating composite coatings containing FEP. The effect of the anode pulse-width on the microstructure and wear resistance of the microarc oxidation coatings was investigated. The wear resistance of the microarc oxidation self-lubricating composite coatings was analyzed. The results revealed that the MAO self-lubricating composite coatings integrated the advantages of wear resistance of the MAO ceramic coatings and a low friction coefficient of FEP. Compared to the MAO coatings, the microarc oxidation self-lubricating composite coatings exhibited a lower friction coefficient and lower wear rates.
1. Introduction
Aluminum alloys, due to their advantages of high strength to weight ratio, lightweight [1], proper corrosion resistance, and great workability, have received much attention and are extensively applied in various industries [2]. Unfortunately, the application of aluminum alloys is seriously restricted by their low surface hardness, high and unstable friction coefficient, and poor wear-resistance [3,4,5]. In the past decades, many surface modification technologies have been developed and employed to improve the hardness and wear resistance of aluminum alloys. However, most of these technologies require high temperatures and are complicated to employ. These technologies are also not environmentally friendly [6,7]. Microarc oxidation (MAO), namely plasma electrolytic oxidation (PEO) [8], is an effective technique for the surface treatment of aluminum alloys [9,10]. MAO could be used to prepare ceramic-like oxide coatings on the surface of valve metals [11,12]. The ceramic coatings prepared by MAO have high hardness, good adhesion to the substrate, excellent wear resistance, etc. [13,14,15].
The microstructure and properties of MAO coatings are influenced by many factors such as the electrolyte composition [16], power supply modes [17], electrical parameters [18], oxidation time [19], and additives [20]. Hussein et al. [21] investigated the effect of the current mode (unipolar, bipolar) on the wear properties of MAO coatings on AM60B magnesium alloys. Wu et al. [22] found that the composition, structure, and physical and chemical properties of MAO coatings on the surface of Ti alloys can be extensively modified by changing the anodic and cathodic voltages. Li et al. [23] discovered that the wear resistance of MAO coatings can be significantly improved by increasing the cathodic voltage. Moreover, the MAO ceramic coatings produced also behave as high friction coefficient layers, which limit the extensive engineering applications for MAO technology. The wear resistance of MAO coatings could be improved through decreasing the friction coefficient, which has received increased attention. Wang et al. [7] prepared MAO self-lubricating Al2O3/PTFE composite coatings on the surface of aluminium alloys, and these MAO composite coatings exhibited excellent self-lubricating behaviour. Yin et al. [24] prepared self-lubricating alumina-graphite composite coatings using a one-step PEO process in the appropriate graphite-dispersed electrolyte solution. This MAO composite coating showed excellent performance. Mu et al. [20] prepared MAO self-lubricating TiO2/graphite composite coatings on TI6Al4V alloys. Qin et al. [25] prepared MAO self-lubricating TiO2/MoS2 composite coatings on TI6Al4V alloys.
The microarc oxidation self-lubricating composite coatings could possess relatively improved hardness and higher anti-wear attributes as well as self-lubricating performance coupled with a lower friction coefficient. MAO ceramic coatings typically contain many crater-like micropores of various sizes and a small number of microcracks. This creates the possibility to deposit small sized lubricants into these micropores and microcracks to form microarc oxidation self-lubricating composite coatings. Fluorinated ethylene propylene (FEP) has low shear strength and is often used as a solid lubricant. Moreover, FEP dispersion has good liquidity.
In this study, 2024-T4 aluminum alloys were treated through microarc oxidation using a pulsed bipolar current mode at different anode pulse-widths. After the MAO coatings were formed, the micropores and microcracks on the surface were filled with FEP dispersion for preparing MAO self-lubricating composite coatings containing FEP. The microstructure and properties of the MAO coatings, and the wear resistance of the microarc oxidation self-lubricating composite coatings were investigated. The adhesion strength between the MAO coatings and the substrates was also analyzed.
2. Experimental Details
2.1. Sample Preparation
The MAO coatings were prepared on 2024-T4 aluminum alloys. The main chemical composition (mass fraction, wt %) of the 2024-T4 aluminum alloys is 3.8–4.9% Cu, 0.5% Si, 0.5% Fe, 0.3–0.9% Mn, 1.2–1.8% Mg, 0.25% Zn, 0.10% Cr, 0.15% Ti, balanced with Al. The main mechanical properties of the 2024-T4 aluminum alloys are a yield stress (0.2% offset) of σ0.2 = 325 MPa, a tensile strength of σb = 470 MPa, a Vickers hardness of 130 Hv, an elongation of δ = 20%, and a Young’s modulus of 69 GPa. The sample size was 30 mm × 15 mm × 2 mm. Samples were polished using abrasive papers from 600# to 2000#, degreased by ultrasound in acetone, rinsed in deionized water, and then dried in warm air. The alternating current (AC) pulse microarc oxidation unit (Harbin Institute of Technology, Harbin, China) was used in this experiment. The sample was used as the anode and the electrolytic tank was used as the cathode. The silicate electrolyte was prepared in deionized water. The composition of the electrolyte was (6 g/L) Na2SiO3, (1.5 g/L) KOH, and was of high purity. A pulsed bipolar constant current power supply was used in this experiment, and the schematic of the pulse output is shown in Figure 1. The MAO process parameters are listed in Table 1. All samples were processed for 30 min. I+ is the positive current and I− is the negative current. The mixing pump was opened and the electrolyte was stirred continuously during the MAO treatment. The cycle cooling system was opened to ensure that the electrolyte temperature was less than 40 °C.
The variation curves of the voltages are shown in Figure 2. As shown in Figure 2I, the anode and cathode voltages increased as the MAO processing time increased during microarc oxidation. The resistance of MAO coatings increased as the MAO coatings grew, resulting in an increase of the anode and cathode voltages under the constant current mode during MAO. Moreover, Figure 2II,III show that the growth rates of the anode and cathode voltages increased in association with the anode pulse-width, which may be related to the growth rate of the MAO coatings during the process.
After the microarc oxidation coatings were formed, the coated samples were rinsed with deionized water and dried in warm air. The coated samples were immersed in a water-based FEP dispersion. The immersion time was 15 min. The micropores and microcracks on the surface of the MAO coatings were filled with the FEP dispersion. After immersing for 15 min, the samples were heated for 40 min at 220 °C and the FEP dispersion solidified. The FEP was embedded into the micropores and microcracks of the MAO ceramic coatings, which formed the MAO self-lubricating composite coatings containing FEP. The MAO coatings are those from “a” to “g”, while the MAO-FEP coatings are labeled with a1 and, therefore, are those from “a1” to “g1”.
2.2. Testing and Characterization
The morphologies of the microarc oxidation ceramic coatings formed using the pulsed bipolar power supply at different anode pulse-widths and the morphologies of the microarc oxidation self-lubricating composite coatings were observed by a FEI Sirion scanning electron microscope (SEM, FEI Quanta 200F, FEI, Eindhoven, The Netherlands). The coating thickness was measured via SEM. The surface roughness of the microarc oxidation ceramic coatings was measured by an OLS3000 laser confocal microscope (OLS, Suzhou, China). The phase structure of the microarc oxidation ceramic coatings was analyzed by an X’ Pert PRO X-ray diffractometer (XRD, Philips, Amsterdam, The Netherlands).
The adhesion strength of the microarc oxidation coatings was evaluated using a CSM microscratch tester (CSM, Neuchatel, Switzerland). In this test, the load on a diamond Rockwell indenter with a tip radius of 100 μm was linearly increased from 0 to 30 N at a normal loading speed of 30 N·min−1 as the diamond is drawn across the surface of the MAO coatings. The scratch length was 5 mm. The critical load values (Lc) were determined using supplementary data graphics including acoustic emission and friction coefficient.
The hardness was measured by a Vickers hardness tester (Huayin, Laizhou, China): the load was 10 N and the dwelling time was 10 s. For each sample, the tests were carried out six times. The friction coefficient of the MAO coatings and the microarc oxidation self-lubricating composite coatings was measured by a CETR-UMT-2 ball-on-disk wear tester (CETR, Campbell, CA, USA). WC balls with a diameter of 5 mm and a surface roughness greater than 0.05 μm were used as counterface materials. All wear tests were conducted with WC balls in sliding contact with a load of 10 N at a fixed sliding speed. The rotating diameter and rotating speed of the wear tester were 6 mm and 200 rpm, respectively. The test time of each sample measured on the wear tester was 20 min. The width of the wear tracks were measured via SEM and an OLS3000 laser confocal microscope. The depth and volume of the wear tracks were detected by an OLS3000 laser confocal microscope. The average value of the three profiles on the wear tracks was used to calculate the wear rate. The computation formula of the wear rate is reported in Equation (1) [20], where Q is the wear rate, is the wear volume (mm3), P is the applied load (N), and S is the sliding distance (m).
3. Results and Discussion
3.1. Microstructure of MAO Coatings and MAO Self-Lubricating Composite Coatings
The surface morphologies of the microarc oxidation ceramic coatings prepared on the surface of 2024-T4 aluminum alloys are shown in Figure 3. MAO ceramic coatings contained many crater-like micropores of various sizes and a small number of microcracks. The porosity of the MAO ceramic coatings increased significantly and the MAO coatings became more porous as the anode pulse-width increased from 1000 to 4000 μs. These micropores were formed by molten “oxide magma” and the gas bubbles ejected from discharge channels. The rapid solidification of the molten oxide magma ejected from discharge channels in the electrolyte, however, also produced thermal stress, which caused microcracks [26].
As shown in Figure 3, A-type holes, B-type holes, and C-type holes were clearly exhibited on the surface of the MAO coatings. A-type holes and C-type holes showed a porous foam-like structure. B-type holes looked like flat pancakes and showed a more compact structure. According to previous studies, three typical discharge events occurred in the MAO process. A-type discharge events occurred in holes on the surface of the MAO coatings. B-type discharge events penetrated through the MAO coatings. C-type discharge events occurred in the relatively deep holes on the surface of the MAO coatings. A-type holes, B-type holes and C-type holes were formed by A-type discharge events, B-type discharge events, and C-type discharge events, respectively [27]. Therefore, it can be inferred that with the increase in the anode pulse-width, A-type discharge events and C-type discharge events increase. At the same time, B-type discharge events decrease and MAO coatings became more porous.
The surface roughness of microarc oxidation ceramic coatings is shown in Figure 4. The surface roughness of the microarc oxidation coatings increased significantly with the increase in the anode pulse-width. As shown in Figure 3, the foam-like structures increased in size and quantity with the increase in the anode pulse-width, which increased the surface roughness of the microarc oxidation coatings.
The cross-sectional morphologies of the microarc oxidation ceramic coatings are shown in Figure 5. Figure 5 shows the defects and micropores (region D). In the MAO coatings, the defects and micropores increased significantly with an increase in the anode pulse-width, and the MAO coatings became more porous. A-type discharge events and C-type discharge events did not penetrate through the entire MAO coating. This did not result in the formation of a new oxide. A-type discharge events and C-type discharge events increased with the increase in the anode pulse-width. The defects and micropores in the MAO coatings were not completely filled with the molten oxide magma, which rapidly solidified and formed MAO coatings with higher porosity.
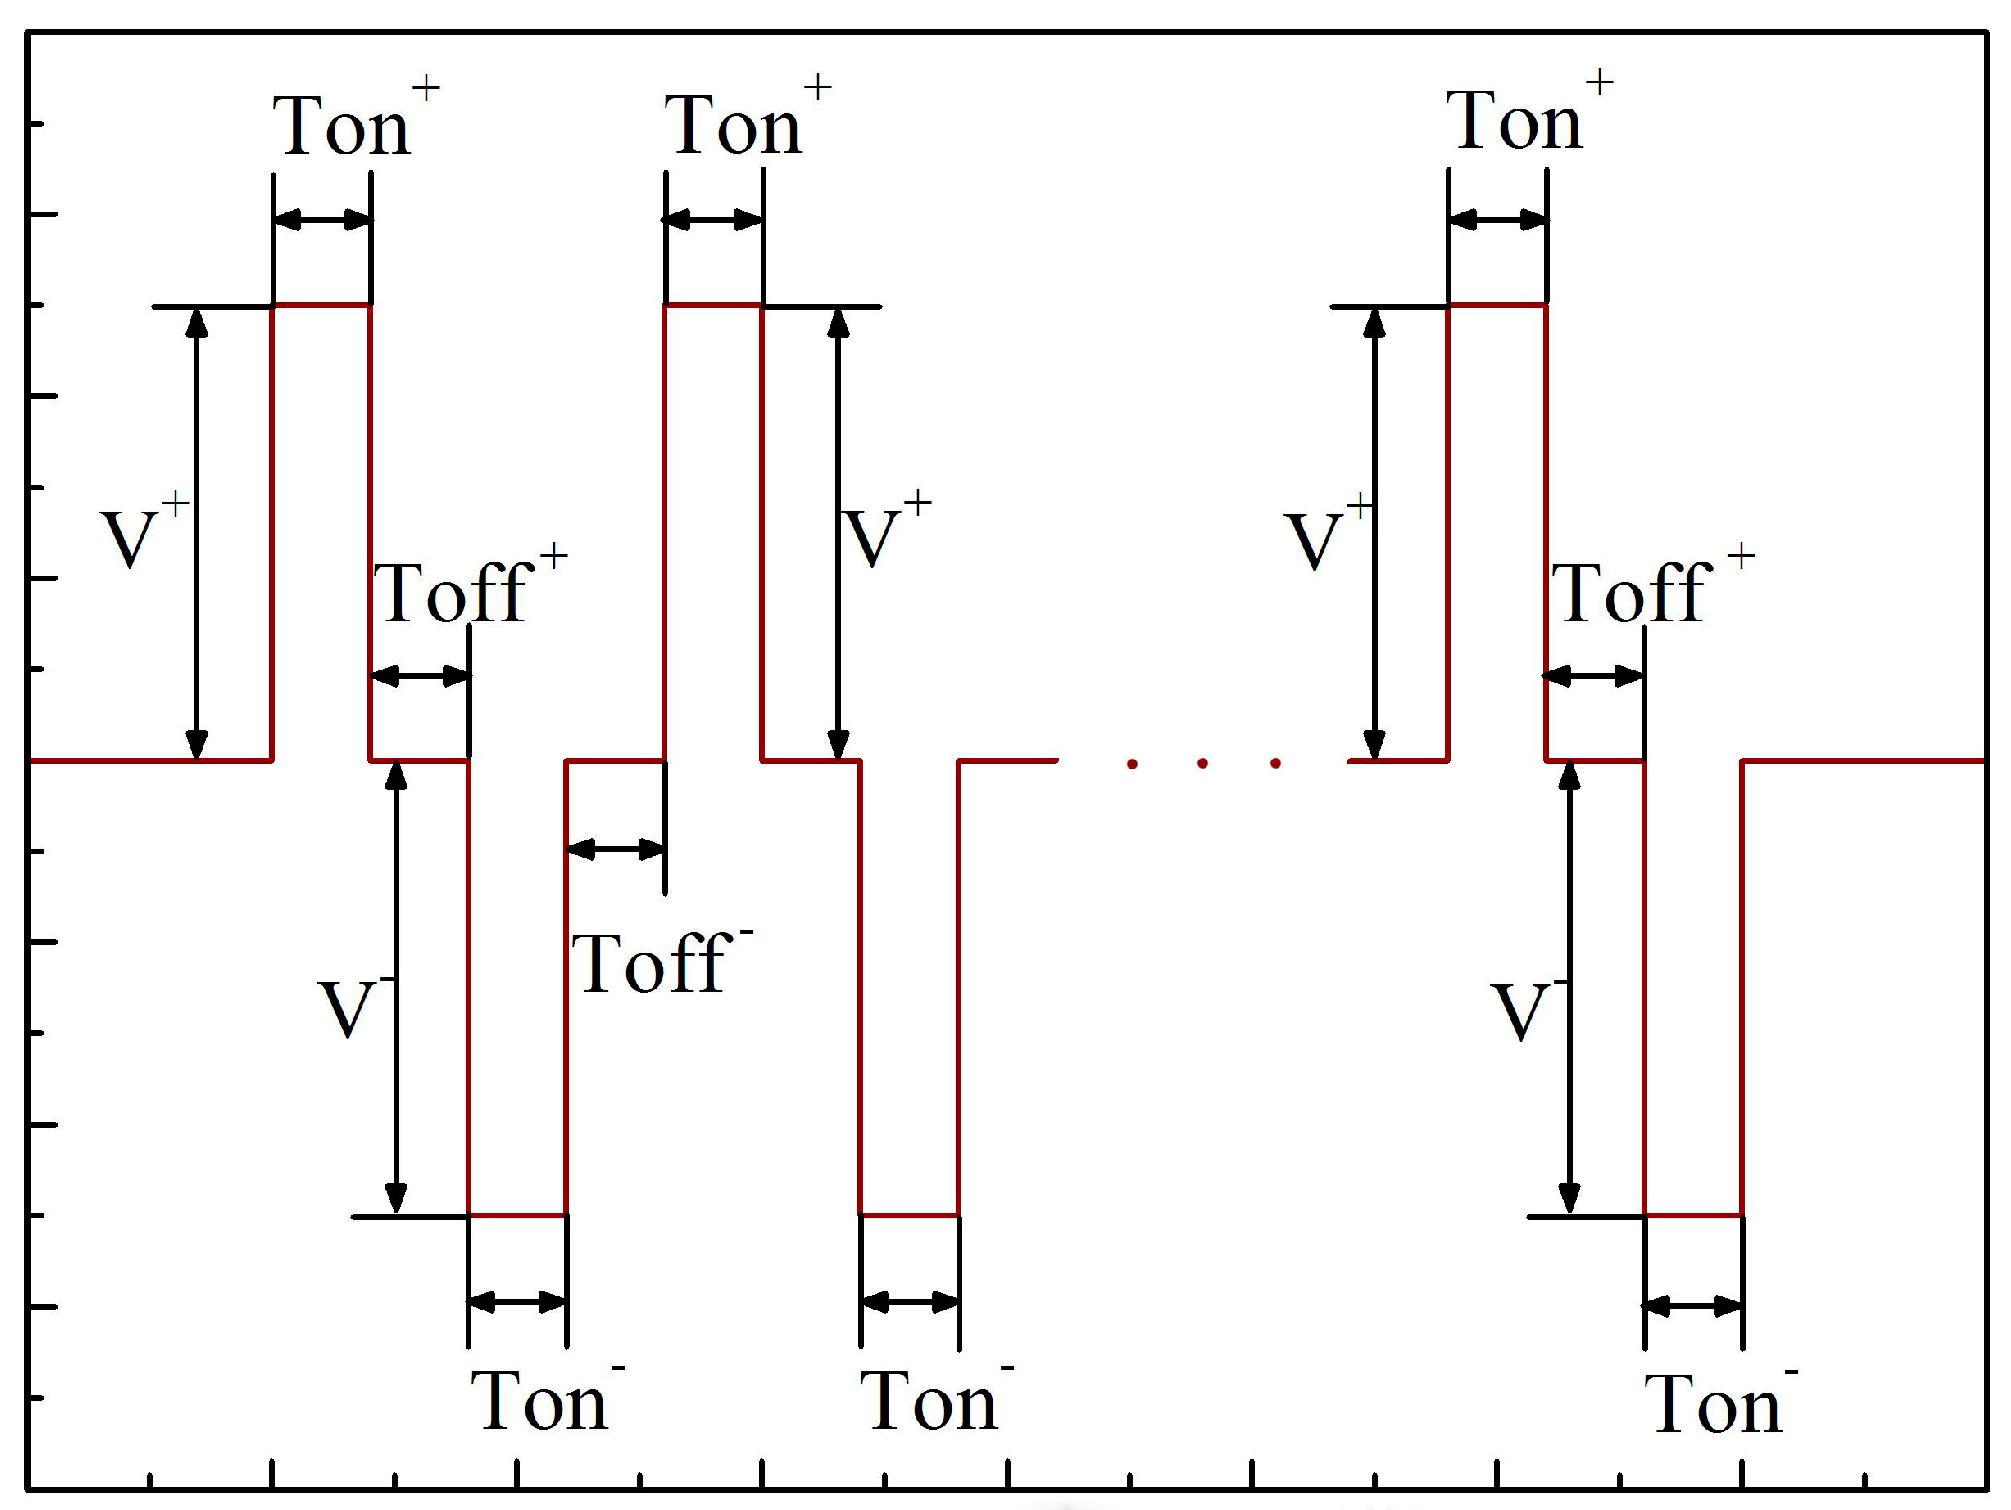
The thickness of the microarc oxidation ceramic coatings is shown in Figure 6. The thickness of the MAO ceramic coatings increased with an increase in anode pulse-width. As shown in Figure 3, the foam-like structures increased in size and quantity with the increase in the anode pulse-width, which increased the growth rates of the MAO coatings. Moreover, the non-uniformity of the A-type discharge events and C-type discharge events on the surface of the MAO coatings, the pressure in the discharge channels, and the ejected height of the molten oxide magma increased along with the anode pulse-width. This increased the growth rates and the non-uniformity of the thickness of the MAO coatings.
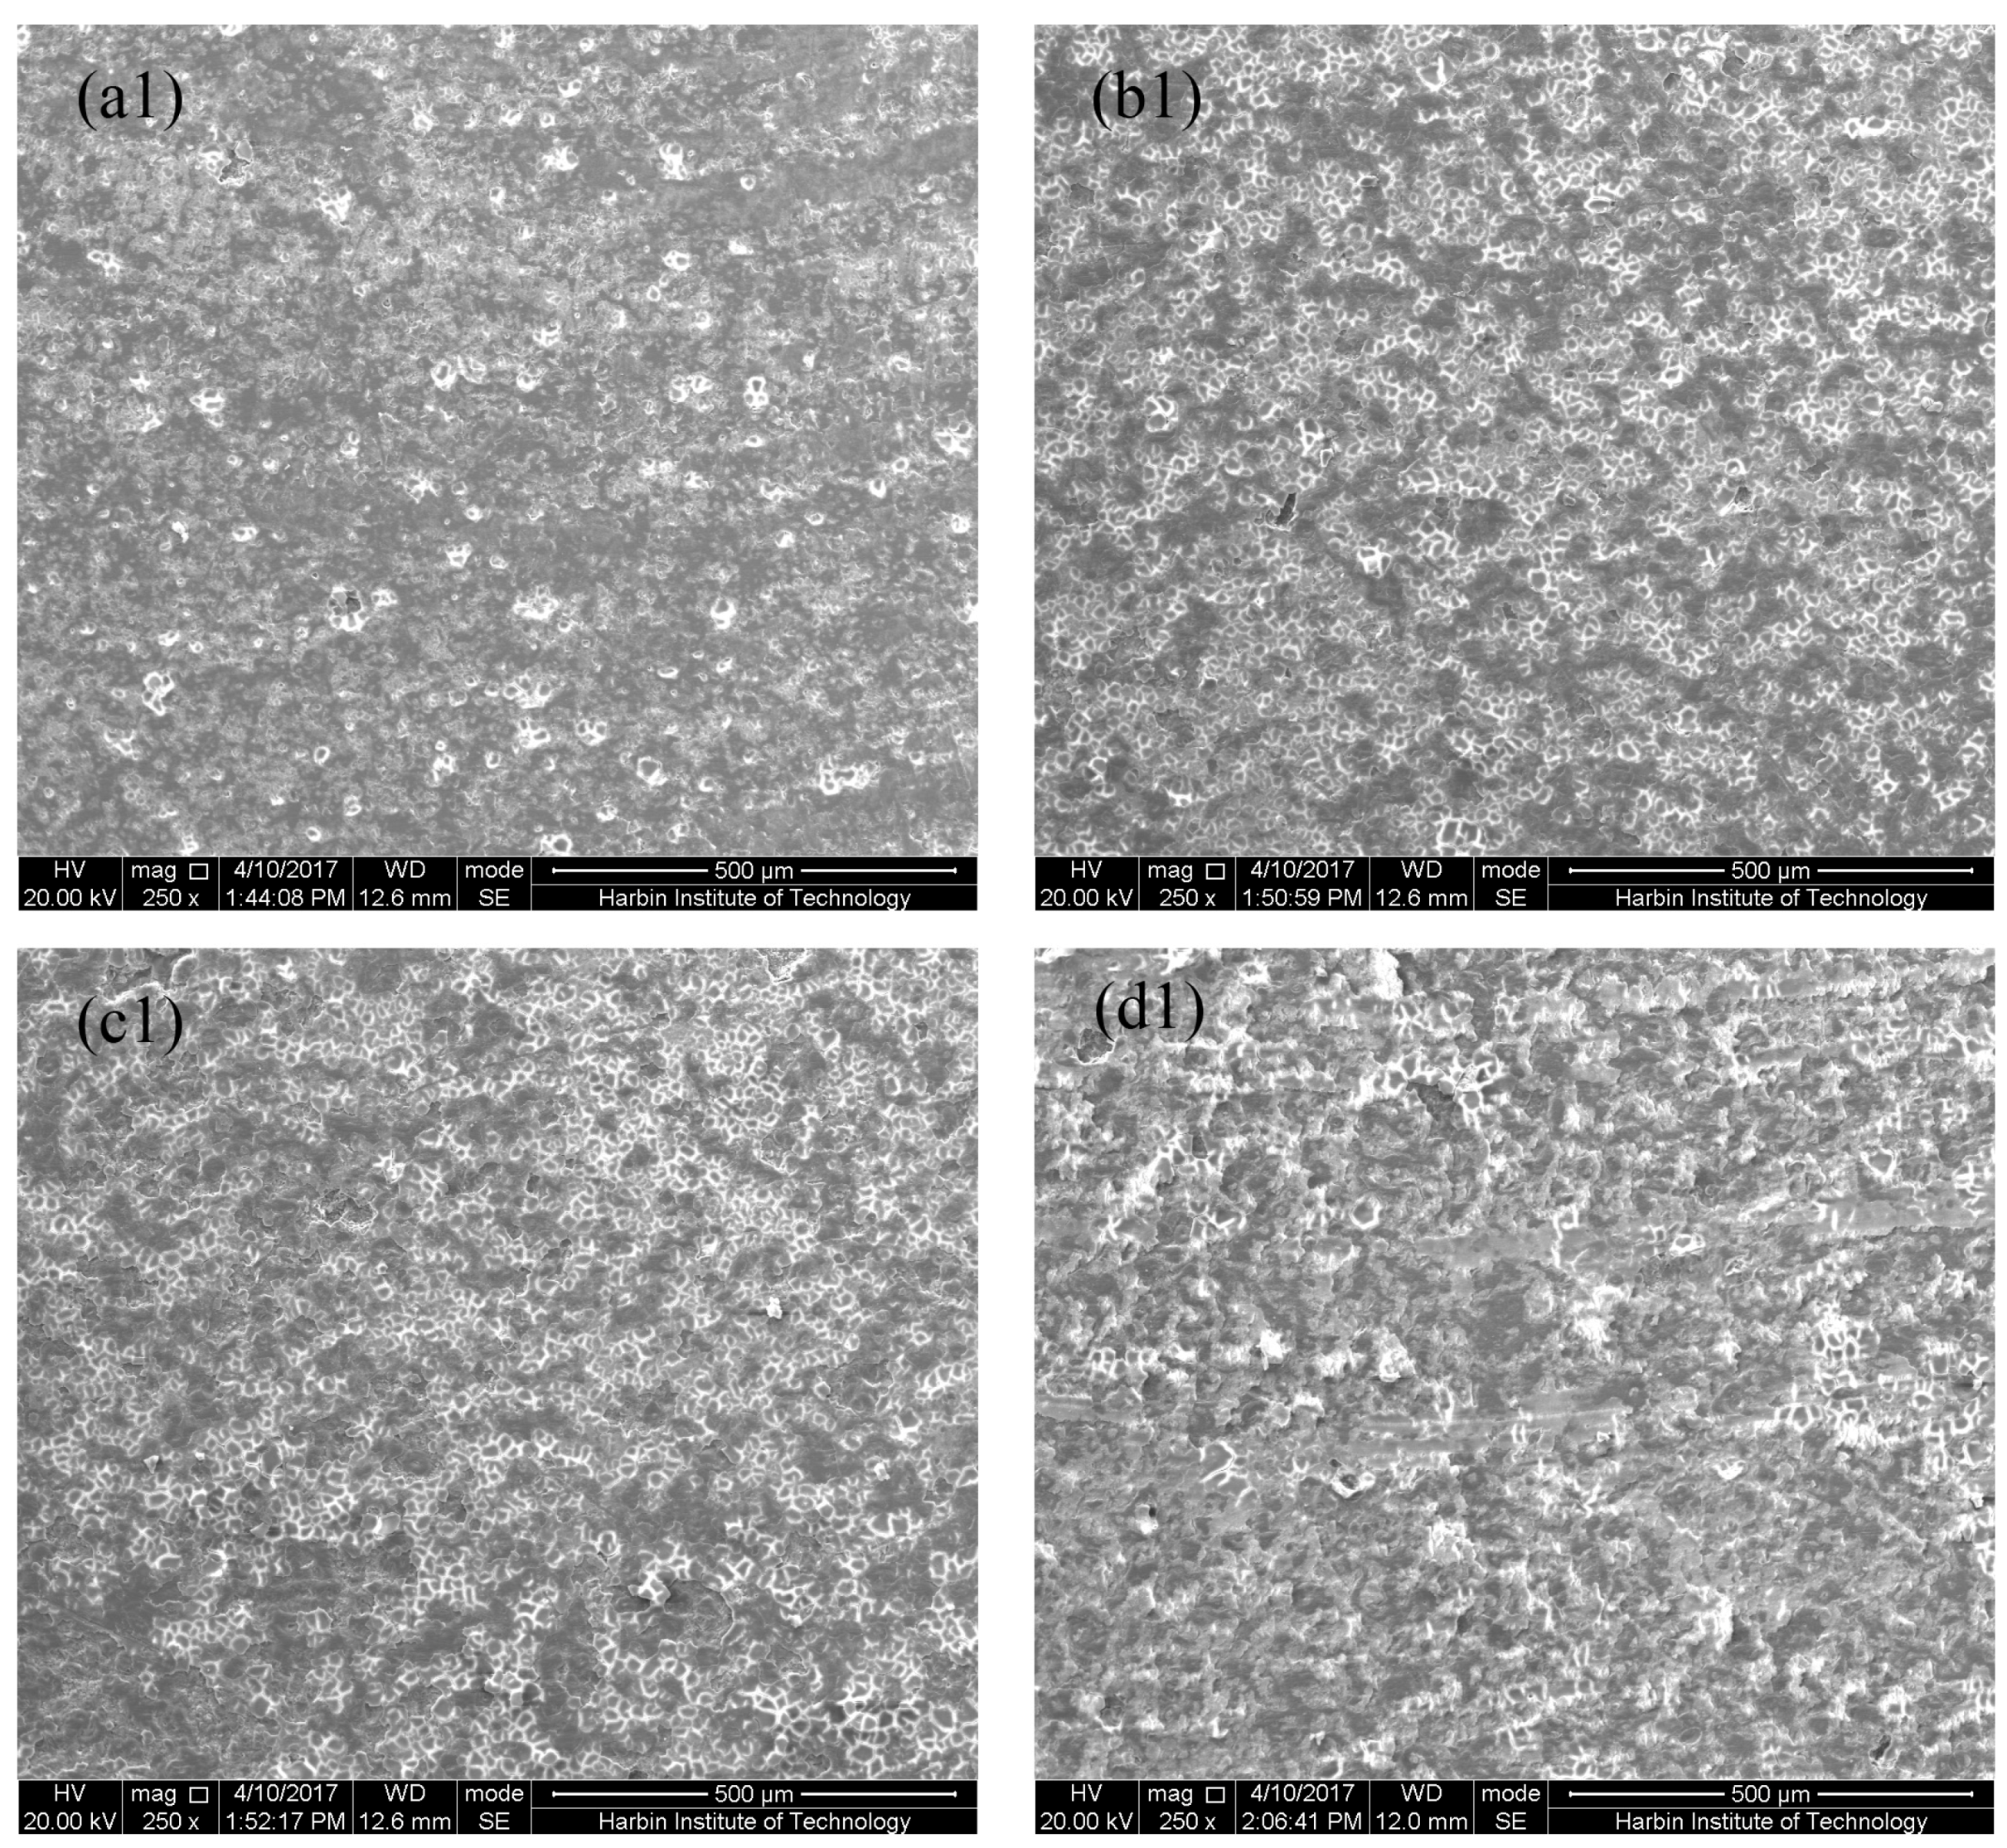
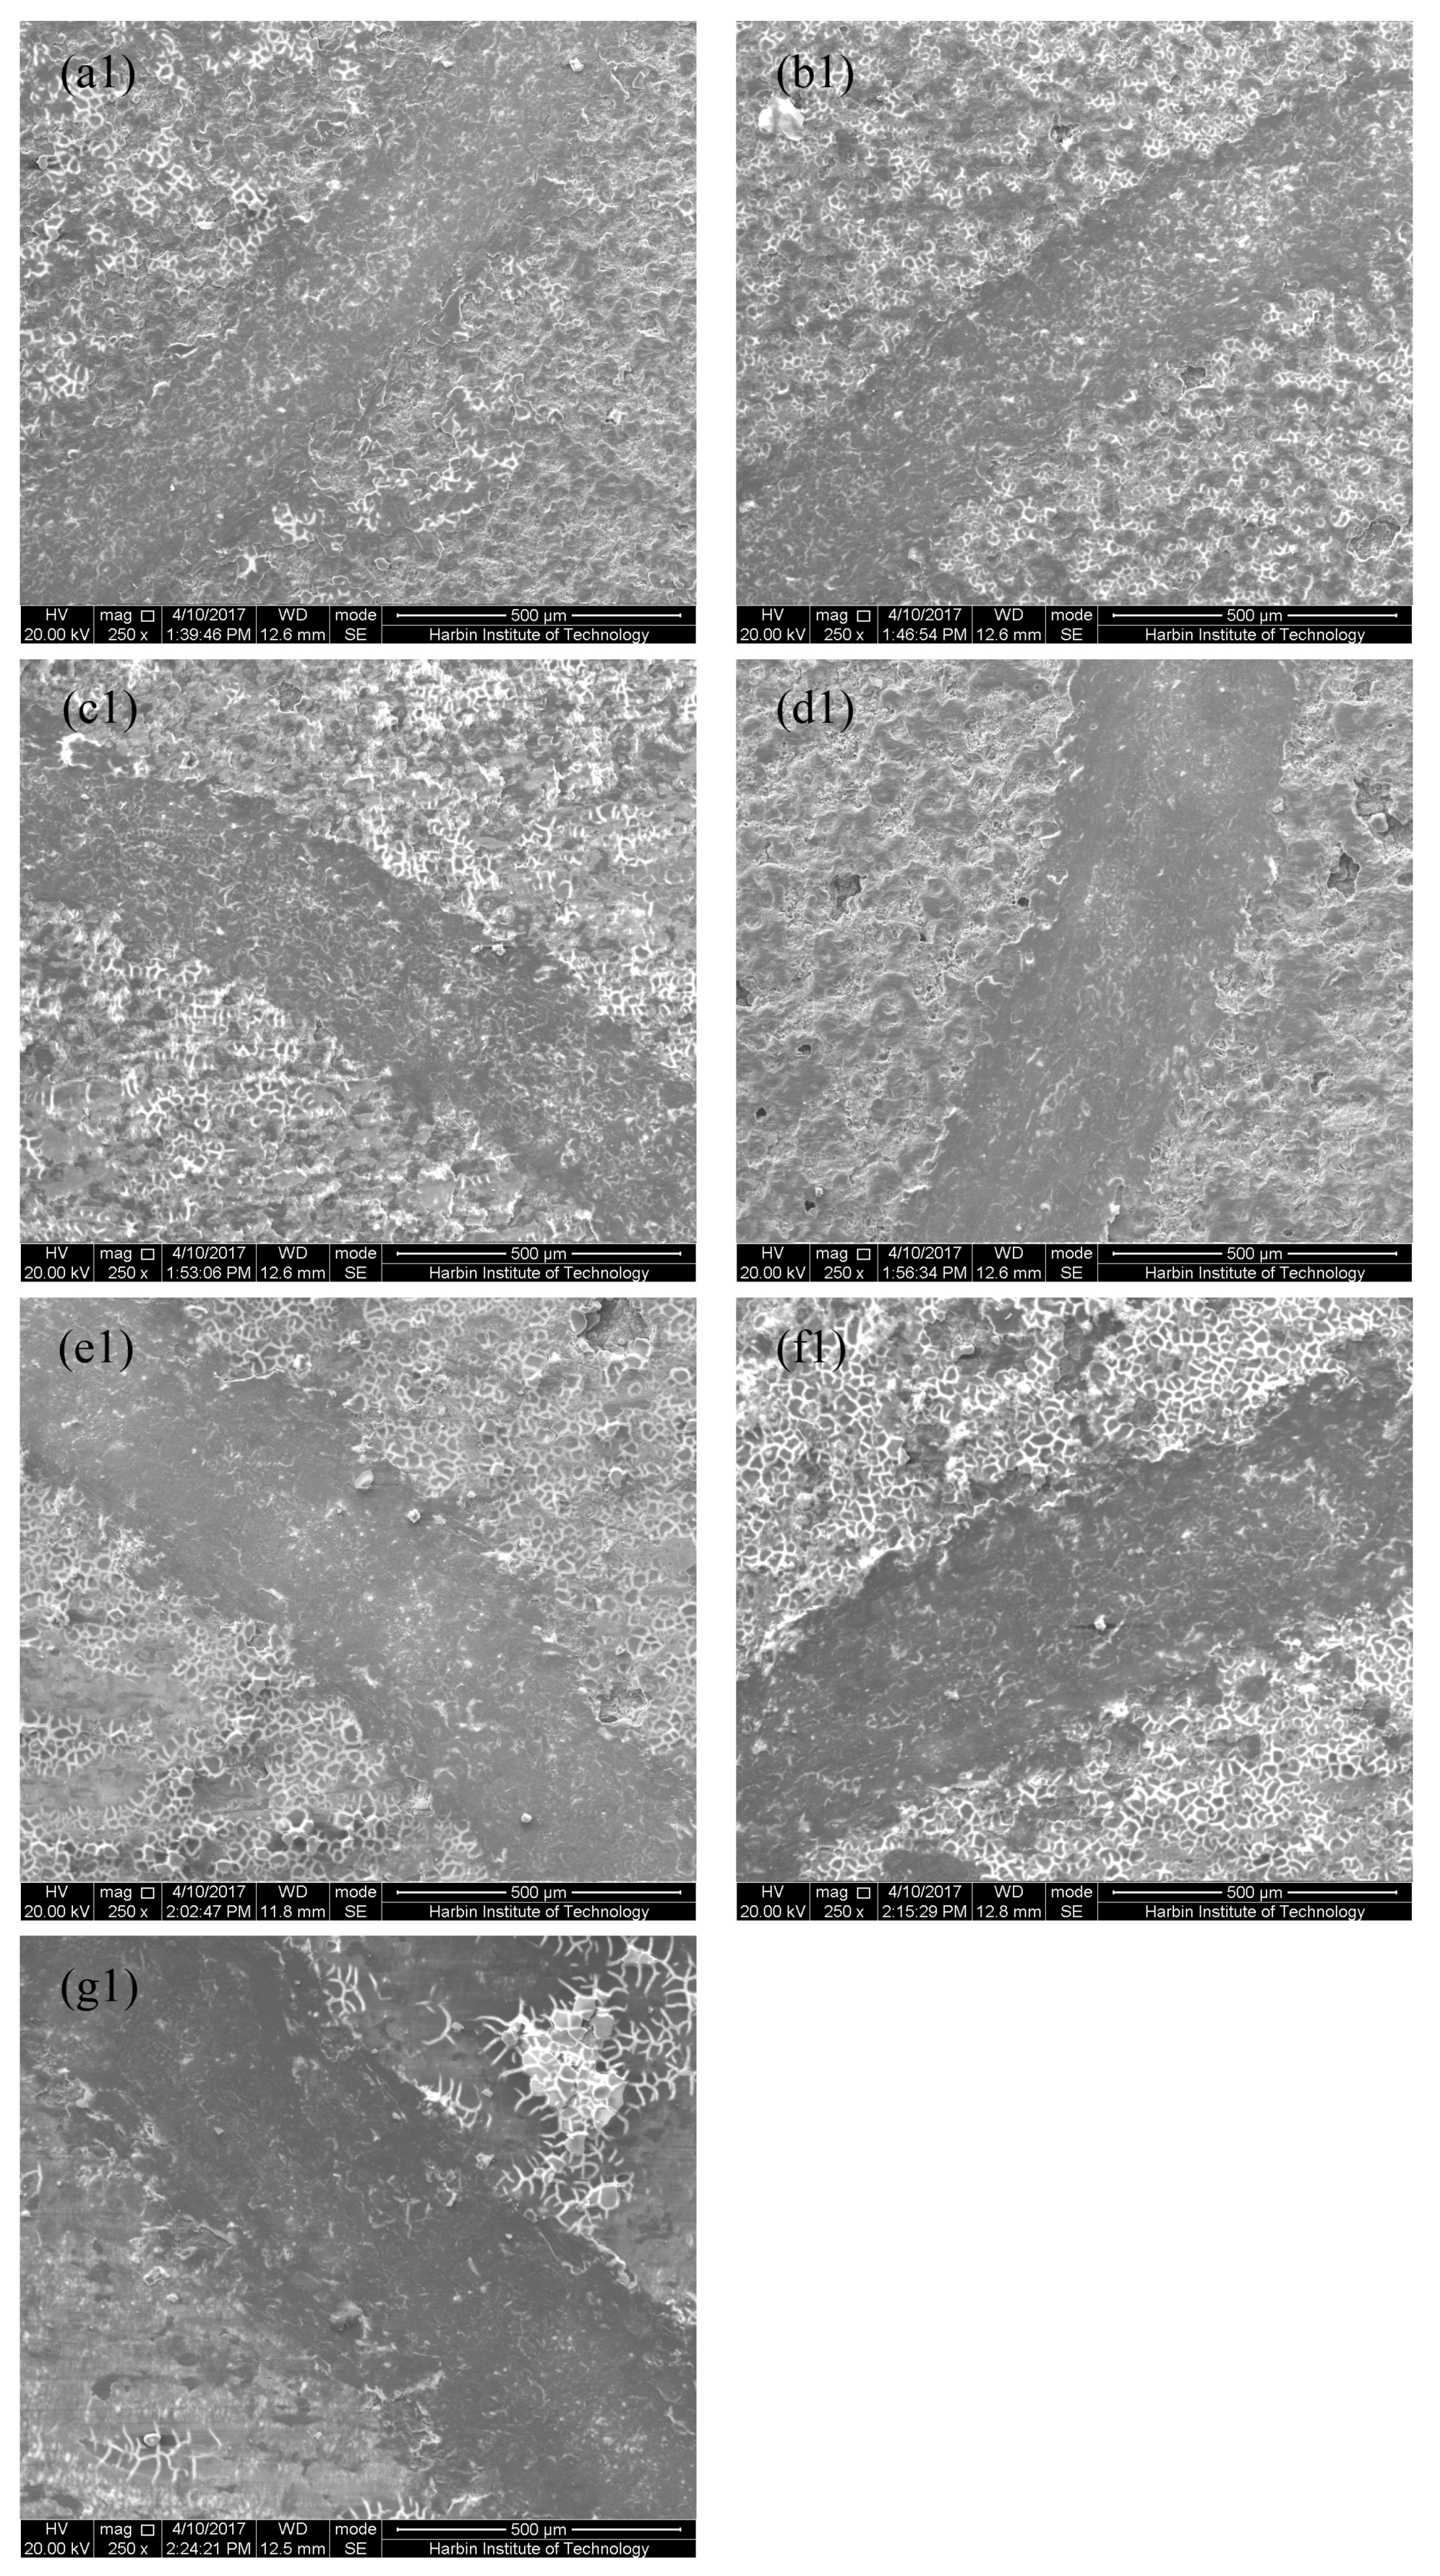
The surface morphologies of the microarc oxidation self-lubricating composite coatings are shown in Figure 7. The micropores and microcracks on the surface of the MAO ceramic coatings were filled with the FEP dispersion.
3.2. Effect of Anode Pulse-Width on the Phase Structure of MAO Ceramic Coatings
The phase structure of the microarc oxidation ceramic coatings is shown in Figure 8. The XRD analysis results revealed that the MAO ceramic coatings were made up of γ-Al2O3, and a small amount of α-Al2O3 and mullite (3Al2O3·2SiO2 and 2Al2O3·SiO2). Figure 9 shows the structure of mullite. Three typical γ-Al2O3 peaks are marked with 1, 2, and 3 in Figure 8. The intensity of the three typical γ-Al2O3 peaks is also listed in Table 2. The intensity of the γ-Al2O3 peaks first increased and then decreased with the increase in the anode pulse-width. As shown in Figure 6, the thickness of the MAO coatings increased with the increase in the anode pulse-width. The intensity of the γ-Al2O3 peaks increased with the increase in the anode pulse-width.
B-type discharge events penetrated through the entire MAO coating and can promote the formation of the new molten oxide magma on the interface of the coatings/substrates [27]. However, B-type discharge events and the quantity of the formed molten oxide magma on the coatings/substrates interface decreased with the increase in the anode pulse-width. When the anode pulse-width exceeded 1500 μs, the intensity of the γ-Al2O3 peaks decreased with the increase in the anode pulse-width.
3.3. Effect of Anode Pulse-Width on the Adhesion Strength of MAO Ceramic Coatings
Figure 10 and Figure 11 show the SEM morphologies and supplementary data graphics of scratches on the microarc oxidation coatings, respectively. The critical loads at which the acoustic emission and friction coefficient increased sharply are indicated on the graphs. The corresponding critical load values are summarized in Table 3, and they decreased with the increase in the anode pulse-width. Tekin et al. [28] suggests that the bonding strength between coatings and substrates, and the cohesion of inter-particles can be improved by decreasing the micropores’ size and porosity on the surface of the microarc oxidation coatings. The compactness of the microarc oxidation coatings, the bonding strength between the coatings and substrates, as well as the cohesion of inter-particles decreased with the increase in the anode pulse-width.
With the increase of the MAO coating porosity, the area of the mechanical meshing region on the interface between the coatings and substrates as well as the inter-particles in the MAO coatings decreased, which decreased the critical load values.
Moreover, with the increase of the MAO coating porosity, the distance between the coatings and substrates as well as the inter-particles in the MAO coatings increased, which decreased the Van der Waals forces between the coatings and substrates as well as the inter-particles. This decreased the critical load values.
Besides, as shown in Figure 5, the micropores and other defects (region D) on the MAO coatings increased with the increase in the anode pulse-width, which contributed to the formation of the crack sources. These crack sources expand in the direction of the interface between the MAO coatings and substrates and create exfoliation under the applied load during scratch testing. This decreased the critical load values.
3.4. Effect of Anode Pulse-Width on the Wear Resistance of MAO Ceramic Coatings
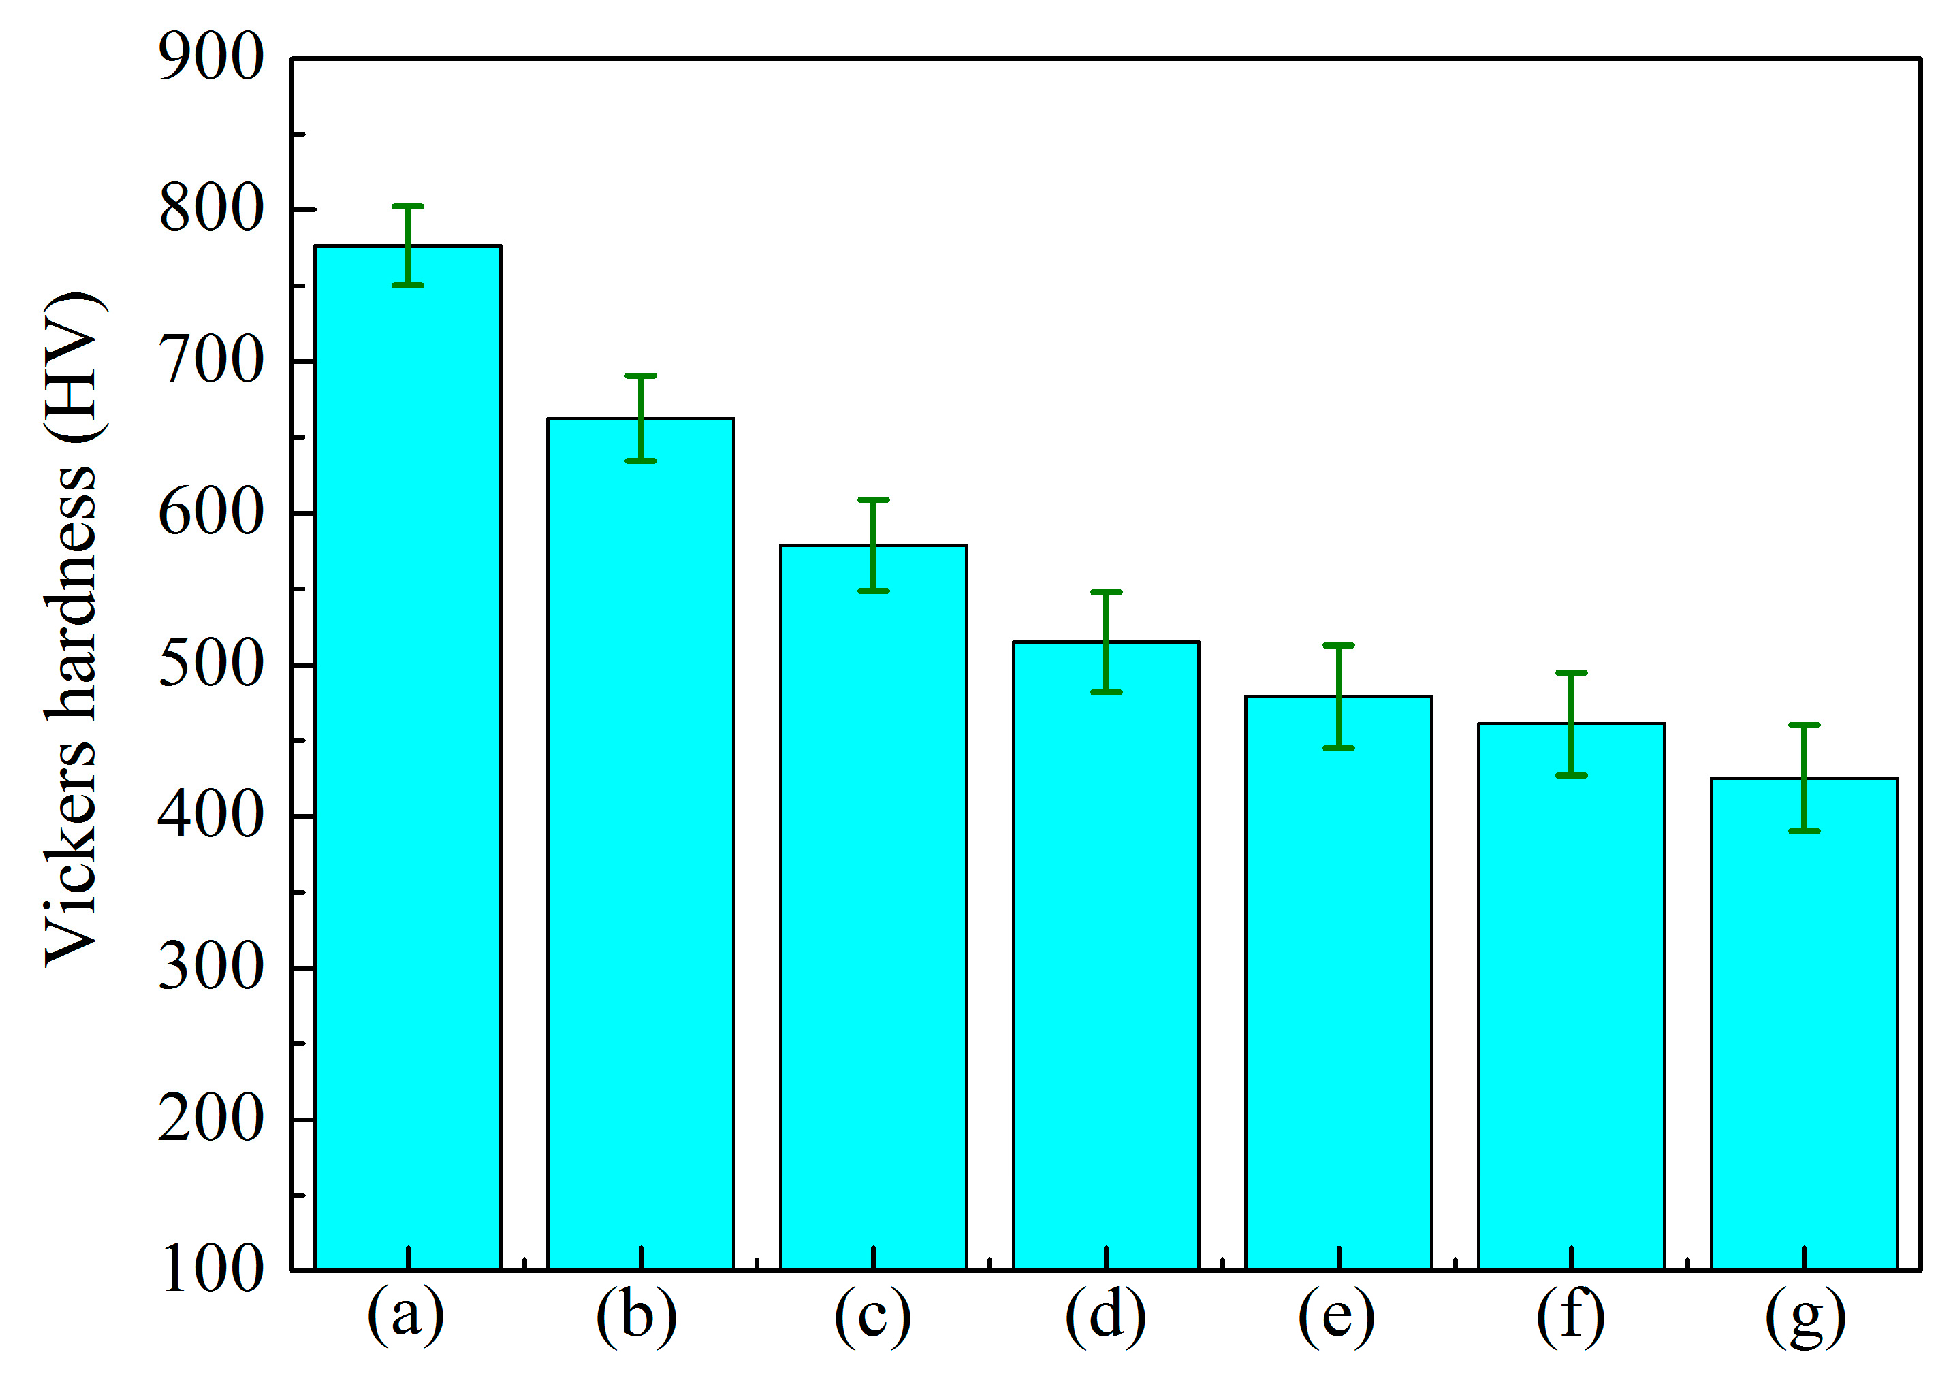
The hardness of the microarc oxidation ceramic coatings is shown in Figure 12. With the increase in the anode pulse-width, the compactness and hardness of the MAO ceramic coatings decreased gradually.
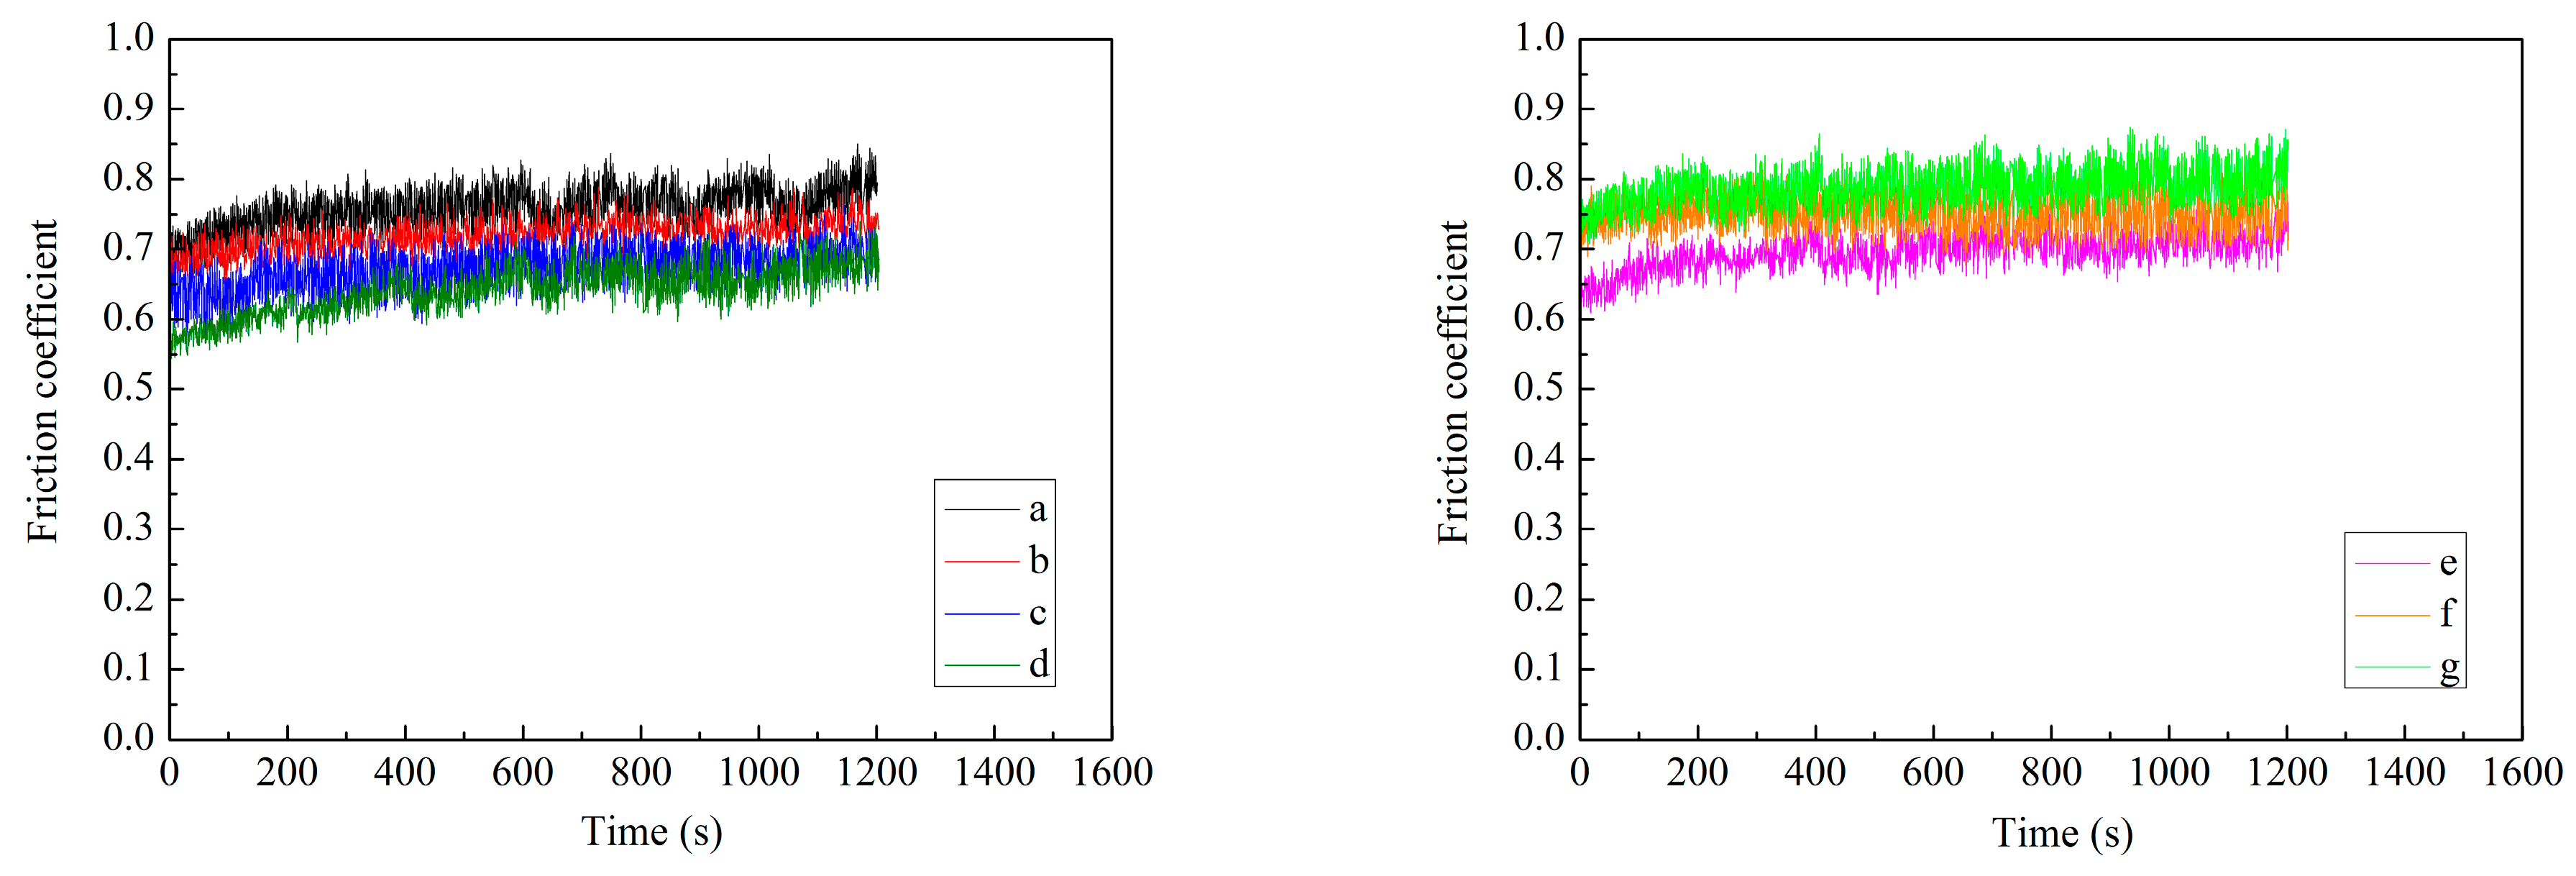
Figure 13 shows the friction coefficient of the microarc oxidation coatings against the WC balls at room temperature during the wear testing. The friction coefficient of the MAO ceramic coatings ranged from 0.60–0.85, determined by the performance of the ceramic itself. Moreover, the friction coefficient was significantly affected by the cracks and pores on the MAO coatings. The wave peaks on the surface of the WC balls easily penetrated into the surface of the MAO coatings due to the high porosity of the MAO coatings. This increased the contact area between the WC balls and MAO coatings as well as the friction coefficient. The uneven distribution of the cracks and pores on the surface of the MAO coatings increased the fluctuation range of the friction coefficient. The ease of penetration by the wave peaks on the surface of the WC balls created serious abrasive wear and produced a significant quantity of wear debris during the wear testing. The microcracks in the MAO coatings easily expanded and formed exfoliation under the periodically applied load during wear testing. The wear debris and exfoliation were involved in the friction process, which significantly affected the friction coefficient.
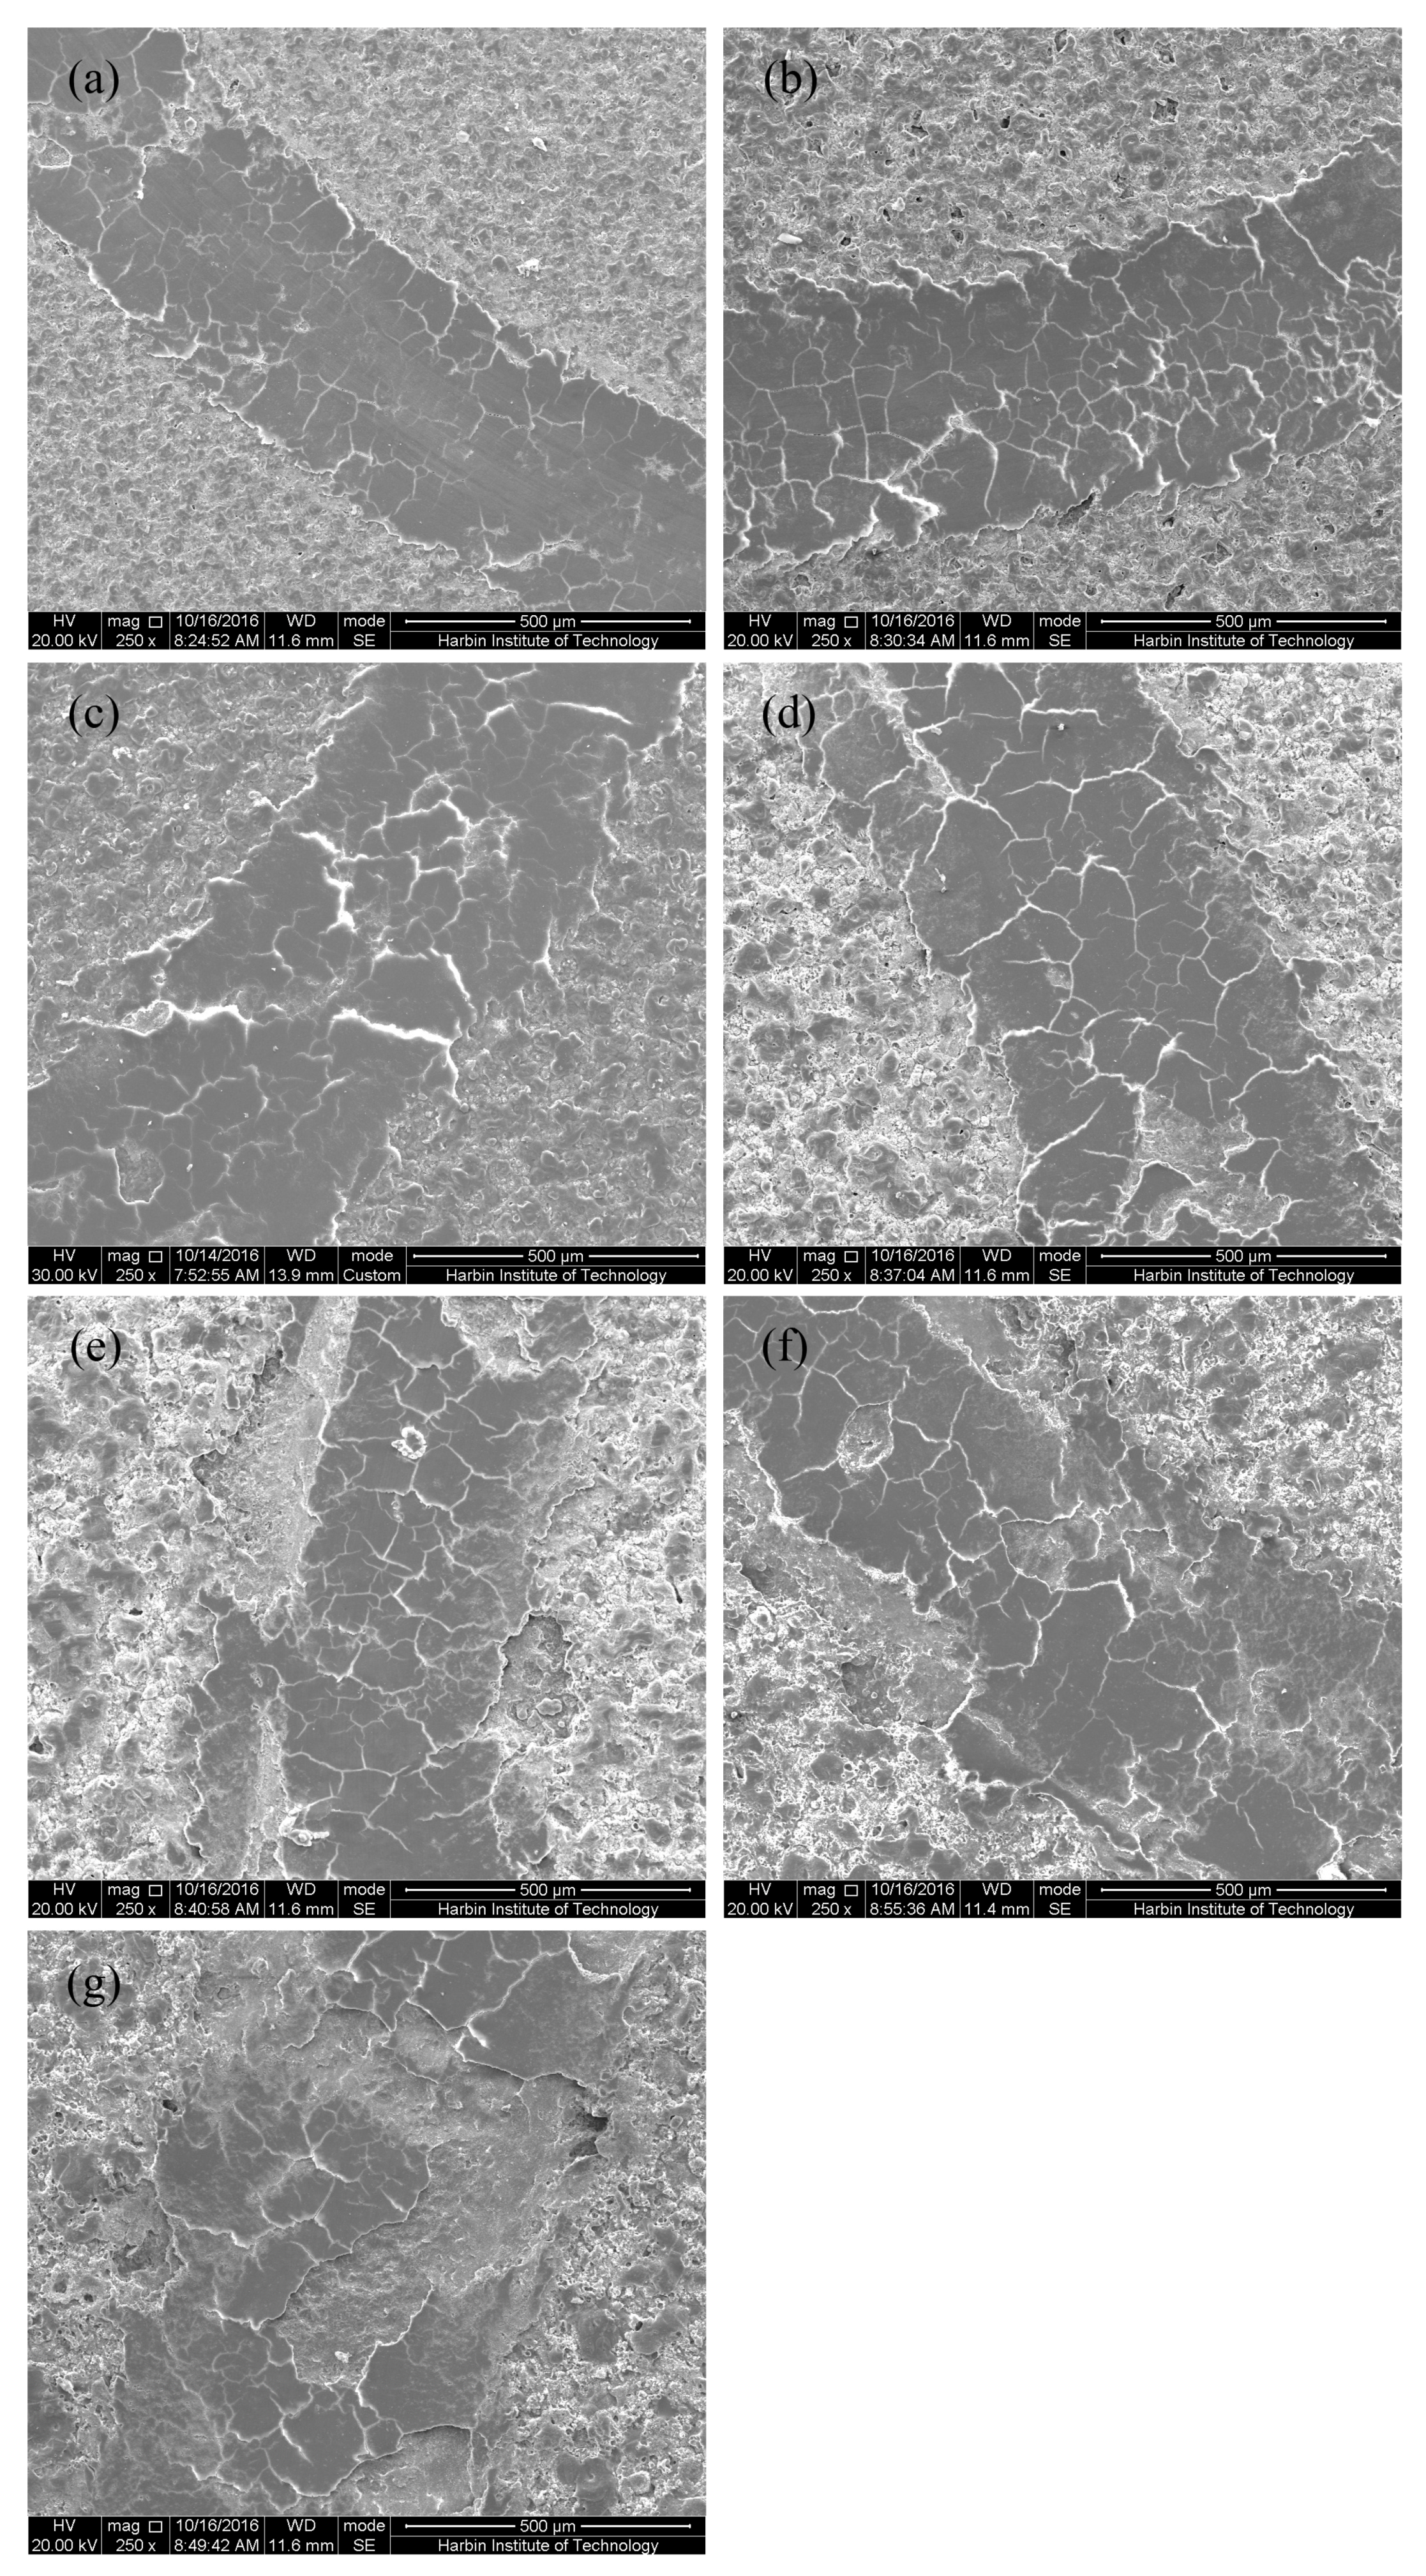
Figure 14 shows the morphologies of the wear tracks for the microarc oxidation coatings against WC balls at room temperature after wear testing. The morphologies of the wear tracks for the MAO coatings exhibited furrows and a wide range of exfoliation. This revealed that the dominant wear mechanisms of the microarc oxidation ceramic coatings were abrasive and fatigue wear. Moreover, the furrows and the region of exfoliation increased in size with the increase in the anode pulse-width.
The compactness and hardness of the MAO coatings decreased with the increase in the anode pulse-width. This could make the microbulges on the surface of the WC balls penetrate into the surface of MAO coatings more easily, and increased the abrasive wear during wear testing. Moreover, as shown in Figure 3, some microcracks existed on the surface of the MAO coatings and these microcracks easily expanded and formed exfoliation under the periodically applied load during wear testing.
As shown in Figure 5, many micropores and defects (region D) in the MAO coatings contributed to the formation of crack sources. These crack sources expand and create exfoliation under the periodically applied load during wear testing. The porosity and defects in the MAO coatings increased and the compactness of the MAO coatings decreased with the increase in the anode pulse-width. This increased the formation of crack sources and exfoliation during wear testing.
Table 4 shows the wear rates of the MAO coatings. The wear rates of the MAO coatings increased significantly with the increase in the anode pulse-width. As shown in Figure 3 and Figure 5, the porosity and defects of the MAO coatings increased with the increase in the anode pulse-width, which significantly increased the furrows, exfoliation, and the wear rates of the MAO coatings during wear testing.
3.5. Tribological Properties of MAO Self-Lubricating Composite Coatings
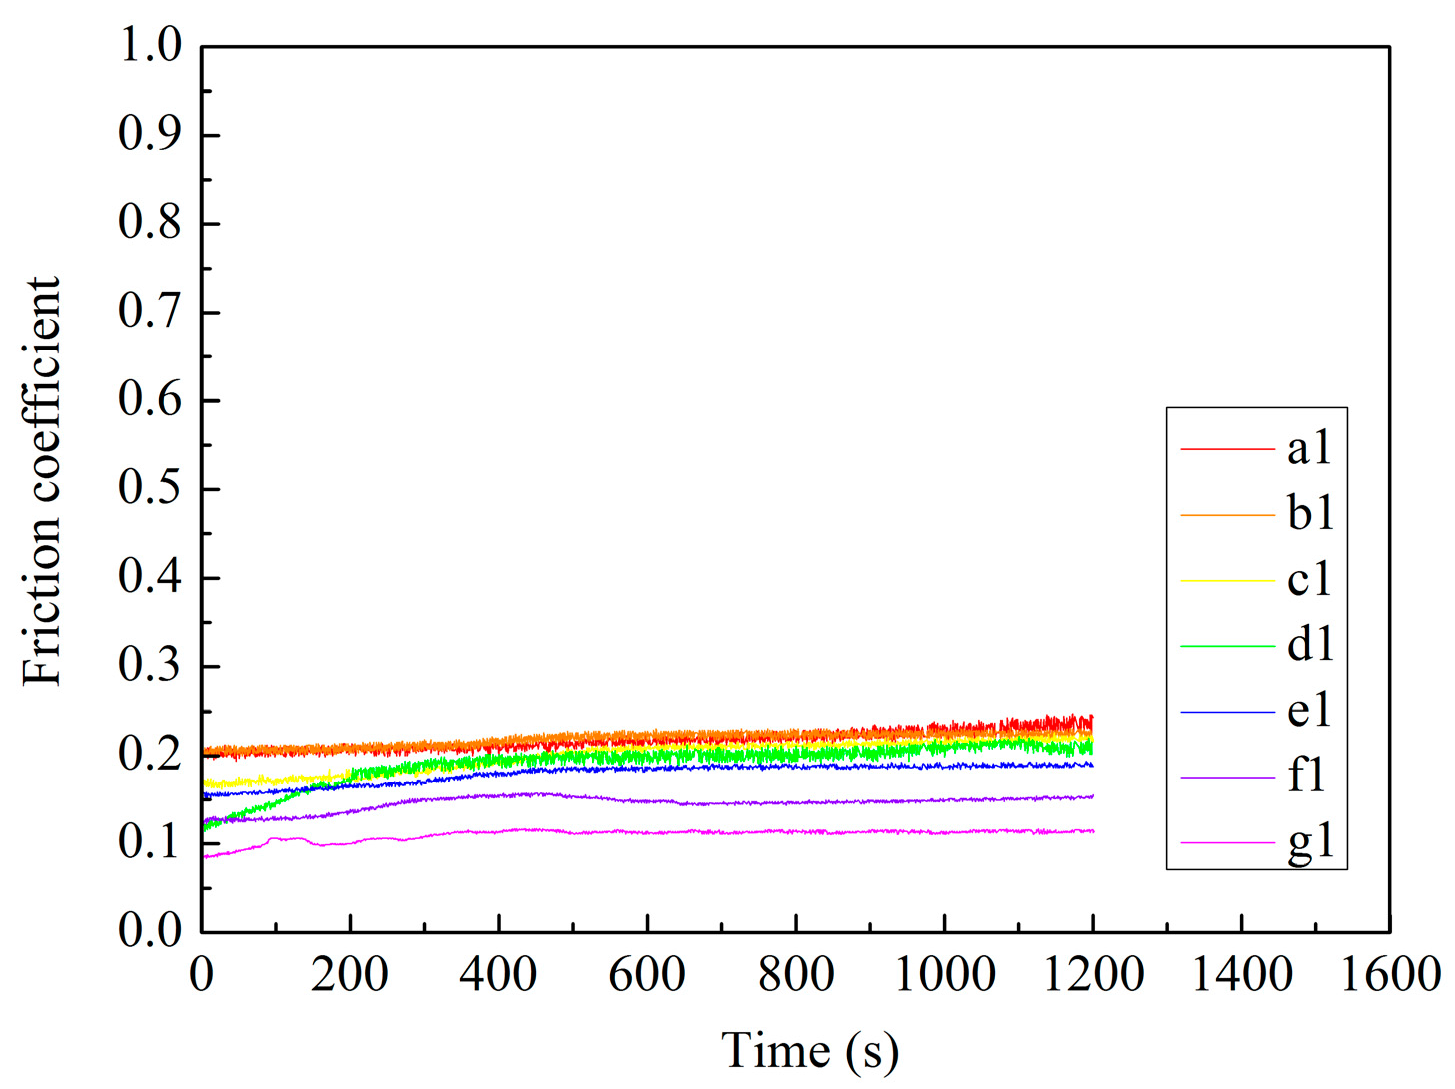
Figure 15 shows the friction coefficient of the MAO self-lubricating composite coatings against WC balls at room temperature during wear testing. As shown in Figure 15, compared to the MAO coatings, the MAO self-lubricating composite coatings exhibited a lower friction coefficient. The friction coefficient was in the range of 0.09–0.25. Moreover, the friction coefficient of the MAO self-lubricating composite coatings decreased with increased anode pulse-width. It can be inferred that the porosity of the MAO coatings increased with increased anode pulse-width, the FEP in micropores and microcracks on the surface of the MAO ceramic coatings increased, and the lubrication was sufficient during wear testing, leading to the decreased friction coefficients for the MAO self-lubricating composite coatings with increased anode pulse-width.
Figure 16 shows the morphologies of the wear tracks for the MAO self-lubricating composite coatings against WC balls at room temperature after wear testing. As shown in Figure 16, the morphologies of the wear tracks for the MAO coatings did not exhibit a significant quantity of furrows or exfoliation. Thus, the dominant wear mechanism of the MAO self-lubricating composite coatings was mild abrasive wear.
Table 5 shows the wear rates of the MAO self-lubricating composite coatings. Compared to the MAO coatings, the MAO self-lubricating composite coatings exhibited lower wear rates, and the wear rates of the MAO self-lubricating composite coatings first decreased and then increased with the increased anode pulse-width. When the anode pulse-width was 2000 μs, the wear rate of the MAO self-lubricating composite coatings was the lowest. Because the porosity of the MAO coatings increased as the anode pulse-width increased from 1000 to 2000 μs, the FEP in the micropores and microcracks on the surface of the MAO ceramic coatings increased and the lubrication was sufficient during wear testing.
However, when the anode pulse-width exceeded 2000 μs, the wear rates of the MAO self-lubricating composite coatings increased with the increased anode pulse-width, because the porosity of the MAO coatings increased, and the compactness as well as the hardness of the MAO ceramic coatings decreased with increased anode pulse-width. This led to increased wear rates for the MAO self-lubricating composite coatings with increased anode pulse-width.
4. Conclusions
The 2024-T4 aluminum alloys were treated with microarc oxidation in the silicate system electrolyte using a pulsed bipolar power supply at different anode pulse-widths. After MAO, the micropores and microcracks on the surface of the MAO ceramic coatings were filled with FEP dispersion to prepare the micro-arc oxidation self-lubricating composite coatings containing FEP. The hardness and wear resistance of the MAO coatings decreased as the anode pulse-width increased. Compared to the MAO coatings, the friction coefficient and wear rates of the MAO self-lubricating composite coatings sharply decreased. Moreover, the wear rates of the MAO self-lubricating composite coatings first decreased and then increased with increased anode pulse-width. When the anode pulse-width was 2000 μs, the wear rate of the MAO self-lubricating composite coating was the lowest. The MAO self-lubricating composite coatings integrated the advantages of wear resistance of the MAO coatings and a low friction coefficient of FEP, possessing superior tribological properties.
Acknowledgments
The authors gratefully acknowledge the Micro/Nano Technology Research Center, Harbin Institute of Technology for device support.
Author Contributions
Zhen-Wei Li and Shi-Chun Di conceived and designed the experiments; Zhen-Wei Li performed the experiments; Zhen-Wei Li and Shi-Chun Di analyzed the data; Shi-Chun Di contributed reagents/materials/analysis tools; Zhen-Wei Li wrote the paper.
Conflicts of Interest
The authors declare no conflicts of interest.
References
- Wang, X.S.; Guo, X.W.; Li, X.D.; Ge, D.Y. Improvement on the fatigue performance of 2024-T4 alloy by synergistic coating technology. Materials 2014, 7, 3533–3546. [Google Scholar] [CrossRef]
- Wang, P.; Li, J.P.; Guo, Y.C.; Yang, Z.; Wang, J.L. Ceramic coating formation on high Si containing Al alloy by PEO process. Surf. Eng. 2016, 32, 428–434. [Google Scholar] [CrossRef]
- Rao, R.N.; Das, S.; Mondal, D.P.; Dixit, G. Effect of heat treatment on the sliding wear behavior of aluminium alloy (Al–Zn–Mg) hard particle composite. Tribol. Int. 2010, 43, 330–339. [Google Scholar] [CrossRef]
- Tseng, C.C.; Lee, J.L.; Kuo, T.h.; Kuo, S.N.; Tseng, K.H. The influence of sodium tungstate concentration and anodizing conditions on microarc oxidation (MAO) coatings for aluminum alloy. Surf. Coat. Technol. 2012, 206, 3437–3443. [Google Scholar] [CrossRef]
- Polat, A.; Makaraci, M.; Usta, M. Influence of sodium silicate concentration on structural and tribological properties of microarc oxidation coatings on 2017A aluminum alloy substrate. J. Alloys Compd. 2010, 504, 519–526. [Google Scholar] [CrossRef]
- Nimura, K.; Sugawara, T.; Jibiki, T.; Ito, S.; Shima, M. Surface modification of aluminum alloy to improve fretting wear properties. Tribol. Int. 2016, 93, 702–708. [Google Scholar] [CrossRef]
- Wang, Z.J.; Wu, L.; Qi, Y.L.; Cai, W.; Jiang, Z.H. Self-lubricating Al2O3/PTFE composite coating formation on surface of aluminium alloy. Surf. Coat. Technol. 2010, 204, 3315–3318. [Google Scholar] [CrossRef]
- Tsutumi, Y.; Niinomi, M.; Nakai, M.; Shimabukuro, M.; Ashida, M.; Chen, P.; Doi, H.; Hanawa, T. Electrochemical surface treatment of a β-titanium alloy to realize an antibacterial property and bioactivity. Metals 2016, 6, 76. [Google Scholar] [CrossRef]
- Yavari, S.A.; Necula, B.S.; Fratila-Apachitei, L.E.; Duszczyk, J.; Apachitei, I. Biofunctional surfaces by plasma electrolytic oxidation on titanium biomedical alloys. Surf. Eng. 2016, 32, 411–417. [Google Scholar] [CrossRef]
- Han, O.S.; Hwang, M.J.; Song, Y.H.; Song, H.J.; Park, Y.J. Effects of surface structure and chemical composition of binary Ti alloys on cell differentiation. Metals 2016, 6, 150. [Google Scholar] [CrossRef]
- Mioč, U.B.; Stojadinović, S.; Nedić, Z. Characterization of bronze surface layer formed by microarc oxidation process in 12-tungstophosphoric acid. Materials 2010, 3, 110–126. [Google Scholar] [CrossRef]
- Cheng, Y.L.; Xue, Z.G.; Wang, Q.; Wu, X.Q.; Matykina, E.; Skeldon, P.; Thompson, G.E. New findings on properties of plasma electrolytic oxidation coatings from study of an Al-Cu-Li alloy. Electrochim. Acta 2013, 107, 358–378. [Google Scholar] [CrossRef]
- Chen, M.A.; Ou, Y.C.; Yu, C.Y.; Xiao, C.; Liu, S.Y. Corrosion performance of epoxy/BTESPT/MAO coating on AZ31 alloy. Surf. Eng. 2016, 32, 38–46. [Google Scholar] [CrossRef]
- Guan, Y.J.; Xia, Y.; Xu, F.T. Interface fracture property of PEO ceramic coatings on aluminum alloy. Surf. Coat. Technol. 2008, 202, 4204–4209. [Google Scholar] [CrossRef]
- Martin, J.; Leone, P.; Nomine, A.; Renaux, D.V.; Henrion, G.; Belmonte, T. Influence of electrolyte ageing on the plasma electrolytic oxidation of aluminium. Surf. Coat. Technol. 2015, 269, 36–46. [Google Scholar] [CrossRef]
- Shokouhfar, M.; Dehghanian, C.; Baradaran, A. Preparation of ceramic coating on Ti substrate by Plasma electrolytic oxidation in different electrolytes and evaluation of its corrosion resistance. Appl. Surf. Sci. 2011, 257, 2617–2624. [Google Scholar] [CrossRef]
- Jin, F.Y.; Chu, P.K.; Xu, G.D.; Zhao, J.; Tang, D.; Tong, H.H. Structure and mechanical properties of magnesium alloy treated by micro-arc discharge oxidation using direct current and high-frequency bipolar pulsing modes. Mater. Sci. Eng. A 2006, 435–436, 123–126. [Google Scholar] [CrossRef]
- Bayati, M.R.; Moshfegh, A.Z.; Golestani-Fard, F. Effect of electrical parameters on morphology, chemical composition, and photoactivity of the nano-porous titania layers synthesized by pulse-microarc oxidation. Electrochim. Acta 2010, 55, 2760–2766. [Google Scholar] [CrossRef]
- Montazeri, M.; Dehghanian, C.; Shokouhfar, M.; Baradaran, A. Investigation of the voltage and time effects on the formation of hydroxyapatite-containing titania prepared by plasma electrolytic oxidation on Ti–6Al–4V alloy and its corrosion behavior. Appl. Surf. Sci. 2011, 257, 7268–7275. [Google Scholar] [CrossRef]
- Mu, M.; Zhou, X.J.; Xiao, Q.; Liang, J.; Huo, X.D. Preparation and tribological properties of self-lubricating TiO2/graphite composite coating on TI6Al4V alloy. Appl. Surf. Sci. 2012, 258, 8570–8576. [Google Scholar] [CrossRef]
- Hussein, R.O.; Northwood, D.O.; Su, J.F.; Xie, X. A study of the interactive effects of hybrid current modes on the tribological properties of a PEO (plasma electrolytic oxidation) coated AM60B Mg-alloy. Surf. Coat. Technol. 2013, 215, 421–430. [Google Scholar] [CrossRef]
- Wu, H.H.; Lu, X.Y.; Long, B.H.; Wang, X.Q.; Wang, J.B.; Jin, Z.S. The effects of cathodic and anodic voltages on the characteristics of porous nanocrystalline titania coatings fabricated by microarc oxidation. Mater. Lett. 2005, 59, 370–375. [Google Scholar] [CrossRef]
- Li, Q.B.; Liang, J.; Liu, B.X.; Peng, Z.J.; Wang, Q. Effects of cathodic voltages on structure and wear resistance of plasma electrolytic oxidation coatings formed on aluminium alloy. Appl. Surf. Sci. 2014, 297, 176–181. [Google Scholar] [CrossRef]
- Yin, B.; Peng, Z.J.; Liang, J.; Jin, K.J.; Zhu, S.Y.; Yang, J.; Qiao, Z.H. Tribological behavior and mechanism of self-lubricating wear-resistant composite coatings fabricated by one-step plasma electrolytic oxidation. Tribol. Int. 2016, 97, 97–107. [Google Scholar] [CrossRef]
- Qin, Y.K.; Xiong, D.S.; Li, J.L. Characterization and friction behavior of LST/PEO duplex-treated Ti6Al4V alloy with burnished MoS2 film. Appl. Surf. Sci. 2015, 347, 475–484. [Google Scholar] [CrossRef]
- Wang, S.Y.; Si, N.C.; Xia, Y.P.; Liu, L. Influence of nano-SiC on microstructure and property of MAO coating formed on AZ91D magnesium alloy. Trans. Nonferr. Met. Soc. China 2015, 25, 1926–1934. [Google Scholar] [CrossRef]
- Hussein, R.O.; Xie, X.; Northwood, D.O.; Yerokhin, A.; Matthews, A. Spectroscopic study of electrolytic plasma and discharging behavior during the plasma electrolytic oxidation (PEO) process. J. Phys. D Appl. Phys. 2010, 43, 105203. [Google Scholar] [CrossRef]
- Tekin, K.C.; Malayoglu, U.; Shrestha, S. Tribological behaviour of plasma electrolytic oxide coatings on Ti6Al4V and cp-Ti alloys. Surf. Eng. 2016, 32, 435–442. [Google Scholar] [CrossRef]
Figure 1.
Schematic of the pulse output with a bipolar constant current power supply.

Figure 2.
Variation curves of the voltage at different anode pulse-widths during microarc oxidation. (I) variation curves of anode and cathode voltages; (II) variation curves of anode voltages; (III) variation curves of cathode voltages; (a): 1000 μs; (b): 1500 μs; (c): 2000 μs; (d): 2500 μs; (e): 3000 μs; (f): 3500 μs; (g): 4000 μs.
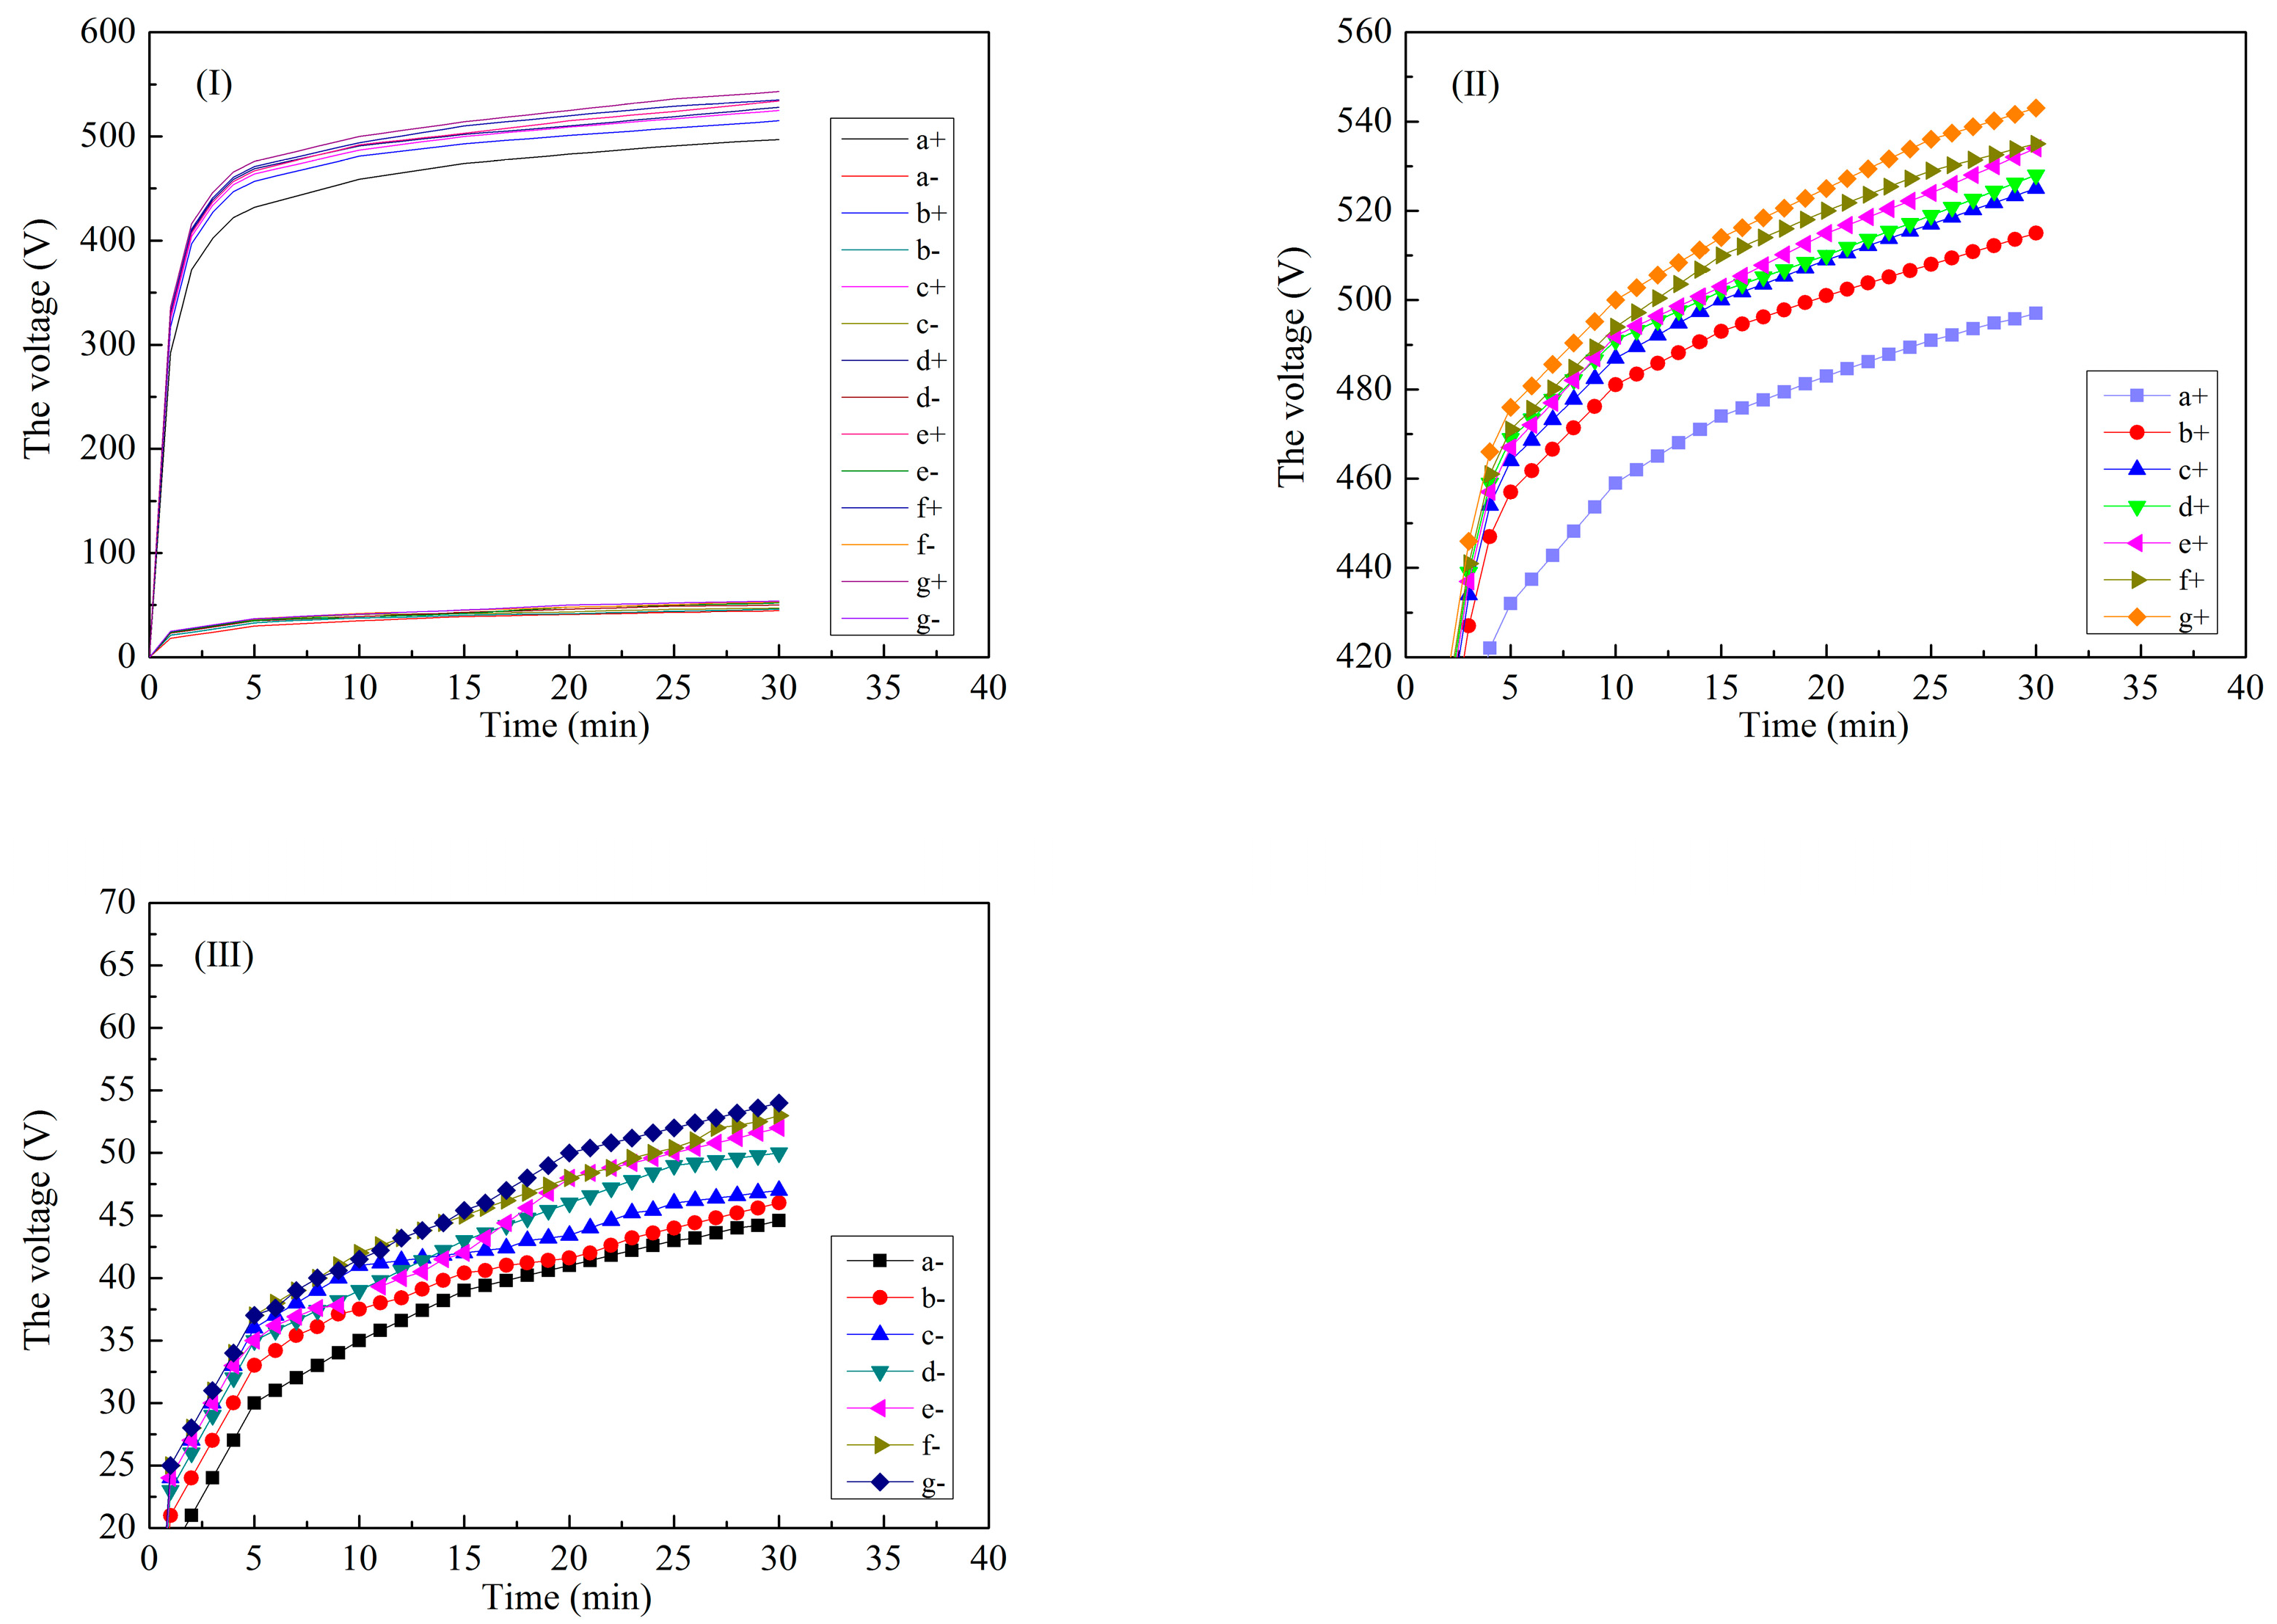
Figure 3.
Surface morphologies of the microarc oxidation coatings formed on aluminum alloys at different anode pulse-widths. (a) 1000 μs; (b) 1500 μs; (c) 2000 μs; (d) 2500 μs; (e) 3000 μs; (f) 3500 μs; (g) 4000 μs.
Figure 3.
Surface morphologies of the microarc oxidation coatings formed on aluminum alloys at different anode pulse-widths. (a) 1000 μs; (b) 1500 μs; (c) 2000 μs; (d) 2500 μs; (e) 3000 μs; (f) 3500 μs; (g) 4000 μs.
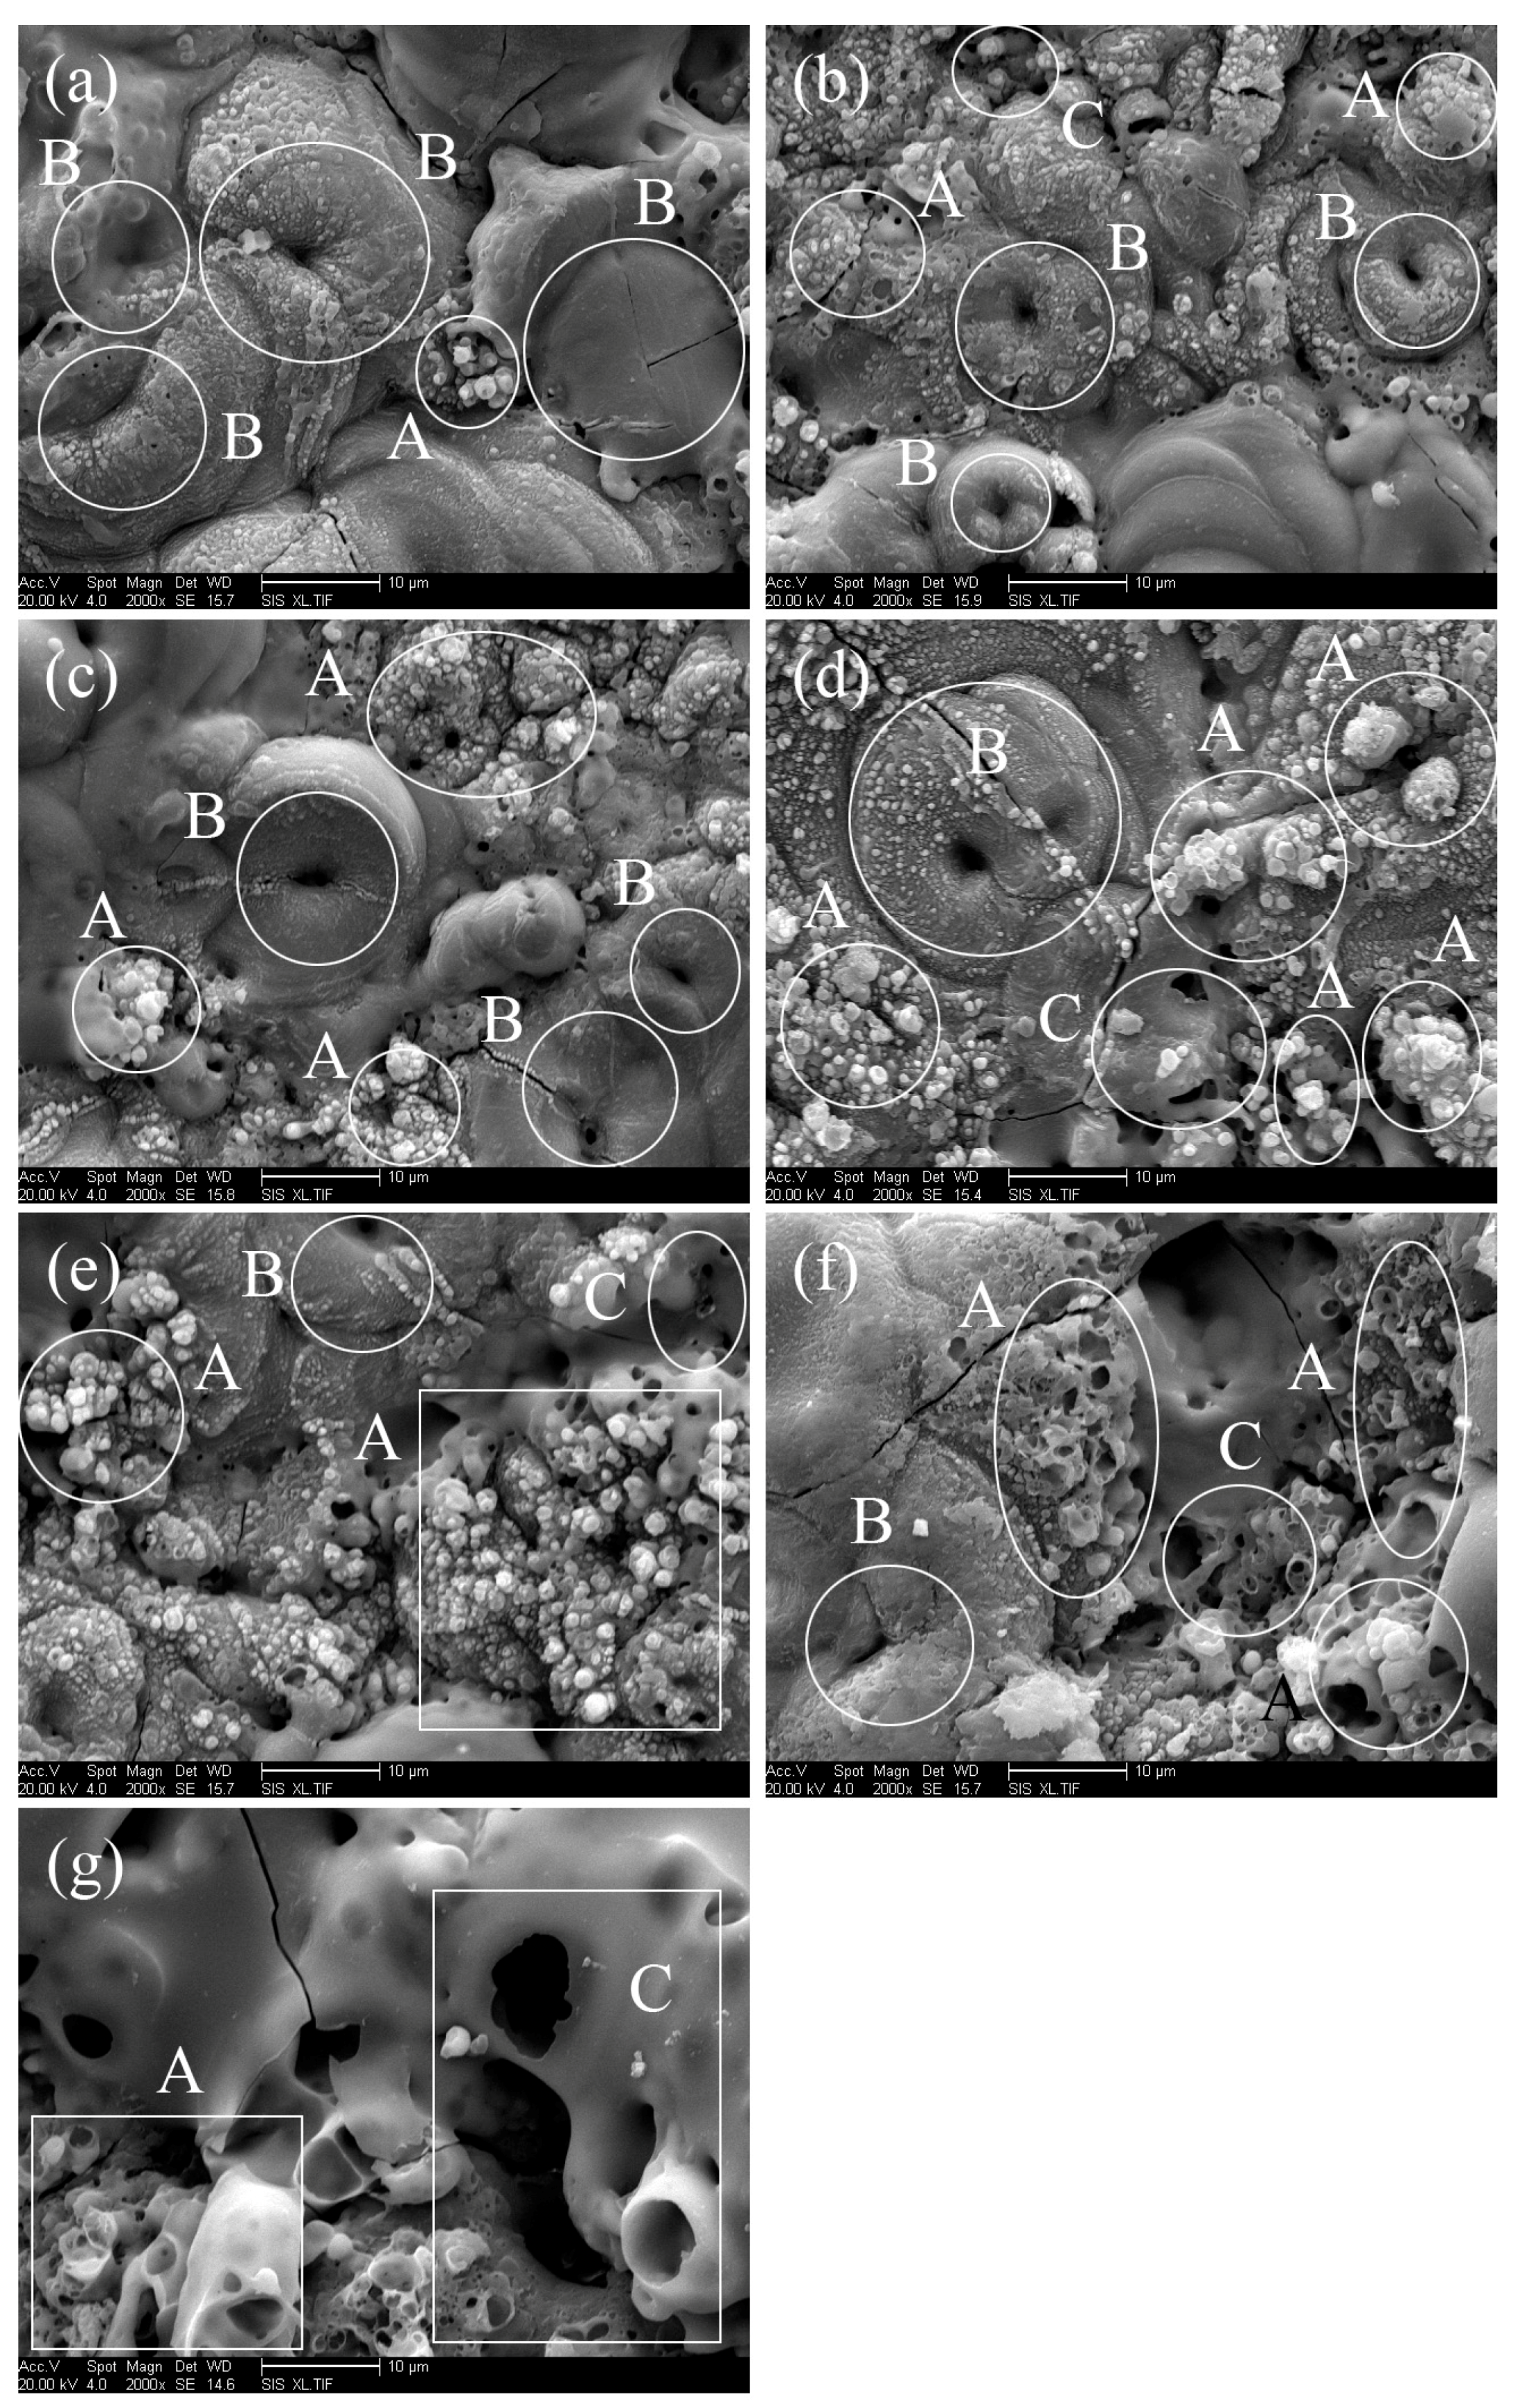
Figure 4.
The surface roughness of microarc oxidation coatings formed on aluminum alloys at different anode pulse-widths. (a): 1000 μs; (b): 1500 μs; (c): 2000 μs; (d): 2500 μs; (e): 3000 μs; (f): 3500 μs; (g): 4000 μs.
Figure 4.
The surface roughness of microarc oxidation coatings formed on aluminum alloys at different anode pulse-widths. (a): 1000 μs; (b): 1500 μs; (c): 2000 μs; (d): 2500 μs; (e): 3000 μs; (f): 3500 μs; (g): 4000 μs.
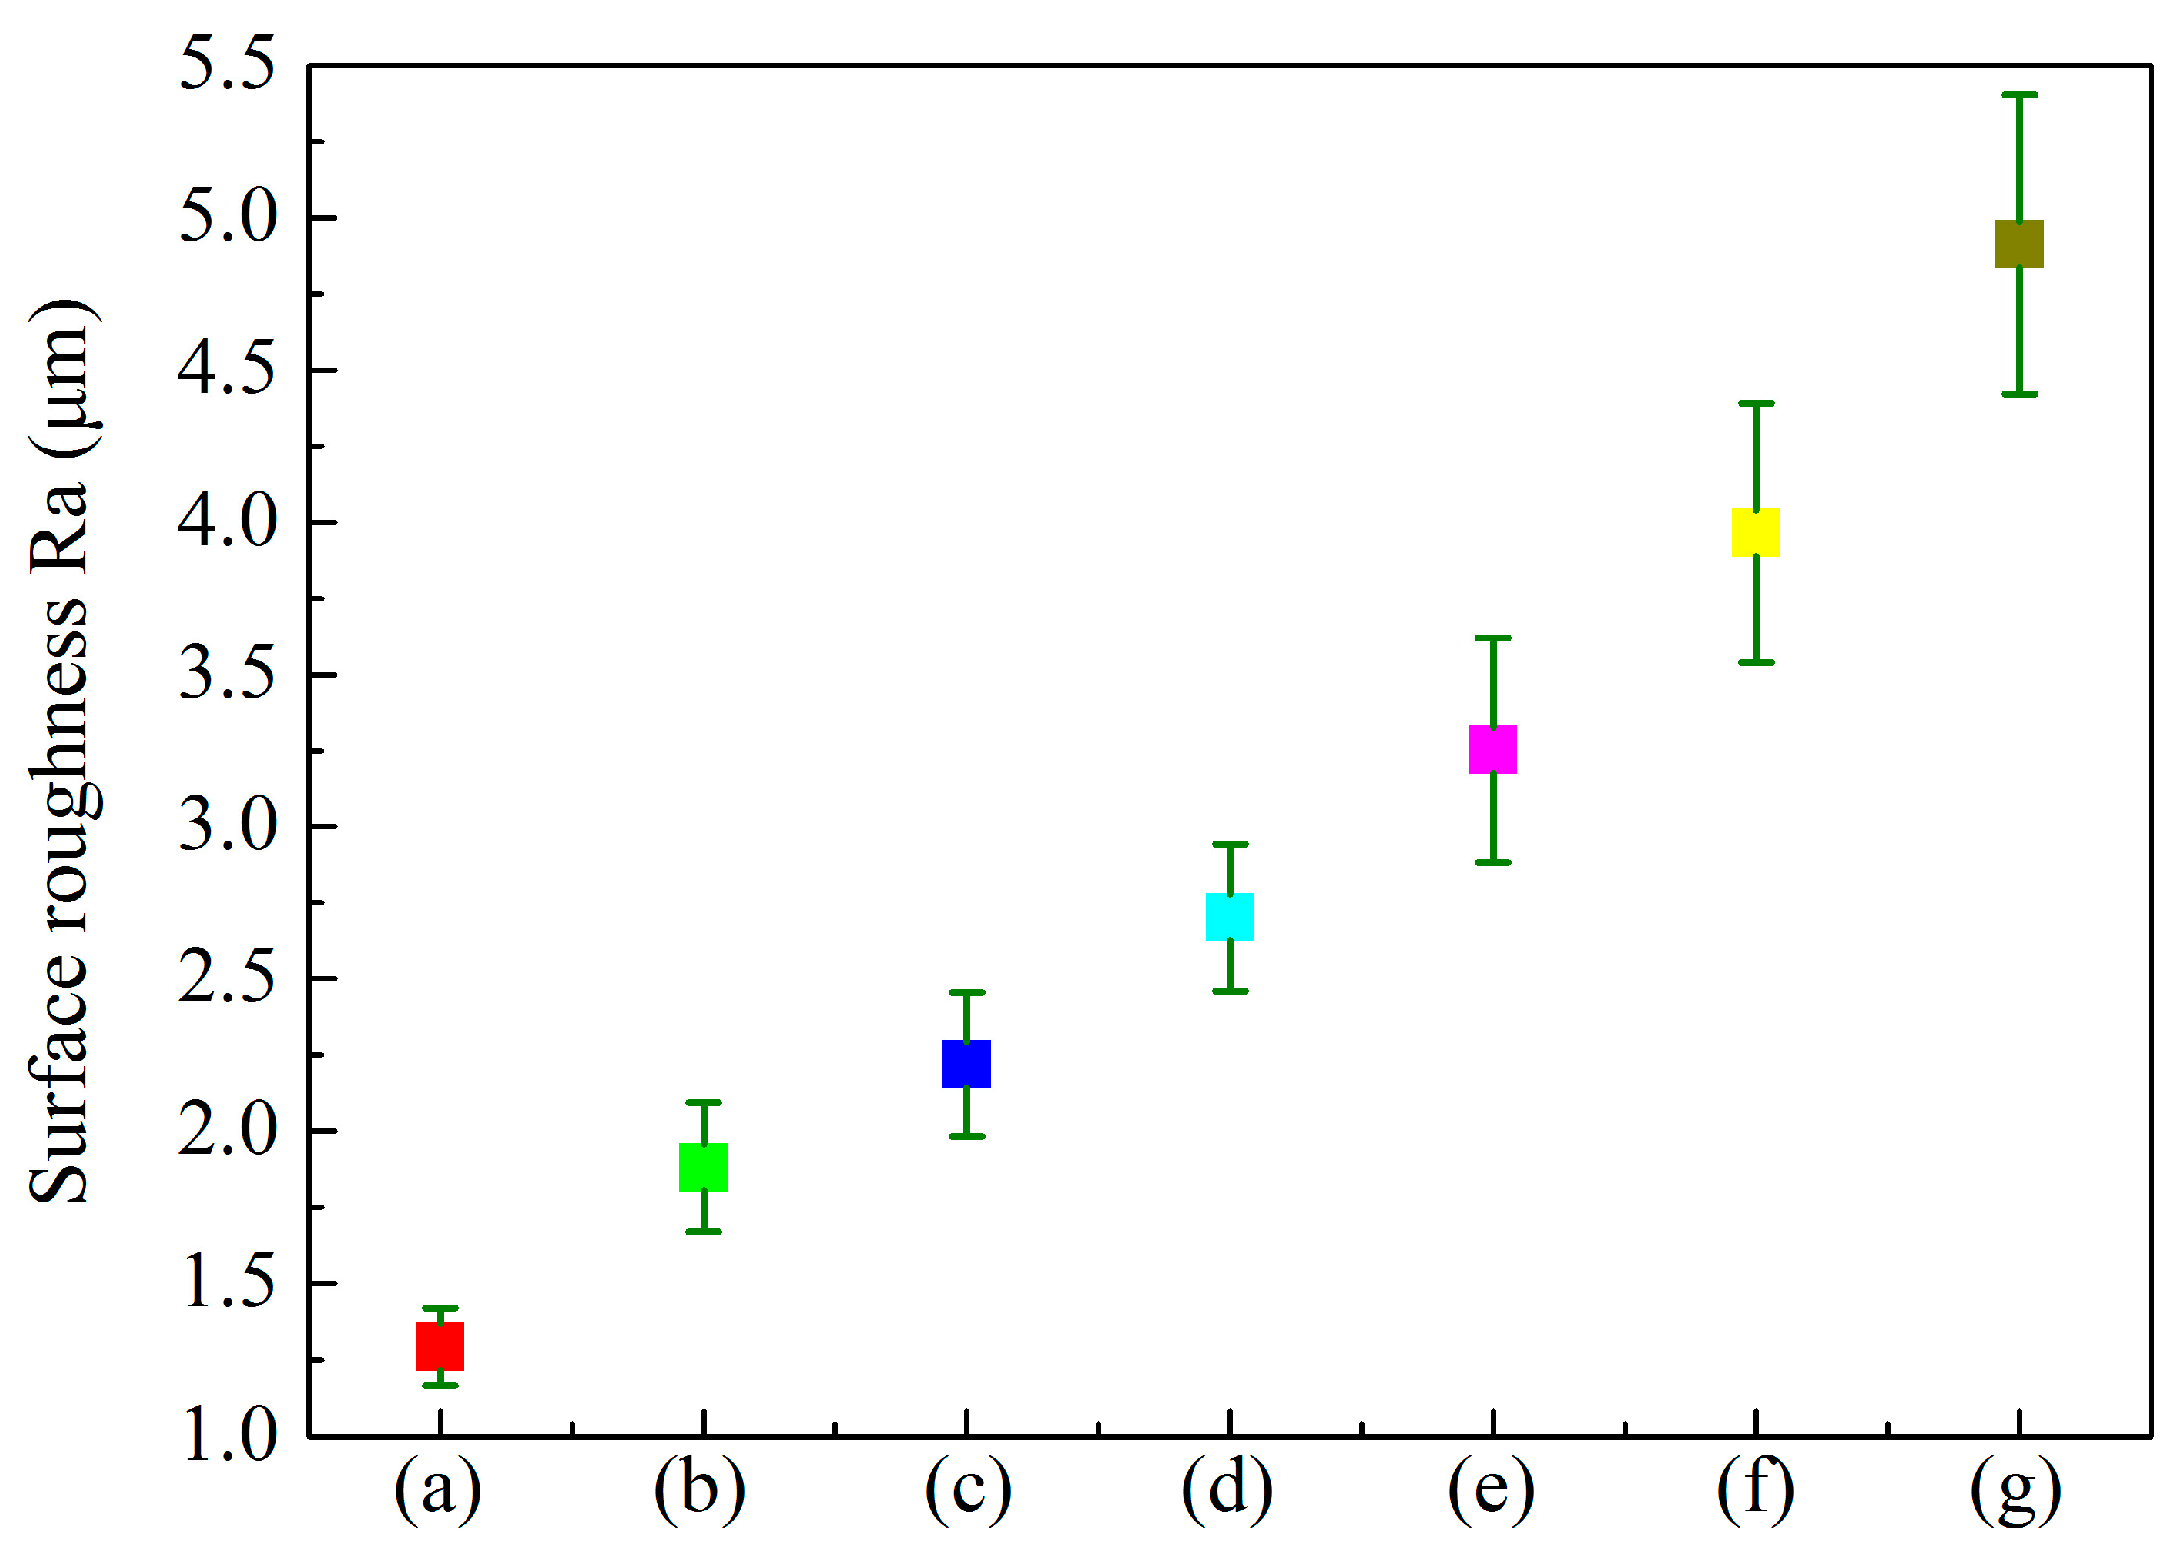
Figure 5.
The cross-section morphologies of microarc oxidation coatings formed on aluminum alloys at different anode pulse-widths. (a) 1000 μs; (b) 1500 μs; (c) 2000 μs; (d) 2500 μs; (e) 3000 μs; (f) 3500 μs; (g) 4000 μs.
Figure 5.
The cross-section morphologies of microarc oxidation coatings formed on aluminum alloys at different anode pulse-widths. (a) 1000 μs; (b) 1500 μs; (c) 2000 μs; (d) 2500 μs; (e) 3000 μs; (f) 3500 μs; (g) 4000 μs.
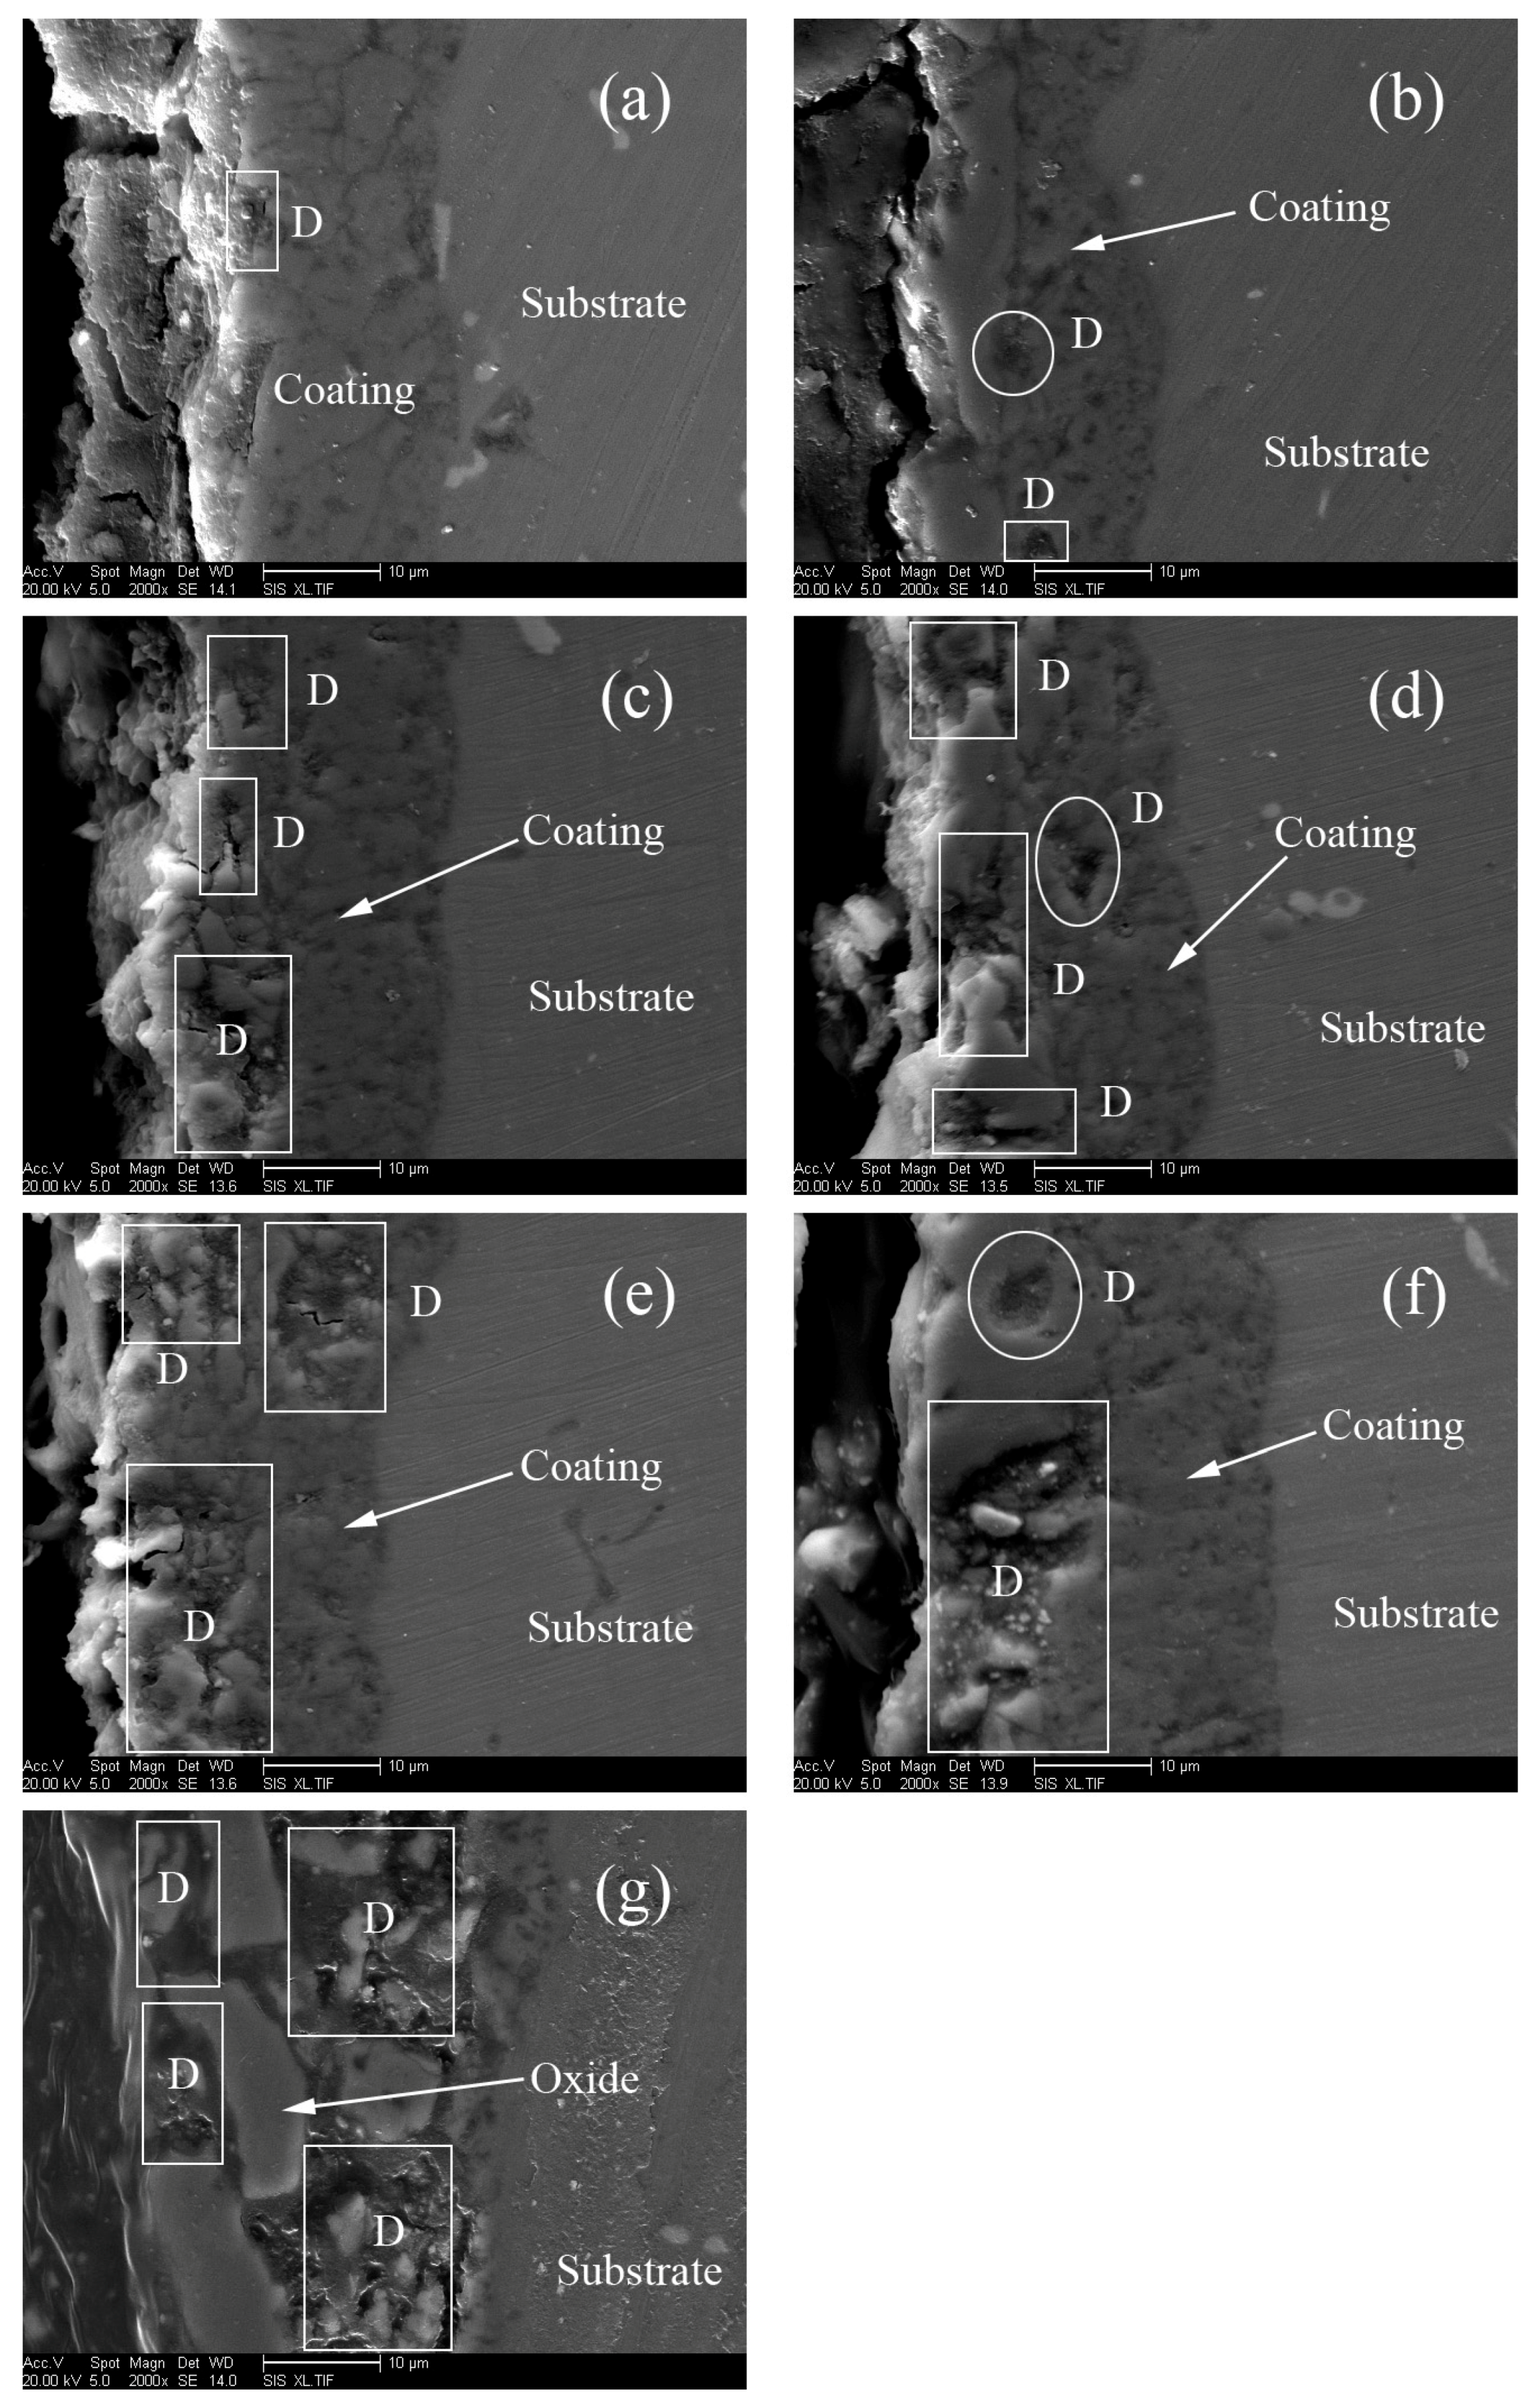
Figure 6.
The thickness of microarc oxidation coatings formed on aluminum alloys at different anode pulse-widths. (a): 1000 μs; (b): 1500 μs; (c): 2000 μs; (d): 2500 μs; (e): 3000 μs; (f): 3500 μs; (g): 4000 μs.
Figure 6.
The thickness of microarc oxidation coatings formed on aluminum alloys at different anode pulse-widths. (a): 1000 μs; (b): 1500 μs; (c): 2000 μs; (d): 2500 μs; (e): 3000 μs; (f): 3500 μs; (g): 4000 μs.

Figure 7.
The surface morphologies of the microarc oxidation self-lubricating composite coatings formed on aluminum alloys at different anode pulse-widths. (a1) 1000 μs; (b1) 1500 μs; (c1) 2000 μs; (d1) 2500 μs; (e1) 3000 μs; (f1) 3500 μs; (g1) 4000 μs.
Figure 7.
The surface morphologies of the microarc oxidation self-lubricating composite coatings formed on aluminum alloys at different anode pulse-widths. (a1) 1000 μs; (b1) 1500 μs; (c1) 2000 μs; (d1) 2500 μs; (e1) 3000 μs; (f1) 3500 μs; (g1) 4000 μs.

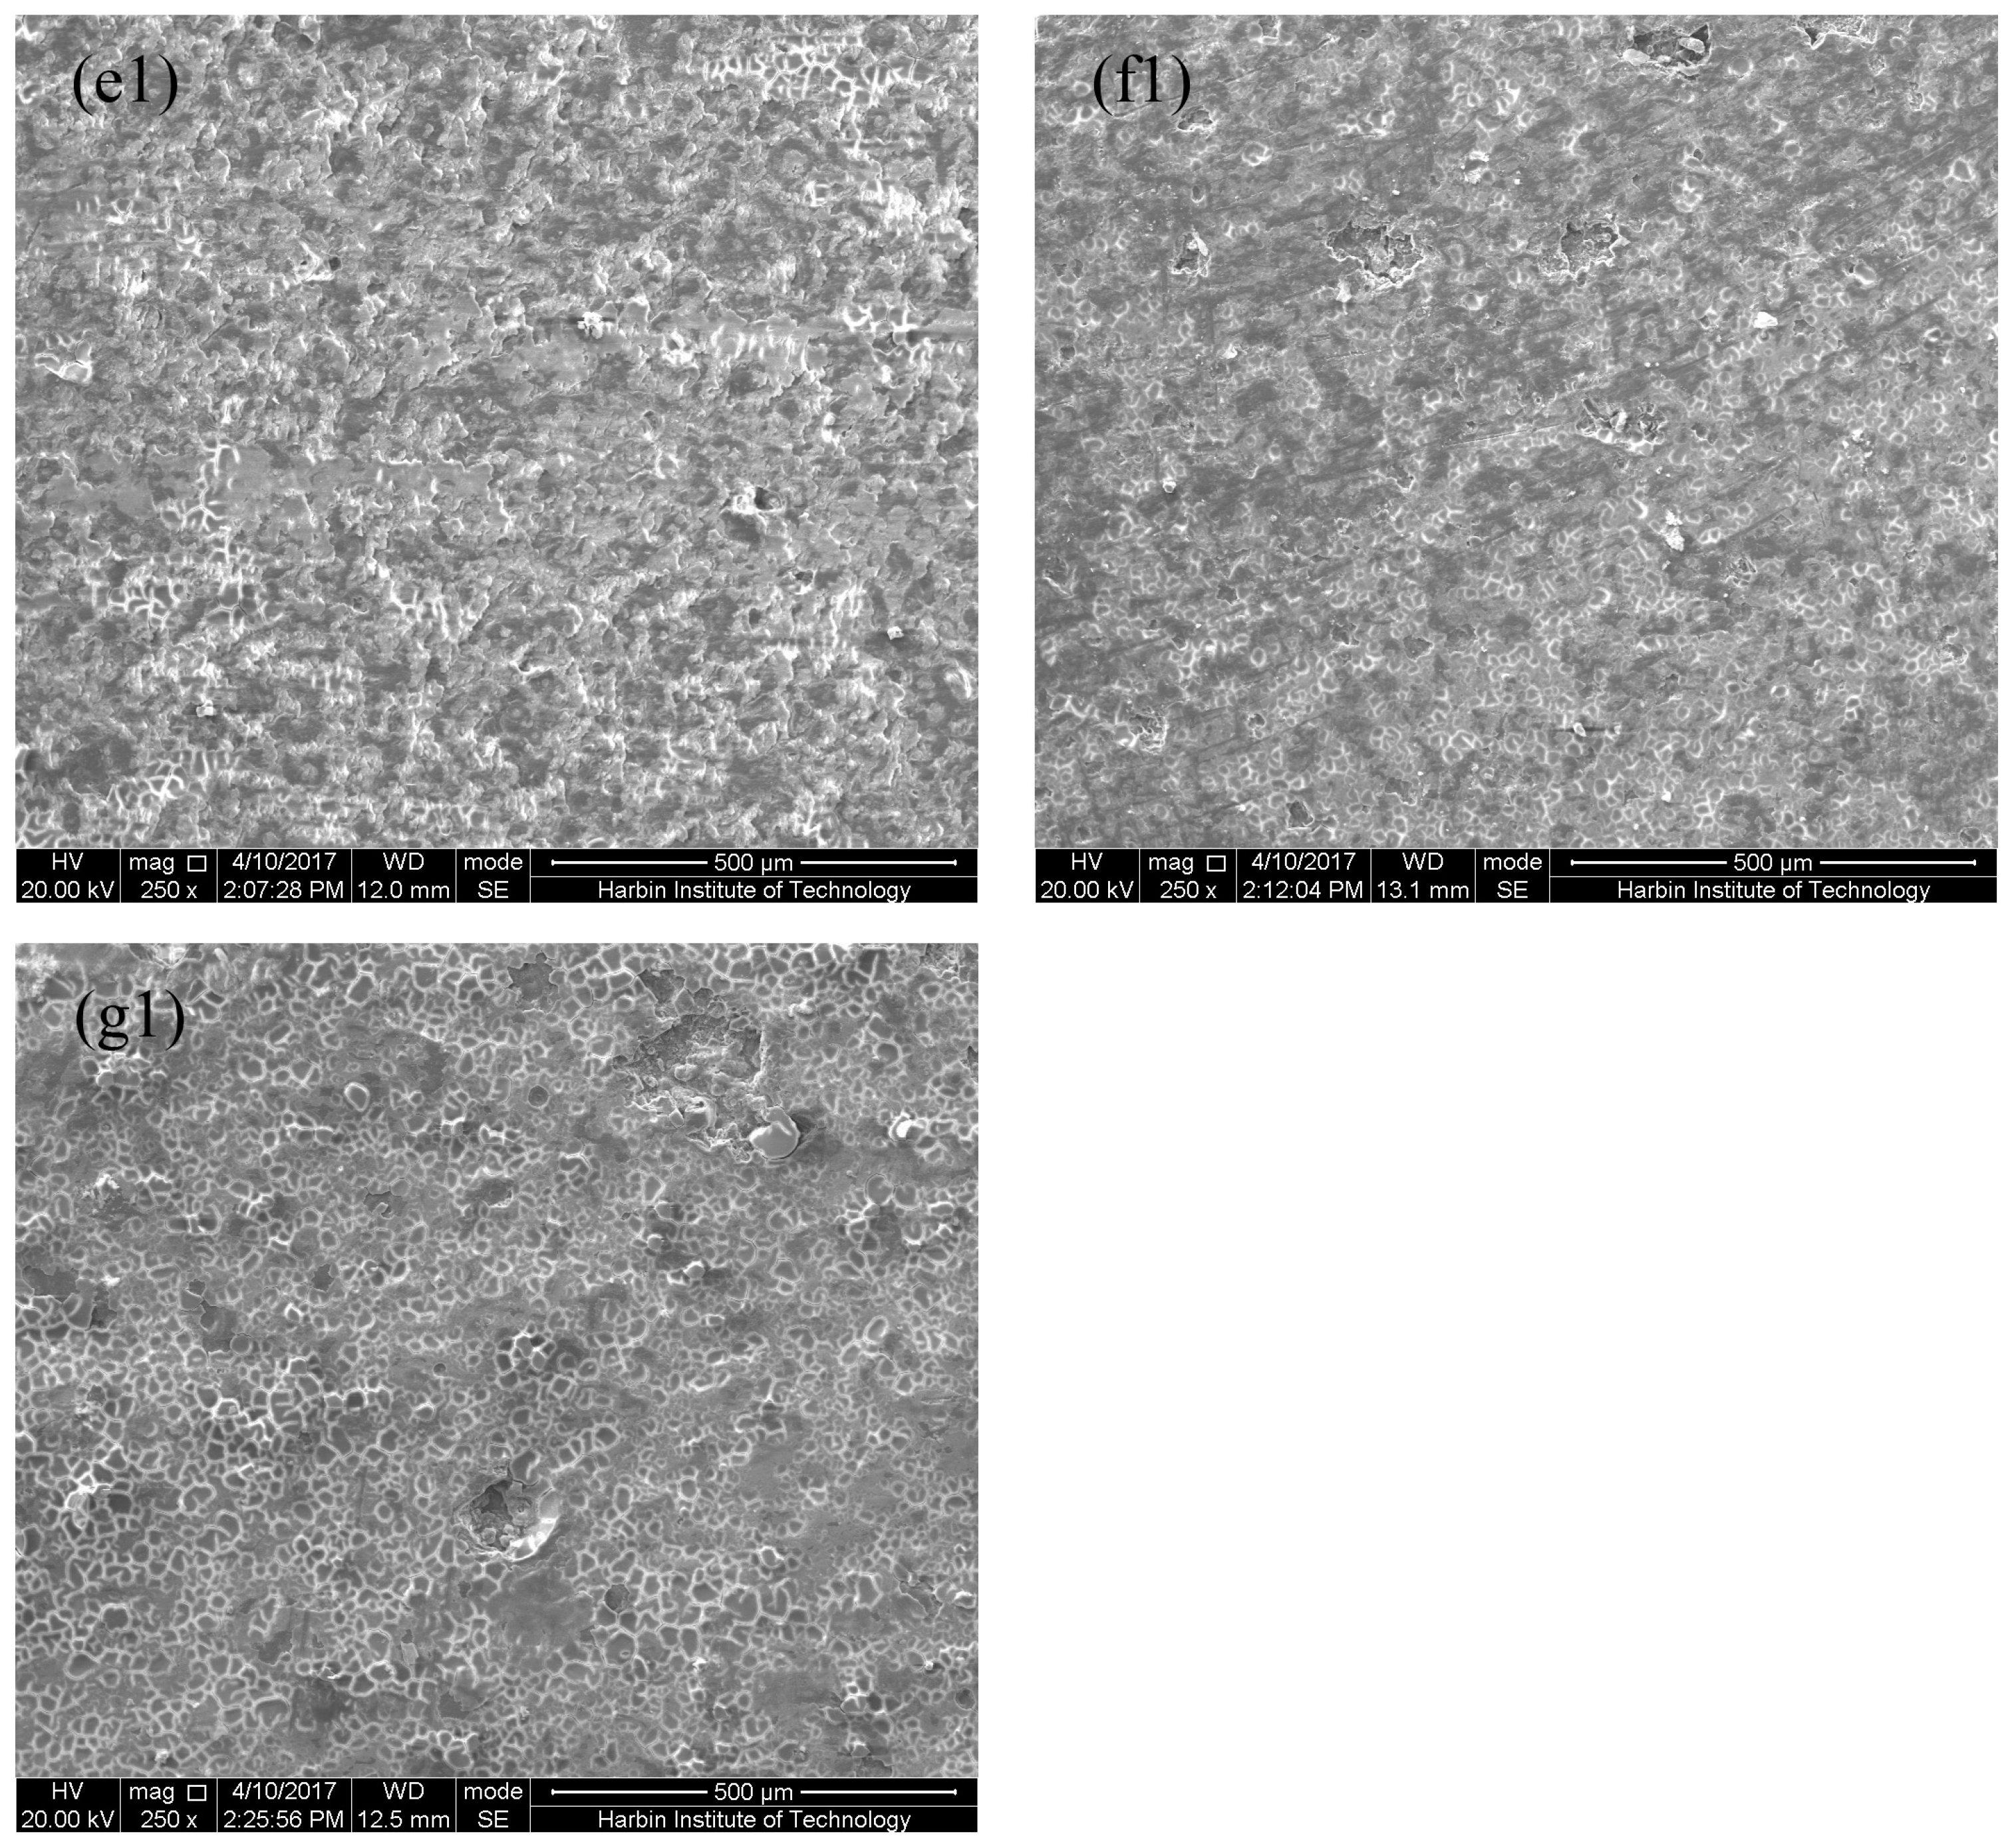
Figure 8.
X-ray diffractometer (XRD) patterns of the microarc oxidation coatings formed on aluminum alloys at different anode pulse-widths. (a) 1000 μs; (b) 1500 μs; (c) 2000 μs; (d) 2500 μs; (e) 3000 μs; (f) 3500 μs; (g) 4000 μs.
Figure 8.
X-ray diffractometer (XRD) patterns of the microarc oxidation coatings formed on aluminum alloys at different anode pulse-widths. (a) 1000 μs; (b) 1500 μs; (c) 2000 μs; (d) 2500 μs; (e) 3000 μs; (f) 3500 μs; (g) 4000 μs.
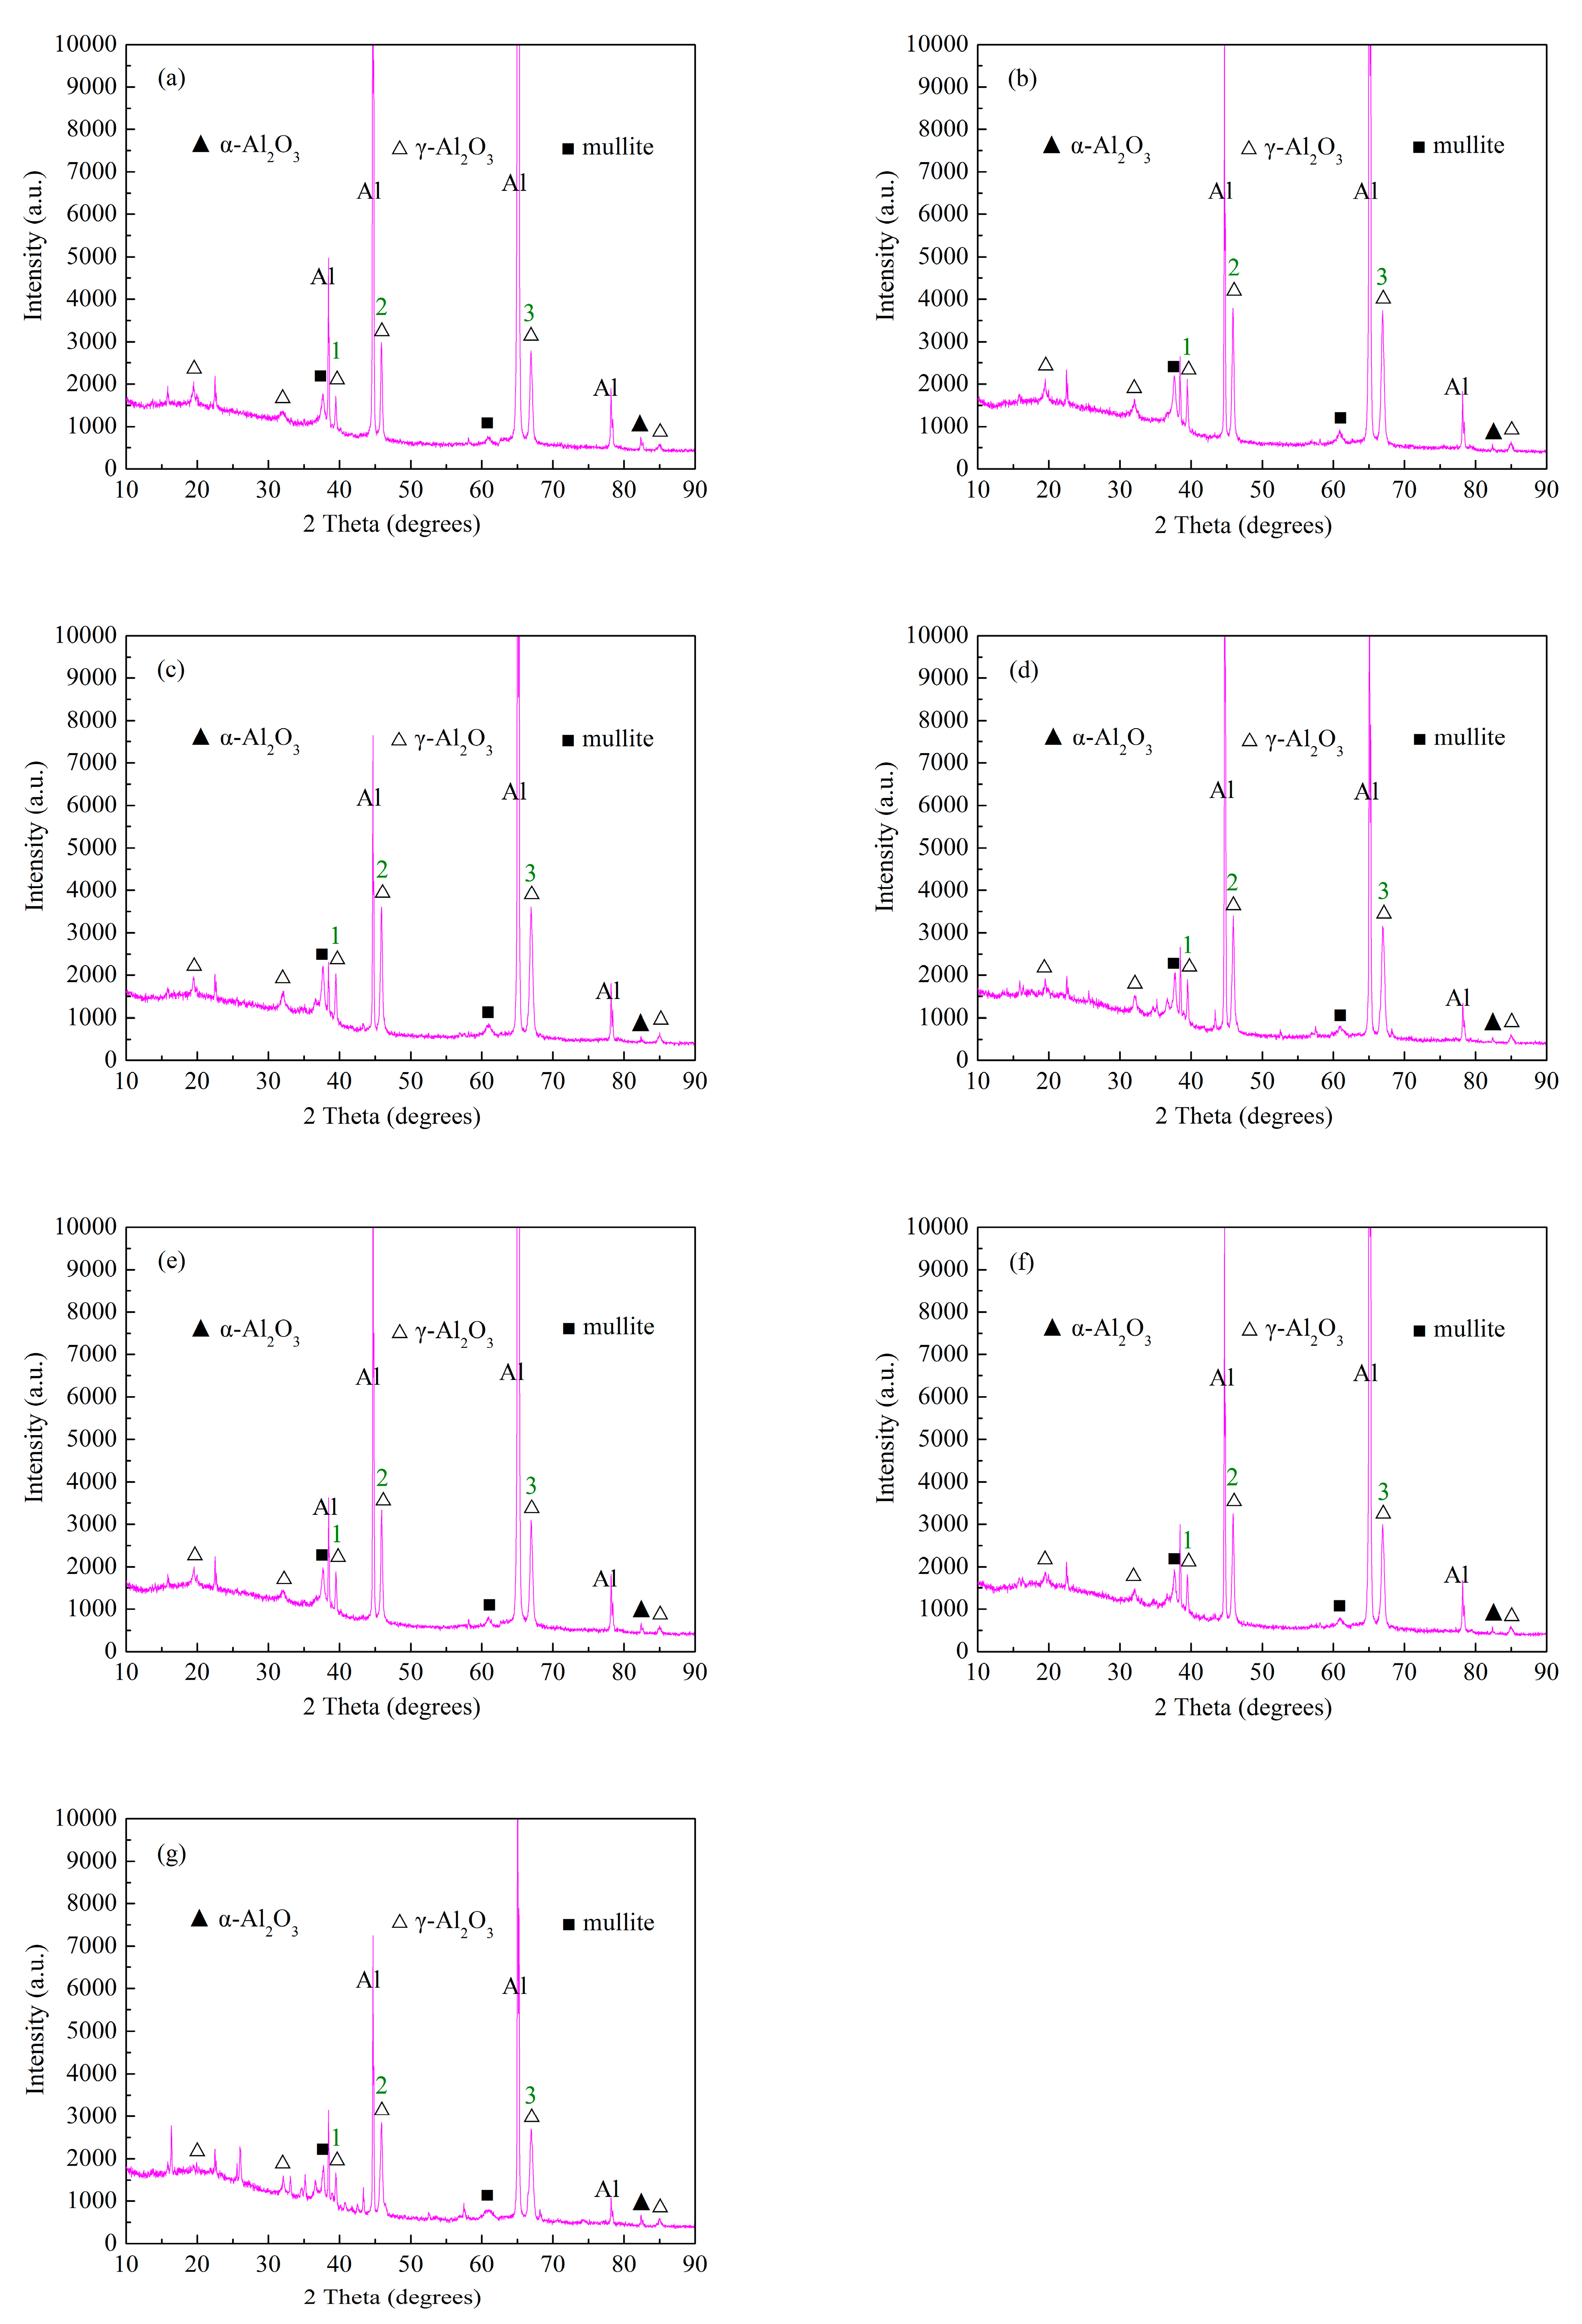
Figure 9.
The structure of mullite.
Figure 10.
The scanning electron microscope (SEM) morphologies of scratches on the microarc oxidation coatings formed on aluminum alloys at different anode pulse-widths. (a) 1000 μs; (b) 1500 μs; (c) 2000 μs; (d) 2500 μs; (e) 3000 μs; (f) 3500 μs; (g) 4000 μs.
Figure 10.
The scanning electron microscope (SEM) morphologies of scratches on the microarc oxidation coatings formed on aluminum alloys at different anode pulse-widths. (a) 1000 μs; (b) 1500 μs; (c) 2000 μs; (d) 2500 μs; (e) 3000 μs; (f) 3500 μs; (g) 4000 μs.
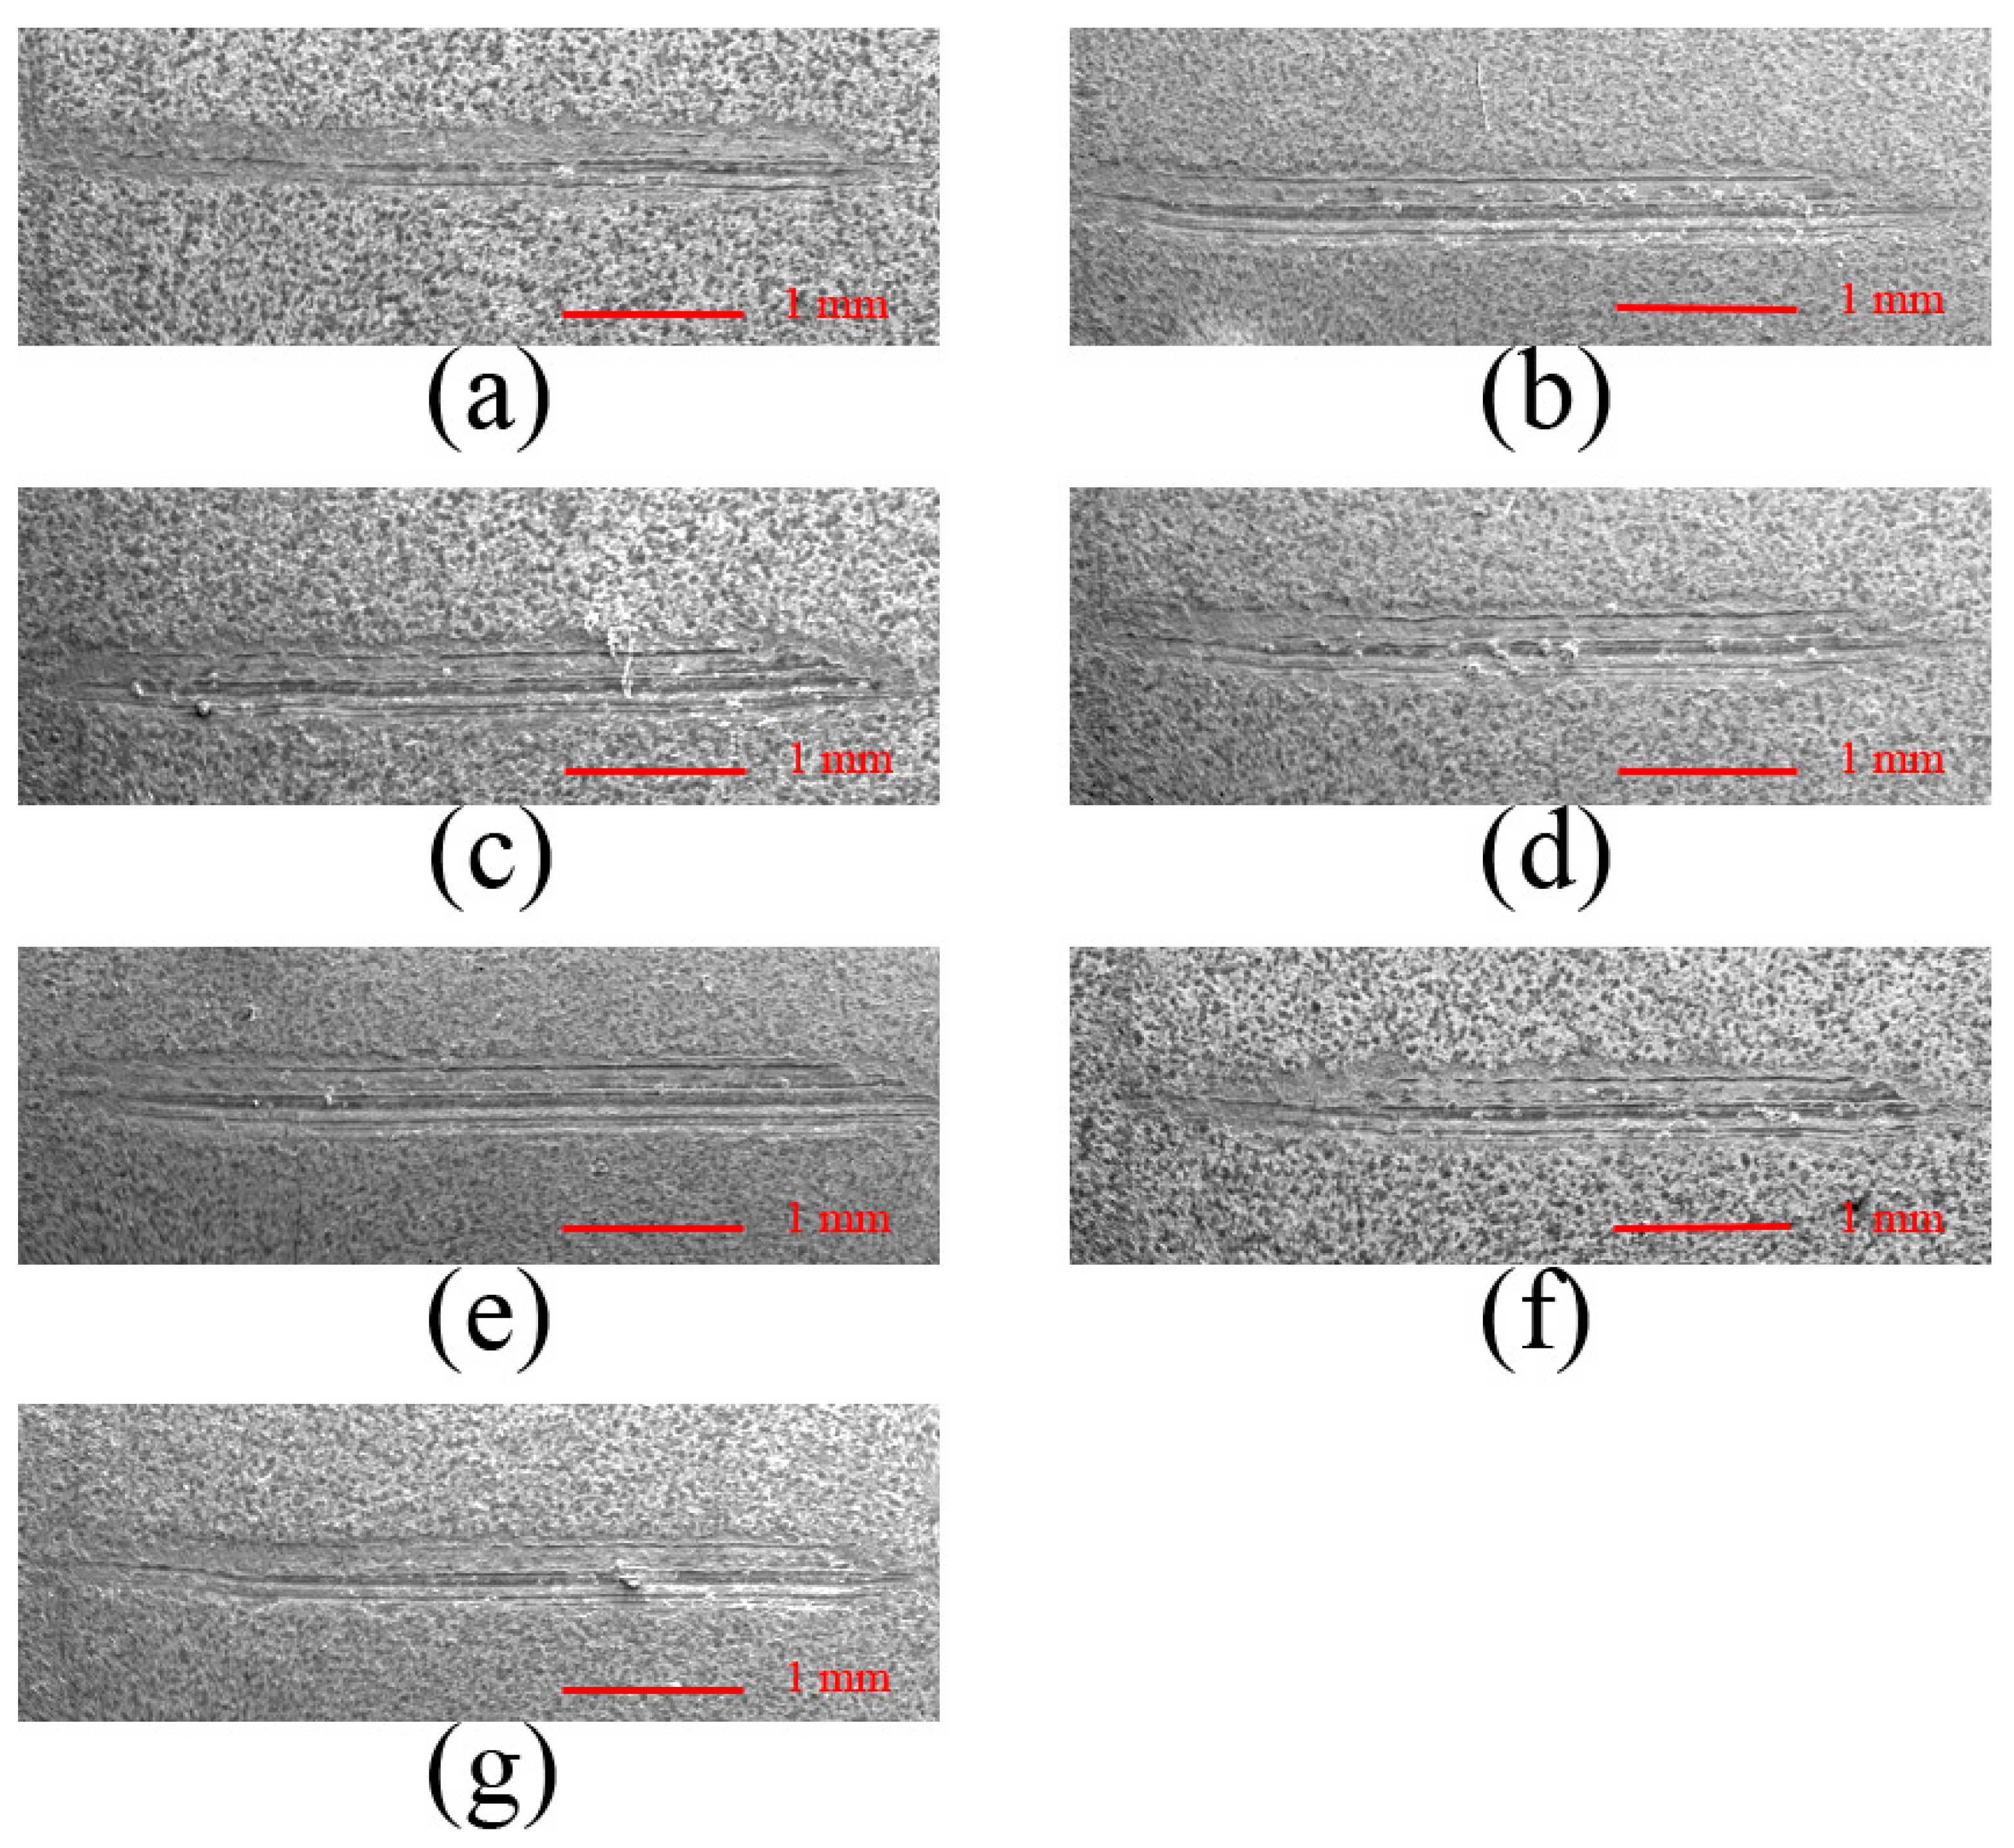
Figure 11.
The supplementary data graphics of scratches on the microarc oxidation coatings formed on aluminum alloys at different anode pulse-widths. (a) 1000 μs; (b) 1500 μs; (c) 2000 μs; (d) 2500 μs; (e) 3000 μs; (f) 3500 μs; (g) 4000 μs.
Figure 11.
The supplementary data graphics of scratches on the microarc oxidation coatings formed on aluminum alloys at different anode pulse-widths. (a) 1000 μs; (b) 1500 μs; (c) 2000 μs; (d) 2500 μs; (e) 3000 μs; (f) 3500 μs; (g) 4000 μs.
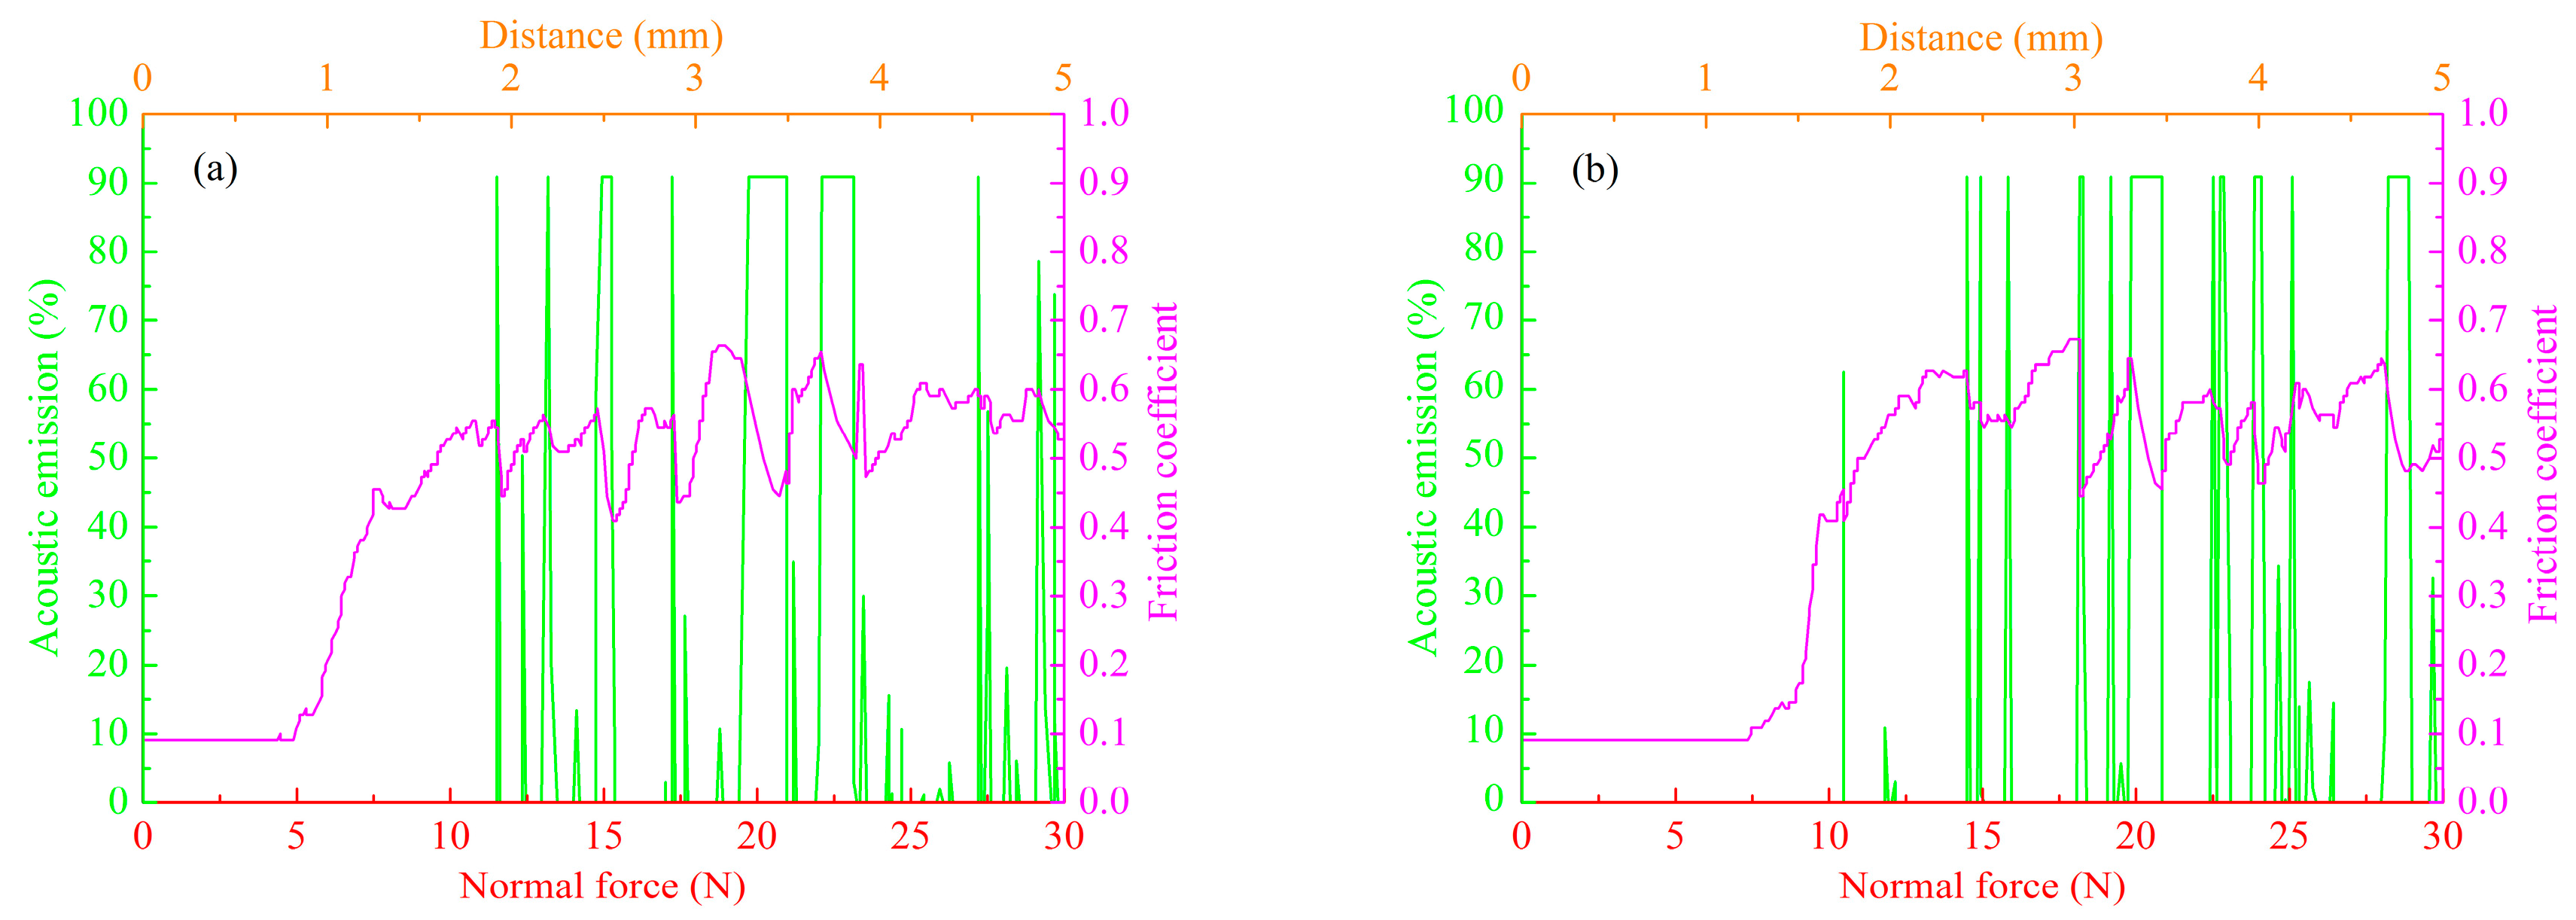
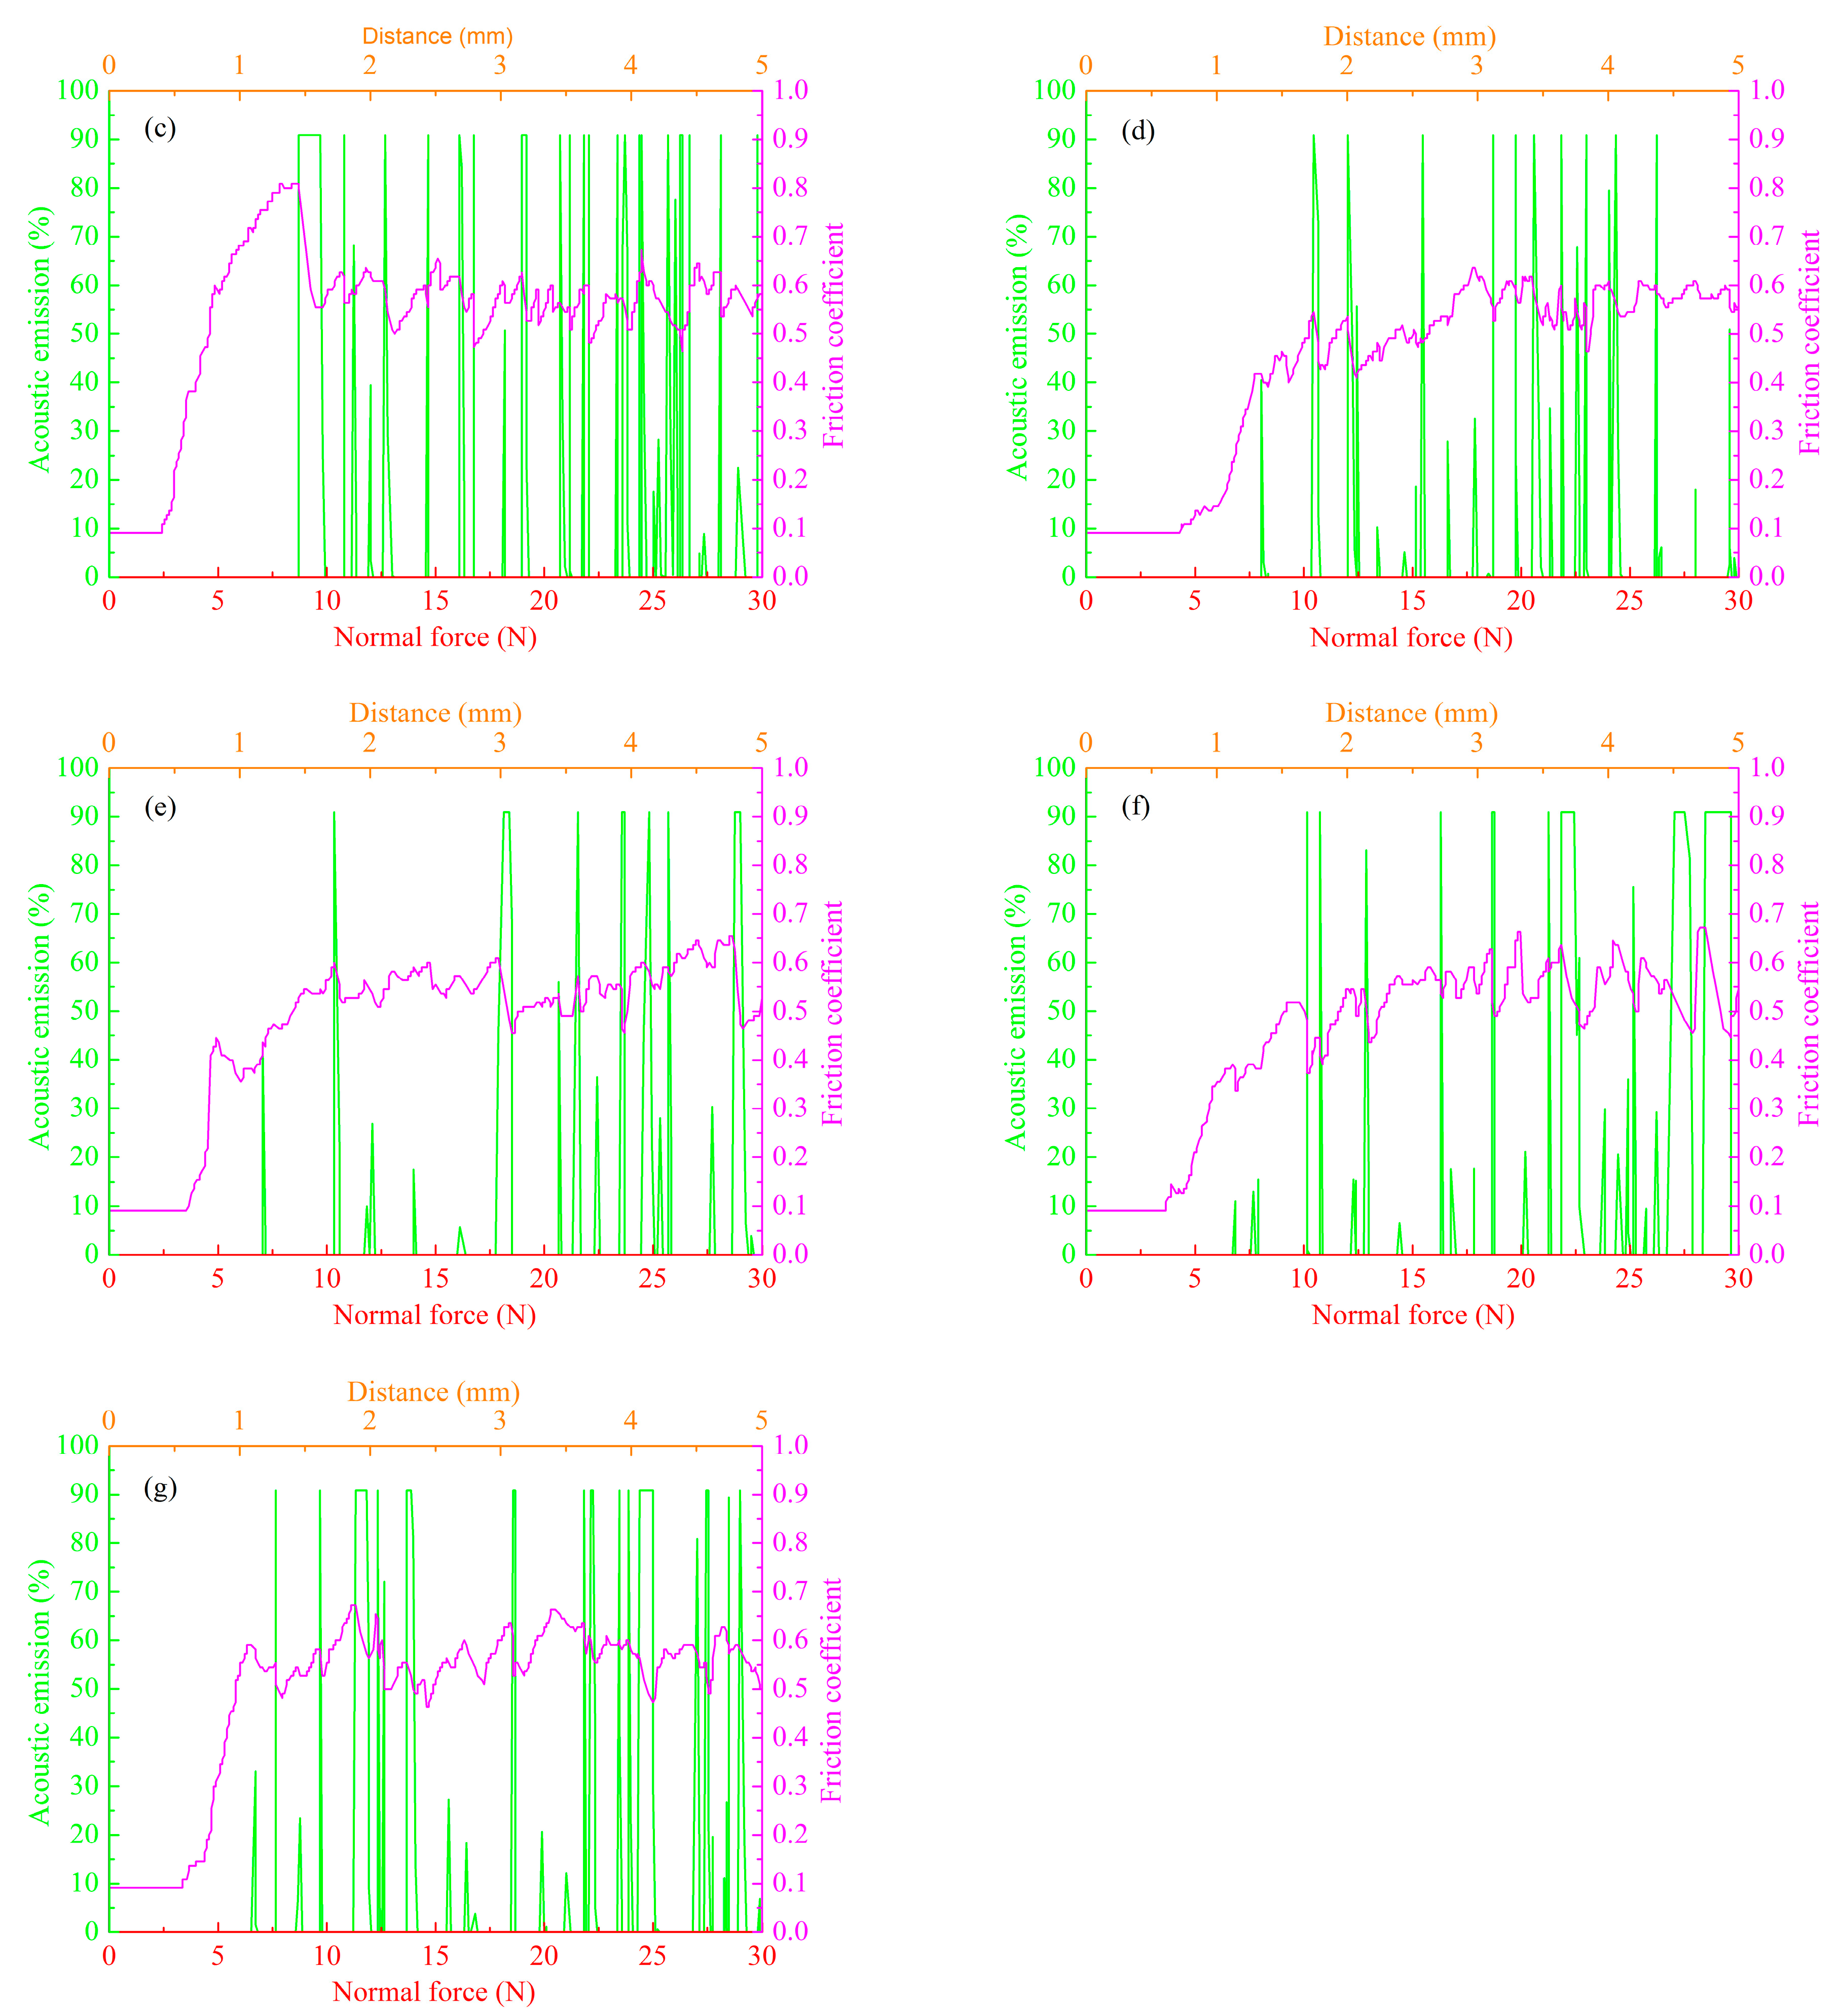
Figure 12.
The hardness of the microarc oxidation coatings formed on aluminum alloys at different anode pulse-widths. (a): 1000 μs; (b): 1500 μs; (c): 2000 μs; (d): 2500 μs; (e): 3000 μs; (f): 3500 μs; (g): 4000 μs.
Figure 12.
The hardness of the microarc oxidation coatings formed on aluminum alloys at different anode pulse-widths. (a): 1000 μs; (b): 1500 μs; (c): 2000 μs; (d): 2500 μs; (e): 3000 μs; (f): 3500 μs; (g): 4000 μs.

Figure 13.
Friction coefficient of the microarc oxidation coatings formed on aluminum alloys at different anode pulse-widths. (a): 1000 μs; (b): 1500 μs; (c): 2000 μs; (d): 2500 μs; (e): 3000 μs; (f): 3500 μs; (g): 4000 μs.
Figure 13.
Friction coefficient of the microarc oxidation coatings formed on aluminum alloys at different anode pulse-widths. (a): 1000 μs; (b): 1500 μs; (c): 2000 μs; (d): 2500 μs; (e): 3000 μs; (f): 3500 μs; (g): 4000 μs.

Figure 14.
The morphologies of wear tracks for the microarc oxidation coatings formed on aluminum alloys at different anode pulse-widths. (a) 1000 μs; (b) 1500 μs; (c) 2000 μs; (d) 2500 μs; (e) 3000 μs; (f) 3500 μs; (g) 4000 μs.
Figure 14.
The morphologies of wear tracks for the microarc oxidation coatings formed on aluminum alloys at different anode pulse-widths. (a) 1000 μs; (b) 1500 μs; (c) 2000 μs; (d) 2500 μs; (e) 3000 μs; (f) 3500 μs; (g) 4000 μs.

Figure 15.
Friction coefficient of the microarc oxidation self-lubricating composite coatings formed on aluminum alloys at different anode pulse-widths. (a1): 1000 μs; (b1): 1500 μs; (c1): 2000 μs; (d1): 2500 μs; (e1): 3000 μs; (f1): 3500 μs; (g1): 4000 μs.
Figure 15.
Friction coefficient of the microarc oxidation self-lubricating composite coatings formed on aluminum alloys at different anode pulse-widths. (a1): 1000 μs; (b1): 1500 μs; (c1): 2000 μs; (d1): 2500 μs; (e1): 3000 μs; (f1): 3500 μs; (g1): 4000 μs.

Figure 16.
The morphologies of wear tracks for the MAO self-lubricating composite coatings formed on aluminum alloys at different anode pulse-widths. (a1) 1000 μs; (b1) 1500 μs; (c1) 2000 μs; (d1) 2500 μs; (e1) 3000 μs; (f1) 3500 μs; (g1) 4000 μs.
Figure 16.
The morphologies of wear tracks for the MAO self-lubricating composite coatings formed on aluminum alloys at different anode pulse-widths. (a1) 1000 μs; (b1) 1500 μs; (c1) 2000 μs; (d1) 2500 μs; (e1) 3000 μs; (f1) 3500 μs; (g1) 4000 μs.


Table 1.
Microarc oxidation process parameters for coatings formed on aluminum alloys at different anode pulse-widths.
Table 1.
Microarc oxidation process parameters for coatings formed on aluminum alloys at different anode pulse-widths.
| Labels | Ton+ (μs) | Toff+ (μs) | Ton− (μs) | Toff− (μs) | V+ (V) | V− (V) | I+ (A/dm2) | I− (A/dm2) | Time (min) |
|---|---|---|---|---|---|---|---|---|---|
| a (a1) | 1000 | 300 | 2000 | 300 | Figure 2 | Figure 2 | 37 | 9 | 30 |
| b (b1) | 1500 | 300 | 2000 | 300 | Figure 2 | Figure 2 | 37 | 9 | 30 |
| c (c1) | 2000 | 300 | 2000 | 300 | Figure 2 | Figure 2 | 37 | 9 | 30 |
| d (d1) | 2500 | 300 | 2000 | 300 | Figure 2 | Figure 2 | 37 | 9 | 30 |
| e (e1) | 3000 | 300 | 2000 | 300 | Figure 2 | Figure 2 | 37 | 9 | 30 |
| f (f1) | 3500 | 300 | 2000 | 300 | Figure 2 | Figure 2 | 37 | 9 | 30 |
| g (g1) | 4000 | 300 | 2000 | 300 | Figure 2 | Figure 2 | 37 | 9 | 30 |
Table 2.
The intensity of γ-Al2O3 peaks in the microarc oxidation (MAO) coatings formed on aluminum alloys at different anode pulse-widths.
Table 2.
The intensity of γ-Al2O3 peaks in the microarc oxidation (MAO) coatings formed on aluminum alloys at different anode pulse-widths.
| Labels | Intensity (a.u., arbitrary unit) | ||||||
|---|---|---|---|---|---|---|---|
| a | b | c | d | e | f | g | |
| 1 | 1720 | 2110 | 2032 | 1895 | 1879 | 1818 | 1671 |
| 2 | 2988 | 3789 | 3607 | 3404 | 3335 | 3253 | 2853 |
| 3 | 2789 | 3731 | 3606 | 3163 | 3099 | 2991 | 2701 |
Table 3.
Critical load values of MAO coatings formed on aluminum alloys at different anode pulse-widths.
Table 3.
Critical load values of MAO coatings formed on aluminum alloys at different anode pulse-widths.
| Coatings | Lc (N) |
|---|---|
| A (Figure 10a) | 11.58 |
| B (Figure 10b) | 10.50 |
| C (Figure 10c) | 8.83 |
| D (Figure 10d) | 8.17 |
| E (Figure 10e) | 7.17 |
| F (Figure 10f) | 6.83 |
| G (Figure 10g) | 6.67 |
Table 4.
Wear rates of the MAO coatings formed on aluminum alloys at different anode pulse-widths.
| Coatings | Wear Time (s) | Wear Track Width (μm) | Wear Track Depth (μm) | Wear Rate (mm3·N−1·m−1) |
|---|---|---|---|---|
| a | 1200 | 420.56 | 3.19 | 0.13 × 10⁻⁵ |
| b | 1200 | 490.65 | 3.73 | 0.15 × 10⁻⁵ |
| c | 1200 | 560.75 | 4.26 | 0.18 × 10⁻⁵ |
| d | 1200 | 654.21 | 4.97 | 0.20 × 10⁻⁵ |
| e | 1200 | 700.94 | 5.32 | 0.21 × 10⁻⁵ |
| f | 1200 | 724.30 | 5.50 | 0.22 × 10⁻⁵ |
| g | 1200 | 794.39 | 6.03 | 0.24 × 10⁻⁵ |
Table 5.
Wear rates of the MAO self-lubricating composite coatings formed on aluminum alloys at different anode pulse-widths.
Table 5.
Wear rates of the MAO self-lubricating composite coatings formed on aluminum alloys at different anode pulse-widths.
| Coatings | Wear Time (s) | Wear Track Width (μm) | Wear Track Depth (μm) | Wear Rate (mm3·N−1·m−1) |
|---|---|---|---|---|
| a1 | 1200 | 380.47 | 2.92 | 0.12 × 10⁻⁵ |
| b1 | 1200 | 357.10 | 2.81 | 0.11 × 10⁻⁵ |
| c1 | 1200 | 333.74 | 2.73 | 0.10 × 10⁻⁵ |
| d1 | 1200 | 403.83 | 3.16 | 0.13 × 10⁻⁵ |
| e1 | 1200 | 427.20 | 3.24 | 0.13 × 10⁻⁵ |
| f1 | 1200 | 473.92 | 3.69 | 0.15 × 10⁻⁵ |
| g1 | 1200 | 520.65 | 4.15 | 0.17 × 10⁻⁵ |
© 2017 by the authors. Licensee MDPI, Basel, Switzerland. This article is an open access article distributed under the terms and conditions of the Creative Commons Attribution (CC BY) license (http://creativecommons.org/licenses/by/4.0/).
Share and Cite
MDPI and ACS Style
Li, Z.-W.; Di, S.-C. Effect of Anode Pulse-Width on the Microstructure and Wear Resistance of Microarc Oxidation Coatings. Metals 2017, 7, 243. https://doi.org/10.3390/met7070243
AMA Style
Li Z-W, Di S-C. Effect of Anode Pulse-Width on the Microstructure and Wear Resistance of Microarc Oxidation Coatings. Metals. 2017; 7(7):243. https://doi.org/10.3390/met7070243
Chicago/Turabian StyleLi, Zhen-Wei, and Shi-Chun Di. 2017. "Effect of Anode Pulse-Width on the Microstructure and Wear Resistance of Microarc Oxidation Coatings" Metals 7, no. 7: 243. https://doi.org/10.3390/met7070243
Note that from the first issue of 2016, this journal uses article numbers instead of page numbers. See further details here.