Investigation of Dendrite Coarsening in Complex Shaped Lamellar Graphite Iron Castings


1
Department of Materials and Manufacturing—Foundry Technology, Jönköping University, 551 11 Jönköping, Sweden
2
Department of Material Science and Engineering, KTH Royal Institute of Technology, 100 44 Stockholm, Sweden
*
Author to whom correspondence should be addressed.
Metals 2017, 7(7), 244; https://doi.org/10.3390/met7070244
Submission received: 31 May 2017
/
Revised: 28 June 2017
/
Accepted: 29 June 2017
/
Published: 1 July 2017
Abstract
:Shrinkage porosity and metal expansion penetration are two casting defects that appear frequently during the production of complex-shaped lamellar graphite iron components. These casting defects are formed during the solidification and usually form in the part of the casting which solidifies last. The position of the area that solidifies last is dependent on the thermal conditions. Test castings with thermal conditions like those existing in a complex-shaped casting were successfully applied to provoke a shrinkage porosity defect and a metal expansion penetration defect. The investigation of the primary dendrite morphology in the defected positions indicates a maximum intradendritic space, where the shrinkage porosity and metal expansion penetration defects appear. Moving away from the defect formation area, the intradendritic space decreases. A comparison of the intradendritic space with the simulated local solidification times indicates a strong relationship, which can be explained by the dynamic coarsening process. More specifically, long local solidification times facilitates the formation of a locally coarsened austenite morphology. This, in turn, enables the formation of a shrinkage porosity or a metal expansion penetration.
1. Introduction
Complex shaped lamellar graphite iron castings are the most widespread applications of cast iron materials in the automotive industry [1]. Besides the advantages of good thermal conductivity, vibration damping capacity and machinability, there are some recurrent defects like shrinkage porosity (SP) and metal expansion penetration (MEP) that result in additional expenses for the casting producers as well as their customers. SP can cause leakage through the casting wall when the component is pressurized. MEP can cause unhealthy cleaning procedures leading to “white fingers”, which is an occupational disease. Therefore, large efforts have been spent to investigate the formation mechanisms of these defects and to reduce the waste casting due to SP and MEP [2,3,4,5,6,7,8,9]. In general, SP and MEP are usually discussed together as they appearance shows similar characteristics. Both are initiated on the castings surface, where the alloy exists in liquid phase in the final stage of the solidification. Consequently, this area may be understood as the flow path which is open for the longest time. Also, the SP and MEP defects usually appear when the area that solidifies last is close to or at the metal-mold interface.
The SP and MEP are surface defects, usually appear on the metal-mold interface where.
In the investigation of the SP defect, Elmquist et al. [7] used the color etching technique to study the defect on cylinder head castings. Compared to the previous surmise that SP is positioned around a single eutectic colony, the color etched samples showed that SP is distributed around groups of eutectic colonies. An investigation [8] based on the Direct Austempering After Solidification (DAAS) procedure [10,11] revealed that SP is placed on the austenite grain boundary. Another study [9], based on the Electron Backscatter Diffraction (EBSD) technique, has confirmed that the position of the pore is situated on the austenite grain boundary. The oxide layer on the internal surface of the SP indicates the relationship between the pore and the surrounding atmosphere.
Levelink and Julien [2,3] investigated the MEP defect and concluded that a liquid metal, which is squeezed out from the casting in between the sand grains, causes the defect. They found that the content of phosphorus and the presence of phosphide eutectic promotes MEP formation. Also, the penetration was supposed to occur at the end of solidification. Later, Dugic and Svensson [4] showed that the penetration took place in the beginning of the eutectic phase formation. More specifically, they used non-welded thermocouples to detect when the liquid metal enters the penetrated zone. Diószegi et al. [5,6] revealed a eutectic composition of penetrated layers between the sand grains by color etching, however the original composition of the cast iron was a standard hypoeutectic alloy. This was the first observation considering the effect of the primary austenite grains on the flow path.
Coarsening is a morphological change of the solid phase existing in contact with the molten metal, which is known in the literature as the Oswald ripening process [12,13,14,15]. The austenite dendrite in cast iron is a solid phase which suffers from morphological changes. This is due to its large interfacial area, which is not in thermodynamic equilibrium. A continuous solution and dissolution process at the solid-liquid interface tend to reduce the interfacial area towards a thermodynamic equilibrium. The isothermal coarsening of the austenite dendrite has recently been investigated by Hernando et al. [16,17,18] based on the Secondary Dendrite Arm Spacing (SDAS) and the Modulus of the Intradendritic Space (MIS), also named the Hydraulic diameter between the dendrite arms, as the morphological parameters. The investigation revealed a series of morphological changes starting with dendrite coarsening, continuing with dendrite fragmentation, then a coalescence of the fragmented particles. Lora et al. [19] reported coarsening of primary austenite under the solidification process, which is also called a dynamic coarsening. The morphological changes under dynamic conditions were similar to the observed changes under isothermal conditions in both cases, and the results were strictly dependent on the local solidification time. A common feature for Hernando’s [16,17,18] and Lora’s [19] experiments was the cylindrical shape of the sample (Ø 50 mm, height 100 mm), which causes a compact axisymmetric thermal field and an even distribution of the morphological parameters in the geometry investigated.
The scope of the present paper is to investigate the morphological variation in complex-shaped casting geometries, which tend to promote SP and MEP defects. Previously presented investigations [16,17,18,19] under isothermal conditions or dynamic conditions in compact geometries combined thermal measurements using thermocouples with results from morphological investigations. In the case of complex shaped castings like cylinder heads or cylinder blocks, the use of thermocouples to characterize the thermal field and to record the local solidification time is practically not recommended. The application of numerous thermocouples next to each other would disturb the local solidification time and the measurement. In this investigation, the local solidification times were calculated by numerical simulation.
2. Materials and Methods
The casting of the samples was performed under industrial conditions. The melt was prepared in an induction furnace and treated according to the current production procedure. The casting temperature was 1448 ± 5 °C. The material of the cast alloys was hypoeutectic lamellar graphite iron, the chemical compositions are shown in Table 1.
In both cases, the mold material was an Epoxi-SO2 hardened quartz sand.
2.1. Shrinkage Porosity (SP)
The sample named “SP sample” combines simple geometrical domains as cylinders and plates to create a thermal condition comparable to that in a complex shaped cylinder head (Figure 1a) [8]. The bottom plate (20 mm) and the top plate (10 mm) connected with three cylinders (Ø 40 mm) and a vertical plate (15 mm) parallel to the cylinders. The distance between the vertical plate and the cylinders is 7 mm.
The chosen geometry was demonstrated to be prone to form shrinkage porosities reported in [8] similar to porosities found in real cylinder head castings [7]. For the microstructure investigation, the SP sample was cut to half on the A-A plane, as it is indicated by the dashed line in Figure 1a. The micrographs were taken on the A-A plane from the lower part of the middle cylindrical domain. The positions of the micrographs are indicated by the thick frames in Figure 1b. Frames coincident with micrographs containing defects are also highlighted with a cross.
2.2. Metal Expansion Penetration (MEP)
The sample named “MEP sample” combines simple cylindrical domains to create a thermal condition and a concave casting surface that are comparable with those in a complex shaped cylinder head (Figure 2a).
The cylindrical casting (Ø 80 mm, height 80 mm) includes an internal channel (Ø 30 mm) ending in a concave casting surface (R 15 mm).
This geometry was demonstrated in the literature [5,6] to be prone to form metal expansion penetration identical to those found in castings used in industrial applications. For the microstructure investigation, the MEP sample was cut to half along the A-A plane, as indicated by the dashed line in Figure 2a. The MEP sample is rotational-symmetric and the MEP defects appeared evenly distributed in connection to the internal concave casting surface. The microstructure investigation was made along the A-A plane. The positions of the micrographs are indicated by thick frames in Figure 2b. Frames coincident with micrographs containing defects are also highlighted with a cross.
2.3. Microstructure Investigation
Surfaces of both samples were color etched at elevated temperature with an etchant solution that contains 200 mL of distilled water, 160 g of KOH, 40 g of NaOH and 40 g of picric acid [20]. The 108 °C temperature of the etchant was maintained with ±3% accuracy by a thermistor controlled heating system. The color distribution for the picric-acid based etching is strictly dependent on the silicon segregation pattern [21]. A positive segregation value of Si (k > 1) causes a well distinguishable picture of the primary austenite, only in locations where the primary network is not superimposed on the eutectic colony. Consequently, it is necessary to consider the equal distribution of the primary austenite in the casting domain.
A total of 74 micrographs were taken from the color-etched surface of the samples. The morphology of the primary austenite is difficult to identify by the image analysis software, so the micrographs were pre-processed by hand on a touch sensitive display. These images are used as input for the image analysis studies.
2.4. Morphologic Parameters
The most general way to describe the correlation between the morphology of the primary dendrite and the local solidification time tsol is to measure the distance between the secondary arms of the dendrite, the secondary dendrite arm spacing (SDAS) λ2. In a previous work [22], the time dependence of λ2 is described as
The more advanced way to describe this correlation uses stereological approach in the characterization of the primary dendrite morphology. Diószegi et al. [23] introduced the hydraulic diameter for the description of the intradendritic phase. Their concept demonstrated that the primary austenite dendrites and the intradendritic phase have a common boundary. Consequently, the perimeter of the primary austenite dendrites equals to the perimeter of the intradendritic phase, Pi. Then, the hydraulic diameter of the intradendritic phase can be expressed as follows:
where Ai is the surface area of the intradendritic phase. The has a unit of [µm], and expresses the mathematical relation between the volume of the intradendritic phase and its surface area. As it was described in previous studies [15,19,22,23], the hydraulic diameter shows the same cube root dependence with the local solidification time:
Therefore, the SDAS and values will be displayed on a t1/3 scale.
2.5. Numerical Simulation of the Local Solidification Time
Simulation of the local solidification time in the SP and MEP samples were performed using MAGMAsoft© (version 5.1, MAGMA Giessereitechnologie GmbH, Aachen, Germany), which is a commercial simulation code aimed to solve phenomena related to metal casting. The numerical solution in the software used is the Control Volume based Finite Difference Method (FDM-CV), where the control volume is equivalent to the mesh element. The geometry definition of the samples and the mesh element definition was made in the preprocessor of the computer program. The mesh elements were created as equal sized cells distributed over the whole geometrical domain. The cross-section size of a mesh cell match with the size of a micrograph what is 2 mm × 2.62 mm. The number of mesh elements are given in the Appendix A.
The mold filling simulation serves to calculate the initial temperature distribution in the calculated domain as input for the start of the solidification simulation. The mold filling calculation is based on the Navier-Stokes equation for three-dimensional fluid flow models [24].
The solution to the heat transport problem in combination with the solidification problems serves to calculate the temperature distribution as a function of time in the whole geometrical domain and the local solidification time in the metallic part of the calculated domain.
The energy equation (Equation (5)), based on the general heat conduction equation incorporate a source term representing the release of latent heat of fusion during solidification.
where ρ is the density, is the heat capacity, x, y and z are the space parameters, k is the thermal conductivity, T is the temperature, and t is the time. The energy equation is valid in the whole calculation domain while the source term is activated only in the metallic domain and only within the solidification interval.
The latent heat released during solidification was defined by using a standard method named in the literature as the “Enthalpy Method” [25]. The amount of released latent heat (J·m−3) at a given fraction solidified phase fS is proportional to the total solidification heat L (J·kg−1) multiplied by the density ρ (kg·m−3).
Furthermore, it is assumed that the energy rate per volume unit is released at a certain time according to:
Then, Equation (7) may be rewritten in the following form:
and introduced as the last term on the right-hand side of the energy equation.
A rearrangement of the equation by transforming the term for heat release during solidification to the left side together with the enthalpy term of the equation gives:
The term of is an experimentally defined relation expressing the transformation of the solid phase from liquid to solid state. Since the derivative of fraction solid versus the temperature is negative in the solidification interval the latent heat released will be added to the term.
Solving the energy equation by the FDM-CV method will result in the temperature variation as a function of space and time. The temperature variation as a function of time is considered in the geometrical centrum point of the control volume. The local solidification time is defined as the time calculated to decrease the temperature in each metallic control volume from the liquidus to the solidification temperature. The used thermal data for the numerical calculation are given in the Appendix A.
3. Results and Discussion
3.1. Shrinkage Porosity (SP)
The casting defects are indicated by black circles on the polished SP sample (Figure 3a).
Figure 3b is a color etched micrograph, corresponding to the area signed with the white rectangle 1 in Figure 3a. The SP (indicated by arrows) is formed in connection to the casting surface and incorporates primary austenite dendrites (Figure 3b). The observed shrinkage porosities in the present experiment have the same character as the one described in the literature [7,8].
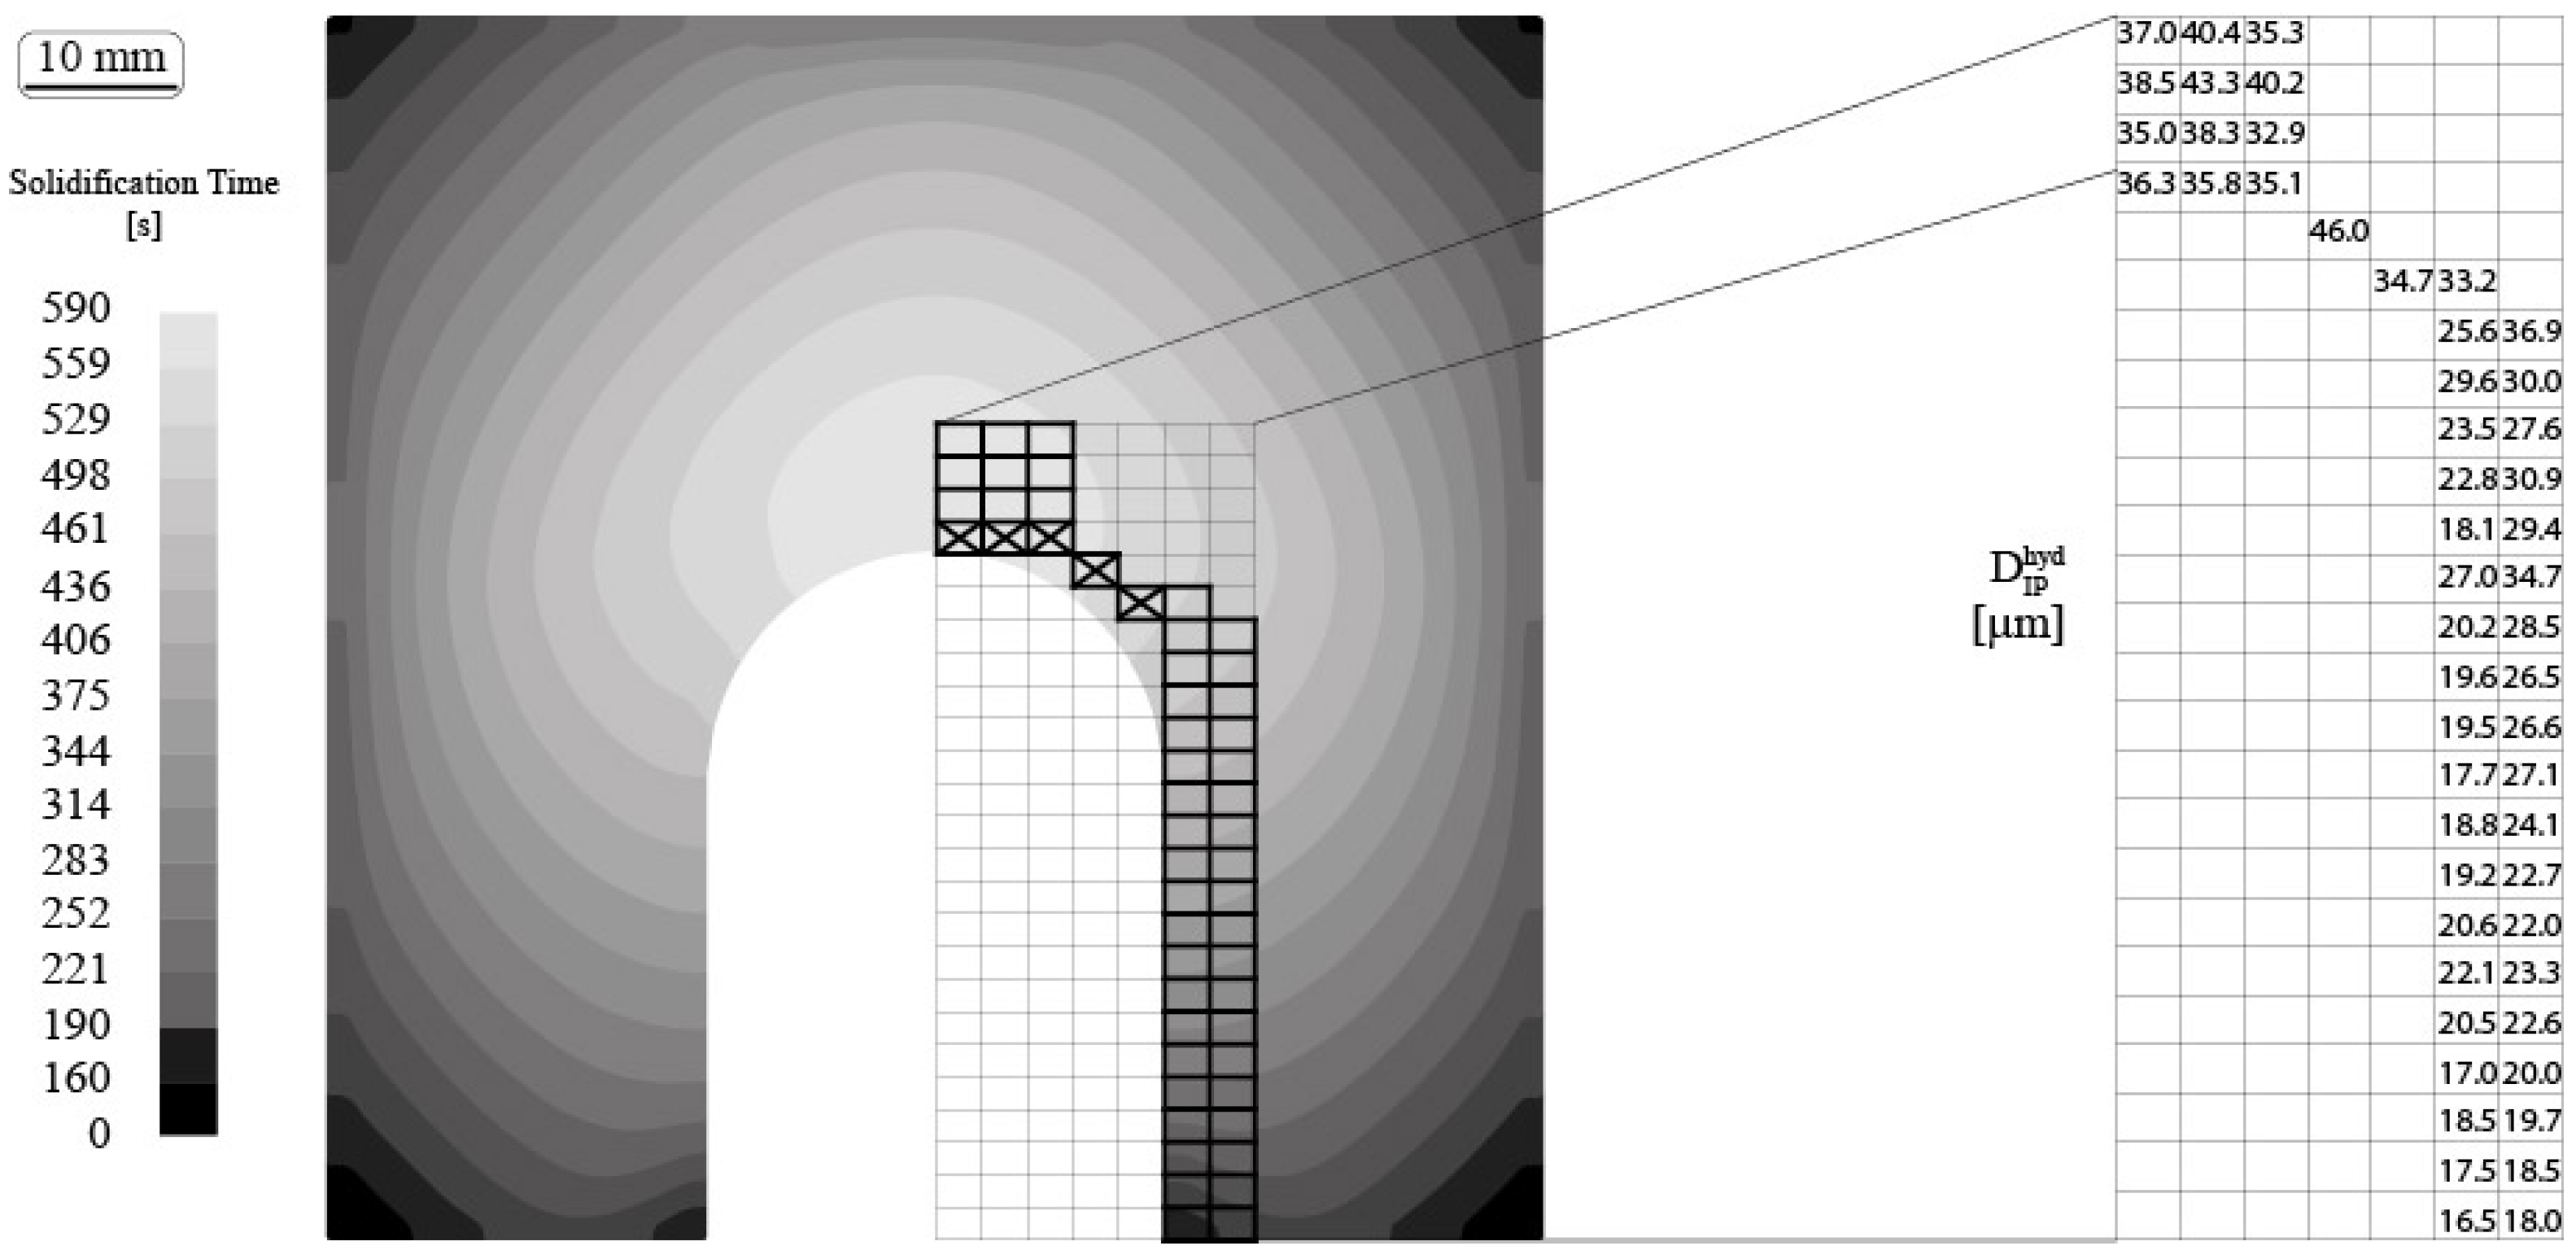
The simulated local solidification time indicates the position of the slowest cooling area at the bottom of the cylindrical component close to the casting surface adjacent to the vertical plate component. This thermal distribution is common in complex shaped casting geometries where shrinkage porosity defects are frequently found. The largest local hydraulic diameters in the SP sample, displayed in the grid (Figure 4) are found in the same positions as the slowest solidification time. A comparison of micrographs collected from positions with different solidification time indicates the morphological differences (see Figure 5 and Figure 6).
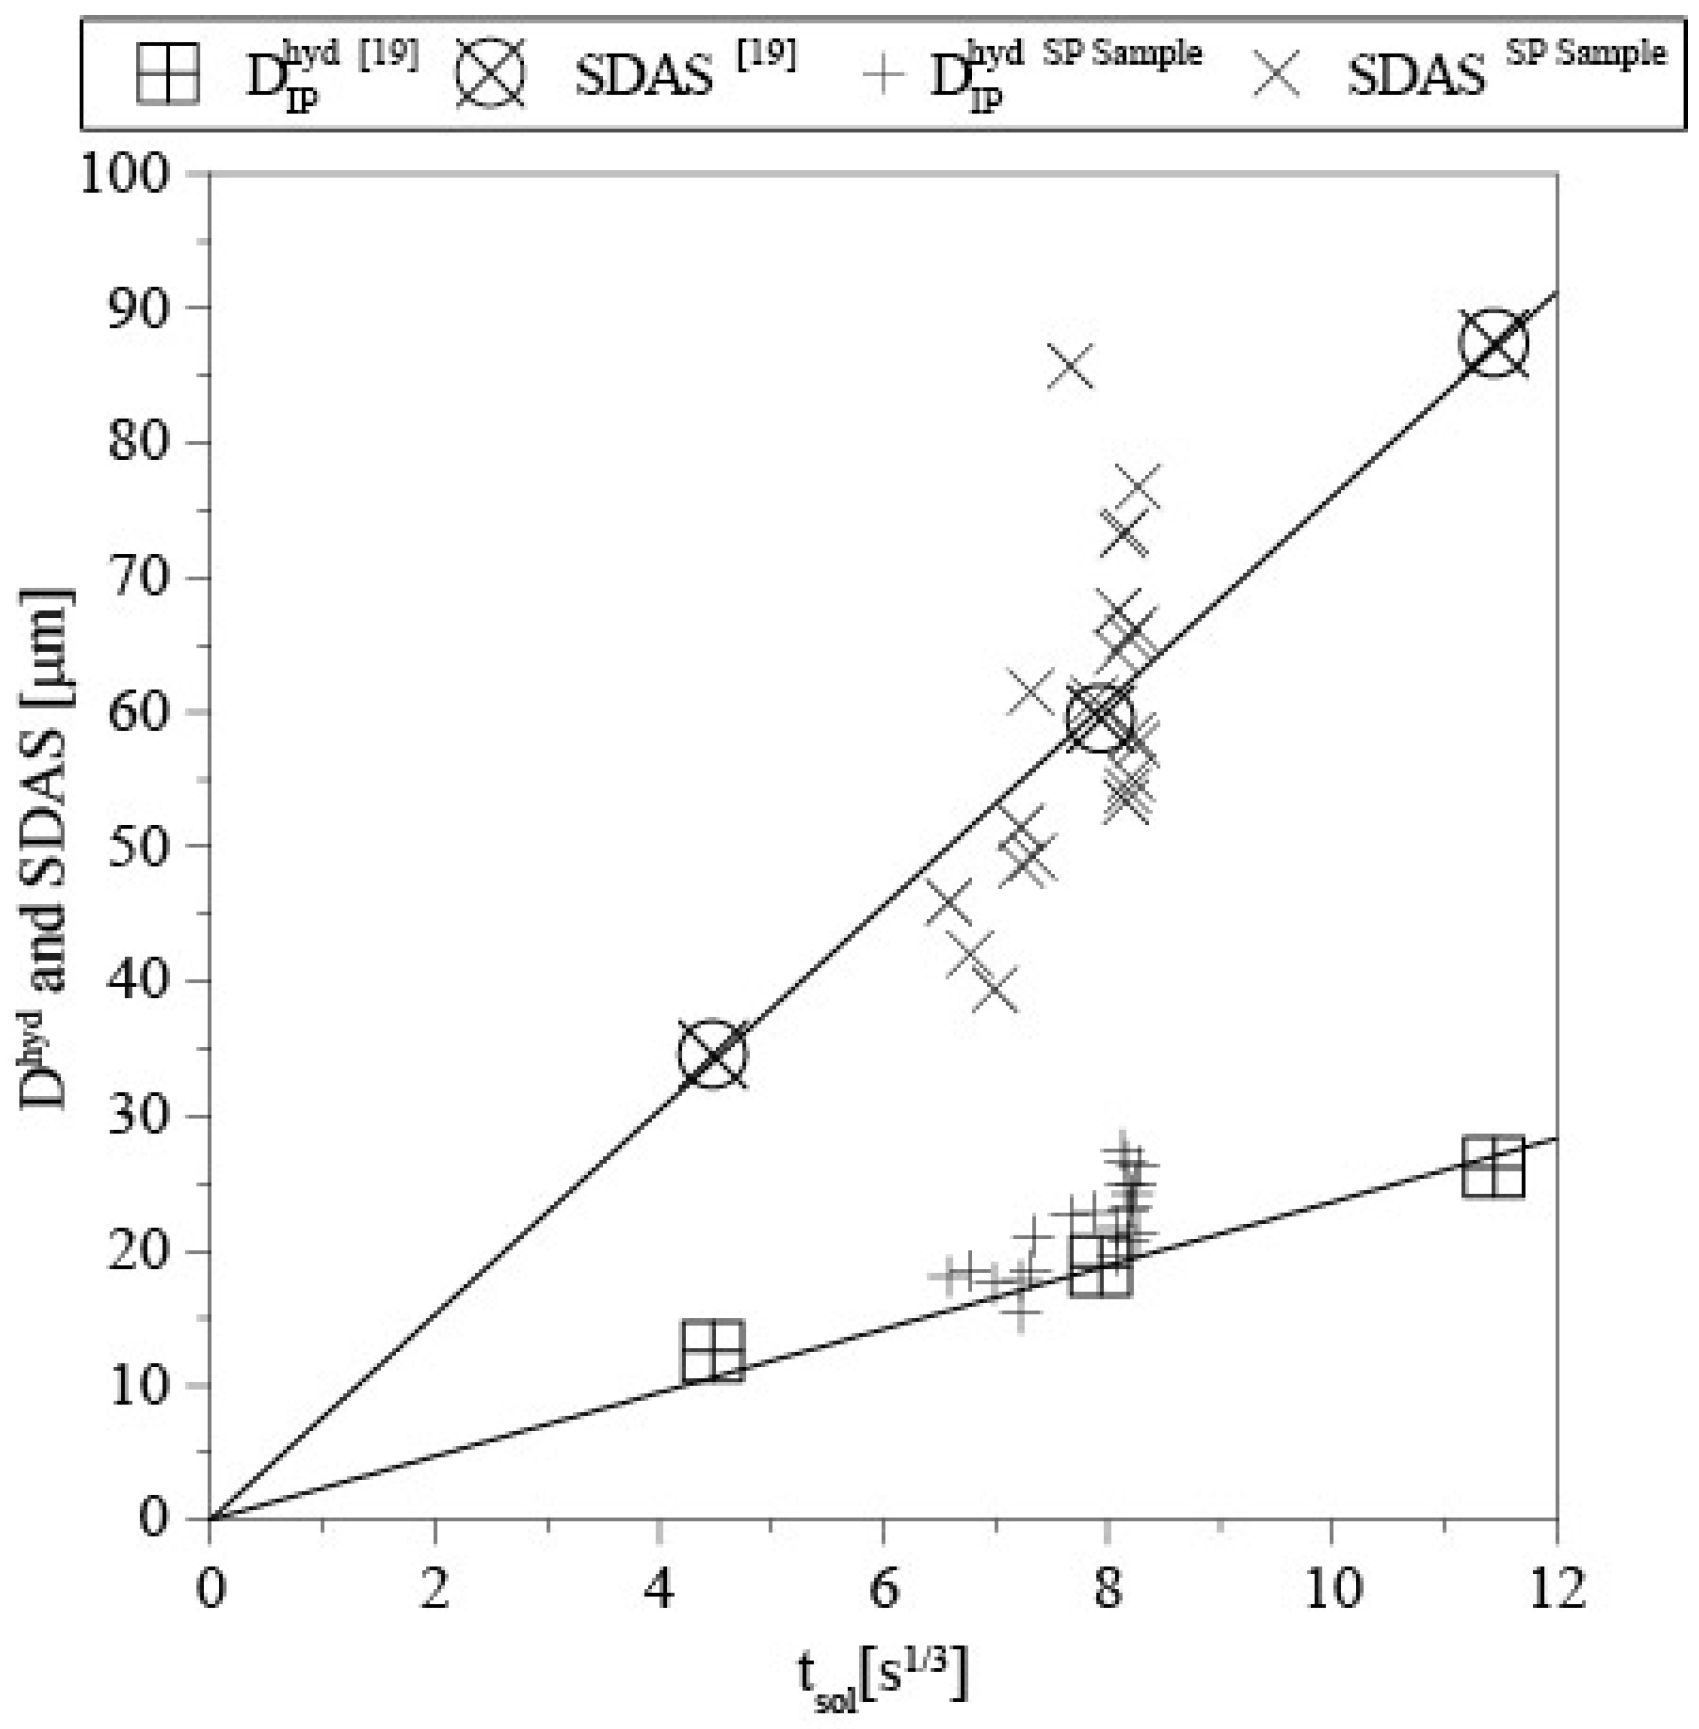
The observations presented are in clear correlation to earlier observations where the morphological parameters such SDAS and hydraulic diameter of the intradendritic space are strictly temperature dependent. The mechanism leading to this correlation also mentioned as dendrite coarsening was studied and reported earlier in compact casting geometries, where the geometrical centrum point was identical with the thermal centrum. The present investigation reports for the first-time observations on dendrite coarsening in a complex casting geometry where the last solidifying area is situated in the metal-mold interface. A comparison between dynamic coarsening of a hypoeutectic lamellar cast iron alloy solidified in a compact geometry and the present alloy solidified in a complex shaped cast geometry are presented in Figure 7. The morphology parameters compared fit well each other, except the SDAS at a long solidification time.
A supposed reason for the higher scattering level of SDAS is connected to the fragmentation phenomena during the coarsening process. The reduction of the observable secondary dendrite arms during the coarsening and the complete re-melting of primary arms leads to situation where the SDAS is not safely measurable anymore.
The consequence of the coarsening process controlling the relation between the local solidification time and the intradendritic space in the complex shaped casting geometry can be interpreted as the natural condition for the mass transport between the dendrite arms. The longer the local solidification time, the larger the intradendritic space will be, as well as the possibility to drain the liquid metal from late solidifying areas to earlier solidified. In the case present investigated, the last solidifying area is situated at the border between casting and mold material. The suggested mechanism of shrinkage porosity formation is then a consequence of the liquid drained from the casting mold border replaced by the gaseous atmosphere from the adjacent molding environment.
3.2. Metal Expansion Penetration (MEP)
The enlargement of the as a result of the coarsening of the primary austenite dendrites in the defected area can be verified also in the case of MEP samples. The MEP defect is indicated by a curved black outline on the polished sample in Figure 8a.
Figure 8b is a color etched micrograph magnified from the area signed with the white rectangle 1 within the indicated defect area of Figure 8a. The red line in Figure 8b represents the original metal-mold interface. The area above the red line shows the bulk microstructure that contain both primary and eutectic phases, as is expected from the hypoeutectic original composition. The area below the red line shows sand particles from the mold which are incorporated between the castings surface and the MEP defect (on the left). The penetrated metal seems to have an eutectic composition, as the primary austenite phase is completely missing from its microstructure.
The simulated local solidification time in the MEP sample is illustrated in Figure 9. The last solidification time is found adjacent to the internal concave casting surface. The largest local hydraulic diameters in the MEP sample are found in the same positions as the slowest solidification time. A comparison of micrographs collected from positions with different solidification time indicate the morphological differences (see Figure 10 and Figure 11).
The observations presented are in clear correlation where the morphological parameters, SDAS and hydraulic diameter of the intradendritic space, are strictly temperature dependent. The morphological differences are even clearer than the ones presented in the previous chapter (SP). Even in the case of the MEP sample the last solidifying areas are situated in the metal-mold interface.
A comparison between dynamic coarsening of a hypoeutectic lamellar cast iron alloy solidified in a compact geometry and the present alloy solidified in a complex shaped cast geometry are presented in Figure 12. The parameters compared fit well between the present experiment and the literature date. Comparing SDAS, the scatter is large, probably based on the fragmentation effect during coarsening.
The consequence of the coarsening process controlling the relationship between the local solidification time and the intradendritic space can be interpreted in a similar way in the MEP sample as in the SP sample, but this time the liquid flow direction between the dendritic network is the inverse of the SP mechanism. The longer the local solidification time, the larger the intradendritic space will be, and the possibility to squeeze excess of liquid metal from fast solidifying areas to late solidified areas increases. Excess of liquid metal in the intradendritic area can result from the eutectic transformation where graphite precipitated.
The suggested mechanism of metal expansion penetration is then a consequence of the squeezing process from fast solidifying areas toward slow solidifying areas. The intradendritic liquid segregated to a eutectic composition penetrates the voids between the sand grains.
4. Conclusions
Microstructure analyses have been successfully applied in castings defects investigation. The experimental results show that defects appeared as SP and MEP formations in complex shaped castings in lamellar graphite iron alloys. Also, numerical simulations were performed to predict the local solidification times. The main findings from the study can be concluded as follows:
- (1)
- The coarsening phenomena was observed in two different complex shaped castings.
- (2)
- The local solidification time influences the austenite morphology in complex shaped castings, which is in agreement with previous observations in compact shaped cylindrical castings.
- (3)
- A variation in local solidification time within the same complex shaped casting leads to the formation of a morphological gradient, which can be considered as the transport path for the intradendritic liquid in forming a shrinkage porosity defect or a metal expansion penetration defect.
- (4)
- The morphological parameter observations in complex shaped casting are disturbed due to morphological changes like a dendrite fragmentation and coalescence.
Acknowledgments
The present work is a part of the research project JÄRNKOLL within the Casting Innovation Centre, financed by the Swedish Knowledge Foundation. Cooperating parties in the project are Jönköping University, Swerea SWECAST AB, Scania CV AB and Volvo Powertrain AB. Participating persons from these institutions/companies are acknowledged.
Author Contributions
Péter Svidró prepared the samples, performed the image analysis and the numerical simulation, analyzed the data and wrote the major part of the paper; Attila Diószegi conceived and designed the experiment; Attila Diószegi, Mohsen Saffari Pour and Pär Jönsson wrote minor part of the paper.
Conflicts of Interest
The authors declare no conflict of interest.
Appendix A
Thermal properties used in the solidification simulation are:
- Alloy
- Material: GJL-150
Heat capacity CP, fraction solid fs, thermal conductivity k and density ρ as a function of Temperature.

Table A1.
Material properties for the alloy in the numerical simulation.
| Temperature (°C) | CP (J·kg−1 K−1) | fS | k (W·m−1·K−1) | ρ (kg·m−3) |
|---|---|---|---|---|
| 1 | 450 | - | 54.0 | 7100.0 |
| 25 | 467 | - | - | - |
| 100 | 506 | - | 52.5 | 7074.5 |
| 200 | 563 | - | 51.0 | 7049.1 |
| 300 | 621 | - | 50.0 | 7023.8 |
| 400 | 663 | - | 49.0 | 6998.6 |
| 500 | 741 | - | 48.5 | - |
| 600 | 851 | - | - | - |
| 700 | 1036 | - | - | - |
| 725 | 1100 | - | - | - |
| 810 | 744 | - | - | - |
| 900 | 774 | - | - | - |
| 1000 | 804 | - | - | 6850.6 |
| 1100 | 830 | - | - | - |
| 1160 | 844 | 1.000 | 40.0 | 6814.0 |
| 1161 | - | 0.830 | - | - |
| 1162 | - | 0.530 | - | - |
| 1163 | - | 0.180 | - | - |
| 1164 | - | 0.040 | - | - |
| 1166 | - | 0.030 | - | - |
| 1168 | - | 0.020 | - | - |
| 1170 | - | 0.010 | - | - |
| 1173 | 740 | 0.000 | 38.0 | 6882.0 |
| 1200 | 747 | - | - | - |
| 1255 | - | - | - | 6813.9 |
| 1300 | 778 | - | - | - |
| 1355 | - | - | - | 6745.3 |
| 1400 | 813 | - | - | - |
| 1500 | 854 | - | - | - |
| 1600 | 871 | - | - | - |
| 1700 | 872 | - | - | - |
| 2000 | 872 | - | 38.0 | 6310.2 |
L = 230 kJ·kg−1, Tinit = 1448 °C, Tliquidus = 1173 °C, Tsolidus = 1160 °C.
Mold
Material: Furan-mold
Heat capacity CP, density ρ and thermal conductivity k as a function of Temperature:
Table A2.
Material properties for the mold in the numerical simulation.
| Temperature (°C) | CP (J·kg−1·K−1) | ρ (kg·m−3) | k (W·m−1·K−1) |
|---|---|---|---|
| 1 | 700 | 1500.0 | 0.91 |
| 20 | - | - | 0.90 |
| 25 | 741 | - | - |
| 50 | - | - | 0.87 |
| 99 | 850 | - | - |
| 100 | 850 | 1495.0 | 0.82 |
| 101 | 850 | - | - |
| 127 | 886 | - | - |
| 150 | - | - | 0.79 |
| 200 | - | 1493.0 | 0.77 |
| 227 | 991 | - | - |
| 250 | - | - | 0.76 |
| 300 | - | 1490.0 | 0.74 |
| 326 | 1082 | - | - |
| 327 | 1082 | - | - |
| 400 | - | 1487.0 | 0.70 |
| 427 | 1167 | - | - |
| 500 | - | 1478.0 | 0.70 |
| 526 | 1248 | - | - |
| 527 | 1248 | - | - |
| 573 | 1285 | - | - |
| 574 | 1160 | - | - |
| 600 | - | 1476.0 | 0.70 |
| 627 | 1162 | - | - |
| 700 | - | - | 0.71 |
| 727 | 1167 | - | - |
| 750 | - | - | 0.73 |
| 800 | - | - | 0.76 |
| 827 | 1172 | - | - |
| 850 | - | - | 0.79 |
| 900 | - | - | 0.83 |
| 927 | 1177 | - | - |
| 950 | - | - | 0.88 |
| 1000 | - | - | 0.93 |
| 1027 | 1181 | - | - |
| 1050 | - | - | 0.99 |
| 1100 | - | - | 1.05 |
| 1127 | 1186 | - | - |
| 1150 | - | - | 1.12 |
| 1200 | 1.20 | ||
| 1227 | 1190 | - | - |
| 1327 | 1194 | - | - |
| 1600 | - | - | 1.40 |
| 2000 | 1250 | 1470.0 | 1.50 |
Tinit = 20 °C
Heat transfer coefficients (HTC) between the alloy and the mold as a function of Temperature are:
Table A3.
HTC values used in the numerical simulation.
| Temperature (°C) | h (W·m−2·K−1) |
|---|---|
| 1 | 300 |
| 600 | 500 |
| 1100 | 600 |
| 1200 | 800 |
| 2000 | 800 |
Mesh parameters and time increment used in the solidification simulation are:
- SP sample: 183520 metal cells out of 2473692 cells
- MEP sample: 34120 metal cells out of 206424 cells
Casting properties are:
Table A4.
Properties of the casting components in the numerical simulation.
| Sample Name | Component Name | Volume (L) | Weight (kg) |
|---|---|---|---|
| SP sample | casting | 1.93 | 13.68 |
| SP sample | mold | 16.59 | 24.87 |
| MEP sample | casting | 0.37 | 2.61 |
| MEP sample | mold | 1.2 | 1.8 |
Simulation conditions are:
Table A5.
Solidification conditions in the numerical simulation.
| Sample Name | Pouring Time (s) | Simulation Time (s) | Δt (s) | Solidification and Cooling |
|---|---|---|---|---|
| SP sample | 10 | 600 | 1 | time dependent |
| MEP sample | 6 | 600 | 1 | time dependent |
Appendix B
Nomenclature
| Capital letters | |
| Ai | Area of the intradendritic phase (m2) |
| Heat capacity (J·kg−1·K−1) | |
| Hydraulic diameter of the intradendritic phase (m) | |
| Hydraulic diameter of the intradendritic space (m) | |
| L | Latent heat of solidification (J·kg−1) |
| Pi | Perimeter of the intradendritic phase (m) |
| Released latent heat (J·m−3) | |
| Released latent heat during solidification (W·m−3) | |
| T | Temperature (°C) |
| Small letter | |
| fS | Fraction solidified metal (-) |
| k | Thermal conductivity (W·m−1·K−1) |
| t | Time (s) |
| tsol | Solidification time (s) |
| Greek letters | |
| ρ | Density (kg·m−3) |
| λ2 | Secondary dendrite arm spacing (μm) |
References
- Modern Casting Staff. 50th Census of World Casting Production. In Modern Casting; American Foundry Society: Schaumburg, IL, USA, 2016; pp. 25–29. [Google Scholar]
- Levelink, H.G.; Julien, F.P. Penetration and shrinkage by interaction of solidifying cast iron and casting mold—Part 1. AFS Cast Met. Res. J. 1973, 9, 56–63. [Google Scholar]
- Levelink, H.G.; Julien, F.P. Penetration and shrinkage by interaction of solidifying cast iron and casting mold—Part 2. AFS Cast Met. Res. J. 1973, 9, 105–109. [Google Scholar]
- Dugic, I.; Svensson, I.L. An investigation of the effect of inoculants on the metal expansion penetration in grey iron. Int. J. Cast Met. Res. 1999, 11, 333–338. [Google Scholar] [CrossRef]
- Diószegi, A.; Dugic, I. The mechanisms of metal expansion penetration in grey cast iron. In Proceedings of the Eight International Symposium on Science and Processing of Cast Iron, Beijing, China, 16–19 October 2006; pp. 92–97. [Google Scholar]
- Diószegi, A.; Dugic, I.; Svensson, I.L. Metal expansion penetration on concave casting surfaces of grey cast iron cylinder heads. AFS Trans. 2007, 115, 609–615. [Google Scholar]
- Elmquist, L.; Adolfsson, S.; Diószegi, A. Characterizing shrinkage porosity in gray cast iron using microstructure investigation. In AFS Transactions; American Foundry Society: Schaumburg, IL, USA, 2008; Volume 116, pp. 691–703. [Google Scholar]
- Elmquist, L.; Diószegi, A. Shrinkage porosity and its relation to solidification structure of grey cast iron parts. Int. J. Cast Met. Res. 2010, 23, 44–50. [Google Scholar] [CrossRef]
- Elmquist, L.; Soivio, K.; Diószegi, A. Cast iron solidification structure and how it is related to defect formation. Mater. Sci. Forum 2014, 790, 441–446. [Google Scholar] [CrossRef]
- Rivera, G.L.; Boeri, R.E.; Sikora, J.A. Solidification of gray cast iron. Scr. Mater. 2004, 50, 331–335. [Google Scholar] [CrossRef]
- Rivera, G.; Calvillo, P.; Boeri, R.; Houbaert, Y.; Sikora, J. Examination of the solidification macrostructure of spheroidal and flake graphite cast irons using DAAS and ESBD. Mater. Charact. 2008, 59, 1342–1348. [Google Scholar] [CrossRef]
- Glicksman, M.E.; Voorhees, P.W. Ostwald Ripening and Relaxation in Dendritic Structures. Metall. Trans. A 1984, 15, 995–1001. [Google Scholar] [CrossRef]
- Voorhees, P.W. The theory of Ostwald ripening. J. Stat. Phys. 1985, 38, 231–252. [Google Scholar] [CrossRef]
- Lacaze, J.; Lesoult, G. Birth, Growth and Ripening of Solidification Structures. Acta Stereol. 1986, 5, 331–336. [Google Scholar]
- Kammer, D.; Voorhees, P.W. The morphological evolution of dendritic microstructures during coarsening. Acta Mater. 2006, 54, 1549–1558. [Google Scholar] [CrossRef]
- Hernando, J.C.; Diószegi, A. An Overview of Isothermal Coarsening in Hypoeutectic Lamellar Cast Iron. In Advances in the Science and Engineering of Casting Solidification: An MPMD Symposium Honoring Doru Michael Stefanescu; Nastac, L., Liu, B., Fredriksson, H., Lacaze, J., Hong, C., Catalina, A.V., Buhrig-Polaczek, A., Monroe, C., Sabau, A.S., Ruxanda, R.E.L., et al., Eds.; Springer International Publishing: Cham, Switzerland, 2016; pp. 295–302. [Google Scholar]
- Hernando, J.C.; Domeij, B.; Diószegi, A. Influence of Ti and Mo additions on the isothermal coarsening process of primary austenite in Lamellar Graphite Iron. In Proceedings of the 5th Decennial International Conference on Solidification Processing, Old Windsor, UK, 25–28 July 2017. [Google Scholar]
- Hernando, J.C.; Ghassemali, E.; Diószegi, A. The Morphological Evolution of Primary Austenite during Isothermal Coarsening. 2017, unpublished work. [Google Scholar]
- Lora, R.; Diószegi, A. Dynamic Coarsening of 3.3C-1.9Si Gray Cast Iron. Metall. Mater. Trans. A 2012, 43, 5165–5172. [Google Scholar] [CrossRef]
- Voort, G.F.V. Color Metallography. In ASM Handbook, Vol. 9: Metallography and Microstructures; ASM International: Materials Park, OH, USA, 2004; pp. 493–512. [Google Scholar]
- Vazehrad, S.; Elfsberg, J.; Diószegi, A. Study of microstructure and silicon segregation in cast iron using color etching and electron microprobe analysis. Mater. Charact. 2015, 104, 132–138. [Google Scholar] [CrossRef]
- Flemings, M.C. Coarsening in Solidification Processing. Mater. Trans. 2005, 46, 895–900. [Google Scholar] [CrossRef]
- Diószegi, A.; Fourlakidis, V.; Lora, R. Austenite Dendrite Morphology in Lamellar Cast Iron. In Proceedings of the SPCI 10, Mar Del Plata, Argentina, 10–13 November 2014. [Google Scholar]
- MAGMASoft Standard Manual; MAGMA Giessereitechnologie GmbH: Aachen, Germany, 2012.
- Hattel, J. Fundamentals of Numerical Modelling of Casting Processes, 1st ed.; Polyteknisk Forlag: Kongens Lyngby, Denmark, 2005. [Google Scholar]
Figure 1.
(a) Isometric view of the shrinkage porosity (SP) sample; (b) Cross-section view of the SP sample.
Figure 1.
(a) Isometric view of the shrinkage porosity (SP) sample; (b) Cross-section view of the SP sample.
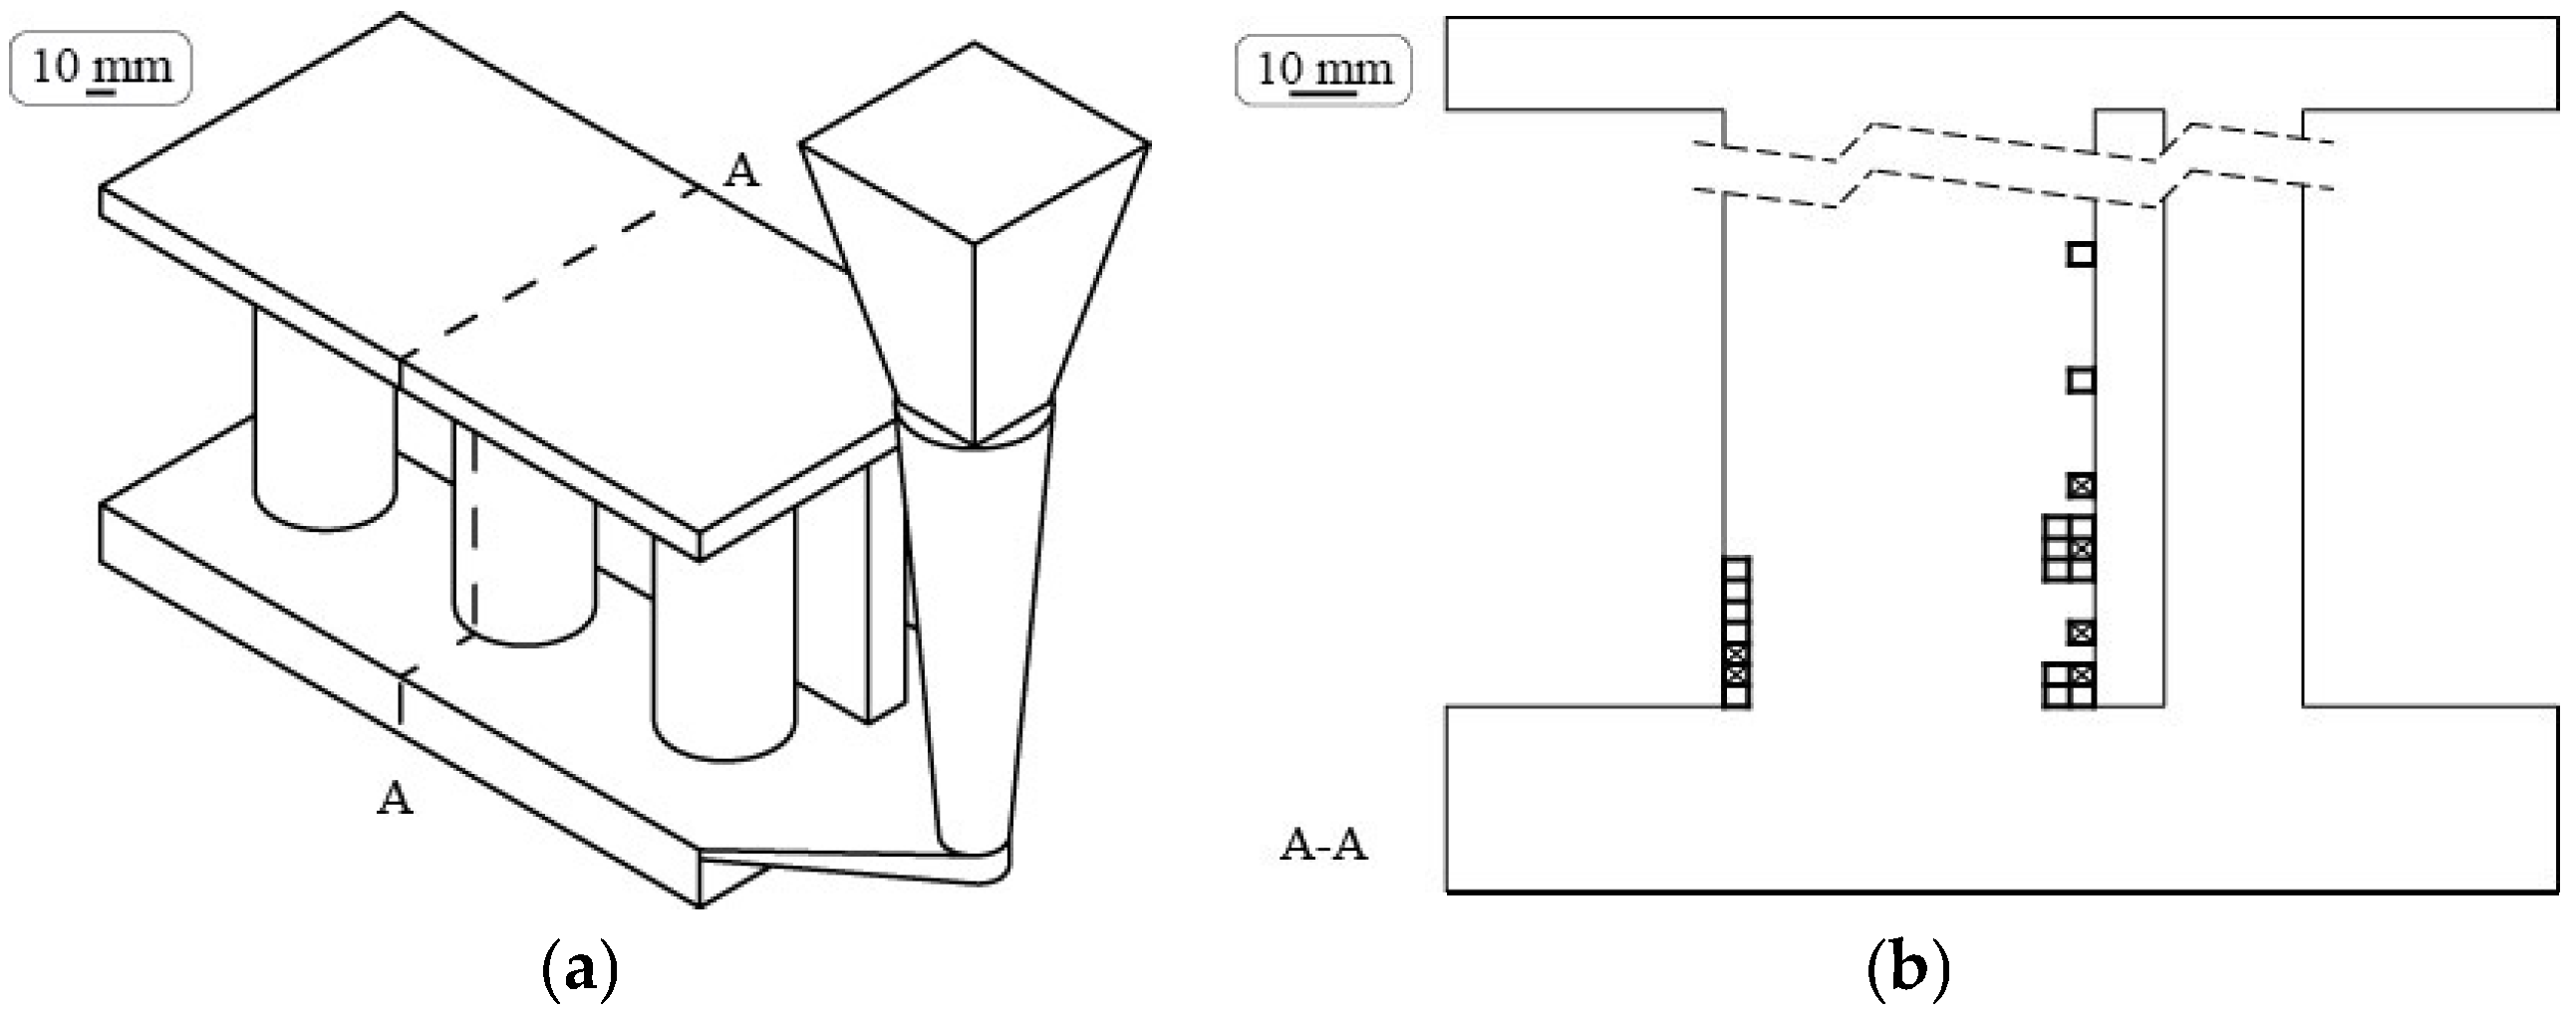
Figure 2.
(a) Isometric view of the metal expansion penetration (MEP) sample; (b) Cross-section view of the MEP sample.
Figure 2.
(a) Isometric view of the metal expansion penetration (MEP) sample; (b) Cross-section view of the MEP sample.

Figure 3.
(a) Polished surface from the SP sample; (b) Color-etched micrograph from the SP sample. Primary austenite appears in dendritic shape with light blue color.
Figure 3.
(a) Polished surface from the SP sample; (b) Color-etched micrograph from the SP sample. Primary austenite appears in dendritic shape with light blue color.
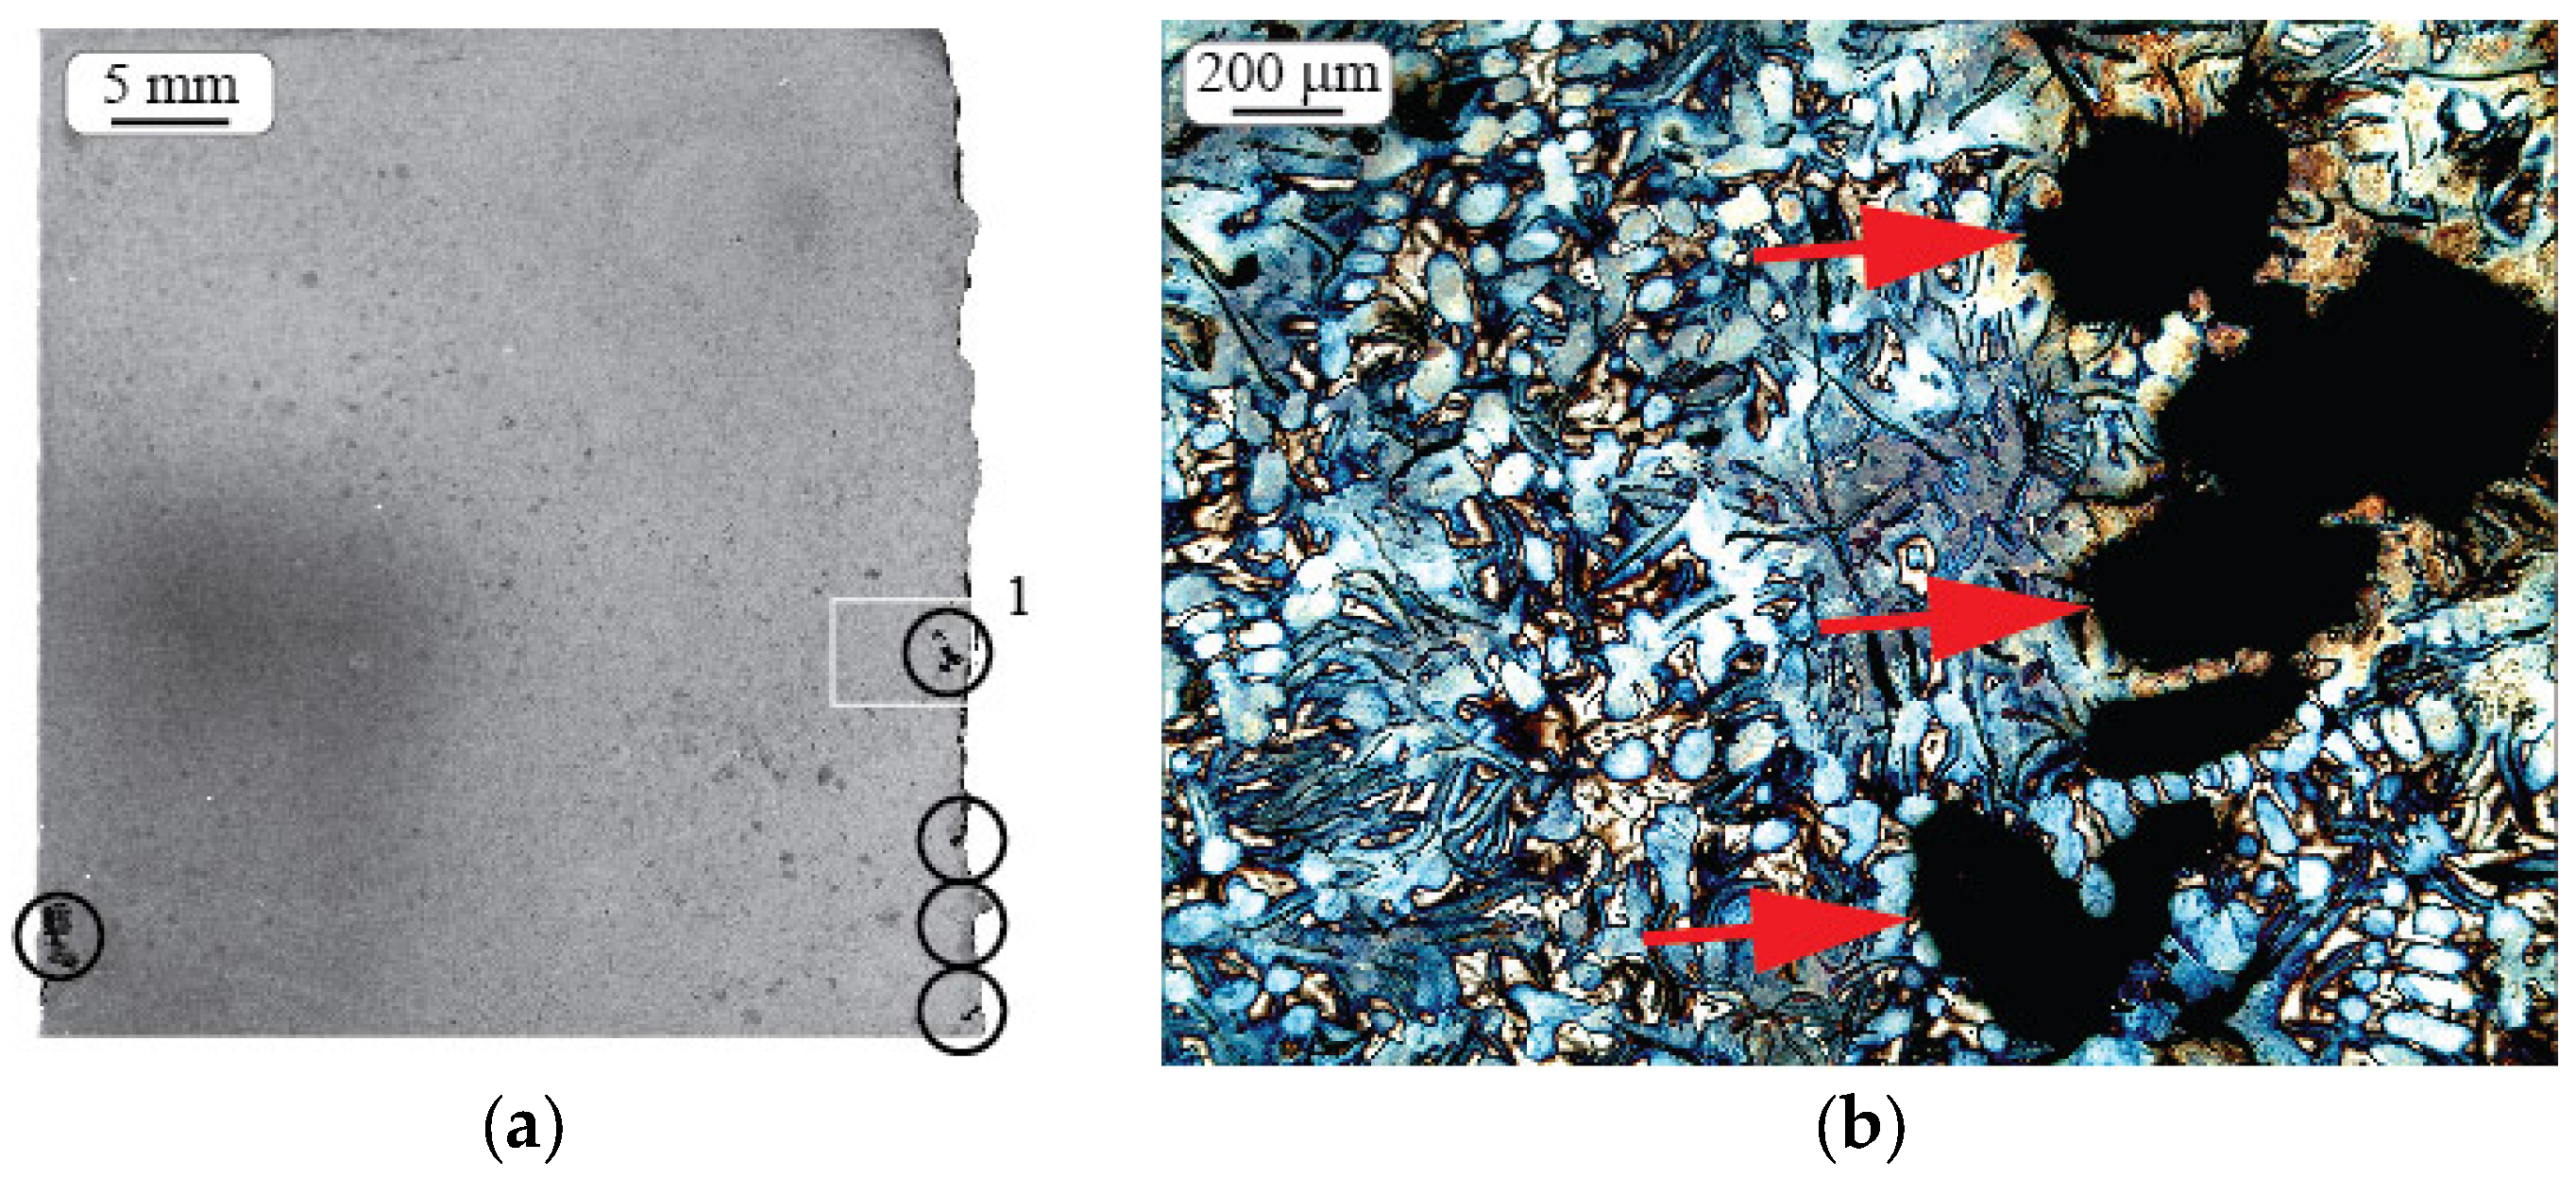
Figure 4.
Simulated local solidification time and the measured hydraulic diameter of the intradendritic phase in the right-hand side grid. The gray color scale plotted on the cross section of the SP sample geometry represents the simulated local solidification time.
Figure 4.
Simulated local solidification time and the measured hydraulic diameter of the intradendritic phase in the right-hand side grid. The gray color scale plotted on the cross section of the SP sample geometry represents the simulated local solidification time.
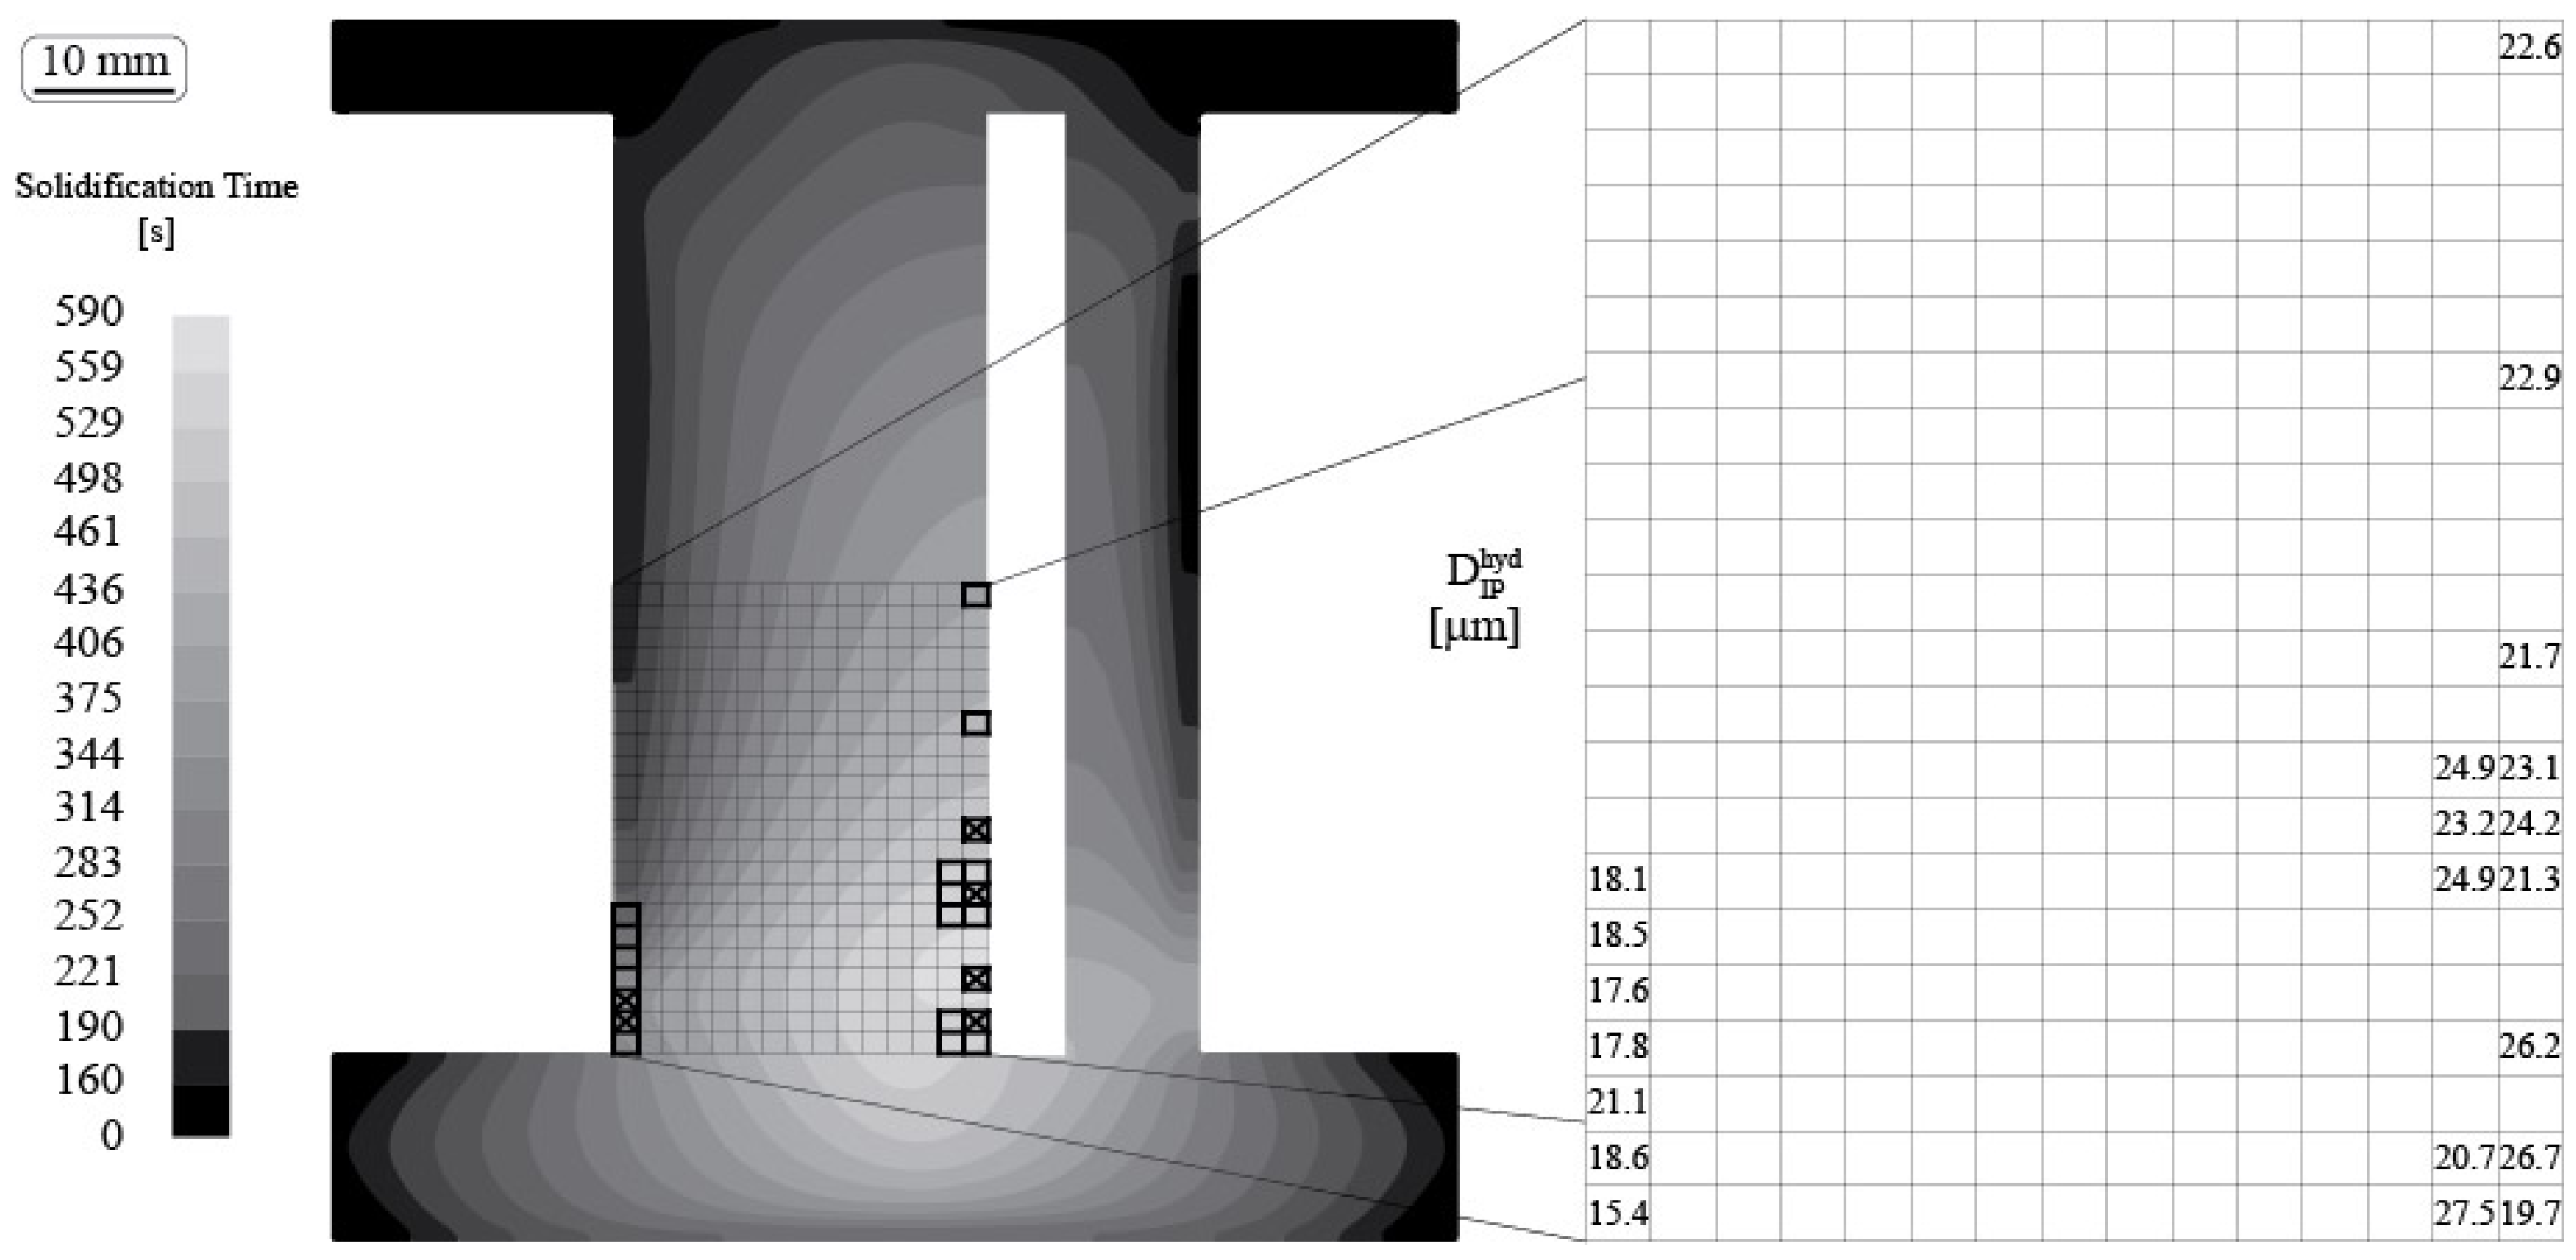
Figure 5.
Micrograph representing a local solidification time of tsol = 377 s, = 17.6 µm and secondary dendrite arm spacing (SDAS) = 51.45 µm. Primary austenite appears in dendritic shape with whitish light blue color.
Figure 5.
Micrograph representing a local solidification time of tsol = 377 s, = 17.6 µm and secondary dendrite arm spacing (SDAS) = 51.45 µm. Primary austenite appears in dendritic shape with whitish light blue color.

Figure 6.
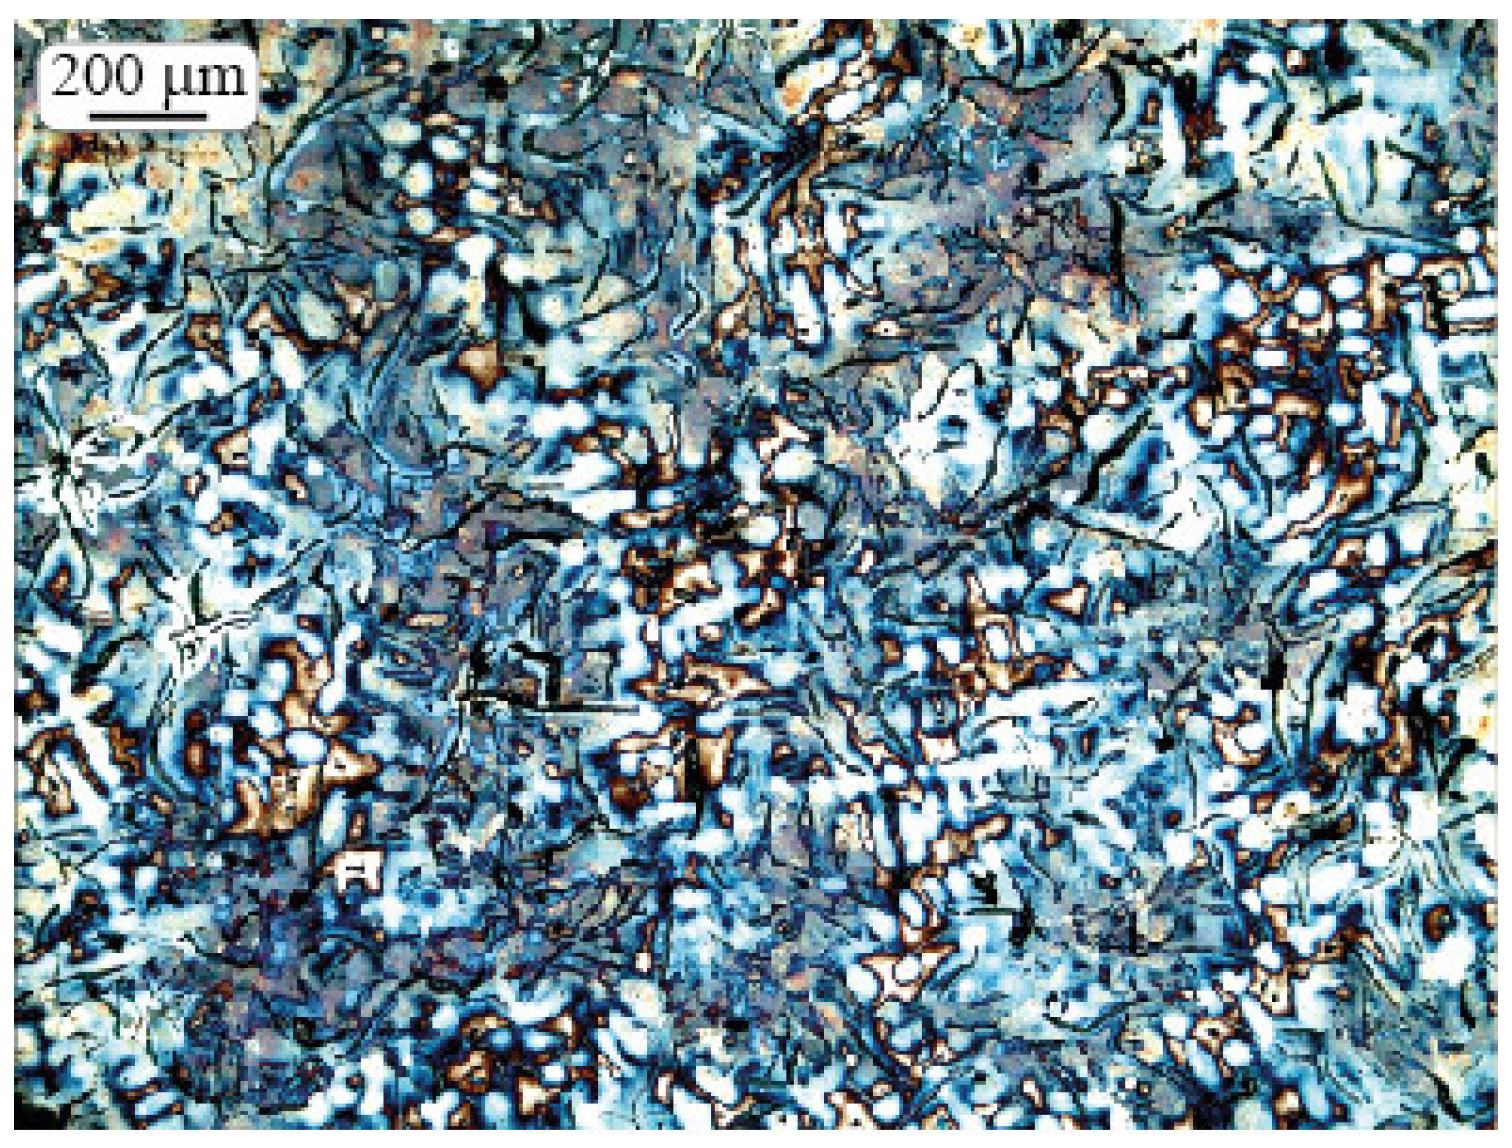
Micrograph representing a local solidification time of tsol = 566 s, = 26.2 µm and SDAS = 76.79 µm. Primary austenite appears in dendritic shape with blue color.
Figure 6.
Micrograph representing a local solidification time of tsol = 566 s, = 26.2 µm and SDAS = 76.79 µm. Primary austenite appears in dendritic shape with blue color.
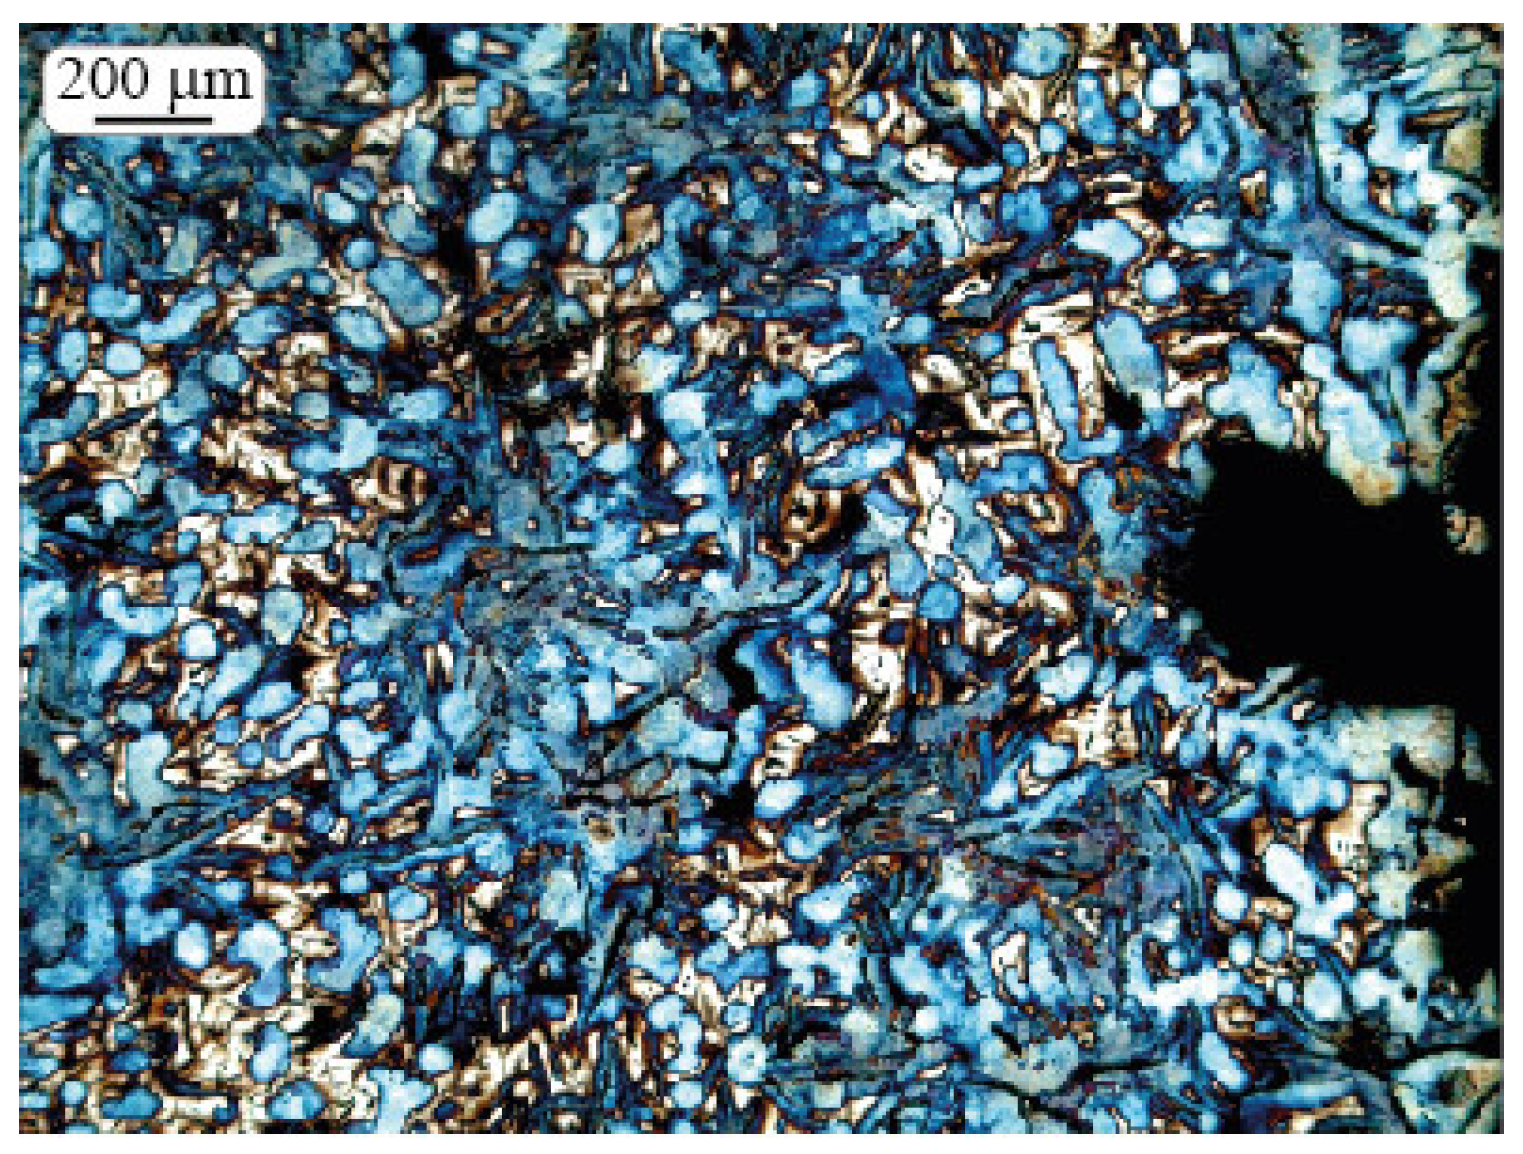
Figure 7.
Comparison of the results with literature data. SDAS and of the intradendritic space plotted as a function of the cube root of the local solidification time.
Figure 7.
Comparison of the results with literature data. SDAS and of the intradendritic space plotted as a function of the cube root of the local solidification time.

Figure 8.
(a) Polished surface of the MEP sample; (b) Color-etched micrograph from the MEP sample. Primary austenite appears in dendritic shape with brownish blue color above the red line.
Figure 8.
(a) Polished surface of the MEP sample; (b) Color-etched micrograph from the MEP sample. Primary austenite appears in dendritic shape with brownish blue color above the red line.
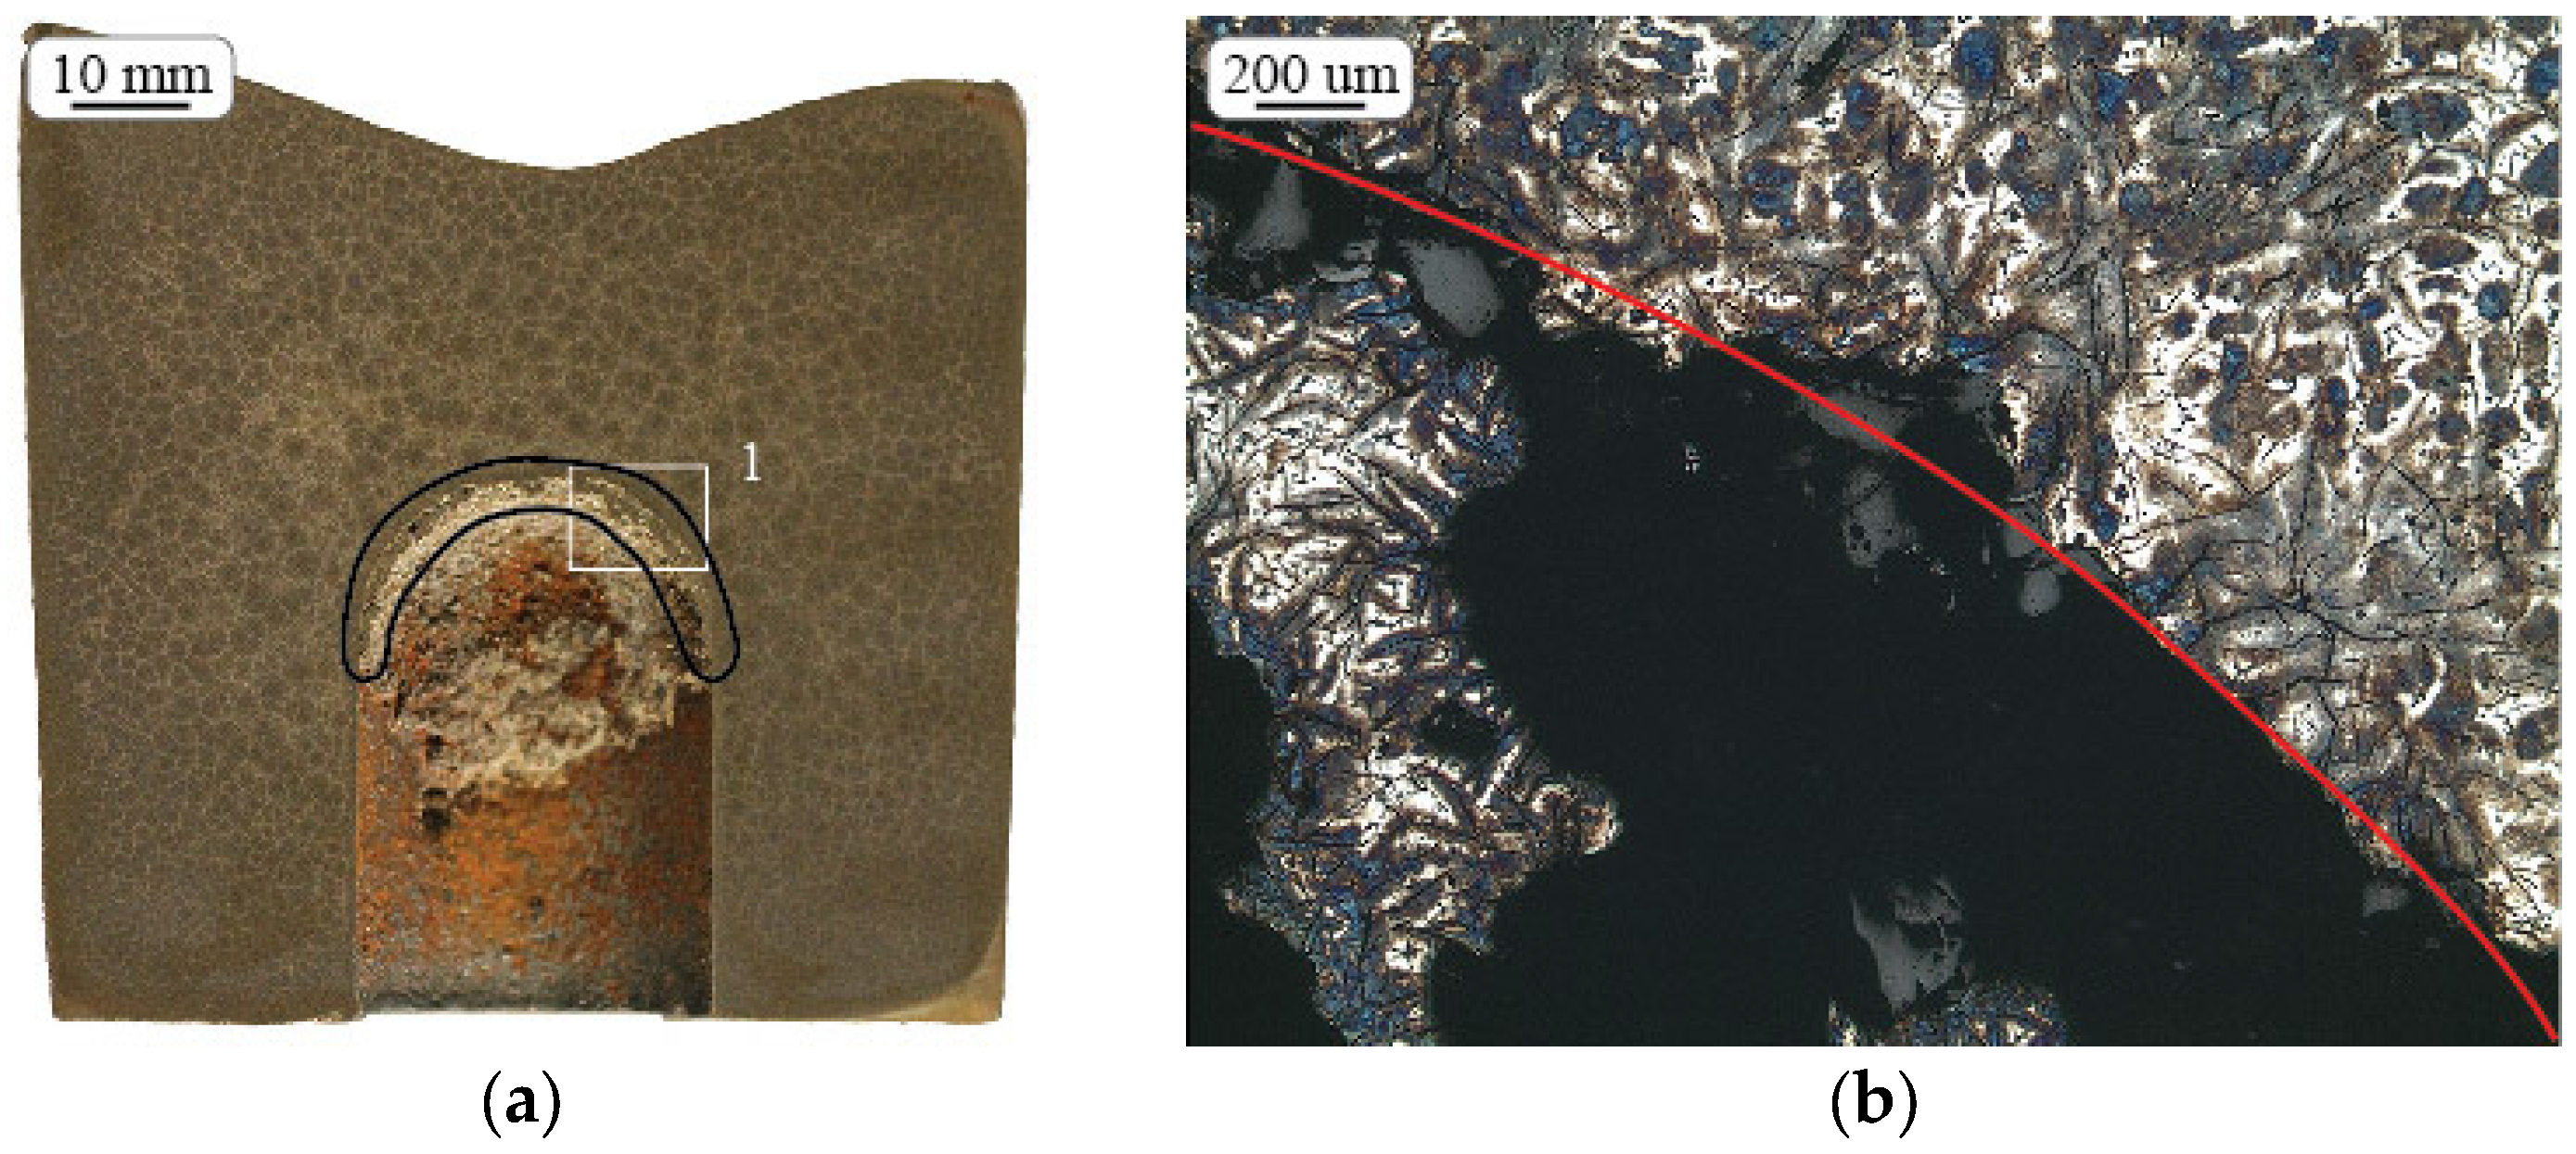
Figure 9.
Simulated local solidification time and the measured hydraulic diameter of the intradendritic phase in the right-hand side grid. The gray color scale plotted on the cross section of the MEP sample geometry represents the simulated local solidification time.
Figure 9.
Simulated local solidification time and the measured hydraulic diameter of the intradendritic phase in the right-hand side grid. The gray color scale plotted on the cross section of the MEP sample geometry represents the simulated local solidification time.

Figure 10.
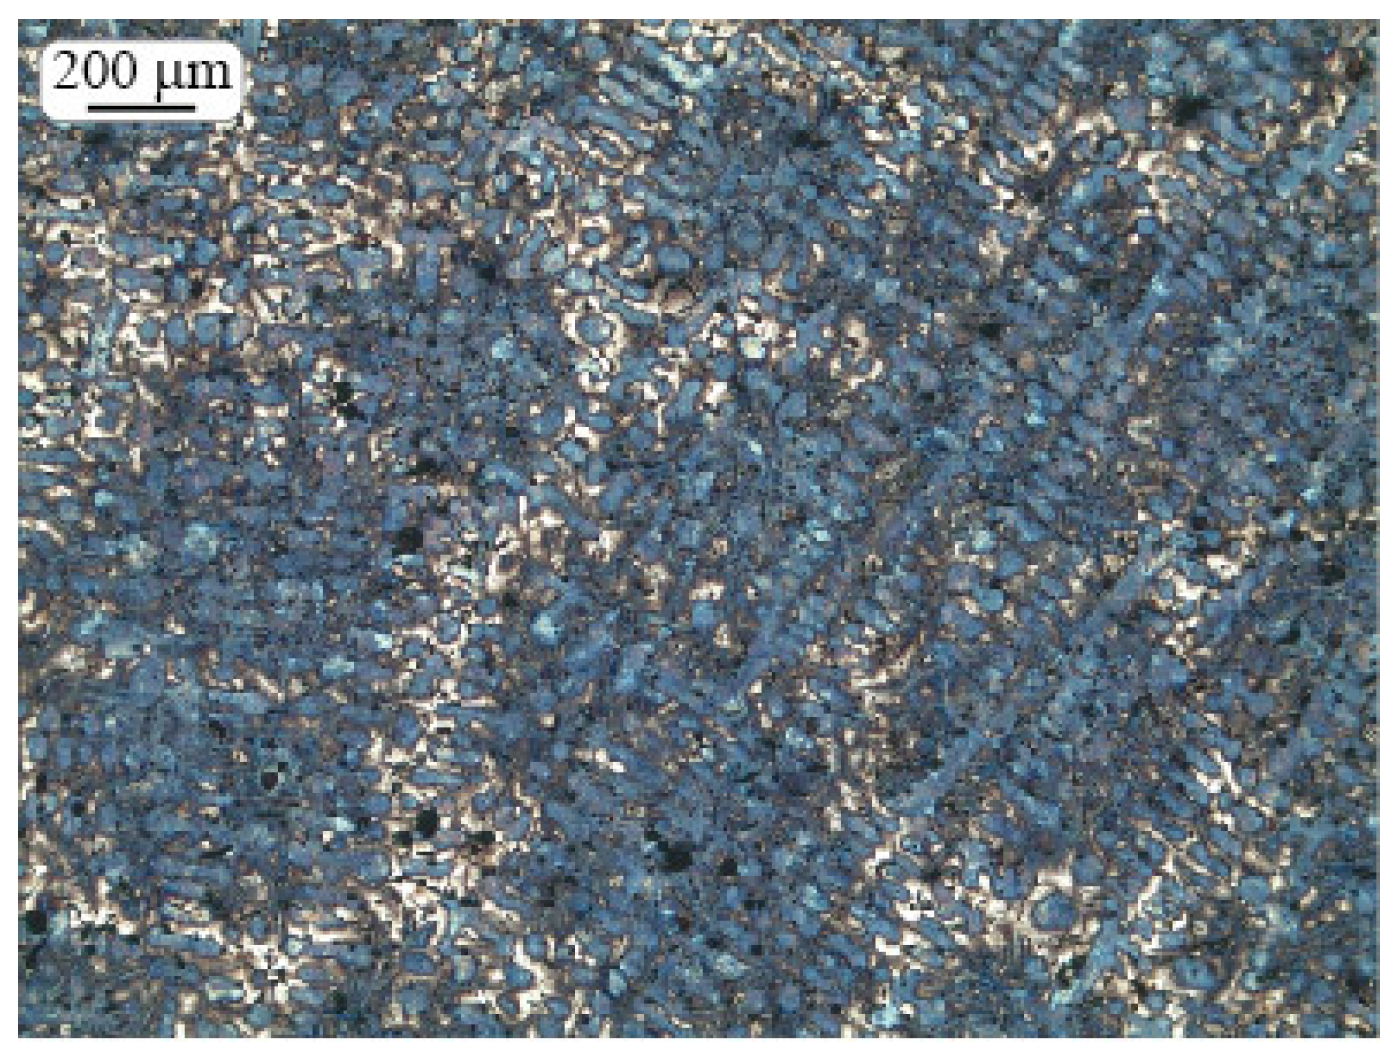
Micrograph representing a local solidification time of tsol = 220 s, = 18.5 µm and SDAS = 30.36 µm. Primary austenite appears in dendritic shape with blue color.
Figure 10.
Micrograph representing a local solidification time of tsol = 220 s, = 18.5 µm and SDAS = 30.36 µm. Primary austenite appears in dendritic shape with blue color.

Figure 11.
Micrograph representing a local solidification time of tsol = 570 s, = 35 µm and SDAS = 59.67 µm. Primary austenite appears in dendritic shape with brownish blue color.
Figure 11.
Micrograph representing a local solidification time of tsol = 570 s, = 35 µm and SDAS = 59.67 µm. Primary austenite appears in dendritic shape with brownish blue color.
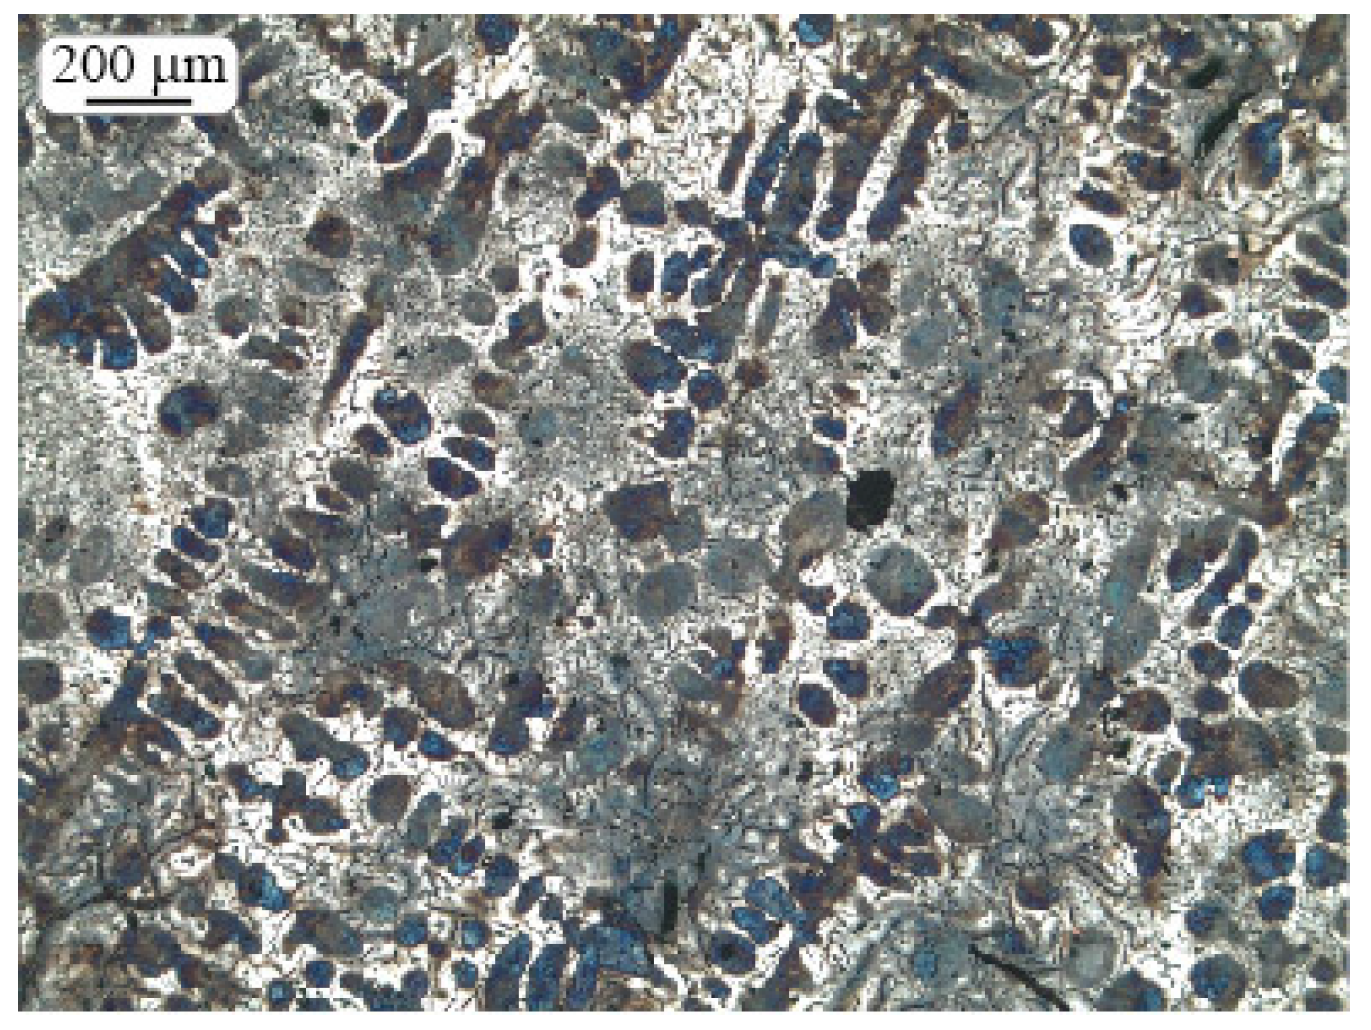
Figure 12.
Comparison of the results with literature data. SDAS and of the intradendritic space plotted as a function of the cube root of the local solidification time.
Figure 12.
Comparison of the results with literature data. SDAS and of the intradendritic space plotted as a function of the cube root of the local solidification time.
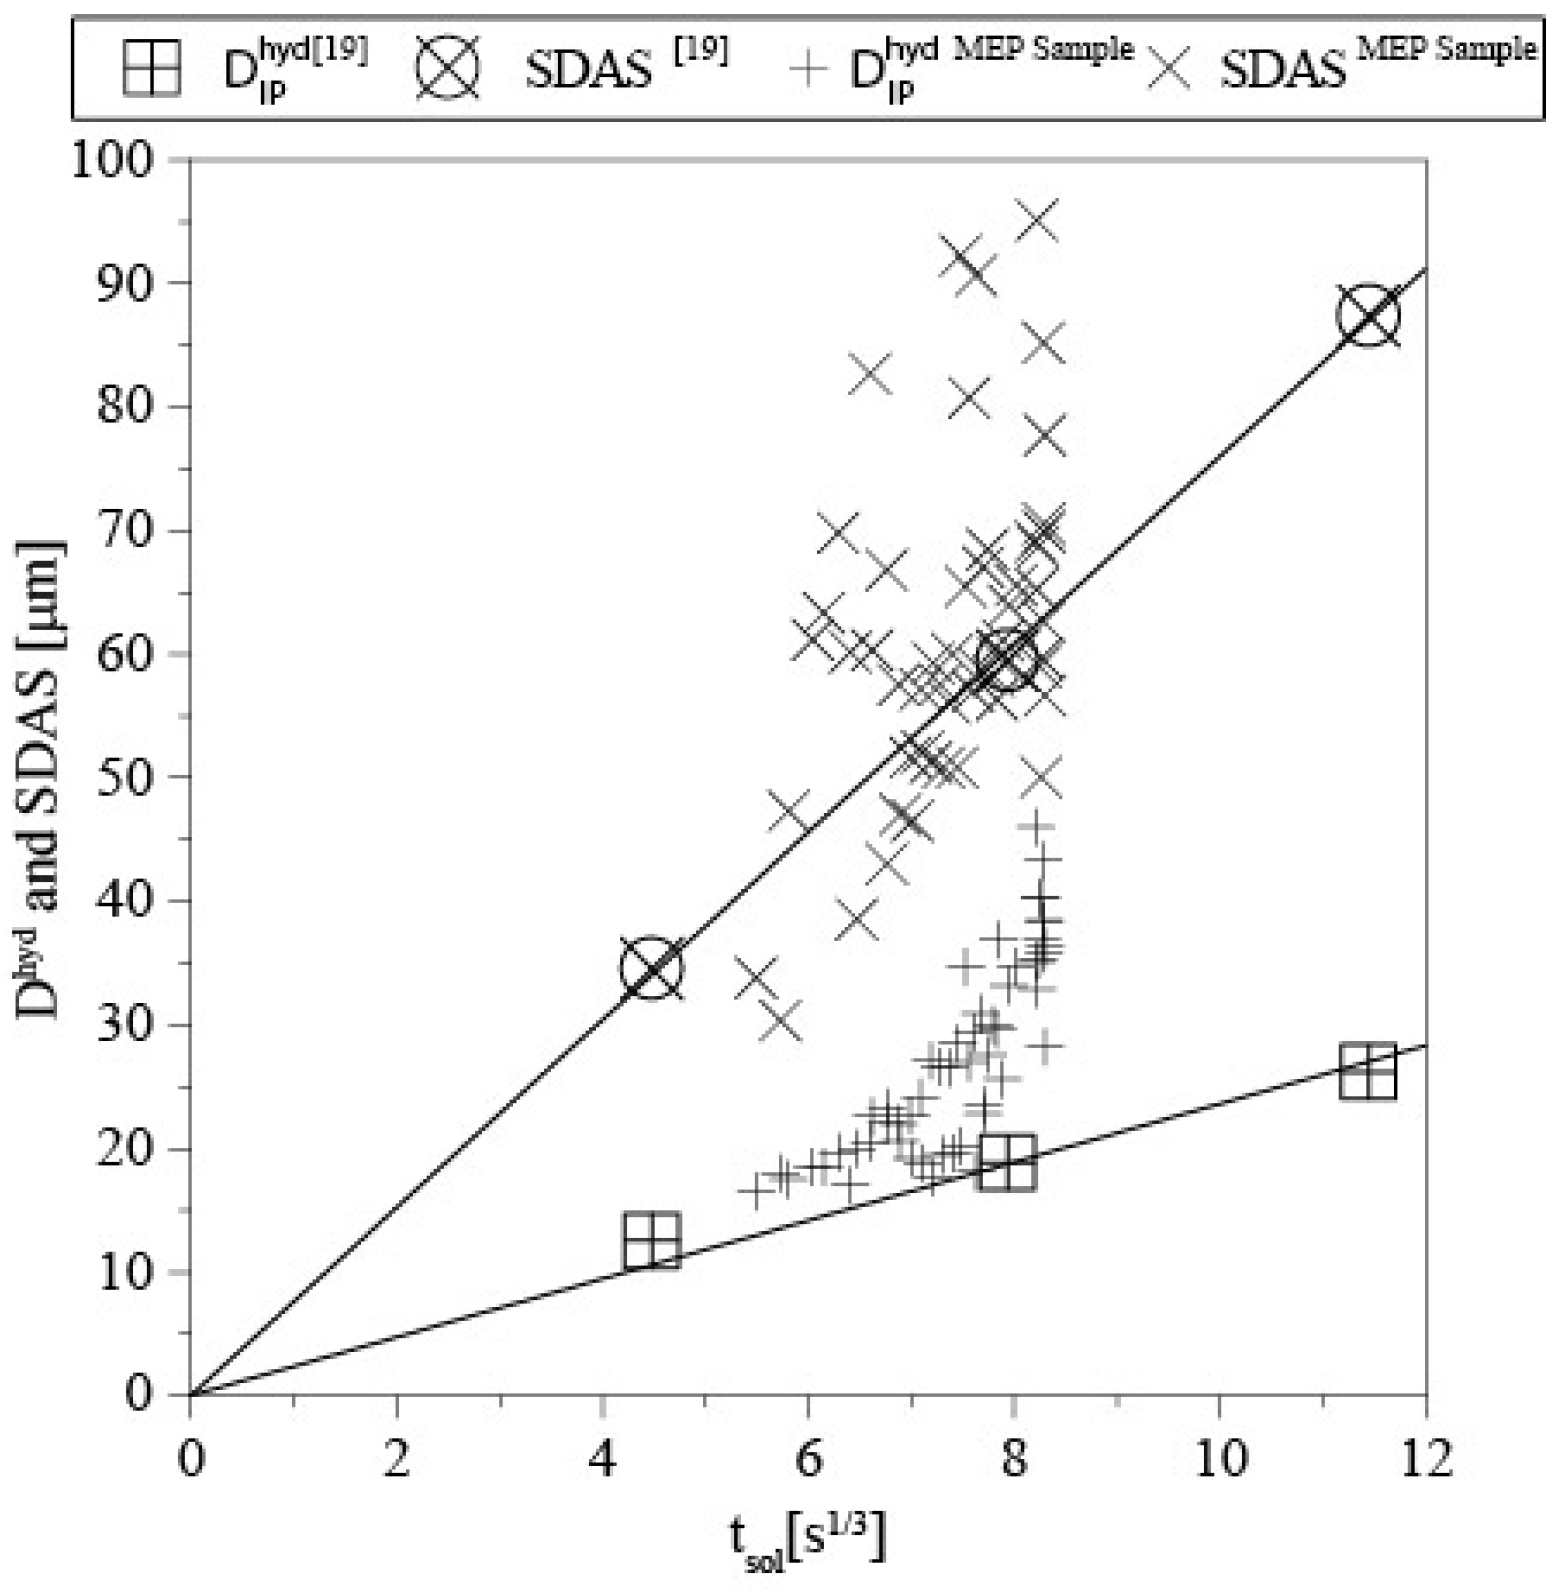
Table 1.
Chemical composition of the alloys.
| Element | C | Si | Mn | P | S | Cr | Mo |
|---|---|---|---|---|---|---|---|
| Content in SP sample (wt %) | 3.28 | 1.96 | 0.64 | 0.03 | 0.06 | 0.26 | 0.05 |
| Content in MEP sample (wt %) | 3.18 | 1.77 | 0.56 | 0.05 | 0.09 | 0.15 | 0.24 |
© 2017 by the authors. Licensee MDPI, Basel, Switzerland. This article is an open access article distributed under the terms and conditions of the Creative Commons Attribution (CC BY) license (http://creativecommons.org/licenses/by/4.0/).
Share and Cite
MDPI and ACS Style
Svidró, P.; Diószegi, A.; Pour, M.S.; Jönsson, P. Investigation of Dendrite Coarsening in Complex Shaped Lamellar Graphite Iron Castings. Metals 2017, 7, 244. https://doi.org/10.3390/met7070244
AMA Style
Svidró P, Diószegi A, Pour MS, Jönsson P. Investigation of Dendrite Coarsening in Complex Shaped Lamellar Graphite Iron Castings. Metals. 2017; 7(7):244. https://doi.org/10.3390/met7070244
Chicago/Turabian StyleSvidró, Péter, Attila Diószegi, Mohsen Saffari Pour, and Pär Jönsson. 2017. "Investigation of Dendrite Coarsening in Complex Shaped Lamellar Graphite Iron Castings" Metals 7, no. 7: 244. https://doi.org/10.3390/met7070244
Note that from the first issue of 2016, this journal uses article numbers instead of page numbers. See further details here.