Enhanced Surface Precipitates on Ultrafine-Grained Titanium in Physiological Solution

College of Mechanical and Electrical Engineering, Nanjing University of Aeronautics and Astronautics, Nanjing 210007, China
*
Author to whom correspondence should be addressed.
Metals 2017, 7(7), 245; https://doi.org/10.3390/met7070245
Submission received: 17 May 2017
/
Revised: 15 June 2017
/
Accepted: 27 June 2017
/
Published: 1 July 2017
(This article belongs to the Special Issue Synthesis and Properties of Bulk Nanostructured Metallic Materials)
Abstract
:Enhanced cell adherence to the surface of nanocrystallized commercially pure titanium (CP–Ti) was observed by several authors. However, the understanding of the surface modification of Ti in a physiological solution due to nanocrystallized grain size has not been reached. In this work, equal channel angular pressing (ECAP) was applied to manufacturing ultrafine grained CP–Ti. Martensite and Widmanstatten microstructures were also obtained for comparison. The CP–Ti pieces with different microstructures were subjected to soaking tests in a simulated body fluid. Electrochemical impedance spectroscopy (EIS) measurements, X-ray photoelectron spectroscopy (XPS) and scanning electron microscope (SEM), energy dispersive spectrometer (EDS) were used to characterize the surfaces. The results show the surface precipitates mainly contain Ti, O, Ca and P. The quantity of precipitates on ECAPed CP–Ti is the largest among different specimens corresponded to the observation of the thickest layer formation on ECAPed CP–Ti found by EIS. EDS results show more CaPO and less Ti are included on ECAPed Ti comparing to the deposits on other two types of specimens. Smaller numbers of precipitates and denser film are produced on the surface of the water-quenched CP–Ti. The regeneration kinetics of the CaP precipitates evaluated by Gibbs free energy is introduced to interpret the precipitating behaviors on different CP–Ti specimens.
1. Introduction
Titanium and titanium alloys are potential materials for biomedical application due to their high mechanical properties and high corrosion resistance. Pure titanium occupies the strength lower than Ti–6Al–4V, for example, for no alloys addition to pure titanium. However its strength can be elevated through microstructural modification by severe plastic deformation (SPD). Not only strength, but also corrosion resistance and surface cells attachment can be improved by the method of SPD [1,2,3,4,5,6,7,8]. The strength increment is correlated to ultrafine grain size given by Hall-Petch relationship. However, until now the mechanism of improved cell attachment and corrosion resistance of titanium metal affected by grain size has not been understood.
Kim [1] and Park [2] established a model explaining enhanced surface cell attachment on nanocrystallized CP–Ti is due to that the nodule at triple-point junction of grain microstructure is increased in number as the grain size is refined through equal channel angular pressing (ECAP). Accelerated stem cell attachment on ECAPed CP–Ti specimens was observed by Estrin [3]. Enhanced bacterials adhesion on nanocrystalline CP–Ti was reported by the paper performed by Truong [4]. Nano size surface roughness produced on the nanocrystalline grained titanium is considered as the mechanisms by them. Faghihi [5] investigated the effect of grain orientation on MC3T3 pre-osteoblast cell attachment on titanium alloy (Ti–6Al–4V). His finding emphasizes that the orientation of grain microstructure has great influence on the number of pre-osteoblast cells attached to the surface of titanium.
Native formed surface film on titanium experiences regeneration process occurring in a corrosive solution. The surface compositions are eventually modified to the compositions included in the solution. The studies of the reaction of native surface on titanium with the physiological solution were performed by authors [9,10,11,12,13,14,15,16,17,18]. Lu [9] studied the reaction of a polycrystalline titanium surface with oxygen and water molecules at 150–850 K. The oxidations types are varied according to the temperatures of reaction. The study by Alkhateeb [10] confirmed a spontaneous modification of the Ti surface to the surface containing Ca and P species as the surface contacted with a Ringer’s solution. His study also revealed the composition of the CaP precipitates changed as a function of time. The interaction between Ti and Dulbecco’s modified Eagle’s medium with bovine serum albumin (BSA) component was studied by Burgos-Asperilla [11] who reported that the passive film has acidic hydroxyl group and the adsorption kinetics for phosphate and calcium ions is slow.
Although these studies, the investigation of the mechanism behind the effect of nanostructure on the cell attachment of CP–Ti are still open. Furthermore, in the scope of authors’ knowledge, no study concerns the reaction of titanium surface with physiological solution affected by ultrafine grained microstructure until now. In this paper, an investigation of spontaneous modification of the surface of titanium with different substrate microstructures after soaking in a physiological solution is carried out. Electrochemical impedance spectroscopy (EIS), X-ray photoelectron spectroscopy (XPS) and scanning electron microscope (SEM) are used for surface characterization and the composition quantity measurements.
2. Materials and Methods
A commercially pure titanium (CP–Ti, Grade 2) bar is used. The ECAP die used in this work has channel angle Φ of 105° and outer corner angle Ψ of 75°. The die and a furnace were fixed on a hydraulic press (Tianjing Forging Machine, Tianjing, China). Isothermal ECAP at the temperature of 400 °C was applied. The ECAP process was carried out through 2 passes with route Bc which means the rod is rotated 90° clockwise continuously along its longitudinal axis in the next ECAP pass.
After roughly grinding, the CP–Ti pieces were heated in an argon atmosphere up to 900 °C and held at the temperature for 1 h. Then they were separately quenched into water or cooled within the furnace to the room temperature. These specimens were named as WQ (water quenching) and FC (furnace cooling) specimen, respectively. Three same pieces were prepared for each condition for the reliability of the experiment. After ground with 400, 800 and 1200 abrasive paper, the surface of titanium was polished with two kinds of Al2O3 powder W2 (average diameter 2 µm) and W0.5 (average diameter 0.5 µm). The samples further electrochemically polished were observed by electronic backscatter diffraction (EBSD) attached to a scanning electron microscope (SEM) (JSM-7001F, Japan Electron Optics Laboratory Co. Ltd., Tokyo, Japan).
Simulated body fluid (SBF) solution which composition is 7.885 NaCl, 0.219 KCl, 0.268 CaCl2, 0.081 Na2SO4, 0.311 MgCl2·6H2O, 0.340 NaHCO3, 0.219 K2HPO4, 6.048 NH2C(CH2OH) and 0.8 g/L bovine serum albumin (BSA, Aladdin, Shanghai, China) was used for the media. The partial pressure of oxygen was reduced by the nitrogen gas injection (ASTM F2129-06). Adjust the pH value of the test solution with HCl (1 M) to 7.4. The whole preparation process of SBF was carried out in a constant temperature water bath (37.0 ± 1.0 °C). Finally bovine serum albumin was added to the SBF solution.
The CP–Ti pieces after ECAP and heat treatments were first ground and polished equally and then ultrasonically cleaned, firstly by suds for 15 min, then by acetone for 15 min. The samples were finally cleaned by deionized water and dried in the air. On the surface of Ti pieces, an area of 1 cm × 1 cm was left and other places were coated by epoxy resin. The electrochemical cell is maintained, by means of a thermostated bath at constant temperature and defined (37 °C). Typical three electrodes system (Chi660D, Shanghai, China) called working electrode, saturated calomel electrode (SCE) (reference electrode) and platinum foil (auxiliary electrode) was used. The open-circuit potential was first measured for 1 h until the open-circuit potential was stable. Afterwards, electrochemical impedance spectroscopy (EIS) was measured at open-circuit potential in the frequency range from 100 kHz to 10 mHz with a perturbation signal of 5 mV (vs. SCE).
The preparation of the samples for static immersion tests was basically the same as that for the EIS measurement. The pieces mounted in cold-setting resin with 1 cm × 1 cm window left as working area were subjected to static immersion tests. Each specimen was leaned against wall of a 25 mL beaker and fully immersed in the solution. The beaker was covered with a laboratory Parafilm sheet and filled with pure nitrogen above the solution. All beakers were placed in a water-bath circumstance and held at 37 °C for 60 days. Three sets of experiments under one identical condition were carried out in order to ensure high reliability.
After immersion, the pieces were cleaned with deionized water three times and dried in the air. The chemical composition of the surface was examined by a PHI Quantera II X-ray Photoelectronic Spectroscopy (XPS, PHI, Chanhassen, MN, USA) with a monochromatic AlK X-ray source, and pass energies of 280 and 112 eV for survey and high-resolution scan, respectively. A take-off angle of 45° to the surface normal was used in the XPS tests for all samples. The surface morphology of the specimen after immersion was observed by a SEM (JSM-7001F).
3. Results
3.1. Microstructure
Figure 1 shows EBSD mappings of the CP–Ti specimens. In Figure 1a, a shear band microstructure composed of fine grains with low angle and high angle boundaries is shown. An average grain size of 3.3 ± 1.2 µm is obtained. The microstructure of WQ specimens is composed of coarse grains (Figure 1b) and a few martensitic bundles in the grain. The martensite contains lamellas structure with the lamellas space ranged in the order of 10 µm. Most of lamellas boundaries are low angle type. Coarse Widmanstatten phase is presented in FC specimen (Figure 1c). The boundaries of the Widmanstatten phase are mainly large angle type.
3.2. Electrochemical Impedance Spectroscopy (EIS) Results
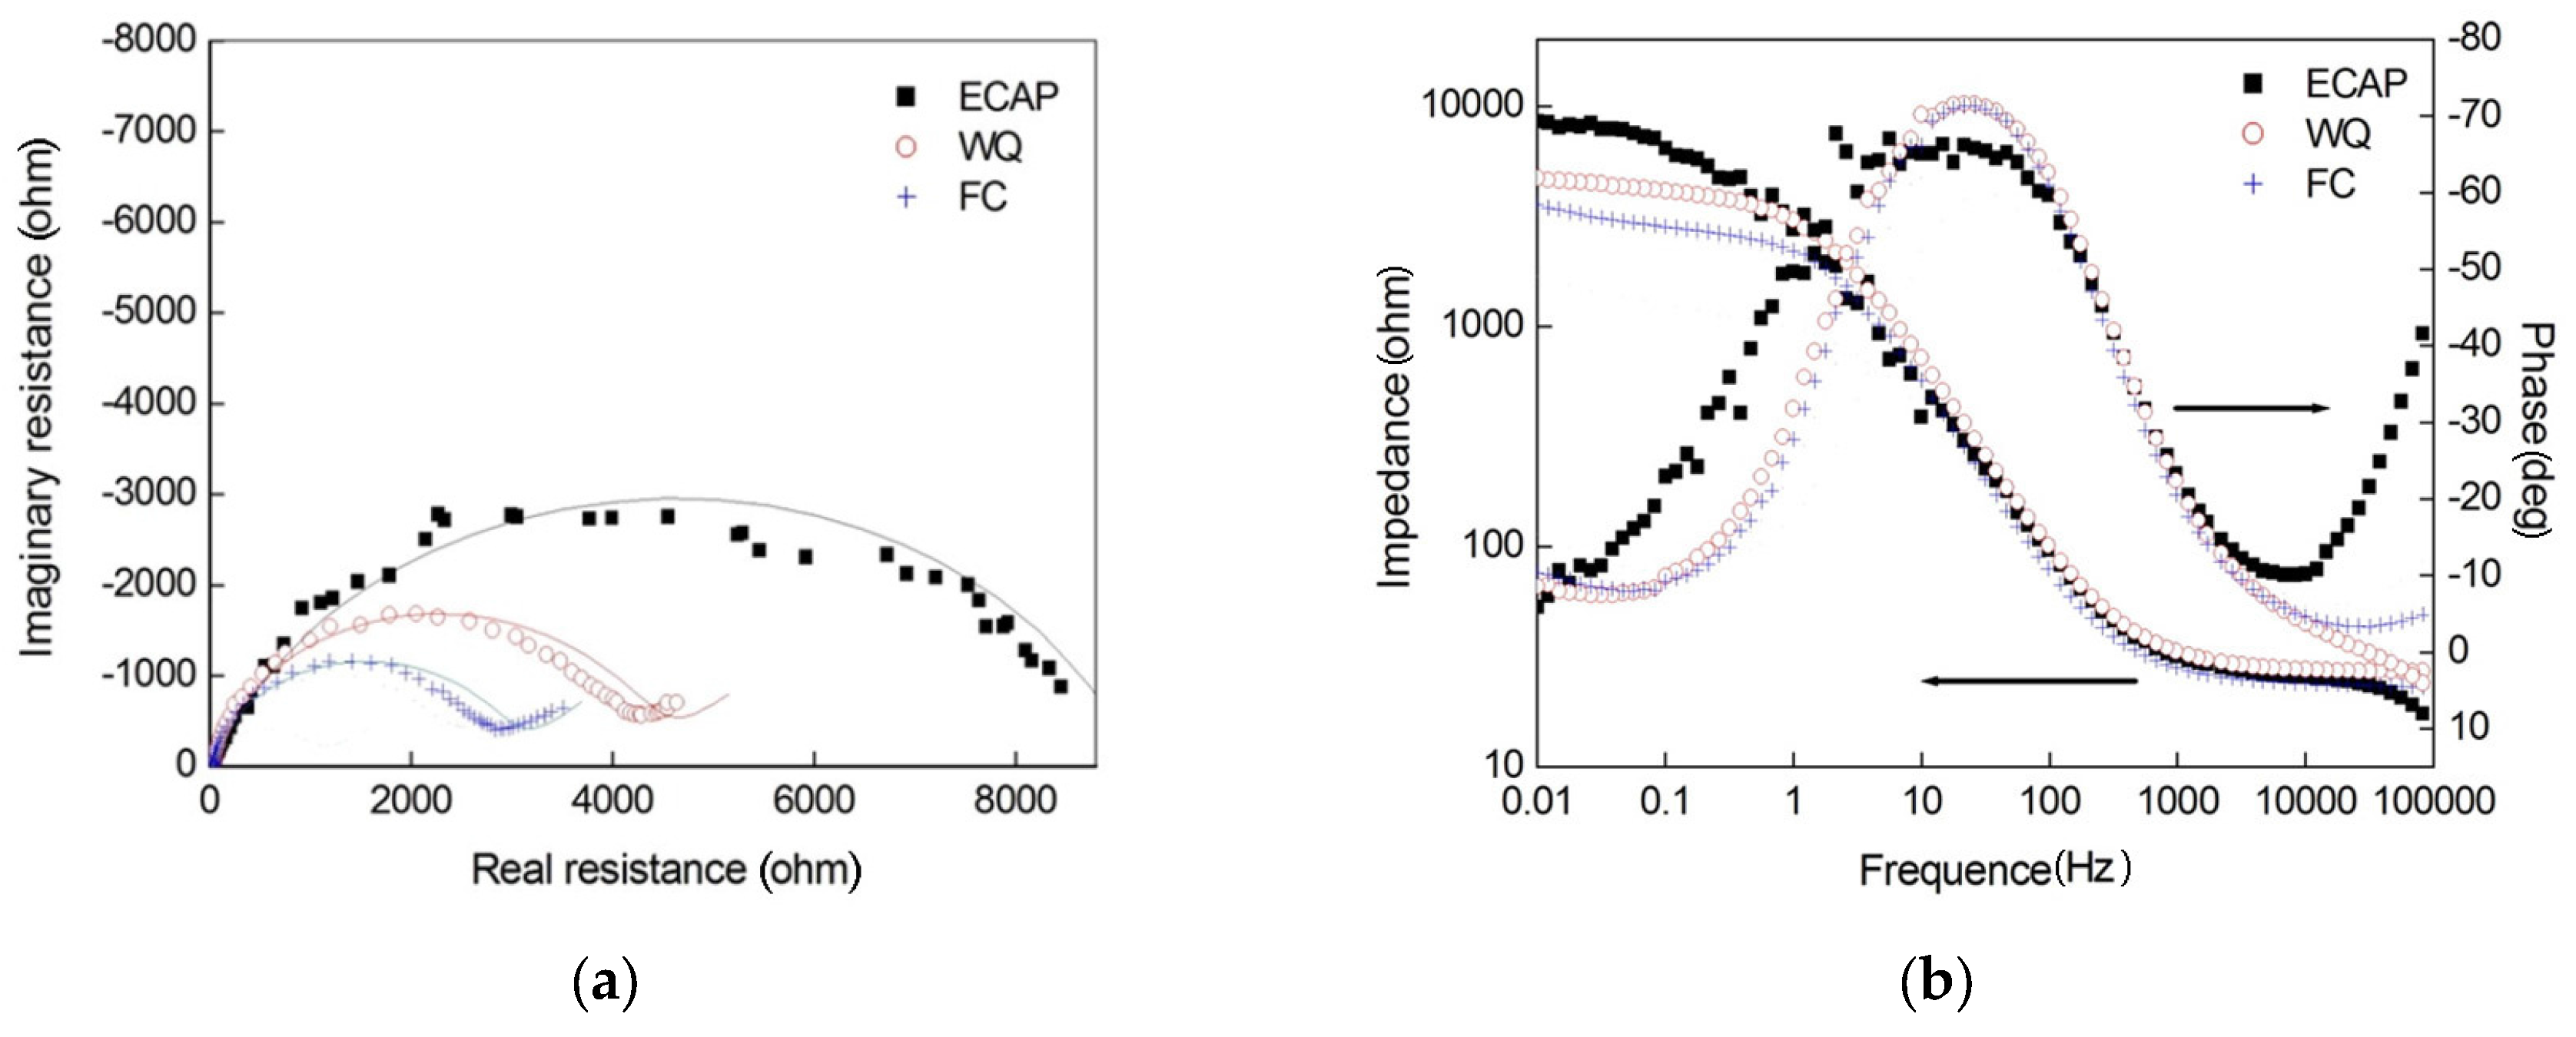
Figure 2a,b shows respectively Nyquist and Bode plots of CP–Ti specimens at the open circuit potential. Nyquist plots (Figure 2a) exhibit a deformed semicircle, resulting from a dispersion effect. The diameter of the semicircle, representing the real impedance indicates the magnitude of the corrosion resistance. The Nyquist plots of the WQ and FC specimens in the low frequency range exhibit a straight line with a 45° angle to the Z′ axis, indicating the existence of Warburg impedance [19] and a diffusion of the corrosion product: ions across the surface film of the electrode. The Bode plots (Figure 2b) show that the impedance modulus of ECAPed CP–Ti is higher than those of WQ and FC CP–Ti. The Bode plots of WQ and FC specimens at low frequencies also show the features of Warburg impedance. For all specimens, the EIS spectra are characterized with one time constant.
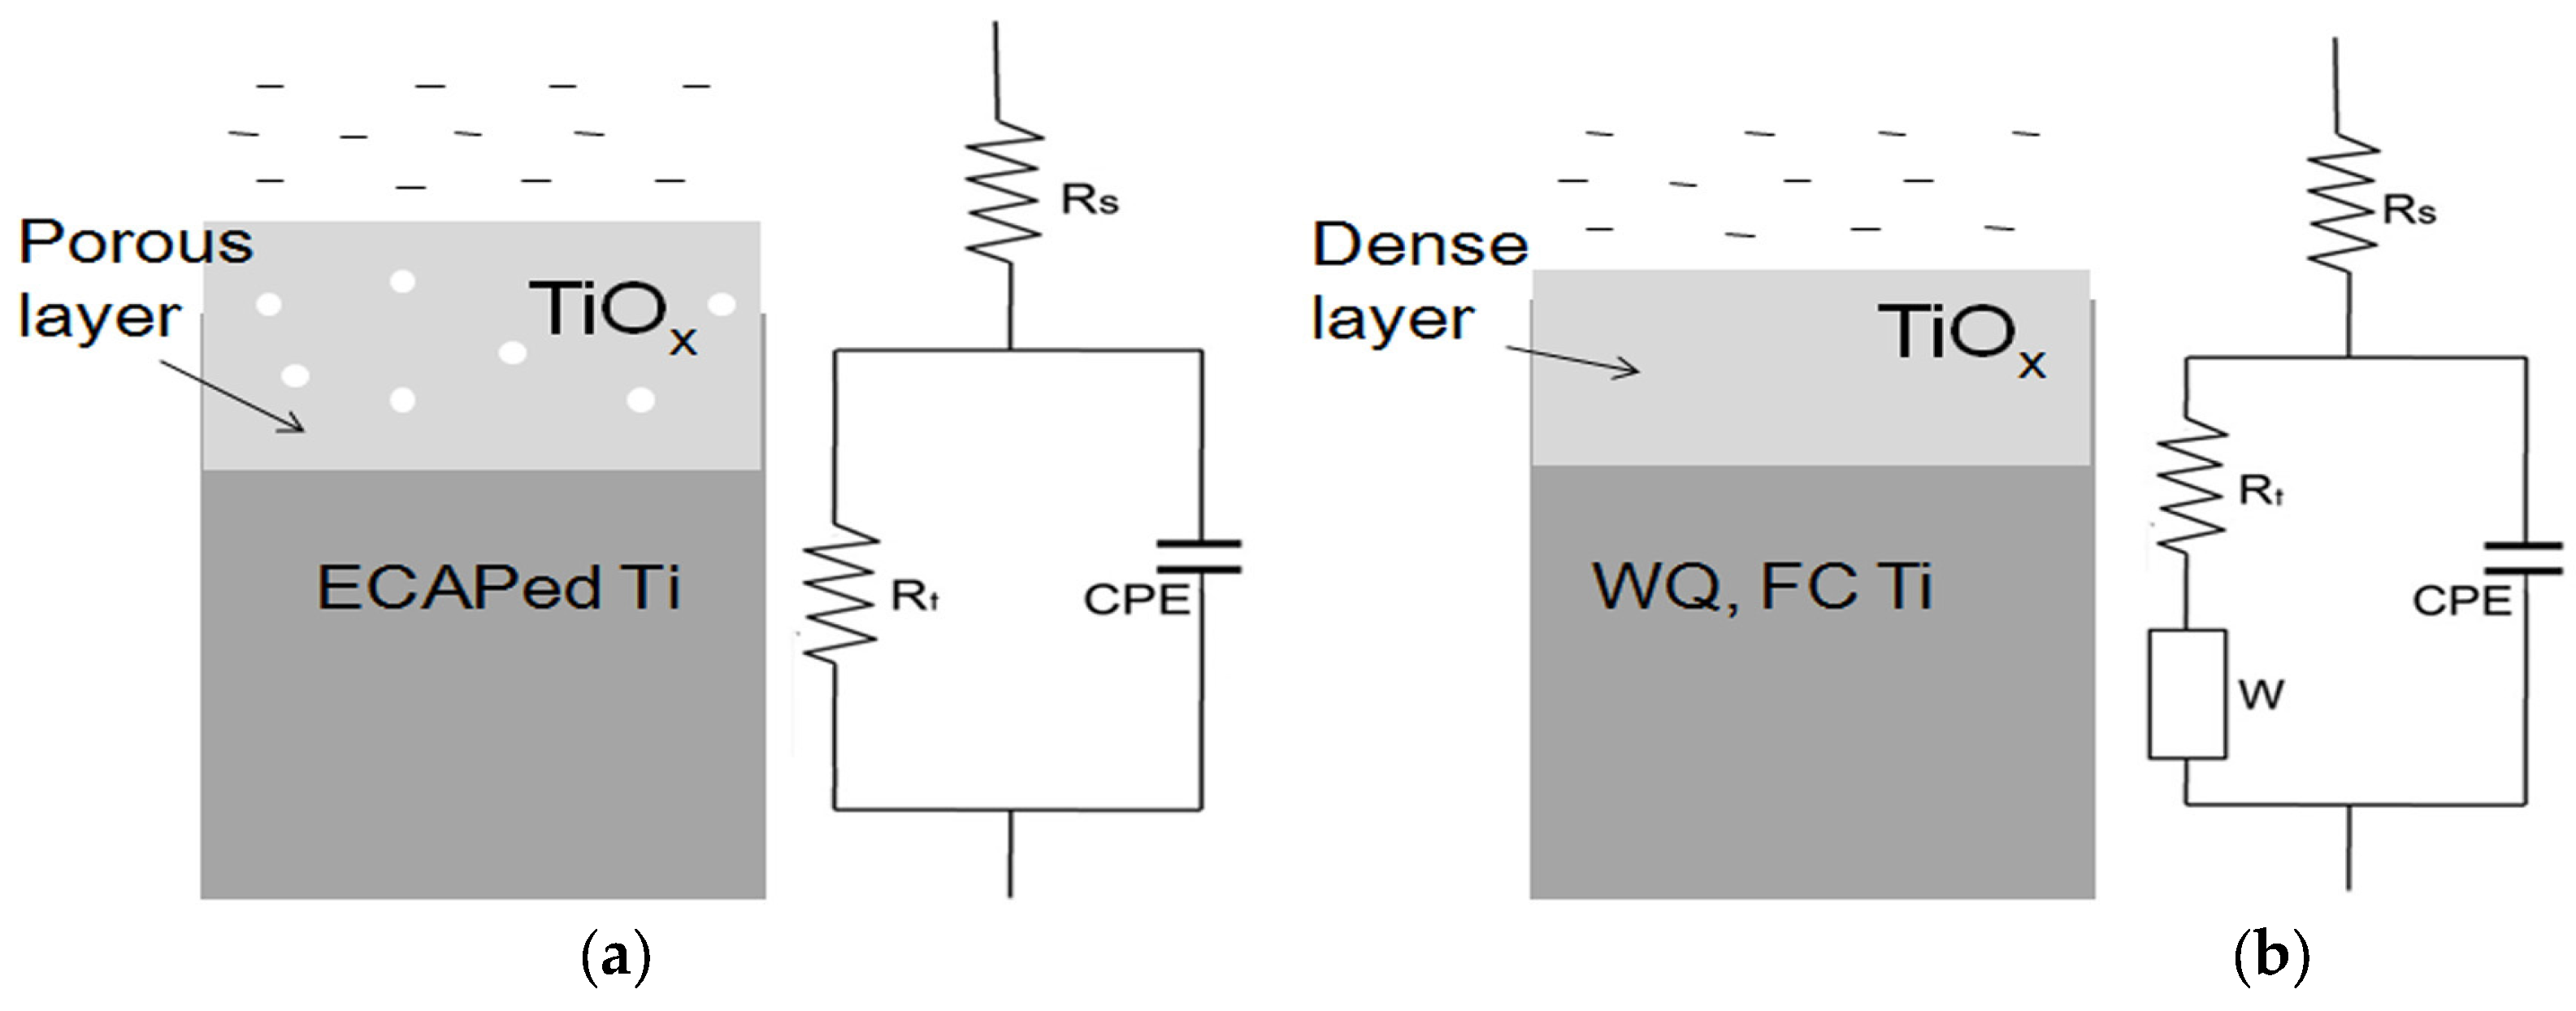
Using ZSimpWin software (Echem Software, Ann Arbor, MI, USA), equivalent electrical circuit is used to simulate EIS curves under best fitting. Figure 3 shows the simulated results of the equivalent electrical circuits and R(QR) and R(Q(RW)) is corresponding to the circuits of ECAPed and heat-treated CP–Ti, respectively. The fitting parameters of the equivalent electrical circuits for various specimens are listed in Table 1. It can be seen from Table 1 that the solution resistance Rs of three types of specimens is almost the same due to the same solution used. The charge transfer resistance of ECAPed specimen is the highest among these specimens indicating the highest corrosion resistance and the thickest layer produced on the surface [20]. The Warburg capacitance is inversely proportional to the Warburg impedance. It is found that the Warburg capacitance for WQ CP–Ti is lower than that for FC CP–Ti. This observation indicates a denser film produced on WQ CP–Ti [21] causing more difficulty of the ions diffusion across the surface on WQ CP–Ti. A schematic diagram of the layers produced on two kinds of specimens is shown in Figure 3.
Several authors [22,23,24] concerned porous layer formation during corrosion tests on titanium and titanium alloys. The feature of porous in this work can be demonstrated by the EIS result of insignificance of Warburg impedance for ECAPed specimens and easy diffusion behavior of corrosion product through the layer. The evidence of larger phase angles of ECAPed CP–Ti (Figure 2b) at low frequencies than those of FC and WQ CP–Ti also supports the feature of porous. Therefore, a thick porous layer formation on ECAPed Ti is concluded. TiOx denotes titanium is bonded to oxygen by X = 2, 1, 3/2 and 3/4.
3.3. Response to Soaking
The surface composition and morphology of various titanium specimens after soaking is characterized by XPS, SEM and EDS. O 1s, N 1s, Ti 2p, Ca 2p and P 2p spectra are presented in XPS survey scan of various titanium specimens. There is no difference on the element type, however, the atomic percentage of the elements (Table 2) detected by XPS varies according to the specimen type. The maximum O and Ti contents were observed on ECAPed CP–Ti and the O and Ti contents on FC CP–Ti are higher than those on WQ one. P on ECAPed specimen has higher content than other two type specimens. Ca content on ECAPed Ti is the same (=0.5 at %) as those on FC Ti, and Ca deposited on WQ Ti is very small (<0.1 at %).
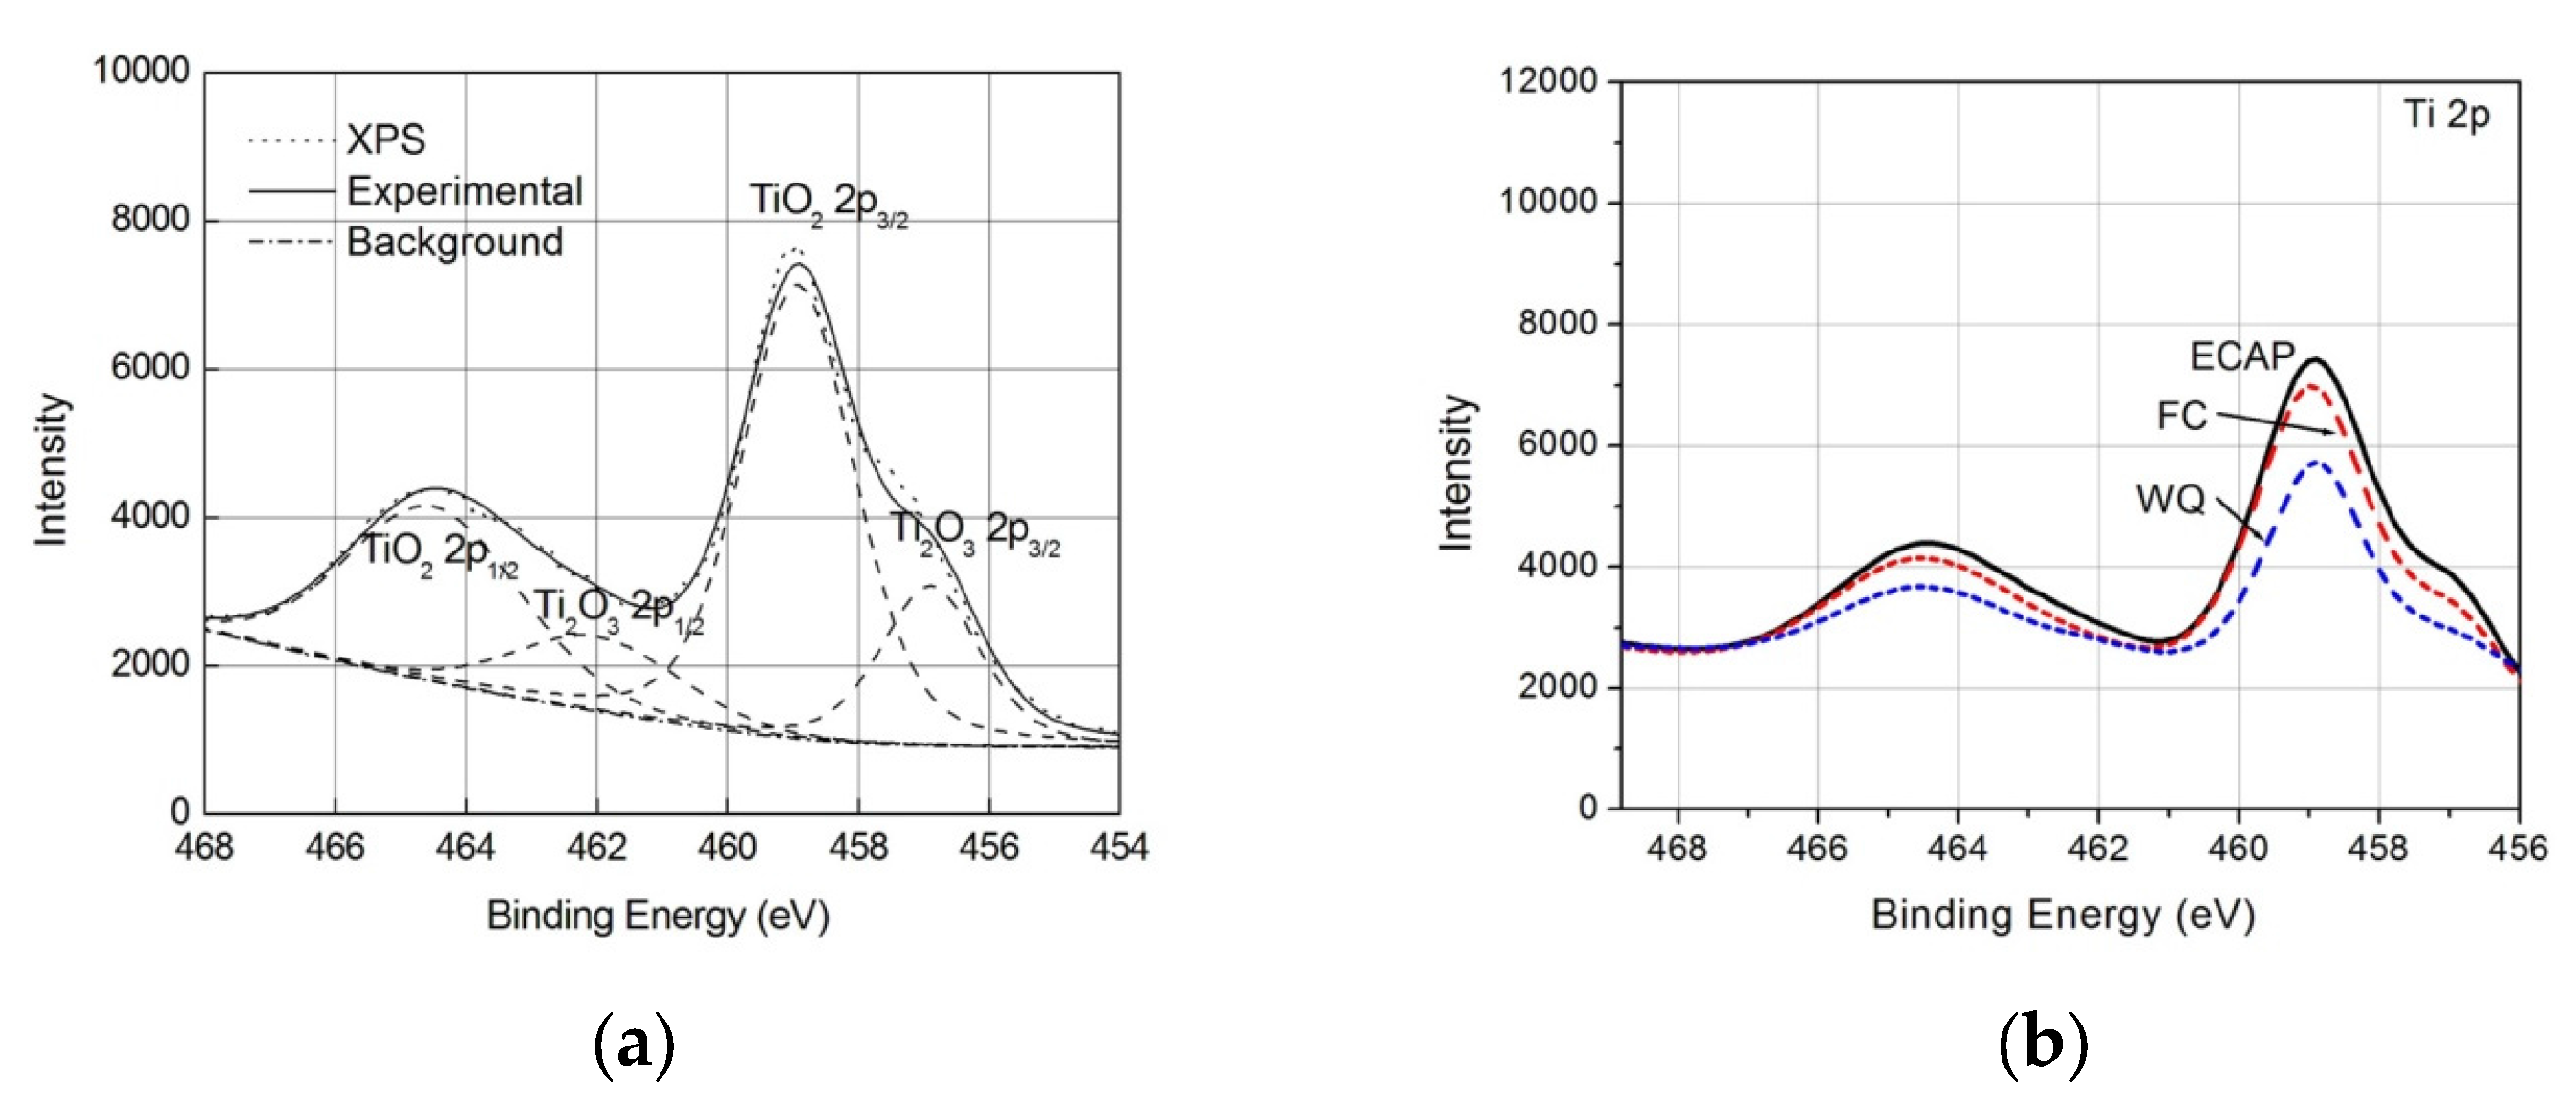
High resolution spectra of various elements are shown in Figure 4,Figure 5,Figure 6,Figure 7. The O 1s peak is deconvoluted into two sub-peaks: the peak attributed to oxygen bonds in organic at binding energy of around 531.9 eV and to metal-oxygen bonds at binding energy of around 529.9 eV (Figure 4a). For comparing the photoelectron intensity activated from different types of specimens, the background intensity was cut (Figure 4b). It is found from the intensity contributed by ECAPed CP–Ti is the highest and the intensity contributed by FC Ti is higher than that by WQ Ti, which denotes the O content in the surface of different Ti specimens can be ranged in the order, ECAP > FC > WQ.
The Ti 2p spectra show two types, Ti 2p Ti4+ and Ti 2pTi3+ (Figure 5a). They both are spin-orbit splitting at 2p1/2 and 2p3/2. It can be seen that the amount of Ti4+ is much larger than Ti3+. The Ti 2p intensity of different specimens is compared in Figure 5b. Higher intensity of Ti 2p on ECAPed and FC CP–Ti than on WQ CP–Ti is observed.
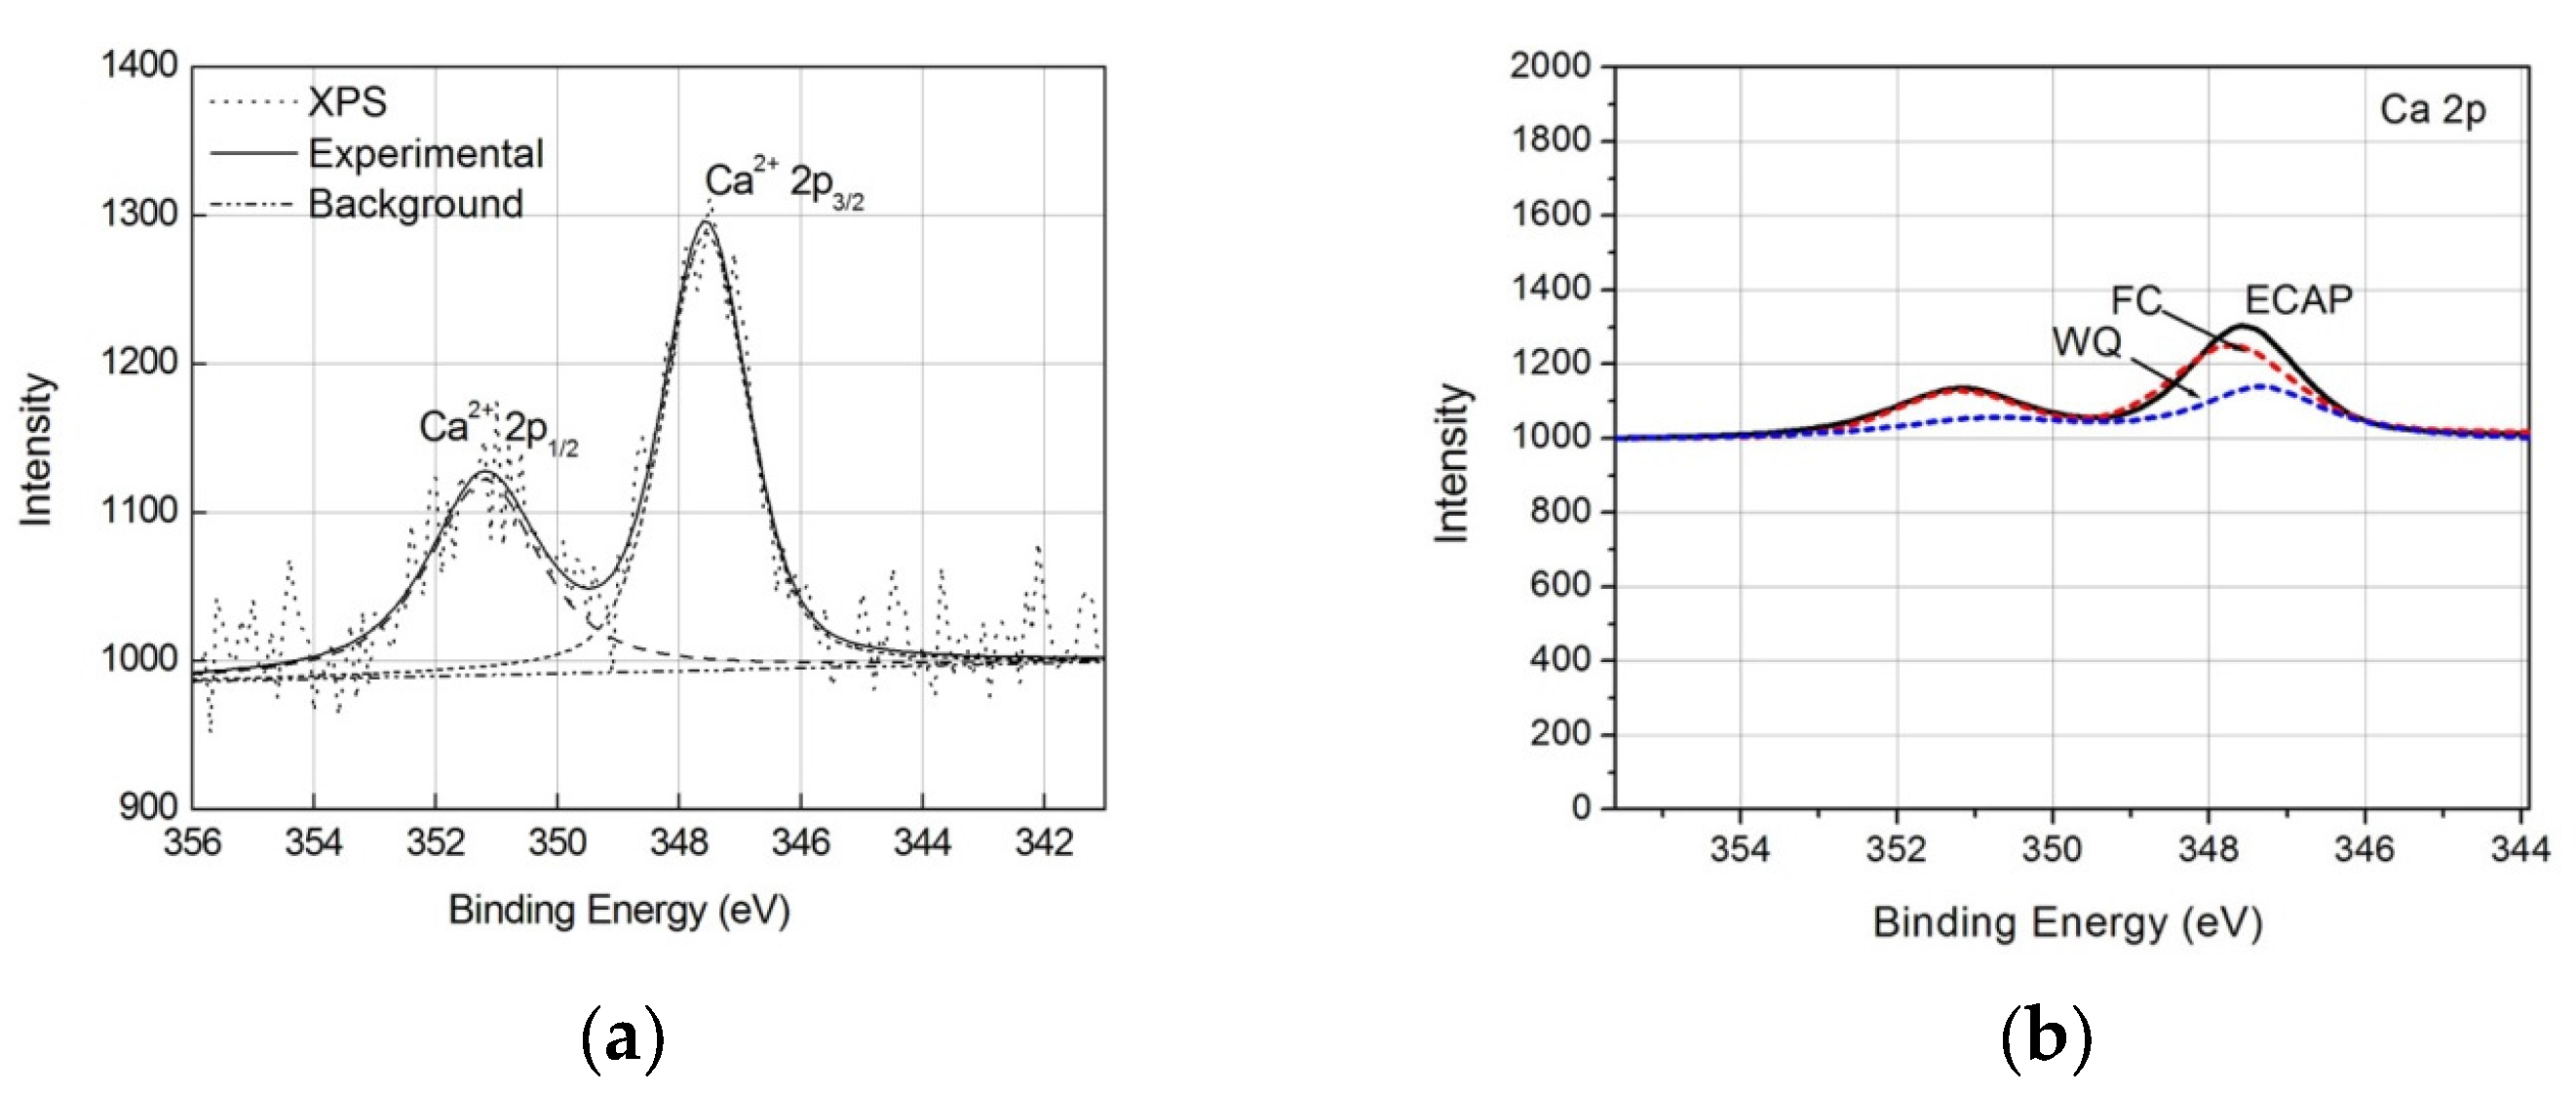
The Ca 2p spectra (Figure 6a) show spin-orbit splitting at 2p1/2 and 2p3/2 and binding energy at 351.1 and 347.6 eV, respectively. The intensity of Ca 2p contributed by ECAPed and FC CP–Ti is higher than that by WQ Ti. The P 2p spectra (Figure 7a) show P3+ 2p3/2 at 138.6 eV and P5+ 2p3/2 at 133.5 eV. CaHPO4 and Ca3(PO4)2 are possible according to the bonding energy of Ca 2p and P 2p [25]. The semi-quantitative comparison of different types of specimens shown in Figure 6b and Figure 7b indicates larger numbers of depositions containing Ca and P produced on ECAPed and FC specimens than those produced on WQ specimens.
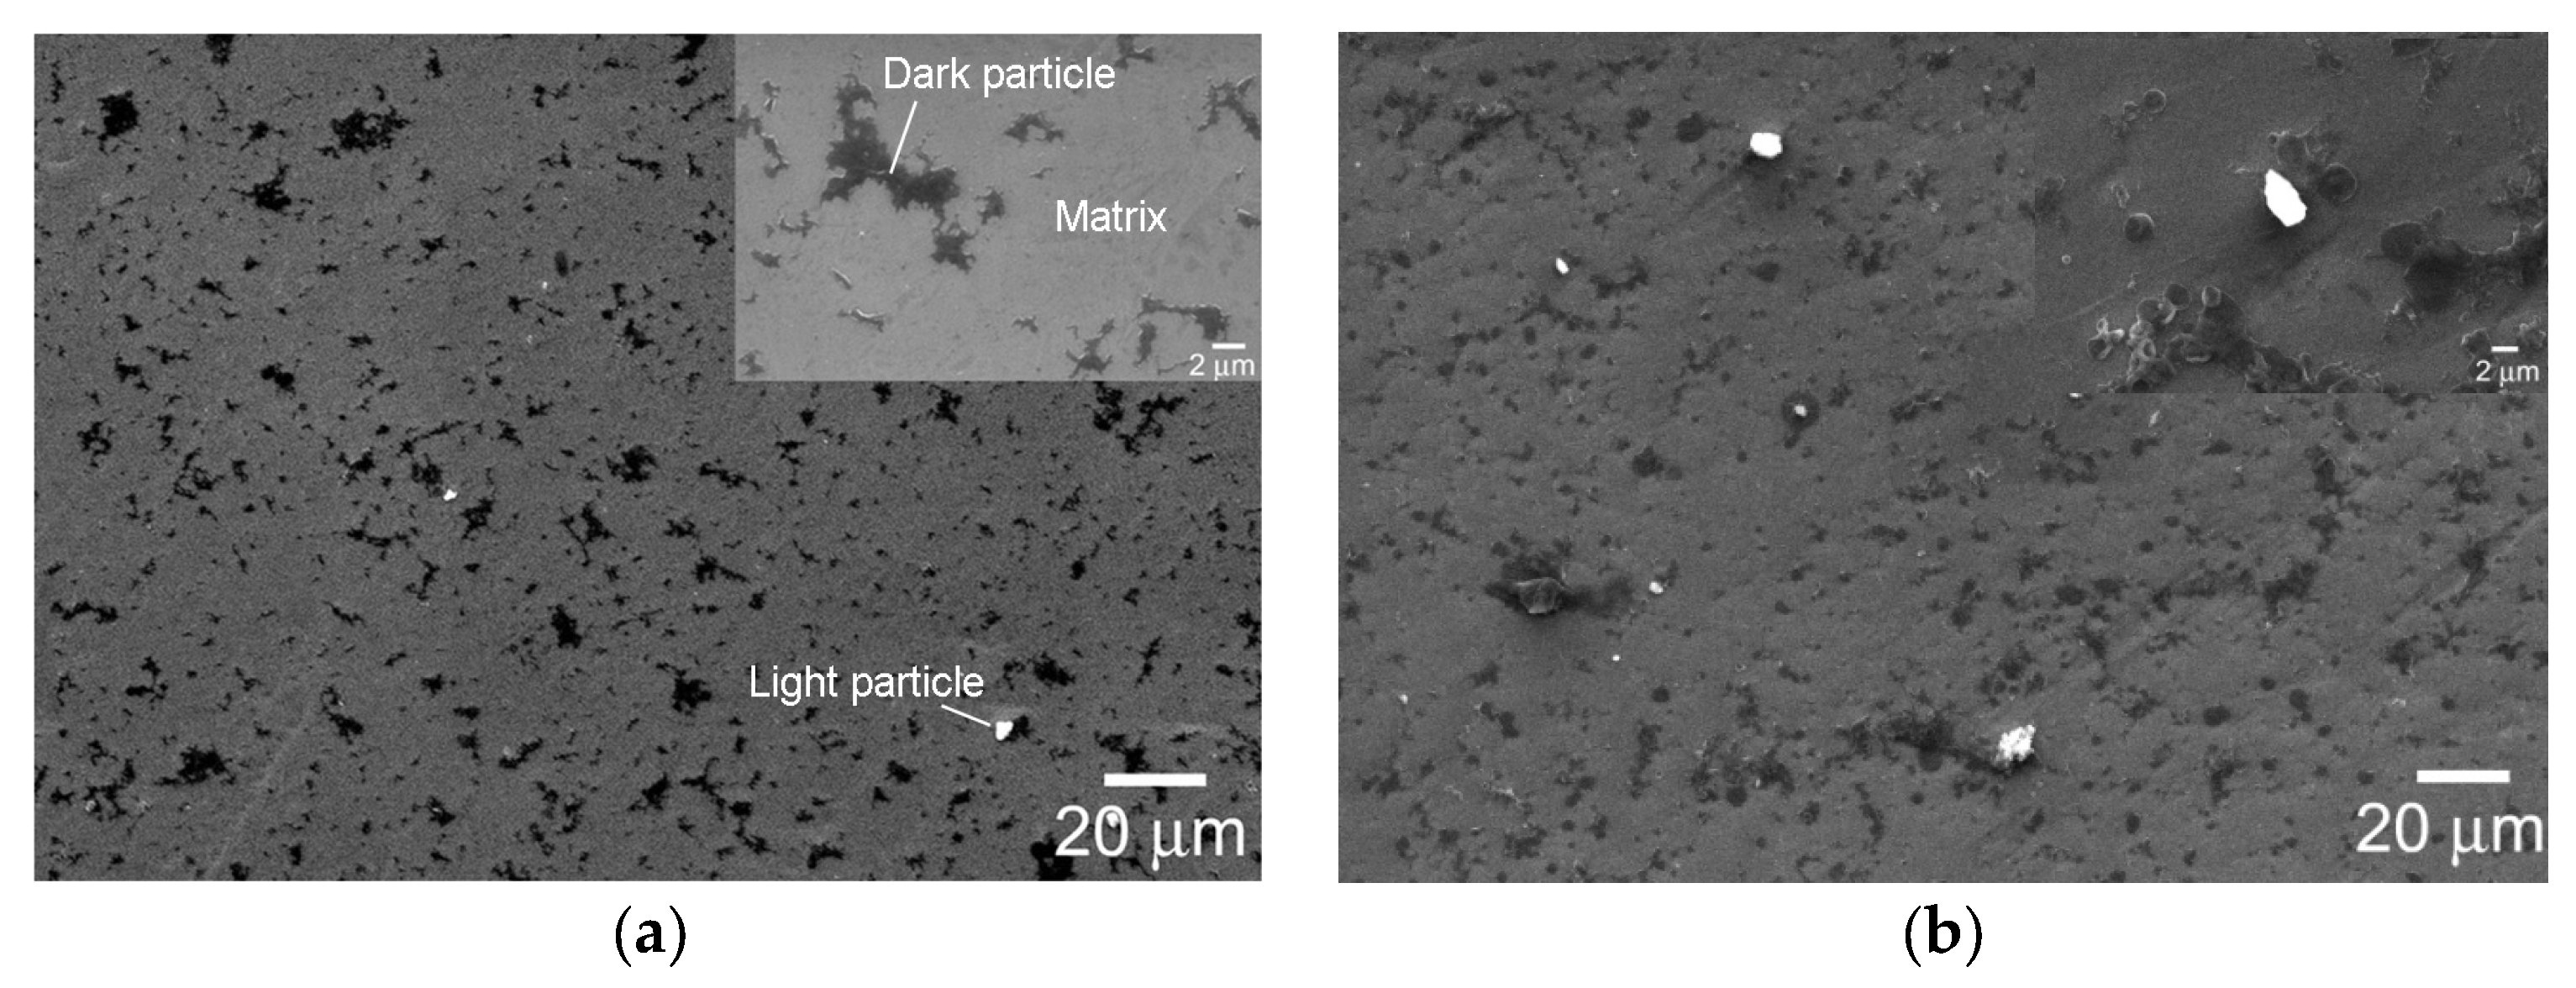
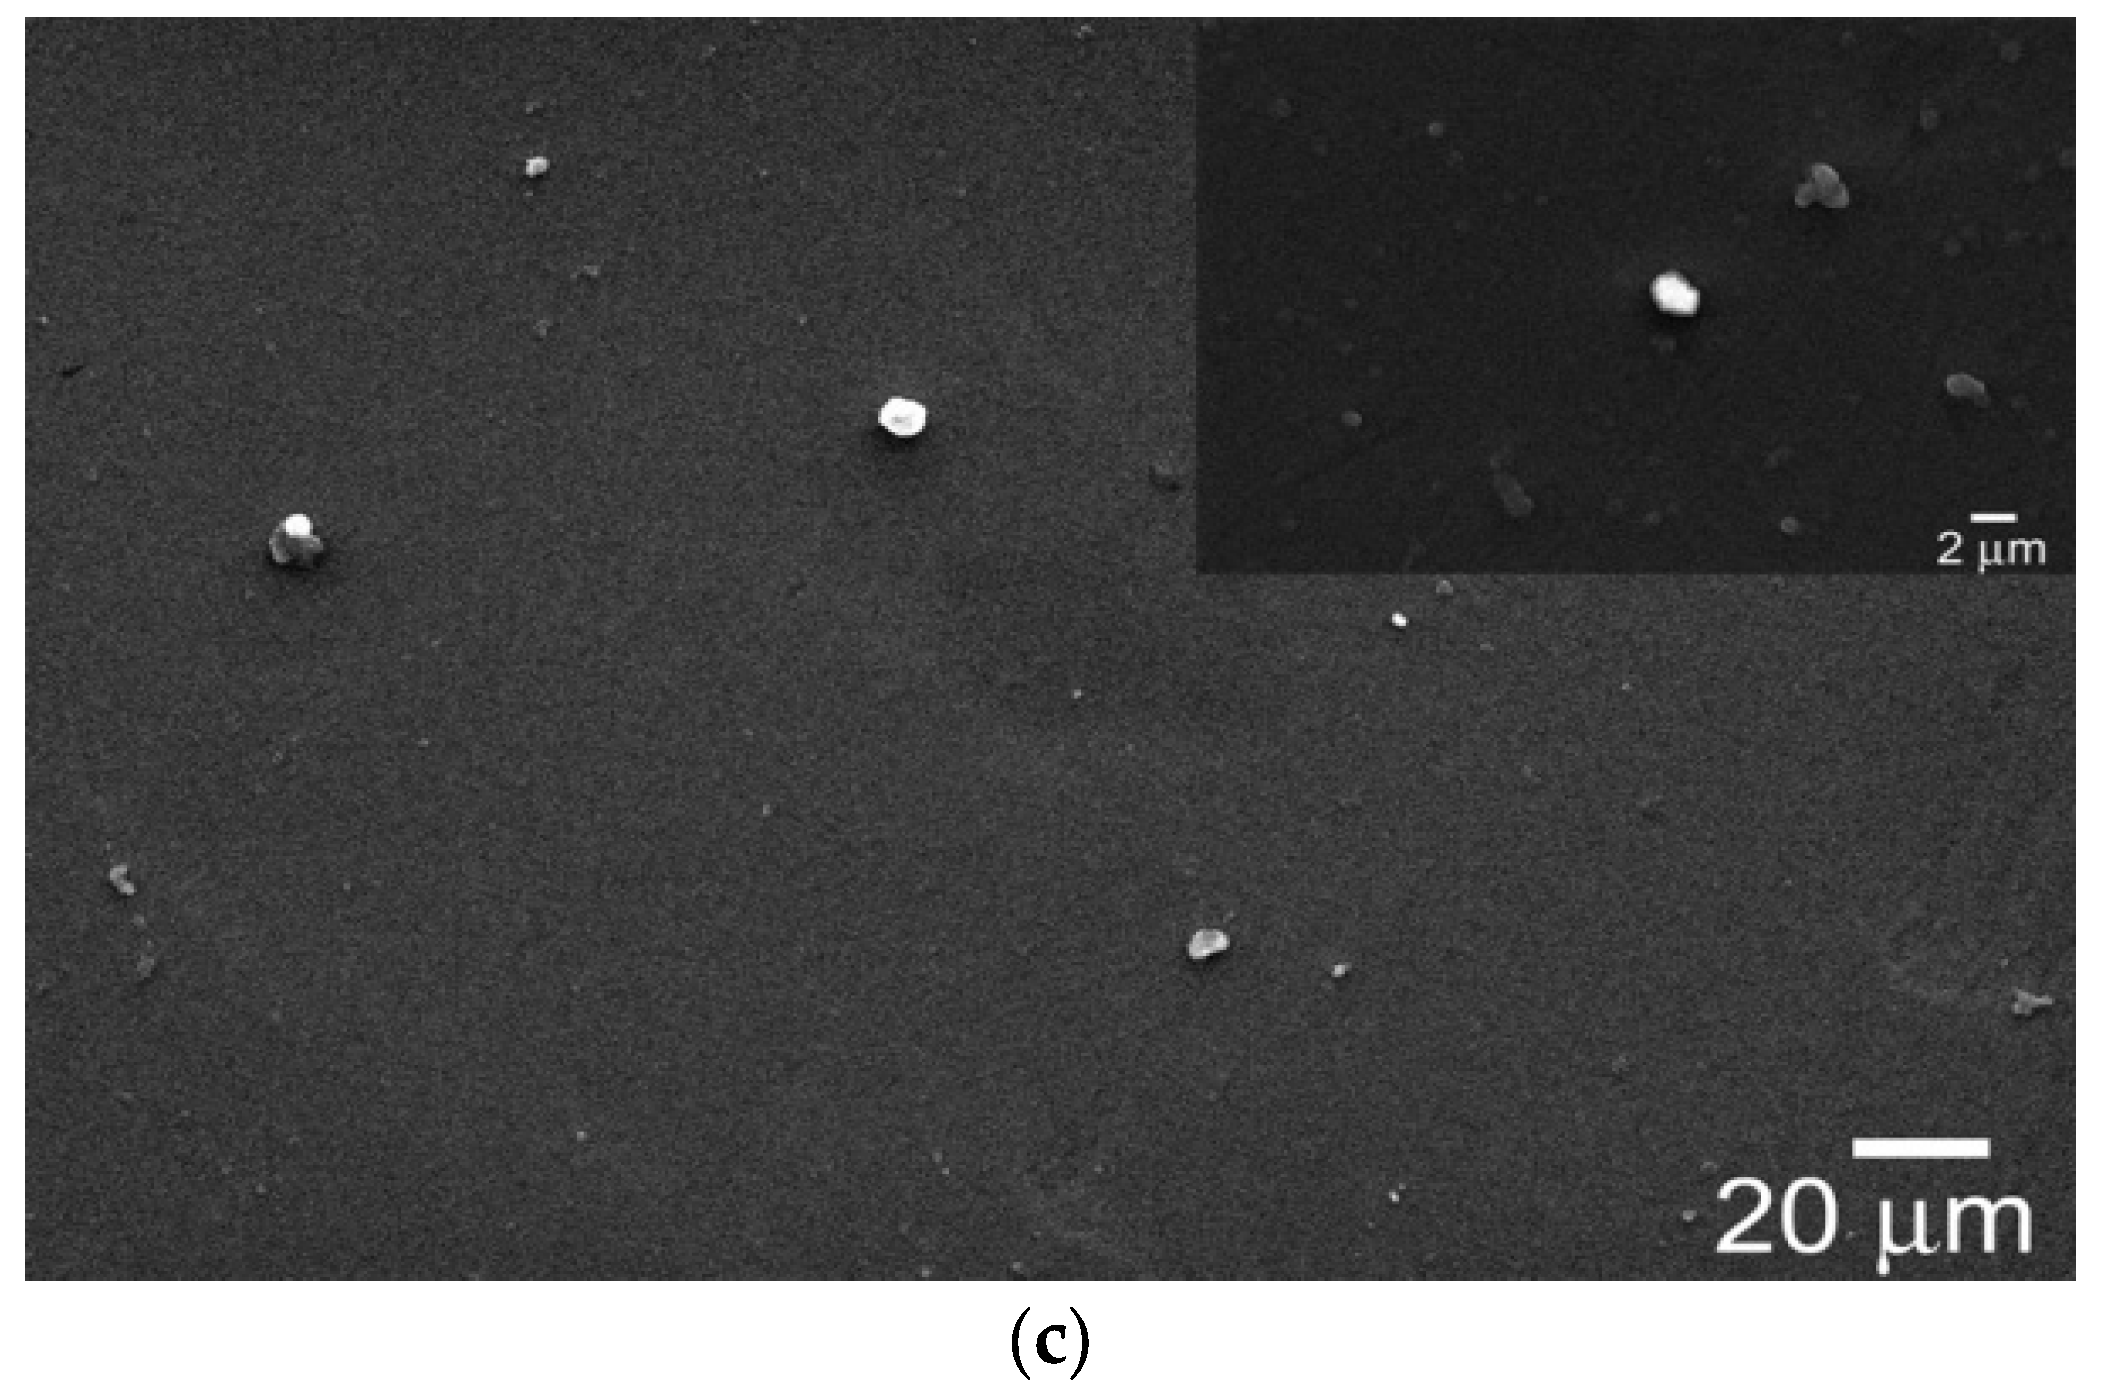
An observation of the surface morphology by a SEM is shown in Figure 8. Two kinds of depositions, light and dark particles are exhibited on the titanium matrix. Dark particles are significantly larger in number than light particles. It can be found that the number of dark particles is the largest on ECAPed Ti and the least on WQ one (Figure 8a,c). The EDS results examining the composition of light, dark particles and that of matrix are listed in Table 3. EDS results indicate that the dark and light particles are both composed of Ti, O, Ca and P. The dark particles on ECAPed CP–Ti consist of more O and less Ti compared with those on FC and WQ CP–Ti. The atomic ratio between Ca and P (Ca:P) is ranged in 1:0.6~1:7.4. A higher ratio (1:4.7–7.4) and also more P content are produced on ECAPed CP–Ti surface. The Ca:P ratio measured on FC CP–Ti is 1:0.65~1:0.77.
4. Discussion
The composition of CaP compound spontaneously formed on titanium surface will be changed with the increase of deposition time [15]. The chemical reaction taken place firstly is the formation of PO4 ion then the deposition of Ca. The chemical reaction proposed by Hanawa [15] associated with surface dissolution of titanium oxide is firstly
and then
TiO(OH)2 + HPO42− → TiO(HPO4) + 2OH−,
TiO(HPO4) + Ca2+ + 2OH− → CaTiO(HPO4)(OH)2.
Previous studies [22,26] on partial dissolution behaviour happening on titanium surface revealed hydrated porous structure formation and surface chemical composition modification. From this work it can be found that the ultrafine grained microstructure does promote the surface precipitates of CaP compound formation on titanium. The effect of microstructure is attributed to the formation kinetics of CaP compound. The CaP formation kinetics can be evaluated by Gibbs free energy occurring in the reactions of Equations (1) and (2). Gibbs free energy is a thermodynamic potential that can be used to calculate the maximum work performed by a chemical reaction at a constant temperature and pressure. An increase of the Gibbs free energy leads to an intensive chemical reaction expressed by in the Equations of (1) and (2) and more product quantity of CaP. The stored energy ED associated with severe plastic deformation and grain size is given by [27].
where k is the constant, θ is the tilt angle of the boundary and D is the grain size. The grain boundaries is separated into high angle boundary and low angle boundary by the title angle where θ ≤ 15° defined as low angle boundary and >15° defined as high angle boundary. From Equation (3) the smaller the grain size is, the larger the stored energy. If we correlate the stored energy with Gibbs free energy, it is to some degree understandable that the surface precipitates on ultrafine grained titanium are larger.
ED=kθ/D,
Surface roughness of titanium is another important issue affecting the surface attaching properties [3,4]. In this work, the specimen surface is treated with the same grinding and polishing process as described in the experimental. The surface roughness is attempted to ensure the same for different kinds of specimens.
5. Conclusions
The surface modification on CP–Ti specimens soaked in a pure N2 bubbled simulated body fluid with BSA addition due to different microstructure of substrate was investigated. ECAPed CP–Ti has a microstructure of ultrafine grain size averagely 3.3 µm, whereas FC and WQ CP–Ti has developed coarse grained Widmanstatten and martensite microstructure, respectively. The EIS measurement shows a larger charge transfer resistance for ECAPed CP–Ti than FC and WQ CP–Ti indicating a thicker film formation on ECAPed CP–Ti. A larger Warburg resistance is obtained on WQ CP–Ti specimens indicates a denser film formation on WQ CP–Ti.
The surface composition and morphology of different titanium specimens after 60 days soaking in the SBF solution are examined by XPS, EDS and SEM. It is found that the precipitates amount on ECAPed CP–Ti is the largest among three kinds of specimens. The precipitates contain O, Ti, Ca and P. More contents of O, Ti, Ca and P are deposited on the ECAPed CP–Ti. An increase of Ca:P ratio can be examined on ECAPed surface explaining that the P amount deposited on the surface of ECAPed Ti is increased comparing to other two type of specimens. These phenomena are attempted to be interpreted by the concept of Gibbs free energy of the surface reaction. Because of increased dislocation density and decreased grain size induced by ECAP process the store energy is increased and consequently the Gibbs free energy is higher, which leads to the increased amount of precipitates on ECAPed Ti. Enhanced osteoblast cell attachment on ultrafine grained Ti observed previously can be understood by this mechanism. A smaller amount of compound deposited on WQ CP–Ti may be related to the denser film formation on WQ CP–Ti.
This investigation is an attempt to understand how the microstructure of Ti substrate affects the chemical composition change of the Ti surface immersed in a SBF with BSA addition. More Ca, P and O contents are found in the surface composition on ultrafine grained Ti which do benefit to the bioactivity improvement of Ti implant practically. This finding provides a method for improving bio-bonding between implant and surround tissue.
Acknowledgments
Thanks for the grant from Jiangsu Natural Science Foundation (BK2011736).
Author Contributions
Q.Z. conceived and designed the experiments; C.H.Z. performed the experiments; Q.Z. and L.W. analyzed the data; Q.Z. wrote the paper.
Conflicts of Interest
The founding sponsors had no role in the design of the study; in the collection, analyses, or interpretation of data; in the writing of the manuscript, and in the decision to publish the results.
References
- Kim, T.N.; Balakrishnan, A.; Lee, B.C.; Kim, W.S.; Dvorankova, B.; Smetana, K.; Park, J.K.; Panigrahi, B.B. In vitro fibroblast response to ultra fine grained titanium produced by a severe plastic deformation process. J. Mater. Sci. Mater. Med. 2008, 19, 553–557. [Google Scholar] [CrossRef] [PubMed]
- Park, J.-W.; Kim, Y.-J.; Park, C.H.; Lee, D.-H.; Kod, Y.G.; Jang, J.-H.; Lee, C.S. Enhanced osteoblast response to an equal channel angular pressing-processed pure titanium substrate with microrough surface topography. Acta Biomater. 2009, 5, 3272–3280. [Google Scholar] [CrossRef] [PubMed]
- Estrin, Y.S.; Ivanova, E.P.; Michalska, A.; Truong, V.K.; Lapovok, R.; Boyd, R. Accelerated stem cell attachment to ultrafine grained titanium. Acta Biomater. 2011, 7, 900–906. [Google Scholar] [CrossRef] [PubMed]
- Truong, V.K.; Lapovok, R.; Estrin, Y.S.; Rundell, S.; Wang, J.Y.; Fluke, C.J.; Crawford, R.J.; Ivanova, E.P. The influence of nano-scale surface roughness on bacterial adhesion to ultrafine-grained titanium. Biomaterials 2010, 31, 3674–3683. [Google Scholar] [CrossRef] [PubMed]
- Faghihi, S.; Azari, F.; Li, H.; Bateni, M.R.; Szpunar, J.A.; Vali, H.; Tabrizian, M. The significance of crystallographic texture of titanium alloy substrates on pre-osteoblast responses. Biomaterials 2006, 27, 3532–3539. [Google Scholar] [CrossRef] [PubMed]
- Maleki-Ghaleh, H.; Hajizadeh, K.; Hadjizadeh, A.; Shakeri, M.S.; Alamdari, S.; Ghobadi Masoudfar, S.; Aghaie, E.; Javidi, M.; Zdunek, J.; Kurzydlowski, K.J. Electrochemical and cellular behavior of ultrafine-grained titanium in vitro. Mater. Sci. Eng. C 2014, 39, 299–304. [Google Scholar] [CrossRef] [PubMed]
- An, B.; Li, Z.; Diao, X.; Xin, H.; Zhang, Q.; Jia, X.; Wu, Y.; Li, K.; Guo, Y. In vitro and in vivo studies of ultrafine-grain Ti as dental implant material processed by ECAP. Mater. Sci. Eng. C 2016, 67, 34–41. [Google Scholar] [CrossRef] [PubMed]
- Zheng, C.Y.; Nie, F.L.; Zheng, Y.F.; Cheng, Y.; Wei, S.C.; Valiev, R.Z. Enhanced in vitro biocompatibility of ultrafine-grained titanium with hierarchical porous surface. Appl. Surf. Sci. 2011, 257, 5634–5640. [Google Scholar] [CrossRef]
- Lu, G.; Bernasek, S.L.; Schwartz, J. Oxidation of a polycrystalline titanium surface by oxygen and water. Surf. Sci. 2000, 458, 80–90. [Google Scholar] [CrossRef]
- Alkhateeb, E.; Virtanen, S. Influence of surface self-modification in Ringer’s solution on the passive behavior of titanium. J. Biomed. Mater. Res. Part A 2005, 75, 934–940. [Google Scholar] [CrossRef] [PubMed]
- Burgos-Asperilla, L.; Garcia-Alonso, M.C.; Escudero, M.L. Study of the interaction of inorganic and organic compounds of cell culture medium with a Ti surface. Acta Biomater. 2010, 2, 652–661. [Google Scholar] [CrossRef] [PubMed]
- Matykina, E.; Arrabal, R; Valiev, R.Z.; Molina-Aldareguia, J.M.; Belov, P.; Sabirov, I. Electrochemical anisotropy of nanostructured titanium for biomedical implants. Electrochim. Acta 2015, 176, 1221–1232. [Google Scholar] [CrossRef]
- Hodgson, A.W.E.; Mueller, Y.; Forster, D.; Virtanen, S. Electrochemical characterization of passive film on Ti alloys under simulated biological conditions. Electrochim. Acta 2002, 47, 1913–1923. [Google Scholar] [CrossRef]
- Hanawa, T.; Ota, M. Calcium phosphate naturally formed on titanium in electrolyte solution. Biomaterials 1991, 12, 767–774. [Google Scholar] [CrossRef]
- Hanawa, T.; Asami, K.; Asaoka, K. Repassivation of titanium and surface oxide film regenerated in simulated bioliquid. J. Biomed. Mater. Res. 1998, 40, 530–538. [Google Scholar] [CrossRef]
- Wu, W.; Nancollas, G.H. Kinetics of heterogeneous nucleation of calcium phosphates on anatase and rutile. J. Colloid Interface Sci. 1998, 199, 206–211. [Google Scholar] [CrossRef]
- Lima, J.; Sousa, S.R.; Ferreira, A.; Barbosa, M.A. Interactions between calcium, phosphate, and albumin on the surface of titanium. J. Biomed. Mater. Res. 2001, 55, 45–53. [Google Scholar] [CrossRef]
- Healy, K.E.; Ducheyne, P. Hydration and preferential molecular adsorption on titanium in vitro. Biomaterials 1992, 13, 553–561. [Google Scholar] [CrossRef]
- Skale, S.; Dolecek, V.; Slemnik, M. Substitution of the constant phase element by Warburg impedance for protective coating. Corros. Sci. 2007, 49, 1045–1055. [Google Scholar] [CrossRef]
- Tamilselvi, S.; Raman, V.; Rajendran, N. Corrosion behaviour of Ti–6Al–7Nb and Ti–6Al–4V ELI alloys in the simulated body fluid solution by electrochemical impedance spectroscopy. Electrochim. Acta 2006, 52, 839–846. [Google Scholar] [CrossRef]
- Yuan, X.X.; Xu, N.X. Determination of hydrogen diffusion coefficient in metal hydride electrode by modified Warburg impedance. J. Alloys Comp. 2001, 329, 115–120. [Google Scholar] [CrossRef]
- Cvijović-Alagić, I.; Cvijović, Z.; Bajat, J.; Rakin, M. Composition and processing effects on the electrochemical characteristics of biomedical titanium alloys. Corros. Sci. 2014, 83, 245–254. [Google Scholar] [CrossRef]
- Assis, S.L.; Wolynec, S.; Costa, I. The electrochemical behaviour of Ti–13Nb–13Zr alloy in various solutions. Mater. Corros. 2008, 59, 739–743. [Google Scholar] [CrossRef]
- Alves, V.A.; Reis, R.Q.; Santos, I.C.B.; Souza, D.G.; Goncalves, T.F.; Pereirada-Silva, M.A.; Rossi, A.; Silva, L.A. In situ impedance spectroscopy study of the electrochemical corrosion of Ti and Ti–6Al–4V in simulated body fluid at 25 °C and 37 °C. Corros. Sci. 2009, 51, 2473–2482. [Google Scholar] [CrossRef]
- National Institute of Standards and Technology (NIST) XPS Database Selected Element Search Menu. Available online: http://srdata.nist.gov/xps/selEnergyType.aspx (accessed on 5 October 2015).
- Pan, J.; Thierry, D.; Leygraf, C. Electrochemical impedance spectroscopy study of the passive oxide film on titanium for implant application. Electrochim. Acta 1996, 41, 1143–1153. [Google Scholar] [CrossRef]
- Humphreys, F.J.; Hatherly, M. Recrystallization and Related Annealing Phenomenon, 2nd ed.; Elsevier: Oxford, UK, 2004; pp. 12–24. [Google Scholar]
- Oliveira, N.C.M.; Moura, C.C.G.; Zanetta-Barbosa, D.; Mendonça, D.B.S.; Cooper, L.; Mendonça, G.; Dechichi, P. Effects of titanium surface nodization with CaP incorporation on human osteoblastic response. Mater. Sci. Eng. C 2013, 33, 1958–1962. [Google Scholar] [CrossRef] [PubMed]
- Carlier, A.; Chai, Y.C.; Moesen, M.; Theys, T.; Schrooten, J.; Van Oosterwyck, H.; Geris, L. Designing optimal calcium phosphate scaffold-cell combinations using an integrative model-based approach. Acta Biomater. 2011, 7, 3573–3585. [Google Scholar] [CrossRef] [PubMed]
- Hong, Y.J.; Chun, J.-S.; Lee, W.-K. Association of collagen with calcium phosphate promoted osteogenic responses of osteoblast-like MG63 cells. Colloids Surf. B Biointerfaces 2011, 83, 245–253. [Google Scholar] [CrossRef] [PubMed]
Figure 1.
Electronic backscatter diffraction (EBSD) mapping of the microstructures of (a) equal channel angular pressing (ECAP); (b) water quenching (WQ); and (c) Furnace cooling (FC) CP–Ti.
Figure 1.
Electronic backscatter diffraction (EBSD) mapping of the microstructures of (a) equal channel angular pressing (ECAP); (b) water quenching (WQ); and (c) Furnace cooling (FC) CP–Ti.
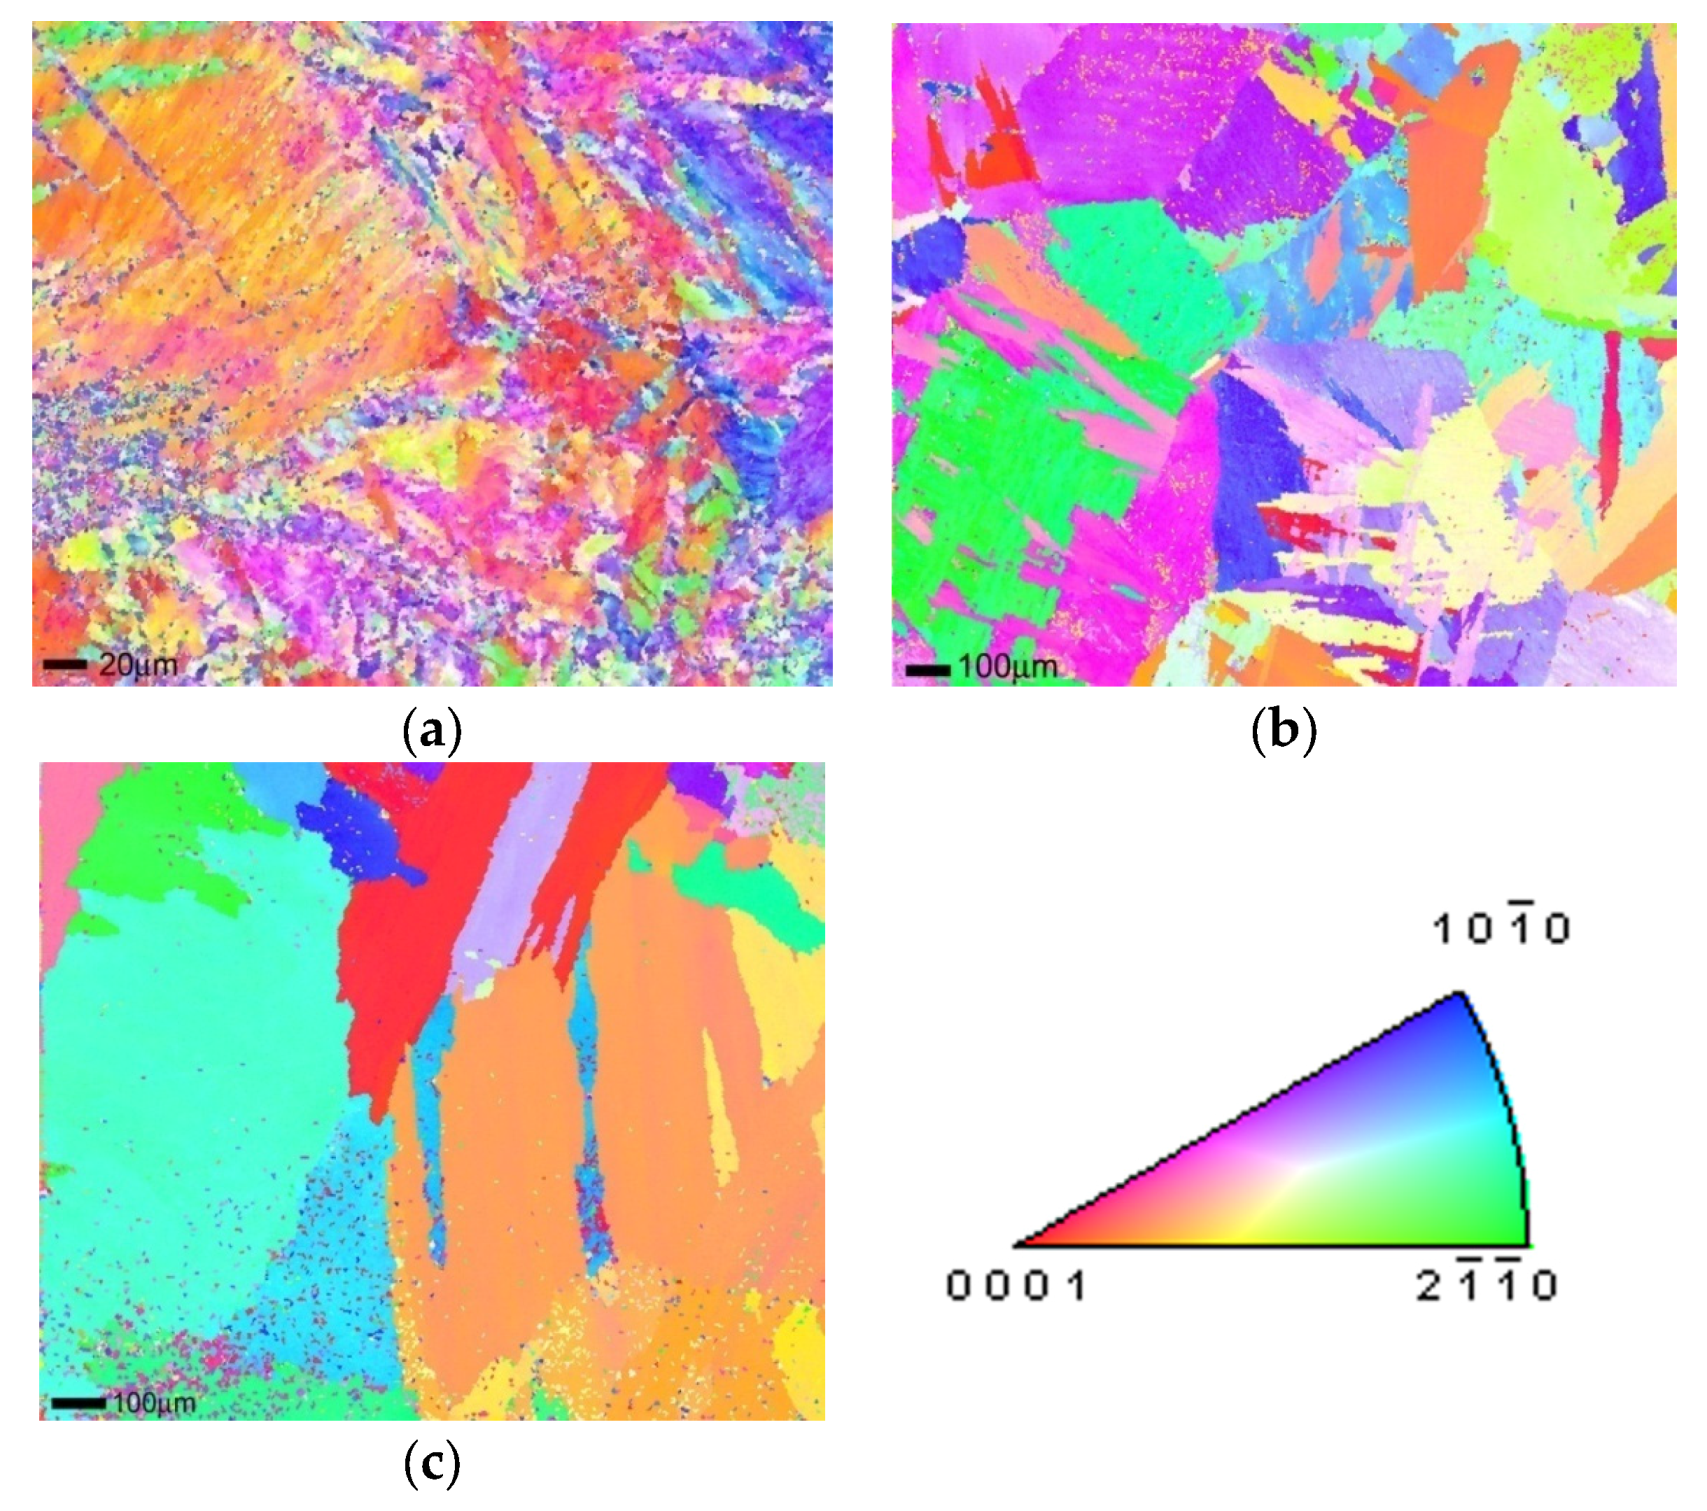
Figure 2.
(a) Nyquist plots; and (b) Bode plots of CP–Ti after ECAP and heat treatments.

Figure 3.
Equivalent electric circuits by best fitting simulation of the data obtained from electrochemical impedance spectroscopy (EIS) measurement of (a) ECAP CP–Ti; and (b) FC and WQ CP–Ti specimens.CPE: constant phase element, Rs: solution resistance, Rt: charge transfer resistance, W: Warburg element.

Figure 4.
High resolution spectra of O 1s on CP–Ti after soaking in simulated body fluid (SBF). (a) ECAPed CP–Ti; and (b) Comparison of three types of specimens: ECAPed, FC and WQ.
Figure 4.
High resolution spectra of O 1s on CP–Ti after soaking in simulated body fluid (SBF). (a) ECAPed CP–Ti; and (b) Comparison of three types of specimens: ECAPed, FC and WQ.
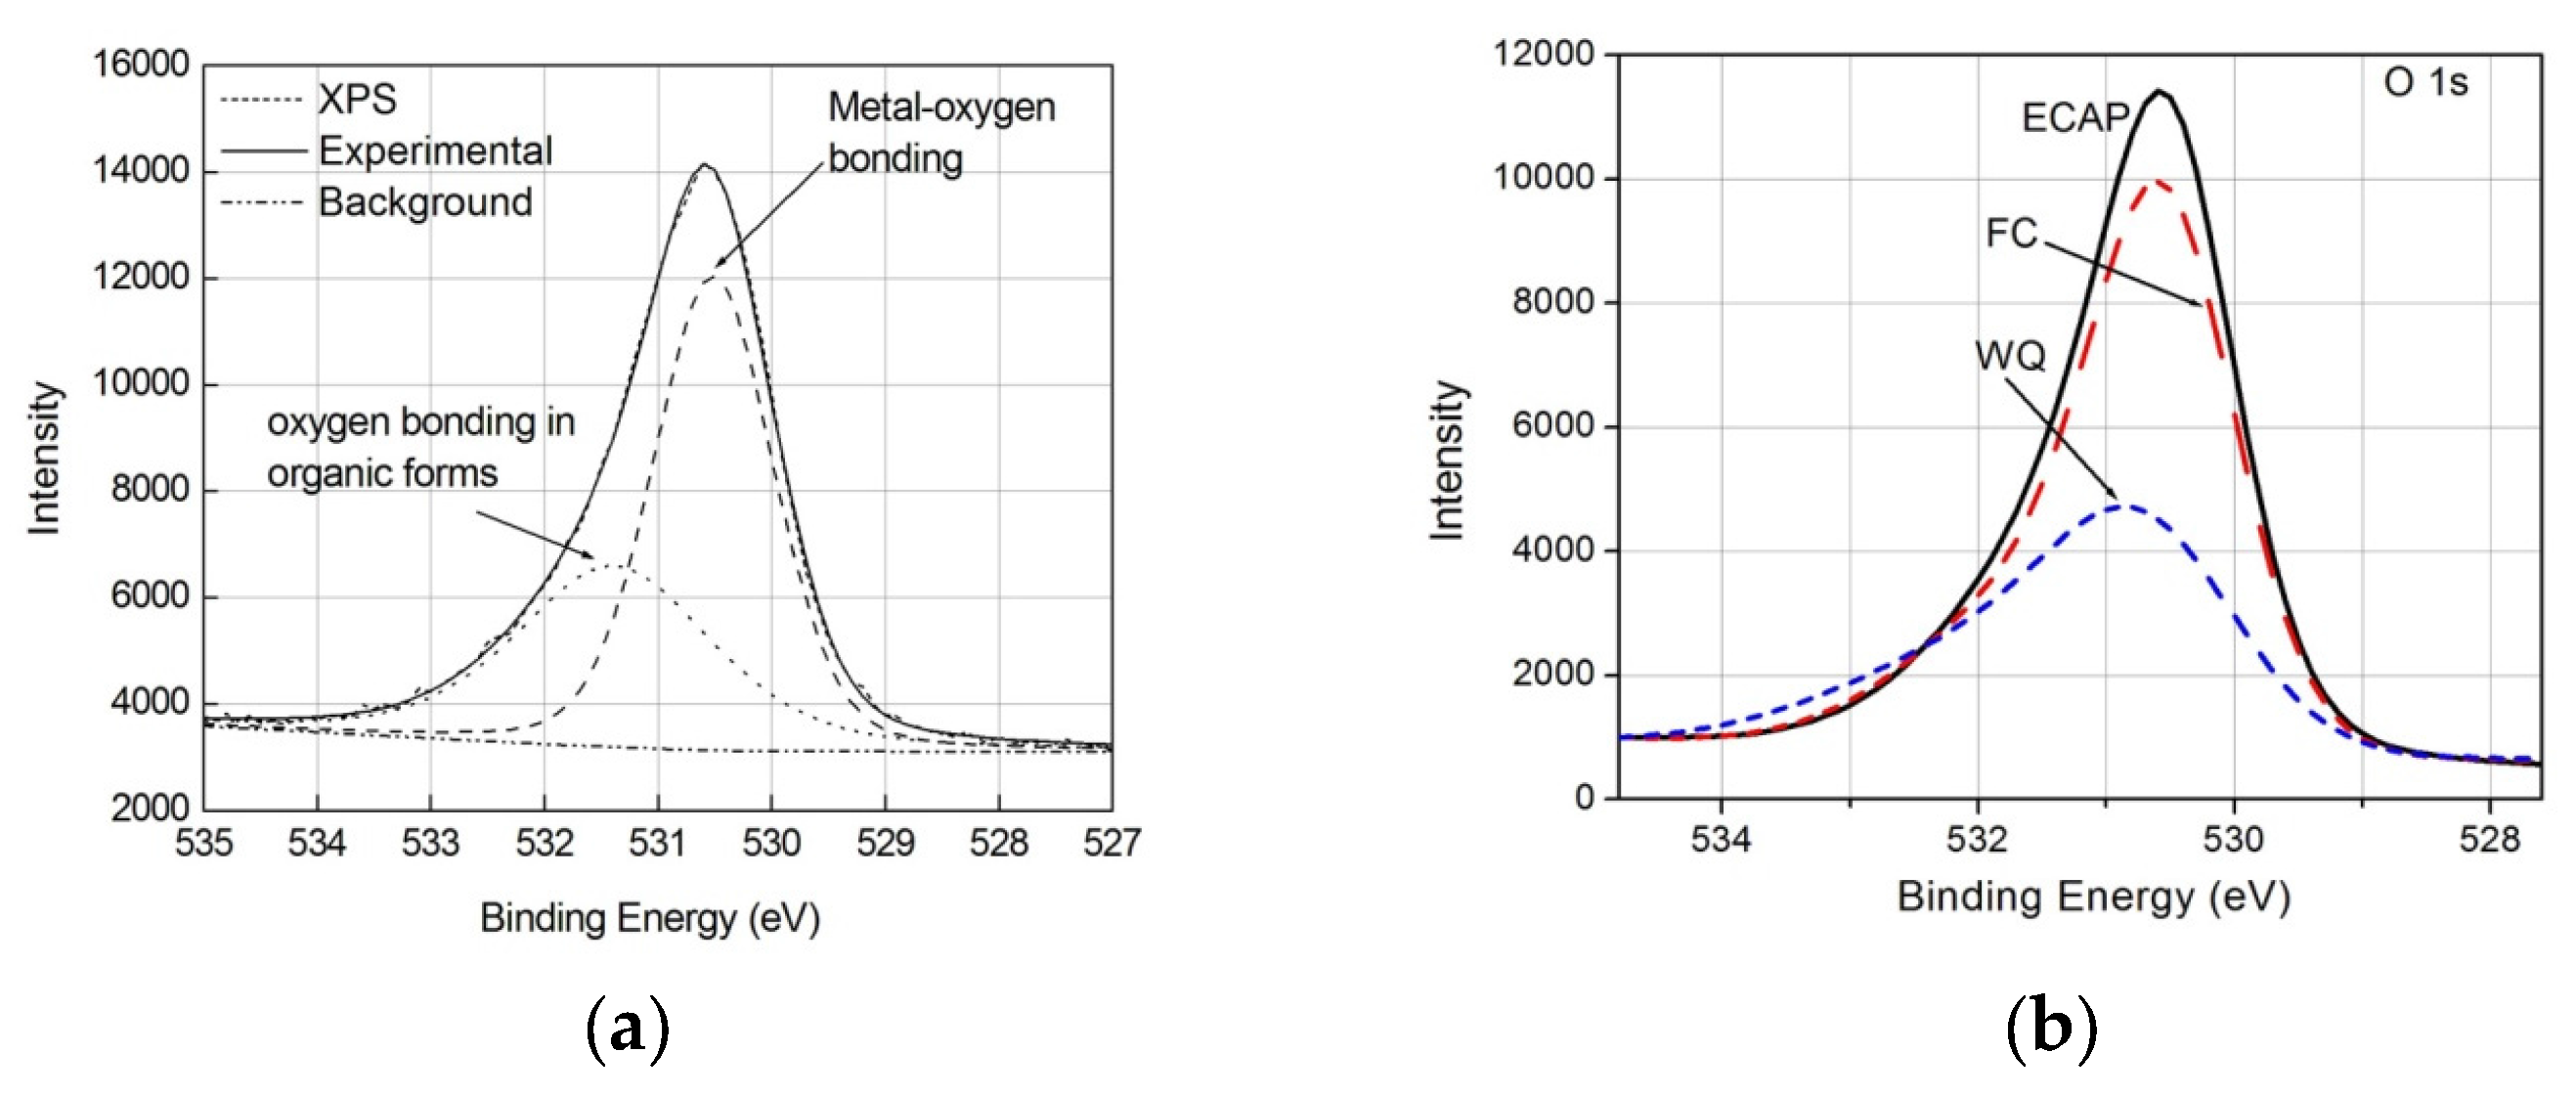
Figure 5.
High resolution spectra of Ti 2p on CP–Ti after soaking in SBF. (a) ECAPed CP–Ti; and (b) Comparison of three types of specimens: ECAPed, FC and WQ.
Figure 5.
High resolution spectra of Ti 2p on CP–Ti after soaking in SBF. (a) ECAPed CP–Ti; and (b) Comparison of three types of specimens: ECAPed, FC and WQ.

Figure 6.
High resolution spectra of Ca 2p on CP–Ti after soaking in SBF. (a) ECAPed CP–Ti; and (b) Comparison of three types of specimens: ECAPed, FC and WQ.
Figure 6.
High resolution spectra of Ca 2p on CP–Ti after soaking in SBF. (a) ECAPed CP–Ti; and (b) Comparison of three types of specimens: ECAPed, FC and WQ.

Figure 7.
High resolution spectra of P 2p on CP–Ti after soaking in SBF. (a) ECAPed CP–Ti; and (b) Comparison of three types of specimens: ECAPed, FC and WQ.
Figure 7.
High resolution spectra of P 2p on CP–Ti after soaking in SBF. (a) ECAPed CP–Ti; and (b) Comparison of three types of specimens: ECAPed, FC and WQ.
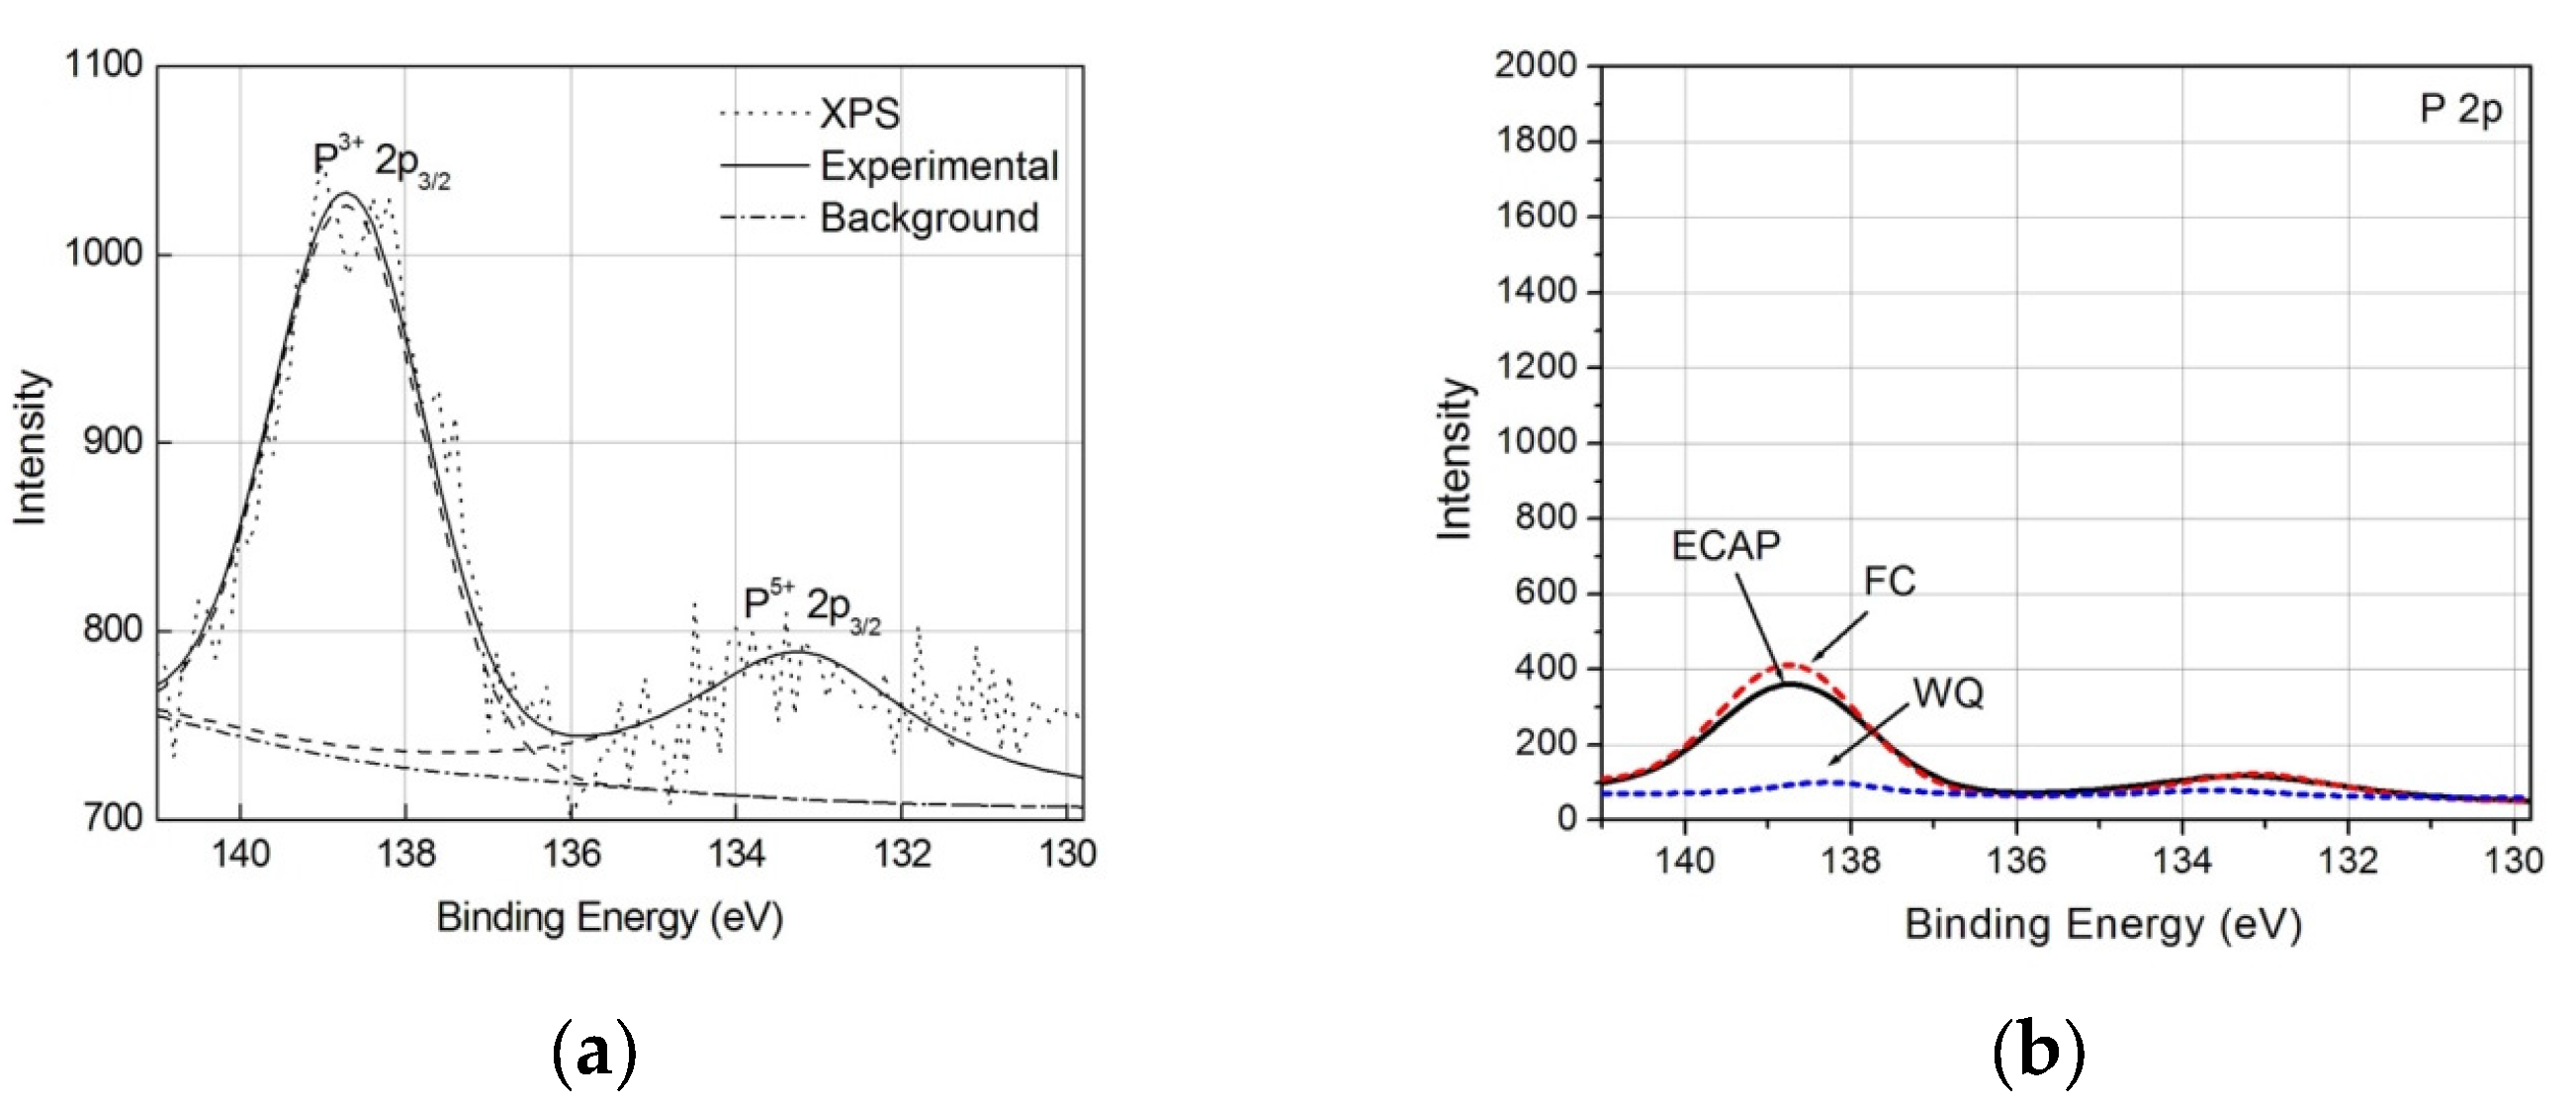
Figure 8.
Scanning electron microscope (SEM) photographs of (a) ECAP; (b) FC; (c) WQ CP–Ti after soaking in SBF.
Figure 8.
Scanning electron microscope (SEM) photographs of (a) ECAP; (b) FC; (c) WQ CP–Ti after soaking in SBF.


Table 1.
Equivalent electric circuit parameters for CP–Ti.
| Specimen Types | Rs (Ω·cm2) | Q (Ω−1·cm−2·sn) | n | Rt (Ω·cm2) | σ (Ω−1·cm−2·s0.5) |
|---|---|---|---|---|---|
| FC | 21.82 + 2.27/−4.17 | (5.54 + 2.34/−1.28) × 10−5 | 0.863 + 0.034/−0.035 | 1201.13 + 467.9/−45.5 | 0.0063 + 0.0019/−0.0021 |
| WQ | 25.19 + 2.66/−3.39 | (4.42 + 3.04/−2.12) × 10−5 | 0.882 + 0.048/−0.054 | 4452.0 + 664/−157 | 0.0049 + 0.0012/−0.0020 |
| ECAP | 21.5 ± 5.93 | (7.85 ± 1.07) × 10−5 | 0.773 ± 0.019 | 6043.5 ± 733.5 | - |
FC: Furnace cooling; WQ: water quenching; ECAP: equal channel angular pressing.
Table 2.
Surface film composition and atomic percentage measured semi-quantitatively by X-ray photoelectron spectroscopy (XPS) on CP–Ti after soaking in simulated body fluid (SBF) (at %).
Table 2.
Surface film composition and atomic percentage measured semi-quantitatively by X-ray photoelectron spectroscopy (XPS) on CP–Ti after soaking in simulated body fluid (SBF) (at %).
| Sample | O 1s | Ti 2p | Ca 2p | P 2p | N 1s |
|---|---|---|---|---|---|
| ECAP | 36.2 | 20.3 | 0.5 | 1.0 | 1.6 |
| FC | 31.2 | 17.5 | 0.5 | 0.4 | 1.7 |
| WQ | 22.2 | 17.2 | <0.1 | <0.1 | 4.3 |
Table 3.
Energy dispersive spectrometer (EDS) atomic percentages of the elements deposited on ECAP, FC and WQ CP–Ti (at %) and Ca:P ratio.
Table 3.
Energy dispersive spectrometer (EDS) atomic percentages of the elements deposited on ECAP, FC and WQ CP–Ti (at %) and Ca:P ratio.
| Specimens | Measured Places | O | Ti | P | Ca | Ca:P |
|---|---|---|---|---|---|---|
| ECAP-1 * | Matrix | 13.72 | 74.18 | 0.152 | 0 | - |
| Dark particle | 16.08 | 55.66 | 0.127 | 0.016 | 1:7.7 | |
| ECAP-2 | Matrix | 12.34 | 72.18 | 0 | 0.019 | - |
| Dark particle 1 | 17.55 | 46.86 | 0.076 | 0.015 | 1:5.2 | |
| Dark particle 2 | 13.73 | 54.24 | 0.114 | 0.024 | 1:4.7 | |
| FC-1 | Matrix | 3.49 | 92.54 | 0.015 | 0.023 | 1:0.6 |
| Light particle | 12.84 | 58.83 | 0.295 | 0.441 | 1:0.7 | |
| Dark particle | 8.01 | 61.89 | 0.033 | 0.043 | 1:0.8 | |
| FC-2 | Matrix | 4.27 | 91.00 | 0.116 | 0 | - |
| Light particle | 53.40 | 9.29 | 0 | 0 | - | |
| Dark particle | 6.28 | 78.04 | 0.026 | 0 | - | |
| WQ-1 | Matrix | 4.36 | 82.86 | 0.068 | 0 | - |
| Light particle | 37.88 | 16.36 | 0.081 | 0.070 | 1:1.2 | |
| WQ-2 | Matrix | 4.00 | 91.44 | 0.145 | 0 | - |
| Dark particle 1 | 6.18 | 81.33 | 0.147 | 0 | - | |
| Dark particle 2 | 3.61 | 90.37 | 0.187 | 0 | - |
* ECAP-1 and ECAP-2 mean two ECAPed specimens are examined by EDS.
© 2017 by the authors. Licensee MDPI, Basel, Switzerland. This article is an open access article distributed under the terms and conditions of the Creative Commons Attribution (CC BY) license (http://creativecommons.org/licenses/by/4.0/).
Share and Cite
MDPI and ACS Style
Zhou, Q.; Wang, L.; Zou, C.-H. Enhanced Surface Precipitates on Ultrafine-Grained Titanium in Physiological Solution. Metals 2017, 7, 245. https://doi.org/10.3390/met7070245
AMA Style
Zhou Q, Wang L, Zou C-H. Enhanced Surface Precipitates on Ultrafine-Grained Titanium in Physiological Solution. Metals. 2017; 7(7):245. https://doi.org/10.3390/met7070245
Chicago/Turabian StyleZhou, Qing, Lei Wang, and Cheng-Hong Zou. 2017. "Enhanced Surface Precipitates on Ultrafine-Grained Titanium in Physiological Solution" Metals 7, no. 7: 245. https://doi.org/10.3390/met7070245
Note that from the first issue of 2016, this journal uses article numbers instead of page numbers. See further details here.