Article

Low Cycle Fatigue Behaviour of DP Steels: Micromechanical Modelling vs. Validation

1
Institute of Material Research and Testing, Bauhaus-University Weimar, 99421 Weimar, Germany
2
Department of Aerospace Engineering, University of Michigan, Ann Arbor, MI 48109, USA
3
Department of Materials Test Engineering (WPT), TU Dortmund University, D-44227 Dortmund, Germany
*
Authors to whom correspondence should be addressed.
Metals 2017, 7(7), 265; https://doi.org/10.3390/met7070265
Submission received: 22 June 2017 / Revised: 5 July 2017 / Accepted: 6 July 2017 / Published: 11 July 2017
(This article belongs to the Special Issue Microstructure based Modeling of Metallic Materials)

Abstract

:
This study aims to simulate the stabilised stress-strain hysteresis loop of dual phase (DP) steel using micromechanical modelling. For this purpose, the investigation was conducted both experimentally and numerically. In the experimental part, the microstructure characterisation, monotonic tensile tests and low cycle fatigue tests were performed. In the numerical part, the representative volume element (RVE) was employed to study the effect of the DP steel microstructure of the low cycle fatigue behavior of DP steel. A dislocation-density based model was utilised to identify the tensile behavior of ferrite and martensite. Then, by establishing a correlation between the monotonic and cyclic behavior of ferrite and martensite phases, the cyclic deformation properties of single phases were estimated. Accordingly, Chaboche kinematic hardening parameters were identified from the predicted cyclic curve of individual phases in DP steel. Finally, the predicted hysteresis loop from low cycle fatigue modelling was in very good agreement with the experimental one. The stabilised hysteresis loop of DP steel can be successfully predicted using the developed approach.

1. Introduction

Dual phase (DP) steels, as a popular type of high strength low alloy steels, offer desirable mechanical properties such as high strength and good formability [1]. These properties derive from the special microstructure of the DP steel, which is obtained through proper alloying and suitable thermomechanical treatment [2]. DP steel has a unique microstructure consisting of a soft ferrite matrix and varied volume fraction of metastable hard martensite, which result in a combination of high work hardening and high ductility [3,4]. These favourable mechanical properties have led to the extensive use of DP steels in the construction of different automobile parts [5,6].
Until now, an extensive number of studies have been conducted in order to better understand the effect of microstructure on the mechanical properties of DP steel [7,8,9,10]. Sun et al. [11] predicted the ductile failure of DP steels in the form of plastic strain localisation resulting from the strain partitioning between the harder martensite phase and the softer ferrite matrix. Shen et al. [12] performed the in situ SEM investigations in order to assess the strain partitioning between ferrite and martensite in DP steel. The results show that the micro-fracture occurs in soft ferrite regions rather than in the martensite phase. However, Mazinani and Poole [13] studied the effect of martensite plasticity on the mechanical properties of a DP steel. They observed damage nucleation mainly in martensite islands. Ramazani et al. [14] investigated the effect of martensite banding on the failure initiation in the dual phase steel and reported that DP steel with equiaxed microstructures shows better failure behavior than the banded one does, although the failure mechanism (martensite cracking) is the same in both microstructures. They used the extended finite element method (XFEM) to model martensite cracking on the mesoscale.
In spite of comprehensive studies about the monotonic deformation behavior of DP steels, there are relatively few research papers about the cyclic deformation of this kind of metal. Since most structural components are subjected to different cyclic loading during the service application, fatigue behavior is considered as an important topic to be investigated. Suresh [15] provides a comprehensive description of the mechanics and micro-mechanisms of fatigue. He concluded that fatigue cracks mostly initiate from stress concentration points where the plastic deformation occurs. Sherman et al. [16] observed the high rate of work hardening during the cyclic loading of DP steel, which is a consequence of its special microstructure. Mediratta et al. [17] studied the low cycle fatigue (LCF) behavior of DP steels with different martensite morphologies and found that the microstructure plays an important role in the LCF behavior of DP steel. Hadianfard [18] investigated the effect of strain amplitude on the LCF behavior of DP steel. His results showed that at low strain amplitudes, the damage was started at the ferrite/martensite interface and passed through areas with low density of martensite. Recently, Paul et al. [19] studied the effect of maretnsite volume fraction of dual phase steel on the low cycle fatigue. He concluded that the martensite percentage is connected to the cyclic hardening and softening behavior of DP steels. Also, it is observed that a prominent dislocation cell substructure formed in the ferrite phase, regardless of the martensite volume fraction.
As the quantifying variability of fatigue strength requires extensive and time consuming experimental studies, in the last two decades considerable progress has been made in simulating and predicting the fatigue failure in steel. McDowell and Dunne [20] emphasised the importance of such mesoscopic simulations to understand the role of microstructure attributes in the distribution of driving forces within grains for the fatigue crack formation. They developed the microstructure-sensitive crystal plasticity modelling method to compute the distributions of slip in polycrystals. One main goal of their work was to develop computational schemes to reduce the number of experiments. Furthermore, the mechanism of fatigue on a microscopic scale has been extensively investigated in many research studies by Mughrabi et al. [21,22]. Furthermore, Shenoy et al. [23,24] conducted a hierarchical model that provides the systematic linkage of the macroscale model to the microstructure. Steglich et al. [25] investigated the micromechanical modelling of cyclic plasticity incorporating damage. Their work used continuum approaches based on porous metal plasticity and continuum damage mechanics to predict the cyclic plastic response, and they applied nonlinear kinematic hardening to describe deformation under cyclic loading realistically. Paul [26] adopted a microstructure-based micromechanical modelling approach to describe the tensile and cyclic plastic deformation in DP590 steel, and thereby determined that the cyclic strain accumulation in the DP steel with an inhomogeneous microstructure is the basic mode of cyclic deformation.
In a previous study [27], we successfully applied the micromechanical modelling to simulate the effect of martensite fraction on the cyclic behavior of DP steel. Accordingly, the aim of this work is to develop a microstructure-based computational scheme that can be used to assist estimating the stabilised hysteresis loop of DP steel, taking into account the microstructural features.

2. Experimental

2.1. Material

In this study, galvanised hot rolled DP600 steel with a thickness of 2 mm is used which is supplied by Thyssenkrupp AG (Essen, Deutschland). The nominal chemical composition of DP600 steel is given in Table 1.
The quantification of microstructures was carried out by standard metallographic procedures. The samples were etched by 3% Nital for about 2 s. The metallographic images were captured along the thickness direction. The digital images from the optical microscope were converted into a black and white image by means of a grey scale threshold binarisation (ferrite—white, martensite—black). The ferrite grain size was determined through the linear intercept method (ASTM Standard E 112) [28] and the martensite fraction was determined by quantifying the area fraction of dark areas. The microstructure of material consists of 80% ferrite and 20% martensite, as shown in Figure 1. The mean ferrite grain size is 5.33 µm.

2.2. Mechanical Testing

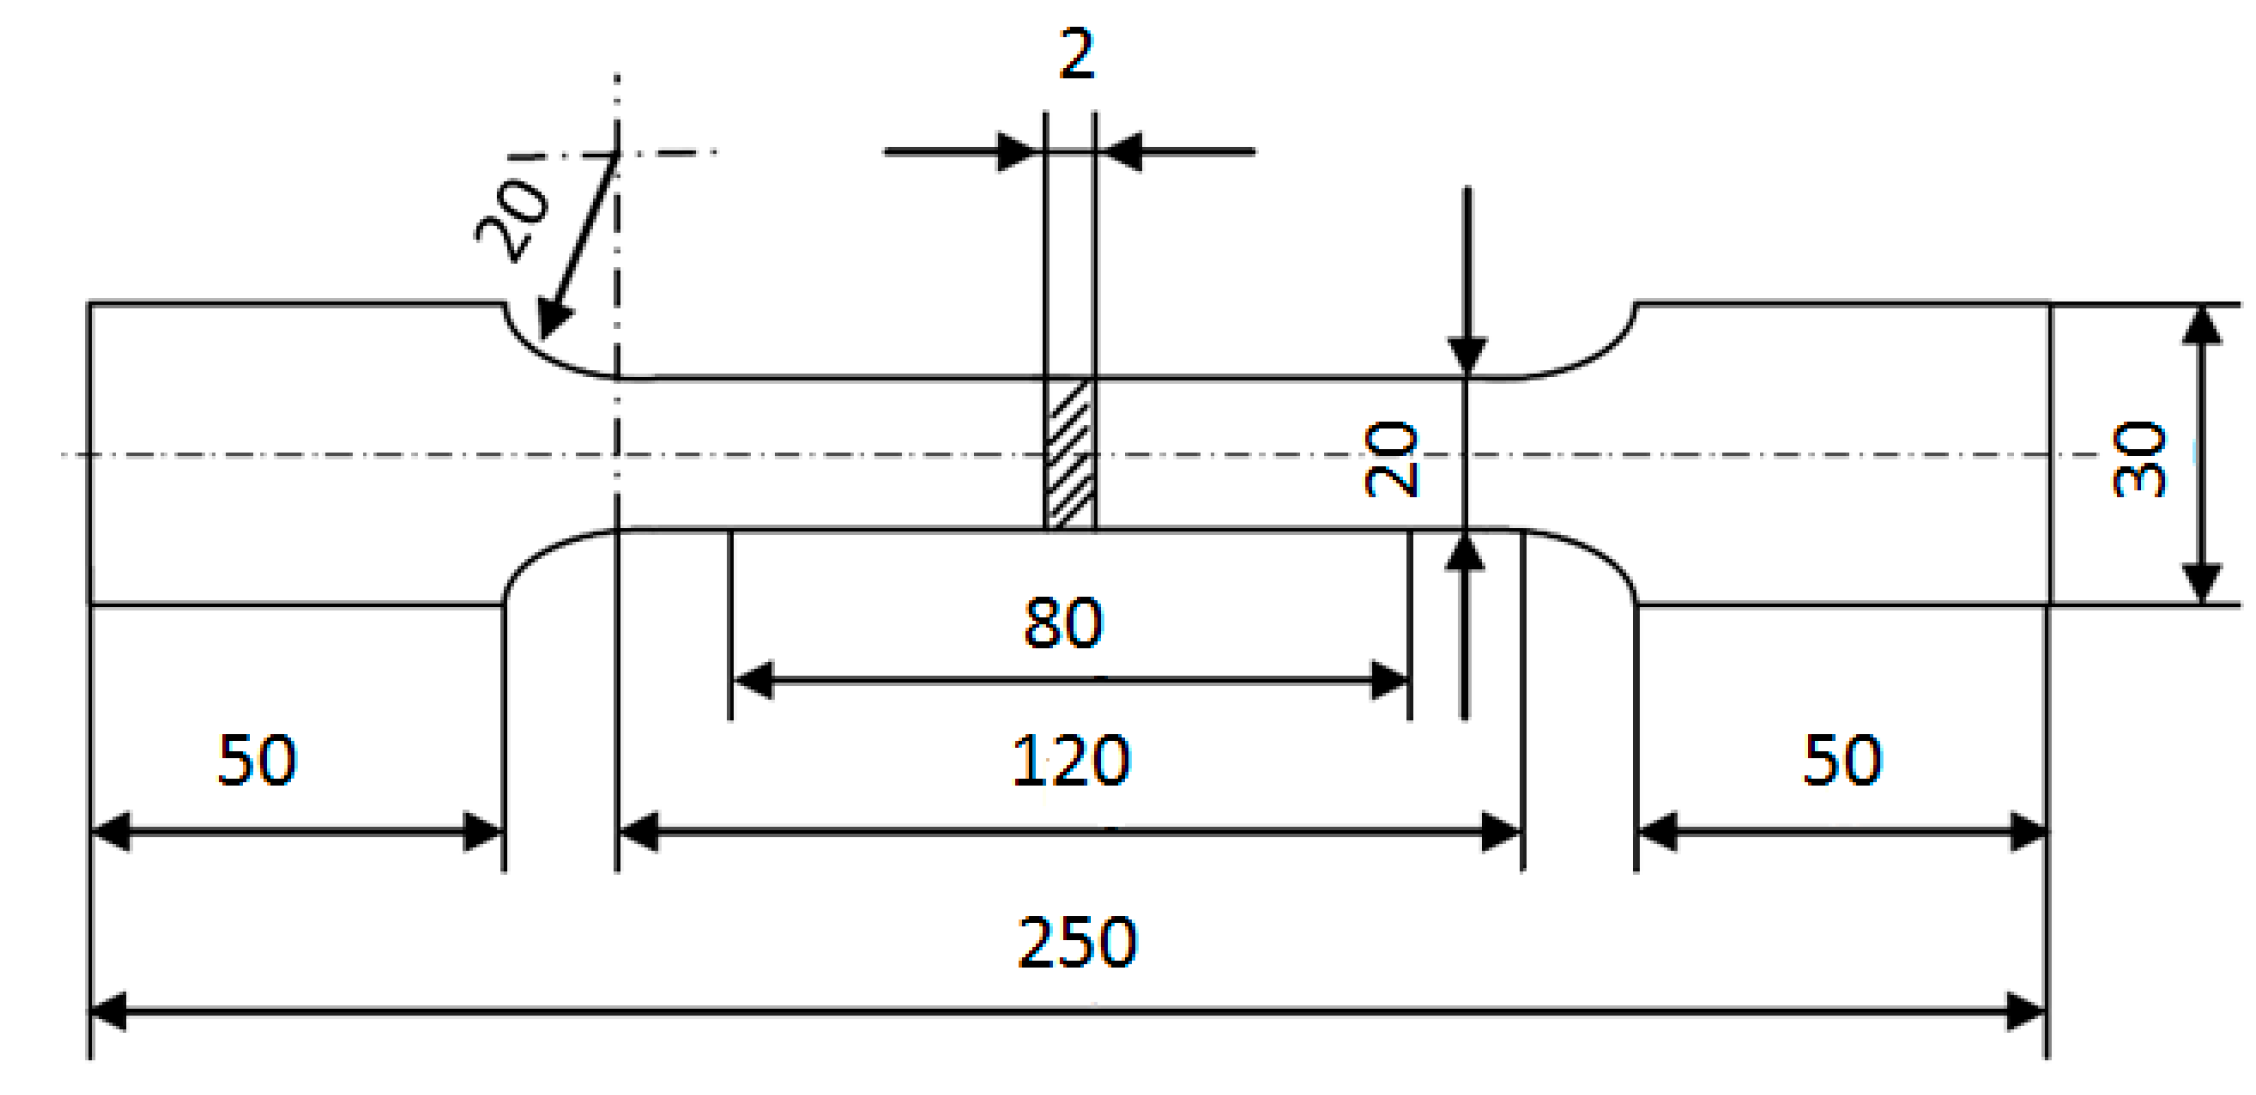
Uniaxial tensile testing was performed at a constant crosshead speed of 4 mm/min, and three repetitions were conducted. Tensile samples were cut with the laser cutting machine according to BS EN ISO 6892-1:2009 [29] and their surfaces were carefully grinded and polished in order to reduce the effect of surface condition. More details regarding alternatives for specimen manufacturing and surface finishing can be found in study [30]. The tensile tests were performed parallel to the rolling direction using a Zwick/Roell Z100 tensile testing machine (Zwick/Roell, Ulm, Germany). The geometry of the tensile test specimen is shown in Figure 2. Additionally, tensile testing results are shown in Table 2, where Sy, Su and El stand for yield strength, ultimate strength and elongation, respectively.
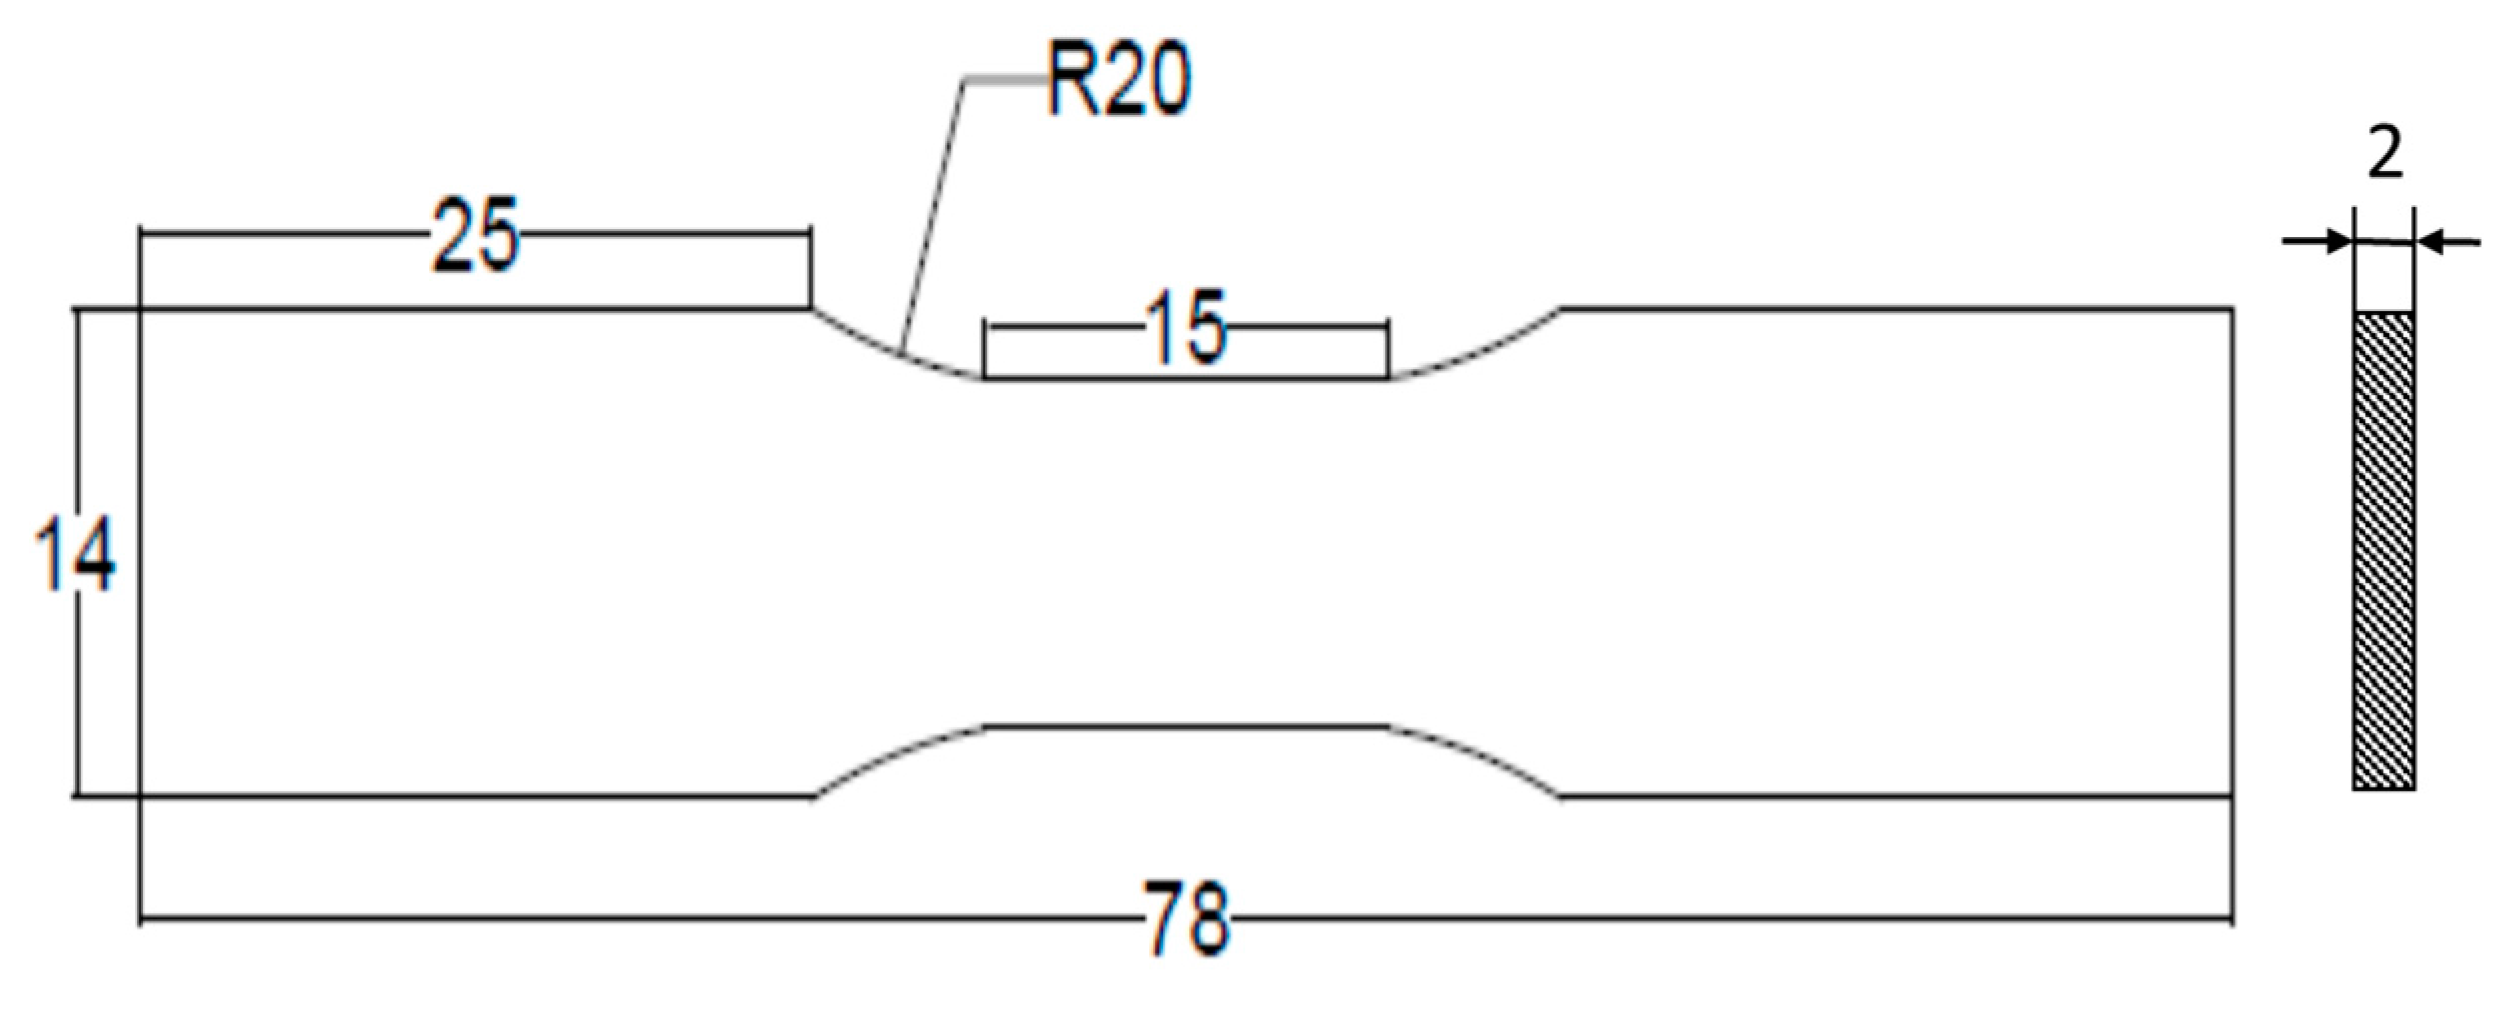
A uniaxial strain controlled low cycle fatigue test was carried out to achieve the smooth and stabilised hysteresis curve. Fully reversed (R = −1) fatigue tests were performed in accordance with ASTM E606/E606M-12 [31] on the 25 kN servo-hydraulic machine. A total strain amplitude of 0.5% was applied at a constant strain rate of 0.02 s−1. Additionally, the anti-buckling restraints were used to prevent the buckling of thin samples under compression. The fatigue test was performed until the stabilised hysteresis stress-strain loop was achieved. The sample geometry used for the low cycle fatigue test is demonstrated in Figure 3.

3. Micromechanical Modelling

Micromechanical modelling is a powerful approach to describe the effect of the microstructure of heterogeneous materials on their macroscopic and failure behavior. The connection between the microstructure and modelling is performed by means of combined finite element modelling (FEM) and representative volume element (RVE). RVE can make a bridge between different scales and represent the real multiphase microstructure. Three important features of micromechanical modelling are (i): RVE definition, which can embody the essential features of whole microstructure; (ii): the constitutive description of mechanical behavior of single phases and (iii): a homogenisation method to predict the macroscopic mechanical behavior.

3.1. RVE Generation

A 2D representative volume element (RVE), which is intended to be representative of the entire sample, was first created from the microstructures of studied DP steel. The selected area of the light optical microscopy (LOM) image of the experimental microstructure was converted into a 2D RVE, taking advantage of the color difference between martensite and ferrite, using an in-house finite element generator, Gitter [32]. The smallest satisfactory dimension of the RVE in DP steels is 24 µm × 24 µm, which should contain a minimum of 19 martensite particles, as reported by Ramazani et al. [16]. The RVE size was therefore taken to be 40 µm × 40 µm. Plane stress elements (CPS4R) were employed for the numerical simulation. Additionally, the effect of the mesh size was studied by Ramazani et al. [33] with the element length ranging from 0.1 to 2 µm, and no deviation was obtained for the meshes finer than 0.25 µm. Therefore, in the current study, quadratic meshes with an element size of 0.25 µm were used for the modelling. Figure 4 shows the light optical microscopic picture of DP600 steel and the selected RVE for micromechanical modelling of DP600 steel.

3.2. Single Phase Flow Curve Modelling

Few models have been described in the literature to quantify the constitutive behavior of single phases. They quantified the flow resistance on a slip plane taking into account Burger’s vector, the line direction and the density of dislocations on all other slip planes [7].
In the current work, the elastic modulus for ferrite and martensite is assumed to be 210 GPa. The flow curve of individual phases for ferrite and martensite at room temperature is quantified based on a dislocation-based strain hardening model of Rodriguez and Gutierrez [34]. This model emerges from the classical dislocation theory approaches of Bergström [35] and Estrin/Mecking [36] and from the work of Gil-sevillano [37]. The model constants are quantified by Rodriguez [34] and are reported in Equations (1) and (2):
σ ( in   MPa ) = σ 0 + Δ σ + α × M × μ × b × 1 exp ( M k r ε ) k r × L ,
where σ and ε are responsible for the true stress (von Mises stress) and true strain (equivalent plastic strain), respectively. The first term σ0 takes the contribution of the lattice friction and the elements in solid solution into account. This contribution can be calculated by application of Peierls stress, which is the required shear stress to move a dislocation within a plane of atoms in the unit cell [38].
σ 0 ( in   MPa ) = 77 + 750 ( % P ) + 60 ( % Si ) + 80 ( % Cu ) + 45 ( % Ni ) + 60 ( % Cr ) + 80 ( % Cr ) + 80 ( % Mn ) + 11 ( % Mo ) + 5000 ( % N ss ) .
The second term, Δσ, provides strengthening by precipitation or carbon in the solution. In the case of ferrite it is:
Δ σ ( in   MPa ) = 5000 × ( % C ss f ) ,
while for martensite it is:
Δ σ ( in   MPa ) = 3065 × ( % C ss m ) 161 ,
where % C ss f denote the carbon content (wt %) in ferrite and % C ss m is the carbon content (in wt %) in martensite, as reported by Thomser et al. [39]
The third term consists of the effects of dislocation strengthening as well as work softening due to recovery. The variables were deducted from Rodriguez [34] and Ramazani et al. [40,41] and are given in Table 3.
The carbon content of ferrite ( C ss f ) was approximated using the ThermoCalc software (Thermo-Calc Software, Solna, Sweden) with the TCFe6 database. The following elements were taken into account for the ThermoCalc calculations: Mn, C, Si and Cr. The carbon content of the martensite ( C ss m ) was calculated by considering the carbon mass balance and based on the following relation Equation (5):
C DP = C ss f V f + C ss m V m ,
where Vf , and Vm, are ferrite and martensite volume fractions, measured experimentally based on the ASTM-E562 standard [28], respectively. CDP stands for the nominal carbon composition of the DP steel.
The corresponding engineering stress and strain quantities are related to the true quantities as follows:
ε eng = exp ( ε ) 1 ,
σ eng = σ / ( 1 + ε eng ) .

3.3. Correlation among Monotonic Flow Curve and Cyclic Behavior of Single Phases

Determination of the cyclic deformation properties of single phases during the tension-compression loading requires specific experiments as well as significant time and costs. Several researchers have developed correlation models to predict the cyclic deformation behavior of steels from monotonic tensile properties and hardness [42,43,44,45]. Smith et al. [46] discovered the correlation between the hardening or softening behavior and the ratio of ultimate tensile strength to yield strength (Su/Sy) from sixteen materials including steel, aluminium and titanium alloys. According to their results, all materials for which Su/Sy ≥ 1.4 hardened under cyclic straining, and those for which Su/Sy ≤ 1.2, cyclically softened.
Recently, Lopez and Fatemi [47] derived a method for estimating the cyclic deformation properties of steels from the common tensile properties. Their proposed correlation successfully predicted the cyclic deformation properties of steels with higher accuracy, compared to the other methods. They predicted the cyclic strain hardening exponent (n′) based on the ultimate tensile strength (Su) and yield strength and utilised a cyclic strength coefficient (K′) value based on (Su). Their results showed that the predicted cyclic stress-strain curves based on his method approximated the experimental cyclic stress-strain curve reasonably well.
The cyclic deformation behavior is typically determined from the steady-state material stress-strain response in constant amplitude strain-controlled fatigue tests. The cyclic deformation is defined by the Ramberg-Osgood type equation in which the true stress amplitude (∆σ/2) versus the calculated true plastic strain amplitude (∆εp/2) data is as follows:
Δ σ 2 = K ( Δ ε P 2 ) n .
According to the authors of [26], in this study the cyclic strength coefficient (K′) and cyclic strain hardening exponent (n′) of the Ramberg-Osgood law were evaluated using the data obtained through the monotonic tensile test.
For steels of which Su/Sy is greater than 1.2, the cyclic strength coefficient (K′) and cyclic strain hardening exponent (n′) can be estimated as follows:
K′ = 1.16 (Su) + 593, if Su/Sy > 1.2;
K′ = 3.0 × 10⁻⁴ (Su)2 + 0.23 (Su) + 619, if Su/Sy ≤ 1.2,
n = 0.33 ( S y S u ) + 0.40 .
Therefore, the stabilised cyclic stress-strain curves of single phases can be predicted by substituting the predicted values of K′ and n′ into Equation (8).

3.4. Kinematic Hardening Parameters for Single Phases

One characteristic of fatigue in metals is work hardening under reversed loading conditions. Various kinematic hardening models are commonly proposed to simulate the cyclic plastic deformation behavior of a material, such as Prager [48], Armstrong and Frederick [49], Chaboche [50], Ohno and Wang [51]. Lately, researchers such as Bari and Hassan [52] have compared the various models of kinematic hardening with experimental data. According to their research studies, Chaboche’s model can be considered an appropriate model to simulate the cyclic plastic deformation.
The kinematic hardening model proposed by Chaboche [50] is based on a decomposition of the non-linear kinematic hardening rule proposed by the Armstrong and Frederick hardening [49] models. This decomposition is mainly significant in better describing the three critical segments of a stable hysteresis curve. These segments are: (i) the initial modulus when yielding starts; (ii) the nonlinear transition of the hysteresis curve after yielding starts until the curve becomes linear again; (iii) the linear segment of the curve in the range of higher stains. The model is in the form of:
σ = σ 0 + i = 1 3 C i γ i tanh ( γ i ε p ) .
In this instance, ε p denote the plastic strain. Ci and γi are Chaboche material constants. In the third order Chaboche model, the index i denotes the individual back-stress tensor, ranging from 1 to 3. The first term in Equation (13) represents the hardening modulus and the second term is a “recall term” that exhibits the nonlinear effect. The material constant γi controls the hardening rate during the plastic deformation. The total back stress is a summation of three back stresses (α = α1 + α2 + α3) in which the first back stress (α1) presents the high plasticity modulus at the yielding point which saturates rapidly. The second back stress (α2) presents the nonlinear part of the hysteresis curve and the last back stress (α3) simulates the linear hardening at a higher strain range. The loading part of the flow curve is represented as:
σ = σ 0 + α 1 + α 2 + α 3 ,
where σ0 is the cyclic yield stress. According to the suggestion by Chaboche [50] to determine the material parameters from the stabilised hysteresis curve, all material parameters are identified from the predicted cyclic stress-plastic strain curve of the individual phases, as discussed in Section 3.3. The value of C1 is determined from the slope of the stress-strain curve at the yield point. The value of γ1 should be large enough that α1 saturates rapidly. C3 can be determined as a constant slope of the stress-strain curve at a high strain range. Also, the value of C2 and γ2 were proposed by trial and error in order to satisfy Equation (12).

4. Results and Discussion

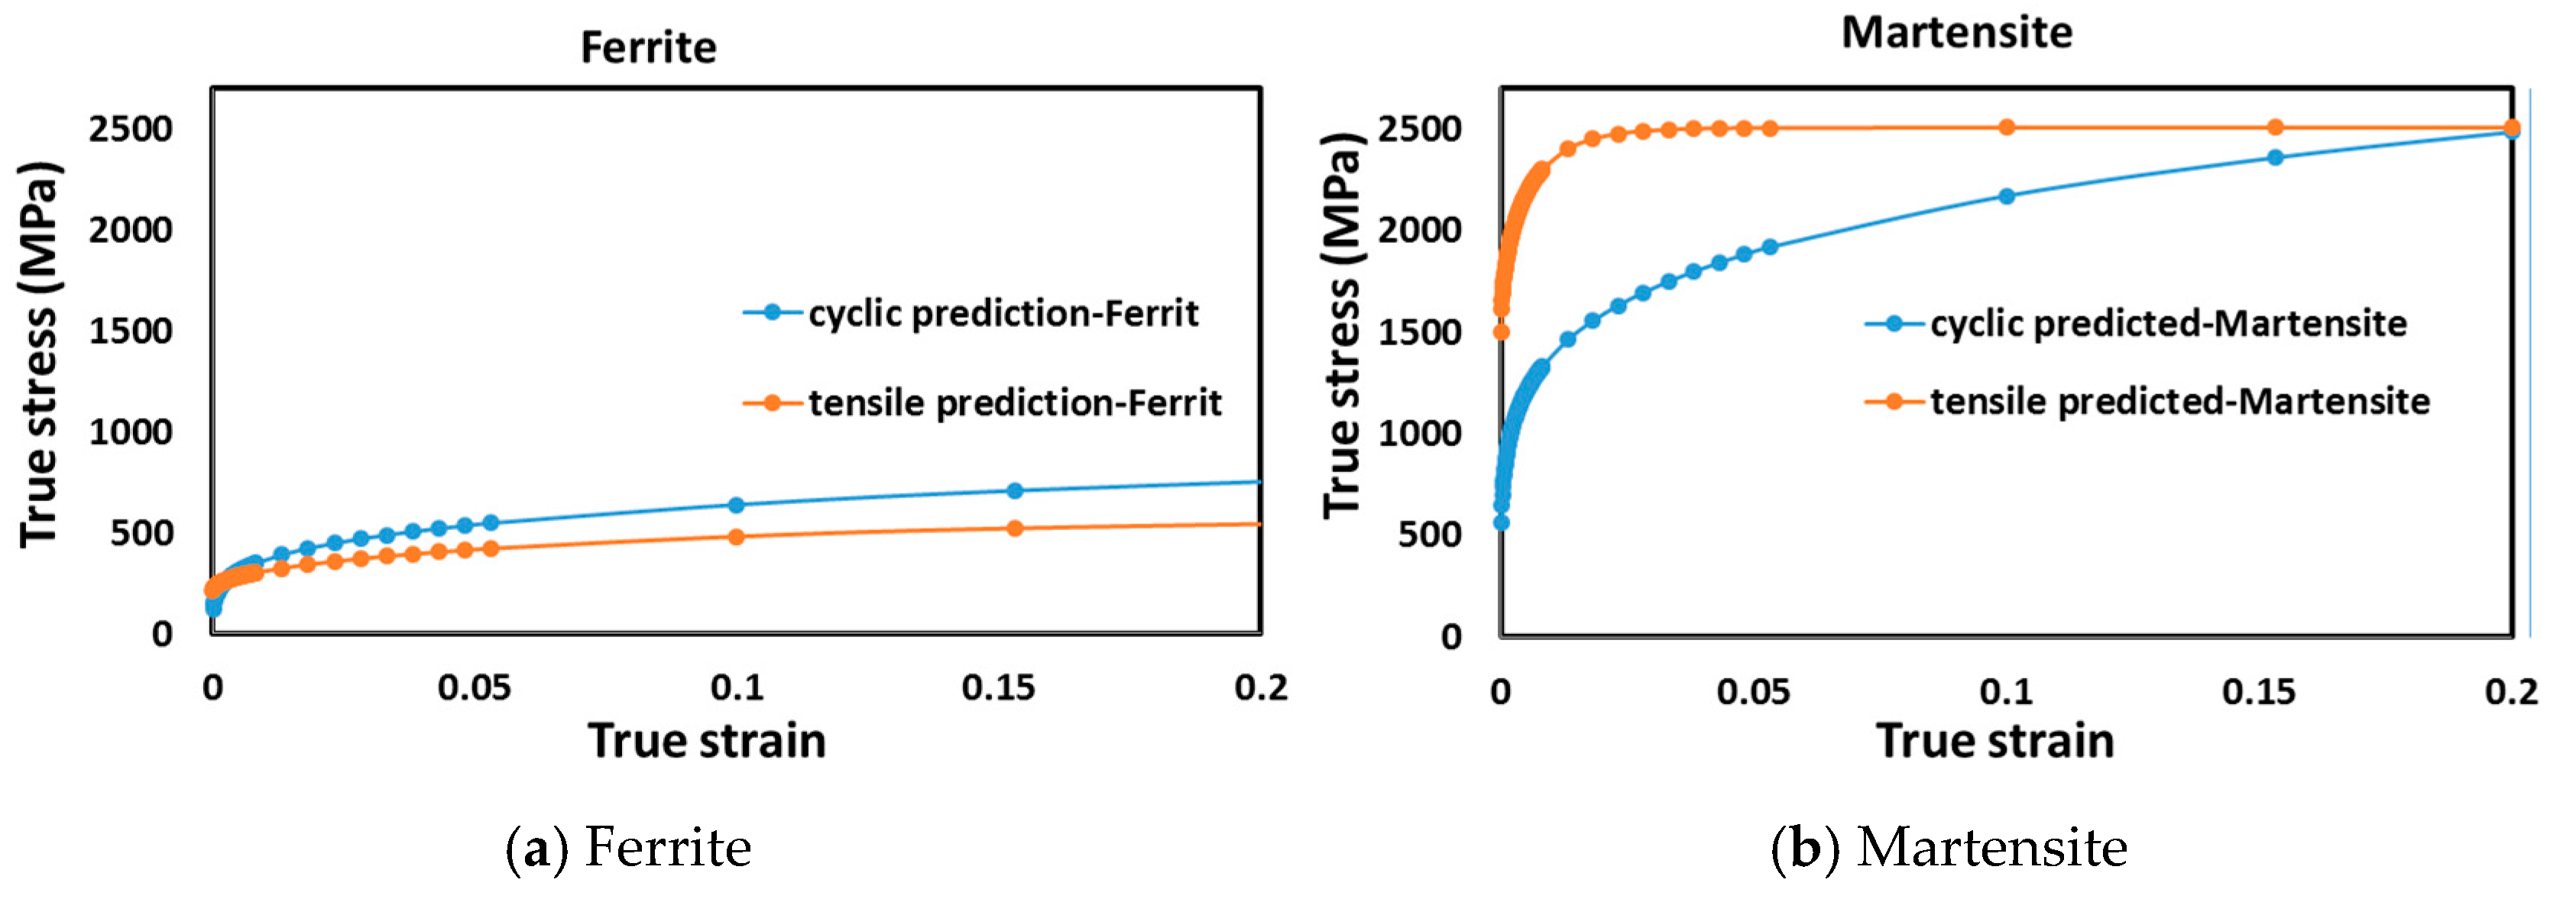
The monotonic flow behavior of each phase is determined from the dislocation-based strain hardening model, as discussed in Section 3.2. Additionally, the engineering ultimate tensile strength and yield strength of each phase were calculated according to Equations (6) and (7). The saturated cyclic stress-strain curve of each phase was estimated according to the tensile properties of individual phases and the Ramberg-Osgood equation, Section 3.3, and plotted in Figure 5.
The cyclic hardening/softening behavior of a material can be explained by differences between the tensile and cyclic stress-strain curve. A material shows cyclic hardening when the tensile stress-strain curve lies below the cyclic curve, and cyclic softening if the tensile stress-strain curve lies above the cyclic stress-strain curve. Therefore, for ferrite as a soft material, the cyclic stress-strain curve is above the tensile curve, showing the cyclic hardening behavior. While, for martensite, the cyclic stress-strain curve is lower than its tensile flow curve, indicating the cyclic softening behavior.
According to [16], for materials that are initially soft, such as ferrite, the dislocation density is low. During the inelastic deformation, the density of dislocations increases rapidly, which leads to a decrease in dislocation mobility and therefore, the material is said to cyclically harden, and the cyclic yield strength becomes greater than the monotonic yield strength. On the other hand, for the hard martensite, inelastic strain cycling results in the rearrangement of dislocations and makes them less resistant to deformation. Thus, dislocations are able to circumnavigate around microstructural barriers and the material cyclically softens, and the cyclic yield strength is less than the monotonic yield strength.
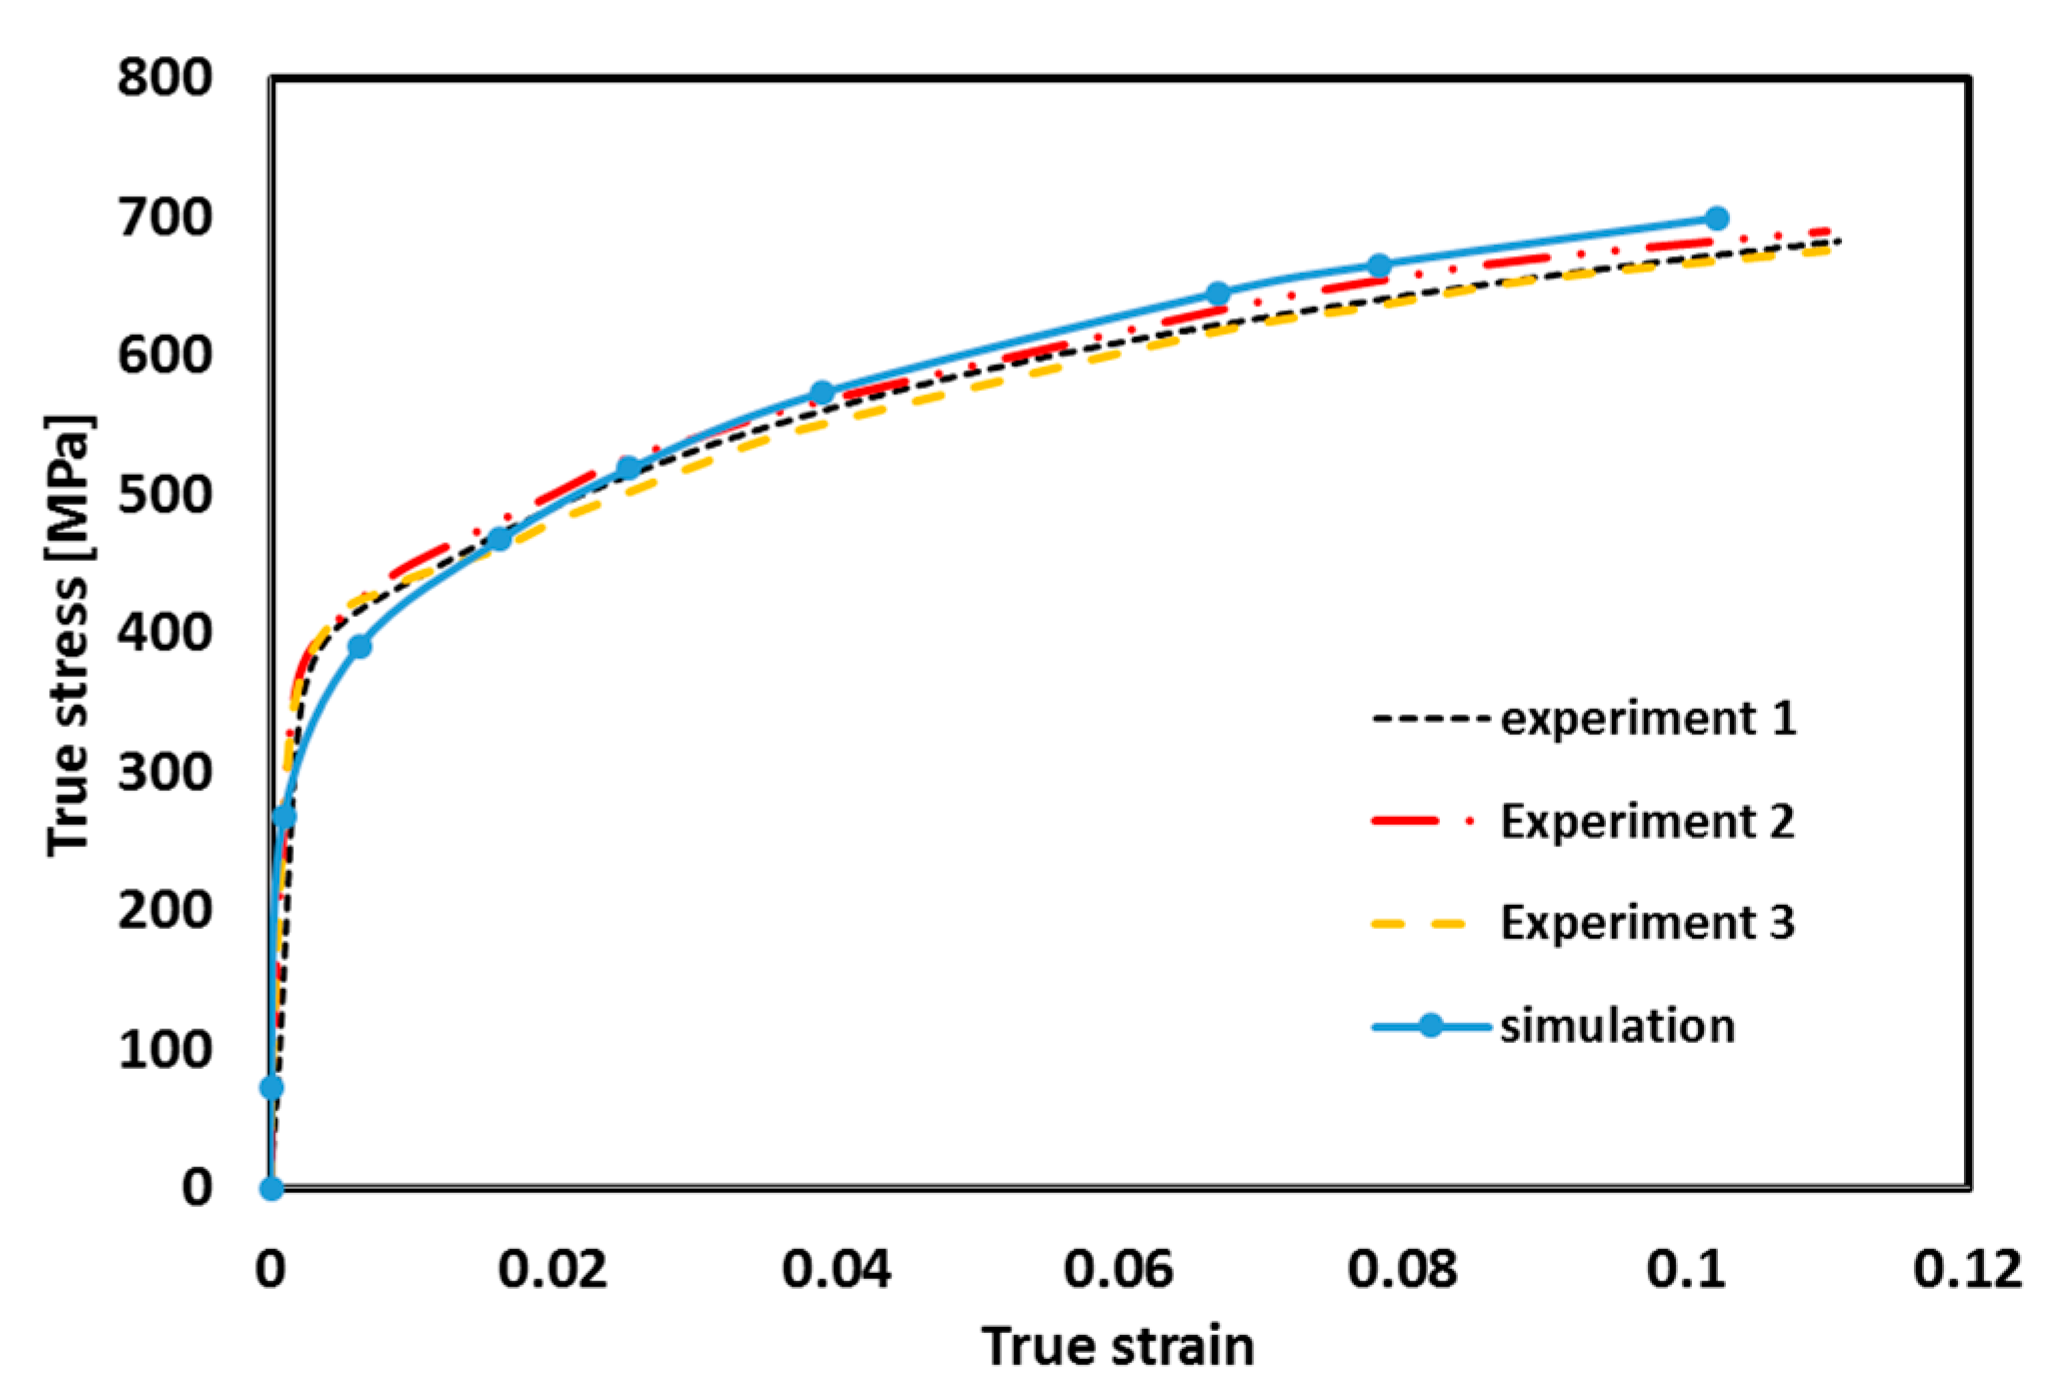
A numerical tensile test was performed on the 2D RVE using the ABAQUS 6.12 standard code in the rolling direction according to the experiments. The simulated flow curve determined from the 2D RVE matches well with the three experimental tensile stress-strain curves shown in Figure 6. It can be seen from this figure, the simulation underestimates the yield point and the initial steps of and plastic deformation zone. The reason of this underestimation are the geometrically necessary dislocations (GNDs). GNDs govern the initial steps of plastic deformation (below 2% deformation). Since they are not taken into account in the current research, such an underestimation can be observed [6]. Leaving the deformation over 2% results in the softening of the GND-incorporated microstructure, because of the large amount of shear band formation. Therefore, the simulated and experimental flow curves show very good agreement [6].
For an accurate simulation of the reversed cyclic loading, a kinematic hardening rule has to be considered. Thus, the Chaboche kinematic hardening parameters were identified from the predicted cyclic curve of each phase. These parameters are obtained by fitting Equation (13) to the stabilised cyclic curve of ferrite and martensite separately. The identified parameters for the Chaboche kinematic hardening are listed in Table 4.
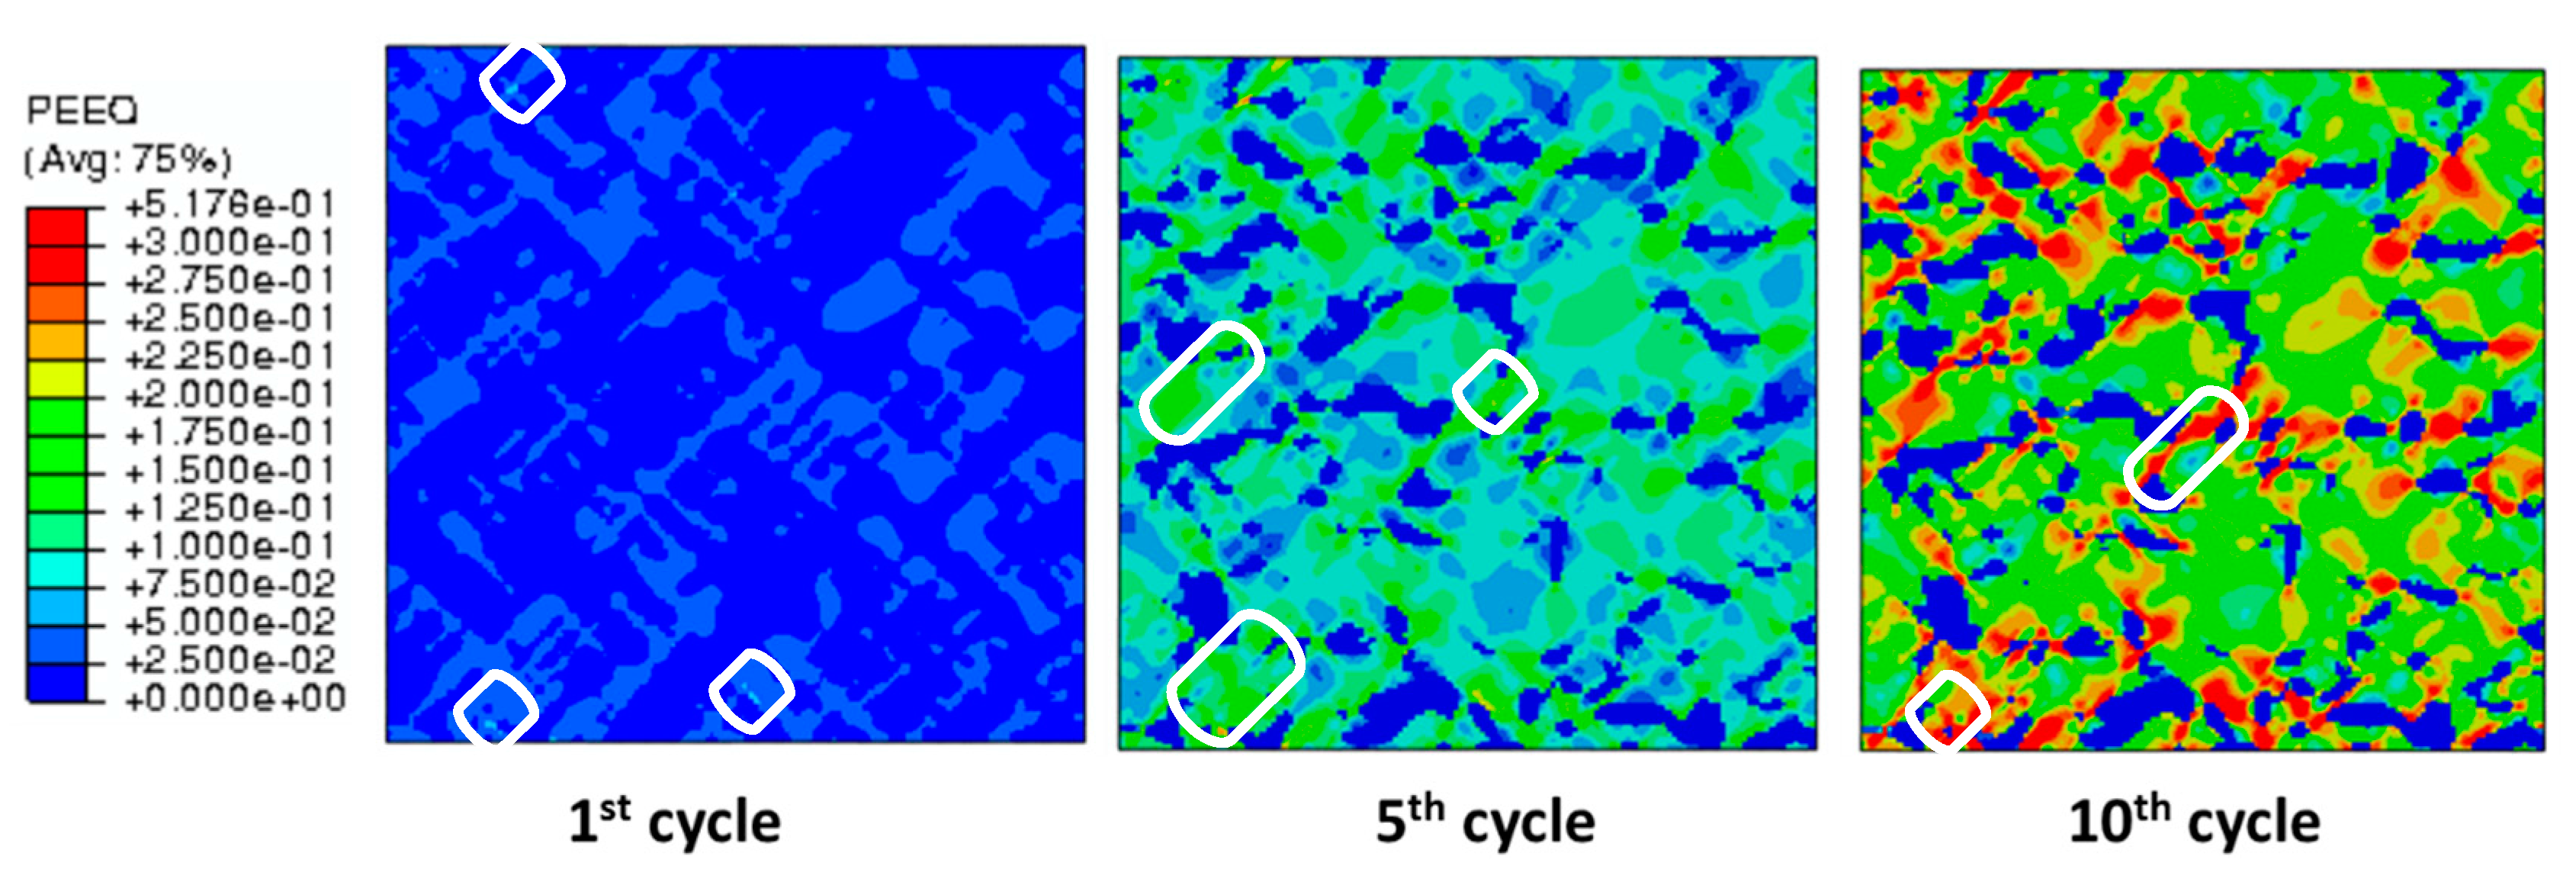
A uniaxial strain controlled cyclic loading with a strain amplitude of 0.5% at a constant strain rate of 0.02 s−1 was performed on the 2D RVE. The equivalent plastic strain distribution of DP600 steel for symmetric strain cycling with a strain amplitude of 0.5% at 1st, 5th and 10th cycles is presented in Figure 7.
Figure 7 illustrates the inhomogeneous accumulation of plastic strain at a different number of cycles. Plastic localisation can be seen in the first cycle, during which cyclic loading shear bands of localised plastic strains developed in soft ferrite while martensite phase remains elastic. The plastic strain localised in ferrite and mostly at the ferrite/martensite interface, which is due to strain partitioning between the ferrite and martensite phases during cyclic loading. The direction of the localised plastic deformation is on average 45°. Also, the interface of phases was ignored, as it is considerably small compared to the phases which were modelled.
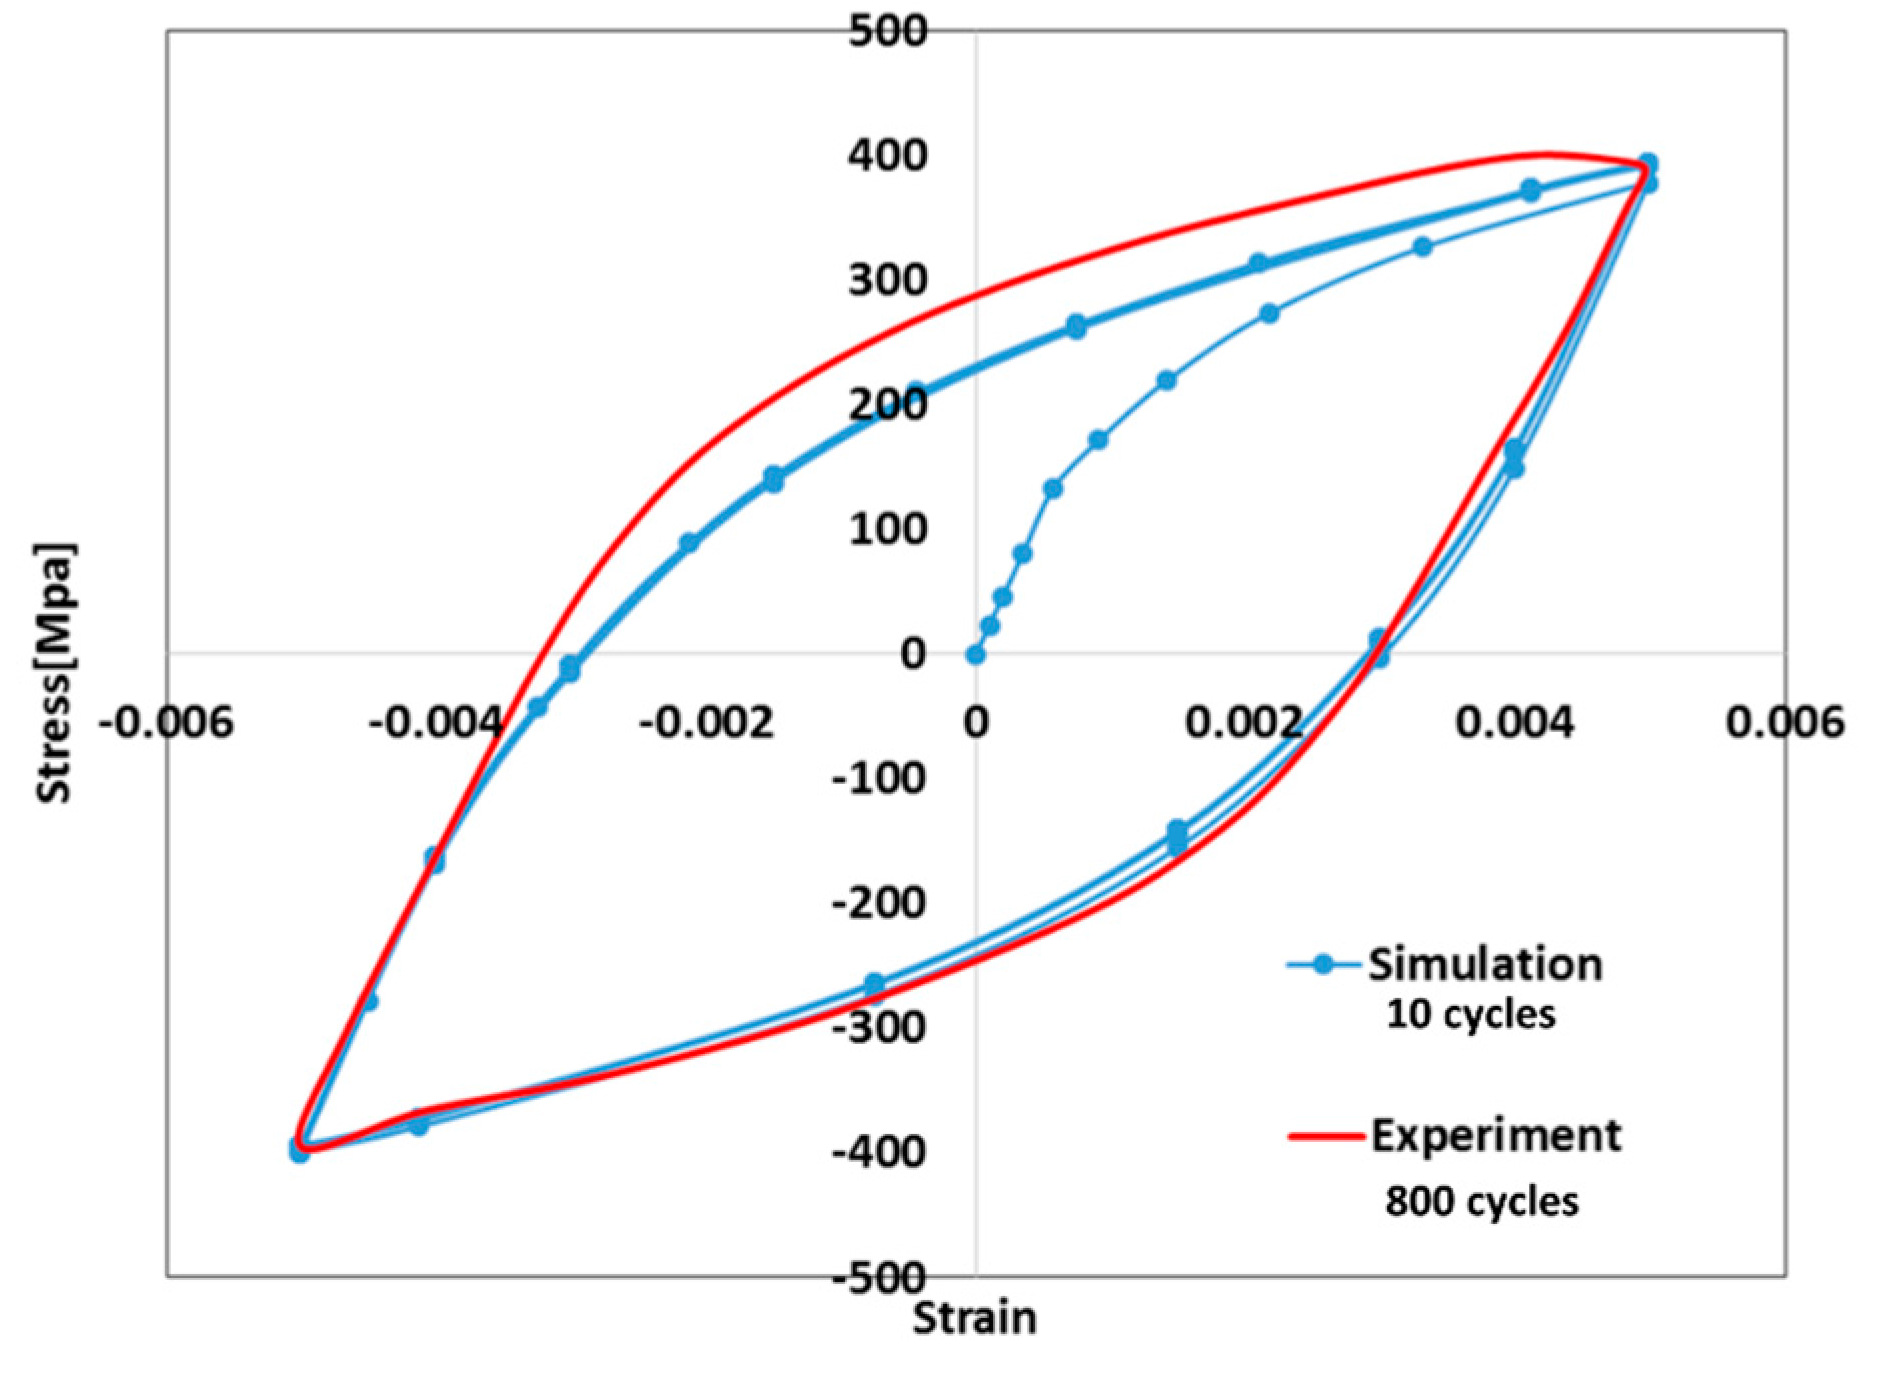
The experimentally evaluated and numerically simulated hysteresis stress-strain loop of DP600 at 0.5% strain amplitude is shown in Figure 8. Compared to the numerical simulation, it can be observed that the simulation results are satisfactory with the experimental results. The limited deviation of the numerical simulation from the experimental response may be attributable to the small deviation in approximating the cyclic strength coefficient of individual phases. Due to the numerical efficiency, a relatively small number of cycles is required to obtain the stabilised hysteresis loop of material.
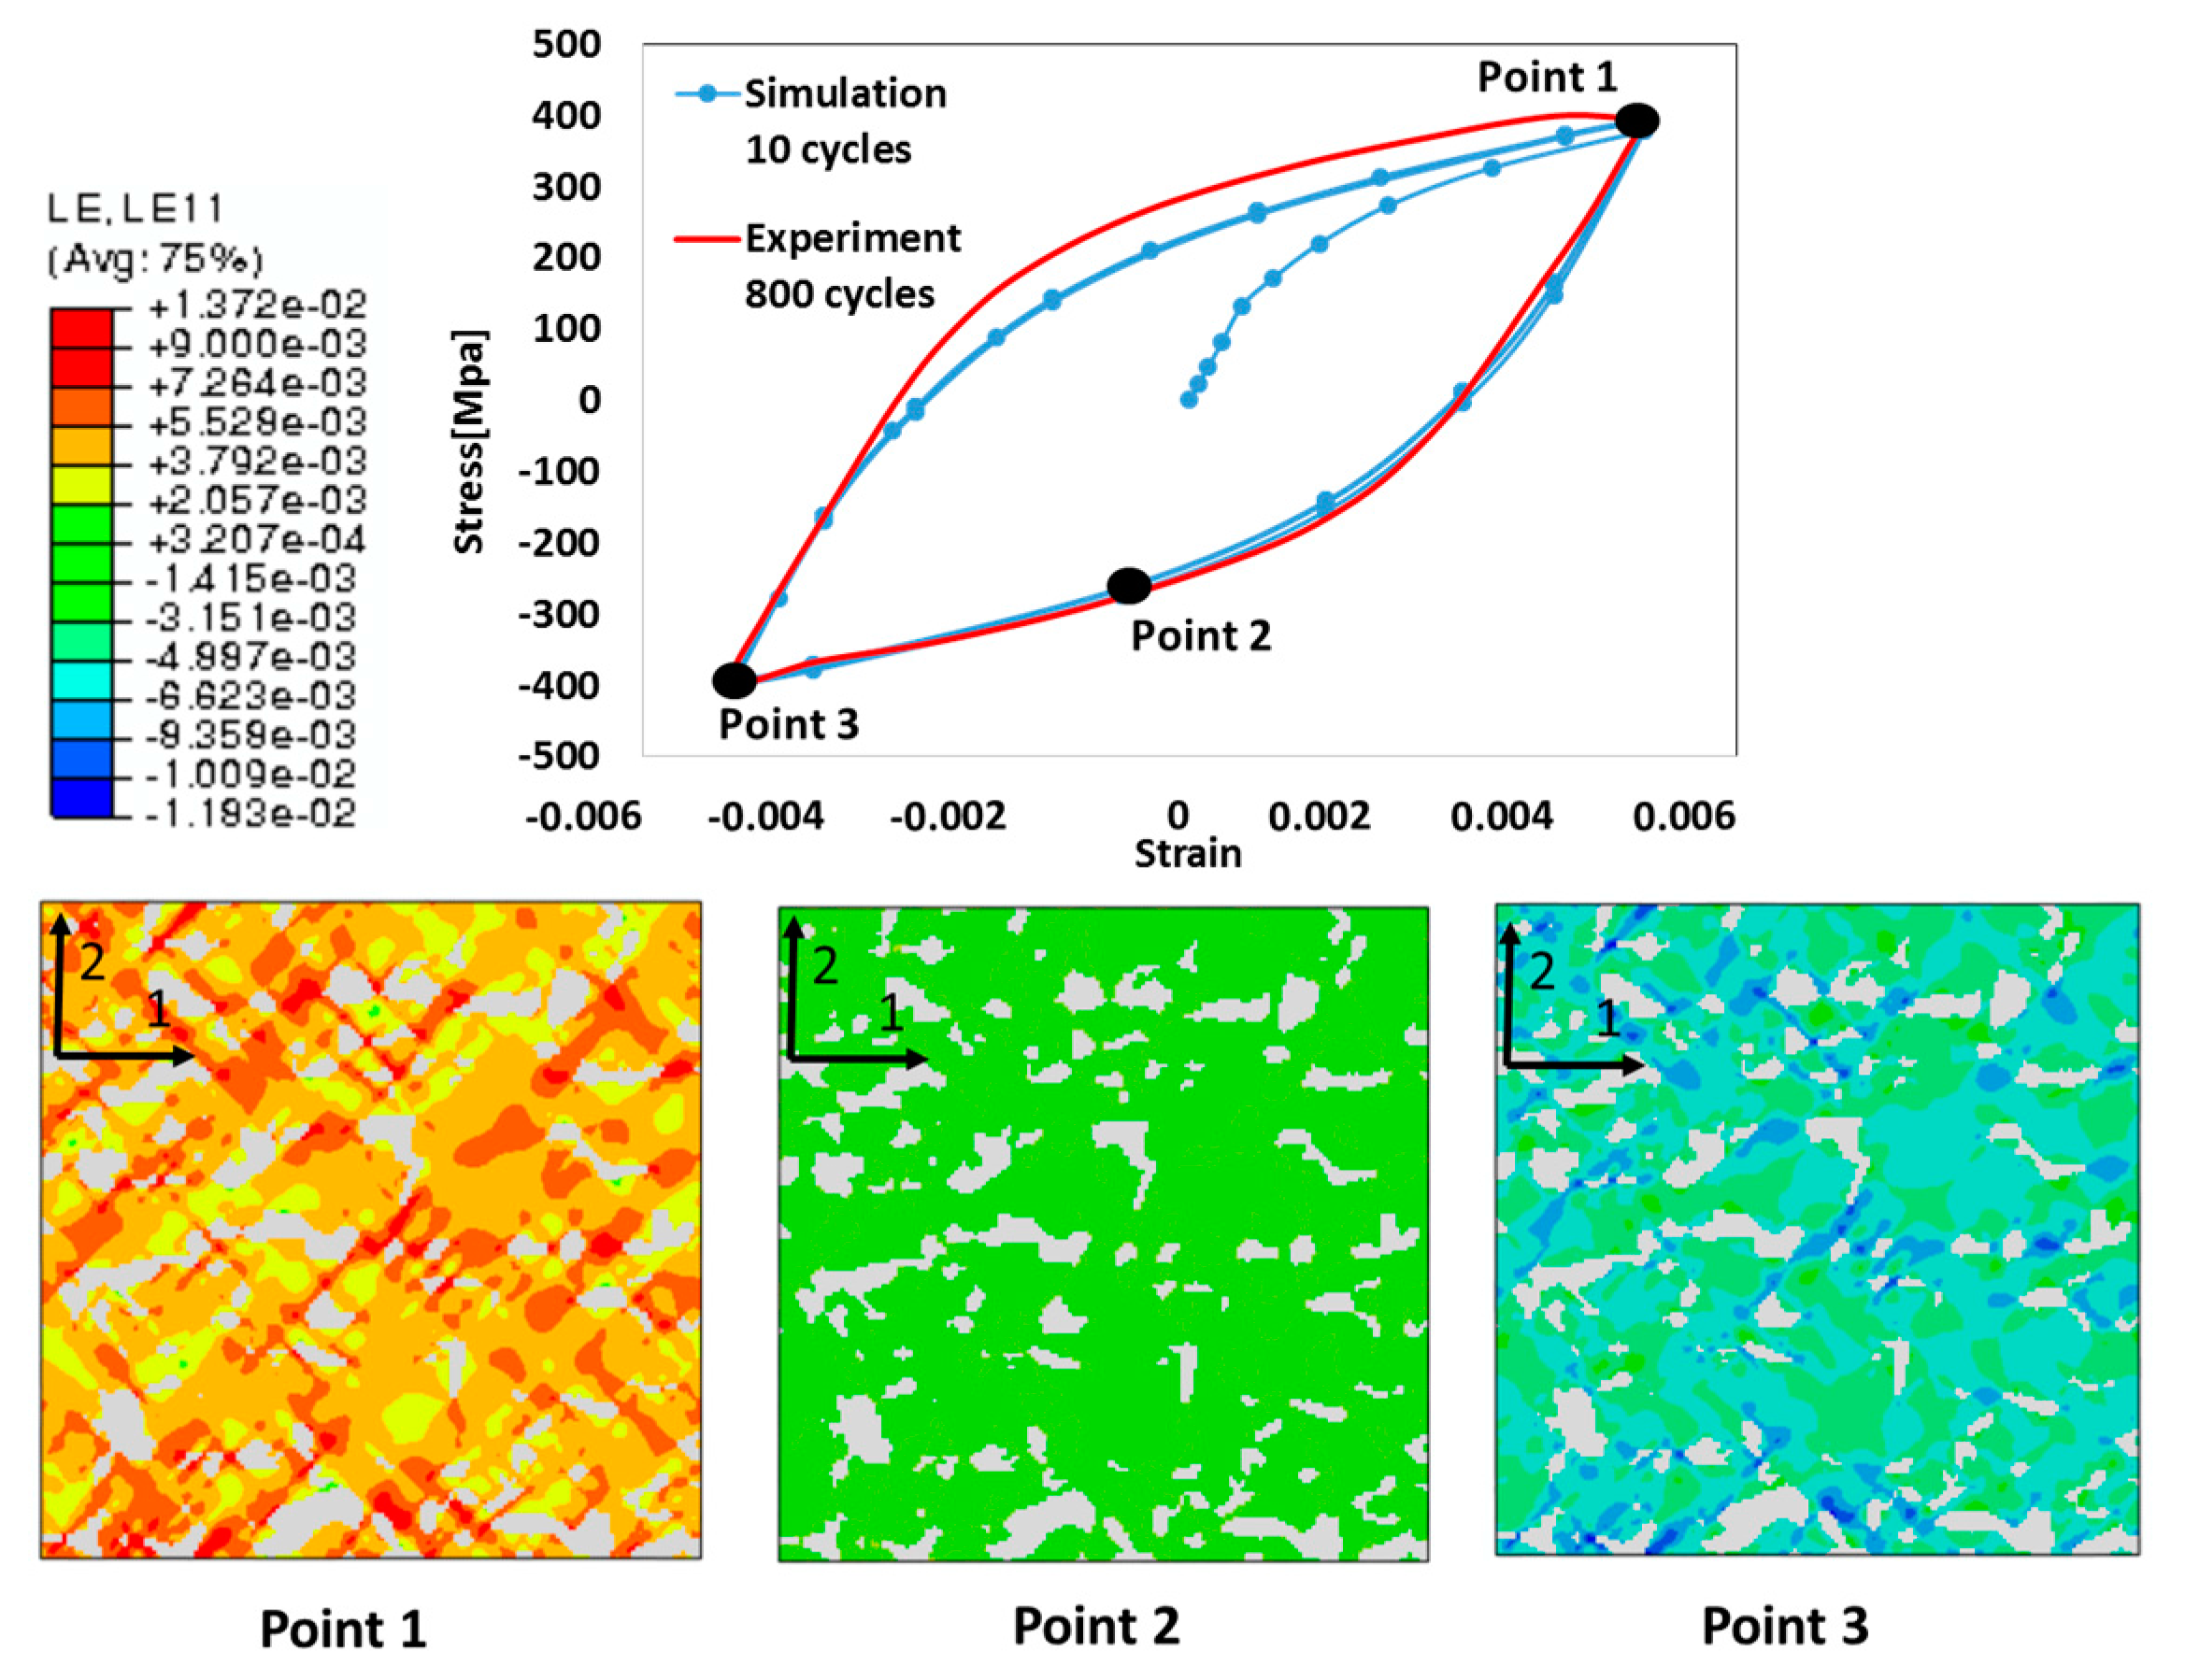
Figure 9 gives the results of local strain at different tension/compression points within ferrite phase in the same colour scale. At the tension peak of the stabilised cycle (point 1) obtained in the simulation, the tension strain in the loading direction increased remarkably in comparison to the compression strain. Such a dramatic increase in the tension strain results in higher strain localisation and sharper shear bands, which can promote micro cracks initiation [53,54]. Therefore, tension peak should be more critical for crack initiation. In point 2 and 3, through the compression loading, the compressive strain increased in the ferrite phase, mostly in the interface of the ferrite/martensite or between two martensite phases, where there is a high strain partitioning between individual phases. Furthermore, since DP steel microstructure is heterogeneous consisting of hard martensite particles in a soft and ductile ferrite matrix. The heterogeneity of microstructure results in an inhomogeneous strain distribution within the ferrite phase. This inhomogeneity depends on the morphology of martensite islands in the microstructure and increasing by increasing the heterogeneity of the microstructure. That is the reason why we observe such an inhomogeneous strain distribution in ferrite during cyclic loading.

5. Conclusions

In the current research, we have investigated the behavior of DP steel during low cycle fatigue using micormechanical modelling and validated our results with the experimental ones. The main conclusions are as follows:
  • A micromechanical modelling approach using a 2D representative volume element was successfully employed to estimate the stable hysteresis stress-strain loop of multiphase steel.
  • The cyclic behavior of individual phases was predicted using the dislocation density hardening model associated with the basic idea of Lopez and Fatemi [47]. about the correlation between the tensile properties and cyclic deformation.
  • The simulation shows the acceptable cyclic hardening/softening behavior for single phases. Also, the difference in the cyclic behavior of single phases resulted in an inhomogeneous strain accumulation in soft ferrite.
  • The comparison between experimental and simulated hysteresis stress-strain loop showed good agreement. Therefore, this approach can be considered as a method to predict the stabilised stress-strain hysteresis loop of dual phase steel.

Acknowledgments

The authors acknowledge the financial support from Bauhaus University of Weimar.

Author Contributions

Ghazal Moeini was the project engineer. Carsten Könke was the principle investigator of the research. Ali Ramazani was the co-principle investigator of the work. Veera Sundararaghavan’s comments and scientific aids significantly supported the progress of the work. Sebastian Myslicki carried out the fatigue test. Ghazal Moeini characterised the microstructure of the samples and ran the simulations. Ghazal Moeini and Ali Ramazani wrote the paper.

Conflicts of Interest

The authors declare no conflicts of interest.

References

  1. Nam, W.J.; Bae, C.M. Microstructural evolution and its relation to mechanical properties in a drawn dual-phase steel. J. Mater. Sci. 1999, 34, 5661–5668. [Google Scholar] [CrossRef]
  2. Bhadeshia, H.K.D.H.; Honeycombe, R.W.K. Steels: Microstructure and Properties; Butterworth-Heinemann (Elsevier): Oxford, UK, 2006. [Google Scholar]
  3. Ramazani, A.; Mukherjee, K.; Schwedt, A.; Goravanchi, P.; Prahl, U.; Bleck, W. Quantification of the effect of transformation-induced geometrically necessary dislocations on the flow-curve modelling of dual-phase steels. Int. J. Plast. 2013, 43, 128–152. [Google Scholar] [CrossRef]
  4. Bleck, W. Cold-rolled, high-strength sheet steels for auto applications. JOM 1996, 48, 26–30. [Google Scholar] [CrossRef]
  5. Ramazani, A.; Mukherjee, K.; Abdurakhmanov, A.; Abbasi, M.; Prahl, U. Characterization of Microstructure and Mechanical Properties of Resistance Spot Welded DP600 Steel. Metals 2015, 5, 1704–1716. [Google Scholar] [CrossRef]
  6. Ramazani, A.; Mukherjee, K.; Prahl, U.; Bleck, W. Transformation-induced, geometrically necessary, dislocation-based flow curve modeling of dual-phase steel: effect of grain size. Metall. Trans. A 2012, 43, 3850–3869. [Google Scholar] [CrossRef]
  7. Schijve, J. Fatigue of Structures and Materials, 2nd ed.; Springer: Houten, The Netherlands, 2009. [Google Scholar]
  8. Lee, M.G.; Lim, H.; Adams, B.L.; Hirth, J.P.; Wagoner, R.H. A dislocation density-based single crystal constitutive equation. Int. J. Plast. 2010, 26, 925–938. [Google Scholar] [CrossRef]
  9. Hobbacher, A.F. Recommendations for Fatigue Design of Welded Joints and Components; IIW Collection; Springer: Cham, Switzerland, 2016. [Google Scholar]
  10. Ramazani, A.; Kazemiabnavi, S.; Larson, R. Quantification of ferrite-martensite interface in dual phase steels: A first-principles study. Acta Mater. 2016, 116, 231–237. [Google Scholar] [CrossRef]
  11. Sun, X.; Choi, K.S.; Liu, W.N.; Khaleel, M.A. Predicting failure modes and ductility of dual phase steels using plastic strain localization. Int. J. Plast. 2009, 25, 1888–1909. [Google Scholar] [CrossRef]
  12. Shen, H.P.; Lei, T.C.; Liu, J.Z. Microscopic deformation behaviour of martensitic-ferritic dual-phase steels. Mater. Sci. Technol. 1986, 2, 28–33. [Google Scholar] [CrossRef]
  13. Mazinani, M.; Poole, W.J. Effect of Martensite Plasticity on the deformation behavior of a low-carbon dual-phase steel. Metall. Mater. Trans. A 2007, 38, 328–339. [Google Scholar] [CrossRef]
  14. Ramazani, A.; Ebrahimi, Z.; Prahl, U. Study the effect of martensite banding on the failure initiation in dual-phase steel. Comput. Mater. Sci. 2014, 87, 241–247. [Google Scholar] [CrossRef]
  15. Suresh, S. Fatigue of Materials, 2nd ed.; Cambridge University Press: Cambridge, UK, 2002. [Google Scholar]
  16. Sherman, A.M.; Davies, R.G. Fatigue of a dual-phase steel. Metall. Trans. A 1979, 10, 929–933. [Google Scholar] [CrossRef]
  17. Mediratta, S.R.; Ramaswamy, V.; Rao, P.R. Influence of ferrite-martensite microstructural morphology on the low cycle fatigue of a dual-phase steel. Int. J. Fatigue 1985, 7, 107–115. [Google Scholar] [CrossRef]
  18. Hadianfard, M.J. Low cycle fatigue behavior and failure mechanism of a dual-phase steel. Mater. Sci. Eng. A 2009, 499, 493–499. [Google Scholar] [CrossRef]
  19. Paul, S.K.; Stanford, N.; Hilditch, T. Effect of martensite morphology on low cycle fatigue behaviour of dual phase steels: Experimental and microstructural investigation. Mater. Sci. Eng. A 2015, 644, 53–60. [Google Scholar] [CrossRef]
  20. McDowell, D.L.; Dunne, F.P.E. Microstructure-sensitive computational modeling of fatigue crack formation. Int. J. Fatigue 2010, 32, 1521–1542. [Google Scholar] [CrossRef]
  21. Mughrabi, H. Cyclic slip irreversibility and fatigue life: A microstructure-based analysis. Acta Mater. 2013, 61, 1197–1203. [Google Scholar] [CrossRef]
  22. Mughrabi, H. Cyclic plasticity and fatigue of metals. J. Phys. IV Colloq. 1993, 3, 659–668. [Google Scholar] [CrossRef]
  23. Shenoy, M.; Tjiptowidjojo, Y.; McDowell, D. Microstructure-sensitive modeling of polycrystalline IN 100. Int. J. Plast. 2008, 24, 1694–1730. [Google Scholar] [CrossRef]
  24. Shenoy, M.; Zhang, J.; McDowell, D.L. Estimating fatigue sensitivity to polycrystalline Ni-base superalloy microstructures using a computational approach. Fatigue Fract. Eng. Mater. Struct. 2007, 30, 889–904. [Google Scholar] [CrossRef]
  25. Steglich, D.; Pirondi, A.; Bonora, N.; Brocks, W. Micromechanical modelling of cyclic plasticity incorporating damage. Int. J. Solids Struct. 2005, 42, 337–351. [Google Scholar] [CrossRef]
  26. Paul, S.K. Effect of material inhomogeneity on the cyclic plastic deformation behavior at the microstructural level: Micromechanics-based modeling of dual-phase steel. Model. Simul. Mater. Sci. Eng. 2013, 21, 055001. [Google Scholar] [CrossRef]
  27. Moeini, G.; Ramazani, A.; Sundararaghavan, V.; Könke, C. Micromechanical modeling of fatigue behavior of DP steels. Mater. Sci. Eng. A 2017, 689, 89–95. [Google Scholar] [CrossRef]
  28. ASTM. E562-11, Standard Test Method for Determining Volume Fraction by Systematic Manual Point Count. In ASTM E562; ASTM International: West Conshokocken, PA, USA, 2013. [Google Scholar]
  29. ISO 6892-1:2016, Metallic Materials—Tensile Testing—Part 1: Method of Test at Room Temperature. Available online: https://www.iso.org/standard/61856.html (accessed on 29 June 2017).
  30. Krahmer, D.M.; Polvorosa, R.; López de Lacalle, L.N.; Alonso-Pinillos, U.; Abate, G.; Riu, F. Alternatives for Specimen Manufacturing in Tensile Testing of Steel Plates. Exp. Tech. 2016, 40, 1555–1565. [Google Scholar] [CrossRef]
  31. ASTM. E606/E606M-12, Standard Test Method for Strain-Controlled Fatigue Testing; ASTM International: West Conshokocken, PA, USA, 2012. [Google Scholar]
  32. Ramazani, A.; Mukherjee, K.; Prahl, U.; Bleck, W. Modelling the effect of microstructural banding on the flow curve behaviour of dual-phase (DP) steels. Comput. Mater. Sci. 2012, 52, 46–54. [Google Scholar] [CrossRef]
  33. Ramazani, A.; Mukherjee, K.; Quade, H.; Prahl, U.; Bleck, W. Correlation between 2D and 3D flow curve modelling of DP steels using a microstructure-based RVE approach. Mater. Sci. Eng. A 2013, 550, 129–139. [Google Scholar] [CrossRef]
  34. Rodriguez, R.-M.; Gutiérrez, I. Unified Formulation to Predict the Tensile Curves of Steels with Different Microstructures. Mater. Sci. Forum 2003, 426, 4525–4530. [Google Scholar] [CrossRef]
  35. Bergström, Y. A dislocation model for the stress-strain behaviour of polycrystalline α-Fe with special emphasis on the variation of the densities of mobile and immobile dislocations. Mater. Sci. Eng. 1970, 5, 193–200. [Google Scholar] [CrossRef]
  36. Estrin, Y.; Mecking, H. A unified phenomenological description of work hardening and creep based on one-parameter models. Acta Metall. 1984, 32, 57–70. [Google Scholar] [CrossRef]
  37. Sevillano, J. Flow stress and work hardening. In Materials Science and Technology; Wiley-VCH Verlag GmbH & Co. KGaA: Weinheim, Germany, 1993. [Google Scholar]
  38. Anderson, E.; Bode, R.; Dorn, J.E.; Spreadborough, J. Effects of alloying elements on the mechanical properties of steels at low temperatures. Met. Sci. J. 1969, 3, 201–208. [Google Scholar] [CrossRef]
  39. Thomser, C. Modelling of the Mechanical Properties of Dual Phase Steels Based on Microstructure. Ph.D. Thesis, RWTH Aachen University, Aachen, Germany, 2009. [Google Scholar]
  40. Ramazani, A.; Abbasi, M.; Kazemiabnavi, S.; Schmauder, S.; Larson, R.; Prahl, U. Development and application of a microstructure-based approach to characterize and model failure initiation in DP steels using XFEM. Mater. Sci. Eng. A 2016, 660, 181–194. [Google Scholar] [CrossRef]
  41. Ramazani, A.; Chang, Y.; Prahl, U. Characterization and modeling of failure initiation in bainite-aided DP steel. Adv. Eng. Mater. 2014, 16, 1370–1380. [Google Scholar] [CrossRef]
  42. Dewa, R.; Kim, S.; Kim, W.; Kim, E. Effect of strain range on the low cycle fatigue in alloy 617 at high temperature. Metals 2017, 7, 54. [Google Scholar] [CrossRef]
  43. Dewa, R.; Kim, S.; Kim, W.; Kim, E. Understanding low cycle fatigue behavior of alloy 617 base metal and weldments at 900 °C. Metals 2016, 6, 178. [Google Scholar] [CrossRef]
  44. Branco, R.; Costa, J.; Antunes, F.; Perdigão, S. Monotonic and cyclic behavior of DIN 34CrNiMo6 tempered alloy steel. Metals 2016, 6, 98. [Google Scholar] [CrossRef]
  45. Landgraf, R.W.; Morrow, J.; Endo, T. Determination of cyclic stress-strain curve. J. Mater. 1969, 4, 176–188. [Google Scholar]
  46. Smith, R.W.; Hirschberg, M.H.; Manson, S.S. Fatigue Behavior under Strain Cycling in Low and Intermediate Life Range; NACA TN D-1574; National Advisory Committee for Aeronautics, Lewis Research Center: Cleveland, OH, USA, 1963. [Google Scholar]
  47. Lopez, Z.; Fatemi, A. A method of predicting cyclic stress-strain curve from tensile properties for steels. Mater. Sci. Eng. A 2012, 556, 540–550. [Google Scholar] [CrossRef]
  48. Prager, W. A New method of analyzing stresses and strains in work-hardening plastic solids. J. Appl. Mech. 1956, 23, 493–496. [Google Scholar]
  49. Armstrong, P.; Frederick, C. A Mathematical Representation of the Multiaxial Bauschinger Effect; CEGB Report No. RD/B/N 731; Research & Development Departement: Berkeley, CA, USA, 1966. [Google Scholar]
  50. Chaboche, J.L. On some modifications of kinematic hardening to improve the description of ratchetting effects. Int. J. Plast. 1991, 7, 661–678. [Google Scholar] [CrossRef]
  51. Ohno, N.; Wang, J.D. Kinematic hardening rules with critical state of dynamic recovery, part I: Formulation and basic features for ratchetting behavior. Int. J. Plast. 1993, 9, 375–390. [Google Scholar] [CrossRef]
  52. Bari, S.; Hassan, T. Kinematic hardening rules in uncoupled modeling for multiaxial ratcheting simulation. Int. J. Plast. 2001, 17, 885–905. [Google Scholar] [CrossRef]
  53. Tu, S.-T.; Zhang, X.-C. Fatigue crack initiation mechanisms. Ref. Modul. Mater. Sci. Mater. Eng. 2016, 1–23. [Google Scholar]
  54. Ramazani, A.; Schwedt, A.; Aretz, A.; Prahl, U. Failure initiation in dual-phase steel. Key Eng. Mater. 2013, 586, 67–71. [Google Scholar] [CrossRef]
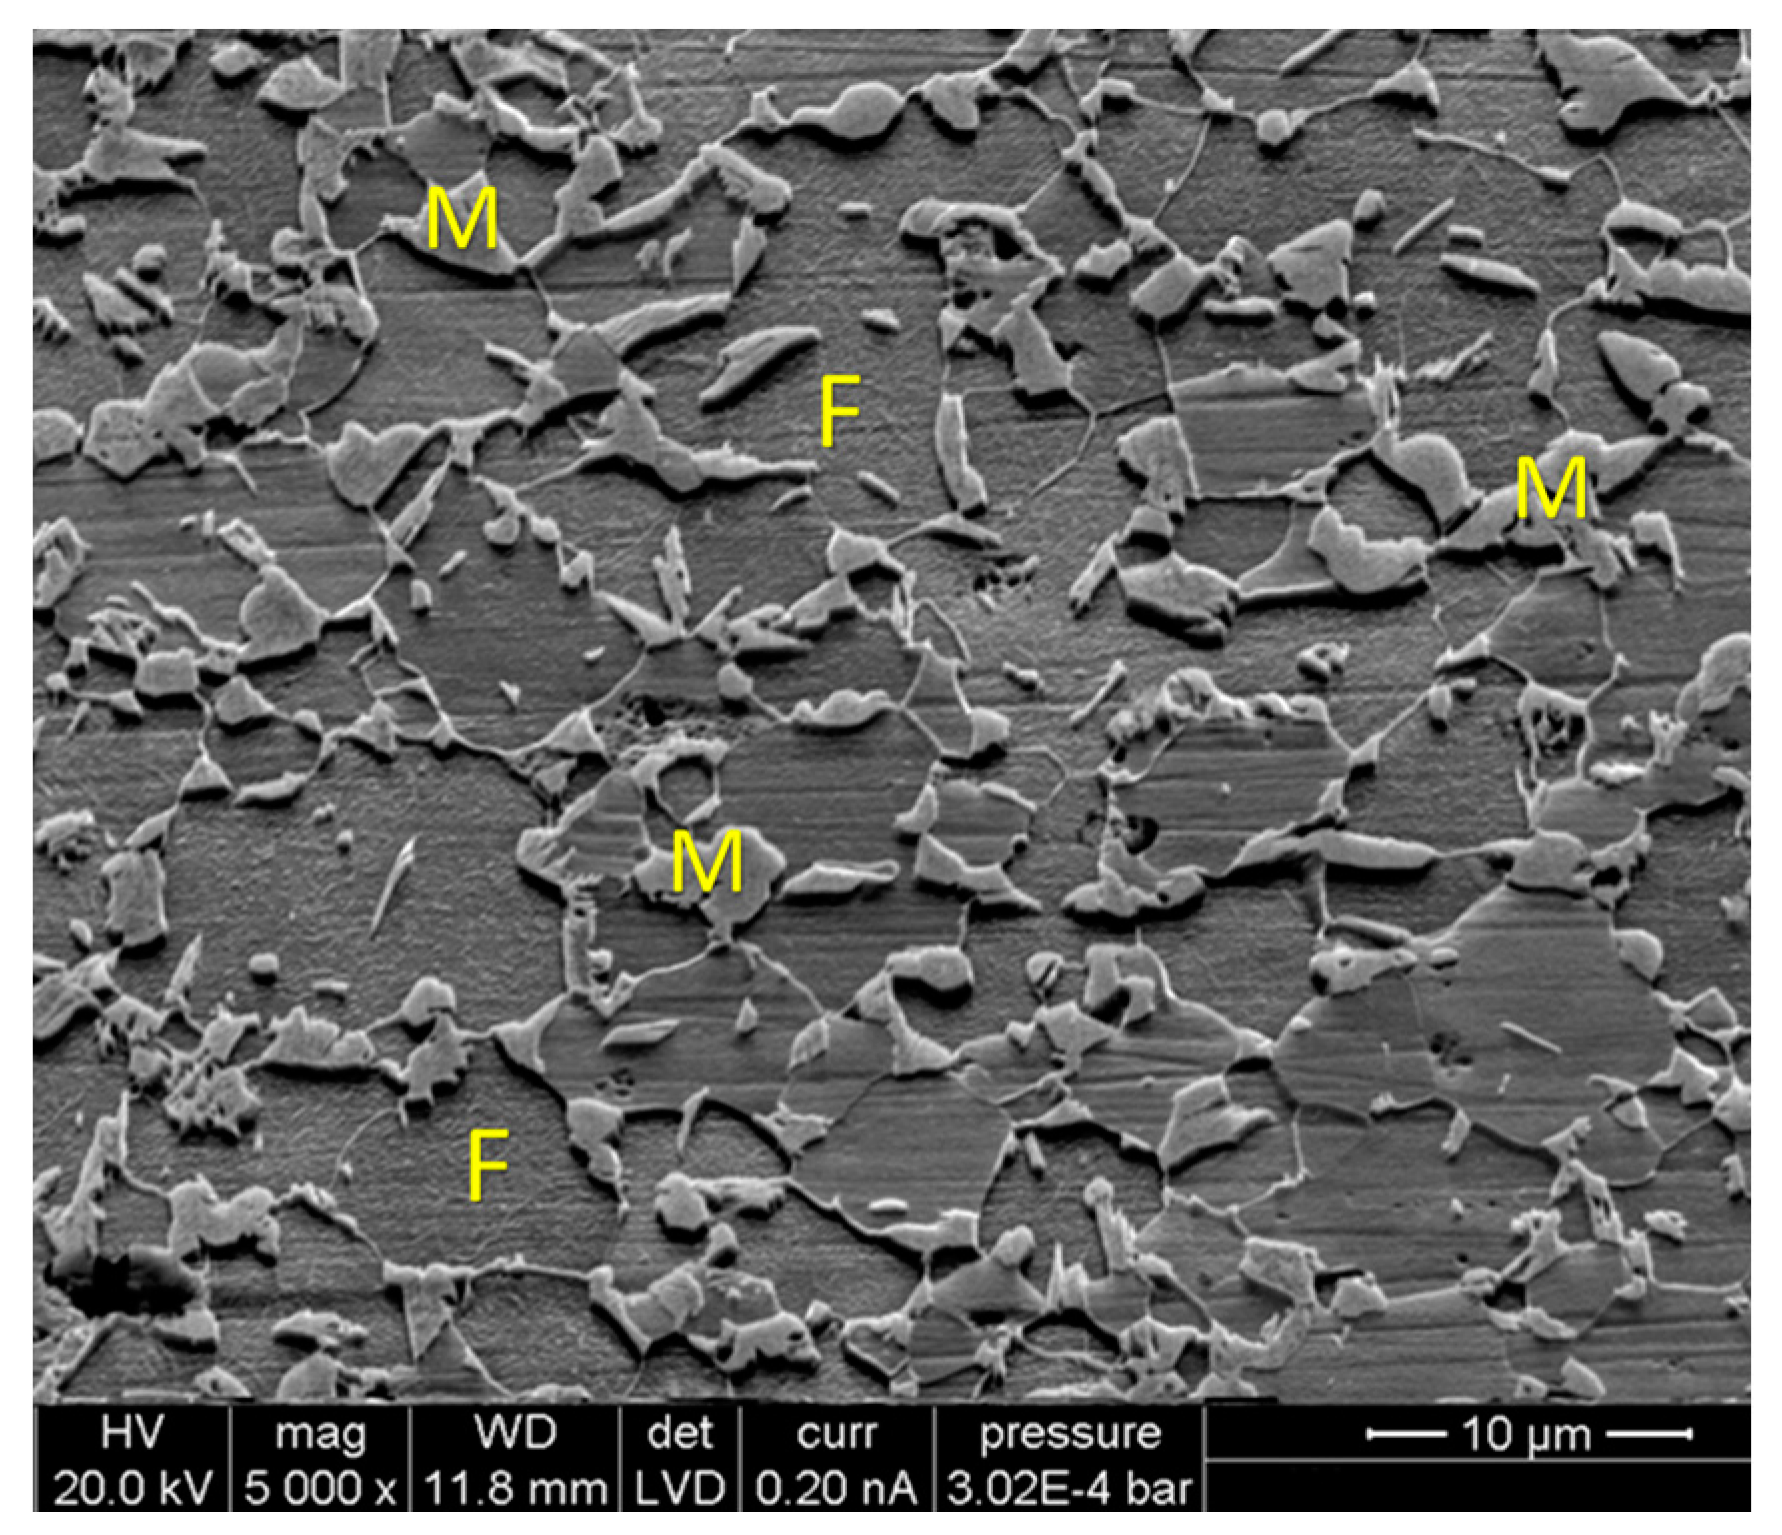
Figure 1. Scanning electron microscopy image of DP600 steel (M: martensite and F: ferrite).
Metals 07 00265 g001
Figure 2. Geometry of the tensile test specimen (dimensions are given in mm).
Metals 07 00265 g002
Figure 3. Sample geometry for low cycle fatigue testing (dimensions are given in mm).
Metals 07 00265 g003
Figure 4. (a) Microstructure of DP600 steel and (b) selection of finite element mesh of representative volume element (RVE).
Metals 07 00265 g004
Figure 5. Monotonic flow curve and predicted cyclic curve of single phases (ferrite, martensite).
Metals 07 00265 g005
Figure 6. Flow curve of the investigated dual phase (DP) steels (Experiment and Simulation).
Metals 07 00265 g006
Figure 7. Equivalent plastic strain distribution at maximum aggregate stress with a different number of cycles.
Metals 07 00265 g007
Figure 8. Numerical simulation of stabilised stress-strain hysteresis loop in comparison with the experiment.
Metals 07 00265 g008
Figure 9. Evaluation of the inhomogeneous strain distribution within the ferrite phase along the loading direction at different stress points.
Metals 07 00265 g009
Table 1. Chemical composition of DP600 steel.
Chemical Composition (wt %)
CMnSiPSAlCrMo
0.0991.230.0790.0120.0010.8940.040.195
Table 2. Tensile test results for DP600 steel.
Sy (MPa)Su (MPa)El (%)
40261623.1
Table 3. Variable values used in Equation (1).
αTaylor Factor MShear Modulus µ (MPa)Burgers Vector b (m)Dislocation Mean Free Path L (m)Recovery Rate kr
FerriteMartensiteFerriteMartensite
0.33380,0002.5 × 10−10dα3.8 × 10−810−5/dα41
Table 4. Chaboche kinematic hardening parameters.
Phaseσ0 (MPa)C1 (MPa)C2 (MPa)C3 (MPa)γ1γ2γ3
Ferrite119113,35819,5913450.51177111.817.0668
Martensite563.1610,33349,9582.5 × 1058.291599.816768.79