Article

In-Situ Investigation of Strain-Induced Martensitic Transformation Kinetics in an Austenitic Stainless Steel by Inductive Measurements

1
Materalia Research Group, Centro Nacional de Investigaciones Metalúrgicas (CENIM-CSIC), Av. Gregorio del Amo 8, 28040 Madrid, Spain
2
Department of Materials Science and Engineering, Delft University of Technology, Mekelweg 2, 2628 CD Delft, The Netherlands
3
Philips Advanced Technology Centre, P.O. Box 20100, Tussendiepen 4, 9200 CA Drachten, The Netherlands
4
Department of Nonlinear Solid Mechanics, University of Twente, Drienerlolaan 5, 7522 NB Enschede, The Netherlands
5
Faculty of Science and Engineering, Advanced Production Engineering—Engineering and Technology Institute Groningen, Nijenborgh 4, 9747 AG Groningen, The Netherlands
*
Author to whom correspondence should be addressed.
Metals 2017, 7(7), 271; https://doi.org/10.3390/met7070271
Submission received: 31 May 2017 / Revised: 10 July 2017 / Accepted: 12 July 2017 / Published: 13 July 2017
(This article belongs to the Special Issue Bainite and Martensite: Developments and Challenges)

Abstract

:
An inductive sensor developed by Philips ATC has been used to study in-situ the austenite (γ) to martensite (α′) phase transformation kinetics during tensile testing in an AISI 301 austenitic stainless steel. A correlation between the sensor output signal and the volume fraction of α′-martensite has been found by comparing the results to the ex-situ characterization by magnetization measurements, light optical microscopy, and X-ray diffraction. The sensor has allowed for the observation of the stepwise transformation behavior, a not-well-understood phenomena that takes place in large regions of the bulk material and that so far had only been observed by synchrotron X-ray diffraction.

Graphical Abstract

1. Introduction

One of the key features of the metastable austenitic stainless steels (MASSs) is the Transformation Induced Plasticity (TRIP) effect [1]. In their annealed soft state, MASSs are fully austenitic (γ); however, they can be strengthened by grain refinement [2] and by its transformation into martensite (α′) under the application of stress/strain [3,4]. Depending on their composition, MASSs can be further strengthened by an aging treatment that induces the precipitation of strengthening particles in the martensite phase, as it is the case of maraging and precipitation hardening (PH) stainless steels [5].
Strain-induced martensite forms from austenite when this is subjected to deformation above its flow stress. When the plastic deformation stops, the strain-induced martensitic transformation also stops. However, depending on the residual stress level in the material, the transformation may also take place immediately after plastic deformation, which is known as stress-assisted transformation [6]. The occurrence of the γ → α′ phase transformation is closely linked to how plastic deformation takes place in the austenite phase, which is connected to the stacking fault energy (SFE) of the steel. In alloys with SFE lower than 15 mJ/m2, the martensitic transformation is favoured and, thus, TRIP occurs. On the other hand, in alloys with a SFE between 25 and 60 mJ/m2, the austenite deforms by twinning and the deformation is mediated by dislocation slip [7]. Typically, MASSs have low SFEs (about 20 mJ/m2) and, consequently, the deformation of the austenite is initially characterized by the formation of staking faults (SFs). Eventually, larger deformations give rise to shear bands and planar defects that result from the overlapping of SFs on austenite { 111 } planes and which are well known as preferred sites for the nucleation of ε-martensite, a precursor of α′-martensite [4,7,8,9,10,11,12]. As reported in the literature, the occurrence of the martensitic transformation via the formation of the intermediate ε-martensite phase (γ → ε → α′) or directly (γ → α′), as well as the transformation rate, depend on austenite stability. A number of factors, such as the chemistry, grain size, temperature, and the strain rate, influence austenite stability [3,4,6,7,8,9,10,11,12,13,14]. The formation of martensite during the application of stresses and strains influences significantly the response of the material during processes like sheet metal forming. The increase of the work-hardening of the steel as a consequence of the martensitic transformation results in enhanced strength and formability, which makes MASSs good candidates for multi-stage processes [9,10,15]. However, using a number of steps to obtain the desired final shape is an extra complication. An accurate determination of the martensite transformation kinetics as a function of the plastic strain is, therefore, necessary to improve the design and prediction of metallurgical processes.
It is not easy to study the evolution of the martensitic transformation under straining. In-situ investigations generally requires the use of large facilities and complex techniques as high energy synchrotron X-ray diffraction (HEXRD) or neutron diffraction, where allocation of beamtime is not straightforward [8,9,11,16]. For this reason, the quantification of martensite by metallography, magnetization measurements or diffraction methods on post-mortem tensile-tested specimens is usually preferred. However, it requires a great number of experiments and long times of experimental procedure [14]. Besides, this method does not provide information on possible stress-assisted transformation induced by residual stresses in the material right after plastic straining. This study presents a method based on an inductive sensor developed by Philips ATC (Drachten, The Netherlands) that allows for a simple and fast in-situ characterization of the formation kinetics of mechanically-induced martensite during tensile testing. The procedure is validated and the results are compared to those obtained by the currently used ex-situ methods.

2. Materials and Methods

The material investigated in this work is an austenitic metastable stainless steel, whose chemical composition is given in Table 1 and corresponds to the AISI 301 grade. The material was supplied as cold rolled sheets of 0.30 mm in thickness in the full annealed state.
The mechanical behavior of the annealed material was studied at room temperature by means of uniaxial tensile tests. Standard specimens were machined perpendicularly to the rolling direction according to the ASTM E8/E8M-09 standard and tested in a Zwick-Roell-Z030 universal testing machine (GmbH & Co. KG, Ulm, Germany) at a strain rate of ε ˙ = 5 × 10 4   s 1 . The strain was measured using double-sided clip extensometers with a parallel length of 80 mm.
The martensite transformation behavior was studied in-situ during tensile testing by means of an inductive sensor developed by Philips ATC that is able to measure differences in relative magnetic permeability ( μ r 100 ) between the paramagnetic austenite and the ferromagnetic martensite phases. A standard integrated circuit (IC) is used for the electronics. An alternating current (AC) is sent through two coils connected in series, i.e., the measurement coil and the reference coil, and the difference in voltage across them is measured and amplified. The coils are 31 mm in length. A number of adjusting elements can be used to set the voltage, current, frequency, and amplification factor. The IC contains an oscillator that generates voltage, a filter, and an amplifier. A frequency of 7.5 kHz was selected in order to avoid as much external electromagnetic interference as possible [15]. The setup is schematically illustrated in Figure 1. The sensor is placed in the middle of the tensile specimen’s gage length and the output signal is recorded during the course of the mechanical testing. The correlation between the volume fraction of martensite and the voltage signal from the sensor is, however, not trivial and requires the correction of some effects influencing the signal such as applied stress, plastic strain, temperature, and specimen volume inside the coil. Of great importance is the correction of the stress-effect. For this purpose, cyclic loading/unloading/reloading (LUR) tensile tests were performed and the inductive signal was registered by using different currents circulating through the coil. The specimens were unloaded to zero force and reloaded again in applied strain increments of 0.05 until the samples fractured. The comparison of the output signal between the loaded and unloaded states allows for the correction of the stress effect. Once the signal is cleaned, a direct relationship between the content of martensite and the sensor output signal can be established based on ex-situ characterization of the martensite volume fraction.
Interrupted tensile tests were performed in applied strain increments of 0.05 between 0 and the fracture ( ε E F = 0.52). The post-mortem specimens were used to ex-situ determine the volume fraction of martensite by different characterization techniques, as explained below.
The volume fraction of martensite was measured ex-situ by different characterization techniques: light optical microscopy (LOM), X-ray diffraction (XRD), and magnetization measurements. For LOM characterization, a Nikon Epiphot 200 (Nikon Instruments, Inc., Melville, NY, USA) was used. The samples were cold mounted and the cross sections were prepared following the standard procedure: grinding down to 1200 grit using different grit size sandpapers and polishing in two steps using different lap cloths and finishing with 1 μm diamond solution. The microstructure was revealed by color etching using HCl-base Beraha’s reagent for 10 s. This etching provides a good contrast between martensite (dark) and austenite (light). By using “ImageJ” image analysis software (version 1.47s, NIH, Stapleton, NY, USA, 2013), the LOM micrographs were converted to binary images. By thresholding the greyscale intensity, the dark areas (martensite phase) are included in the area of analysis and its area fraction can be determined. Both automatic and manual thresholds were compared for evaluation of the method. A total area of 300 × 250 μm2 was analyzed for each condition.
A quantum design MPMS-XL SQUID magnetometer (Quantum Design, Inc., San Diego, CA, USA) was employed to measure the magnetization curve at room temperature. Square-shaped samples of 3 mm side were extracted from the middle of the gage length and the magnetization was recorded by varying the external applied magnetic field from 0 to 5 T in steps of 0.2 T. The volume fraction of martensite correlates with the magnetization saturation of the samples ( M s a t ), through f α = M s a t / M s a t α , as explained elsewhere [17]. To obtain a reference magnetization saturation ( M s a t α ), a piece of as-received material was severely cold-rolled by reducing the strip thickness more than 60% in order to induce the complete transformation into martensite. A M s a t of 133 Am2/kg was obtained.
Specimens of 1 cm2 were prepared for XRD as explained for LOM and including a final polish with colloidal silica suspension (40 nm). XRD measurements were carried out with a Bruker AXS D8 diffractometer (Bruker AXDS GmbH, Karlsruhe, Germany) equipped with a Co-X-ray tube, Goebel mirror optics collimator and a LynxEye Linear Position Sensitive Detector for ultra-fast XRD measurements. The area of interest on the sample was accurately and precisely located in the X-ray beam by using a laser/video microscope from Bruker AXS. A current of 30 mA and a voltage of 40 kV were employed as tube settings. The XRD spectra were collected over a 2 θ range of 35–135° with a step size of 0.01°. The Rietveld analysis program TOPAS (version 4.2, Bruker AXS, 2009) was used for the quantification of the α′-martensite and γ-austenite phases and the calculation of their structural parameters. Crystallographic information of the different phases for the Rietveld refinement was obtained from Pearson’s Crystal Structure Database for Inorganic Compounds. The refinement protocol also included other parameters like background, zero displacement, the scale factors, the peak breadth, and the unit cell parameter. In order to eliminate the instrumental contribution to peak broadening, instrument functions were empirically parameterized from the profile shape analysis of a corundum sample measured under the same conditions.

3. Results

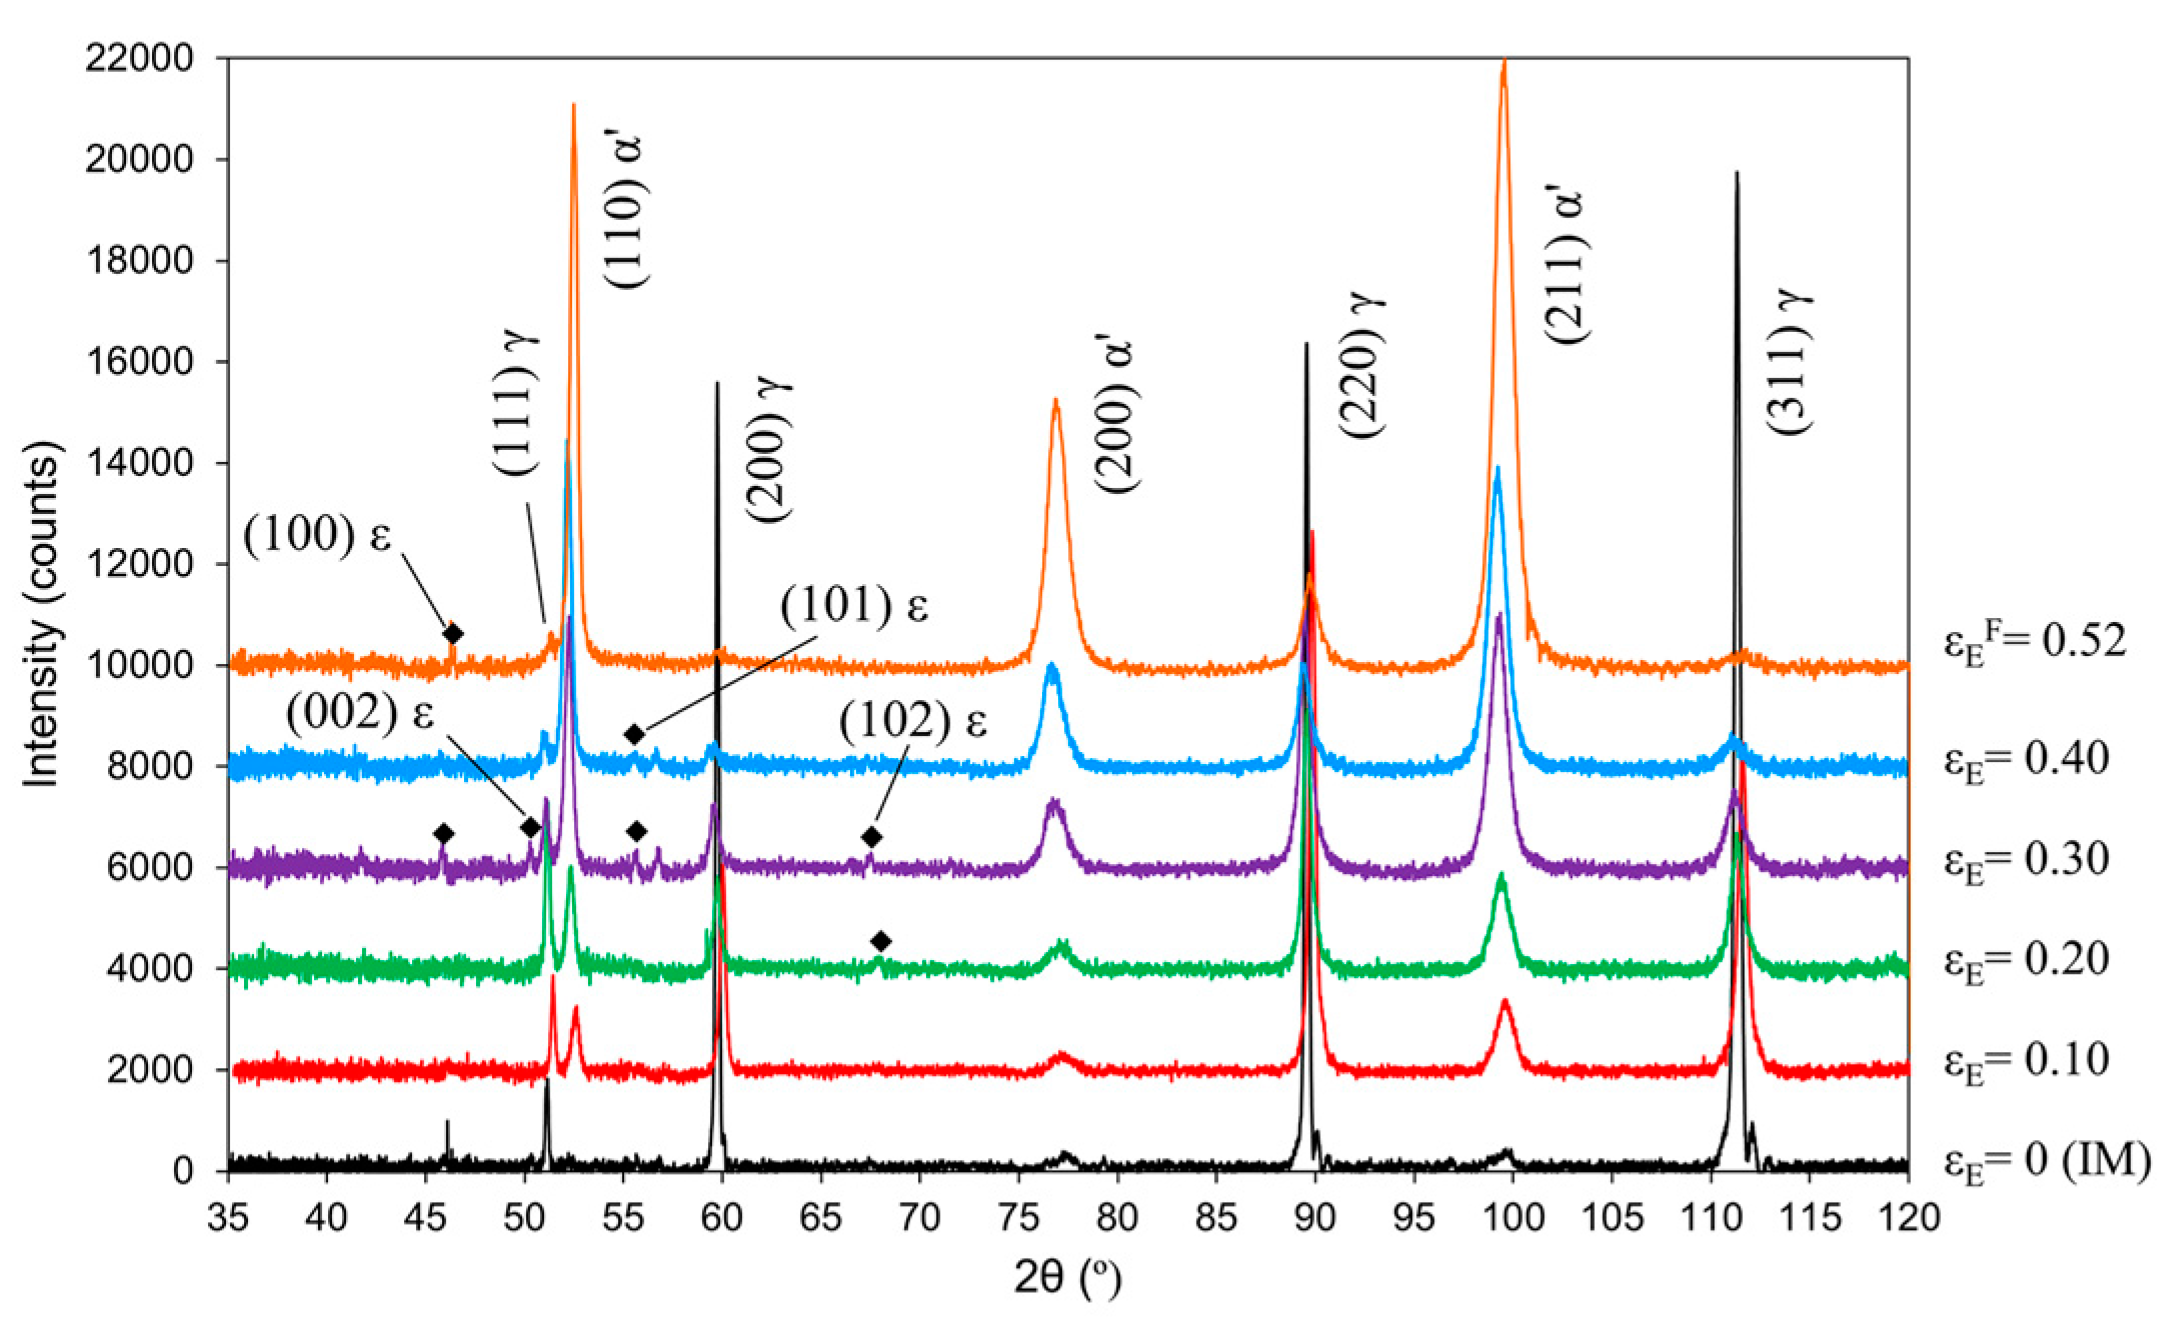
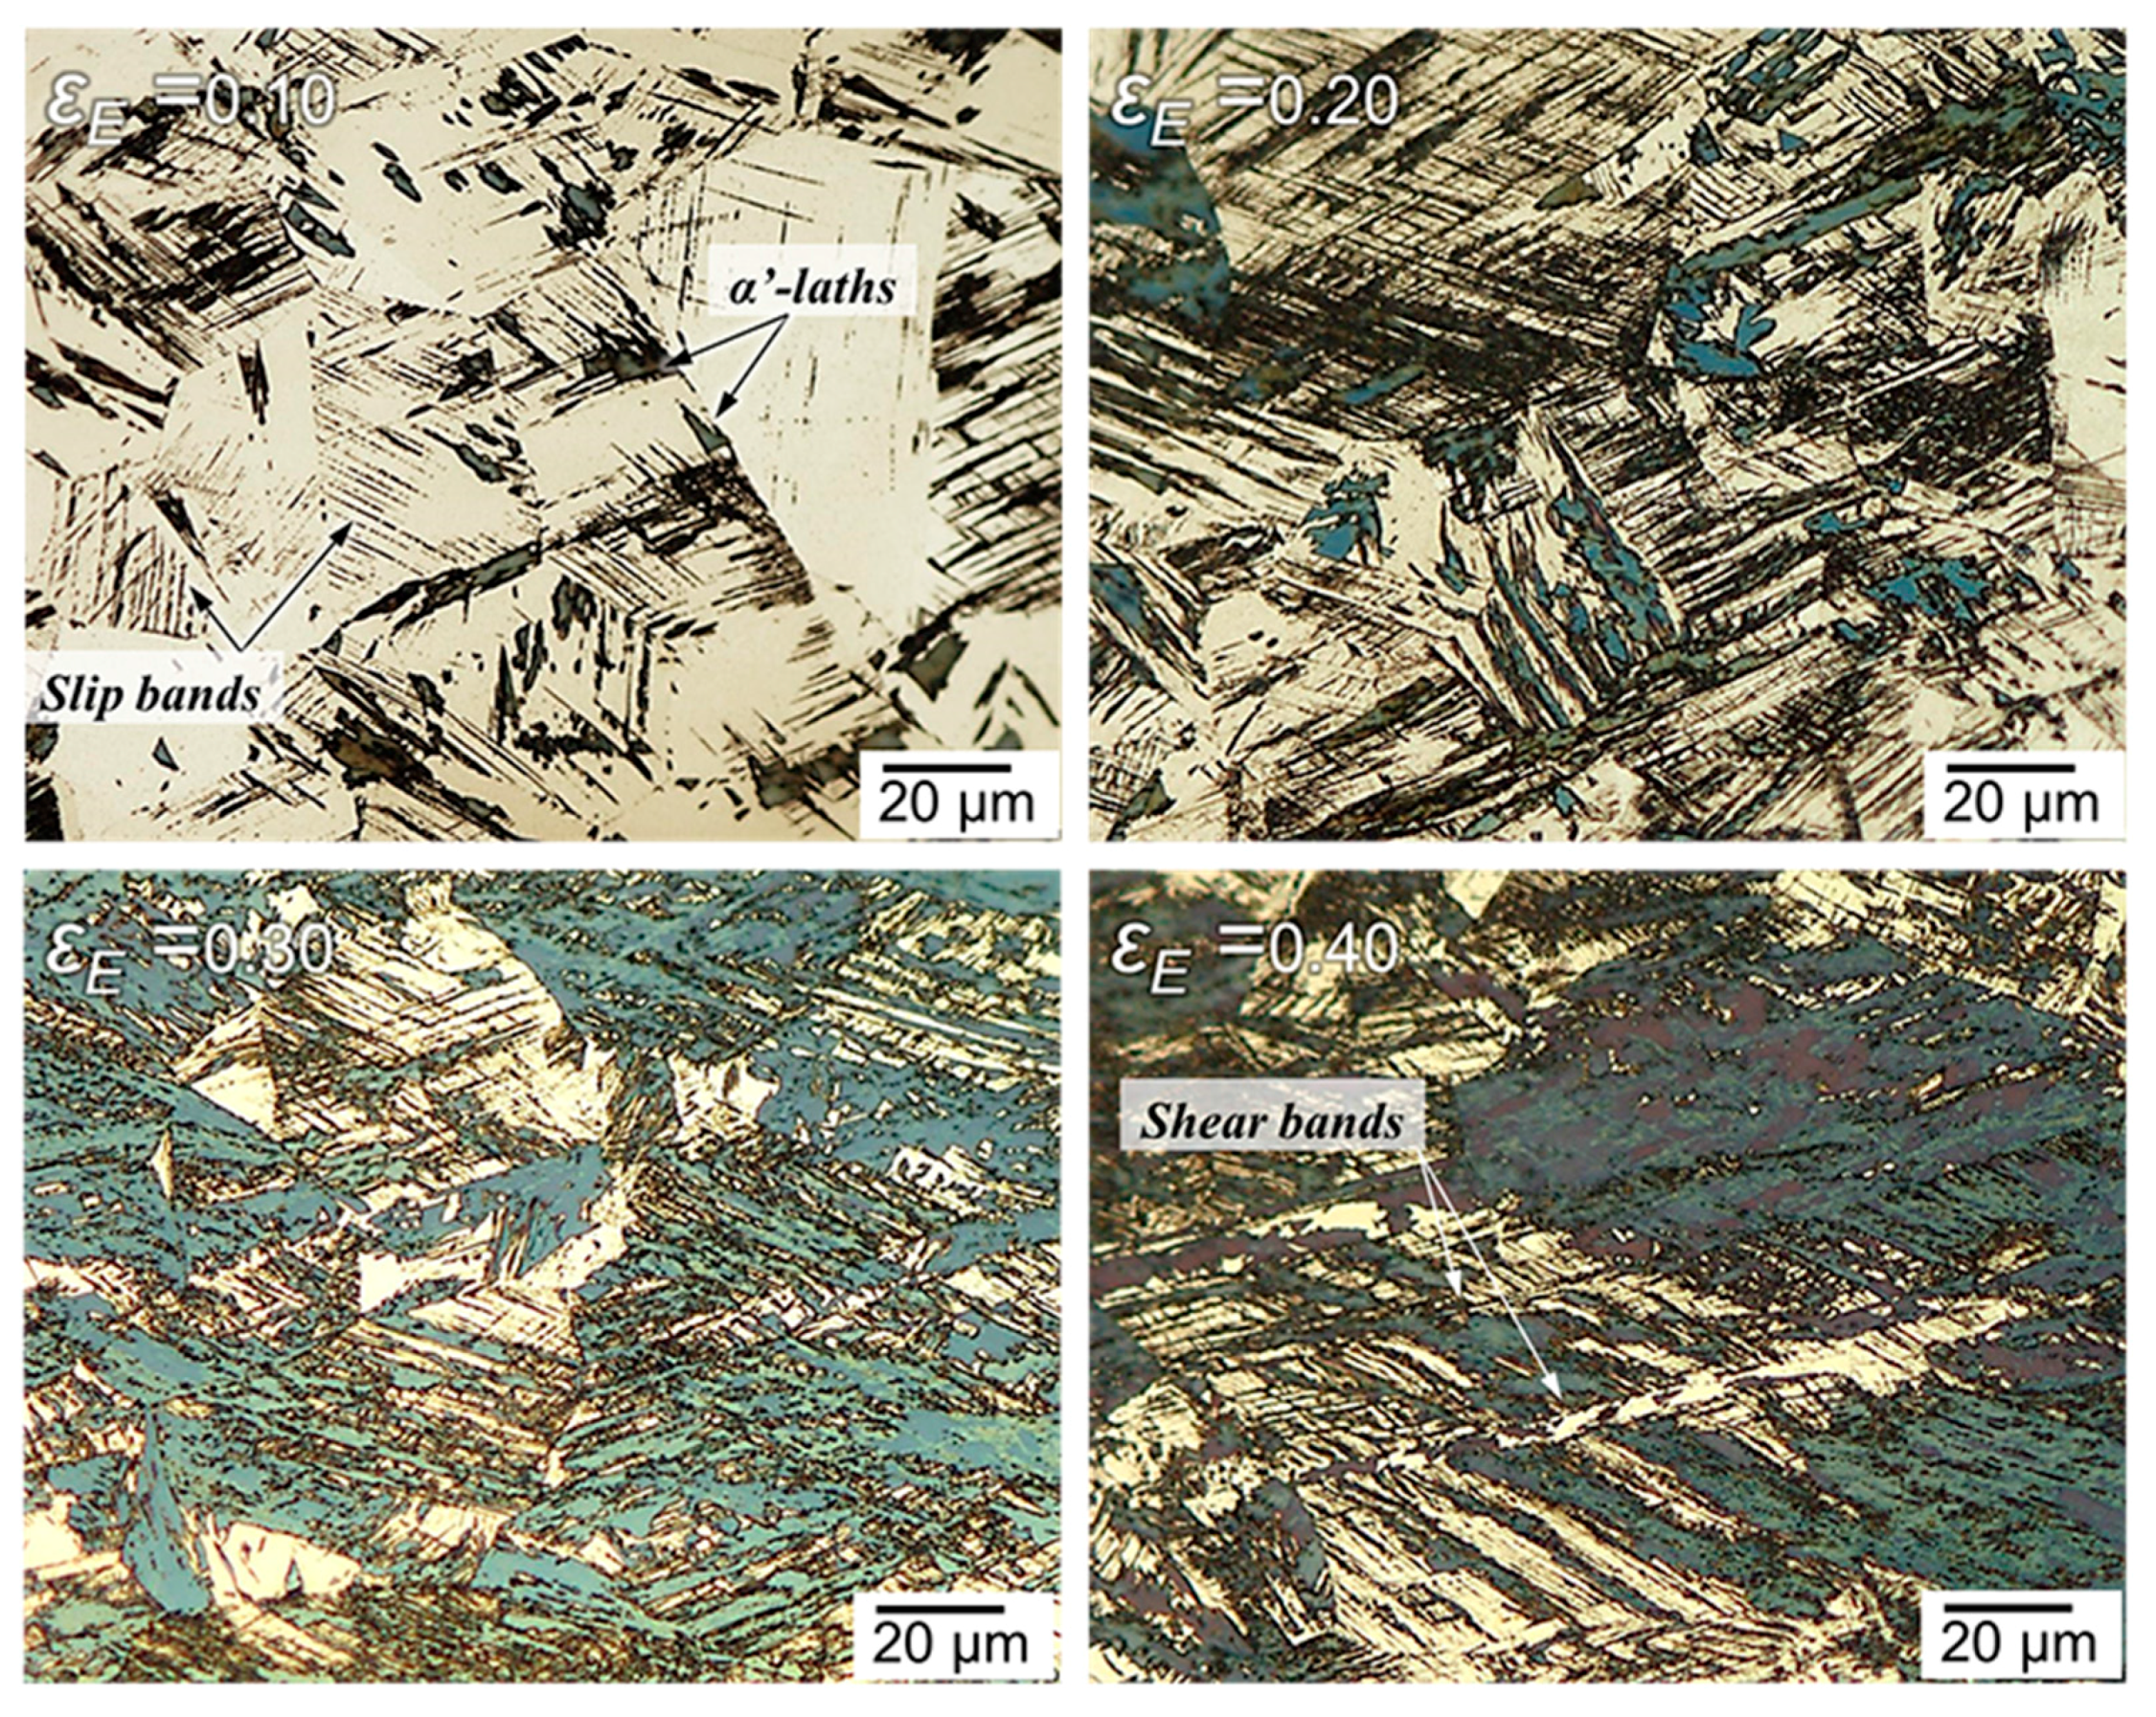
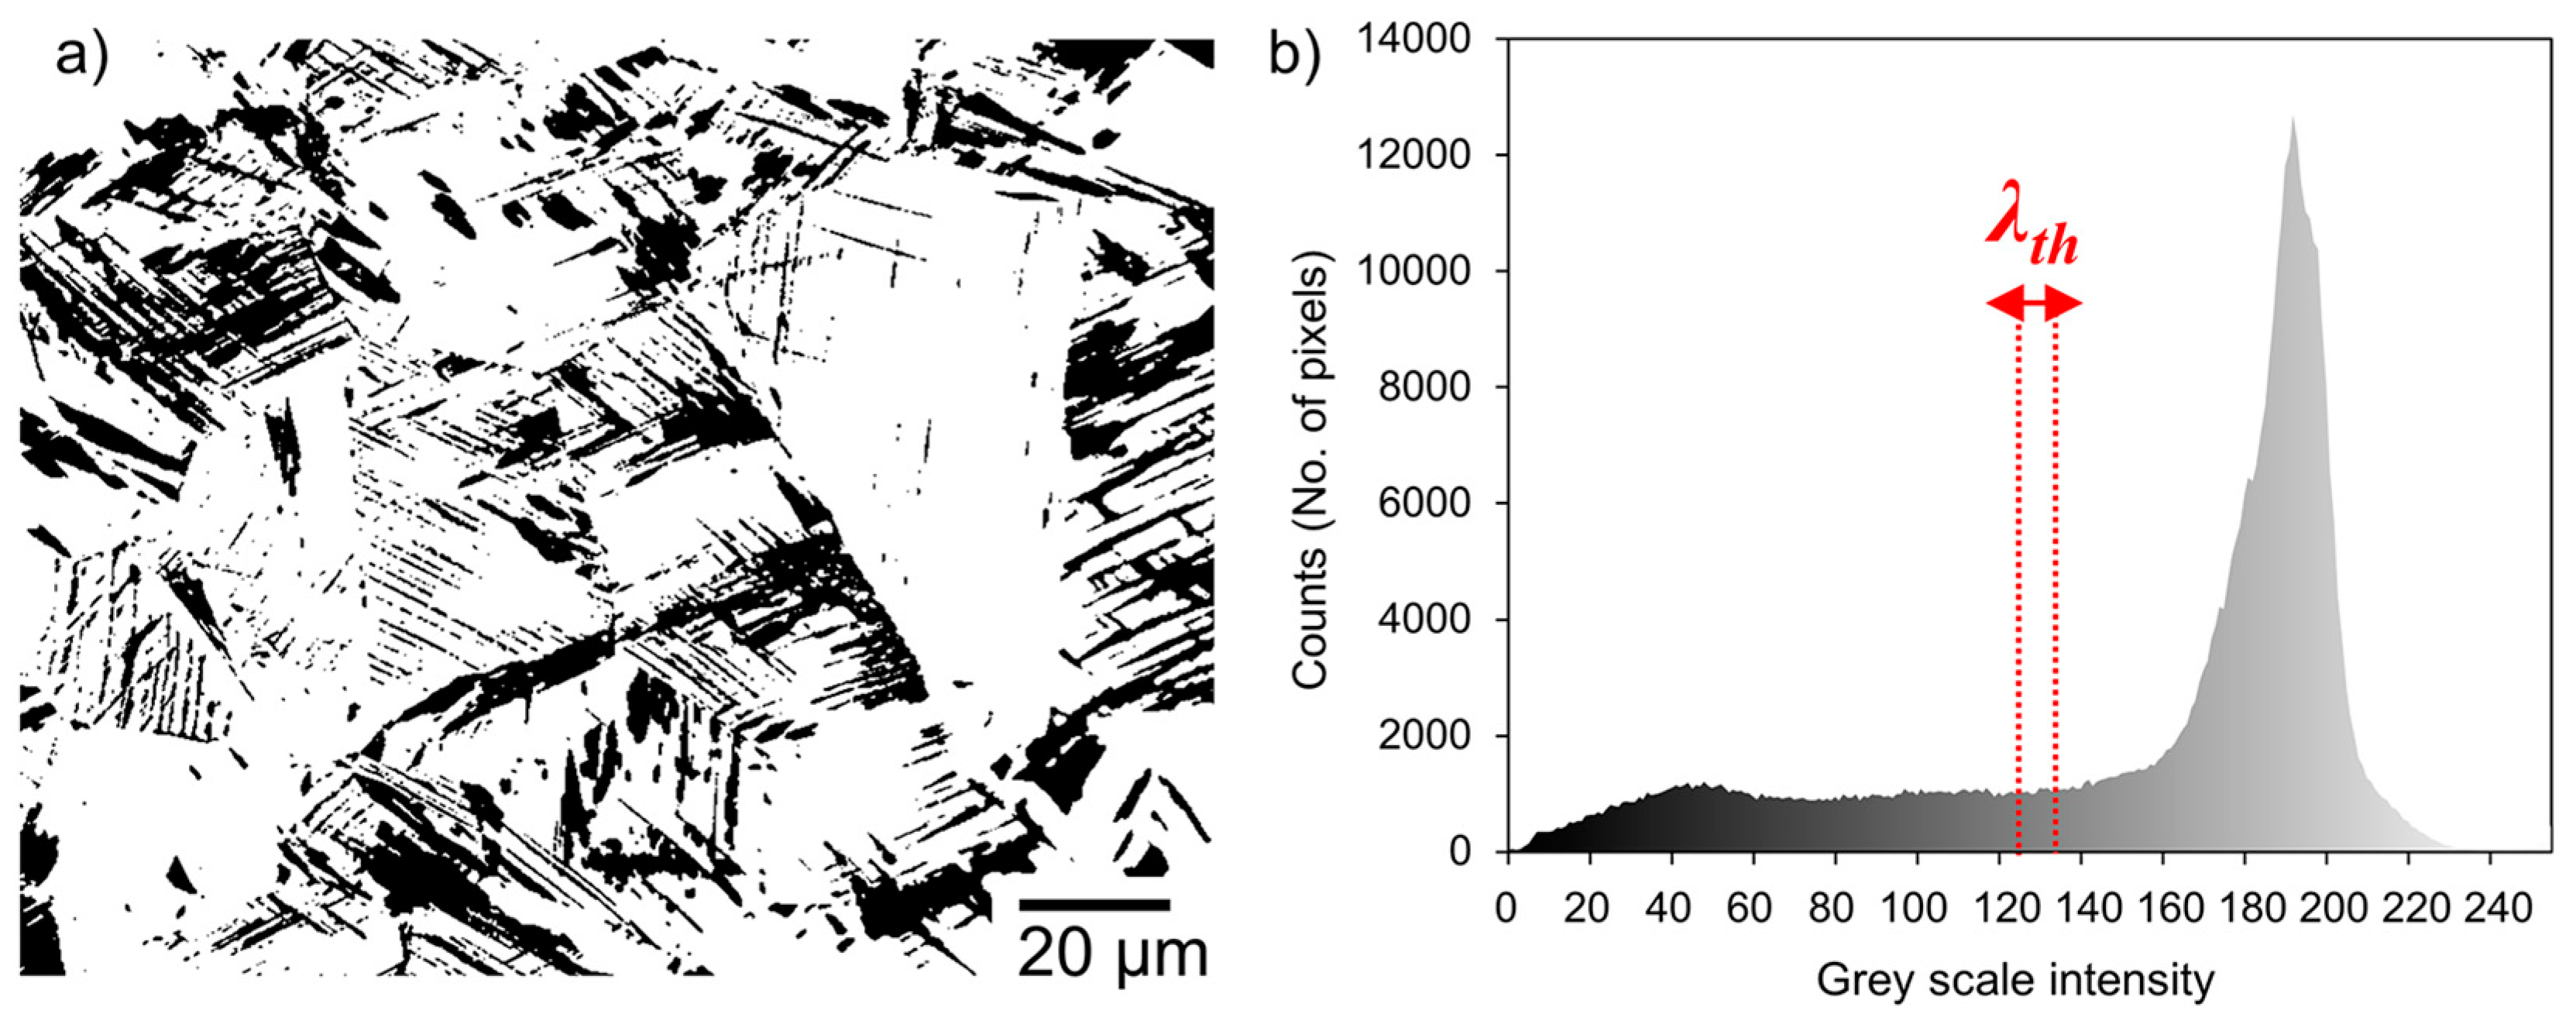
3.1. Ex-Situ Characterizatiton of Strain-Induced α′-Martensite Formation

The progress of the α′-martensite formation with the strain was studied by LOM, magnetization measurements, and XRD in tensile-tested specimens interrupted at different strains ( ε E ). Figure 2 displays the X-ray diffractograms obtained for the as-received, initial microstructure (IM), post-mortem tensile-tested specimens strained to ε E = 0.10, 0.20, 0.30, and 0.40 and a strained-to-fracture specimen ( ε E = 0.52). The initial microstructure is fully austenitic. As the material is strained, the peaks related to the γ-austenite phase decrease and those related to α′-martensite increase. It is worth mentioning that the presence of the ε-martensite phase is detected at strains of 0.20 or higher, as highlighted with diamonds in the diffractograms. These peaks, nevertheless, are quite weak. A maximum ε-martensite volume fraction of 0.04 was detected for the condition strained to ε E = 0.30. This might be indicating that, for stains lower than 0.20, the amount of ε-martensite is too small to be detected.
Figure 3 shows LOM micrographs of samples strained to 0.10, 0.20, 0.30, and 0.40. The martensite phase is revealed in dark colors and the austenite is unetched. After the application of small strains ( ε E 0.10 ), parallel slip bands appeared in those grains that are favorably oriented with respect to the applied stress direction, where slip bands are localized crystallographic slip and, thus, cannot cross existing interfaces into other orientations [18]. By increasing the strain, shear bands appear when homogeneous dislocation slip is inhibited or when an insufficient number of crystallographic slip systems is available in narrow deformation zones (order of microns) while the rest of the matrix undergoes comparably low and homogeneous plastic flow [18]. As the deformation proceeds, the shear bands intersect one another [12,19]. These intersections act as nucleation sites for α′-martensite embryos, which coalesce and grow parallel to the shear bands, as observed for samples strained to ε E = 0.10 and ε E = 0.20 . With larger strains, the fraction of α′-martensite increases rapidly. Since the purpose of etching is the quantification of the martensite phase, other than revealing the microstructure, it is important to mention here that slip bands are also revealed with the etching. This fact directly leads to inaccuracy of the method. The quantification procedure is commented in the following paragraph.
Figure 4a displays a black-and-white image for the sample strained to ε E = 0.10 (Figure 3) after conversion to a binary image and application of a grey scale threshold value ( λ t h ) of 127. The martensite phase and slip bands correspond to black pixels, while the white ones correspond to the austenite phase. Figure 4b shows the histogram of the grey scale image for the same condition. It was found that the estimated martensite content depends strongly on the choice of λ t h . Threshold value variations of ± 5 around λ t h = 127 results in changes of ± 0.01 in volume fraction of martensite. Besides, the grey scale histogram also depends on the etching time. A standard deviation value was estimated considering the automatic λ t h detected by the software and a subjectively chosen λ t h value that gives the best representation of the etched phase.
Figure 5 displays the evolution of the α′-martensite volume fraction with the engineering strain obtained from post-mortem tensile-tested by metallographic quantification, magnetization measurements, and XRD. A fairly good agreement is obtained between the data from magnetization and XRD. Since the ε-martensite is a paramagnetic phase, its formation cannot be detected by magnetization measurements. Differences between XRD and magnetization must be due to experimental errors and to the fact that magnetization measurements is a bulk characterization technique, whereas XRD is restricted to the surface. Besides, the discrepancies observed for the initial microstructure ( ε E = 0 ) could be due to some martensite induced during the metallographic preparation required for both XRD and optical inspection. The values obtained from metallographic quantification appear to be overestimated. The presence of ε-martensite in the microstructure is negligible, compared to that of γ-austenite or α′-martensite. However, it is revealed dark after etching, as are slip and shear bands. By metallographic quantification, these features are accounted for as martensite phase and, thus, this could be a possible reason for the overestimation. The relative error of the data from magnetization measurements is smaller than 0.5%. In the case of XRD, it is difficult to quantify the total error as it depends on the calculation method, instrumental limitation and the sample condition. Differences between XRD and magnetization must be due to experimental errors and to the fact that magnetization measurements is a bulk characterization technique, whereas XRD is restricted to the surface. Although both the result from magnetization and XRD show consistency to one another, measuring the bulk magnetization is a more effective and representative technique to determine the volume fraction of α′-martensite.
The volume fraction of strain-induced α′-martensite ( f α ) can be effectively described by the kinematic equation [20]:
f α = f s [ 1 exp ( β ε p l n ) ]
where f s is the saturation value of transformed martensite, ε p l is the plastic strain, and the parameters β and n represent the stability of the austenite phase and the deformation mode, respectively. In this work, f s = 0.92 and corresponds to the fraction of α′-martensite magnetically measured in a specimen strained to fracture. The fitting parameters were found to be β = 13.4 and n = 2.2 for the data obtained by magnetization measurements. They also represent well the experimental data from XRD and are consistent with other investigations in similar steels tensile strained at room temperature [20].

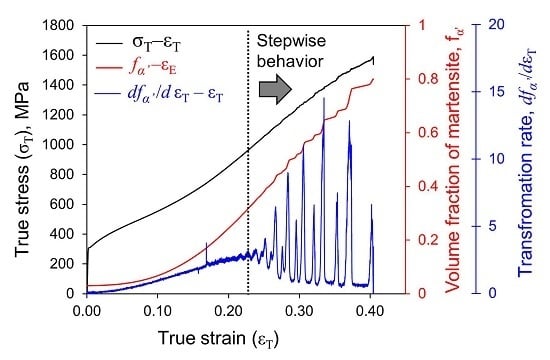
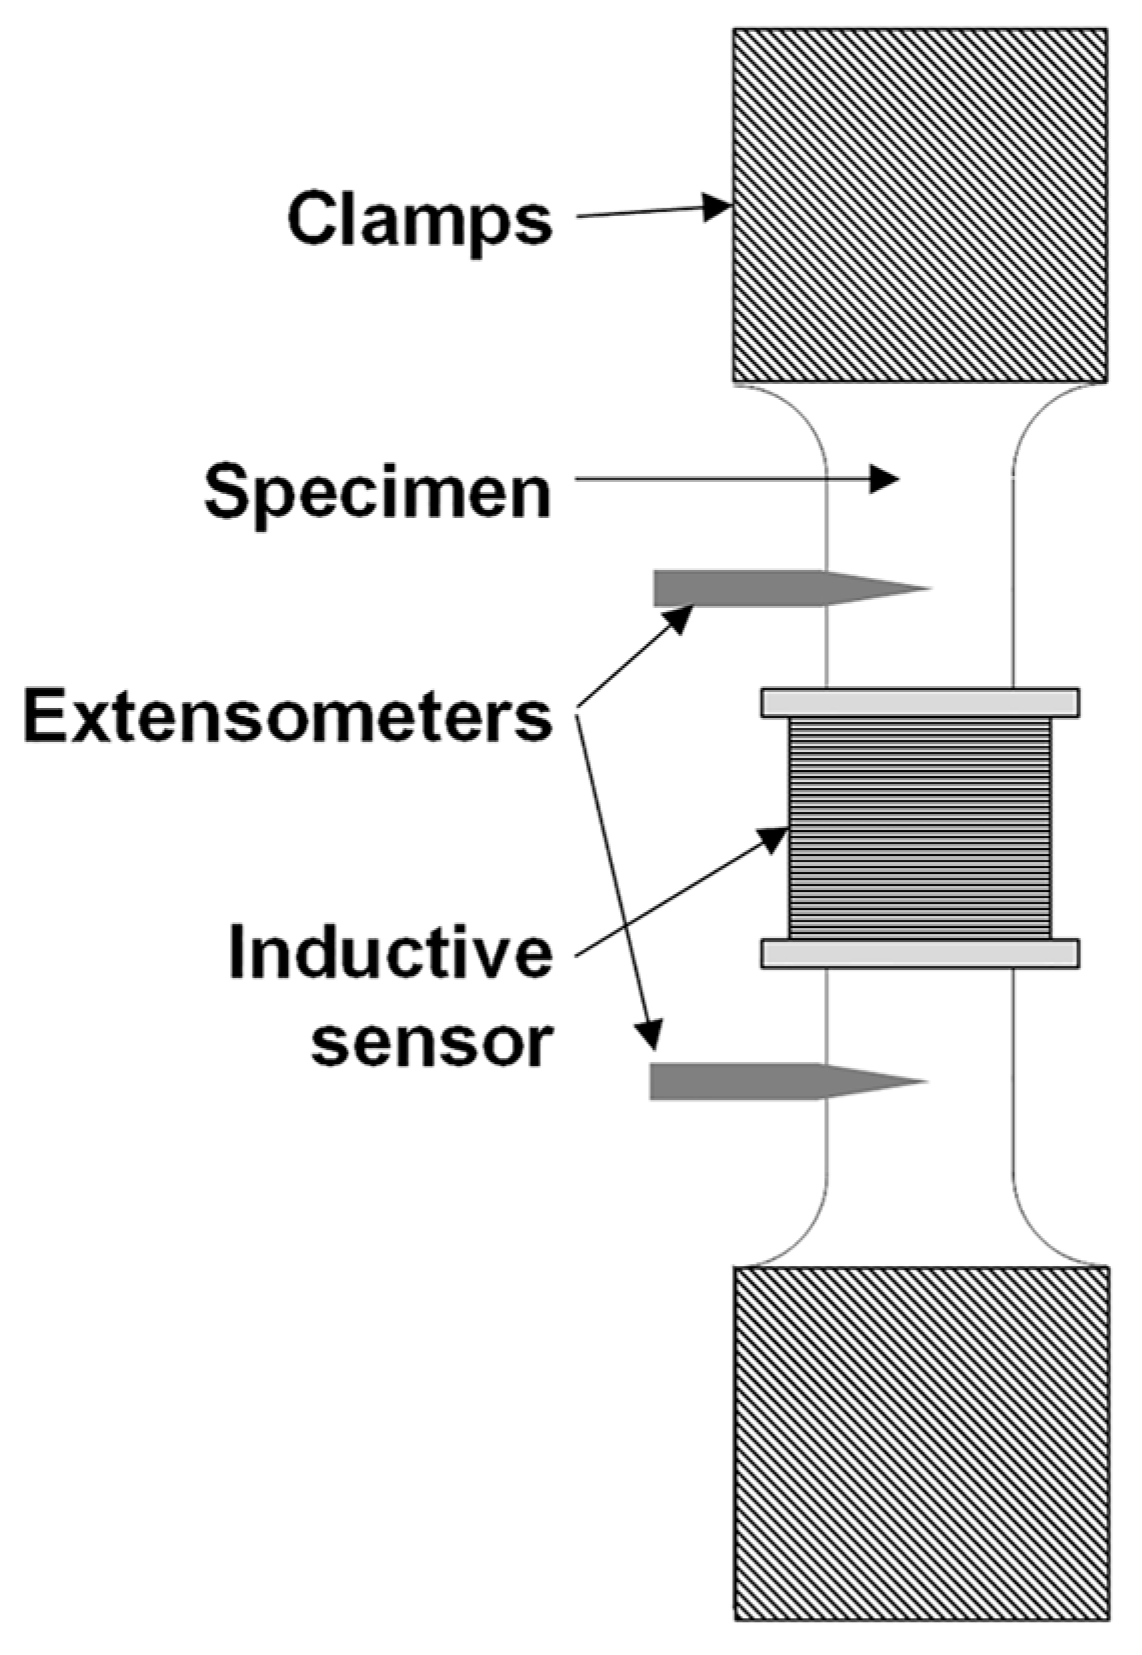
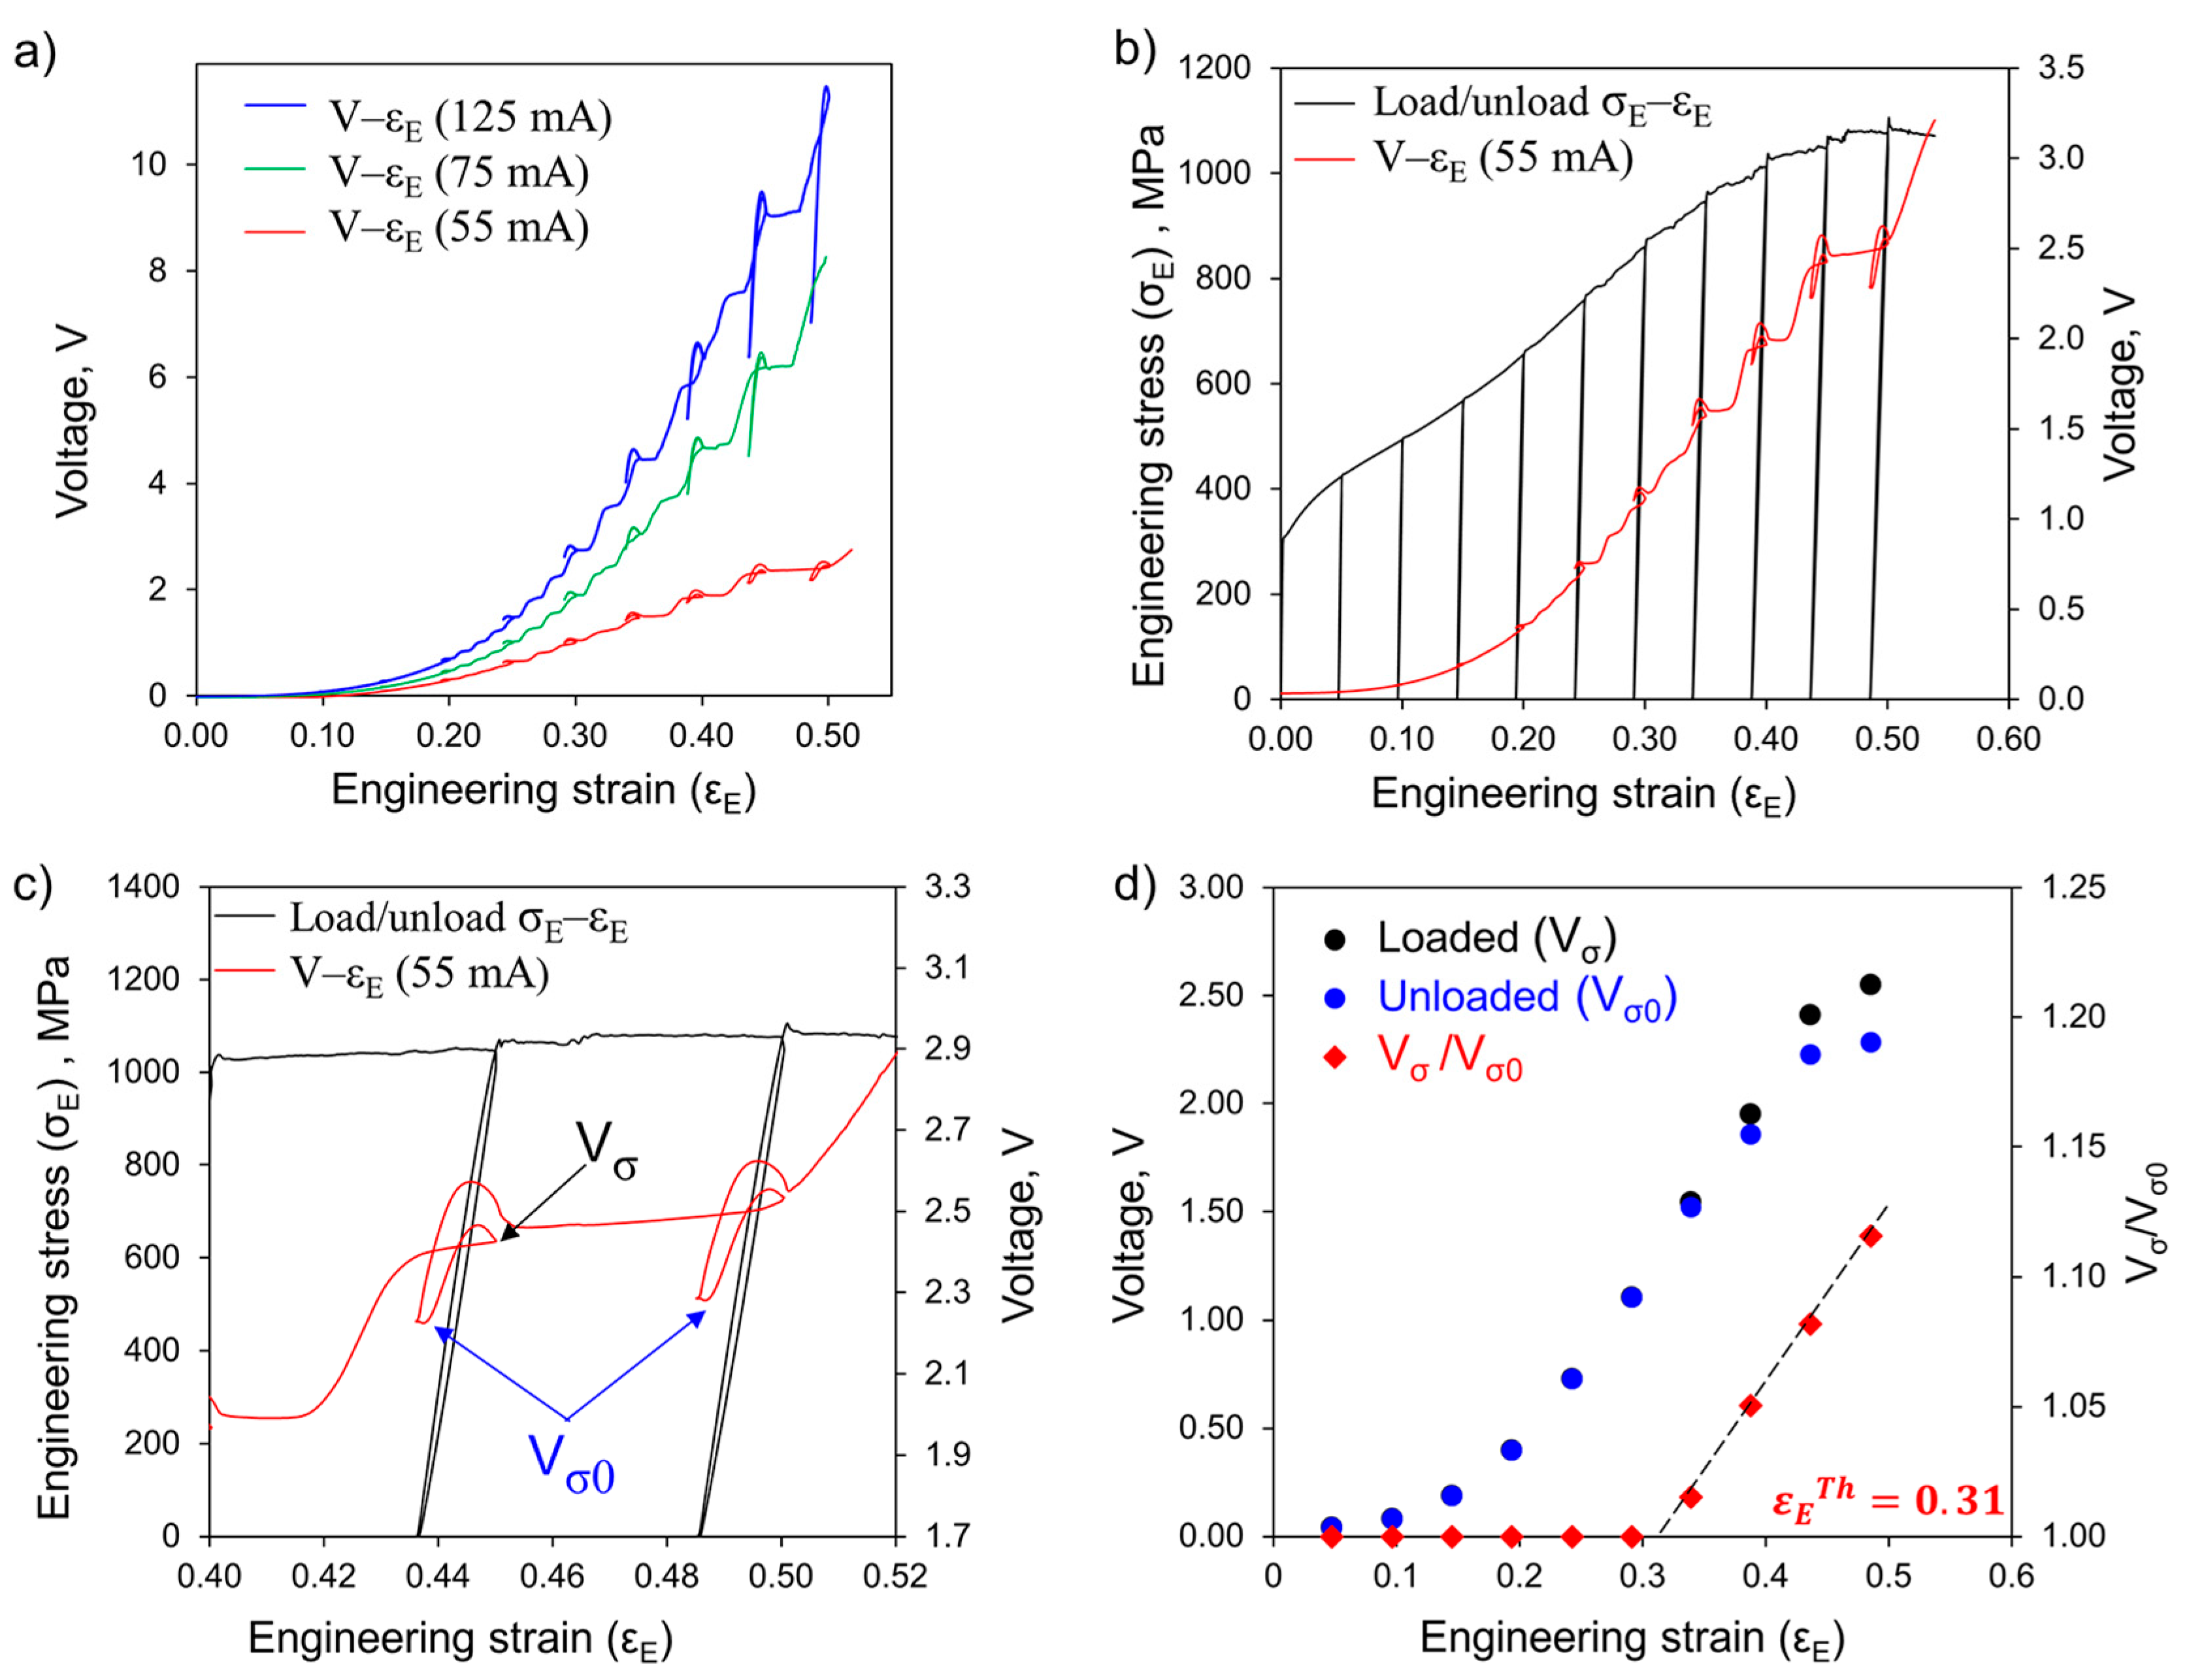
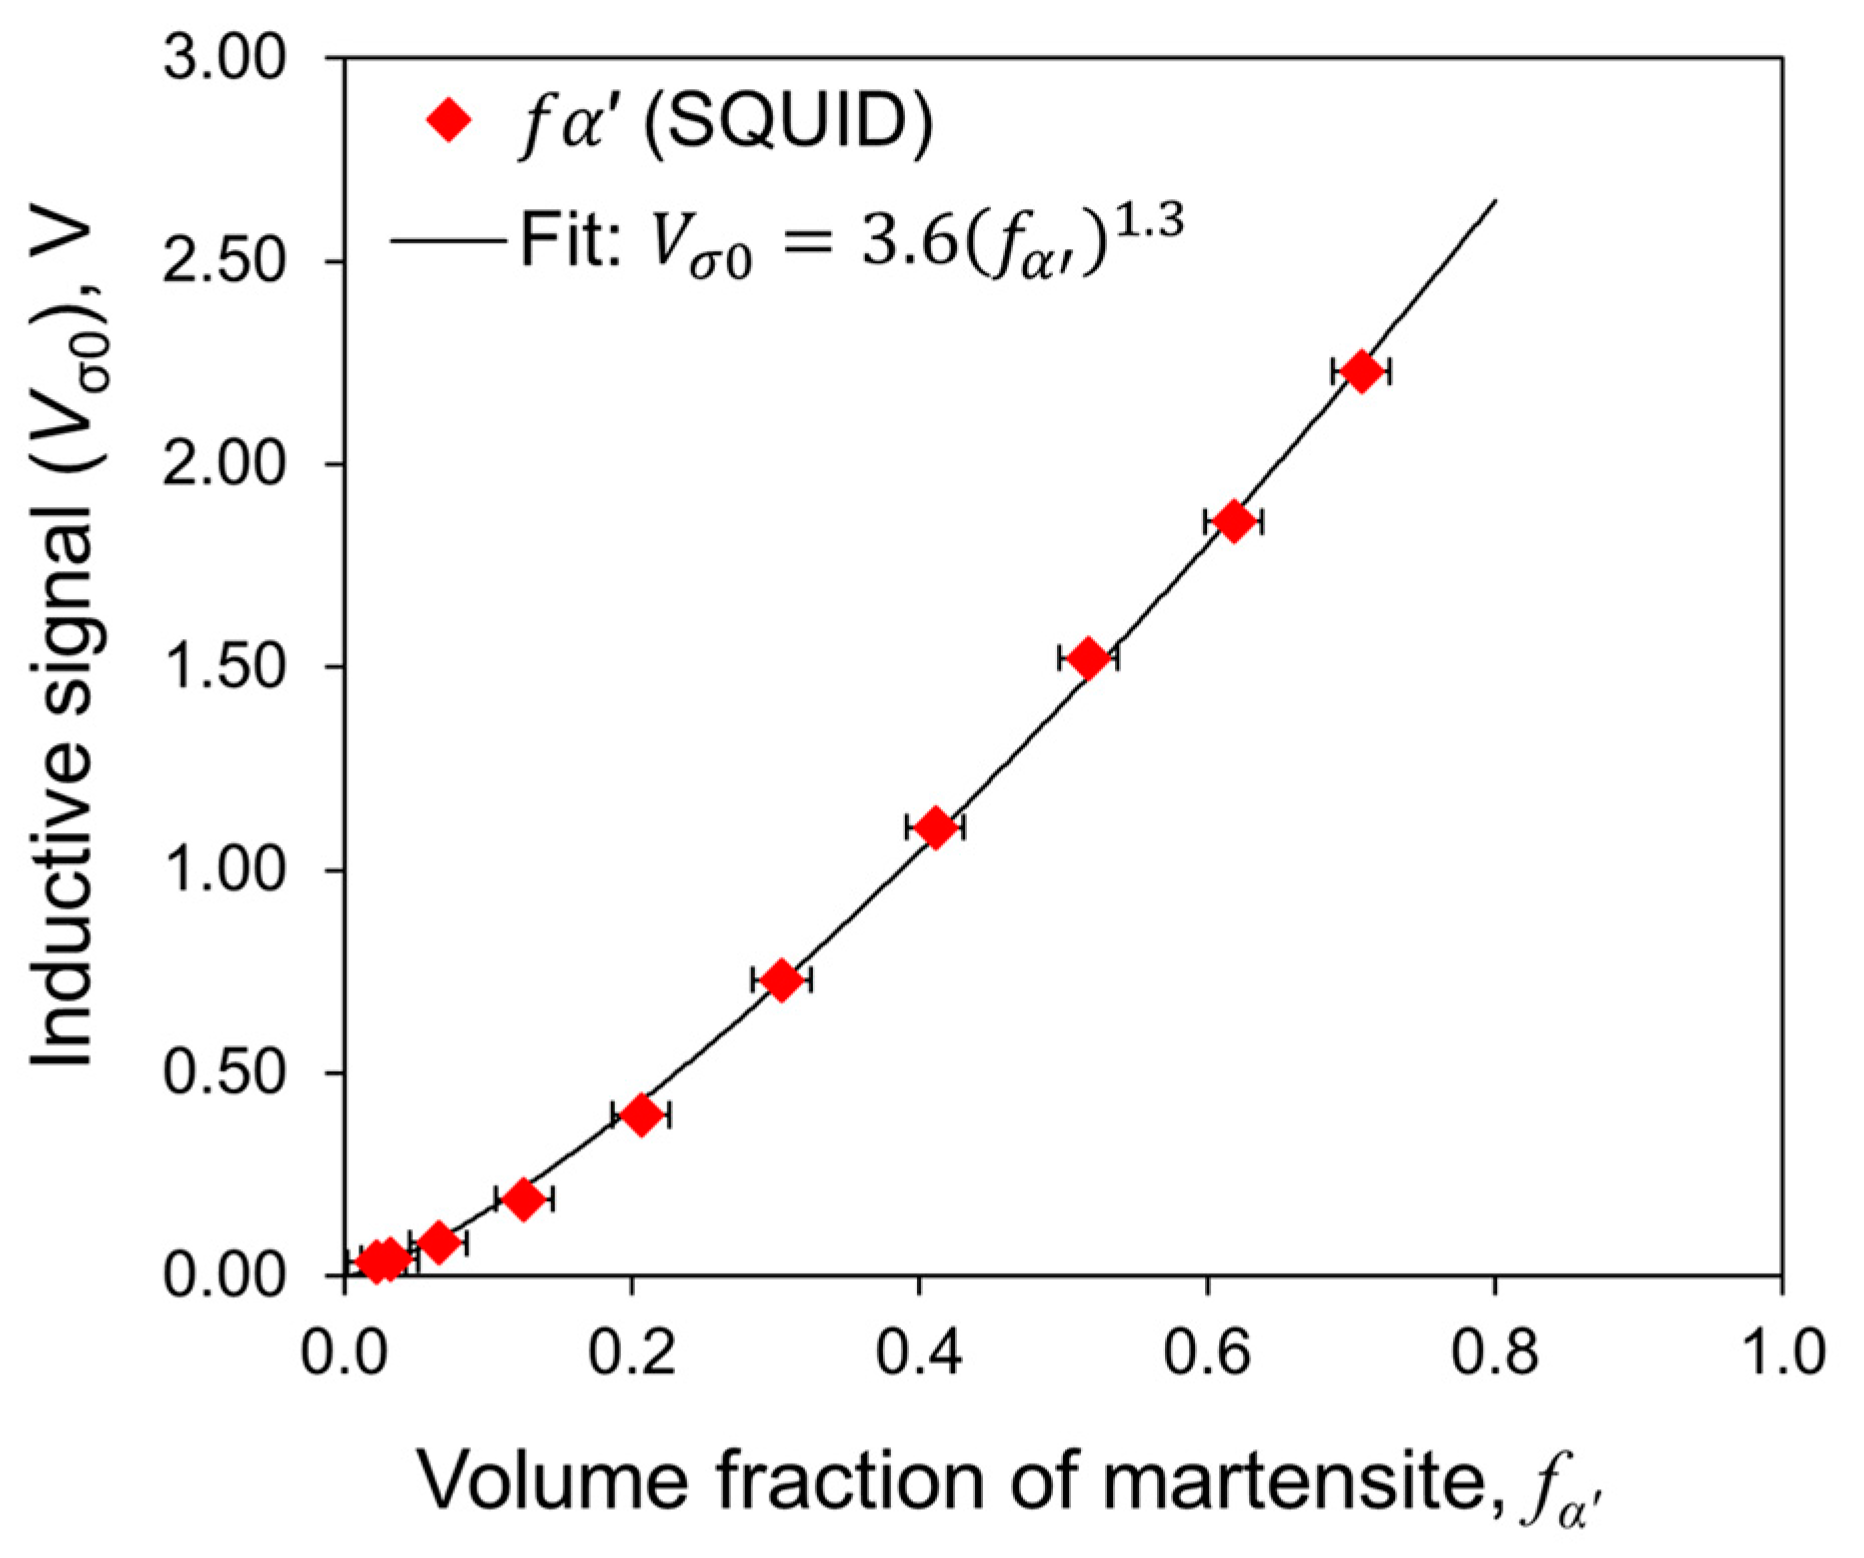
3.2. In-Situ Inductive Measurements

To transform the inductive signal from the sensor into volume fraction of martensite, the various factors affecting it have to be separated: (1) the material volume inside the sensor; (2) the temperature; (3) the applied stress and (4) the volume fraction of martensite. In this section, the different influences are decoupled and the inductive signal is corrected to isolate the influence of the martensite volume fraction.
Since the sensor measures the μ r of the enclosed material volume, the output signal will be affected by any change in this volume. As the material is elongated during the tensile test, the cross sectional area of the specimen decreases accordingly and, in the same manner, the volume enclosed within the sensor. Therefore, the voltage signal decreases linearly during tensile testing as the volume enclosed within the coil is reduced. In order to make the measurements comparable, the voltage values have to be recalculated for the reference volume, where the reference volume refers to the maximum volume of sample inside the sensor. This situation corresponds to the initial state, before straining. The volume effect on the voltage values is then corrected through the following expression: V V = V V 0 · ( 1 + l / L 0 ) , where V V 0 stands for the voltage signal obtained with the maximum volume of sample inside the sensor, corresponding to the non-deformed initial state, and l / L 0 is the strain increment measured by the extensometers, which accounts for the reduction in volume within the sensor if isotropic behavior is assumed.
Both the self-induction of the coil and the μ r of the material are temperature dependent. The coil temperature tends to increase as the result of the current circulating through it. Also, the specimen is warmed up by the deformation if high strain rates are used and thus the chemical driving force for the transformation ( G γ α ) decreases [4,19,21]. Since the strain rate used in this work ( ε ˙ = 5 × 10 4   s 1 ) does not induce heating of the specimen during the deformation [13], the current circulating through the coil is the only heat source. It is known that magnetic fields above 1 T are required to magnetically saturate the sample and, thus, to obtain a magnetization response that can be reliably related to the whole volume fraction of ferromagnetic phase [17,22]. However, the application of magnetic fields larger than 1 T for several minutes induce the formation of a significant volume fraction of isothermal martensite [23]. In this work, a compromise is reached by setting the current to 55 mA, which generates a constant magnetic field of 0.6 T. This magnetic field is high enough to capture martensite formation, but sufficiently low to minimize the temperature increment within the measurement time. Besides, this magnetic field will not accelerate the martensitic transformation kinetics during the course of the cyclic load/unload experiments, which take around 15 min.
The magnetomechanical or “Villari” effect is the phenomenon that relates the effect of an applied stress on the magnetization response of a ferromagnetic material. Thus, it depends on the fraction of martensite and the hydrostatic stress [6]. Cyclic LUR experiments give information about the change of magnetic properties driven by the elastic volume changes in the stressed material. Figure 6a shows the coupled influence of the plastic strain and current and, thus, the magnetic field on the voltage recorded. On the one hand, it is observed that the higher the current, the higher the output voltage signal and thus, the higher magnetic field. On the other hand, in each unload/reload cycle, the voltage first increases and then decreases significantly, reaching a minimum when the load is zero. Then the specimen is reloaded and the voltage raises again. The resultant voltage loop induced by the unloading-reloading cycles is a consequence of the changes in the magnetic properties, and becomes more pronounced as the current is increased. By setting the current to 55 mA (red curve of Figure 6a), the stress effect is significantly reduced. The lower the current, the smaller the change in voltage due to unloading and reloading, as observed from the V ε E curves in Figure 6a. It is worth mentioning that it is not possible to eliminate the stress effect completely. A further decrease of the current would not generate a sufficiently high magnetic field to magnetically saturate the sample, as discussed previously. Figure 6b displays the LUR experiment with the V ε E curve obtained with a current of 55 mA. It is seen that the stress effect increases as the sample is strained and, thus, as the fraction of martensite increases. Figure 6c gives a magnified view of Figure 6b for ε E in the range 0.45–0.50. In this view, the hysteresis behavior can be better appreciated in the stress–strain curve upon unloading/reloading and in terms of its influence on the inductive signal. Under zero stress, the voltage signal is at its minimum and it can be said that this value corresponds solely to the martensitic volume fraction as there is no stress-effect. The determination of this value free of stress-effect is denoted as V σ 0 (pointed by arrows in Figure 6c) and has a systematic error of ±0.01. V σ refers to the signal obtained in the loaded condition and, thus, it is the sum of the martensite fraction and the stress effect. Therefore, the effect of the stress can be isolated by subtracting V σ 0 from V σ . Figure 6d shows the evolution of both signals V σ (loaded) and V σ 0 (unloaded) with the strain and, thus, the deconvolution of two effects. The plastic deformation is also known to affect the magnetic response of ferromagnetic materials due to texture changes and the effect of dislocations on the domain structure and domain walls movement [24]. However, the texture change of α′-martensite during tensile testing is small [25] and, therefore, the difference between V σ 0 and V σ can be solely attributed to the magnetomechanical effect. In order to find a function that allows for the correction of the output signal obtained under monotonic tensile tests, the elastic stress effect is expressed as the ratio V σ / V σ 0 and plot in the secondary y-axis of Figure 6d. It is observed that, for the applied current, there is no stress influence until a plastic strain threshold value of ε E t h = 0.31 is exceeded. Afterwards, the stress effect increases linearly with the plastic strain and the output signal can be corrected through the following expression: V σ / V σ 0 = 0.8 + 0.7 ε E , where the correction factor is a function of the current circulating through the coil.
After applying the above mentioned corrections, the inductive signal V σ 0 is solely due to the martensite volume fraction. In order to find out the correlation between the voltage and the fraction of martensite phase, the results from SQUID magnetization measurements were compared with the inductive values ( V σ 0 ) corresponding to the same strain level. Figure 7 shows a plot of V σ 0 as a function of the volume fraction of α′-martensite obtained by SQUID magnetization measurements. Y-error bars are of the order of data points. The exponential fit equation utilized to correlate both signals will be used to convert the voltage signal into volume fraction of α′-martensite obtained during the monotonic tensile tests.
Figure 8 displays the σ E ε E curve obtained under monotonic tensile test to fracture. The material exhibits a yield strength and ultimate tensile strength of 310 and 1060 MPa, respectively. Both the uniform and total elongations are found at an engineering strain of 0.50. A similar evolution of f α with ε E is obtained by SQUID magnetization measurements, the sensor, and the formation kinetics predicted by Equation (1). The data obtained inductively provides, nevertheless, more information about processes occurring during the martensitic transformation. Figure 9a represents the true stress–strain curves ( σ T ε T ) and the evolution of the martensite formation as a function of ε T . A transition between a smooth transformation and a “step-like” transformation behavior is observed from strain levels of ε T 0.23   ( f α 0.32 ) onwards. Figure 9b provides a detailed view of this stepwise behavior. In each transformation step (pointed by arrows), a large fraction of austenite suddenly transforms into α′-martensite in a narrow strain increment. Each burst of martensite is followed by a plateau where almost no transformation occurs. These sudden increments in martensite volume fraction are reflected as roughness in the σ E ε E curve.

4. Discussion

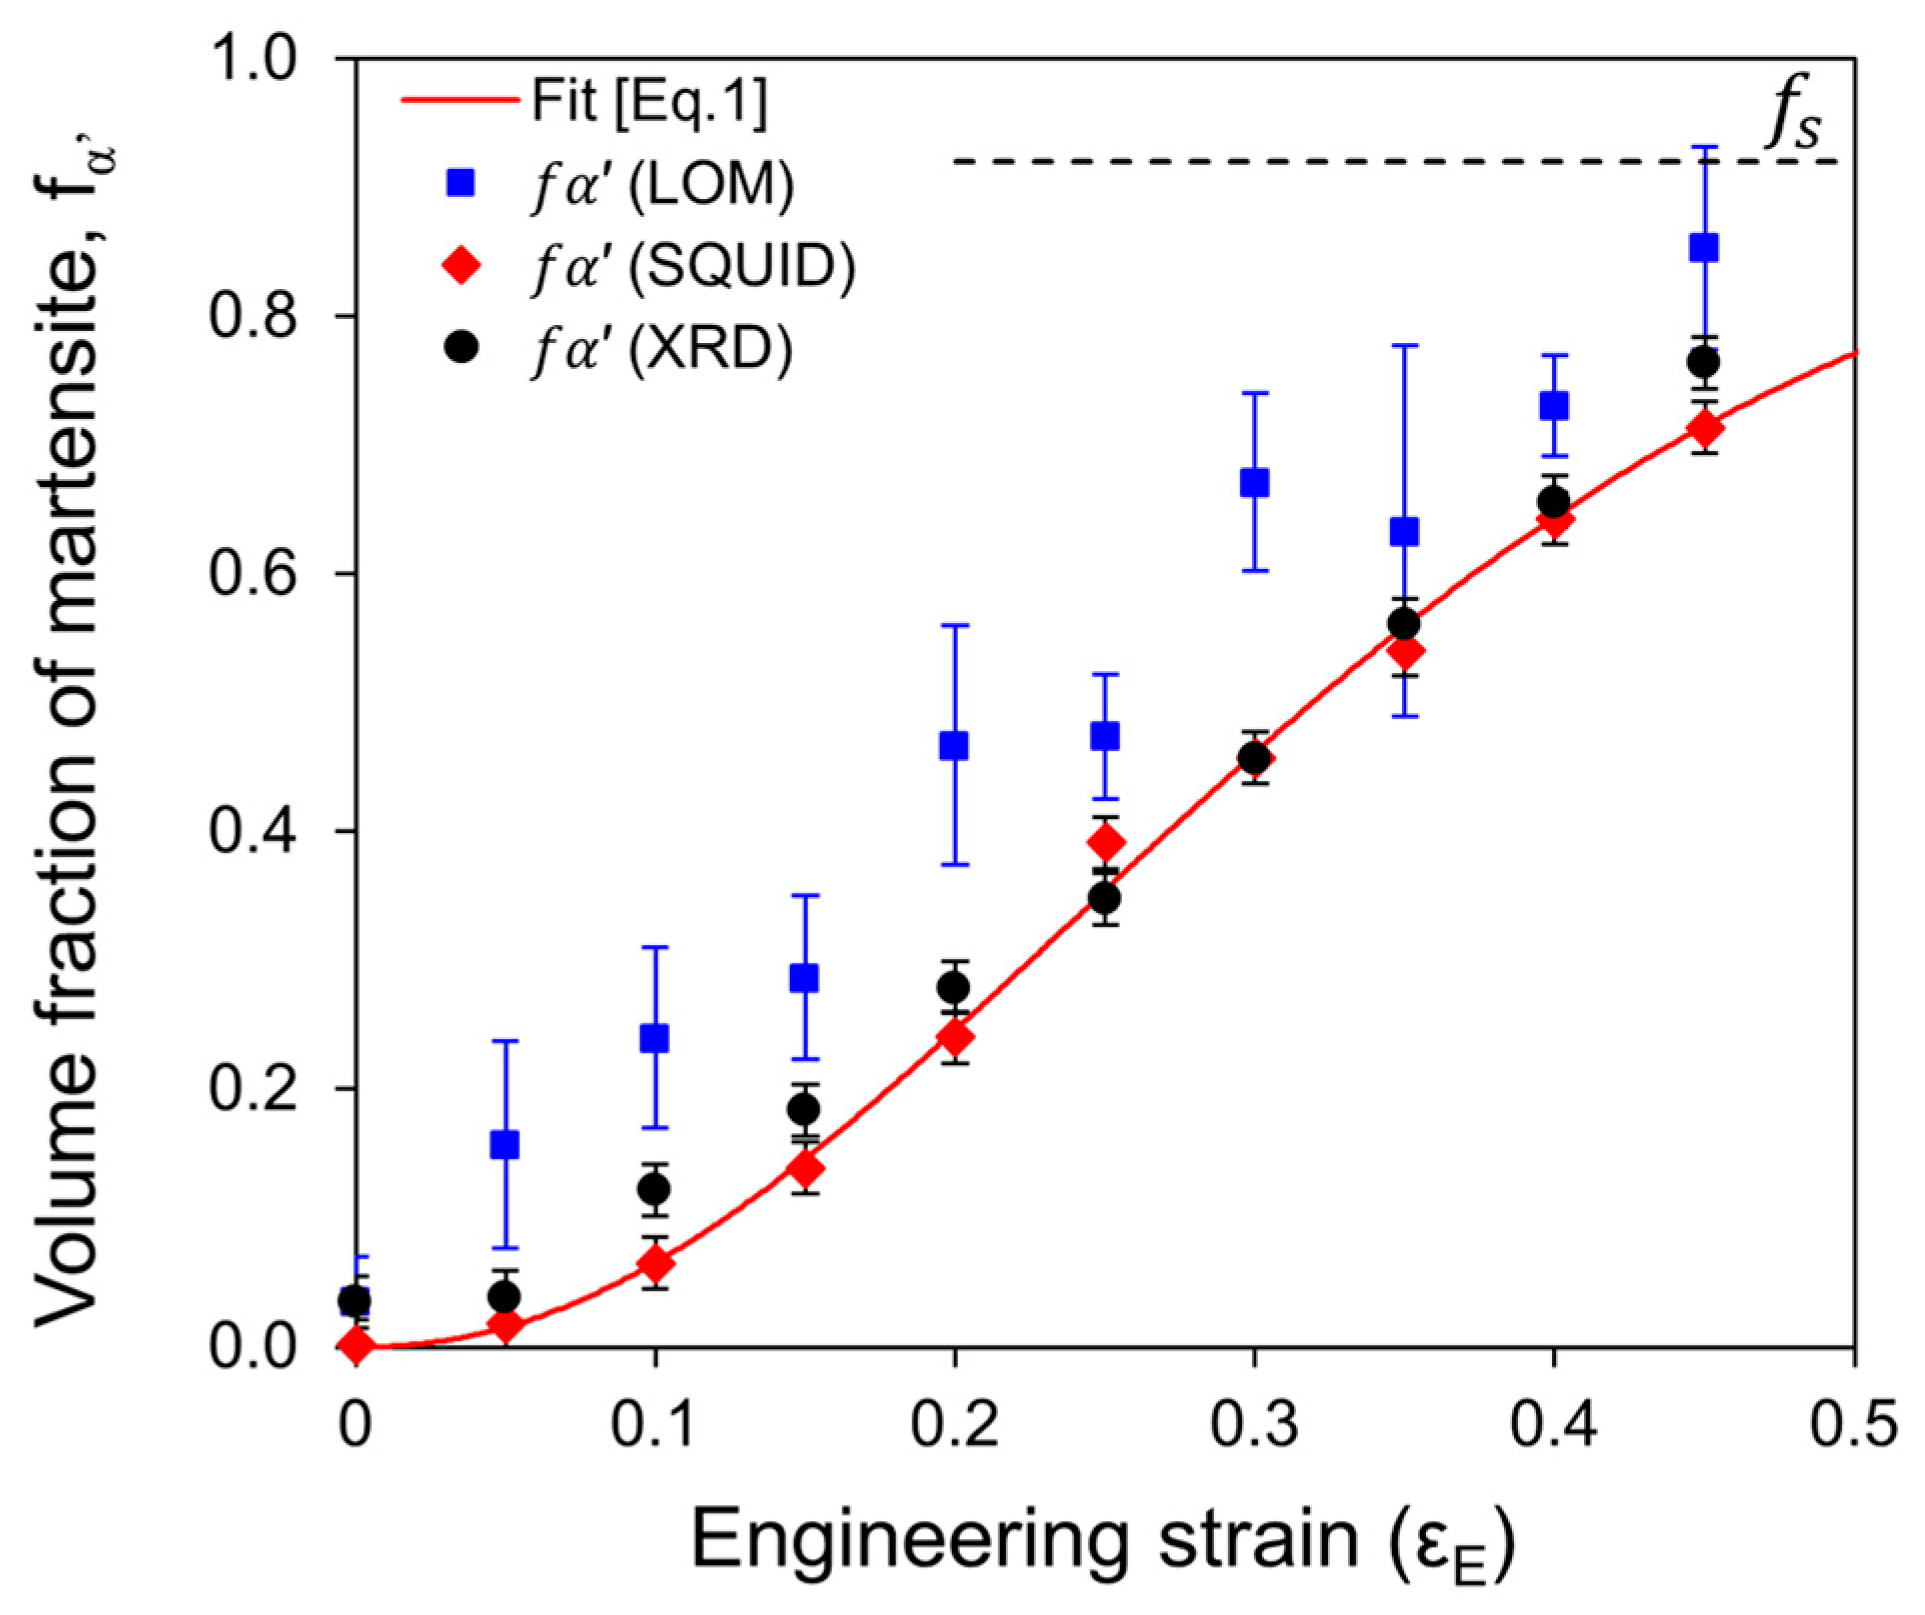
4.1. Comparing Techniques to Desctibe the Martensitic Transformation Kinetics under Unixial Tension

The quantification of the α′-martensite by the different ex-situ characterization techniques is compared in Figure 5. Metallographic quantification leads to an overestimation of α′-martensite volume fraction as compared to the results from magnetization measurements and XRD. The reason is most likely related to the fact that etching does not only disclose α′-martensite, but also ε–martensite, and slip and shear bands. Other than that, the results are affected by the selected λ t h value and the etching of the sample, which makes the method subjective and ambiguous. Therefore, this technique is not recommended for determining the volume fraction of martensite. On the contrary, magnetization measurements and XRD represent more accurate and reliable quantification techniques [22]. Both methods show consistency to one another and also with the results obtained in-situ with the sensor (Figure 8).
It is an important drawback of ex-situ characterization techniques that none of them are able to detect the stress-assisted type of martensitic transformation. Post-mortem tensile specimens are likely to contain residual stresses accumulated in the microstructure after straining. These stresses might trigger further martensitic transformation in the meantime between tensile testing and measurement. Perdahcioğly et al. [3] found a linear relation between the amount of tension and the transformation rate in a 12Cr-9Ni-4Mo austenitic stainless steel. They concluded that the transformation rate increases proportionally with the increase in mechanical driving force, which agrees well with Patel and Cohen’s theory on the action of applied stress on the martensitic transformation [26]. In this sense, in-situ measurements are a more suitable option to investigate the martensitic transformation kinetics. Both stress- and strain-induced types of martensitic transformation have been studied by means of complex, in-situ techniques such as neutron diffraction or HEXRD [8,9,11]. The information provided by these techniques is very accurate and reliable, but it is also localized. The inductive sensor used in this work is also able to measure both strain- and stress-induced types of transformation and can analyze sample volumes of 31 mm × 20 mm × 0.3 mm. Regarding the formation of stress-induced martensite, insight can be obtained through LUR tests. In each unload/reload cycle, the austenite is stressed below its current flow stress. Therefore, if stress-induced transformation occurred during this stage, it would be reflected as an increment in the voltage after unloading/reloading. As Figure 6c displays, the voltage values before and after the unloading/reloading cycles do not match perfectly. A small increment can be appreciated and thus it could be attributed to the formation of stress-induced martensite during the cycle. However, its contribution to the whole transformation is very weak. For this reason, it can be said that the strain-induced mechanism prevails throughout the whole transformation in this case.

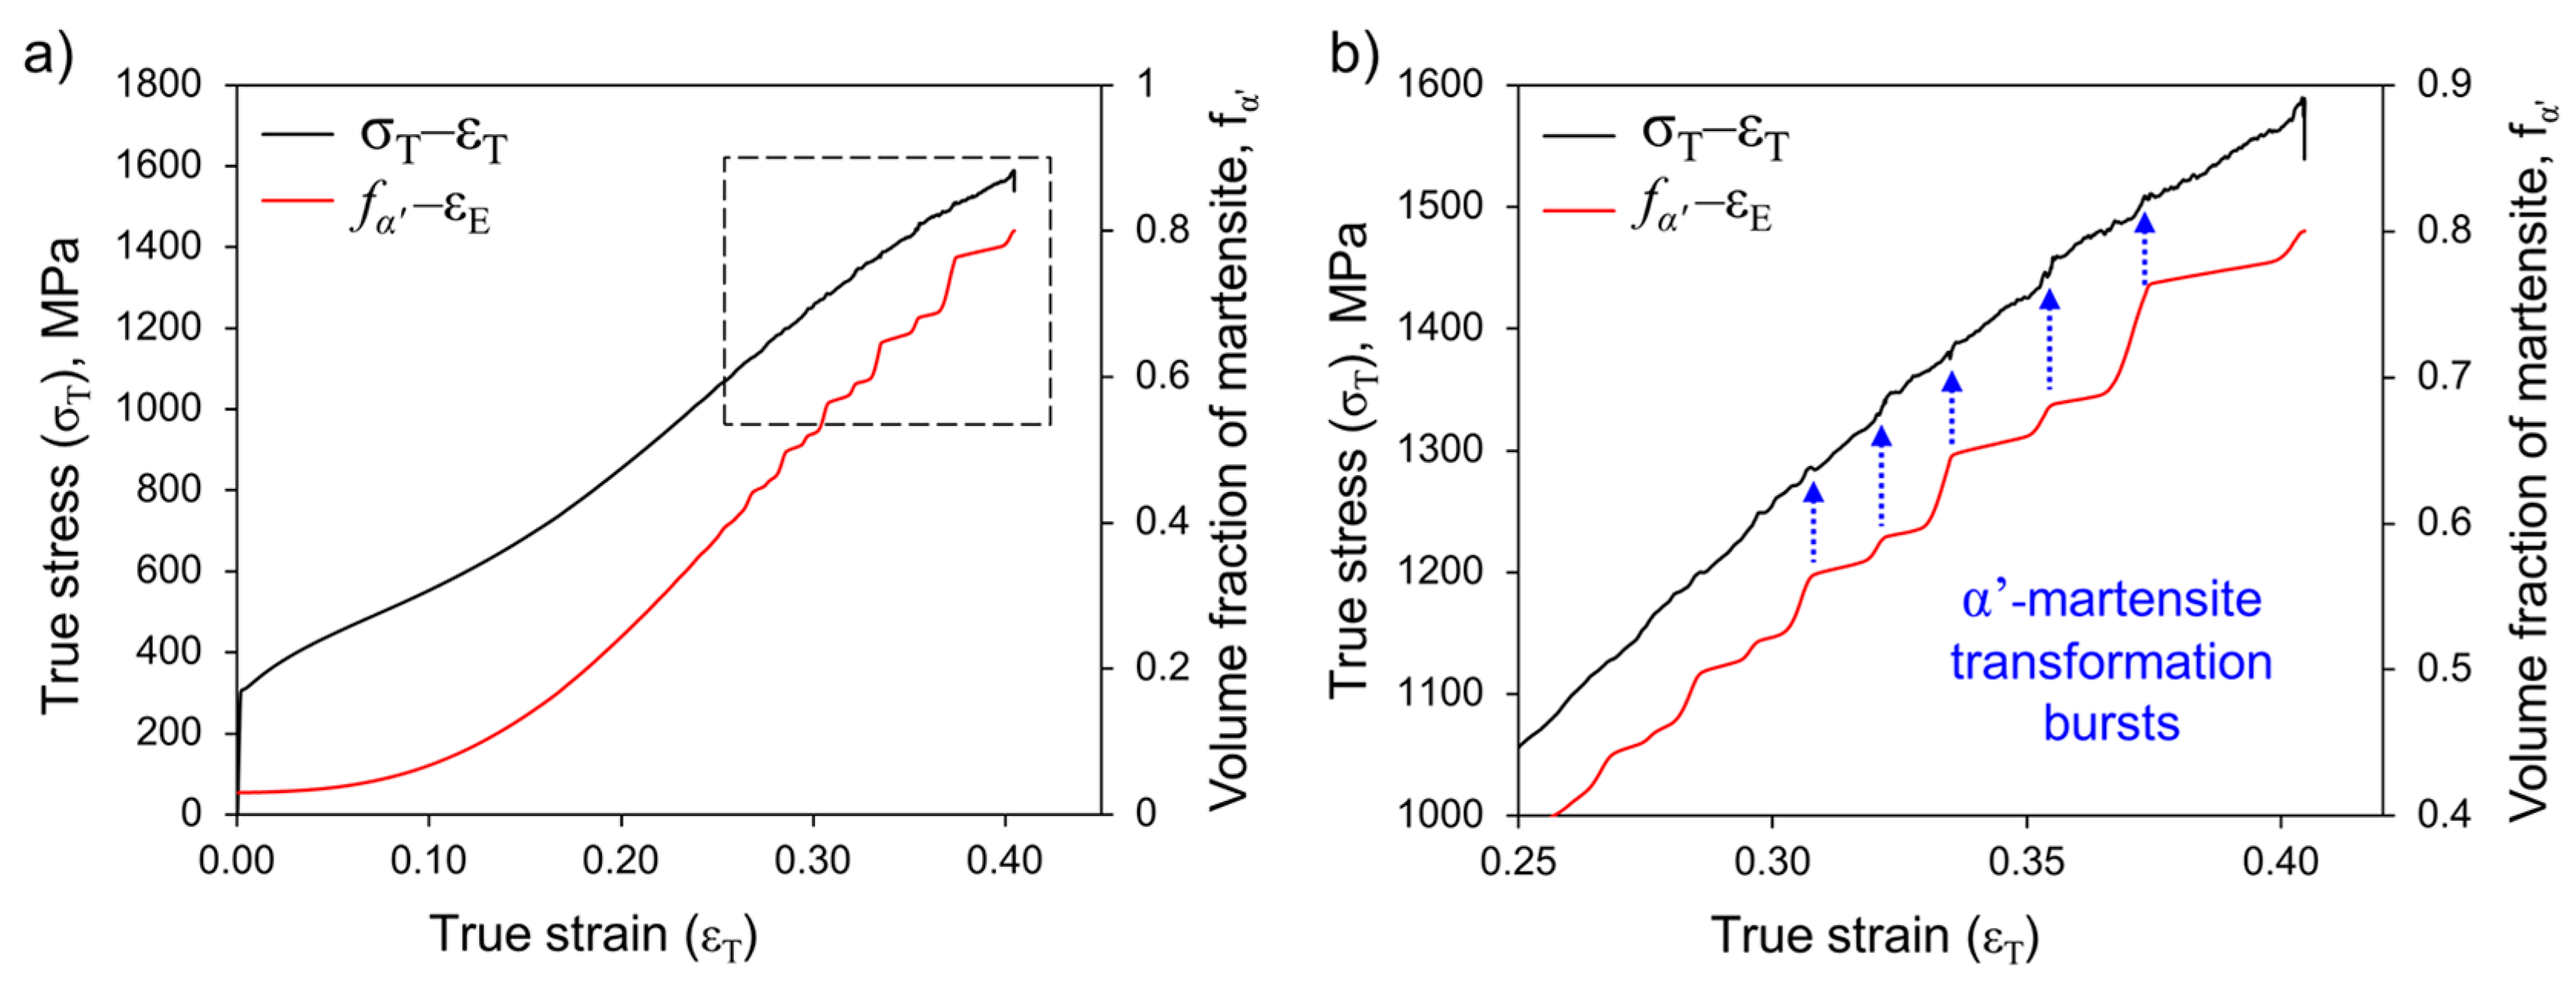
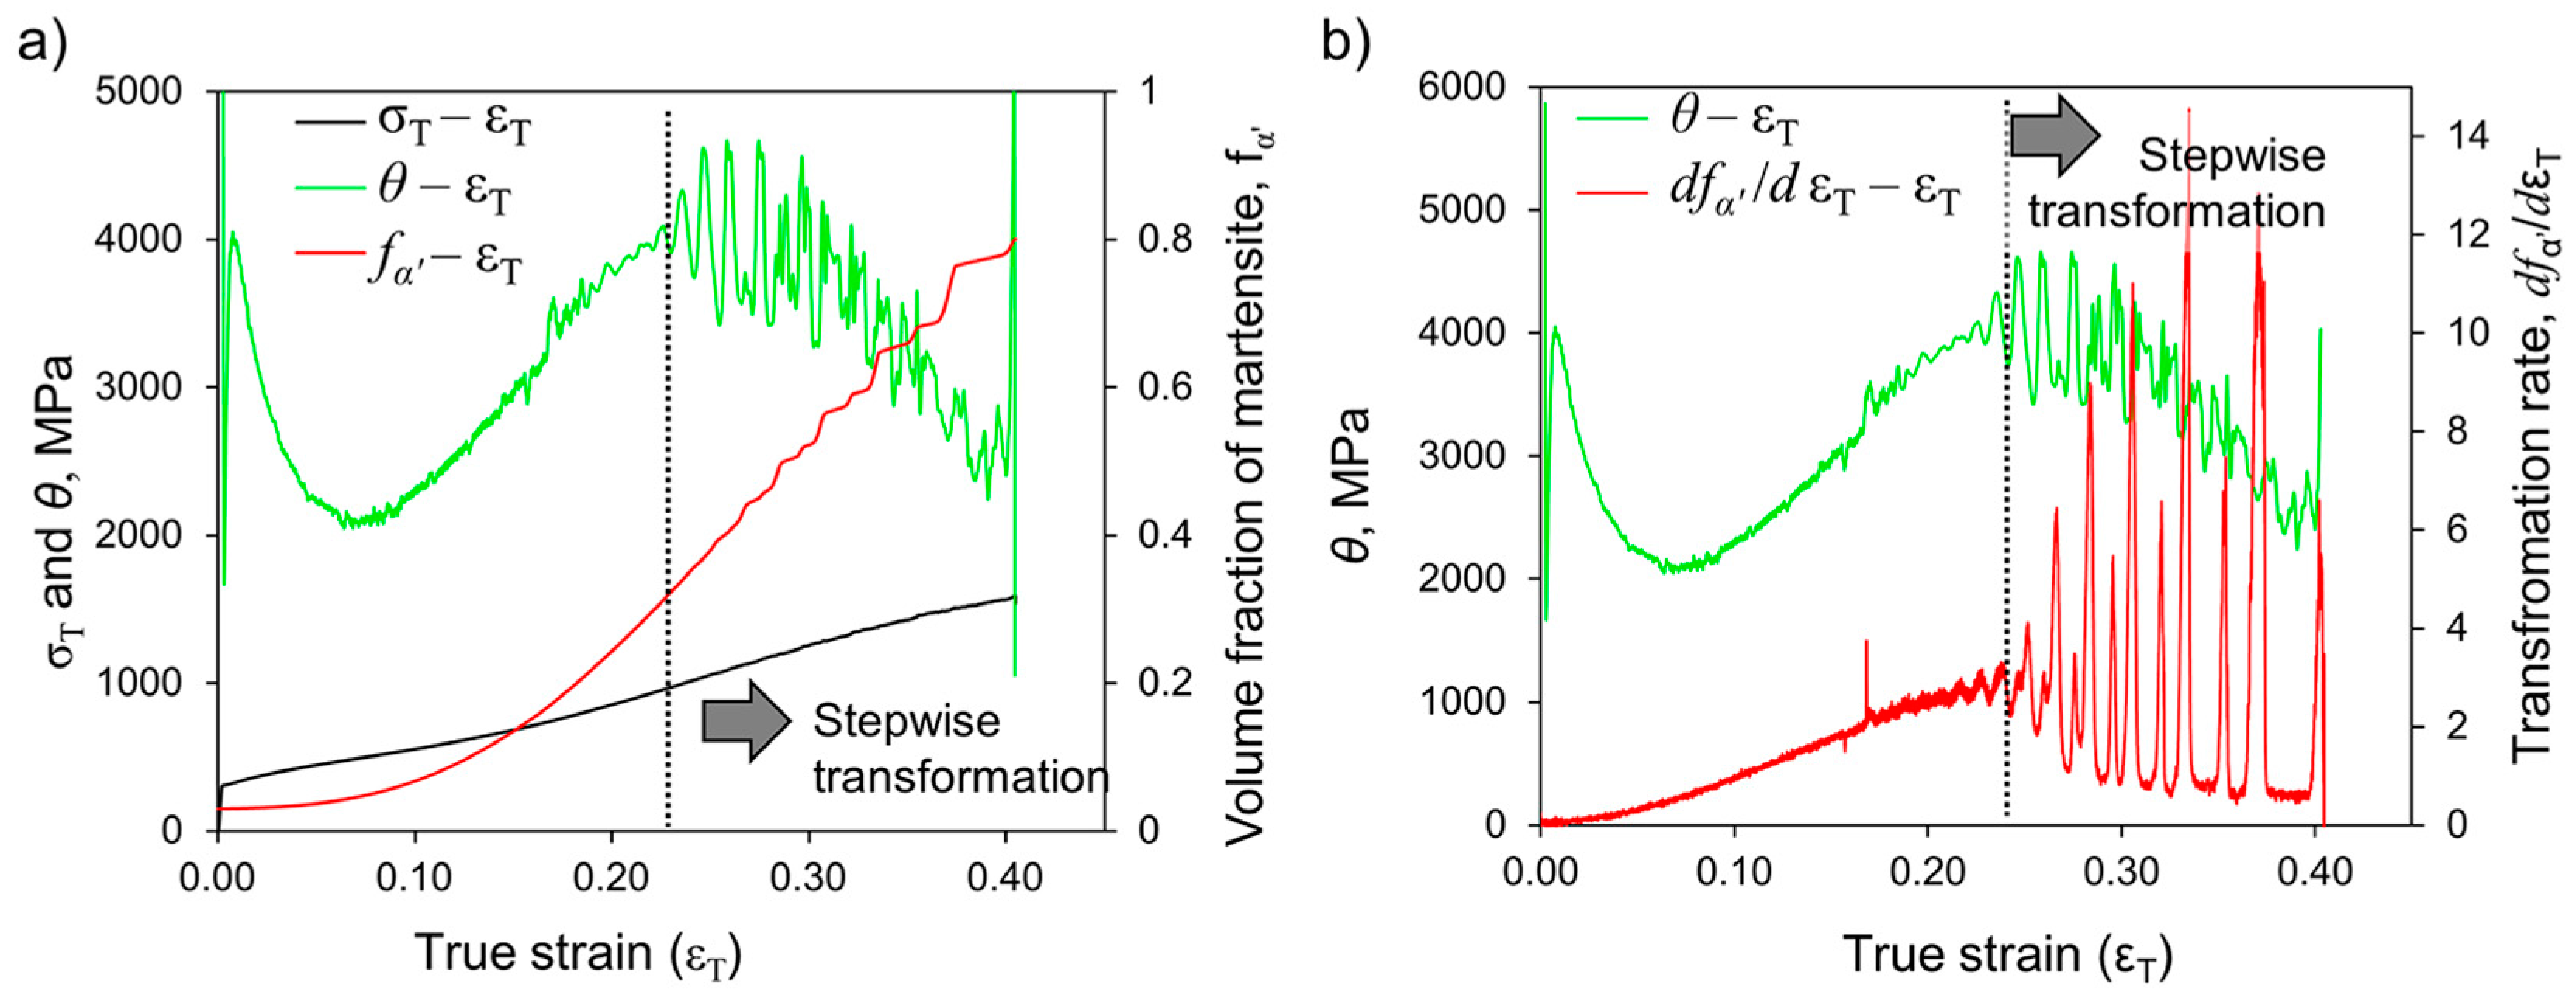
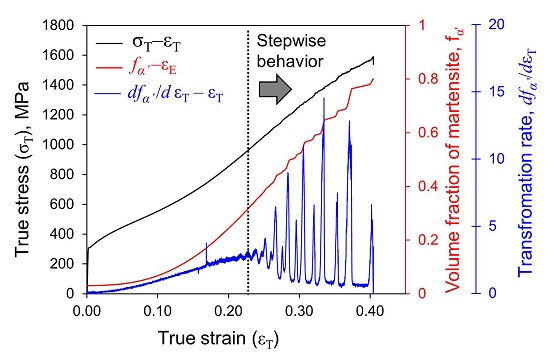
4.2. The Strain-Induced Martensitic Transformation and Stepwise Behavior

It is generally observed that the formation of ε-martensite during straining is favored at low temperatures and enhances the nucleation of α′-martensite [4,10]. The volume fraction of ε-martensite usually reaches a saturation of 0.02–0.05 at applied strains of 0.05–0.20, depending on the austenite grain size, and with larger strains the fraction decreases [7,9]. This suggests that it is a transient phase that represents a potential increase of nucleation sites for α′ and, lowering the barrier for the nucleation of α′. Tian and co-workers have recently hypothesized that the transformation occurs via the sequence γ → stacking faults → ε → α′ in MASSs with low SFE. Band-like structures resulting from faulted areas in the austenite act as precursors for ε-martensite. Although these observations correspond to the transformation during incremental cooling, the sequence could also be applied to the strain-induced transformation [11]. Other authors, on the other hand, conclude that ε-martensite and α′-martensite form independently during straining [14,16]. From the XRD results presented in Figure 2, it is observed that a small amount of ε-martensite forms along with α′-martensite during straining. Its presence is detected even in those conditions strained to 0.40–0.45, which could be interpreted as the ε-martensite not acting as precursor of α′-martensite in this case. Otherwise, a decrease in its volume fraction should be observed. This observation agrees well with Hedström and co-authors’ work [16], who found by HEXRD during in-situ tensile testing in an AISI 301 grade that the formation of ε- and α′-martensite phases are not coupled. Instead, the volume fraction of ε-martensite reaches a saturation level and remains quite stable afterwards. Similarly, in the present work, both phases appear to form simultaneously with straining.
From the microstructural characterization presented in Figure 3, it is observed that the α′-martensite phase forms first at parallel slip bands constrained in the same austenite grain. Then, as the strain increases, more slip systems are activated and shear bands appear when homogeneous dislocation slip is inhibited or when an insufficient number of crystallographic slip systems is available in narrow deformation zones (order of microns), while the rest of the matrix undergoes comparably low and homogeneous plastic flow [18]. The number of intersections increases with further strain and both the nucleation and coalescence of α′-embryos along and across shear bands lead to a rise of the volume fraction of α′-martensite, as previously found [7]. This explains the overall transformation kinetics observed in Figure 9a, but it does not give answer to the step-like behavior pointed out in Figure 9b. Each step is formed due to a burst of α′-martensite within a very small strain increment. Hedström et al. [16] observed a correlation between sudden increases in martensite volume fraction and microstrains in austenite when studying an AISI 301 grade by HEXRD upon tensile loading. They attribute this effect to the autocatalytic martensitic transformation initiated by the growth and coalescence of martensite embryos.
Here, in order to explain the stepwise phenomenon, the relationship between microstructural development, martensite transformation kinetics, and work-hardening is discussed. The following analysis based on Hollomon’s methodology [27] is carried out. Figure 10a presents the true stress ( σ T ), and the instantaneous work-hardening rate ( θ = d ( σ T ) / d ( ε T ) ) as a function of ε T in the primary y-axis, and the fraction of strain-induced martensite ( f α ) as a function of ε T in the secondary y-axis. Figure 10b overlaps the evolution of θ with the martensite transformation rate ( d f α / d ε T ) as a function of ε T . It is observed that a volume fraction of about f α 0.32 has been formed when the stepwise behavior begins. Talonen et al. [28] explains this behavior in terms of the percolation theory. They found that a continuous network of α′-martensite forms above a f α 0.32 , which was termed the percolation threshold. This theory is strongly supported by the microstructural evolution observations showed in Figure 3. It is easy to visualize that the formation of slip bands, martensite laths, and shear bands lead to a segmentation of the untransformed austenite phase into smaller and smaller volumes. At the same time, the flow stress of the austenite increases gradually due to work-hardening. The combination of these two effects: (1) austenite volume refinement and (2) flow stress increase, increases the elastic energy needed for the deformation of the matrix and the surface energy required to create a new interface. In turn, the mechanical driving force for the transformation increases. It can be thus deduced that the resulting microstructure consists of a continuous network of α′-martensite with dispersed untransformed islands of austenite, similar to the configuration first described by Talonen [28]. As Figure 10b depicts, this threshold approximately corresponds to the highest transformation rate, and afterwards, the rate continuously decreases while experiencing pulses of very high intensity. Once the percolation threshold is reached, the load cannot be fully accommodated by the austenite and it is transferred to the α′-martensite. Due to a non-homogenous plastic deformation, the accumulation of stresses is enhanced within the untransformed austenite islands, which triggers the autocatalytic (or stress-induced) martensitic transformation in this volume [1,3]. The occurrence of these bursts in a gradual manner might be related to the crystallographic orientation of the austenite grains with respect to the applied stress, which influences the stress at which the transformation starts. After each burst of sudden martensite formation there is a plateau where almost no transformation occurs. This might be due to the exothermic nature of the martensitic transformation. After each burst, the local temperature of the sample increases, which has two effects: (1) the decrease of the chemical driving force for the transformation ( G γ α ) [11], and (2) the increase of the SFE [4]. Both effects hinder the transformation, which might explain the plateaus. The variation of the transformation rate in pulses causes localized hardening, which redistributes the load to another part of the sample. As a result, the occurrence of necking is pushed to higher strain levels and a high hardening effect is provided. This might be the reason why the uniform and total elongations are found at very similar values.

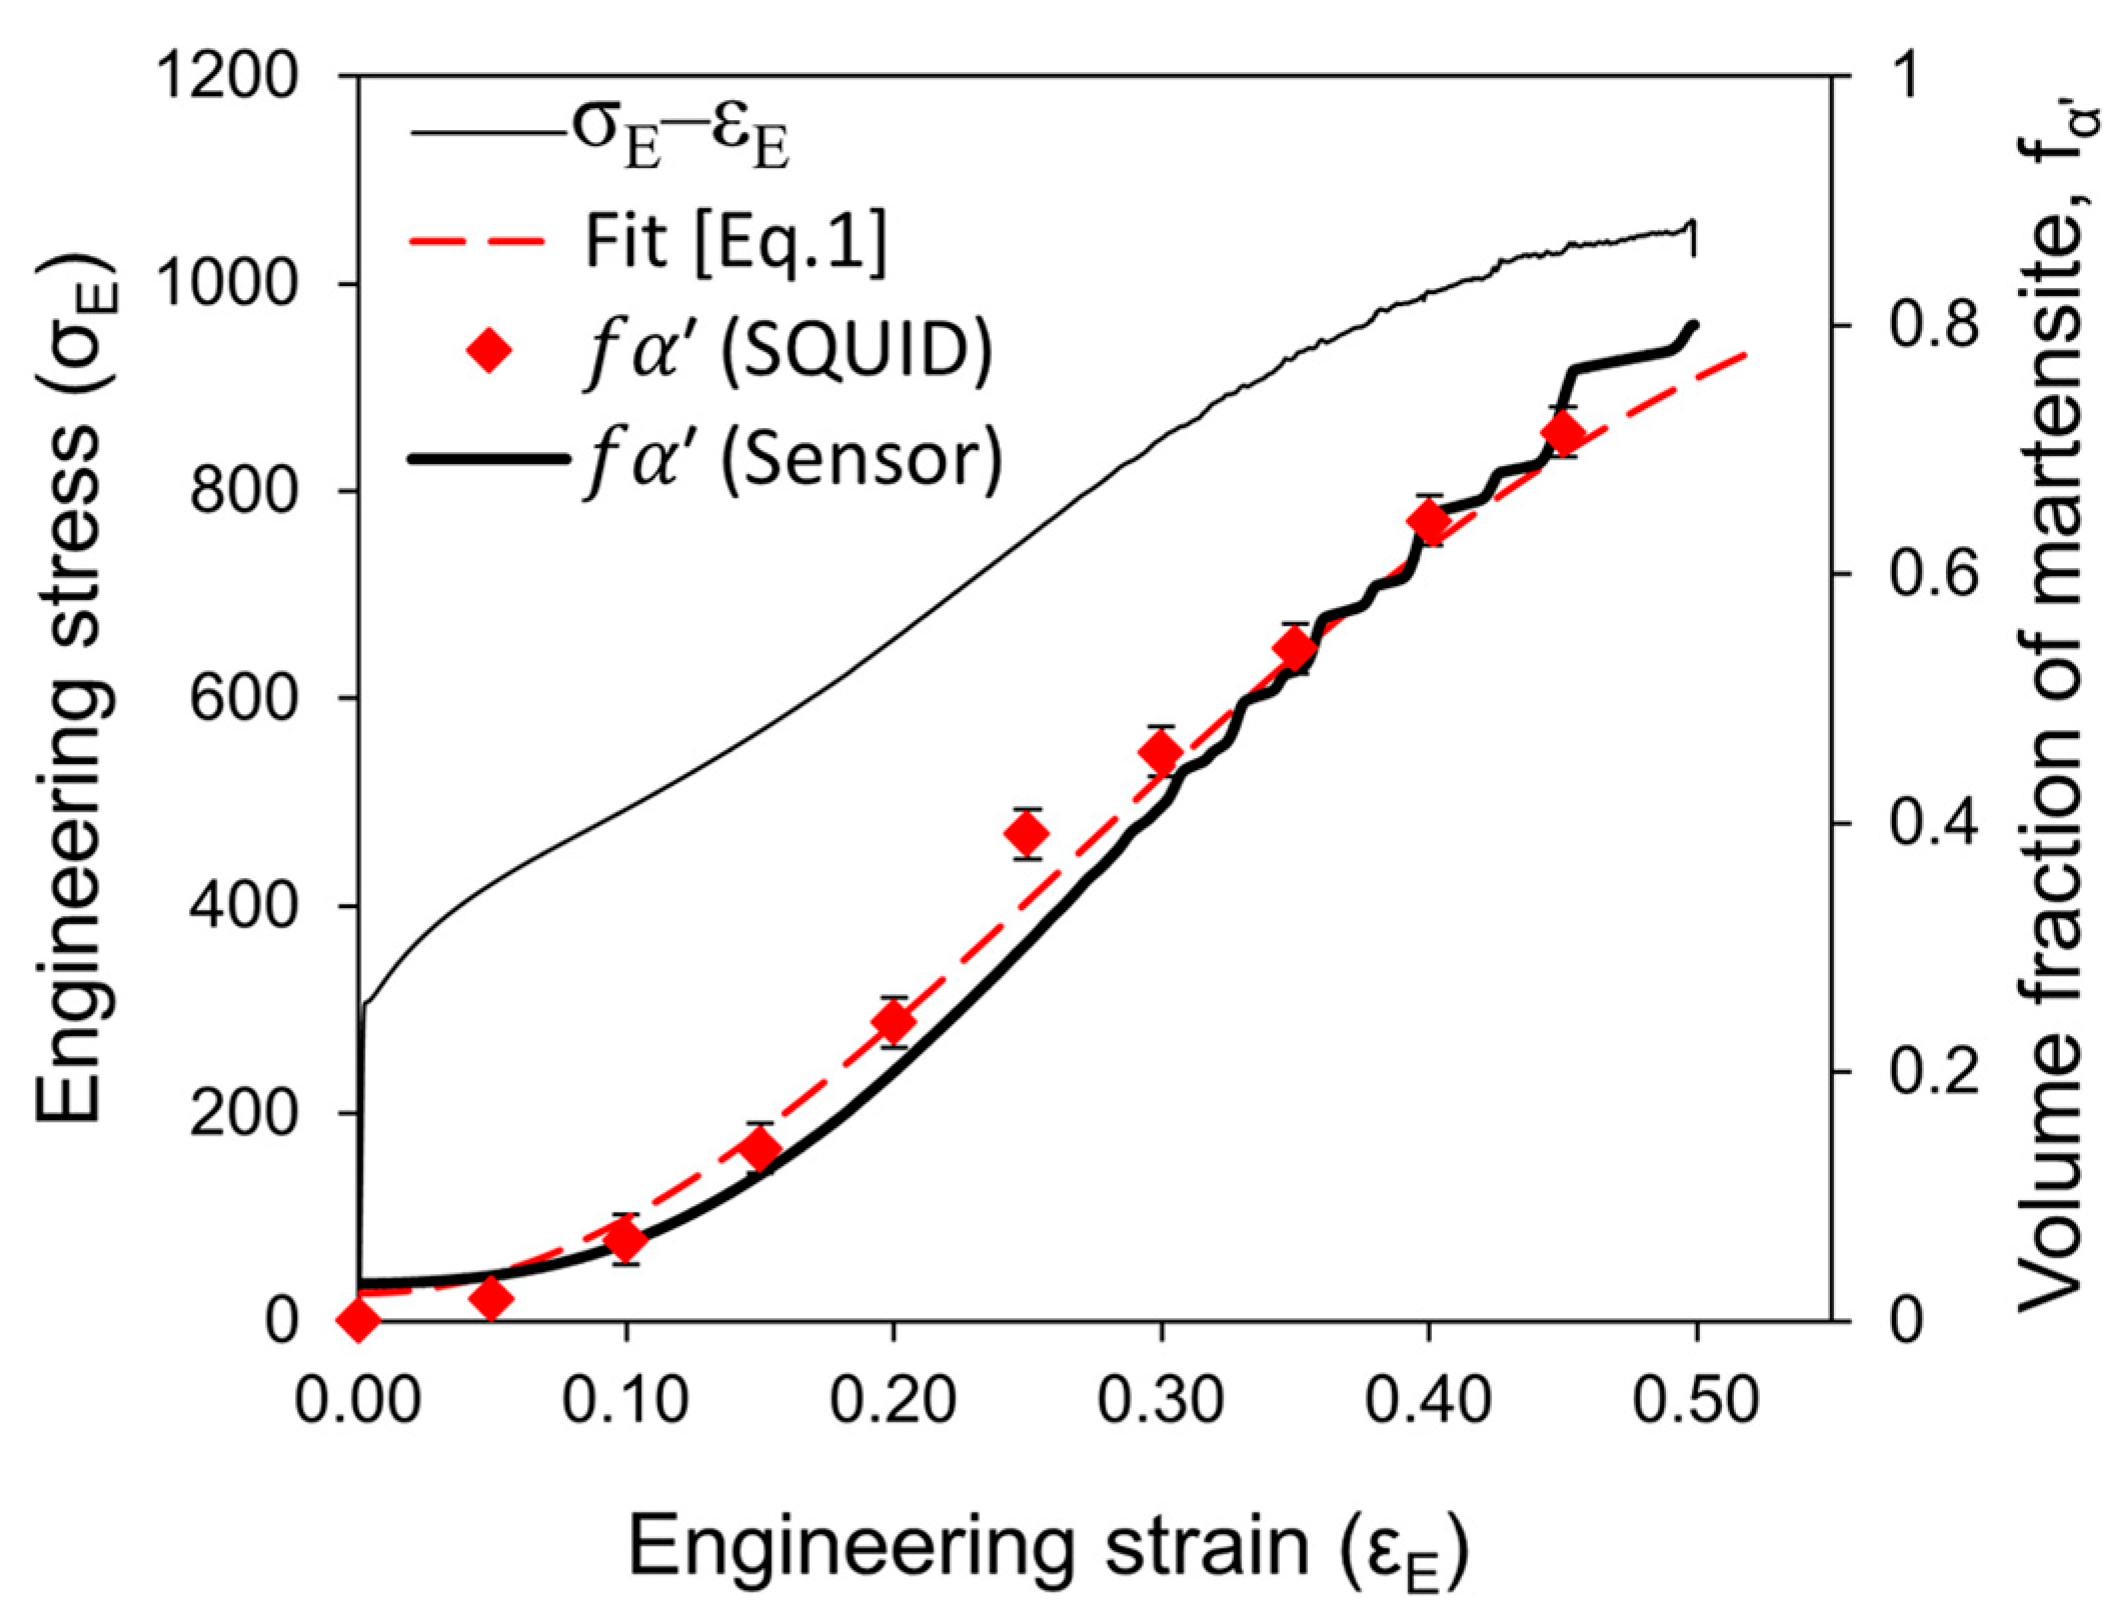
4.3. Validation of the Inductive Sensor as a Technique for In-Situ Characterization of the Strain-Induced Martensitic Transformation

Contrary to other techniques, the sensor is an easy-to-use tool, which does not consume extra measurement-time, need extra sample preparation, or require large facilities. The correlation between the inductive signal and the α′-martensite volume fraction has allowed for the validation of the sensor developed by Philips ATC [29] as an in-situ characterization technique to study the progress of the strain-induced martensitic transformation in MASSs. It is known that the calibration of magnetic devices to quantify volume fractions of martensite can be very complex [6,15,30]. The influence of some effects on the α′-martensite permeability makes the post-processing of the output signal necessary in order to make it representative of the volume fraction of martensite present in the material. In this work, both the effect of temperature and applied stress were minimized by lowering the current circulating through the coil to 55 mA, as shown in Figure 6a. A current of 55 mA ensures a magnetic field of 0.6 T, which is sufficiently high to generate a magnetization response representative of the martensite volume fraction in the material but sufficiently low to not influence the martensitic transformation during the time that the monotonic tensile tests take, which is approximately 9 min [23]. Besides, this current does not warm up the sample. Although the stress effect is significantly reduced, it is still present in the signal and becomes larger and larger as the volume fraction of α′-martensite increases above 0.45 ( ε E t h > 0.31 ). The same effect is observed for larger current values (Figure 6a,b). Therefore, the correction of the stress effect is needed regardless the current circulating through the coil; however, as it has been mentioned previously, an optimum value of 55 mA does not heat up the sample and thus does not influence the driving force for the martensitic transformation.

5. Conclusions

The inductive sensor developed by Philips ATC has been proven to be a user-friendly, cheap, and fast tool for characterizing the formation of α′-martensite in metastable austenitic stainless steels during tensile testing. The calibration of the sensor has been facilitated by setting the current circulating through the coil to 55 mA, which ensures a magnetic field of 0.6 T. This magnetic field is sufficiently high to magnetize the sample, but avoids any influence on the transformation kinetics, either by heating-up of the sample or by accelerating the formation of martensite.
The formation of strain-induced α′-martensite has been studied at room temperature in an AISI 301 grade. In-situ inductive measurements performed with the sensor were compared to the ex-situ characterization done on interrupted-tensile tested specimens by means of light optical microscopy, X-ray diffraction and magnetization measurements. The metallographic quantification of the α′-martensite volume fraction leads to an overestimation; whereas XRD and SQUID magnetization measurements are in good agreement. It seems that SQUID magnetization measurements lead to a more sensitive detection of the α′-martensite volume fraction and match well with the response obtained with the inductive sensor. A correlation between the sensor output signal and the volume fraction of α′-martensite was found, which will be used in future experiments.
The in-situ study has revealed that the α′-martensite transformation occurs in steps once the percolation threshold is reached. At this point the microstructure consists of a continuous network of α′-martensite and islands of untransformed austenite. The phenomena occurring during the martensitic transformation during deformation, i.e., formation of slip bands, shear bands, and martensite laths, produces the segmentation of austenite grains in smaller and smaller volumes. This effect, along with the increase in austenite flow stress due to work-hardening, results in an increase of the mechanical driving force for the transforming. As a consequence, the stresses accumulate in the austenite, which transforms rapidly as a consequence of the autocatalytic nature of the transformation. This rapid growth involves the coalescence of α′-martensite blocks in the continuous network, which causes bursts of martensitic transformation.

Acknowledgments

Carola Celada-Casero acknowledges the financial support from Consejo Superior de Investigaciones Científicas (CSIC) in the form of a JAE-Predoc grant (JAEPre_2011_01167), co-funded by the European Social Fund. The authors deeply acknowledge the financial support from Research Fund for Coal for funding this research under the Contract RFCS-02-2015 (Grant Agreement No.: RFSR-CT-2012-00021) and the Spanish Ministerio de Economia y Competitividad (MINECO) through the form of a Coordinate Project (MAT2016-80875-C3-1-R). Authors are also grateful to Jose Antonio Jimenez (CENIM-CSIC), Julio Romero de Paz (CAI of Physical Techniques, UCM) and Marijke de Vries and Ronald van der Linden (Philips ATC) for the experimental support.

Author Contributions

Carola Celada-Casero performed the experiments, analyzed the results and wrote the paper; Harm Kooiker and Manso Groen provided the material, the facilities and the tools for the analysis and data interpretation; Jan Post conceived and designed the experiments for the sensor calibration; David San-Martin interpreted the data, discussed the results and reviewed the paper.

Conflicts of Interest

The authors declare no conflict of interest.

References

  1. Olson, G.B.; Cohen, M. A mechanism for the strain-induced nucleation of martensitic transformations. J. Less Common Met. 1972, 28, 107–118. [Google Scholar] [CrossRef]
  2. Celada-Casero, C.; Huang, B.M.; Aranda, M.M.; Yang, J.R.; San Martin, D. Mechanisms of ultrafine-grained austenite formation under different isochronal conditions in a cold-rolled metastable stainless steel. Mater. Charact. 2016, 118, 129–141. [Google Scholar] [CrossRef]
  3. Perdahcıoğlu, E.S.; Geijselaers, H.J.M.; Groen, M. Influence of plastic strain on deformation-induced martensitic transformations. Scr. Mater. 2008, 58, 947–950. [Google Scholar] [CrossRef]
  4. Talonen, J.; Hänninen, H. Formation of shear bands and strain-induced martensite during plastic deformation of metastable austenitic stainless steels. Acta Mater. 2007, 55, 6108–6118. [Google Scholar] [CrossRef]
  5. Celada-Casero, C.; Chao, J.; Urones-Garrote, E.; San Martin, D. Continuous hardening during isothermal aging at 723 k (450 °C) of a precipitation hardening stainless steel. Metall. Mater. Trans. A 2016, 47, 5280–5287. [Google Scholar] [CrossRef]
  6. Perdahcıoğlu, E.S.; Geijselaers, H.J.M.; Huétink, J. Influence of stress state and strain path on deformation induced martensitic transformations. Mater. Sci. Eng. A 2008, 481–482, 727–731. [Google Scholar]
  7. Kisko, A.; Misra, R.D.K.; Talonen, J.; Karjalainen, L.P. The influence of grain size on the strain-induced martensite formation in tensile straining of an austenitic 15cr-9mn-ni-cu stainless steel. Mater. Sci. Eng. A 2013, 578, 408–416. [Google Scholar] [CrossRef]
  8. Haušild, P.; Davydov, V.; Drahokoupil, J.; Landa, M.; Pilvin, P. Characterization of strain-induced martensitic transformation in a metastable austenitic stainless steel. Mater. Des. 2010, 31, 1821–1827. [Google Scholar] [CrossRef]
  9. Hedström, P.; Lindgren, L.E.; Almer, J.; Lienert, U.; Bernier, J.; Terner, M.; Odén, M. Load partitioning and strain-induced martensite formation during tensile loading of a metastable austenitic stainless steel. Metall. Mater. Trans. A 2009, 40, 1039–1048. [Google Scholar] [CrossRef]
  10. Spencer, K.; Embury, J.D.; Conlon, K.T.; Véron, M.; Bréchet, Y. Strengthening via the formation of strain-induced martensite in stainless steels. Mater. Sci. Eng. A 2004, 387–389, 873–881. [Google Scholar]
  11. Tian, Y.; Lienert, U.; Borgenstam, A.; Fischer, T.; Hedström, P. Martensite formation during incremental cooling of fe-cr-ni alloys: An in-situ bulk X-ray study of the grain-averaged and single-grain behavior. Scr. Mater. 2017, 136, 124–127. [Google Scholar] [CrossRef]
  12. Murr, L.E.; Staudhammer, K.P.; Hecker, S.S. Effects of strain state and strain rate on deformation-induced transformation in 304 stainless steel: Part II Microstructural study. Metall. Trans. A 1982, 13, 627–635. [Google Scholar] [CrossRef]
  13. Talonen, J.; Hänninen, H.; Nenonen, P.; Pape, G. Effect of strain rate on the strain-induced γ → α′-martensite transformation and mechanical properties of austenitic stainless steels. Metall. Mater. Trans. A 2005, 36, 421–432. [Google Scholar] [CrossRef]
  14. Lichtenfeld, J.A.; Van Tyne, C.J.; Mataya, M.C. Effect of strain rate on stress-strain behavior of alloy 309 and 304l austenitic stainless steel. Metall. Mater. Trans. A 2006, 37, 147–161. [Google Scholar] [CrossRef]
  15. Post, J.; Nolles, H.; Datta, K.; Geijselaers, H.J.M. Experimental determination of the constitutive behaviour of a metastable austenitic stainless steel. Mater. Sci. Eng. A 2008, 498, 179–190. [Google Scholar] [CrossRef]
  16. Hedström, P.; Lienert, U.; Almer, J.; Odén, M. Stepwise transformation behavior of the strain-induced martensitic transformation in a metastable stainless steel. Scr. Mater. 2007, 56, 213–216. [Google Scholar] [CrossRef]
  17. Celada Casero, C.; San Martín, D. Austenite formation in a cold-rolled semi-austenitic stainless steel. Metall. Mater. Trans. A 2014, 45, 1767–1777. [Google Scholar] [CrossRef]
  18. Jia, N.; Eisenlohr, P.; Roters, F.; Raabe, D.; Zhao, X. Orientation dependence of shear banding in face-centered-cubic single crystals. Acta Mater. 2012, 60, 3415–3434. [Google Scholar] [CrossRef]
  19. Olson, G.B.; Cohen, M. Kinetics of strain-induced martensitic nucleation. Metall. Trans. A 1975, 6, 791–795. [Google Scholar] [CrossRef]
  20. Shin, H.C.; Ha, T.K.; Chang, Y.W. Kinetics of deformation induced martensitic transformation in a 304 stainless steel. Scr. Mater. 2001, 45, 823–829. [Google Scholar] [CrossRef]
  21. Post, J.; Huetink, J.; Geijselaers, H.J.M.; Voncken, R.M.J. Fem simulations of a multi stage forming process on sandvik maraging steel 1rk91 describing the stress assisted and the strain induced martensite formation. J. Phys. IV 2003, 112, 417–420. [Google Scholar] [CrossRef]
  22. Zhao, L.; van Dijk, N.H.; Brück, E.; Sietsma, J.; van der Zwaag, S. Magnetic and X-ray diffraction measurements for the determination of retained austenite in trip steels. Mater. Sci. Eng. A 2001, 313, 145–152. [Google Scholar] [CrossRef]
  23. San Martín, D.; Aarts, K.W.P.; Rivera-Díaz-del-Castillo, P.E.J.; van Dijk, N.H.; Brück, E.; van der Zwaag, S. Isothermal martensitic transformation in a 12cr-9ni-4mo-2cu stainless steel in applied magnetic fields. J. Mag. Mag. Mater. 2008, 320, 1722–1728. [Google Scholar] [CrossRef]
  24. Mumtaz, K.; Takahashi, S.; Echigoya, J.; Kamada, Y.; Zhang, L.F.; Kikuchi, H.; Ara, K.; Sato, M. Magnetic measurements of martensitic transformation in austenitic stainless steel after room temperature rolling. J. Mater. Sci. 2004, 39, 85–97. [Google Scholar] [CrossRef]
  25. De Abreu, H.F.G.; da Silva, M.J.G.; Herculano, L.F.G.; Bhadeshia, H. Texture analysis of deformation induced martensite in an aisi 301l stainless steel: Microtexture and macrotexture aspects. Mater. Res. 2009, 12, 291–297. [Google Scholar] [CrossRef]
  26. Patel, J.R.; Cohen, M. Criterion for the action of applied stress in the martensitic transformation. Acta Metall. 1953, 1, 531–538. [Google Scholar] [CrossRef]
  27. Hollomon, J.H. Tensile deformation. Trans. Metall. Soc. AIME 1945, 162, 268–290. [Google Scholar]
  28. Talonen, J. Effect of Strain-Induced α′-Martensite Transformation on Mechanical Properties of Metastable Austenitic Stainless Steels; Helsinki University of Technology: Helsinki, Finland, 2007. [Google Scholar]
  29. Post, J. On the Constitutive Behaviour of Sandvik Nanoflex TM—Modelling Experiments and Multi-Stage Forming; University of Twente: Enschede, The Netherlands, 2004. [Google Scholar]
  30. Radu, M.; Valy, J.; Gourgues, A.F.; Strat, F.L.; Pineau, A. Continuous magnetic method for quantitative monitoring of martensitic transformation in steels containing metastable austenite. Scr. Mater. 2005, 52, 525–530. [Google Scholar] [CrossRef]
Figure 1. Tensile test setup with inductive sensor.
Metals 07 00271 g001
Figure 2. X-ray diffractograms for the initial microstructure (IM) and interrupted tensile-tested specimens at strains ( ε E ) of 0.10, 0.20, 0.30, 0.40, and fracture ( ε E = 0.52). Diamond dots indicate the presence of peaks associated to ε-martensite phase.
Metals 07 00271 g002
Figure 3. Light-optical micrographs of tensile-tested specimens interrupted at strains ( ε E ) of 0.10, 0.20, 0.30, and 0.40 after etching with Beraha’s reagent for 10 s. The martensite phase is revealed in black and blue, whereas the austenite phase remains unetched.
Metals 07 00271 g003
Figure 4. (a) Black-and-white image obtained from the light-optical micrograph of the condition strained up to ε E = 0.10 after applying a grey scale threshold value λ t h = 127; (b) Histogram of the same micrograph showing the number of pixels vs. the grey scale intensity value.
Metals 07 00271 g004
Figure 5. Evolution of martensite volume fraction ( f α ) with strain ( ε E ) obtained ex-situ from interrupted tensile tests determined by LOM, magnetization measurements (SQUID), and XRD. The dashed line represents the saturation value of transformed martensite ( f s = 0.92) found by XRD for a sample strained to fracture.
Metals 07 00271 g005
Figure 6. (a) Evolution of inductive signals with engineering strain ( ε E ) obtained during the course of cyclic load/unload tests by using currents of 125, 75, and 55 mA. (b) Load–unload σ E ε E curve and inductive signal obtained with a current of 55 mA. (c) Magnification of (b) for the range ε E = 0.40–0.52. V σ 0 and V σ stand for voltage signal at zero stress and under stress, respectively. (d) Evolution of both the voltage signal in the loaded ( V σ ) and the unloaded ( V σ 0 ) states recorded during the load-unload cyclic measurements.
Metals 07 00271 g006
Figure 7. Relationship between the signal output (voltage) and the martensite content estimated using SQUID magnetization measurements.
Metals 07 00271 g007
Figure 8. Engineering stress–strain ( σ E ε E ) curve and evolution of the α′-martensite volume fraction ( f α ) with ε E obtained by ex-situ magnetization measurements (SQUID), in-situ inductive measurements (sensor) and as predicted by the kinetics model.
Metals 07 00271 g008
Figure 9. (a) True stress–strain ( σ T ε T ) curve and evolution of f α with ε T obtained in-situ by using the sensor. (b) Magnification of the region marked with a square in (a) pointing out the effect of the transformation bursts on the strengthening of the material.
Metals 07 00271 g009
Figure 10. (a) Evolution of true stress ( σ T ), instantaneous work-hardening rate (θ) and f α with true strain ( ε T ). (b) Evolution of θ and martensite formation rate ( d f α / d ε T ) with ε T . The dotted line highlights the origin of the stepwise transformation.
Metals 07 00271 g010
Table 1. Chemical composition of AISI 301 grade (in wt %) with balanced Fe.
CCrNiSiMnMo
Max 0.1516–186.5–9<1.5<2<0.8

