Transition of the Interface between Iron and Carbide Precipitate From Coherent to Semi-Coherent

1
Advanced Technology Research Laboratories, Nippon Steel & Sumitomo Metal Corporation, 1-8 Fuso-Cho, Amagasaki, Hyogo 660-0891, Japan
2
Nippon Steel & Sumikin Technology Co. Ltd., 20-1 Shintomi, Futtsu, Chiba 293-0011, Japan
3
The Institute of Solid State Physics, The University of Tokyo, 5-1-5 Kashiwanoha, Kashiwa, Chiba 277-8581, Japan
*
Author to whom correspondence should be addressed.
Metals 2017, 7(7), 277; https://doi.org/10.3390/met7070277
Submission received: 5 May 2017
/
Revised: 10 July 2017
/
Accepted: 14 July 2017
/
Published: 19 July 2017
(This article belongs to the Special Issue First-Principles Approaches to Metals, Alloys, and Metallic Compounds)
Abstract
:There are some precipitates that undergo transition from a coherent to semi-coherent state during growth. An example of such a precipitate in steel is carbide with a NaCl-type structure, such as TiC and NbC. The interface energy between carbide precipitate and iron is obtained via large-scale first-principles electronic structure calculation. The strain energy is estimated by structure optimization of the iron matrix with virtual carbide precipitate using the empirical potential. The transition of the interface from a coherent to semi-coherent state was examined by comparing the interface and strain energies between the coherent and semi-coherent interfaces. The sizes where both the precipitates undergo this transition are smaller than those of the interfaces with minimum misfit. The estimated transition diameter of TiC is in agreement with the experimentally obtained value.
1. Introduction
Strengthening of steel is mainly performed through four mechanisms [1]. Increasing the strength of steels by using a solid solution of alloying elements and impurity elements is known as solid solution strengthening. Another strengthening mechanism is dislocation strengthening. In this mechanism, the yield strength is proportional to the square root of the dislocation density. Grain refinement is another effective strengthening mechanism. In this process, yield strength is inversely proportional to the square root of grain size. Precipitates are obstacles to dislocation movement, resulting in strengthening of steel, known as precipitation strengthening. Among these four mechanisms, the most effective mechanism is precipitation strengthening. The effect of precipitation strengthening is expected to be 3000 MPa for the Orowan mechanism, when the volume fraction and diameter of precipitates are assumed to be 10% and 10 nm, respectively. The strengthening effect of this process is much larger than those of the other three mechanisms. Precipitates in steel contribute to not only strengthening but also reduction of grain size, because grain growth is inhibited by pinning of grain boundaries during thermal treatment [2]. This is an important technique to inhibit softening of the heat-affected zone during welding [3]. Other important roles of precipitates include improvements of hole expandability [4] and the hydrogen trap to prohibit the hydrogen embrittlement [5,6].
Precipitates usually have lattice constants that are dissimilar to those of the matrix, i.e., iron. Elastic strain energy due to precipitates is proportional to the cube of the radius of the precipitate. Therefore, the growth of precipitates substantially increases the elastic strain energy. Dislocations due to the semi-coherent interface between precipitate and matrix can reduce the strain around the precipitate. In steel, some precipitates are nucleated with a coherent interface between the precipitate and iron. Such a coherent precipitate naturally transforms to a semi-coherent precipitate during growth, when the coherent precipitate has higher interface and strain energies than the semi-coherent precipitate [7]. One such precipitate has a NaCl-type structure, such as TiC, NbC, and VC. These precipitates are considered to play important roles in the strength and structure of steel. Semi-coherent precipitates can provide a very different performance in comparison to coherent precipitates, for example, in terms of strength and hydrogen trap. This is because it is assumed that the behavior of dislocations and hydrogen varies according to the strain field around the precipitate. In other words, the performance of steel can be improved by appropriate usage of coherent and semi-coherent precipitates. Therefore, it is important to know the size at which the coherent precipitate transforms to a semi-coherent precipitate. These carbides with nanometer size can be densely distributed in steels. An interface relationship of {001}//{001} and <100>//<110> is reported as a Baker–Nutting orientation relationship for carbide precipitates with an NaCl-type structure [8]. One such precipitate, TiC, is considered to exist as a coherent precipitate up to a size of 3 nm [9], and the precipitate transforms to a semi-coherent precipitate due to growth.
The precipitate TiC has a plate-like shape with the abovementioned interface relationship between the precipitate and the iron matrix. In other words, the precipitate grows mainly in the broad plane, namely, the (100) plane of the precipitate. The lateral plane of the precipitate is expected to be semi-coherent at the early stage of precipitation and have higher interface energy than the broad plane. Therefore, the growth of the lateral plane is not dominant. In this study, we focused on the dominant growth plane of the precipitate, namely the broad plane. The growth of the lateral plane and the anisotropy of the growth will be the subject of our future work.
Many first-principles calculations have been performed for the interfaces between body-centered cubic (bcc) iron and carbide or nitride precipitates with an NaCl-type structure [10,11,12,13,14,15,16,17,18,19,20], and the bonding nature between these interfaces has been discussed in the literature. Hartford investigated the chemical bond across the interface and interface energies for the coherent interface between VN and bcc iron [10]. VN in bcc iron was observed as a plate-like precipitate with a diameter between 10 and 20 nm. The treatment as a coherent precipitate is quite reasonable because the lattice misfit between bcc iron and VN is less than 2%. The bond between iron and VN was clarified to be a strong bond and a weak bond. Lee et al. investigated the bond strength between iron and a precipitate by separating the interface between bcc iron and TiC [11]. Arya et al. performed similar calculations in order to apply steel to more reactive and corrosive environments by TiC-coating the iron surface [12]. All of their investigations concluded that the bond between Fe and C atoms strongly depends on the short-range interaction due to the bond. In contrast, the bond among Fe atoms is stronger than that between Fe and C atoms in terms of long-range interaction because of the difference between the metallic bond among Fe atoms and the covalent bonds between Fe and C atoms.
The coherent interface energies between iron and a precipitate were estimated by Hartford [10] and Jung et al. [13,14,15,16]. Johansson et al. developed a method for determining the interface energy using a few points of surface [18,19,20]. They showed that the strain energy should be relieved by forming a semi-coherent precipitate for thicker precipitates, since the elastic energy caused by the coherent strain increases with the thickness of the precipitate. In their approach, the interface energy was estimated using the extended Peierls–Nabarro framework, in which the chemical interaction energy by the first-principles calculation is combined with the elastic energy by the continuum description. They explained that the elastic contribution dominates the interface energy. By calculating the interface energies of many , , and transition metal carbides and nitrides, it was revealed that the interface energies decrease with increase in the number of electrons of the outer-most d orbital [19]. This phenomenon was interpreted as the stronger chemical bond between the Fe atom and transition metal atom in carbides or nitrides for the transition metal atom with more d electrons.
The computational technique by Fors et al. obtains the semi-coherent interface energy efficiently by using the surface energy and elastic strain energy using the Peierls–Nabarro framework. However, there is an ambiguity in the accuracy of the energy value because the atomic configuration around the misfit dislocation is not reproduced accurately. Furthermore, it is not easy for their technique to accurately obtain the segregation properties of impurity near the interface. Previously, we tried to obtain the interface energy of semi-coherent interfaces between NbC and bcc iron via large-scale direct first-principles calculation at the semi-coherent interface [21]. We estimated the transition size of NbC from coherent to semi-coherent precipitate based on the interface and strain energies obtained via the large-scale first-principles calculation and the classical molecular dynamics simulation, respectively. However, the dependence of the precipitate on the size at which the coherent to semi-coherent interface transition occurs has not been clarified to date. Therefore, herein, we applied a method to estimate the transition size of TiC and compared it with the previous results of NbC as well as the interface and strain energies, the electronic structure, and the atomic configuration.
2. Results and Discussion
2.1. Interface Energy
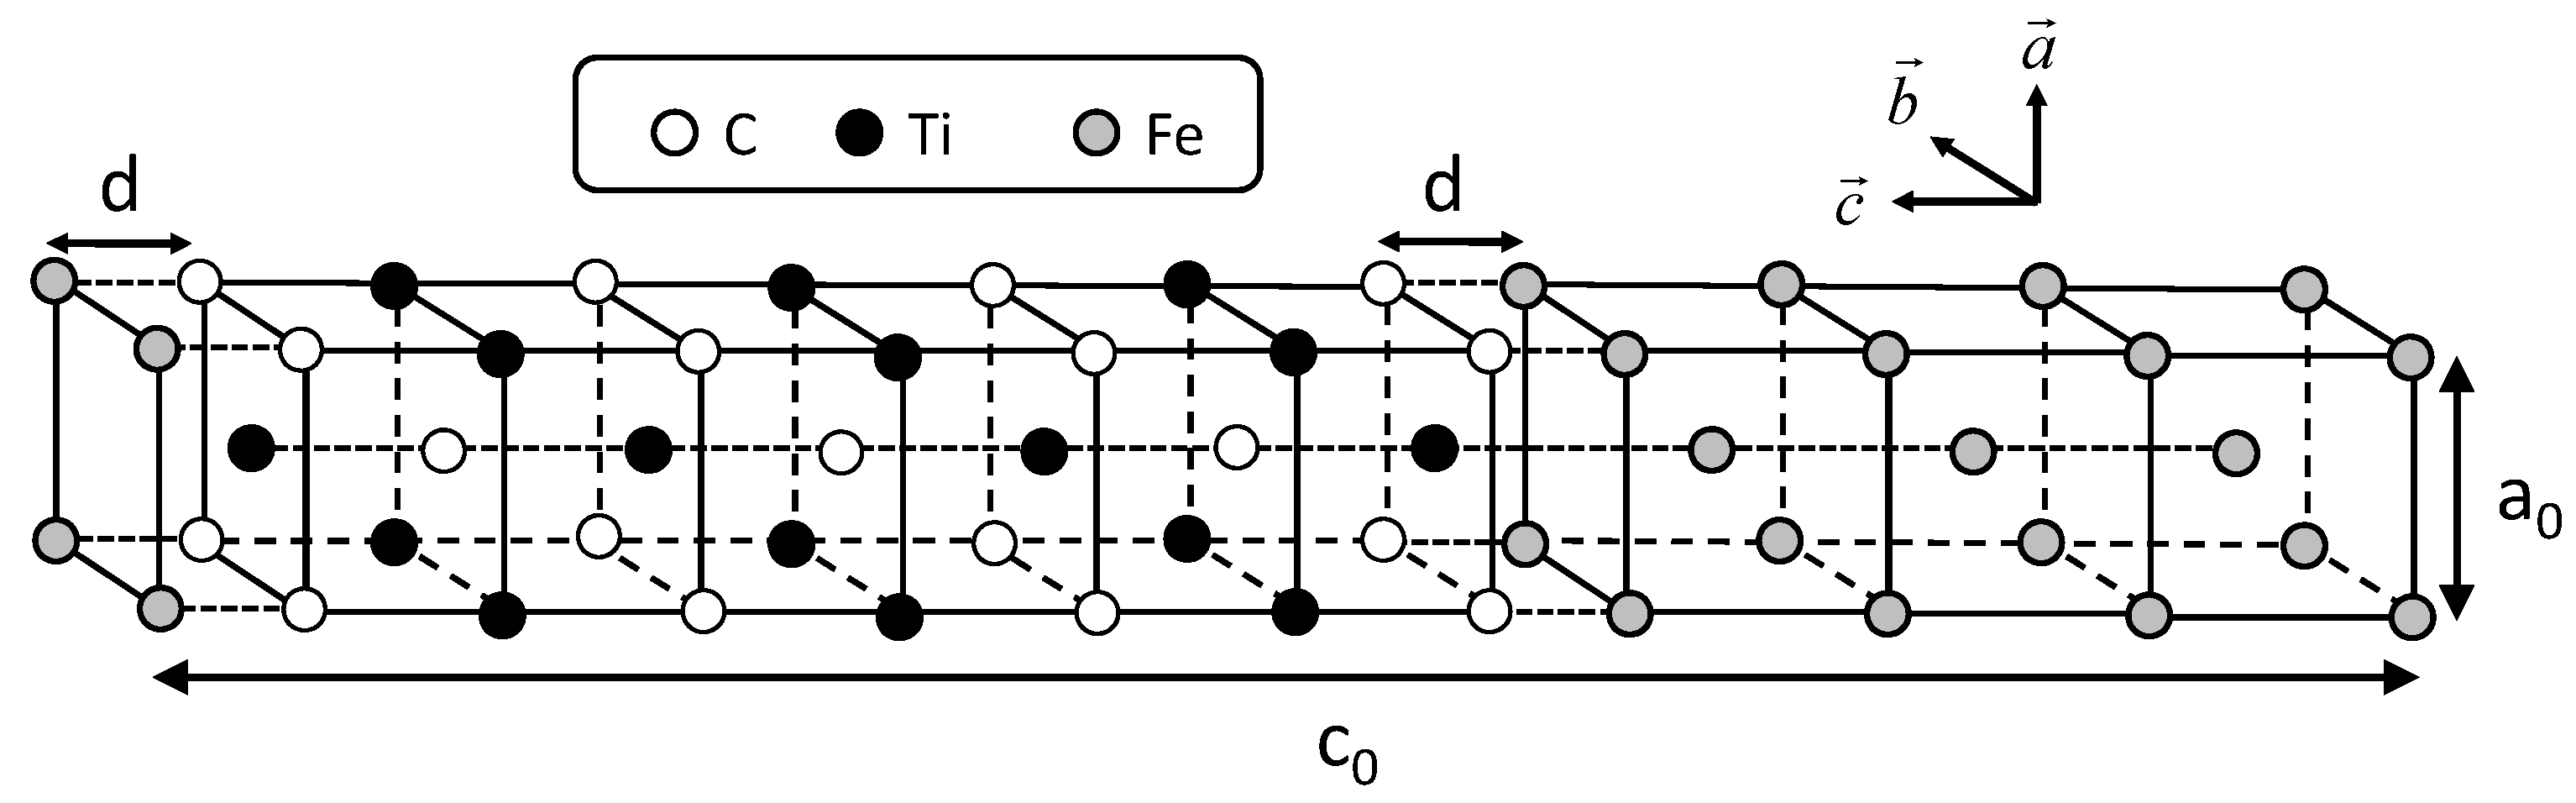
The conditions of calculating coherent interface energy, which include the shape of the unit cell shown in Figure 1, are followed according to the previous study [21]. Two cases of coherent interfaces are examined, as performed in the previous study. In these cases, the C atom is directly connected with the Fe atom across the interface and the Ti atom is connected with the Fe atom. The cases are hereafter referred to as the interfaces of Fe–C–Ti and Fe–Ti–C, respectively. The interface energies are calculated by subtracting the sum of the total energies of all the individual phases from the total energy of the system including the interface. The lattice parameter of the reference state of iron is chosen as follows in order to eliminate the contribution of strain energy in the estimation of the interface energy. The lattice parameter is optimized to minimize the total energy with the value fixed to the length of a unit cell of TiC. This procedure is conducted for both the coherent and semi-coherent interfaces. The lattice parameter of iron for a coherent interface is , while that for semi-coherent interface is . In Figure 2, the calculated interface energies are shown with the previously obtained interface energies between the NbC and bcc iron. In the previous study, two coherent interfaces were treated. One is an interface where a C atom is connected with an Fe atom across the Fe–NbC interface; the other is one where a Nb atom is connected with an Fe atom across the Fe–NbC interface. These two interfaces are referred as Fe–C–Nb and Fe–Nb–C, respectively, in this paper. The horizontal and vertical axes denote the interface distance d and interface energy, respectively. The interface distance is defined as the optimized length of of by subtracting the optimized lengths of of Fe and TiC with of TiC as follows:
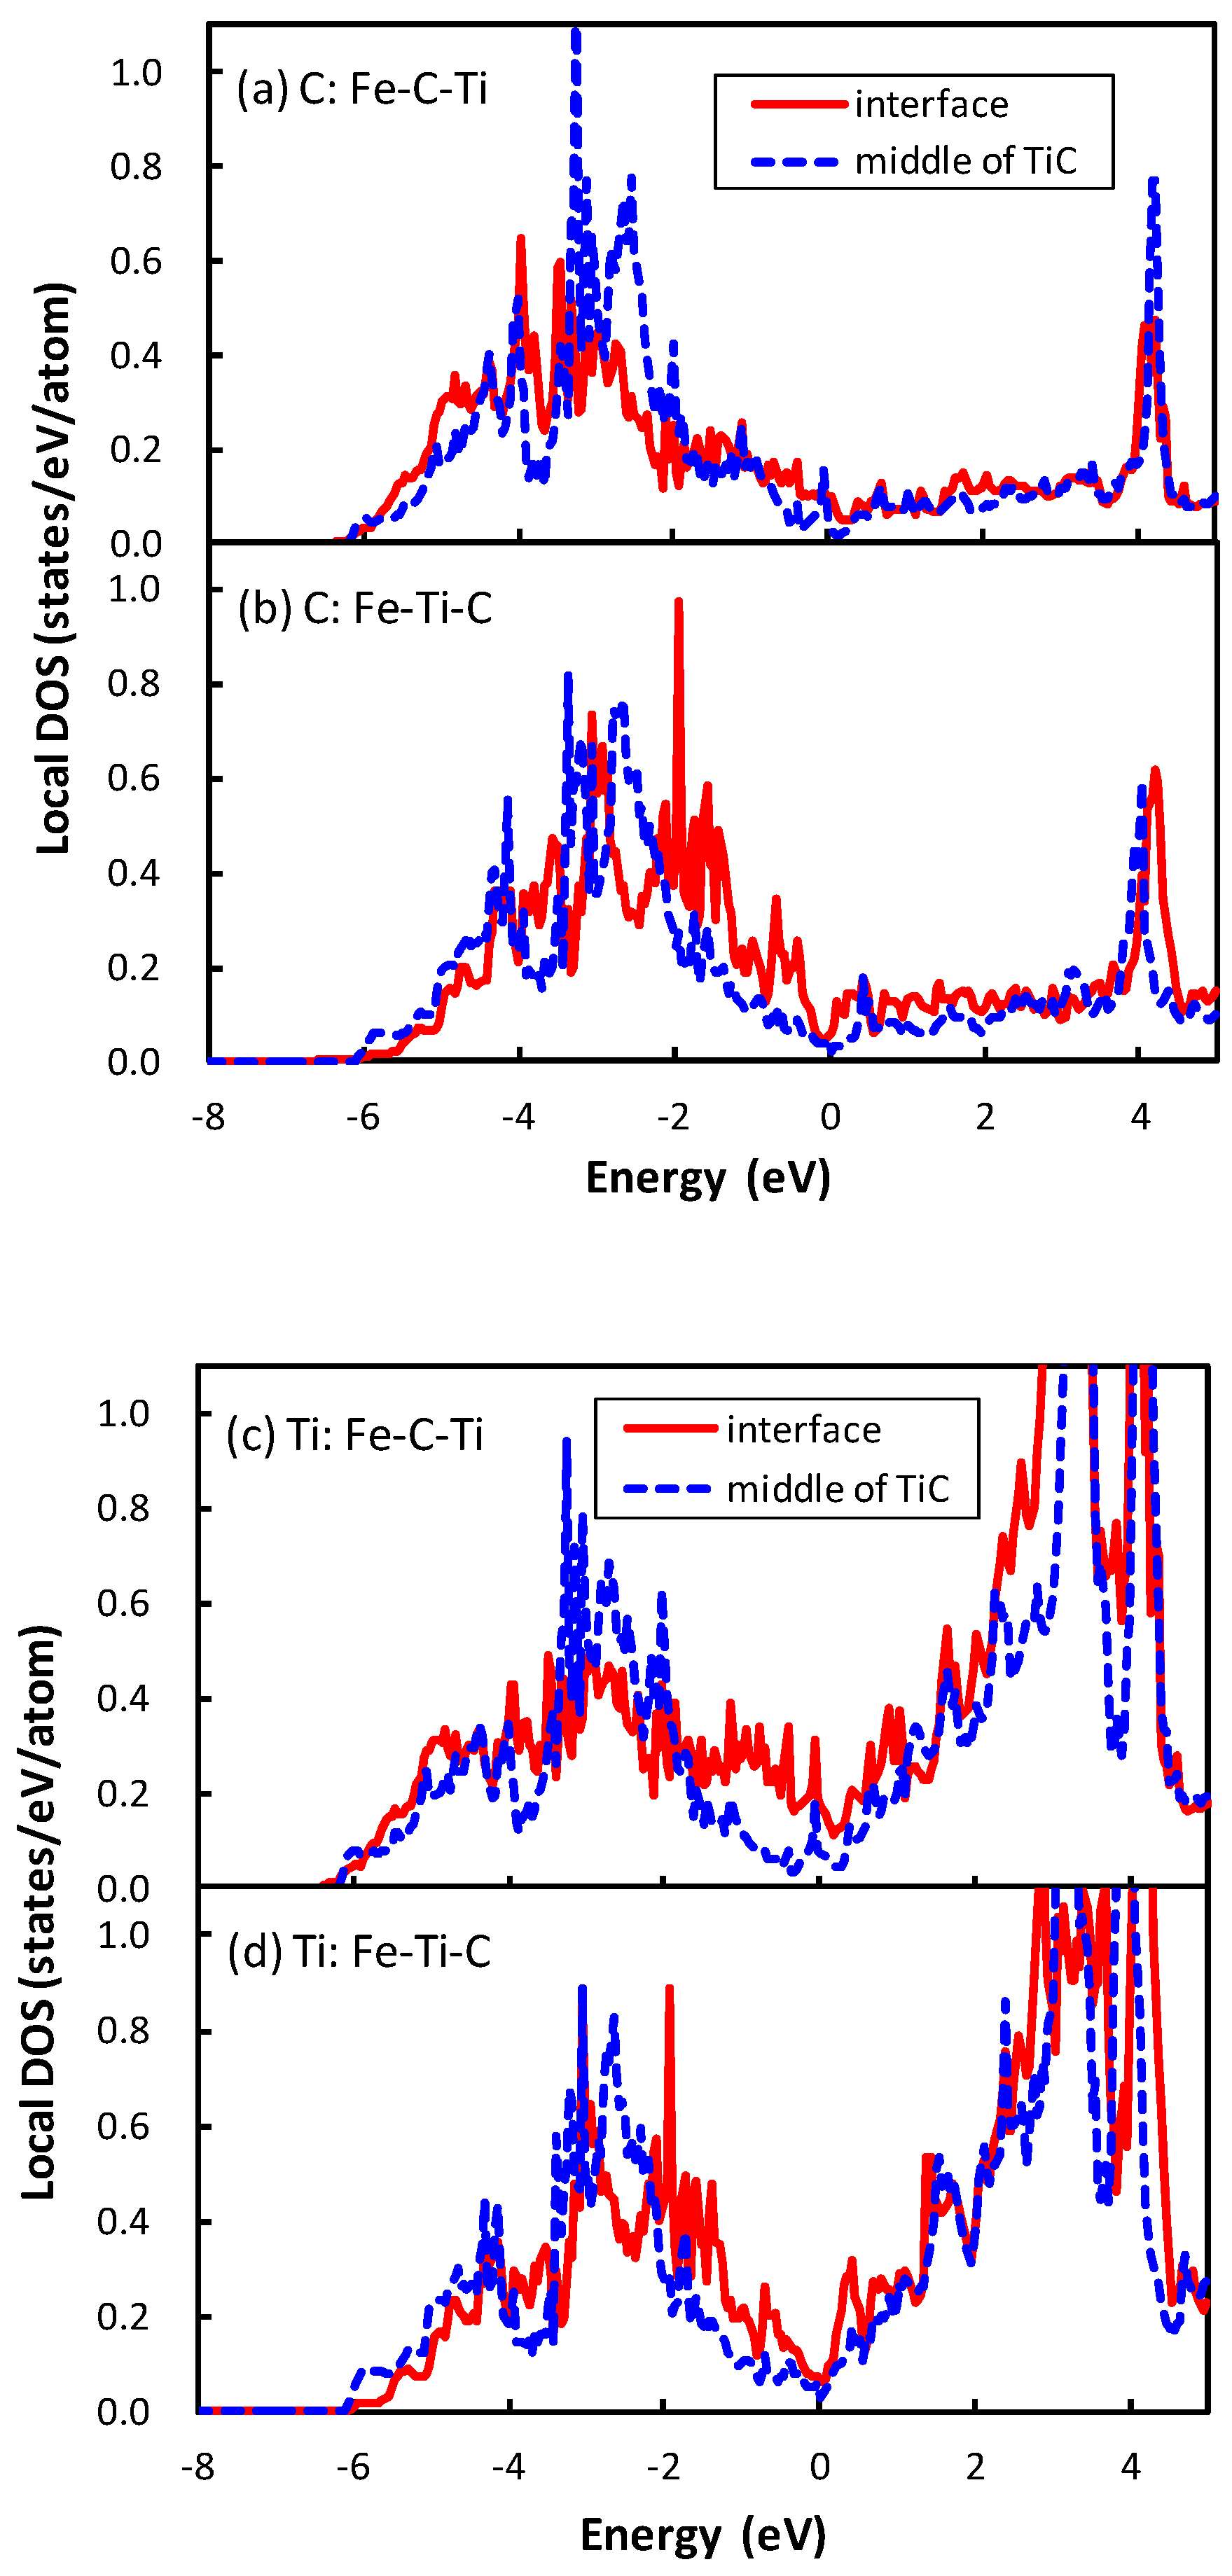
The division operation in this expression is performed because of the inclusion of two interfaces in the unit cell. The interface of Fe–C–Ti is more stable than that of Fe–Ti–C. The same applies for the interface between NbC and bcc iron, which is explained as the energy of the atom at the interface of Fe–C–Nb is lower than that of Fe–Nb–C in the previous study [21]. The local density of states (DOSs) of the C atom of the interface between TiC and bcc iron are plotted in Figure 3. The phenomenon that occurs in the interface between TiC and bcc iron is similar to that between the NbC and bcc iron. The local DOS of the C atom at the interface is shifted to a higher energy relative to that at the middle of the TiC region in the interface of Fe–Ti–C, while the energy region of local DOS of the C atom at the interface is close to that at the middle of the TiC region in the interface of Fe–C–Ti. The mechanism of the energy shift of the local DOS of the C atom at the interface of Fe–Ti–C can be related to the number of surrounding atoms of the C atom. In TiC with an NaCl-type structure, the C atom is surrounded by six Ti atoms. However, the C atom at the interface of Fe–Ti–C has only five surrounding atoms, i.e., the C atom has a dangling bond that destabilizes the C atom. Conversely, the C atom at the interface has six surrounding atoms at the interface of Fe–C–Ti. The local DOS of the Ti atom at the interface of Fe–Ti–C also shows the energy shift in Figure 3d, but the shift is more clearly seen in the DOS of the C atom. Thus, the electronic effect for the interface bonding is dominated by the electrons around C rather than Ti. The states of the C atom in TiC are mainly located from to 0 eV in Figure 3a,b, while those in NbC are from to eV, as shown in the previous paper [21]. In other words, the energy band of TiC is wider than that of NbC. This is due to the difference of lattice constants between TiC and NbC. The smaller lattice constant of TiC gives a wider energy band of the C atom in comparison with NbC. This spread electron of C atom in TiC reduces the difference of the local DOS of the C atom between the interfaces of Fe–C–Ti and Fe–Ti–C compared to that between the interfaces of Fe–C–Nb and Fe–Nb–C, because the energy shift originates from the local covalent bond character of the C atom at the interface.
The minimum of interface energy of Fe–Nb–C is much lower than that of Fe–Ti–C. In the transition metal carbide the transition metal d states hybridize with the states of carbon, and the bonding and anti-bonding states are separated distinctly (Figure 3). For the interfaces of Fe–Ti–C and Fe–Nb–C, the bond across the interface is attributed to the metallic bond between the transition metal d states and Fe d states. In such a case, the increase in filling of the transition metal d states increases the strength of the interface bond [19]. Basically, Nb has one more electron than Ti in the outer-most d orbital. Furthermore, the number of electrons in the Nb atom at the interface increases compared with that at the middle of the NbC region by approximately 0.1 due to the electron donation from the Fe atom, while the number of electrons of Ti at the interface is almost the same as that at the middle of the TiC region. The deeper electronic states of Nb in comparison to Ti cause this phenomenon. Therefore, the interface bond of Fe–Nb–C should be stronger than that of Fe–Ti–C, and the interface of Fe–Nb–C has lower interface energy than that of Fe–Ti–C. In contrast, the minimum of interface energy of Fe–C–Ti does not differ from that of Fe–C–Nb. The bond across the interface should be derived from the strong covalent bond between the Fe and C atoms for both interfaces. Therefore, there is no large deviation in the interface energy between Fe–C–Nb and Fe–C–Ti. In addition, as shown in Figure 2, the interface separation in the interface of Fe–C–Ti is shorter than that of Fe–Ti–C, and the interface separation in the interface of Fe–C–Nb is shorter than that of Fe–Nb–C. The shorter interface separation of Fe–C–Ti in comparison with that of Fe–Ti–C originates from the strong covalent bond between the Fe and C atoms across the interface of Fe–C–Ti.
In general, m units of bcc iron face n units of TiC at the interface. The interface with the same m and n is coherent, while that with different m and n is semi-coherent. In many cases, m and n cannot be expressed by a ratio of integers, i.e., an incoherent interface. As aforementioned, precipitate nanometer sizes of TiC in iron have a flat interface represented by the Baker–Nutting orientation relationship and reveal the semi-coherent interface [9]. It is possible to find the minimum of misfit by searching m and n with lattice constant of iron and that of TiC . is of the conventional lattice constant.
For the interface between bcc iron and TiC, and afford a minimum misfit . Large-scale first-principles calculations are performed for m:n = 15:14, 14:13, 13:12, 12:11, 11:10. The interface energies calculated for and are shown in Figure 2.
The interface distance of the semi-coherent interface is defined as the same analogy of Equation (1). The interface distance of the semi-coherent interface between the TiC and bcc iron is close to that of the coherent interface of Fe–C–Ti. In contrast, the interface distance of the semi-coherent interface between the NbC and bcc iron is closer to that of the coherent interface of Fe–Nb–C. This discrepancy occurs for two reasons. First, the interface distance of the coherent interface between NbC and bcc iron is underestimated compared with that between the TiC and bcc iron, because the lattice parameter of the iron is expanded along a axis to the lattice parameter of transition metal carbides. In other words, the unit cell length of for the coherent interface between the NbC and bcc iron is longer than that between the TiC and bcc iron by 5%. The second cause of the discrepancy comes from a difference in the lattice constant between TiC and NbC. The difference of lattice constants between the TiC and bcc iron is 7.2%, while that between NbC and bcc iron is 12.6%. This large difference of the lattice constants between the TiC and NbC leads to the difference of distance between the misfit dislocations of the semi-coherent interface. The coherent interface distance of Fe–C–Ti is much shorter than that of Fe–Ti–C because of the different bonding character between the covalent strong Fe–C bond and the metallic Fe–Ti bond. There are areas where a Fe atom is connected with a Ti atom across the interface near the misfit dislocation, leading to separation of the interface. The distance between the misfit dislocations of the semi-coherent interface between TiC and bcc iron is approximately 1.67 times longer than that between the NbC and bcc iron. Therefore, the expansion effect of interface by the misfit dislocation does not extend to the whole interface region for TiC.
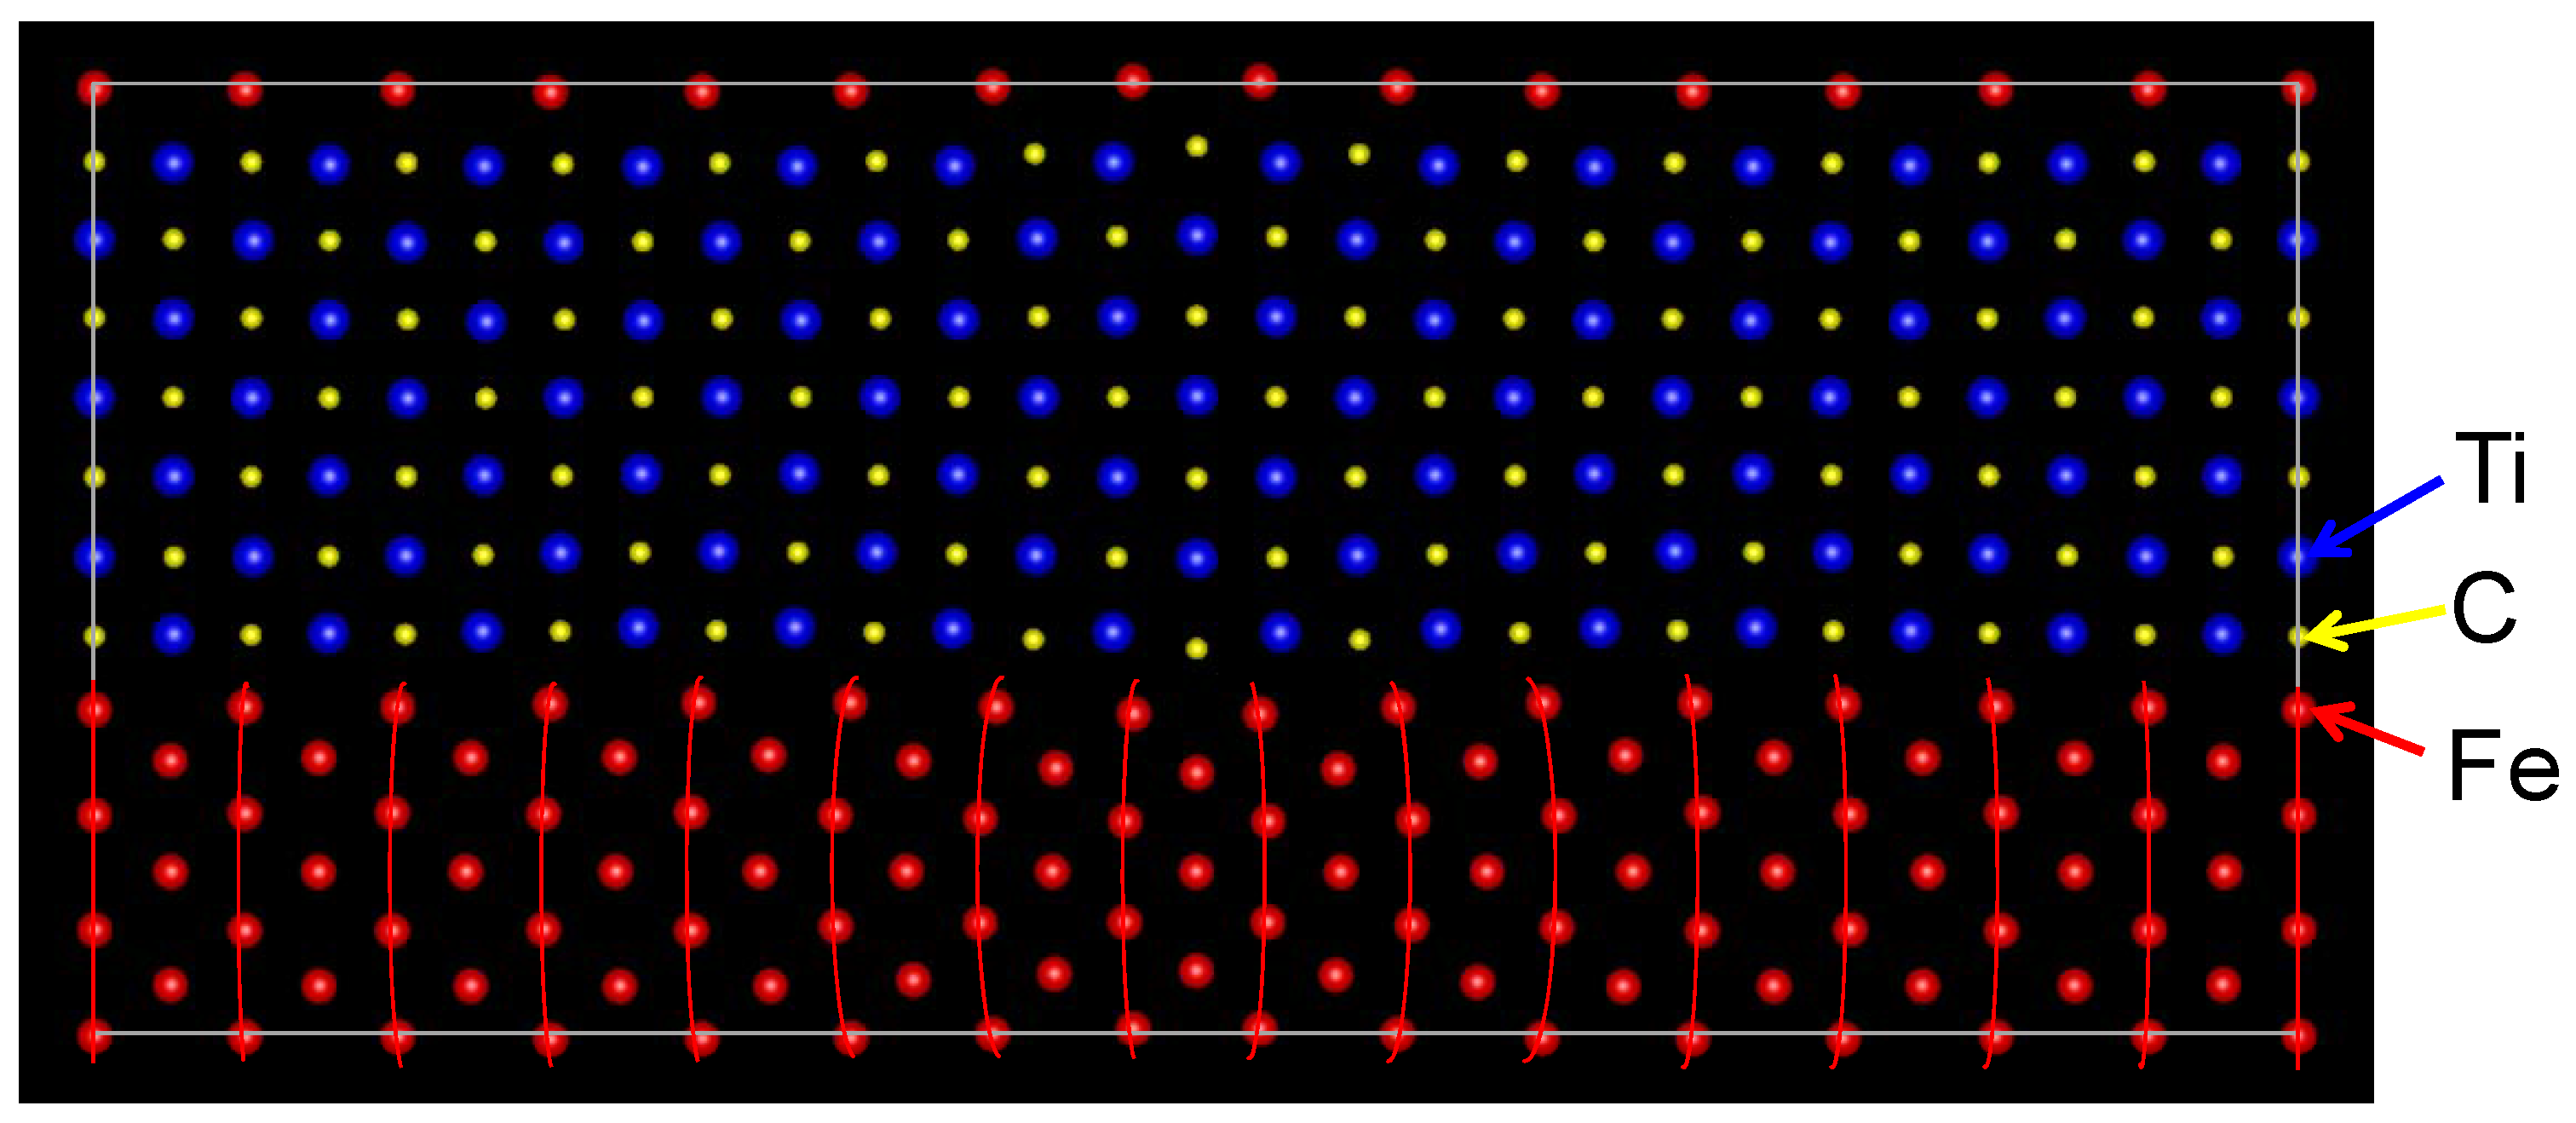
The optimized atomic positions of the semi-coherent interface are shown in Figure 4. The Fe atoms at the interface are connected with the C atoms across the interface except for the Fe atoms near the misfit dislocation, which leads to the bending of lines of Fe atoms. A Fe atom can create a strong covalent bond with a C atom, while the bond between Fe and Ti atoms is weak, as described for the coherent interface. Therefore, the bonding character among Fe, Ti, and C atoms reflects on the atomic transfers around the semi-coherent interface.
The semi-coherent interface can be considered as a mixture of the two coherent interfaces; therefore, the interface energies of the semi-coherent interface are influenced by the interface energies of the coherent interfaces. Since the C atoms at the interface are connected with the Fe atoms at the largest part of the semi-coherent interface, the semi-coherent interface energies are mainly affected by the coherent interface energies of Fe–C–Ti or Fe–C–Nb. Based on this coherent interface energies of Fe–C–Ti or Fe–C–Nb, the coherent interface energies of Fe–Ti–C or Fe–Nb–C affect the semi-coherent interface energies. Then, the semi-coherent interface energy between TiC and bcc iron is slightly larger than that between NbC and bcc iron because the coherent interface energy between TiC and bcc iron is larger than that between NbC and bcc iron. This same tendency was also reported by Fors et al. [19].
2.2. Strain Energy
The structure optimization using the empirical potential is performed to obtain the strain around the precipitate in bcc iron. Figure 5 shows the strain obtained at the center of the broad plane of the precipitate along the perpendicular direction to the broad plane of the precipitate. Coherent and semi-coherent precipitates were assumed in Figure 5a,b, respectively. The coherent and semi-coherent precipitates indicate much different features in the strain around the precipitates. The coherent precipitate has a much larger strain, , than the semi-coherent precipitate. Furthermore, the coherent precipitate gives a positive , i.e., tensile strain, while the semi-coherent precipitate exhibits compressive strain. These features can be elucidated by the atomic transfers due to precipitation. Figure 6 shows the transfers of atoms around the coherent and semi-coherent precipitate by the structure optimization from the ideal position of Fe atoms in bcc iron due to precipitation. For the coherent precipitate, the atoms at the side of the precipitate move toward [100] or [], because the lattice constant of the precipitate is longer than that of bcc iron. Then, the atoms facing the broad plane of the precipitate also move toward [100] or []. Thus, atomic density decreases and the atoms move toward the precipitate near the center of broad plane of the precipitate (Figure 6a). This is the origin of tensile strain for the coherent precipitate. Conversely, atoms at the side of semi-coherent precipitate do not move toward [100] or []. Then, the decrease in atomic density does not occur near the center of the broad plane of the precipitate, and atoms depart from the precipitate along [] due to the expansion of the precipitate along [001]. In this case, three layers of precipitate are assumed. This precipitate region is constructed using four layers of iron expanded 4% along [001]. Thus, the compressive strain is generated in for the semi-coherent precipitate. The strain distribution evaluated from atomic arrangement via high angle annular dark-field scanning transmission electron microscopy also reveals compressive strain at the matrix region near the broad plane of precipitate [22]. Therefore, the theoretically estimated strain around the precipitate is qualitatively in good agreement with the experimental observation. The transfers of atoms along [100] for a coherent precipitate are more prominent than those for a semi-coherent precipitate near the broad interface, which leads to larger for a coherent precipitate than a semi-coherent precipitate.
Strain energy is estimated by comparing the potential energies of the optimized atoms in the matrix region because of the virtual precipitate region to those with the original atom positions of bcc iron. The obtained strain energy is confirmed to be in good agreement with the continuous model. As mentioned above, we focus on the growth of the broad plane of the precipitate. The interface energy is obtained for the area of the broad plane. The obtained strain energy with the same area of the lateral plane is divided by the area of the broad plane and defined as a function of the area of the broad plane in order to compare it with the interface energy. In Figure 7, the interface and strain energies of NbC and TiC are shown as functions of the diameter of the precipitate. The diameter of the plate-like rectangular parallelepiped shaped precipitate is estimated by assuming the precipitates to be spherical. The thicknesses of the precipitates are 0.54 nm and 0.52 nm for NbC and TiC, respectively. The strain energy strongly depends on the size of the precipitate, in contrast to the small precipitate size dependence of interface energies. The strain energies of coherent precipitates increase proportionally to the diameter of the equivalent sphere of the precipitate because larger strain exists around the precipitate for larger precipitates. This linear dependence of the strain energy on the diameter of the precipitate is consistent with the continuum mechanics. Conversely, for semi-coherent precipitates the strain energies decrease with an increase in the size of precipitate in these regions. In Figure 7, the size of precipitates increases from 1.97 nm (n = 10) to 2.51 nm (n = 14) for TiC and from 1.22 nm (n = 5) to 1.73 nm (n = 9) for NbC. The misfits estimated using Equation (2) decrease with increasing size of precipitates in these regions. From this perspective, the misfit and strain energy of semi-coherent interface increases from n = 15 to 21 for TiC. In other words, the strain energy of the semi-coherent interface changes in a saw-like shape. The size dependence of strain energies of NbC is much steeper than that of TiC. This can be attributed to the larger lattice misfit between NbC and bcc iron than that between TiC and bcc iron.
2.3. Transition from the Coherent to the Semi-Coherent State
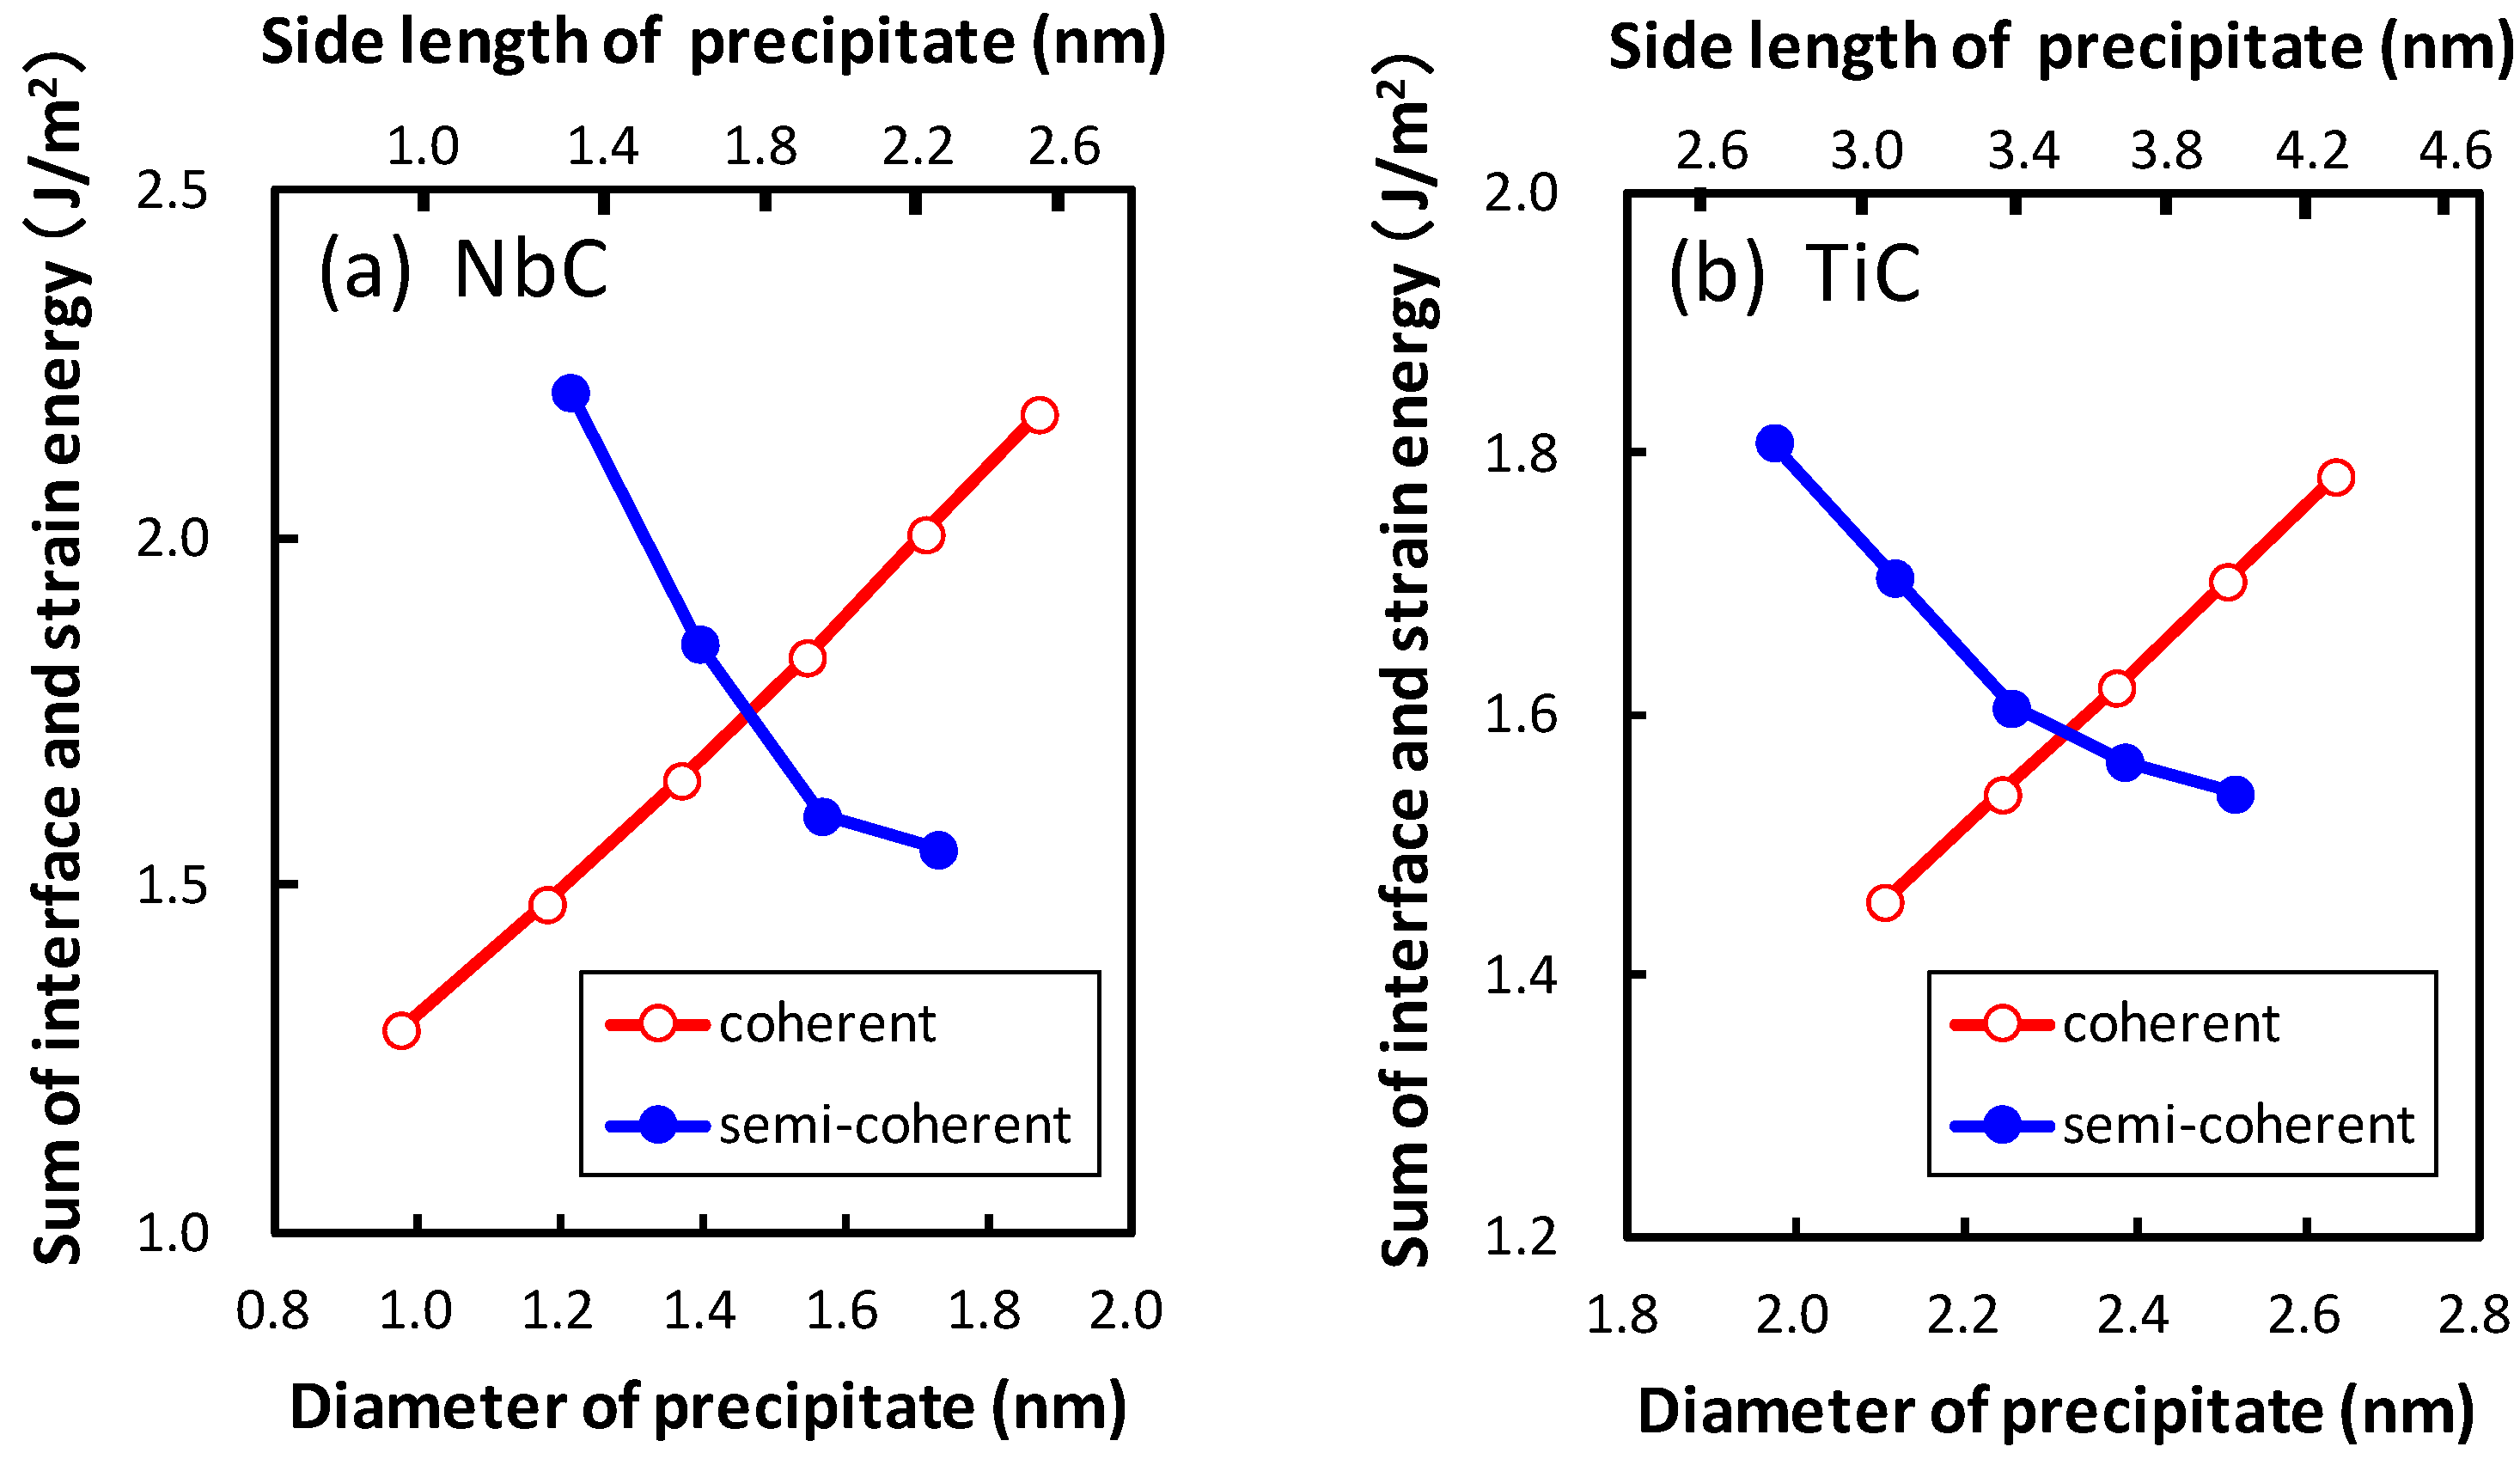
The relation between the summation of the interface and strain energies and the diameter of the precipitate for both the coherent and semi-coherent precipitates is shown in Figure 8. Figure 8 reveals that the coherent precipitates are more stable than the semi-coherent precipitates for smaller size of the precipitates. The opposite size dependence of strain energy between the coherent and semi-coherent precipitates leads to a change from the coherent to the semi-coherent state during the growth of the precipitate at diameters of 1.5 and 2.3 nm for NbC and TiC, respectively. The misfit estimated by Equation (2) has a minimum at diameters of 1.7 and 2.5 nm, respectively. In other words, the sizes where both the precipitates change from coherent to semi-coherent state are smaller than the sizes with minimum misfit in order to release the large strain energies of the coherent precipitates. The transition sizes are examined for thicker precipitates of NbC and TiC with thicknesses of 0.89 and 0.87 nm, respectively. The obtained transition diameters are 1.6 and 2.6 nm for NbC and TiC, respectively.
Wei et al. observed interfacial misfit dislocations on plate-like TiC precipitate via high-resolution transmission electron microscopy [9]. They mentioned that one of the semi-coherent precipitates has a broad plane with a length of 6 nm. The diameter of the semi-coherent precipitate is 3–4 nm, if the thickness of the precipitate is assumed to be 0.52 or 0.87 nm. This size is larger than the estimated transition diameter from the coherent to the semi-coherent state. Therefore, the estimated value is consistent with their experimental result.
Kobayashi et al. evaluated the precipitate size dependence of the interaction force on a dislocation due to the precipitate of TiC from the amount of particle strengthening and the particle spacing [23]. They found that the precipitate size dependence of the interaction force due to the precipitate of TiC changes at a diameter of 2.5 nm. The interaction force increases with increasing size of precipitate below the size, but it becomes constant above the size. They speculated that there are several candidates that cause changes in the size dependence of the interaction force. One of them is the transformation from a coherent precipitate to a semi-coherent one. The theoretically predicted transition size from a coherent to semi-coherent precipitate of TiC is close to the precipitate size where the size dependence of the interaction force changes. If the change in the size dependence of the interaction force is attributed to the change from a coherent precipitate to semi-coherent one, the prediction technique of the change from coherent to semi-coherent precipitate gives a fairly accurate value.
3. Computational Details
The interface and strain energies due to the precipitate in the ferritic matrix should be estimated to know the coherency of the interface between the precipitate and matrix. The previous study revealed that the unit cell comprising seven layers each of Fe and NbC in the perpendicular direction of the interface is sufficient to obtain adequate convergence in the interface energy between NbC and bcc iron [21]. Herein, therefore, the same periodic boundary condition is used in the perpendicular direction of the interface. This calculation condition can be justified for the interface between the TiC and bcc iron because the physical properties of TiC are close to those of NbC. For example, the Young’s moduli of TiC and NbC are 375 and 330 GPa, respectively, which are 191% and 168% of bcc iron, respectively. Moreover, both TiC and NbC have the same a NaCl-type crystal structure with lattice parameters of 0.433 and 0.447 nm, respectively, and the lattice misfit between TiC and bcc iron is smaller than that between NbC and bcc iron. It is necessary, however, to treat more than 4000 atoms for the semi-coherent interface between TiC and bcc iron because of the small lattice misfit. The first-principles calculation of such a huge number of atoms is rather time-consuming even for materials with widely spread electron density. Moreover, the material used in this study includes the elements with localized electron density, namely, Ti, Fe, and C in comparison with a electron system, such as Si. Thus, it is very difficult to treat this issue using the conventional first-principles calculation. In order to overcome this situation, we use the OpenMX package [24] in which the O(N) Krylov-subspace method of first-principles calculation [25] is adopted. For the exchange-correlation energy in the generalized gradient approximation, the expression proposed by Perdew et al. is used [26]. The pseudopotential method with Troullier–Martins pseudopotential [27] is adopted. The , , and states of Fe and Ti and and states of C are treated as valence electrons. The calculations are performed using double valence plus a single polarization function. In this study, the number of atoms in a truncated cluster is fixed at 64, 122, and 122 for Fe, Ti, and C, respectively, to ensure that the total energy differences between the O(N) and conventional methods are less than 0.02 eV/atom. Since the most important quantity for the interface energy is the total energy, a convergence is checked by using the absolute error in total energy with respect to that of the conventional method.
For estimating the strain energy around the precipitate, structure optimization is performed using the empirical potential [28,29]. The first-principles calculation is known to give an accurate elastic constant with the experimental value [30]. The empirical potential is fitted to the experimental elastic constant. Thus, the compatibility between the first-principles calculation and the embedded-atom method calculation is fairly good. The matrix and precipitate regions are set in the simulation cell. However, all atoms in the simulation cell are treated by the embedded-atom method potential for Fe [28,29]. In order to express the precipitate region, the atomic positions are fixed to have the same lattice parameters as TiC. In other words, we assume that the relaxation of atomic positions basically occurs in bcc iron. This assumption can be justified because, as mentioned earlier, the Young’s modulus of TiC is approximately two times larger than that of bcc iron. The semi-coherent precipitate region is constructed by atoms of Fe with an expansion of 0.7% along [001], and it is assumed to be atoms of Ti or C. On the other hand, the coherent precipitate region is constructed by atoms of Fe with expansions of 7.2% and 0.7% along [100] and [001], respectively, and it is assumed to be atoms of Ti or C. The corresponding diameter of a precipitate is estimated by assuming precipitates to be spherical. In the matrix region, the atomic positions are optimized to reduce the force acting on each atom. The calculation cell is set to be conventional unit cells to obtain strain energy accurately enough, because the strain energy due to a precipitate with the diameter of 2.8 nm is estimated in error by less than 0.01 between the and conventional unit cells.
4. Summary
The interface and the strain energies of the interface between the TiC and bcc iron are calculated using the O(N) first-principles electronic structure calculation method and the structure optimization using the empirical potential, respectively. These calculations are performed for various precipitate sizes and coherencies. The interface and strain energies of the semi-coherent precipitate are compared with those of the coherent precipitate. As a result, the transition sizes from coherent to semi-coherent precipitate are estimated to be 1.5 and 2.3 nm for NbC and TiC, respectively. These precipitates undergo a transition from the coherent to semi-coherent state at sizes smaller than those with minimum misfit in order to release the large strain energies of the coherent precipitates. The transition size of TiC is larger than that of NbC, which is related to the smaller lattice misfit of TiC than that of NbC. The estimated transition size of TiC is close to the experimentally obtained size at which the change in the size dependence of the interaction force occurs. Therefore, the methodology presented herein provides a fairly accurate transition size of a precipitate from the coherent to semi-coherent state.
Acknowledgments
The numerical calculations were performed on the K computer provided by the RIKEN Advanced Institute for Computational Science through the HPCI System Research project (Project ID: hp120298, hp130016).
Author Contributions
Hideaki Sawada performed the calculations, analyzed the calculated data and wrote the paper. Hideaki Sawada, Shunsuke Taniguchi, Kazuto Kawakami and Taisuke Ozaki contributed the discussion for the analysis. Taisuke Ozaki developed the first-principles electronic structure simulation code OpenMX.
Conflicts of Interest
The authors declare no conflict of interest. The founding sponsors had no role in the design of the study; in the collection, analyses, or interpretation of data; in the writing of the manuscript, and in the decision to publish the results.
Abbreviations
The following abbreviations are used in this manuscript:
| bcc | body-centered cubic |
| DOS | density of states |
| Fe–C–Ti | coherent interface where a C atom is connected with a Fe atom across the Fe–TiC interface |
| Fe–Ti–C | coherent interface where a Ti atom is connected with a Fe atom across the Fe–TiC interface |
| Fe–C–Nb | coherent interface where a C atom is connected with a Fe atom across the Fe–NbC interface |
| Fe–Nb–C | coherent interface where a Nb atom is connected with a Fe atom across the Fe–NbC interface |
References
- Maki, T. Possibilities of further increase in strength of steels. Bull. Iron Steel Inst. Jpn. 1998, 3, 781–786. [Google Scholar]
- Yong, Q.; Sun, X.; Yang, G.; Zhang, Z. Solution and precipitation of secondary phase in steels: Phenomenon, Theory and Practice. In Advanced Steels: The Recent Scenario in Steel Science and Technology; Weng, Y., Dong, H., Gan, Y., Eds.; Springer: New York, NY, USA, 2011; pp. 109–117. [Google Scholar]
- Sudo, M.; Hashimoto, S.; Kobe, S. Niobium added ferrite-bainite high strength hot-rolled sheet steel with improved formability. Tetsu-to-Hagané 1982, 68, 1211–1220. [Google Scholar] [CrossRef]
- Funakawa, Y.; Shiozaki, T.; Tomita, K.; Yamamoto, T.; Maeda, E. Development of high strength hot-rolled sheet steel consisting of ferrite and nanometer-sized carbides. ISIJ Int. 2004, 44, 1945–1951. [Google Scholar] [CrossRef]
- Pressouyre, G.M.; Bernstein, I.M. Quantitative analysis of hydrogen trapping. Metall. Trans. 1978, 9A, 1571–1580. [Google Scholar] [CrossRef]
- Yamasaki, S.; Takahashi, T. Evaluation method of delayed fracture property of high strength steels. Tetsu-to-Hagané 1997, 83, 454–459. [Google Scholar] [CrossRef]
- Porter, D.A.; Easterling, K.E. Phase Transformations in Metals and Alloys; Taylor & Francis: London, UK, 1992; pp. 160–163. [Google Scholar]
- Baker, R.G.; Nutting, J. The tempering of a Cr-Mo-V-W and a Mo-V steel. In Precipitation Processes in Steels; ISI Special Report No. 64; The Iron and Steel Institute: London, UK, 1959; pp. 1–22. [Google Scholar]
- Wei, F.G.; Hara, T.; Tsuzaki, K. High resolution transmission electron microscopy study of crystallography and morphology of TiC precipitates in tempered steel. Philos. Mag. 2004, 84, 1735–1751. [Google Scholar] [CrossRef]
- Hartford, J. Interface energy and electron structure for Fe/VN. Phys. Rev. 2000, 61, 2221–2229. [Google Scholar] [CrossRef]
- Lee, J.H.; Shishidou, T.; Zhao, Y.J.; Freeman, A.J.; Olson, G.B. Strong interface adhesion in Fe/TiC. Philos. Mag. 2005, 85, 3683–3697. [Google Scholar] [CrossRef]
- Arya, A.; Carter, E.A. Structure, bonding, and adhesion at the TiC(100)/Fe(110) interface from first principles. J. Chem. Phys. 2003, 118, 8982–8996. [Google Scholar] [CrossRef]
- Chung, S.H.; Ha, H.P.; Jung, W.S.; Byun, J.Y. An ab initio study of the energies for interfaces between group V transition metal carbides and bcc iron. ISIJ Int. 2006, 46, 1523–1531. [Google Scholar] [CrossRef]
- Jung, W.S.; Chung, S.H.; Ha, H.P.; Byun, J.Y. An ab initio study of the energies for interfaces between group V transition metal nitrides and bcc iron. Model. Simul. Mater. Sci. Eng. 2006, 14, 479–495. [Google Scholar] [CrossRef]
- Jung, W.S.; Chung, S.H.; Ha, H.P.; Byun, J.Y. An ab initio study of the energies of coherent interfaces formed between bcc iron and carbides or nitrides of transition metals. Solid State Phenom. 2007, 124–126, 1625–1628. [Google Scholar] [CrossRef]
- Jung, W.S.; Lee, S.C.; Chung, S.H. Energetics for interfaces between group IV transition metal carbides and bcc iron. ISIJ Int. 2008, 48, 1280–1284. [Google Scholar] [CrossRef]
- Jung, W.S.; Chung, S.H. Ab initio calculation of interfacial energies between transition metal carbides and fcc iron. Model. Simul. Mater. Sci. Eng. 2010, 18, 075008. [Google Scholar] [CrossRef]
- Johansson, S.A.E.; Christensen, M.; Wahnström, G. Interface energy of semicoherent metal-ceramic interfaces. Phys. Rev. Lett. 2005, 95, 226108. [Google Scholar] [CrossRef] [PubMed]
- Fors, D.H.R.; Wahnström, G. Theoretical study of interface structure and energetics in semicoherent Fe(001)/MX(001) systems. Phys. Rev. 2010, 82, 195410. [Google Scholar] [CrossRef]
- Fors, D.H.R.; Johansson, S.A.E.; Petisme, M.V.G.; Wahnström, G. Theoretical investigation of moderate misfit and interface energies in the Fe/VN system. Comput. Mater. Sci. 2010, 50, 550–559. [Google Scholar] [CrossRef]
- Sawada, H.; Taniguchi, S.; Kawakami, K.; Ozaki, T. First-principles study of interface structure and energy of Fe/NbC. Model. Simul. Mater. Sci. Eng. 2013, 21, 045012. [Google Scholar] [CrossRef]
- Taniguchi, S.; Shigesato, G. Measurement of Coherent Strain Around TiC Precipitations in Ferrite; Northwestern University—NIMS Materials Genome Workshop: Northwestern, IL, USA, 2012. [Google Scholar]
- Kobayashi, Y.; Takahashi, J.; Kawakami, K. Experimental evaluation of the particle size dependence of the dislocation-particle interaction force in TiC-precipitation-strengthened steel. Scr. Mater. 2012, 67, 854–857. [Google Scholar] [CrossRef]
- The OpenMX Software Package. Available online: http://www.openmx-square.org/ (accessed on 17 July 2017).
- Ozaki, T. O(N) krylov subspace method for large scale ab initio electronic structure calculations. Phys. Rev. 2006, 74, 245101. [Google Scholar] [CrossRef]
- Perdew, J.P.; Burke, K.; Ernzerhof, M. Generalized gradient approximation made simple. Phys. Rev. Lett. 1996, 77, 3865–3868. [Google Scholar] [CrossRef] [PubMed]
- Troullier, N.; Martins, J.L. Efficient pseudopotentials for plane-wave calculations. Phys. Rev. 1991, 43, 1993–2006. [Google Scholar] [CrossRef]
- Finnis, M.W.; Sinclair, J.E. A simple empirical n-body potential for transition metals. Philos. Mag. 1984, 50, 45–55. [Google Scholar] [CrossRef]
- Finnis, M.W.; Sinclair, J.E. Erratum. Philos. Mag. 1986, 53, 161. [Google Scholar]
- Zhang, H.; Johansson, B.; Levente, V. Ab initio calculations of elastic properties of bcc Fe-Mg and Fe-Cr random alloys. Phys. Rev. 2009, 79, 224201. [Google Scholar] [CrossRef]
Figure 1.
Arrangement of atoms in the coherent interface with 14 layers along the c-axis.

Figure 2.
The interface distance dependence on the interface energies of the coherent and semi-coherent interfaces between the TiC and bcc iron and those between the NbC and body-centered cubic (bcc) iron.
Figure 2.
The interface distance dependence on the interface energies of the coherent and semi-coherent interfaces between the TiC and bcc iron and those between the NbC and body-centered cubic (bcc) iron.
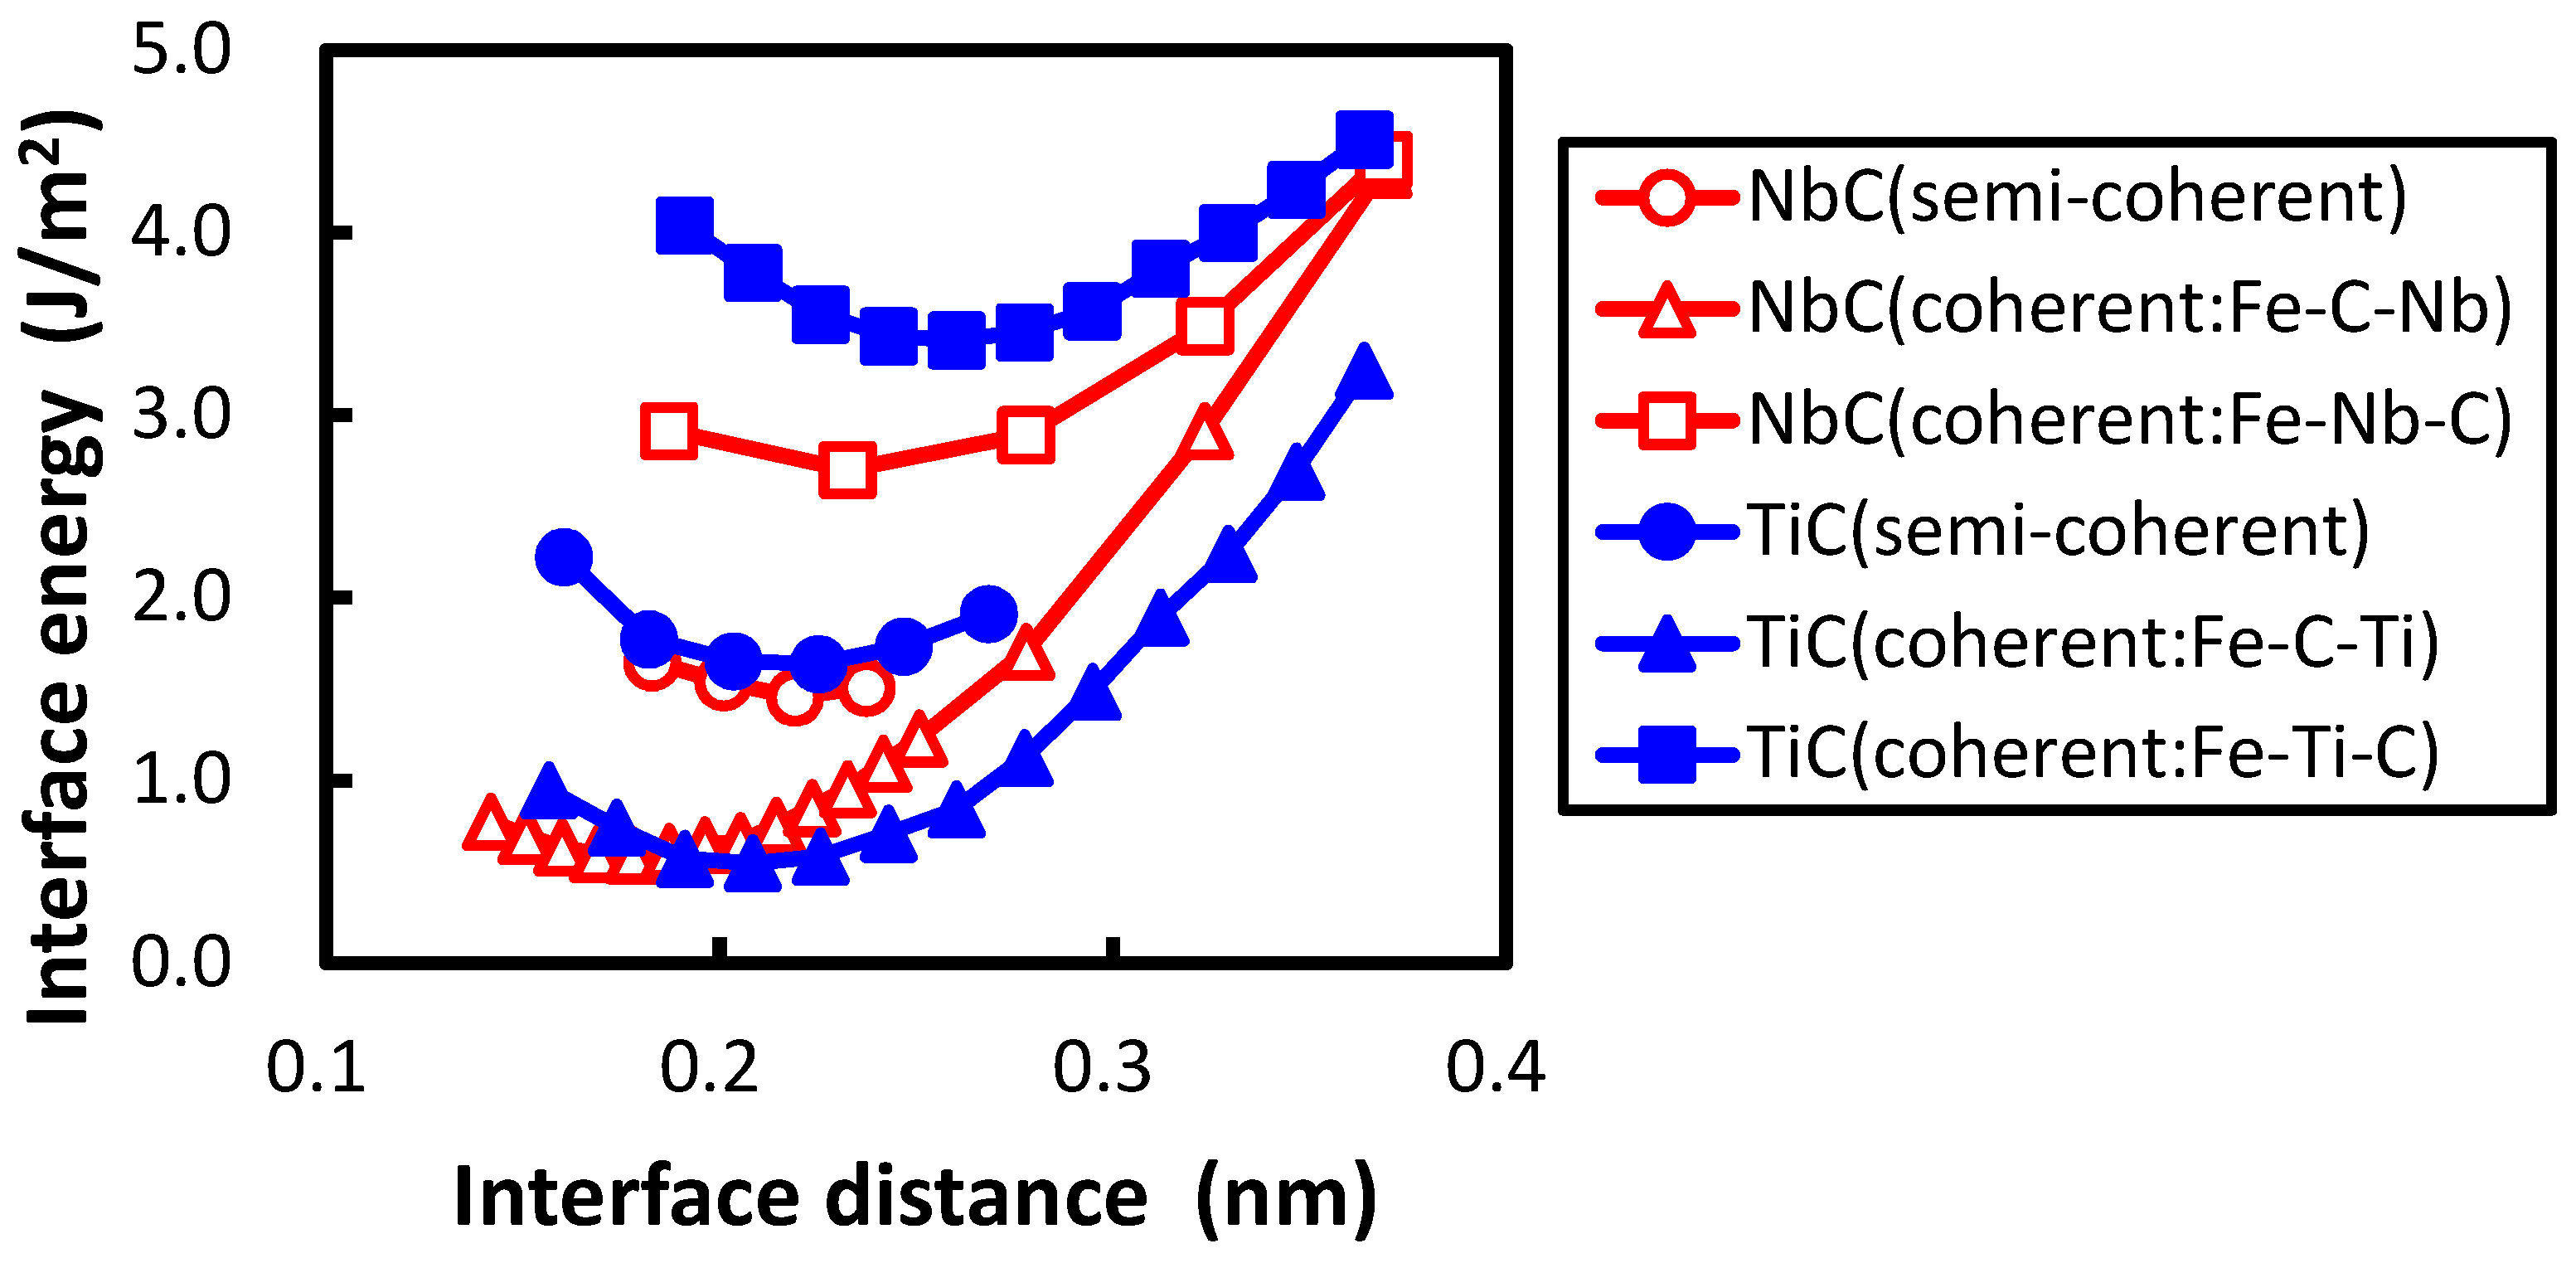
Figure 3.
Local density of states (DOS) of the C atoms (a,b) and Ti atoms (c,d) located at the interface and the middle of TiC. For the atomic arrangement at the interface, (a,c) correspond to the case that the C atom is directly connected with the Fe atom across the interface; and (b,d) correspond to the case that the Ti atom is connected with the Fe atom. The solid red lines and blue dashed lines denote the local DOS at the interface and the middle of TiC, respectively. The Fermi level is set as 0.

Figure 4.
Optimized arrangement of atoms in the semi-coherent interface with m:n = 15:14 in the (110) plane. The Fe atoms are connected along the [001] direction using red lines for visualization.
Figure 4.
Optimized arrangement of atoms in the semi-coherent interface with m:n = 15:14 in the (110) plane. The Fe atoms are connected along the [001] direction using red lines for visualization.

Figure 5.
Strain at the center of the broad plane of the precipitate along the direction perpendicular to the broad plane of precipitate with an (a) coherent and (b) semi-coherent interface. The x- and z-directions are parallel and perpendicular to the broad plane of the precipitate, respectively.
Figure 5.
Strain at the center of the broad plane of the precipitate along the direction perpendicular to the broad plane of precipitate with an (a) coherent and (b) semi-coherent interface. The x- and z-directions are parallel and perpendicular to the broad plane of the precipitate, respectively.
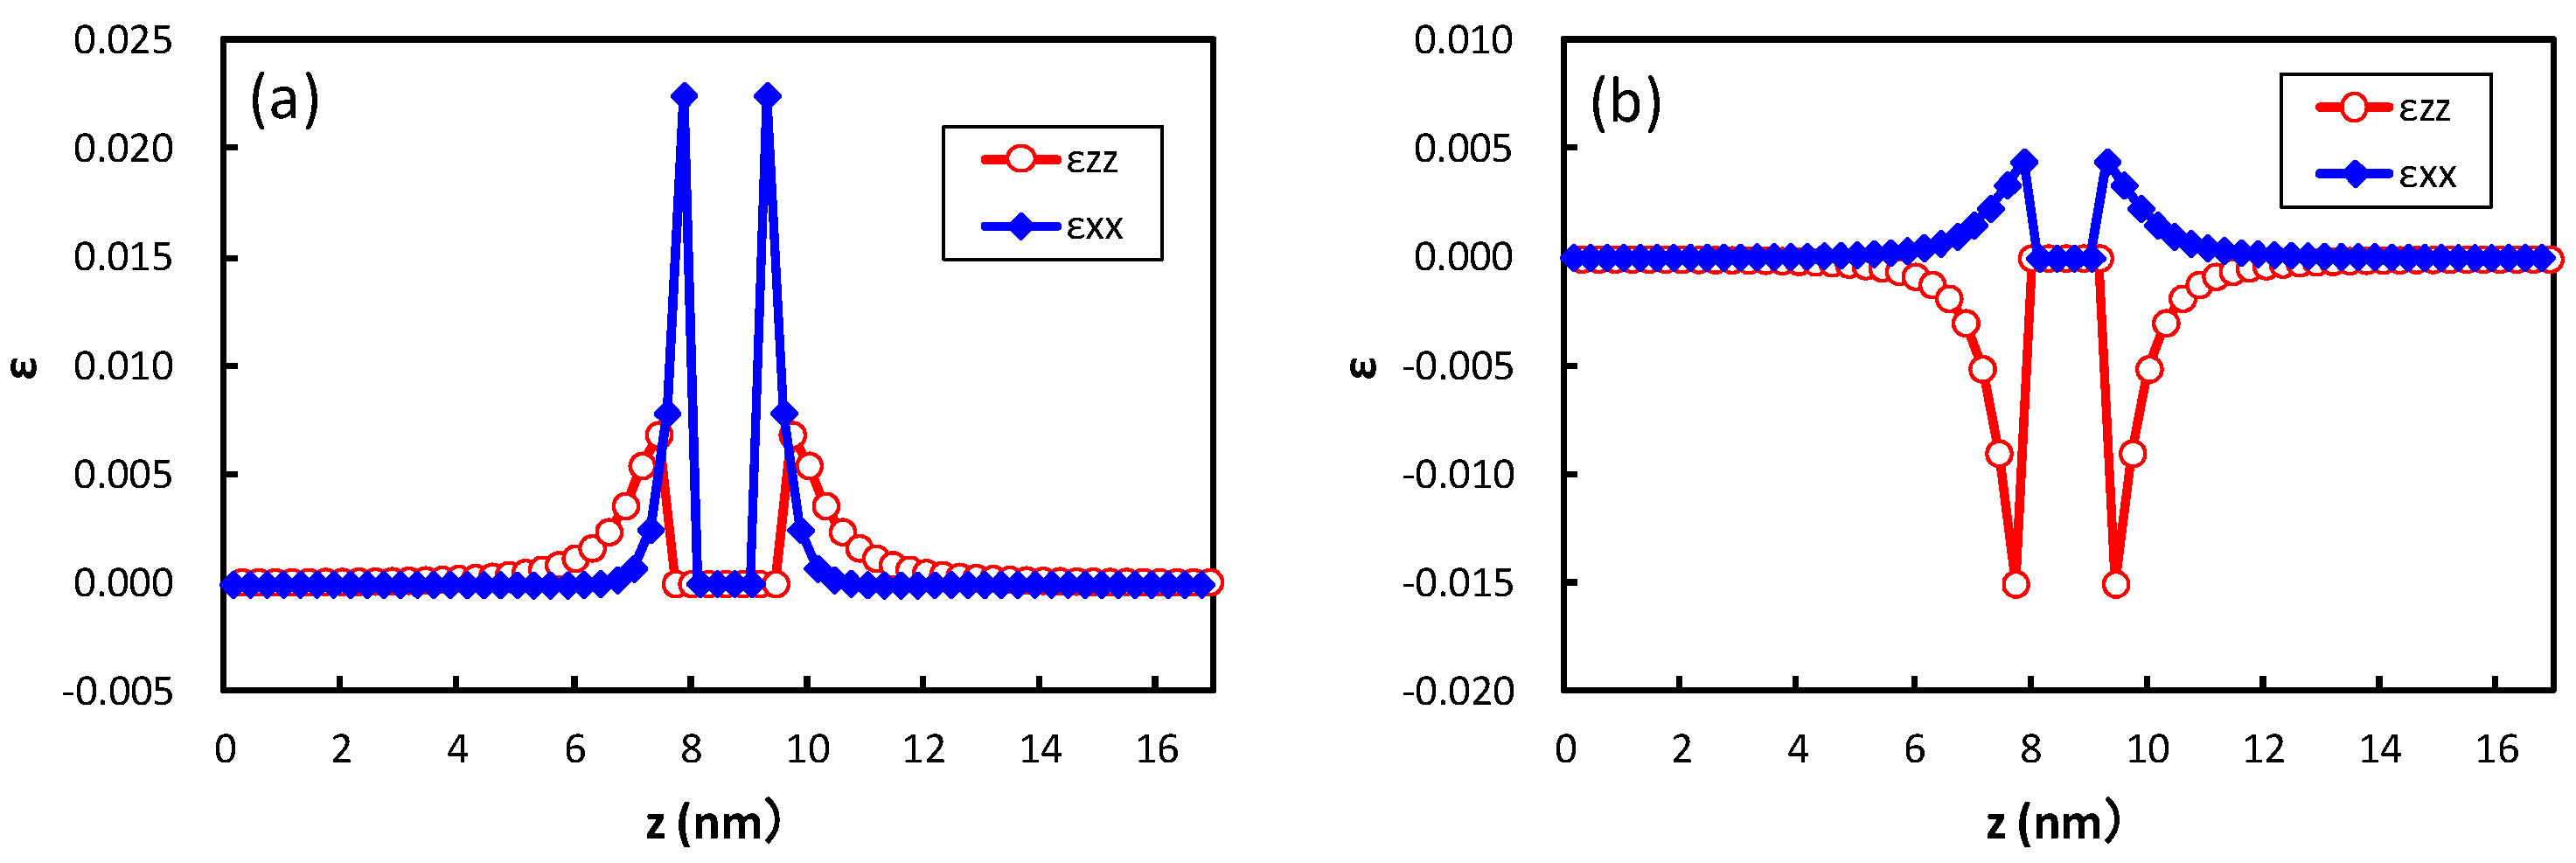
Figure 6.
Movement of atoms around the precipitate with an (a) coherent and (b) semi-coherent interface via structure optimization. The blue points denote atoms in the precipitate region. The red arrows denote movements of atoms in the matrix region by the structural optimization from the ideal position of Fe atoms in bcc iron due to precipitation. The length is elongated by five times from the original for clarity. The tick mark spacing is 0.2 nm for both the horizontal and vertical axes.
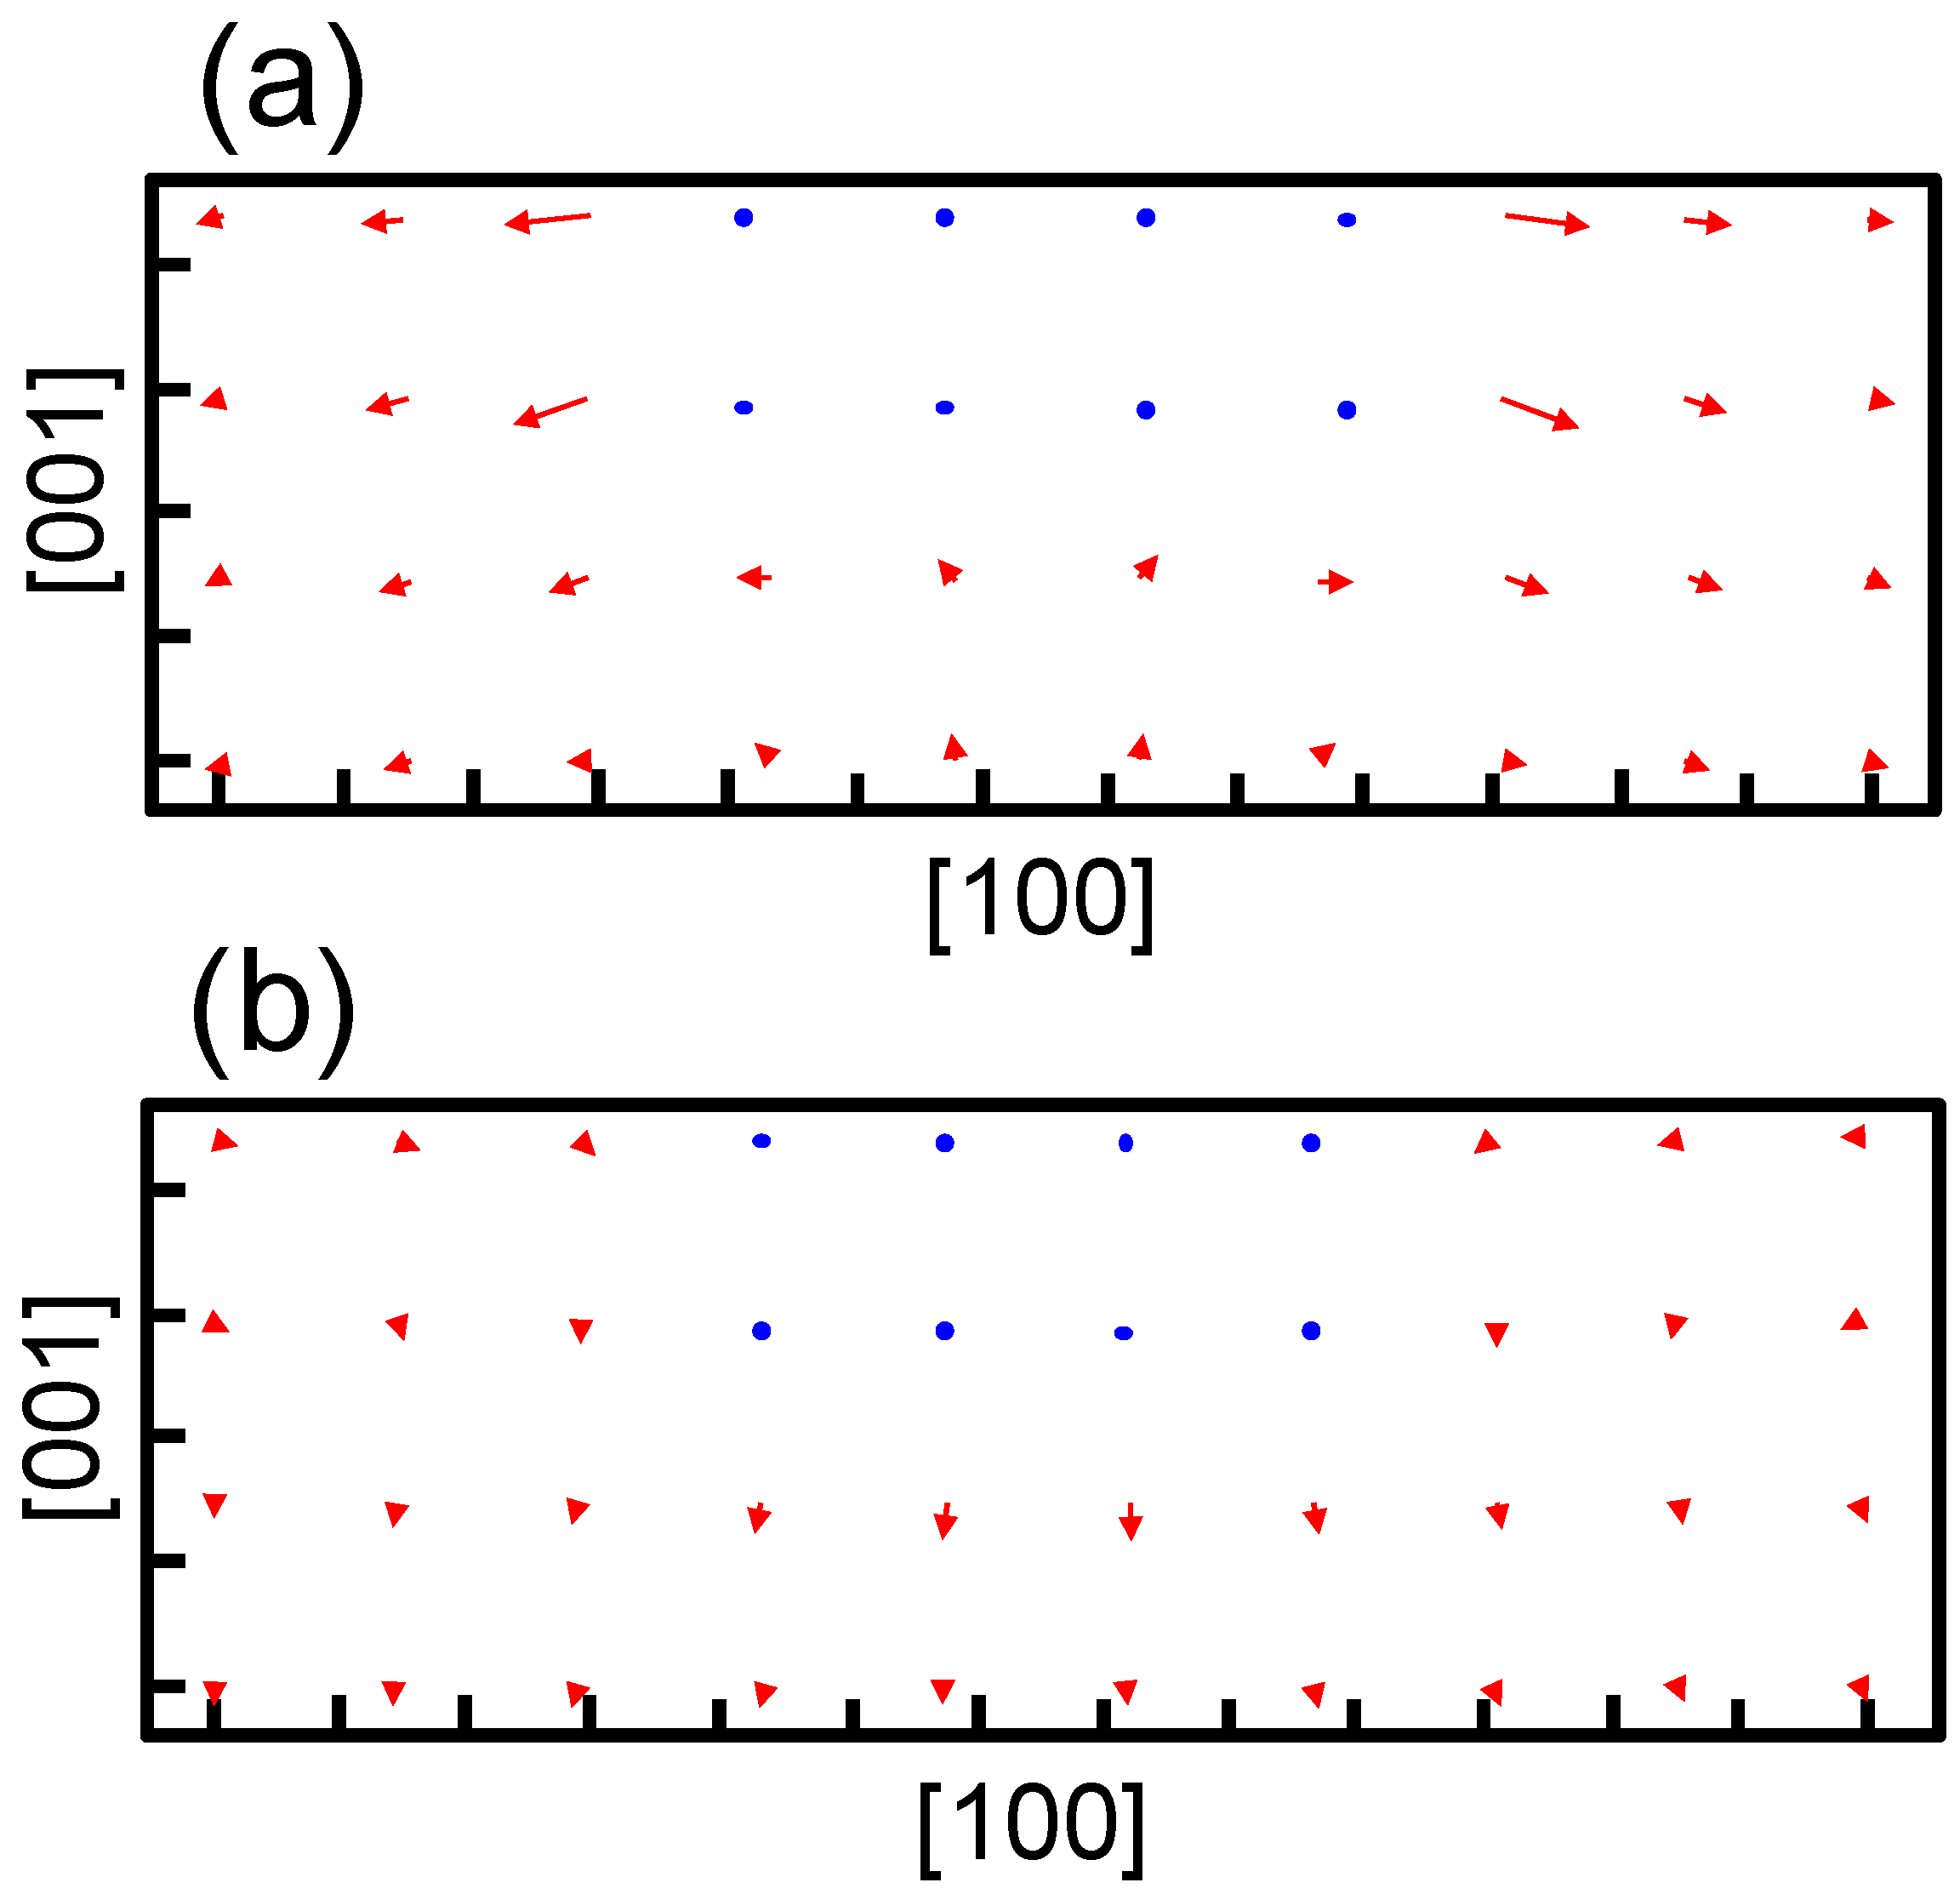
Figure 7.
The dependence of diameter of the precipitate on the interface and strain energies for the coherent and semi-coherent precipitates of (a) NbC and (b) TiC.
Figure 7.
The dependence of diameter of the precipitate on the interface and strain energies for the coherent and semi-coherent precipitates of (a) NbC and (b) TiC.
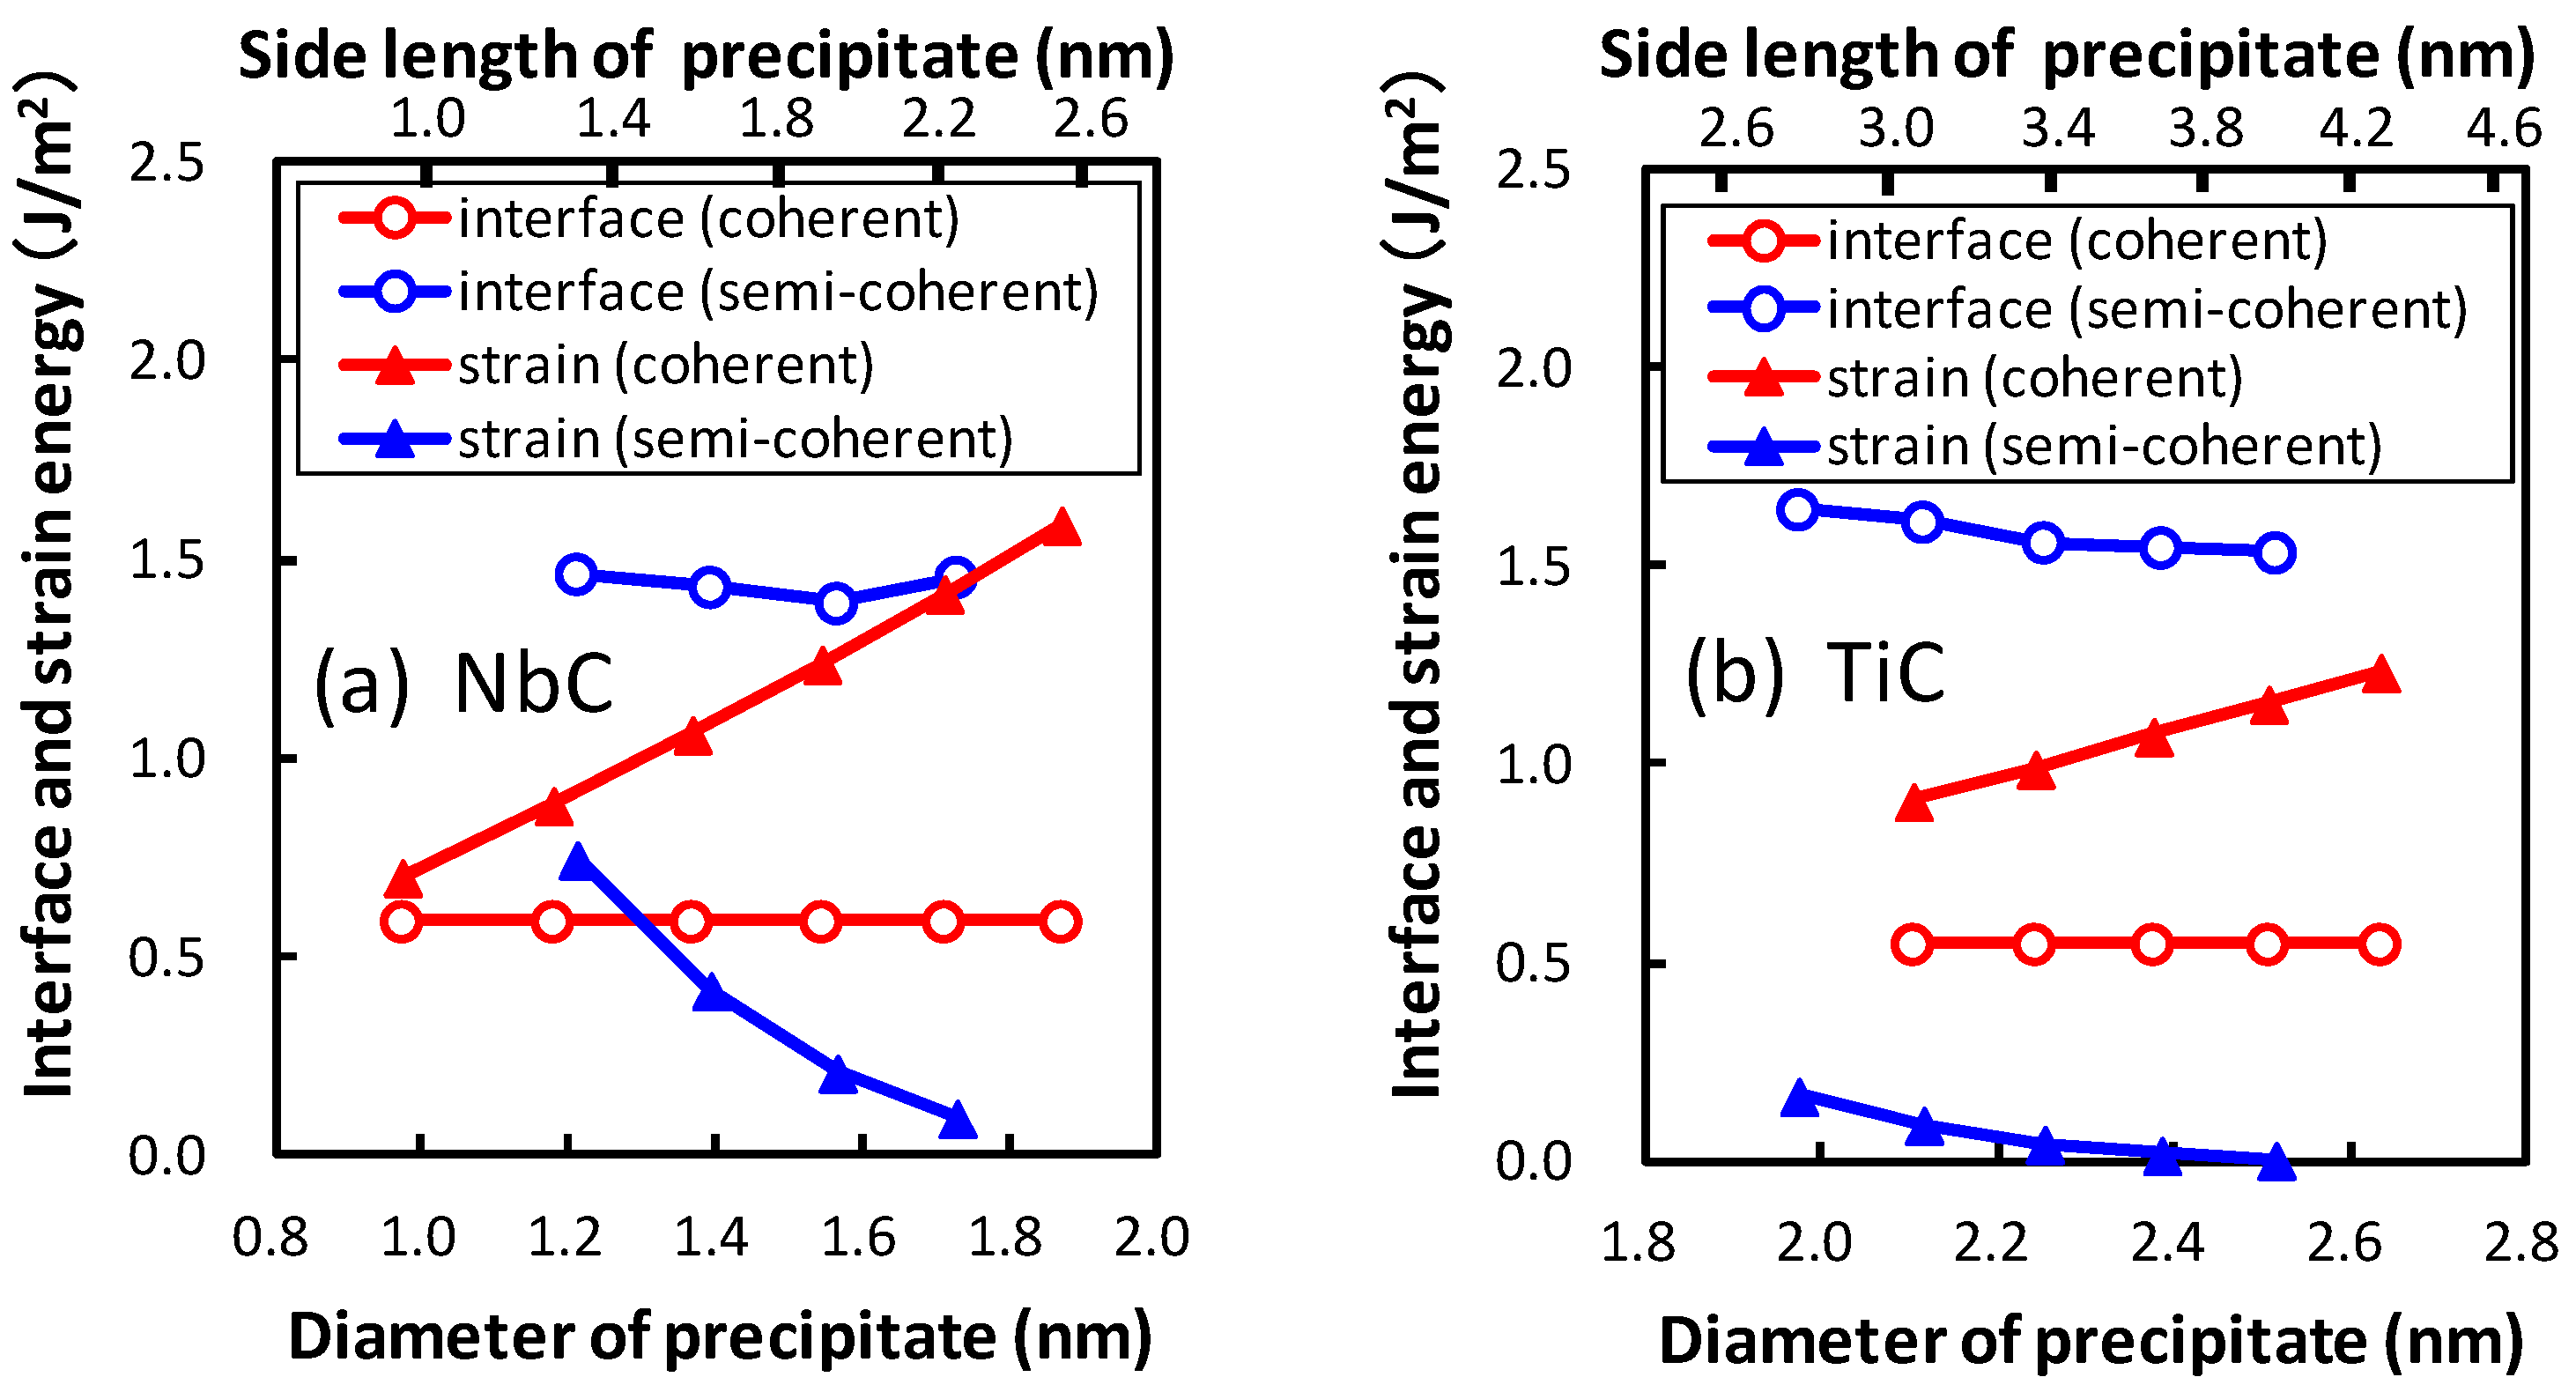
Figure 8.
The dependence of diameter of the precipitate on the sum of the interface and strain energies for the coherent and semi-coherent precipitates of (a) NbC and (b) TiC.
Figure 8.
The dependence of diameter of the precipitate on the sum of the interface and strain energies for the coherent and semi-coherent precipitates of (a) NbC and (b) TiC.

© 2017 by the authors. Licensee MDPI, Basel, Switzerland. This article is an open access article distributed under the terms and conditions of the Creative Commons Attribution (CC BY) license (http://creativecommons.org/licenses/by/4.0/).
Share and Cite
MDPI and ACS Style
Sawada, H.; Taniguchi, S.; Kawakami, K.; Ozaki, T. Transition of the Interface between Iron and Carbide Precipitate From Coherent to Semi-Coherent. Metals 2017, 7, 277. https://doi.org/10.3390/met7070277
AMA Style
Sawada H, Taniguchi S, Kawakami K, Ozaki T. Transition of the Interface between Iron and Carbide Precipitate From Coherent to Semi-Coherent. Metals. 2017; 7(7):277. https://doi.org/10.3390/met7070277
Chicago/Turabian StyleSawada, Hideaki, Shunsuke Taniguchi, Kazuto Kawakami, and Taisuke Ozaki. 2017. "Transition of the Interface between Iron and Carbide Precipitate From Coherent to Semi-Coherent" Metals 7, no. 7: 277. https://doi.org/10.3390/met7070277
Note that from the first issue of 2016, this journal uses article numbers instead of page numbers. See further details here.