Microstructural, Mechanical, Texture and Residual Stress Characterizations of X52 Pipeline Steel


1
School of Mechanical Engineering, The University of Adelaide, Adelaide, SA 5005, Australia
2
Australian Nuclear Science and Technology Organization, Lucas Heights, NSW 2234, Australia
*
Author to whom correspondence should be addressed.
Metals 2017, 7(8), 306; https://doi.org/10.3390/met7080306
Submission received: 13 June 2017
/
Revised: 18 July 2017
/
Accepted: 2 August 2017
/
Published: 9 August 2017
(This article belongs to the Special Issue Mechanical Behavior of High-Strength Low-Alloy Steels)
Abstract
:In this paper, the microstructural and mechanical properties of a high-strength low-alloy (HSLA) API 5L X52 steel, which is widely utilized in the construction of gas pipelines, were characterized with optical microscopy, electron backscatter diffraction, and standard mechanical tests. The outcomes of these characterizations were used to evaluate the strengthening contributions of the solid solution, grain size, dislocations, and precipitates to the overall strength of the steel. In addition, texture and residual stresses were determined with neutron diffraction. The residual stresses were found to be low in comparison with the expected stresses due to the operating pressure. However, these stresses could contribute to the initiation and propagation of stress corrosion cracking at the outer surface of the pipe. Neutron diffraction results also suggested that the outer surface of the pipe had a texture that is expected to have a low resistance to high pH stress corrosion cracking. Both conclusions were found to be consistent with field observations.
1. Introduction
The strong environmental incentives for the use of natural gas as a source of clean energy has boosted the mass production of high-strength low-alloy (HSLA) steels over the past decades. These steels are now widely utilized in the construction of long-distance, high-pressure gas pipelines and other pressure equipment worldwide. A great deal of research has also been directed to obtaining an excellent combination of mechanical properties in HSLA through alloy design as well as optimizing thermo-mechanical controlled processing (TMCP) parameters and corresponding microstructures. TMCP promotes the formation of an acicular ferrite (AF)-based microstructure, which is the preferred microstructure for pipe steels. Steels with AF microstructure normally possess higher strength and toughness, as well as superior stress corrosion and fatigue resistance than steels with ferrite and pearlite (P) microstructure [1,2].
API X52 steel is used widely as pipeline material in Australia and other countries. For example, it is the most-used material in the existing European gas pipeline network. The importance of the characterization of the material properties and susceptibility to various failure modes is progressively increasing with the prospective plans of the EU to utilize the existing pipeline network for the transportation of natural gas and hydrogen mixtures [3,4]. Therefore, the investigation of the microstructure and mechanical properties of pipeline steels is an important aspect required for the understanding of failure mechanisms including plastic collapse, fracture, and stress corrosion cracking (SCC) [5,6]. All of these failure modes represent a significant threat to the integrity of pipelines and pressure equipment.
In the present study, microstructural and mechanical characterizations of HSLA API 5L X52 steel were conducted to assess its mechanical properties. Special attention was given to a theoretical model for the prediction of yield strength (as an indication of the susceptibility of pipes to plastic collapse failure) from the steel composition, microstructure, and measured hardness data.
The API 5L X52 pipes are normally formed by spiral welding technique, which inevitably leads to the generation of residual stresses. Although the residual stresses do not affect the plastic collapse conditions, their presence could significantly influence the susceptibility of the pipe to stress corrosion or the initiation of fatigue cracks. With the help of neutron diffraction, the texture and the field of residual stresses were determined to assess the susceptibility of the API 5L X52 to these failure mechanisms. The outcomes of this study can contribute to the understanding of the stress corrosion resistance, strength, and remaining life of the existing pipeline network made of X52 steel, which is expected to be in service for the foreseeable future.
2. Materials and Methods
2.1. Material
API 5L X52M PSL2 steel was obtained from a pipe section with a wall thickness of 12.7 mm and an outer diameter of 508 mm. Table 1 shows the chemical composition of the steel.
2.2. Microstructural Analysis
2.2.1. Optical Analysis
A semi-automatic Tegramin polishing machine (Struers, Ballerup, Denmark) was used for polishing the sample surface (cross-section of the pipe) down to 1 μm diamond paste. The samples were then etched with 2% Nital solution, and the revealed microstructure was inspected with an Axio Imager optical microscope (Zeiss, Oberkochen, Germany).
2.2.2. Electron Back-Scatter Diffraction (EBSD) Measurements
For EBSD measurements, final polishing was achieved using a porous neoprene disc with a colloidal silica suspension (0.04 μm). The EBSD scans were collected using a FEI Helios Nanolab 600-SEM (Thermo Fisher Scientific, Waltham, MA, USA) equipped with an EBSD detector (EDAX Hikari™, AMETEK, Berwyn, IL, USA). The acceleration voltage and the electron beam current of the SEM were 20 kV and 2.7 nA, respectively. The step size was 1 µm with a hexagonal scan grid (scans were 400 × 400 μm2). EDAX OIMTM Data Analysis 5.2 software (AMETEK, Berwyn, IL, USA) was used for the data collection and analyses.
2.2.3. Hardness Measurements
The bulk hardness of the steel was determined using a Vickers indenter with a load of 10,000 gf. The micro-Vickers hardness measurements were conducted using a LM700AT (Leco, St. Joseph, MO, USA) at different loads from 10 gf to 1000 gf [7] in order to determine the dislocation density in the steel, by following the method exposed in [7,8].
2.2.4. Residual Stress Measurements
The residual stresses profile was measured with neutron diffraction (ND) in the pipe through wall thickness. The measurements were performed on a strain scanning diffractometer (KOWARI, ACNS, ANSTO, Lucas Heights, Australia) [9]. A monochromatic beam with λ = 1.67 Å from Si{400} monochromator reflection was used in this analysis. This choice of wavelength resulted in a scattering angle of 90° of the sample Fe(211) reflection. A nominal gauge volume of 0.3 × 0.3 × 8 mm3 was used to measure two principal stress directions (normal and hoop) and to reconstruct the hoop stress component (under an assumption of zero normal stress). Measurement steps were 0.4 mm through thickness and started at 0.3 mm from the outer surface. The sample was a plate of 100 × 100 mm2 dimension cut from the pipe section.
2.2.5. Texture Measurements
The KOWARI diffractometer was also used to perform texture measurements in the pipe through wall thickness (at seven locations). Samples were prepared by cutting a slice at certain depths measured from the outer surface of the pipes of about 0.5 mm thick and 6 mm wide. The slice was then cut into small coupons and coupons were glued together to form a cube of about 6 mm side. The orientation of each coupon was preserved when cutting and gluing them together. A monochromatic beam with λ = 1.676 Å was used to measure three pole figures (110), (200), and (211) on a grid close to 5 × 5°, and orientation distribution functions (ODF) at φ2 = 45° were plotted from these three pole figures [5].
3. Results
3.1. Microstructural Analysis
3.1.1. Optical Analysis
Figure 1 shows that the microstructure of the steel consisted of ferrite and ~4.7% of pearlite (determined with ImageJ analysis software (v1.48, open source)).
3.1.2. EBSD Measurements
The EBSD measurements were performed at 0.8 mm from the pipe outer surface, and are presented in Figure 2. The inverse pole figure (IPF) showing the orientation of the grains that constitute the steel is presented in Figure 2a. The average grain size diameter from this scan was evaluated as 9.35 µm with a standard deviation of 3.19 µm, and the average grain size of ferrite determined by the linear intercept method with random test lines drawn on the scan was measured as 5.53 µm. The grain boundaries character is shown in Figure 2b. The fractions of low angle grain boundaries (LABs, between 2° and 15°) and high angle boundaries (HABs, between 15° and 180°) were measured as, respectively, 0.08 and 0.92. The average grain boundary misorientation angle was measured as 39.1°.
3.2. Mechanical Properties
3.2.1. Tensile Test Results
The mechanical properties of the pipe steel provided by the manufacturer are presented in Table 2. The specified minimum yield strength (SMYS) for the API 5L X52M PSL2 is 52 ksi or 359 MPa.
3.2.2. Hardness Measurements and Determination of Dislocation Density
The dislocation density can be estimated from indentation measurements for materials displaying indentation size effect (ISE) [7,8]. The hardness value is related to the indentation depth by the equation [10]:
where H0 is the hardness in the limitation of infinite depth (bulk hardness, determined in this work as 153 HV10), h* is a characteristic length, and H is the hardness value corresponding to indentation depth h. By fitting Equation (1) to the experimental hardness values (see the regression curve in Figure 3), a value of h* ~2086 nm could be obtained. h* and the dislocation density statistically stored in the lattice, ρ, are related by the equation [7,8,10]:
where θ is the angle between the surface of the material and the surface of the indenter (22°) and f is a correction factor (=1.9) for the size of the plastic zone [7,8]. By introducing these values in Equation (2), ρ was approximately estimated as 6.9 × 109 cm−2.
3.3. Neutron Diffraction Measurements
3.3.1. Residual Stress Measurements
Figure 4a shows the profile of the residual stresses in the tangential (or hoop) direction measured by ND for the X52 steel, mainly resulting from the steel strip production. Very weak stress distribution in the through-wall-thickness direction of the pipe was recorded, in the range of ±20 MPa with uncertainties ±10 MPa on the stress values. Although statistical oscillations are pronounced with these error bars, the overall stress distribution has features most likely originating from the production process: the V-shape in the middle is typical for hot deep rolling, while sharp drop to compression close to surfaces is associated with colder temperature surface treatment (rolling). An additional stress component (linear bending stress distribution) existed in the as-built pipe that was removed by sample cutting. In the uncut pipes, the tensile stress was reconstructed through accurate measurement of the pipe opening after making the hoop cut. It was estimated to be 41 MPa higher on the outer surface and 42 MPa lower on the inner surface. Figure 4b shows the total residual stress obtained by the combination of the steel strip production and bending pipe process. The residual stresses near the outer surface of the pipe were thus tensile, and had a maximum value of approximately 5.3% of the YS or 5.8% of the SMYS.
3.3.2. Texture Measurements
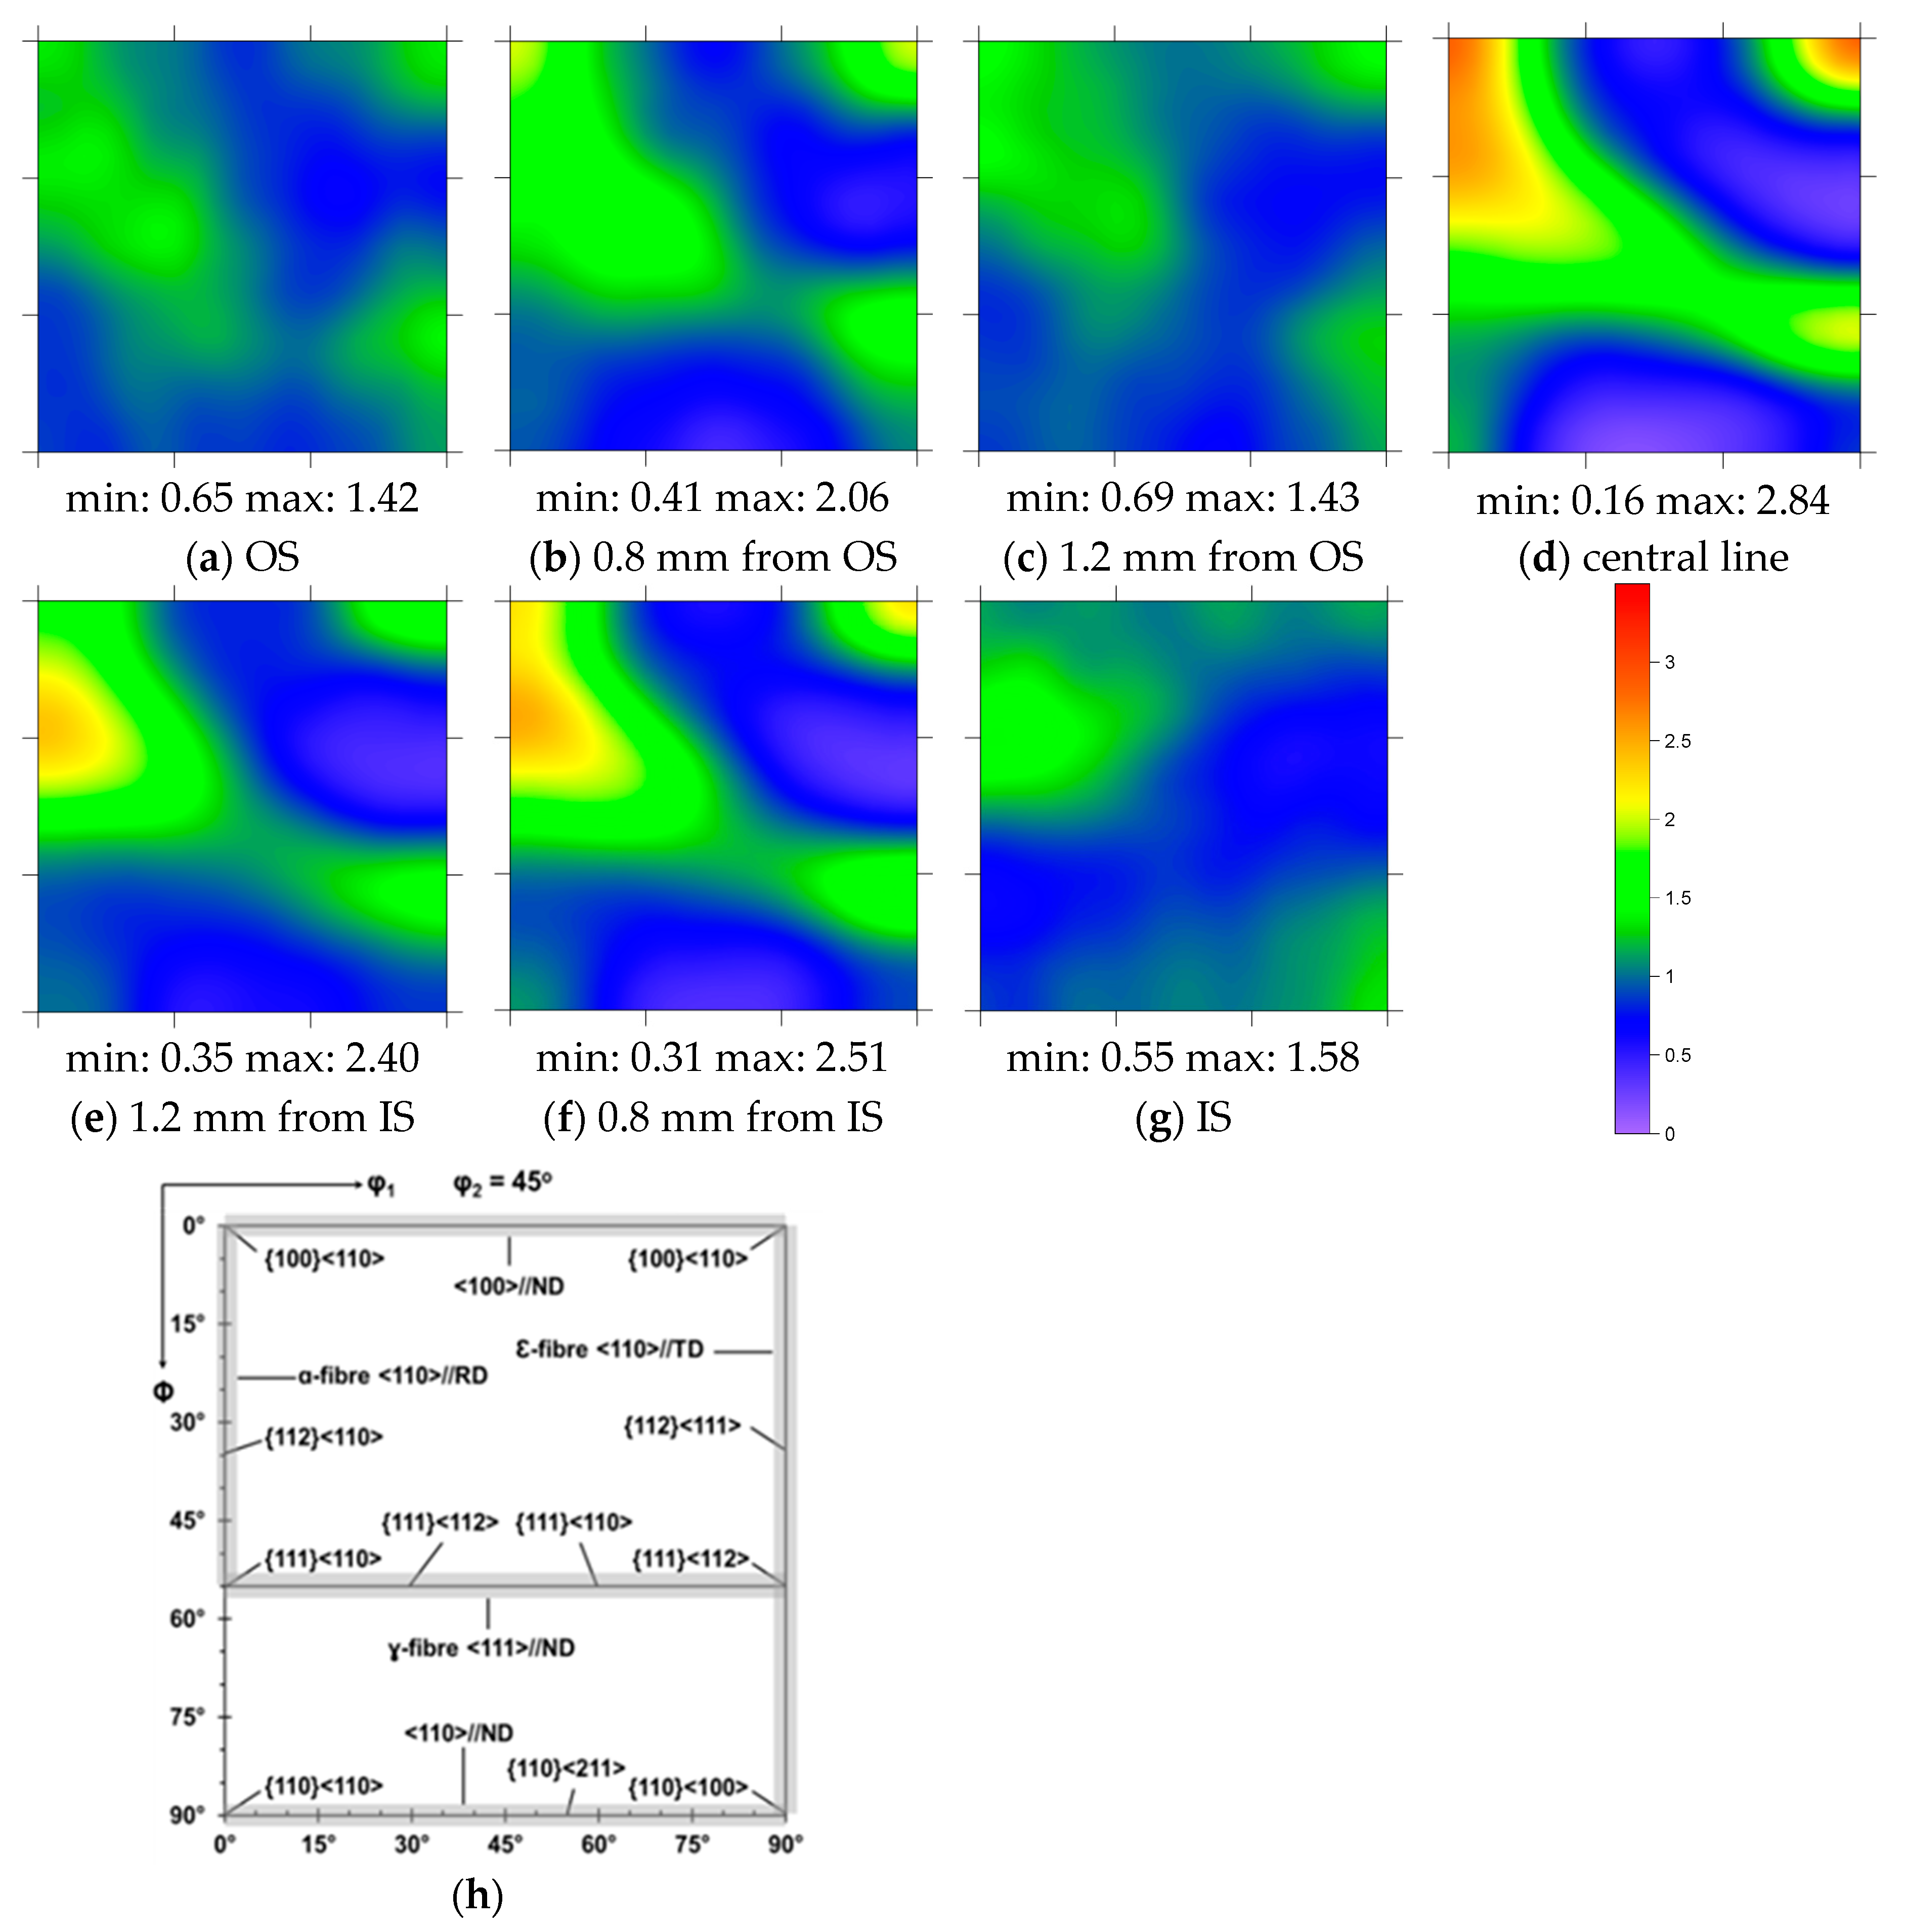
The orientation distribution functions obtained from the three pole figures (110), (200), and (211) allows the quantitative description of the texture of the crystalline phase. In body-centred cubic steels, ODFs at φ2 = 45° section displays the major texture components [5,11]. These ODFs are presented in Figure 5 at seven locations in the pipe through-wall (Figure 5a–g) along with the color scale bar showing the orientations intensity and the ideal locations of the main texture components on the ODF section (schematically shown in Figure 5h). Although ODF profiles were smoothed by the ODF harmonic reconstruction method, an excellent grain statistic was provided in the neutron texture experiment (10 to 100 million grains considered for each measurement). It can be seen that the texture of the steel presents a layer-by-layer characteristic in the through-wall direction, directly linked to the rolling process of the slab. A relatively weak texture was found at the outer surface of the pipe while a typical texture of a rolled strip was found in the central line of the pipe (i.e., along the α- and γ-fibers).
4. Discussion
4.1. Strengthening Mechanisms
In accordance with the structure-based strength calculation model [12,13], the yield strength, , of ferritic steels can be factorized into a number of intrinsic components:
where is the intrinsic lattice friction stress (=54 MPa for pure iron single crystal [12,14]), , , , and are contributions from, respectively, solid solution, grain size, dislocation, and precipitation strengthening.
4.1.1. Solid Solution Strengthening
The solid solution strengthening can be obtained by considering the effect of only Si and Mn atoms, using the equation proposed by Pickering [14]:
Using the values presented in Table 1, was thus determined as approximately 49 MPa. The effect of carbon was not considered, since its solubility in ferrite is negligible [15]. Carbon is expected to be found essentially in the pearlite phase (Figure 1) and as NbC precipitates [16]. However, the fraction of pearlite measured here (Section 3.1.1) is not expected to have any effect on the yield strength [13,17], and the effect of the NbC precipitates on the yield strength is exposed hereafter.
4.1.2. Grain Size Strengthening
The grain size strengthening in ferrite can be expressed from the Hall-Petch equation as [13,16]:
where d is the average grain size of ferrite (in mm) determined by the linear intercept method with random test lines in the EBSD analysis (≈5.53 × 10⁻³ mm, see Section 3.1.2). Consequently, the value of was estimated as approximately 203 MPa.
4.1.3. Dislocation Strengthening
The strengthening contribution due to dislocations can be calculated using the following relation [13,18]:
where G is the shear modulus of the ferrite (81.6 GPa [12]), b is the Burgers vector of the dislocations (0.248 nm [12]), and ρ = 6.9 × 109 cm−2 (see Section 3.2.2). was therefore determined as approximately 64 MPa.
4.1.4. Precipitation Strengthening
The degree of strengthening due to the precipitates is dependent on both their fraction and size in the microstructure, and can be expressed by the following simplified relation [13]:
where the values of B are presented in Table 3 [13].
The concentration of Ti and V being negligible in this X52 steel (Table 1), was determined as approximately 19 MPa by considering the average value of B for Nb as NbC precipitates.
Adding up all the intrinsic contributions in the analytical expression of the yield strength (Equation (3)) results in an overall calculated strength of approximately 389 MPa, which correlates well with the experimental value from the tensile tests (395 MPa).
Similarly, the hardness depends on the average ferrite grain size. This dependence has been shown to follow a Hall-Petch relation for a ferrite/cementite steel [19], and has been determined by regression analysis as:
where d is expressed in µm. With d = 5.53 µm, HV is analytically determined as 148, which is also in good agreement with the measured bulk hardness value of 153 HV10.
It can be noted that the yield and the tensile strengths are empirically related to the hardness by the following equations (derived for an X65 steel) [20]:
With HV = 153, and TS are estimated as 411 and 543 MPa, respectively, which slightly overestimates the measured values (Table 2) of 4% and 11%, respectively.
4.2. Microstructure and Stresses Implications in Stress Corrosion Cracking Susceptibility
HSLA X65 steels were found to have an increased resistance to high pH SCC when a high intensity of texture along the <110>//ND was measured [5,11]. At the outer surface of the considered X52 steel, the measured texture is weak and does not present these orientations, suggesting that this steel is normally susceptible to high pH SCC. Moreover, a high fraction of HABs is also measured, which can promote high pH SCC to initiate and propagate [5]. The microstructure of this steel is thus typically susceptible to high pH SCC [5,11,21,22].
Pipelines are operated to a maximum pressure level that is a percentage of the specified minimum yield strength. For Class 1 locations, for example (offshore, or location unit that has 10 or fewer buildings intended for human occupancy), the maximum allowable operating pressure (MAOP) is 80% of SMYS [22]. However, the areas of pipelines presenting greatest risk of high pH SCC have been defined for MAOP >60% of SMYS [23]. For high pH SCC to occur, the stress or the stress intensity factor must be above a threshold stress, which is reduced by small amplitude and low frequency stress fluctuations superimposed on the mean stress [22]. It has been shown that the threshold stress for an X52 steel decreased to 40% of the SMYS when stress fluctuations of 15% of the mean stress were applied every 12 days [24]. Overall, this study determined the threshold stress values to comprise between 40% and 110% of the SMYS, depending on the amplitude and frequency of the stress fluctuations. Pitting and rougher surfaces can also contribute to the decrease of the threshold stress values [25].
It can therefore be understood that the pipeline considered in this study presenting a susceptible microstructure, operating as level of stress as low as 35% of the SMYS, and presenting additional levels of residual stress at the outer surface (~6% of SMYS) is theoretically susceptible to the development of high pH SCC. This is consistent with observed on-site high pH SCC failure of pipeline made of X52 steel [21].
5. Conclusions
This paper presents the outcomes of micro- and macro-characterizations of API X52 steel, which is one of the most common structural materials of the existing pipeline network in Europe and globally. As outlined in the previous section, the structure-based strength calculation model provides a simple way to effectively evaluate the yield strength of X52 steels through the evaluation of individual strengthening contributions. It is demonstrated that this model can adequately predict the yield strength of steels with ferritic/pearlitic microstructure. However, the theoretical calculations would probably require some adjustment in order to apply to higher strength steels such as X70, the microstructure of which usually incorporates smaller grain sizes and different grain shapes corresponding to acicular ferrite/bainite micro-constituents.
The present characterizations also indicated the potential contribution of the microstructure, relatively weak texture, and residual stresses due to manufacturing to high pH stress corrosion cracking susceptibility. This suggestion is consistent with field observations of failed X52 pipes, and more generally with failed pipes made of higher strength API steels such as X65 [5]. Therefore, the evaluation of the remaining life of the existing X52 pipeline network and its utilization for alternative gas mixture transportation or storage should consider the possible damage accumulation due to stress corrosion cracking as a result of the past operation.
Acknowledgments
This work was funded by the Energy Pipelines CRC, supported through the Australian Government’s Cooperative Research Centres Program. The funding and in-kind support from the APIA RSC is gratefully acknowledged. The authors acknowledge the facilities, and the scientific and technical assistance of the Australian Microscopy & Microanalysis Research Facility at the University of Adelaide as well as Michael Law (ANSTO) for the sample preparation for the texture measurements. The authors would also like to thank Geoff Callar (APA Group) and Erwin Gamboa (The University of Adelaide) for discussion.
Author Contributions
Olivier Lavigne performed the OM, EBSD, and indentations experiments; Vladimir Luzin performed the ND experiments; Olivier Lavigne, Vladimir Luzin and Andrei Kotousov analyzed the data; Olivier Lavigne and Andrei Kotousov wrote the paper.
Conflicts of Interest
The authors declare no conflict of interest.
References
- Costin, W.L.; Lavigne, O.; Kotousov, A. A study on the relationship between microstructure and mechanical properties of acicular ferrite and upper bainite. Mater. Sci. Eng. A 2016, 663, 193–203. [Google Scholar] [CrossRef]
- Costin, W.L.; Lavigne, O.; Kotousov, A.; Ghomashchi, R.; Linton, V. Investigation of hydrogen assisted cracking in acicular ferrite using site-specific micro-fracture tests. Mater. Sci. Eng. A 2016, 651, 859–868. [Google Scholar] [CrossRef]
- Fernandes, T.R.C.; Chen, F.; Da Graça Carvalho, M. “HySociety” in support of European hydrogen projects and EC policy. Int. J. Hydrog. Energy 2005, 30, 239–245. [Google Scholar] [CrossRef]
- Mulder, G.; Hetland, J.; Lenaers, G. Towards a sustainable hydrogen economy: Hydrogen pathways and infrastructure. Int. J. Hydrogen Energy 2007, 32, 1324–1331. [Google Scholar] [CrossRef]
- Lavigne, O.; Gamboa, E.; Costin, W.; Law, M.; Luzin, V.; Linton, V. Microstructural and mechanical factors influencing high pH stress corrosion cracking susceptibility of low carbon line pipe steel. Eng. Fail. Anal. 2014, 45, 283–291. [Google Scholar] [CrossRef]
- Carretero Olalla, V.; Bliznuk, V.; Sanchez, N.; Thibaux, P.; Kestens, L.A.I.; Petrov, R.H. Analysis of the strengthening mechanisms in pipeline steels as a function of the hot rolling parameters. Mater. Sci. Eng. A 2014, 604, 46–56. [Google Scholar] [CrossRef]
- Faraji, G.; Mashhadi, M.M.; Bushroa, A.R.; Babaei, A. TEM analysis and determination of dislocation densities in nanostructured copper tube produced via parallel tubular channel angular pressing process. Mater. Sci. Eng. A 2013, 563, 193–198. [Google Scholar] [CrossRef]
- Graça, S.; Colaço, R.; Carvalho, P.A.; Vilar, R. Determination of dislocation density from hardness measurements in metals. Mater. Lett. 2008, 62, 3812–3814. [Google Scholar] [CrossRef]
- Alipooramirabad, H.; Paradowska, A.M.; Ghomashchi, R.; Kotousov, A.; Hoye, N. Prediction of welding stresses in WIC test and its application in pipelines. Mater. Sci. Technol. 2016, 32, 1462–1470. [Google Scholar] [CrossRef]
- Nix, W.D.; Gao, H. Indentation size effects in crystalline materials: A law for strain gradient plasticity. J. Mech. Phys. Solids 1998, 46, 411–425. [Google Scholar] [CrossRef]
- Arafin, M.A.; Szpunar, J.A. A new understanding of intergranular stress corrosion cracking resistance of pipeline steel through grain boundary character and crystallographic texture studies. Corros. Sci. 2009, 51, 119–128. [Google Scholar] [CrossRef]
- Kamikawa, N.; Sato, K.; Miyamoto, G.; Murayama, M.; Sekido, N.; Tsuzaki, K.; Furuhara, T. Stress-strain behavior of ferrite and bainite with nano-precipitation in low carbon steels. Acta Mater. 2015, 83, 383–396. [Google Scholar] [CrossRef]
- Liu, G. Designing with Carbon-, Low-, and Medium-alloy Steels. In Handbook of Mechanical Alloy Design; Totten, G.E., Xie, L., Funatani, K., Eds.; Taylor & Francis Inc., Marcel Dekker Inc.: New York, NY, USA, 2004; pp. 73–89. [Google Scholar]
- Pickering, F.B. Physical Metallurgy and the Design of Steels; Applied Science Publishers: London, UK, 1978; p. 63. [Google Scholar]
- Bhadeshia, H.K.D.H. Models for the Elementary Mechanical Properties of Steel Welds; Institute of Materials: London, UK, 1997; pp. 229–284. [Google Scholar]
- Altuna, M.A.; Iza-Mendia, A.; Gutierrez, I. Precipitation strengthening produced by the formation in ferrite of Nb carbides. In Proceedings of the 3rd International Conference on Thermomechanical Processing of Steels, Padova, Italia, 10–12 September 2008. [Google Scholar]
- Gladshtein, L.I.; Larionova, N.P.; Belyaev, B.F. Effect of ferrite-pearlite microstructure on structural steel properties. Metallurgist 2012, 56, 579–590. [Google Scholar] [CrossRef]
- Yang, J.R.; Bhadeshia, H.K.D.H. The dislocation density of acicular ferrite in steel welds. Weld. Res. Suppl. 1990, 69, 305s–307s. [Google Scholar]
- Zhao, M.C.; Hanamura, T.; Qiu, H.; Nagai, K.; Yang, K. Grain growth and Hall-Petch relation in dual-sized ferrite/cementite steel with nano-sized cementite particles in a heterogeneous and dense distribution. Scr. Mater. 2006, 54, 1193–1197. [Google Scholar] [CrossRef]
- Hashemi, S.H. Strength–hardness statistical correlation in API X65 steel. Mater. Sci. Eng. A 2011, 528, 1648–1655. [Google Scholar] [CrossRef]
- Saleem, B.; Ahmed, F.; Rafiq, M.A.; Ajmal, M.; Ali, L. Stress corrosion failure of an X52 grade gas pipeline. Eng. Fail. Anal. 2014, 46, 157–165. [Google Scholar] [CrossRef]
- Zheng, W.; Elboujdaini, M.; Revie, R.W. Stress corrosion cracking in pipelines. In Stress Corrosion Cracking; Raja, V.S., Shoji, T., Eds.; Woodhead Publishing Ltd.: Cambridge, UK, 2011; pp. 749–771. [Google Scholar]
- Standard Practice. Stress Corrosion Cracking (SCC) Direct Assessment Methodology; NACE International: Houston, TX, USA, 2008; ISBN 1-57590-191-9. [Google Scholar]
- Fessler, R.R. Combination of conditions causes stress-corrosion cracking. Oil Gas J. 1976, 74, 81–83. [Google Scholar]
- Wells, D.B. SCC threshold stress in line pipe steels. In Proceedings of the 8th Symposium on Line Pipe Research, Houston, TX, USA, 26–29 September 1993. [Google Scholar]
Figure 1.
Microstructure of X52, typically consisting of ferrite (in white) and pearlite (in black).
Figure 1.
Microstructure of X52, typically consisting of ferrite (in white) and pearlite (in black).
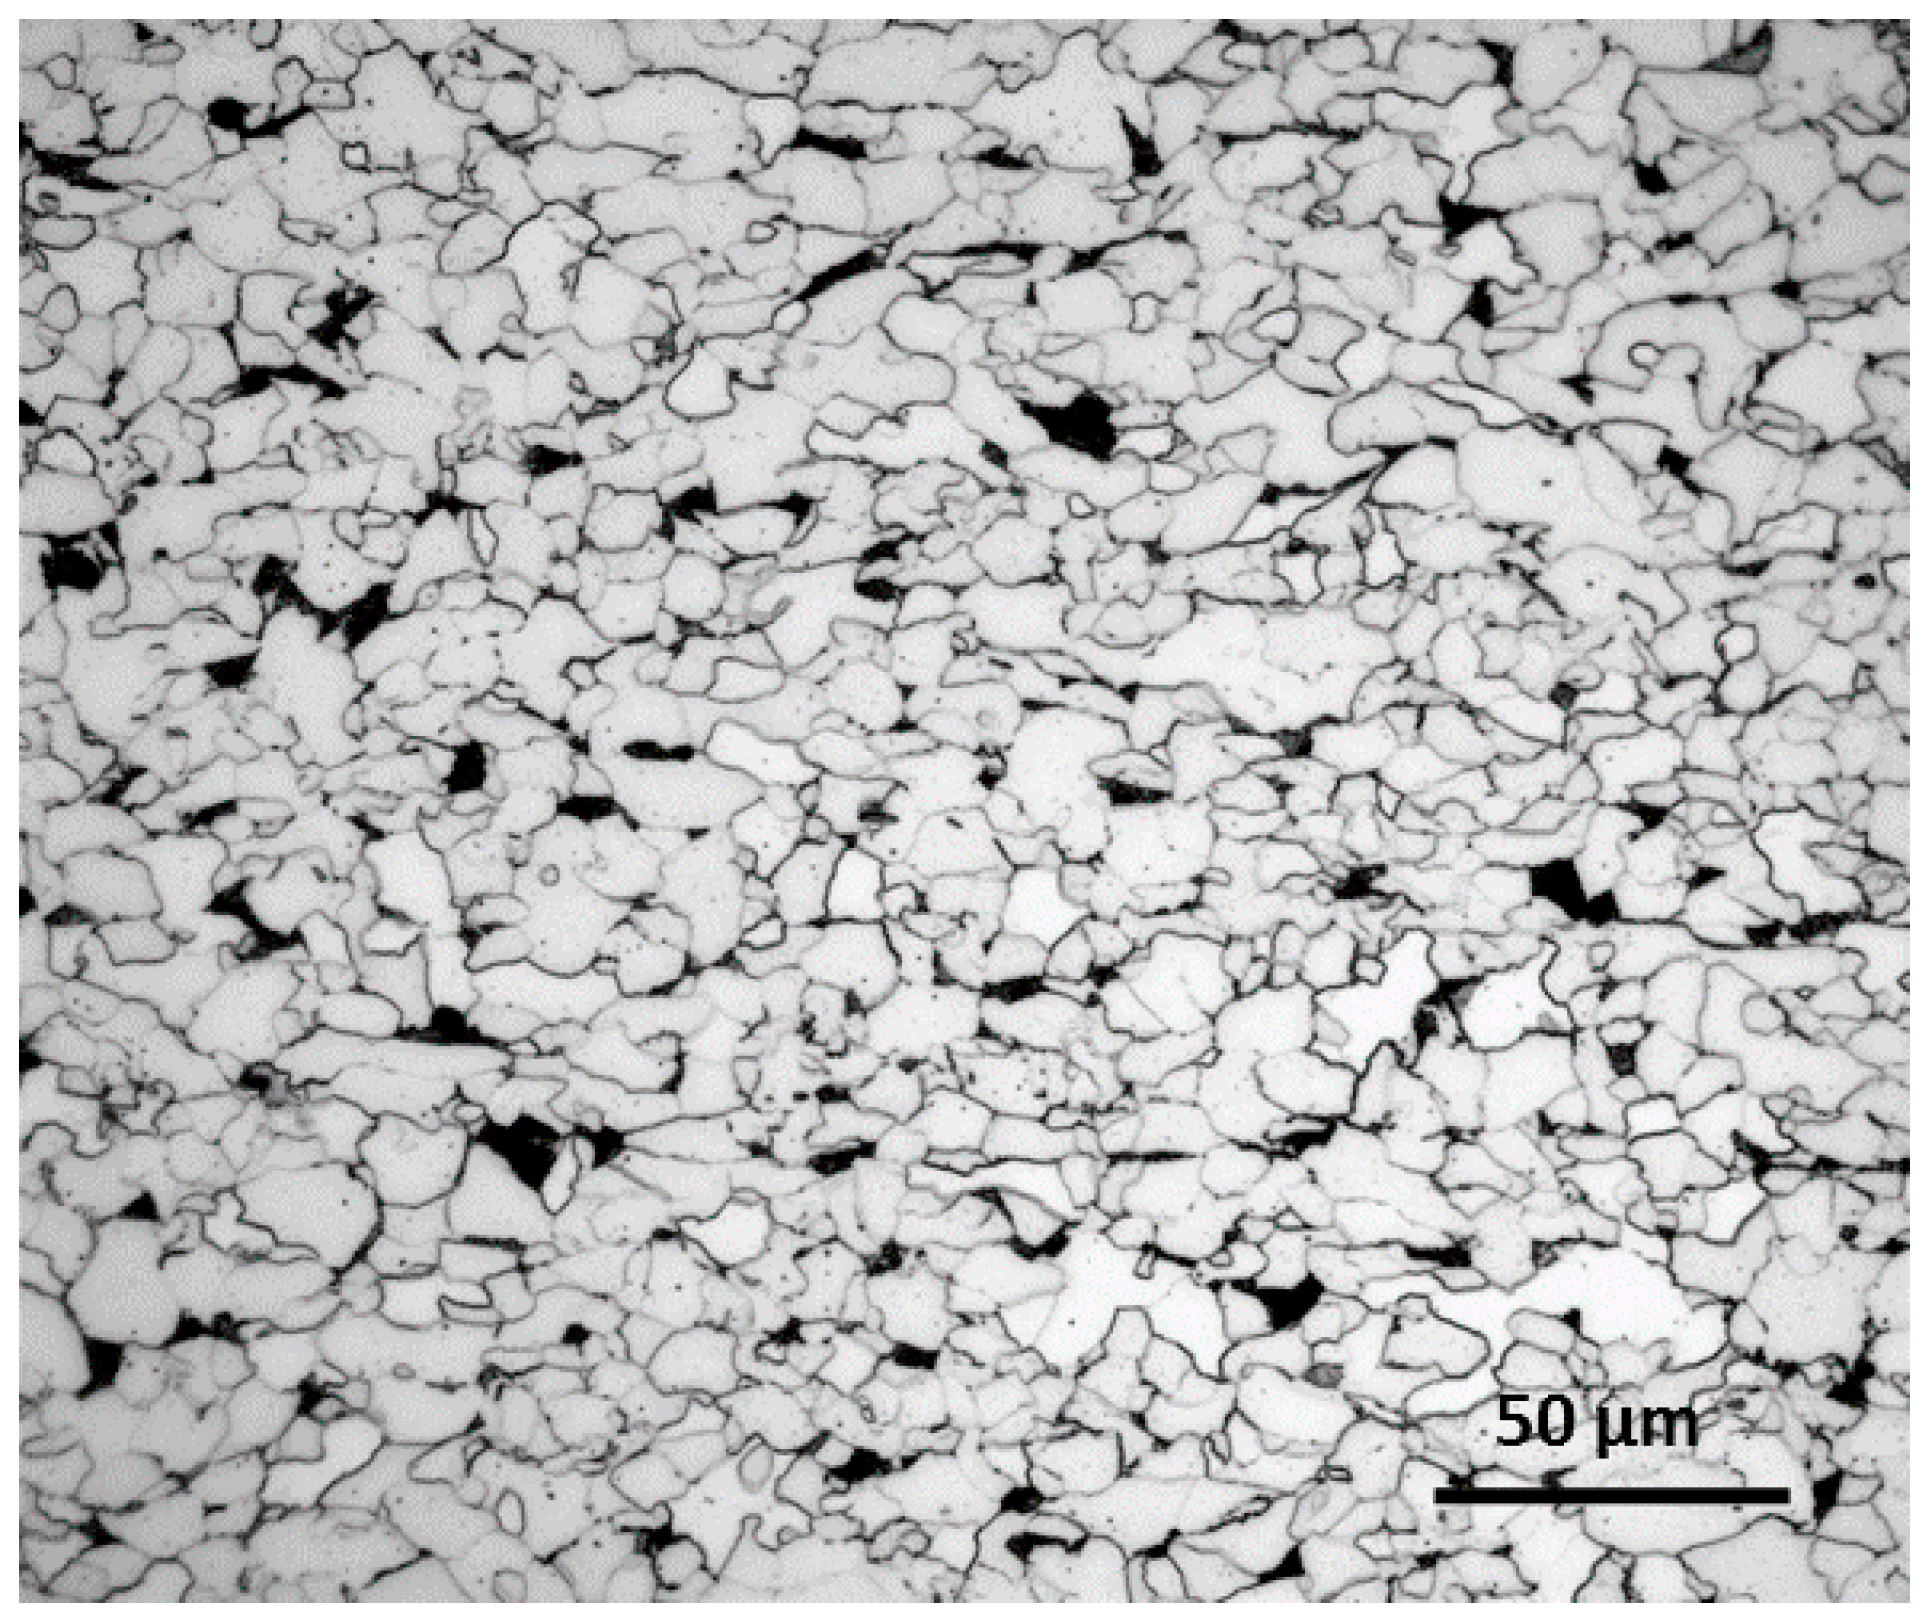
Figure 2.
Electron back-scatter diffraction (EBSD) scan: (a) Qualitative view of the texture (001 inverse pole figure (IPF) map); (b) grain boundary orientations.
Figure 2.
Electron back-scatter diffraction (EBSD) scan: (a) Qualitative view of the texture (001 inverse pole figure (IPF) map); (b) grain boundary orientations.
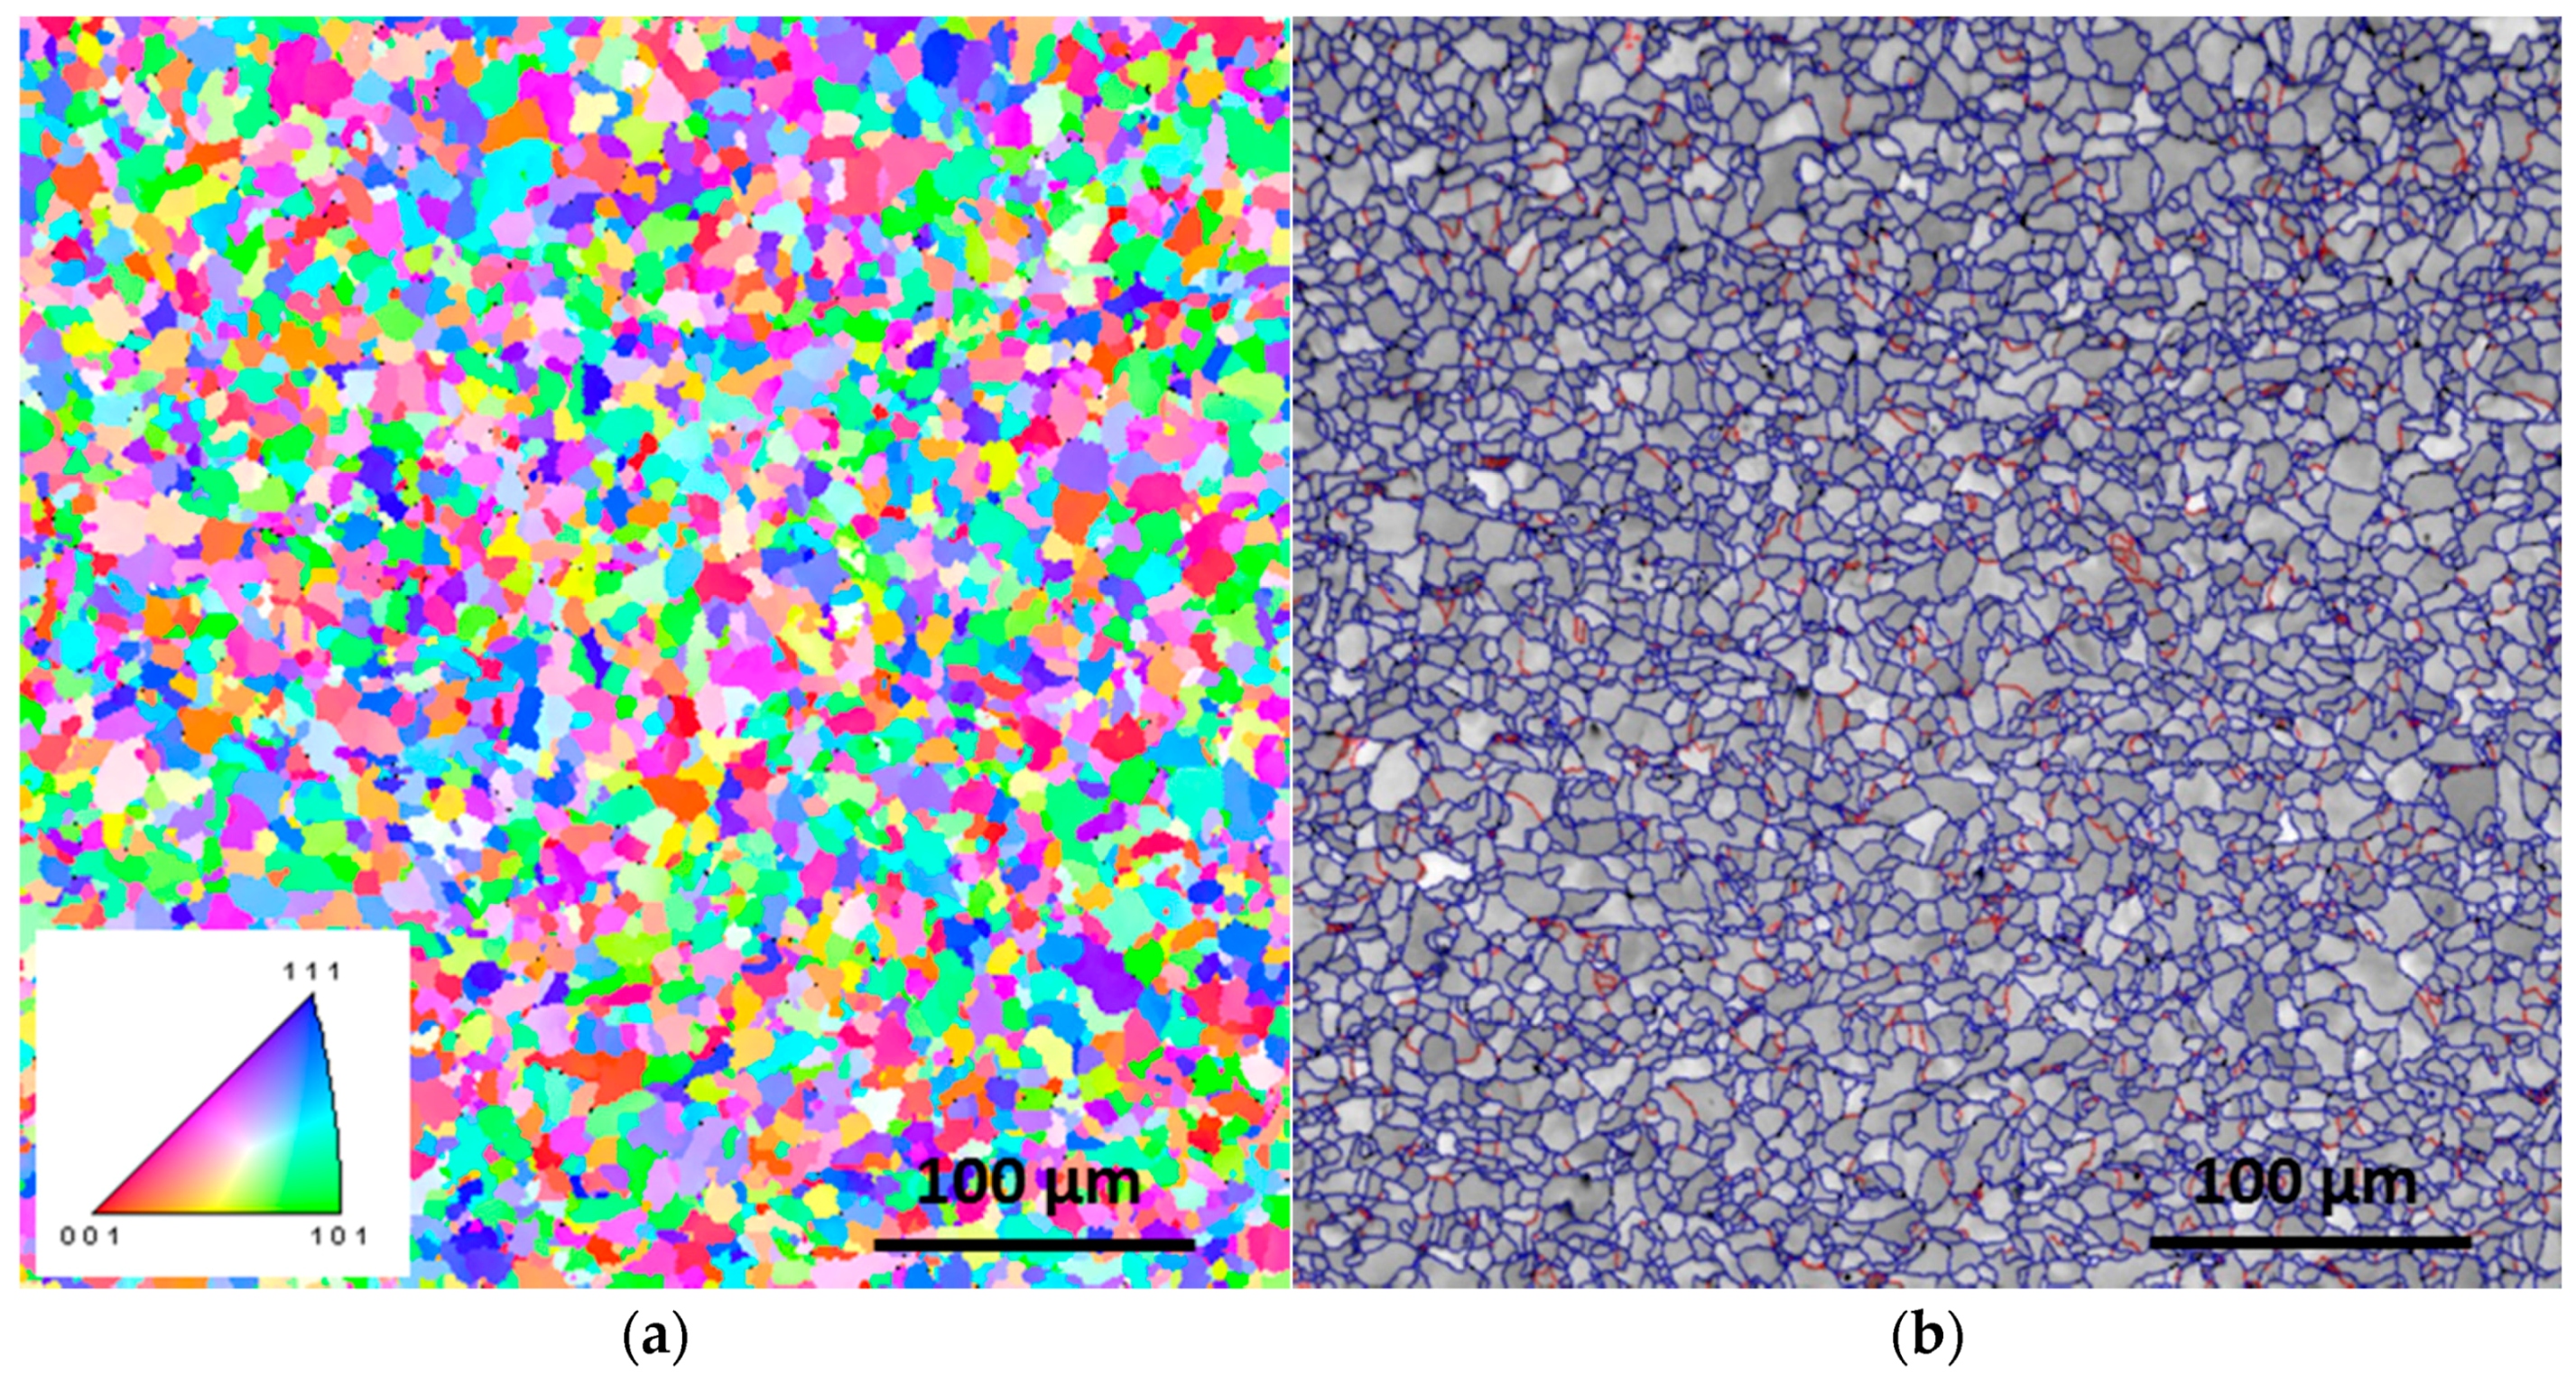
Figure 3.
Indentation size effect and fitting of Equation (1) for the X52 steel.

Figure 4.
Residual stresses profiles in the hoop direction for the X52 steel: (a) Measured for the sample cut out of the pipe ring; (b) Plotted including the bending pipe linear distribution stress.
Figure 4.
Residual stresses profiles in the hoop direction for the X52 steel: (a) Measured for the sample cut out of the pipe ring; (b) Plotted including the bending pipe linear distribution stress.
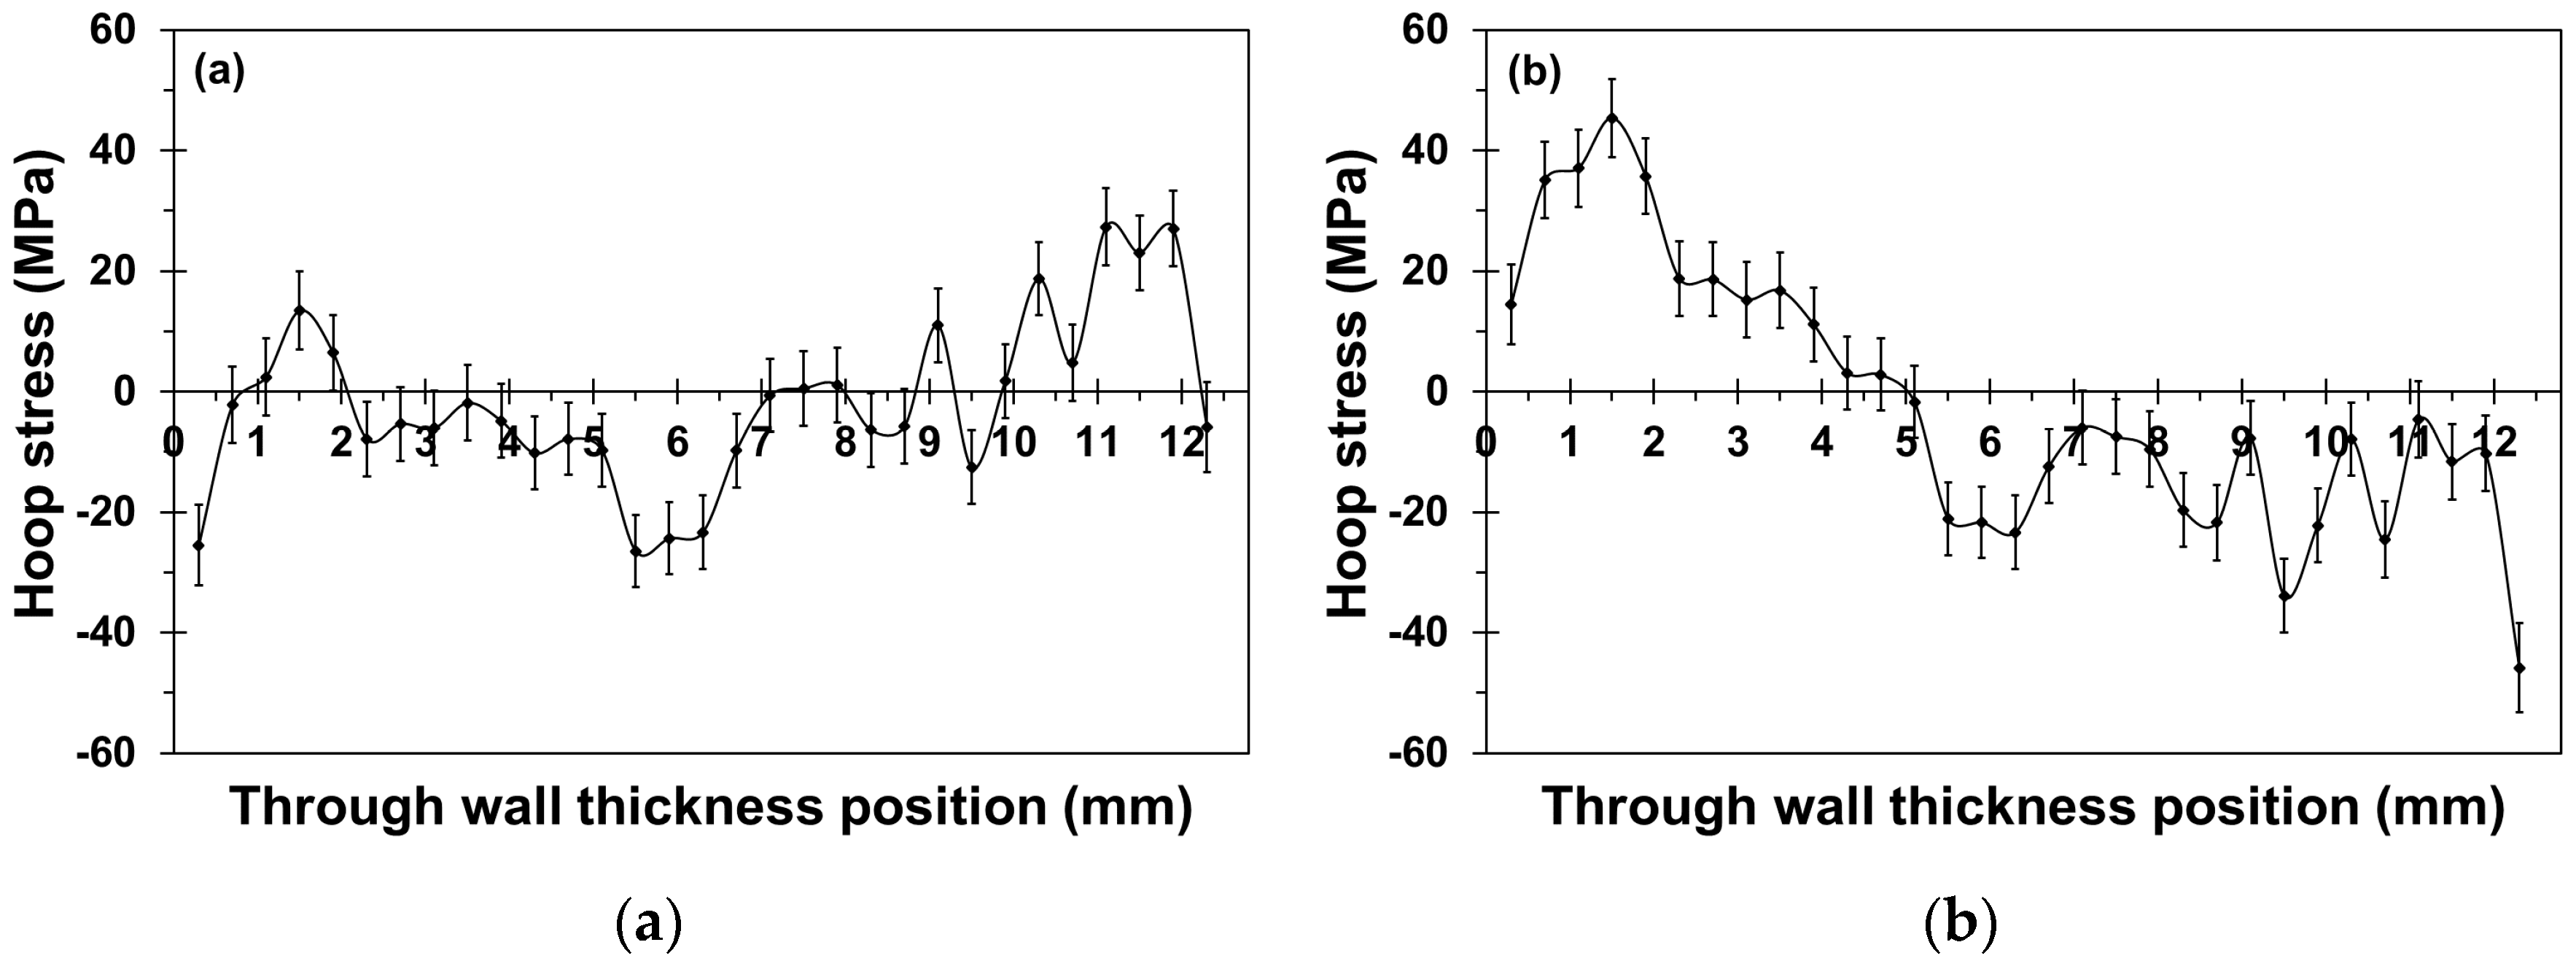
Figure 5.
ODFs at φ2 = 45° section: (a) At the outer surface (OS); (b) At 0.8 mm from OS; (c) At 1.2 mm from OS; (d) At the pipe central line; (e) At 1.2 mm from inner surface (IS); (f) At 0.8 mm from IS; (g) At the inner surface; (h) Schematic representation of the major texture components (where ND, TD, and RD are, respectively, the normal, transverse, and rolling directions).


Table 1.
Measured chemical composition (wt %) for the X52 pipeline steel.
| Element | C | P | Mn | S | Cu | Ni | Cr | Mo | Al | Ti | V | Si | Nb | Fe |
|---|---|---|---|---|---|---|---|---|---|---|---|---|---|---|
| wt % | 0.075 | 0.014 | 0.95 | 0.003 | 0.01 | 0.01 | 0.015 | Tr. | 0.021 | 0.014 | 0.0015 | 0.226 | 0.013 | Bal. |
Table 2.
Tensile tests results (provided by the manufacturer).
| Orientation | Yield Strength (MPa) | Tensile Strength (MPa) | Elongation (%) |
|---|---|---|---|
| Longitudinal | 400 | 500 | 32 |
| Transverse | 395 | 490 | 42 |
Table 3.
Coefficient (B) of precipitation strengthening, from [13].
Table 3.
Coefficient (B) of precipitation strengthening, from [13].
| Solute and Precipitate | Bmax (MPa/wt %) | Bave (MPa/wt %) | Solute Concentration (wt %) |
|---|---|---|---|
| V as V4C3 | 1000 | 500 | 0–0.15 |
| V as VN | 3000 | 1500 | 0–0.06 |
| Nb as Nb(CN) | 3000 | 1500 | 0–0.05 |
| Ti as TiC | 3000 | 1500 | 0.03–0.18 |
© 2017 by the authors. Licensee MDPI, Basel, Switzerland. This article is an open access article distributed under the terms and conditions of the Creative Commons Attribution (CC BY) license (http://creativecommons.org/licenses/by/4.0/).
Share and Cite
MDPI and ACS Style
Lavigne, O.; Kotousov, A.; Luzin, V. Microstructural, Mechanical, Texture and Residual Stress Characterizations of X52 Pipeline Steel. Metals 2017, 7, 306. https://doi.org/10.3390/met7080306
AMA Style
Lavigne O, Kotousov A, Luzin V. Microstructural, Mechanical, Texture and Residual Stress Characterizations of X52 Pipeline Steel. Metals. 2017; 7(8):306. https://doi.org/10.3390/met7080306
Chicago/Turabian StyleLavigne, Olivier, Andrei Kotousov, and Vladimir Luzin. 2017. "Microstructural, Mechanical, Texture and Residual Stress Characterizations of X52 Pipeline Steel" Metals 7, no. 8: 306. https://doi.org/10.3390/met7080306
Note that from the first issue of 2016, this journal uses article numbers instead of page numbers. See further details here.