Surface Characterization and Corrosion Resistance of 36Cr-Ni-Mo4 Steel Coated by WC-Co Cermet Electrode Using Micro-Electro Welding

Department of Materials Engineering, University of Tabriz, Tabriz 51368, Iran
*
Author to whom correspondence should be addressed.
Metals 2017, 7(8), 308; https://doi.org/10.3390/met7080308
Submission received: 5 July 2017
/
Revised: 24 July 2017
/
Accepted: 25 July 2017
/
Published: 12 August 2017
(This article belongs to the Special Issue Cermets and Hardmetals)
Abstract
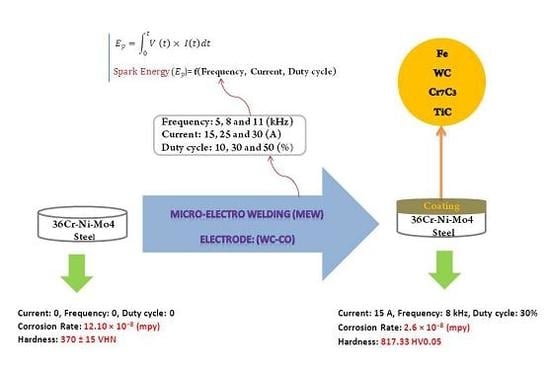
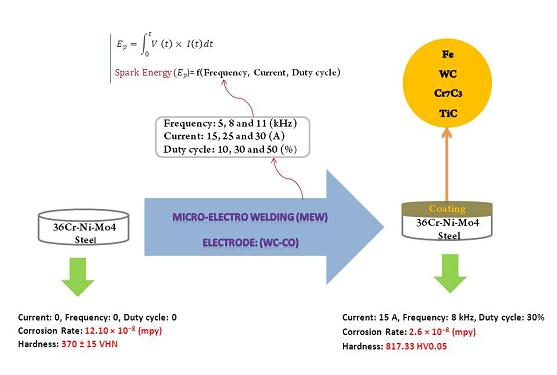
:In this paper the influence of spark energy on corrosion resistance, hardness, surface roughness and morphology of WC-Co coated 36Cr-Ni-Mo4 steel by Micro-Electro Welding (MEW) was investigated. Frequencies of 5, 8 and 11 kHz, currents of 15, 25 and 35 A and duty cycles of 10, 30 and 50 % were applied for coating of the samples using a WC-Co cermet electrode. The results indicate that increasing the current, Duty cycle and frequency of the process increases spark energy. As spark energy increases, efficiency of coating increases to 80% and then decreases. X-ray diffraction (XRD) analysis was used to identify the phases. The results indicated that other than the peaks obtained for the metallic Iron with BCC (Body Centered Cubic) structure, Tungsten Carbide, Cr7C3 and Titanium Carbide phases were also seen on the surface. Vickers micro hardness method was used for hardness measurement of the samples. Surface hardness increases to 817.33 HV0.05 with spark energy increasing up to 1.03 mJ, and then reducing. Optical Microscopy (OM) and scanning electron microscopy (SEM) to study Microstructural and atomic force microscopy (AFM) to study the topography, morphology and roughness were used. Polarization technique in 3.5 wt % NaCl solution was used to evaluate the corrosion properties. The results of the energy dispersive X-ray spectroscopy (EDS) analysis indicate that with increasing spark energy, the amount of Tungsten in surface increases to 41.95 wt % and then decreases. As spark energy increases up to 2.17 mJ, thickness of coating increases to 8.31 μm and then decreases. As spark energy increases, surface roughness is also increased. Corrosion test results indicated that the lowest corrosion rate (2.6 × 10⁻⁸ mpy) is related to the sample with the highest level of efficiency.
1. Introduction
36Cr-Ni-Mo4 steel is one of the high strength steels. 36Cr-Ni-Mo4 steel has applications in the automotive industry, manufacturing of valve and gate valves, cylinders for combustion engines, superheated steam valves and fittings due to high strength to weight ratio and good ductility. Most defects for high strength steels are due to corrosion, wear and fatigue. Also, this group of steels has always been under thermal stress [1]. In a study on wear behavior of H11 tool steel, Barau et al. [2] concluded that the main reason of metal surface destruction under 500 °C is oxidizing wear. Podgornik et al. [3] improved the wear resistance of tool steel using plasma nitriding. Elsaran et al. [4] observed that the friction coefficient was 0.5 and the wear resistance increased with the aging of nitrided 4140 steel for 0.5 h. An approach to enhancing the surface characterization of steels is coating by different methods. Cristiane de Souza Brandolt et al. [5] produced Niobium coating on API 5CTP110 steel using high velocity oxygen fuel (HVOF) thermal spraying. Hard Chromium coating is a common coating for high strength steels, however existing microcracks decrease the corrosion resistance because the corrosive solution pass through them and reach to substrate [6,7]. Therefore scientists use combined processes. These methods commonly have been used to improve the wear/corrosion resistance of tool and die steels. To reach the expected improvement, it is suggested to use a combination of thermochemical and deposition methods [8,9,10,11]. Han et al. [12] formed the Chromium Nitride coating on 4140 steel, with and without primary hard Chromium coating using cathode arc. They observed that Chromium Nitride coating hardness in both cases is approximately three times bigger than the primary hard Chromium coating. Also, the corrosion/wear resistance of Chromium Nitride/ hard Chromium coating was better than both Chromium Nitride and primary hard Chromium coating. Chiu et al. [13,14] also indicated that Chromium Nitride coatings have better wear resistance than hard Chromium coatings. Since the adhesion of the Chromium Nitride coating and substrate is low therefore the wear resistance of the Chromium Nitride coating is reduced when the applied load is higher than the critical value [15]. Another kind of coatings are cermets, which have characteristics such as high hardness, high wear resistance, low friction coefficient and high corrosion resistance which have lead to their wide use in different industries [16,17]. Some examples are Cr3C2-NiCr cermet carbide coating on AISI 316 Molybdenum steel using HVOF thermal spray and TiC-Fe cermet coating on 304 stainless steel using electrical discharge coating (EDC) [18,19]. Espallargas et al. [20] replaced hard Chromium coating with cermet coatings (WC-Ni, Cr3C2-Ni-Cr) on UNS-G41350 steel and improved wear resistance and corrosion resistance but these coatings had some porosity and cracks. In this case, on the surface of the coating the corrosive materials penetrate through the thickness and sometimes reach to the interface and to the substrate. To solve the problem, new methods are now available like micro-electric welding (MEW) which is also known as electrical spark deposition (ESD), electrical spark hardening (ESH) and electrical spark alloying (ESA). In 1994, MEW was used in the Soviet Union to increase the life time of many parts such as lathe parts which were exposed to wear. According to studies on this method, the frequency of deposition can be chosen between 60 Hz and 4 kHz, spark energy between 1 and 10 J and the thickness of the coat 3 μm to 3 mm. Deposition rate in the MEW process is substantially dependent on the material used as cathode and anode and some other electrical properties of the process. Rapid solidification of the deposition usually leads to nano-structured materials and sometimes even amorphous materials. The wear resistance and corrosion resistance of these coatings are higher than materials with a normal crystalline structure, because of smaller grain and higher yield strength [21]. Johnson et al. [22] welded stainless steel (Aluminum < 35 wt %) and Aluminum by using MEW while these are not weldable with normal methods. Nowadays, MEW and its branches are used in the automotive industry to form coatings on the valves in combustion engines, in aerospace to increase the fatigue life and also in nuclear energy applications to prevent wear and resist against damaging [16,21,22,23,24,25,26,27]. Some examples are Mo2FeB2-based cermet coating on high speed steel substrate and Chromium carbide-based coating on the microalloy steel using ESD [28,29]. The WC-Co-Al2O3 coating (60–70 μm) produced by ESD increased the hardness, wear resistance and corrosion resistance of the C45 steel. Also the Titanium Carbide coating produced by ESA increased the hardness, wear resistance and corrosion resistance of the Ti-6Al-4V [30,31]. The Cr7C3 coating produced by MEW increased the roughness (from 5 to 20 μm), hardness (up to 1100 Hv) and corrosion resistance of the 304 stainless steel [32]. MEW is also used in high-temperature applications. In this field, Ohen et al. [33] coated copper electrode by Ni-TiC using MEW and observed that the coating prevented the reaction between Copper and Zinc. The reaction between Copper and Zinc occurred when the coated steel by zinc was welded using copper electrode. In this work 36Cr-Ni-Mo4 steel was coated by WC-Co cermet electrode using MEW. The effect of spark energy changes on surface characterization and corrosion resistance of 36Cr-Ni-Mo4 steel was investigated. Spark energy depends on the current, frequency and duty cycle of the process.
2. Material and Methods
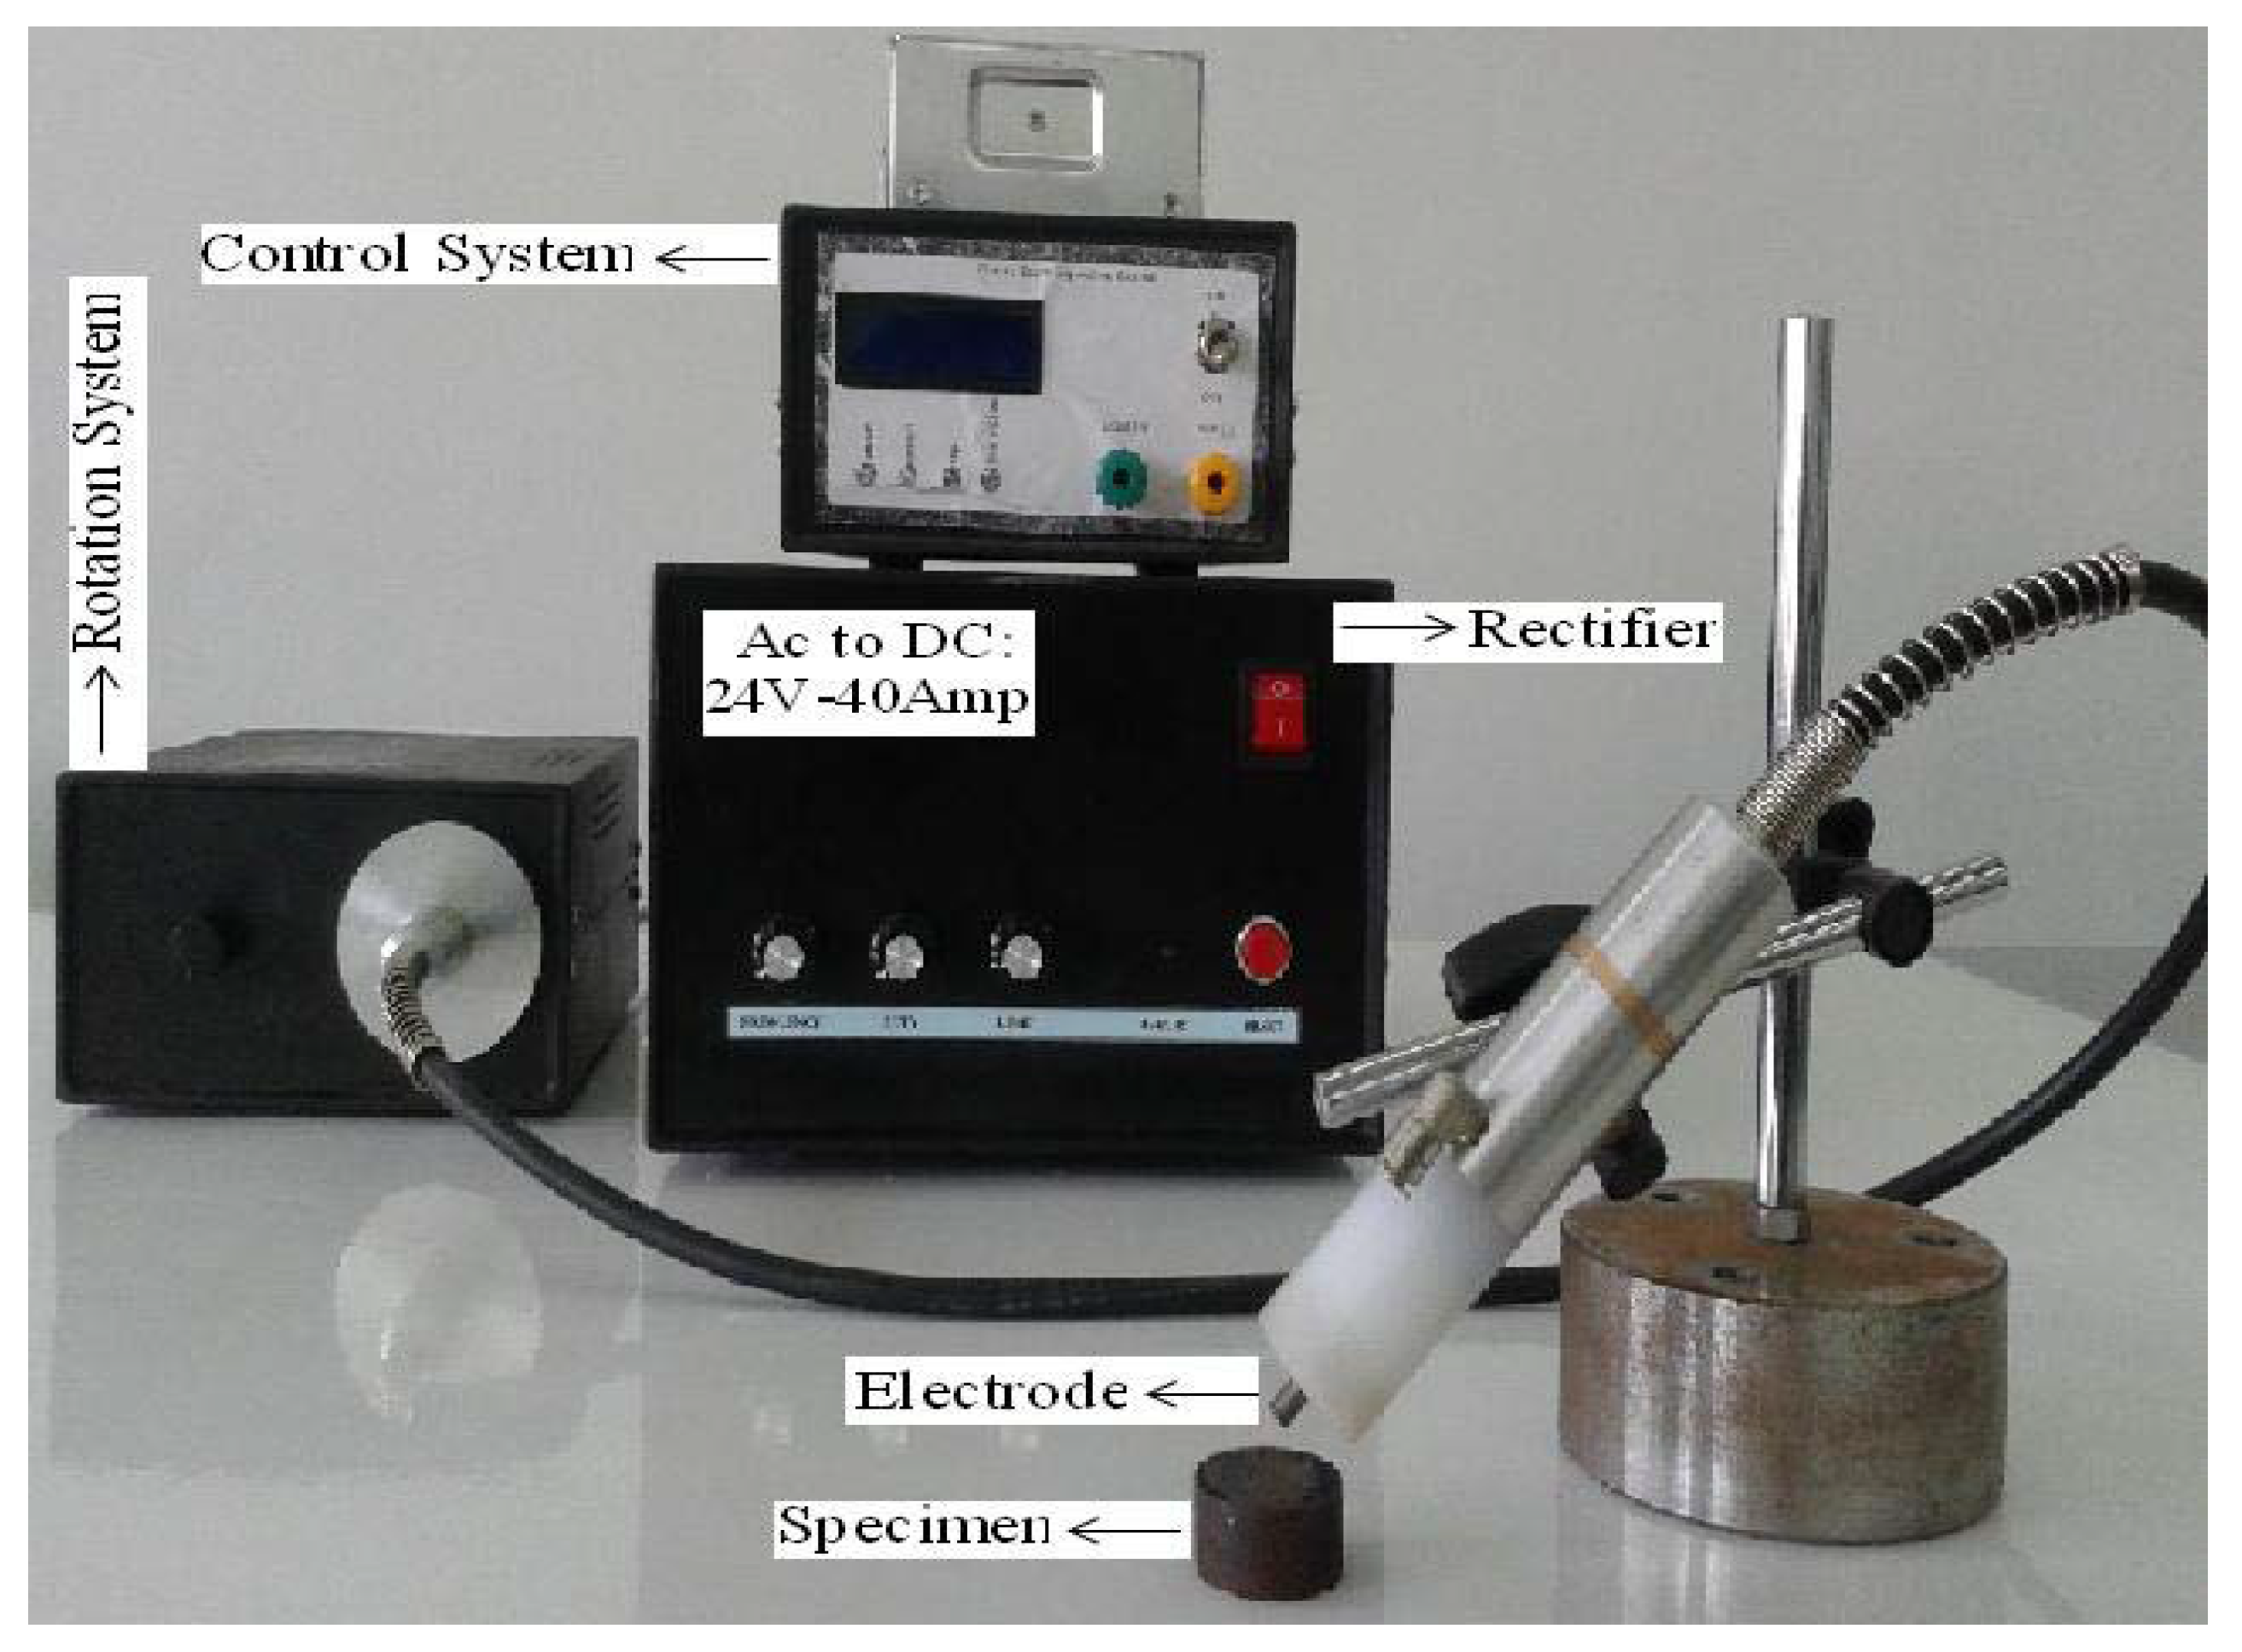
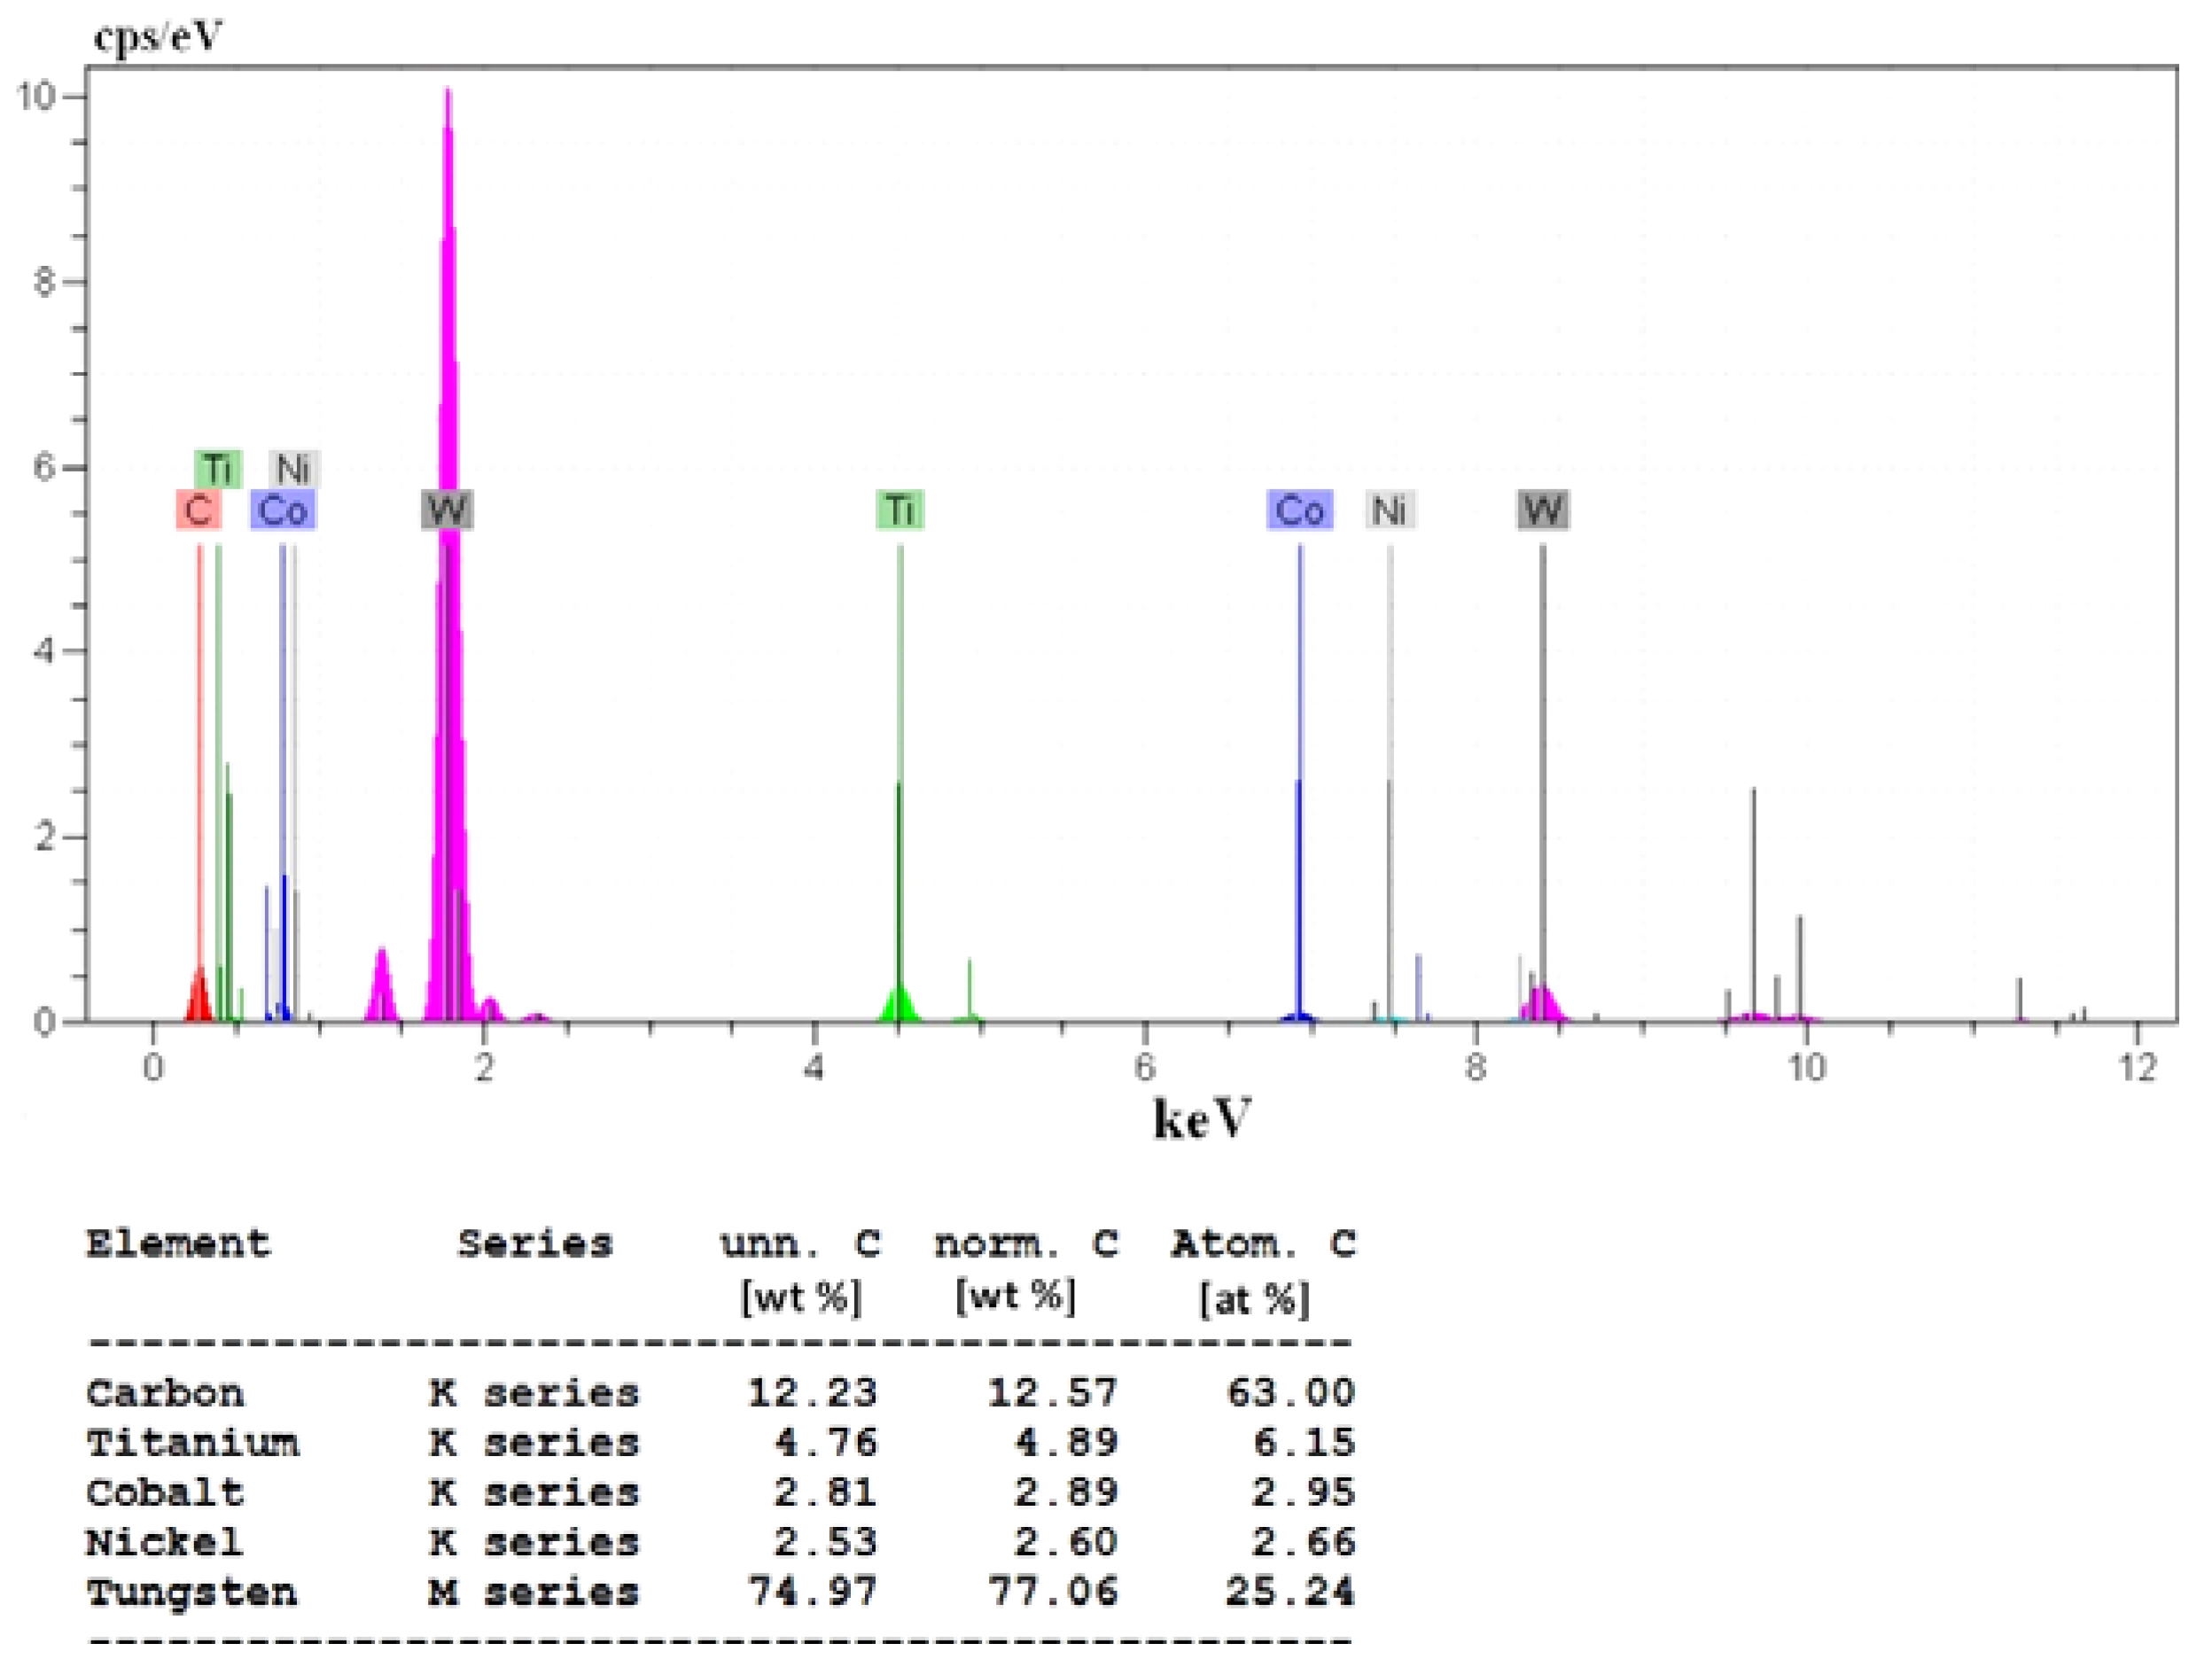
The experimental 36Cr-Ni-Mo4 steel (Reference specimen) with chemical composition given in Table 1 (measured by a SPECTROLAB analyzer, Spectrolab Co., Dusseldorf, Germany) was used as a substrate. Specimen shape was cut in form of disc (Height = 10 mm, Diameter = 30 mm) using wire cut. They were then grounded using various abrasive papers and polished with alumina powder. They were immersed in cold alkaline solution consisting 100 g/L Sodium Hydroxide and 40 g/L Sodium Carbonate. Finally, the specimens were coated with the MEW method. Figure 1 shows the device used in this study. The specimen in the MEW process was placed as cathode. The reference electrode (anode) was Saturated Calomel Electrode (SCE). The results of the EDS analysis (Figure 2) show that the electrode contains a large amount of Tungsten Carbide. In this electrode Cobalt and Nickel can also be seen that are used as binder. With the help of the rotary system the electrode can rotate at a speed of 0–200 rpm. In order to keep the speed of the electrode constant the specimens were fixed on work desk and it was automatically moved at constant speed of 30 mm/min. Direction of desk movement was changed from one side of sample to other side and this action were continued up to complete surface coating. Coating treatment was performed at three frequencies of 5, 8 and 11 kHz, three current limits of 15, 25 and 35 A and three duty cycles of 10, 30 and 50%. Encoding of samples were performed by using three alphabet AFD(A: Ampere, F: Frequency, D: Duty cycle) and a six-digit number that the first two digits from right hand represent the current limit, two middle digits represent the frequency and the left two digits represent the duty cycle (Table 2). The mass of the samples and electrode was calculated before and after each coating stage using digital scale with accuracy of 0.001 g in order to estimate weight difference between cathode and anode to determine coating efficiency. Hardness, roughness, corrosion resistance and surface characteristics of the reference specimen (substrate) and coated specimens (Table 2) was investigated.
Characterization of present phases in the surface of the samples were carried out by X-ray diffraction (XRD, Bruker, Karlsruhe, Germany) analysis with the commercial name of Bruker AXS, Advance D8 and X-ray radiation were performed using a copper target with wave length of 1.54056 Å at voltage of 40 kV and current of 40 mA, step length and step time of 0.05 degree/s. Microhardness measurements were made with vickers hardness tester (Bueh1er Group Co., Uzwil, Switzerland) with commercial name of MX-96604-BUEHLER and were carried out using a test load of 50 g and time of 15 s. Hardness data was collected by taking an average of five to seven indents. Metallographic techniques were employed to reveal cross section of samples. The metallographic pictures were obtained by CARL-ZEISS-4996387 optical microscopy (ZEISS Co., Oberkochen, Germany). Scanning electron microscopy (SEM, Tescan USA Co., Warrendale, PA, USA) with commercial name of ROVENTEC Vega II and EDS detector (Tescan USA Co., Warrendale, PA, USA) were used to explore the surface of electrode, morphology of samples and thickness of coat. Atomic force microscopy (AFM, Anasys Instruments, Santa Barbara, CA, USA) with the commercial name of Nanoscope ® III with a tool tip made of Si3N4, equipped with Nanoscope (R) III Version 5.12r2 software (Santa Barbara, CA, USA), was used to explore topography, morphology and calculate roughness of samples. Just two reference and optimum samples were investigated by AFM and the roughness of other samples were calculated using roughness tester system (Taylor Hosbon Co. Berwyn, PA, USA) with commercial name of SurTonic 25. Finally, to investigate corrosion resistance, polarization corrosion test was conducted in 3.5 wt % of saturated solution of NaCl at room temperature (25 °C). This was carried out by employing the system PARSTAT 2263 (EG & G, Princeton Applied Research, Oak Ridge, TN, USA) at a scanning rate of 0.0002 v·s−1 and potential range of −0.2–0.2 V proportional to open circuit potential (OCP). Zview 310 software (Version 3.5c, Princeton Applied Research, Oak Ridge, TN, USA) was used to analyze data.
3. Calculations
3.1. Spark Energy Calculation
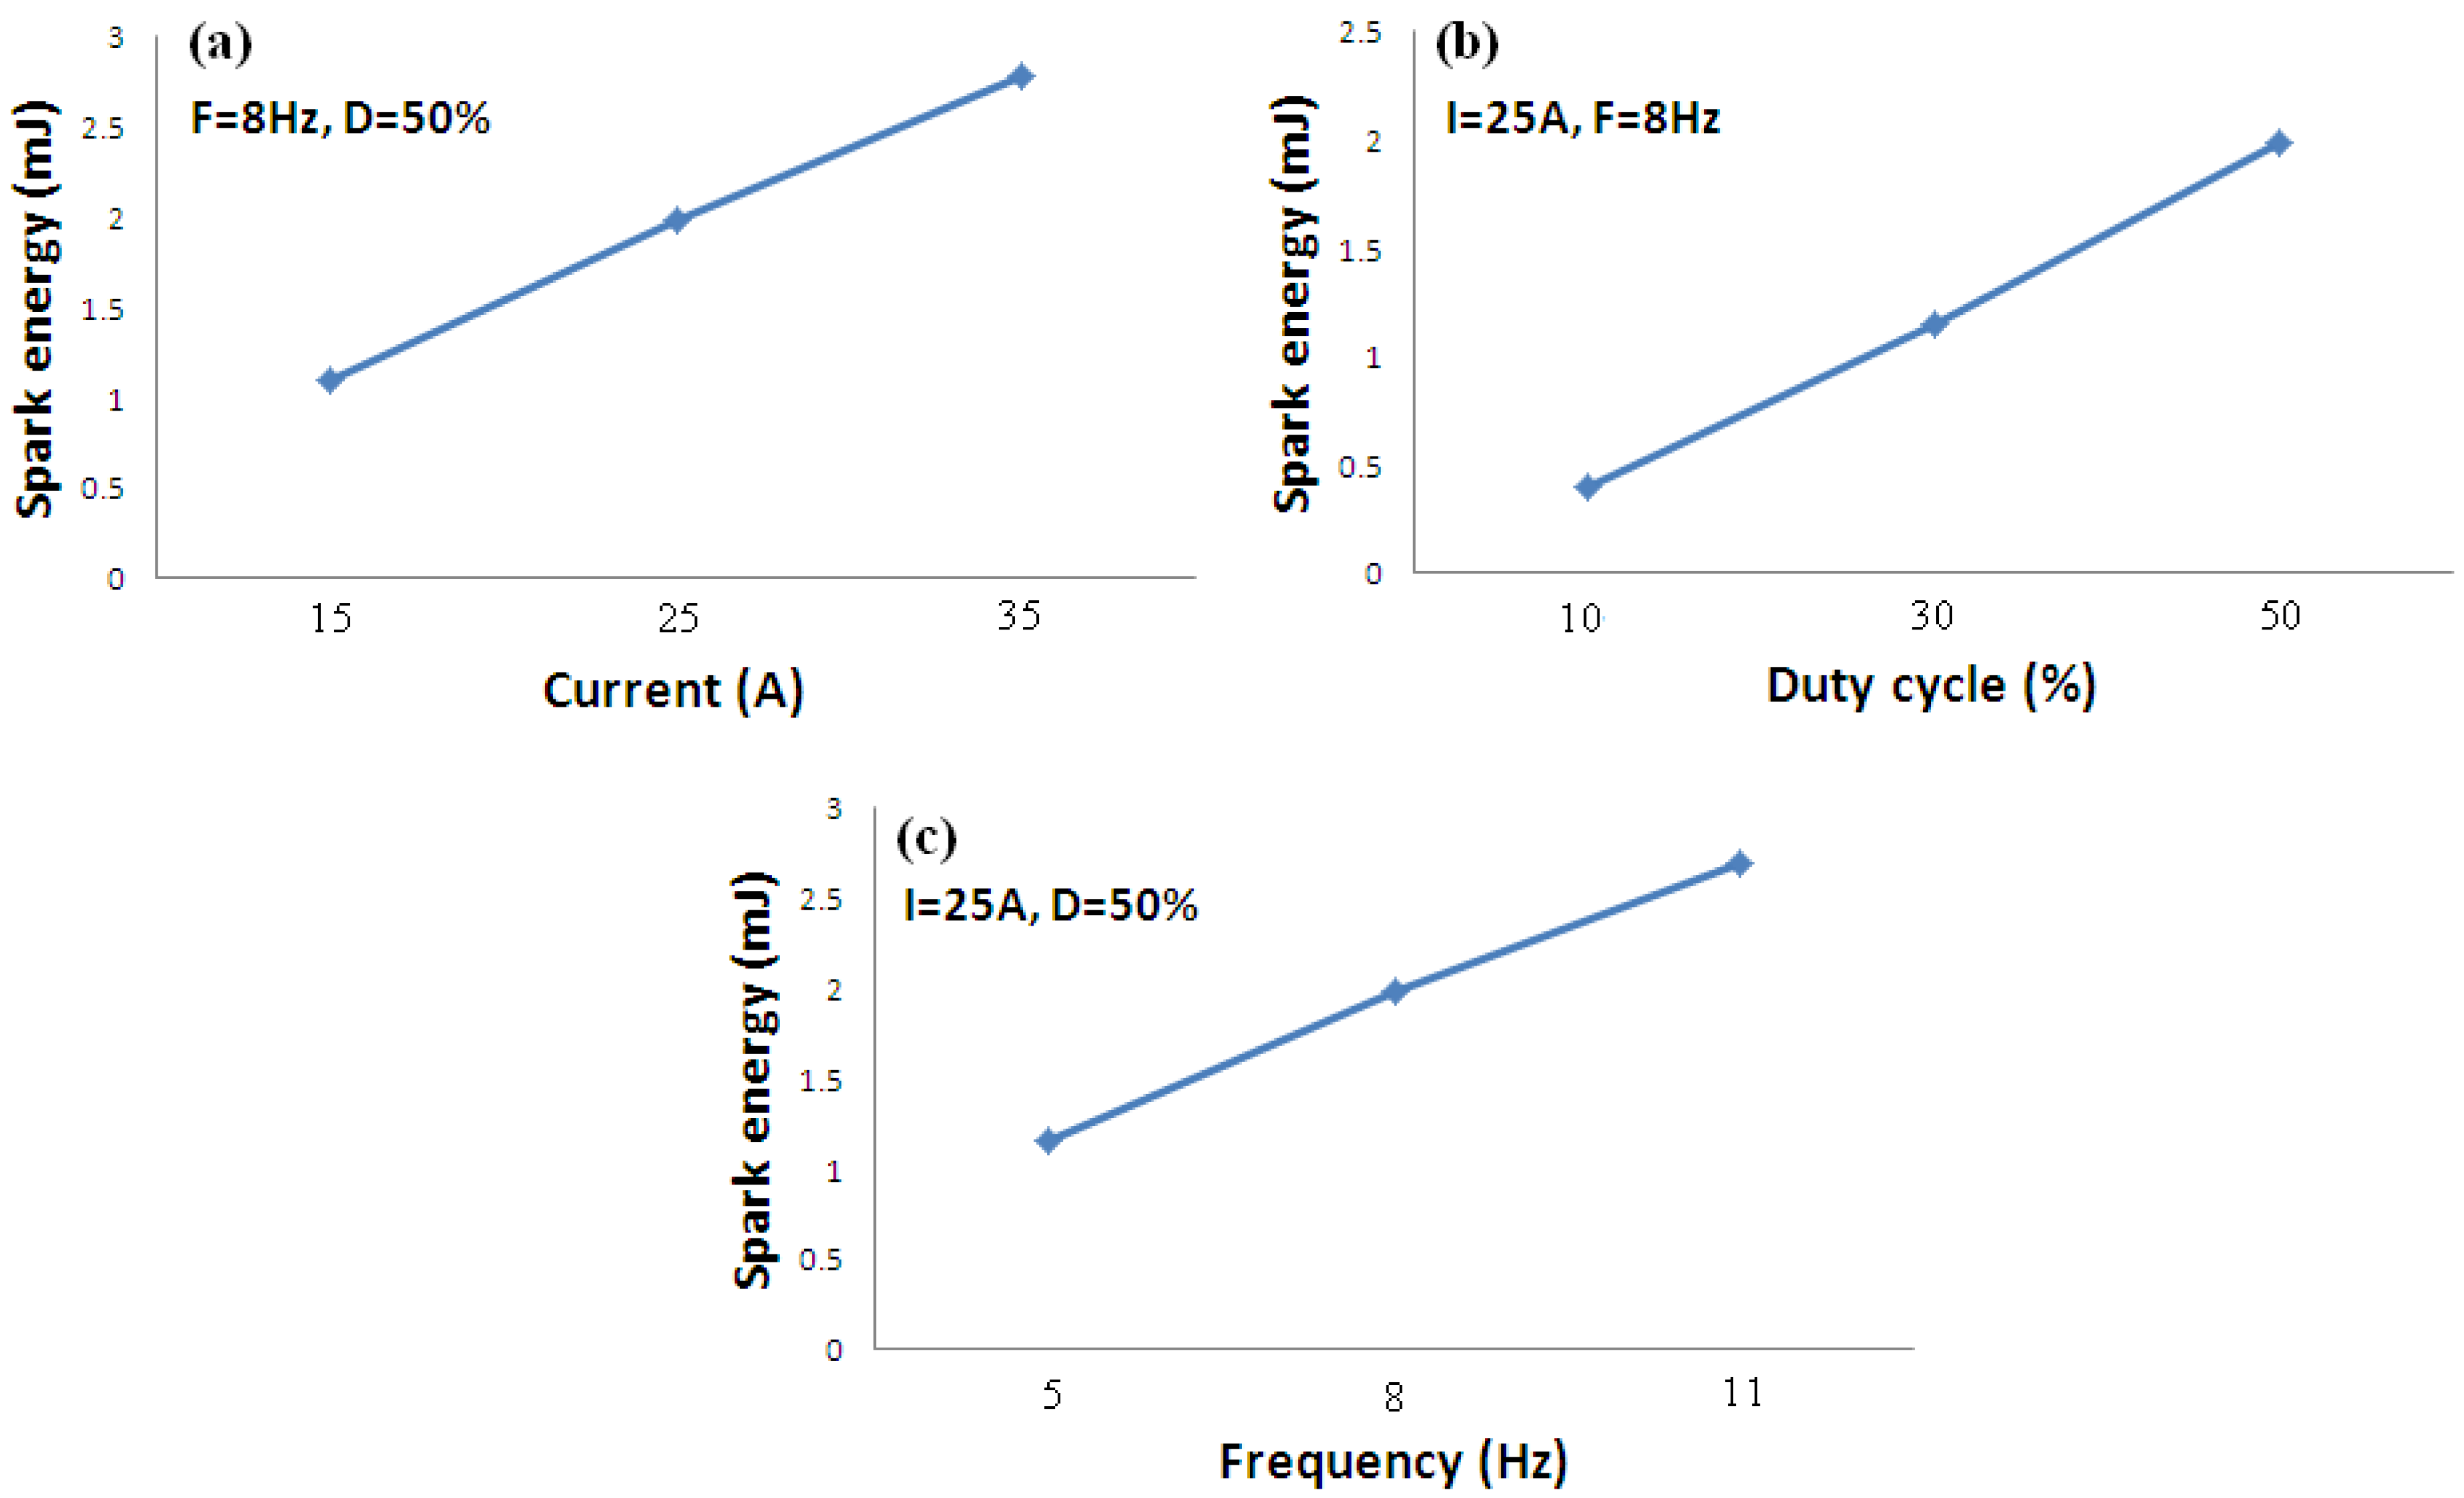
Increase in spark energy can represent the amount of mass separated from anode and amount of incident heat into the cathode. Hence it seems that increase in spark energy will increase the deposition rate. Spark energy (Ep) is represented by expression (1) where V(t) is voltage function by time during discharge, I(t) is current function by time during discharge and t is function by time
during discharge, I(t) is current function by time during discharge and t is pulse time [21]. An oscilloscope system was used to calculate V(t) and I(t) functions, Based on results and shape of voltage curve and current curve. Spark energy approximately increases with the increase of the current limit (Figure 3a), duty cycle (Figure 3b) and frequency (Figure 3c) in a linear relation. As indicated by expression (1) there is a linear relation in increasing spark energy with increase of current. When the duty cycle increases, the time of loading also increases. It has a linear relation with the duty cycle. It means that if the pulse time is the determined value, the duty cycle demonstrates the ratio of time that current is applied on system. Therefore, the duty cycle has a linear relationship with spark energy. The frequency represents the number of pulses in a unit of time. Therefore, pulse number linearly increases the energy in a unit of time. In all conditions, the spark energy was in the range of required energy in the MEW process. It is essential to mention that the chosen currents as a coating parameter show the maximum current that the system can apply in energy spark circuits. Thus it is clear that it shouldn’t be maximum value of itself, this is mentioned by Franjini et al. [34]. With the spark energy calculation (Equation (1)) for every sample of Table 2, it was observed that AFD150550 has the lowest spark energy (Ep: 0.15 J) and sample AFD351150 has the highest spark energy (Ep: 3.75 J).
3.2. Coating Efficiency Calculation
Deposition efficiency for a surface coating with an approximate area of 7.07 cm2 and constant moving rate of electrode tip have been obtained by Equation (2): ×100 (η = deposition efficiency, ∆c = mass changes of cathode and ∆a = mass changes of anode). As shown in Figure 4a with increasing
spark energy, output mass from the anode increases, in other words, with increasing spark energy the weight of the anode reduces. This was predictable according to the increase in spark energy due to the increase in potential of transmission of material from electrode. As shown in Figure 4b, with increasing spark energy up to 2 mJ, the weight of the cathode increases then reduces. As the spark energy increases, particles separated from the anode hit the cathode more strongly. Considering that the surface of the cathode has a certain adhesion, it is believed that in cases of high spark energy, dispersion of separated particles is also high. With the coating efficiency calculation for every sample of Table 2 it was determined that sample AFD150830 has the most coating efficiency. Figure 4c reveals that with increasing spark energy, efficiency of coating increases to 80% and then decreases. Indeed, if deposition efficiency is more than 50% the process is highly efficient, therefore the energy range of 0.5–3.5 mJ has appropriate efficiency. Also reduction of efficiency can be involved in excessive dispersion of separated material.
4. Results and Discussion
4.1. Microstructure Analysis
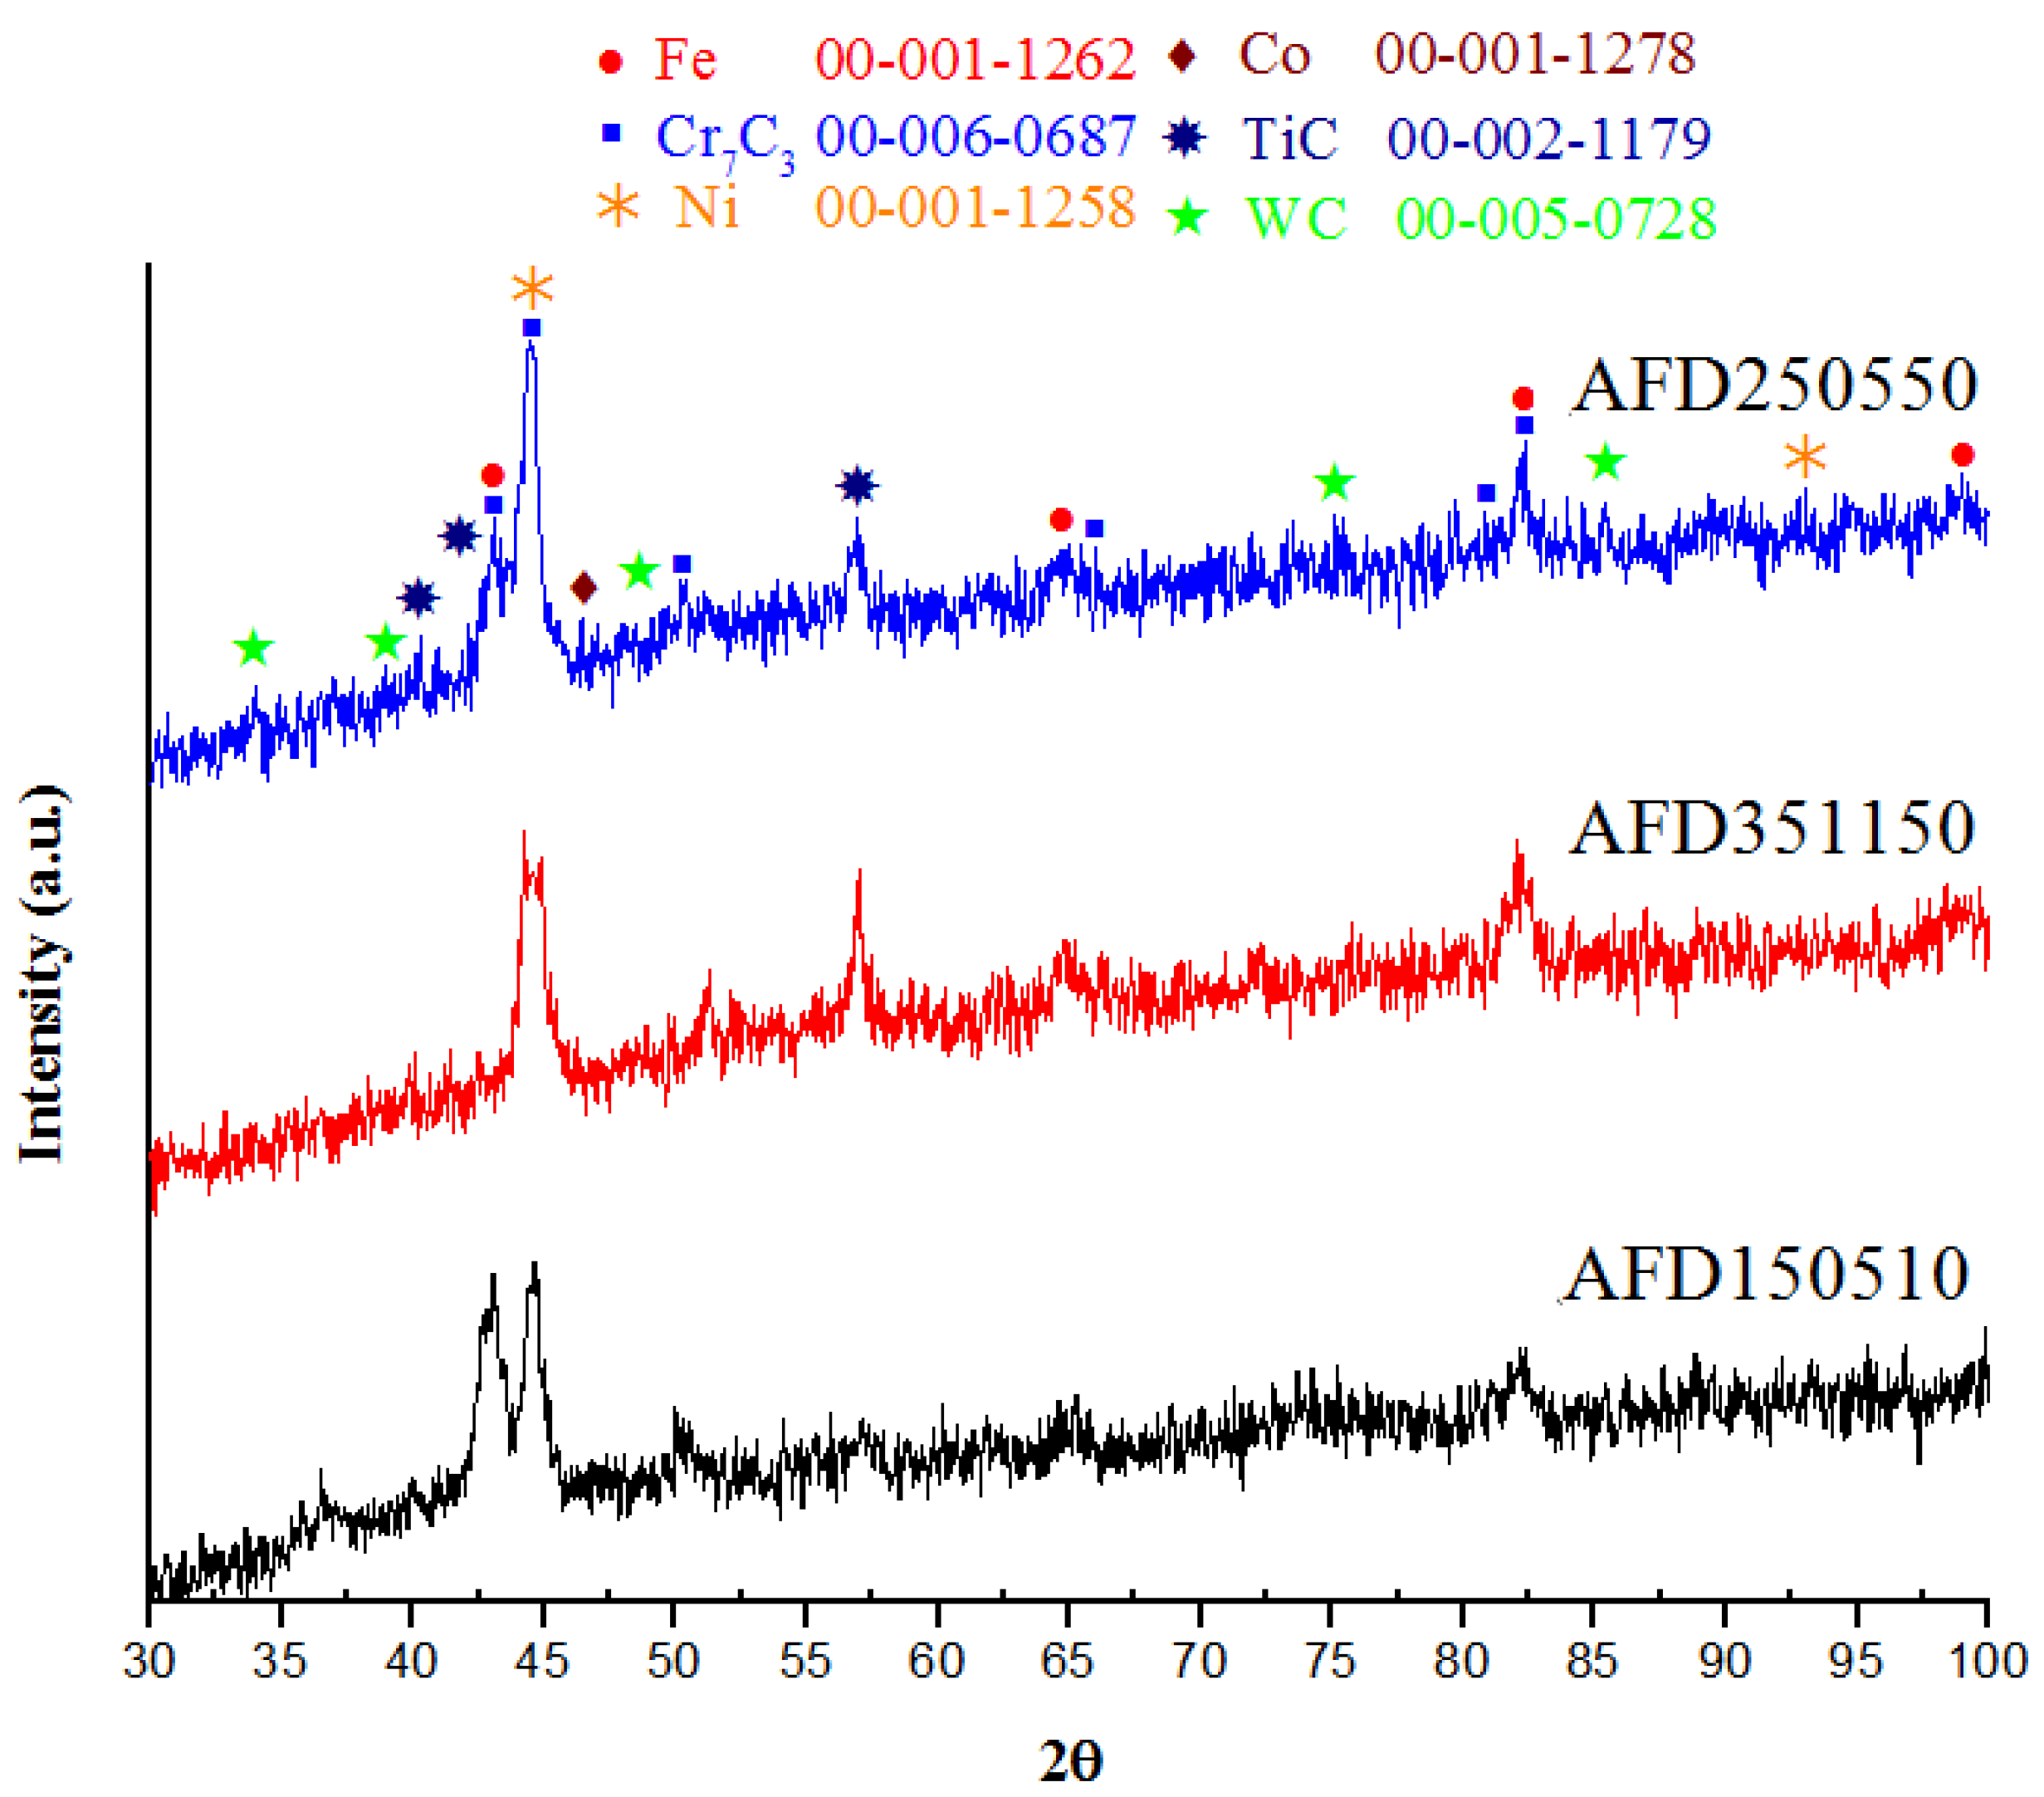
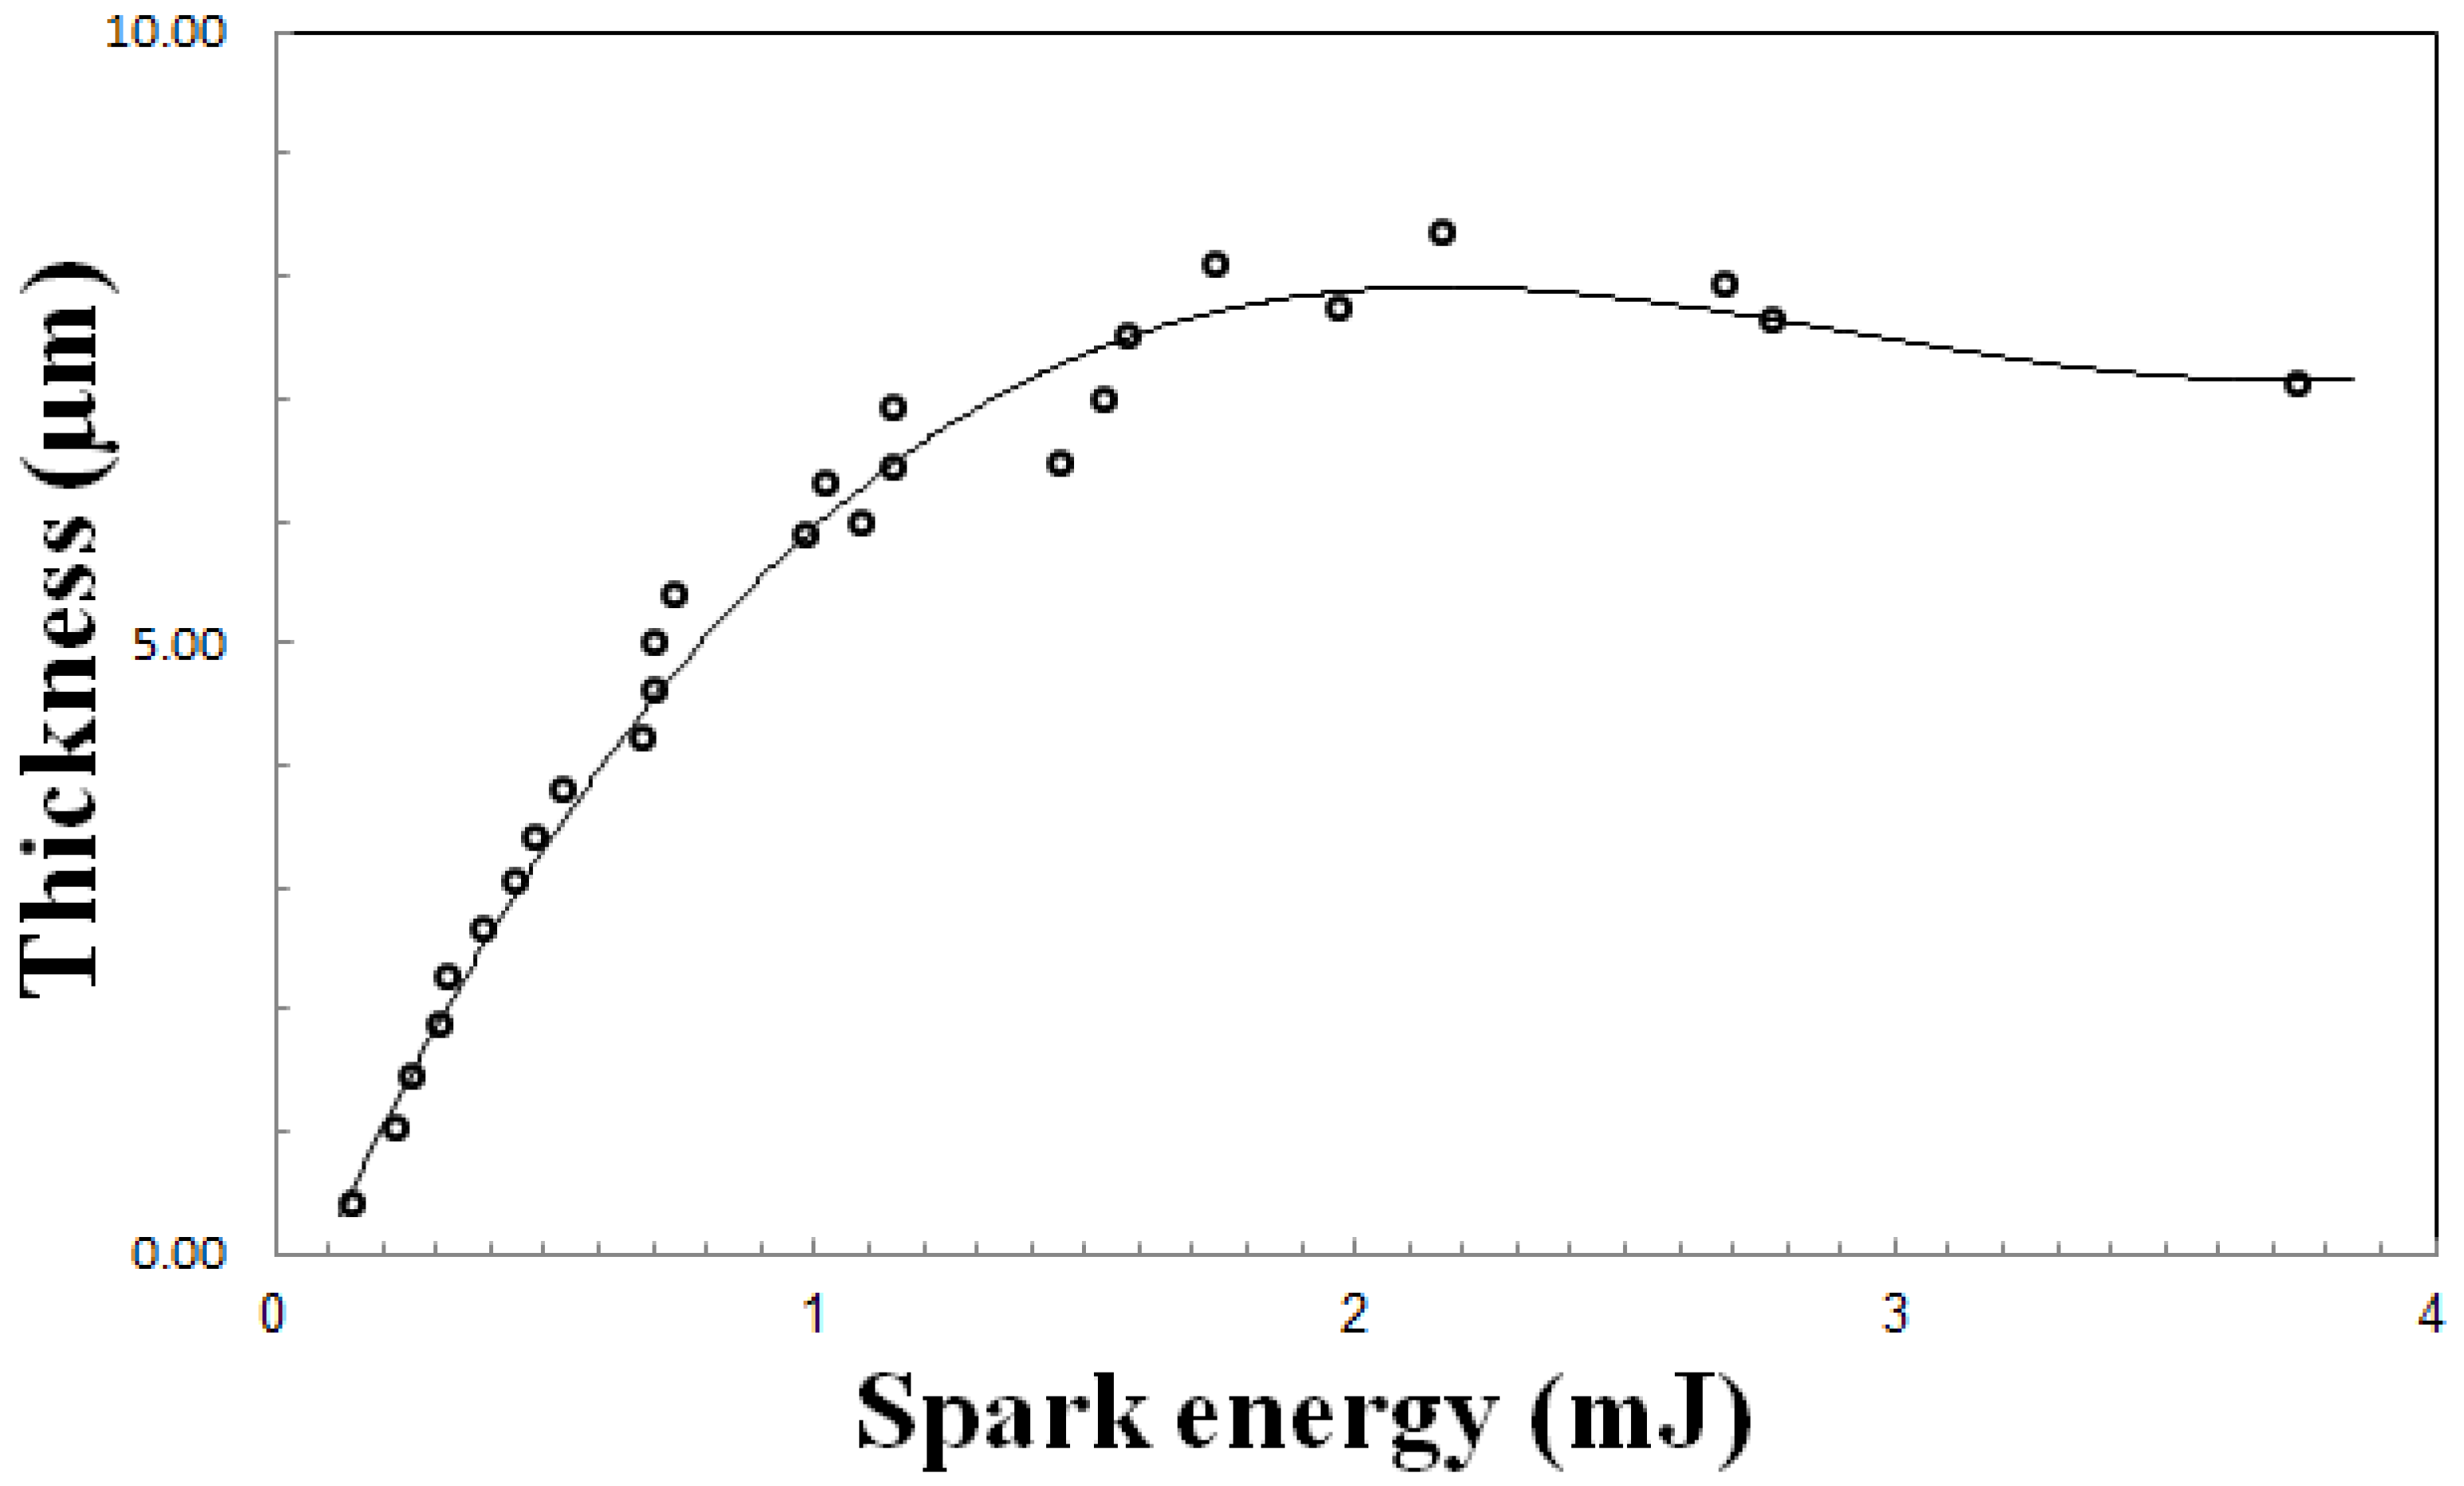
Results of optical microscopy have indicated that the microstructure of the substrate is probably composed of pearlite and bainite (Figure 5). From hardness results of the substrate and according to the continuous cooling transformation (CCT) diagram for 36Cr-Ni-Mo4 steel [35] it can be found that the microstructure of the substrate could be bainite or bainite-carbide, which is compatible with results obtained. Another important point that can be extracted from Figure 5 is the non-smooth interface between coating and heat affected zone layer. As specimens were polished completely before coating, non-smooth interface formation which is usually seen in diffusional coating can be represented good adhesion of coating to substrate [36]. In order to identify phases formed during coating, XRD results were shown in Figure 6 for samples AFD150510 (the lowest spark energy), AFD351150 (the highest spark energy) and AFD250550 (sample with the highest thickness. calculation was done based on the cross section (Figure 7)). As shown in Figure 6, the standard card number related to specify XRD peaks of every phase is represented, it can be seen that in addition to metallic Iron phases with BCC structure, peaks related to Tungsten Carbide, Cr7C3 and Titanium Carbide phases also is observed. Phases Tungsten Carbide, Cr7C3 and Titanium Carbide are present phases in electrode that have been transformed to the surface of substrate. Phase Cr7C3 is the phase that has probably been formed during the coating process. Since the Chromium carbide is more stable than Iron carbide [37], after surface melting of substrate steel a portion of present chromium alloy element of steel reacts with carbon of the electrode and Cr7C3 phase is formed. In addition, a small amount of nickel and cobalt can be identified in XRD peaks. Indeed it is essential to say that by increasing the thickness of the coating, peaks related to Tungsten Carbide and Cr7C3 phase increases and peaks related to Iron decrease. It should be noted that with the increasing spark energy up to 2.17 mJ, the coating thickness increases to 8.31 μm and then reduces (Figure 8). This is because of porosities in coating structure (Figure 9e). In other words, sample AFD250550 has the most and sample AFD150510 has the least picks respective to Tungsten Carbide and Cr7C3 phases. As mentioned, with high spark energy the dispersion of separated particles is also high. Therefore, with high spark energy the coating has a high porosity. This confirms that as the spark energy increases the coating efficiency first increases and then reduces (Figure 4c).
4.2. Surface and Cross Section Studies
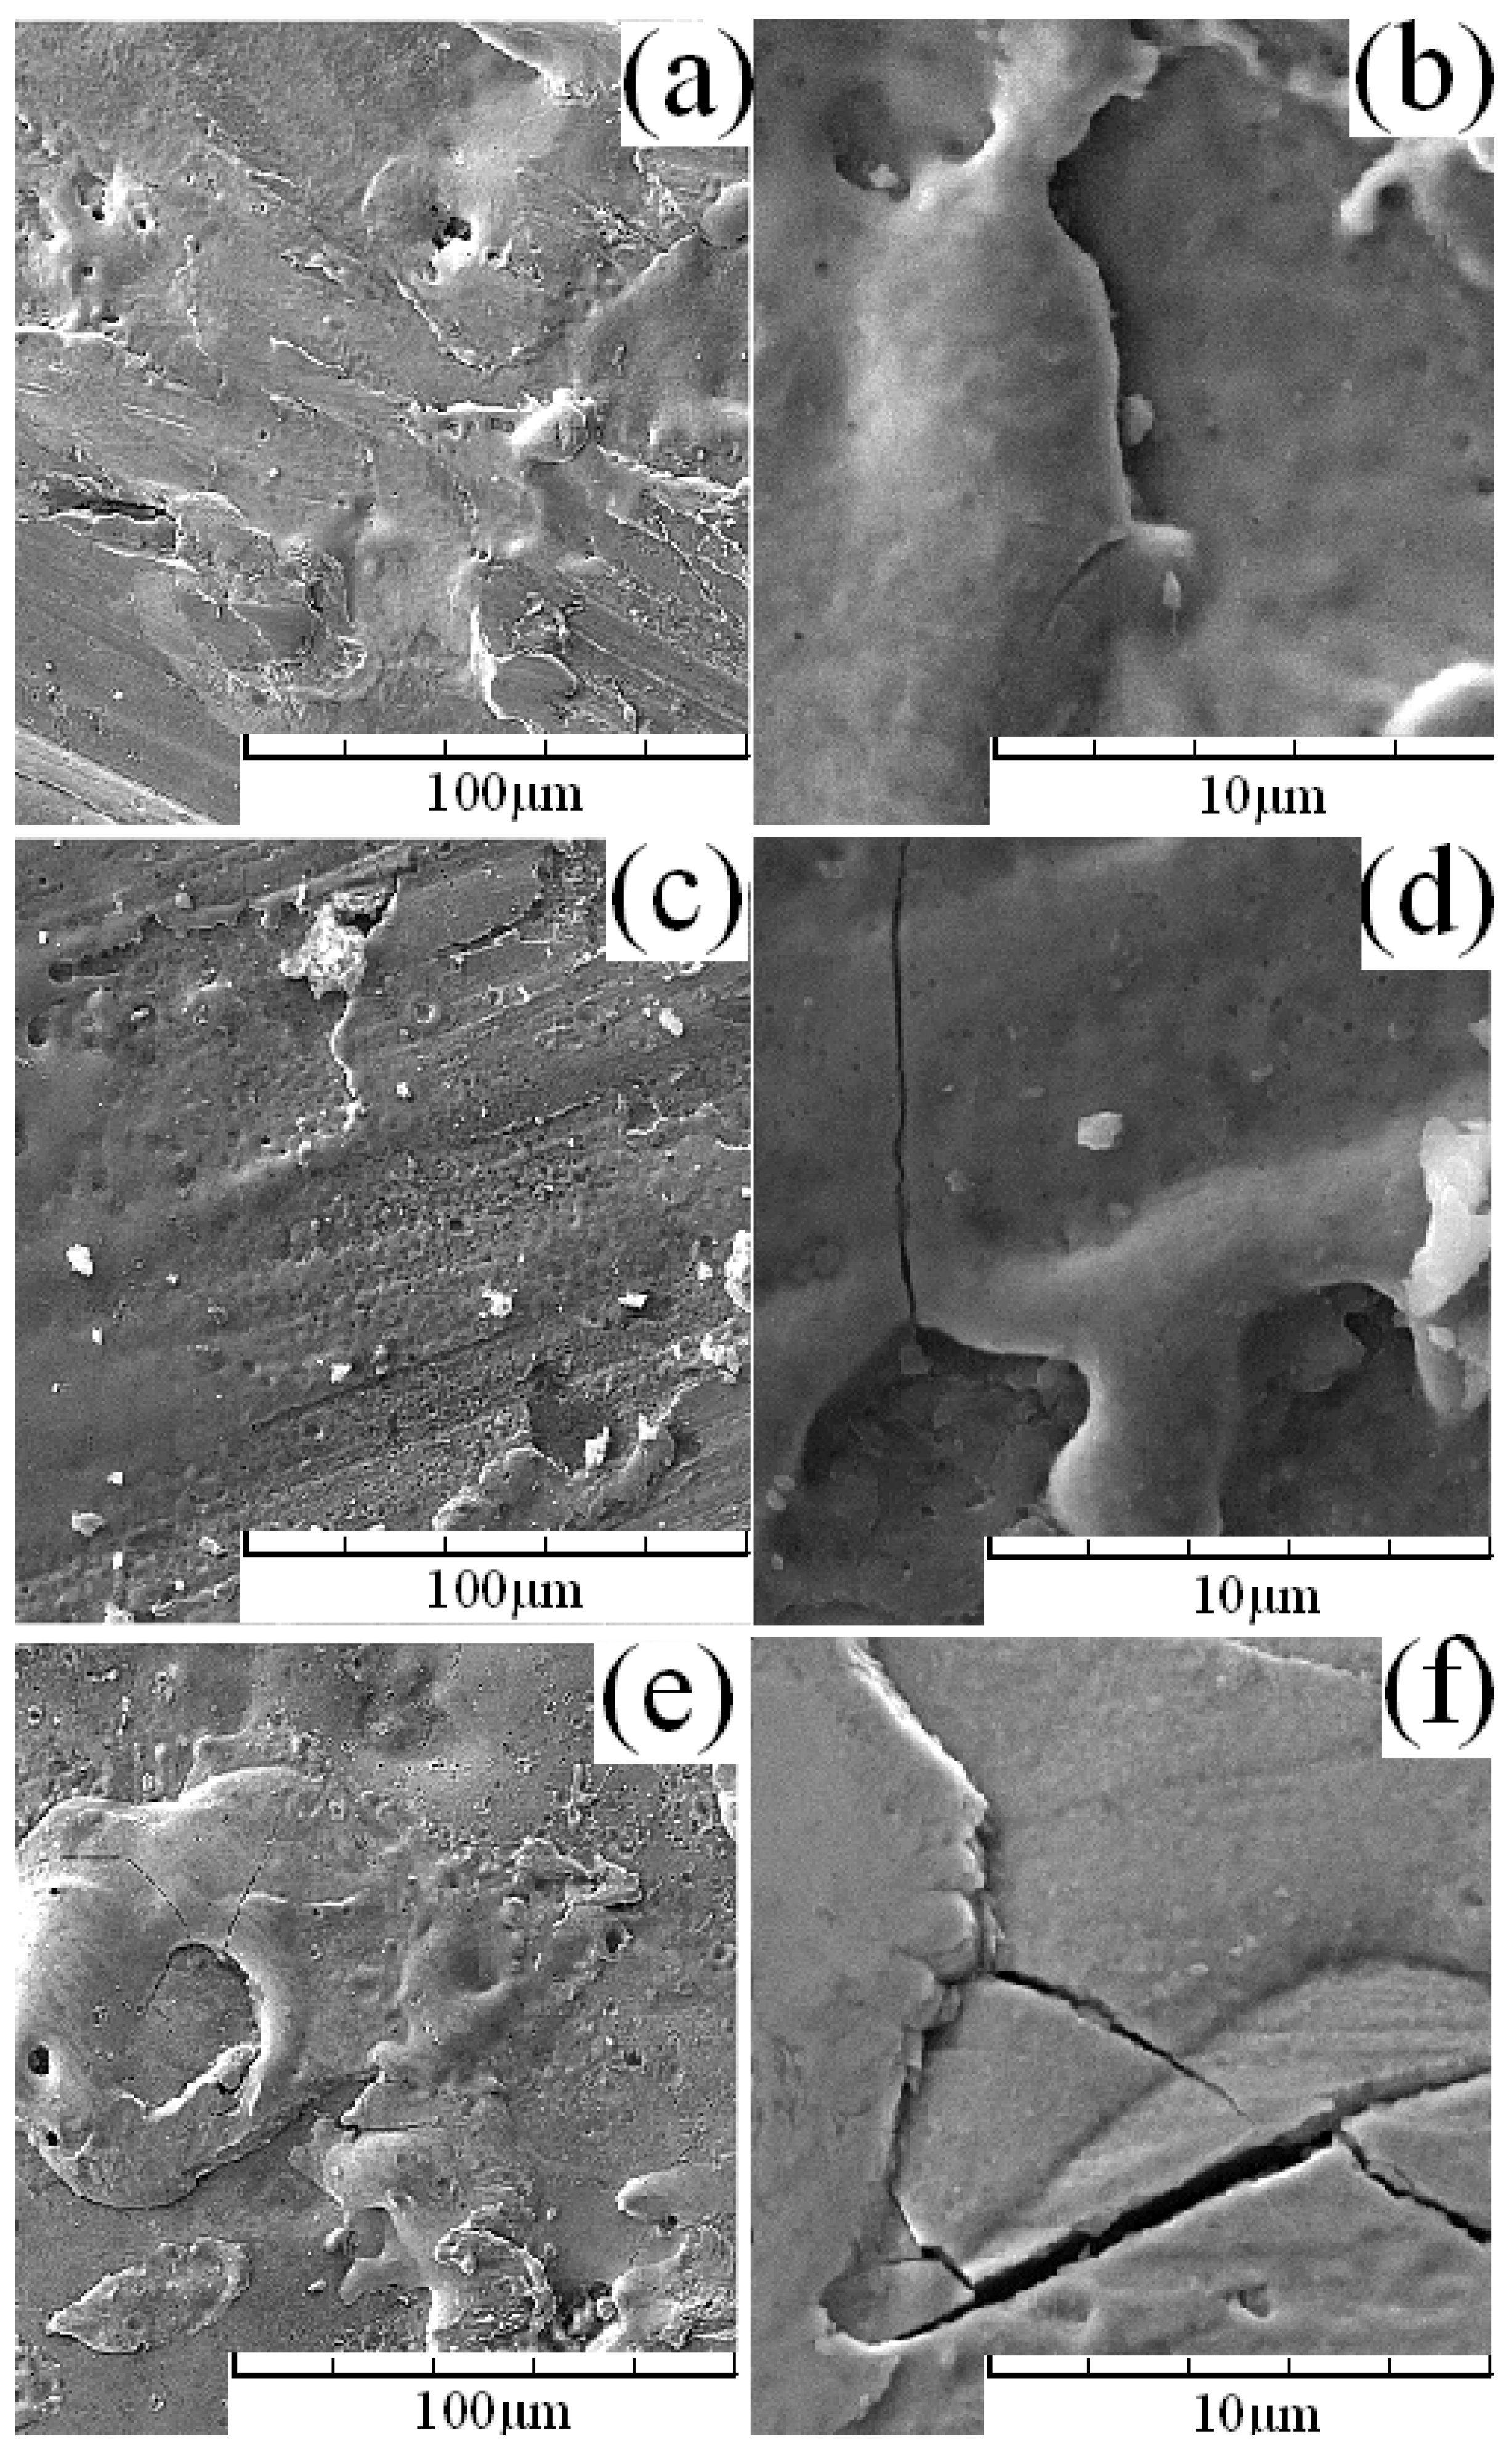
According to the cross section image, after coating of samples three regions can be seen individually, they are: coating layer, heat affected zone and substrate (Figure 7). Three specimens were chosen to be analyzed with SEM: AFD150510, AFD250550 and AFD351150. Specimen AFD150510 polishing scratches is observed in the surface and it has not been completely coated with electrode material (Figure 9a). With increasing magnification up to 10,000 (Figure 9b), in addition to surface melted regions microcracks can be found in the surface of the coating. The main reason for microcrack formation is the presence of brittle carbide compound in the surface of coating. On the regions of the surface of this specimen, very fine porosity is observed that might be due to air trapped in molten material around the arc.
On the surface of specimen AFD351150 there are not polished scratched and the surface of it has been coated with electrode material (Figure 9c). With increase in the magnification up to 10,000 (Figure 9d) cracks can be seen in the surface of the coating. Due to the high spark energy in this specimen, crack formation in the surface is probable because of the growth of the carbide layer. A lot of porosity in either micro and macro spherical form could be observed on the surface of the specimen. One of the other features is the widening of the over compiled layers. This means that with increasing spark energy the temperature of the molten material formed in the surface increases; thus solidification time and melt fluidity increases and consequently molten drops formed on the surface are able to flow and expand on the surface. Of course it should be considered that increase in the fluidity of melt at the surface can be lead to extra dispersion of it due to it hitting particles separated from the electrode, which was observed in obtained results of coating thickness and deposition efficiency calculations.
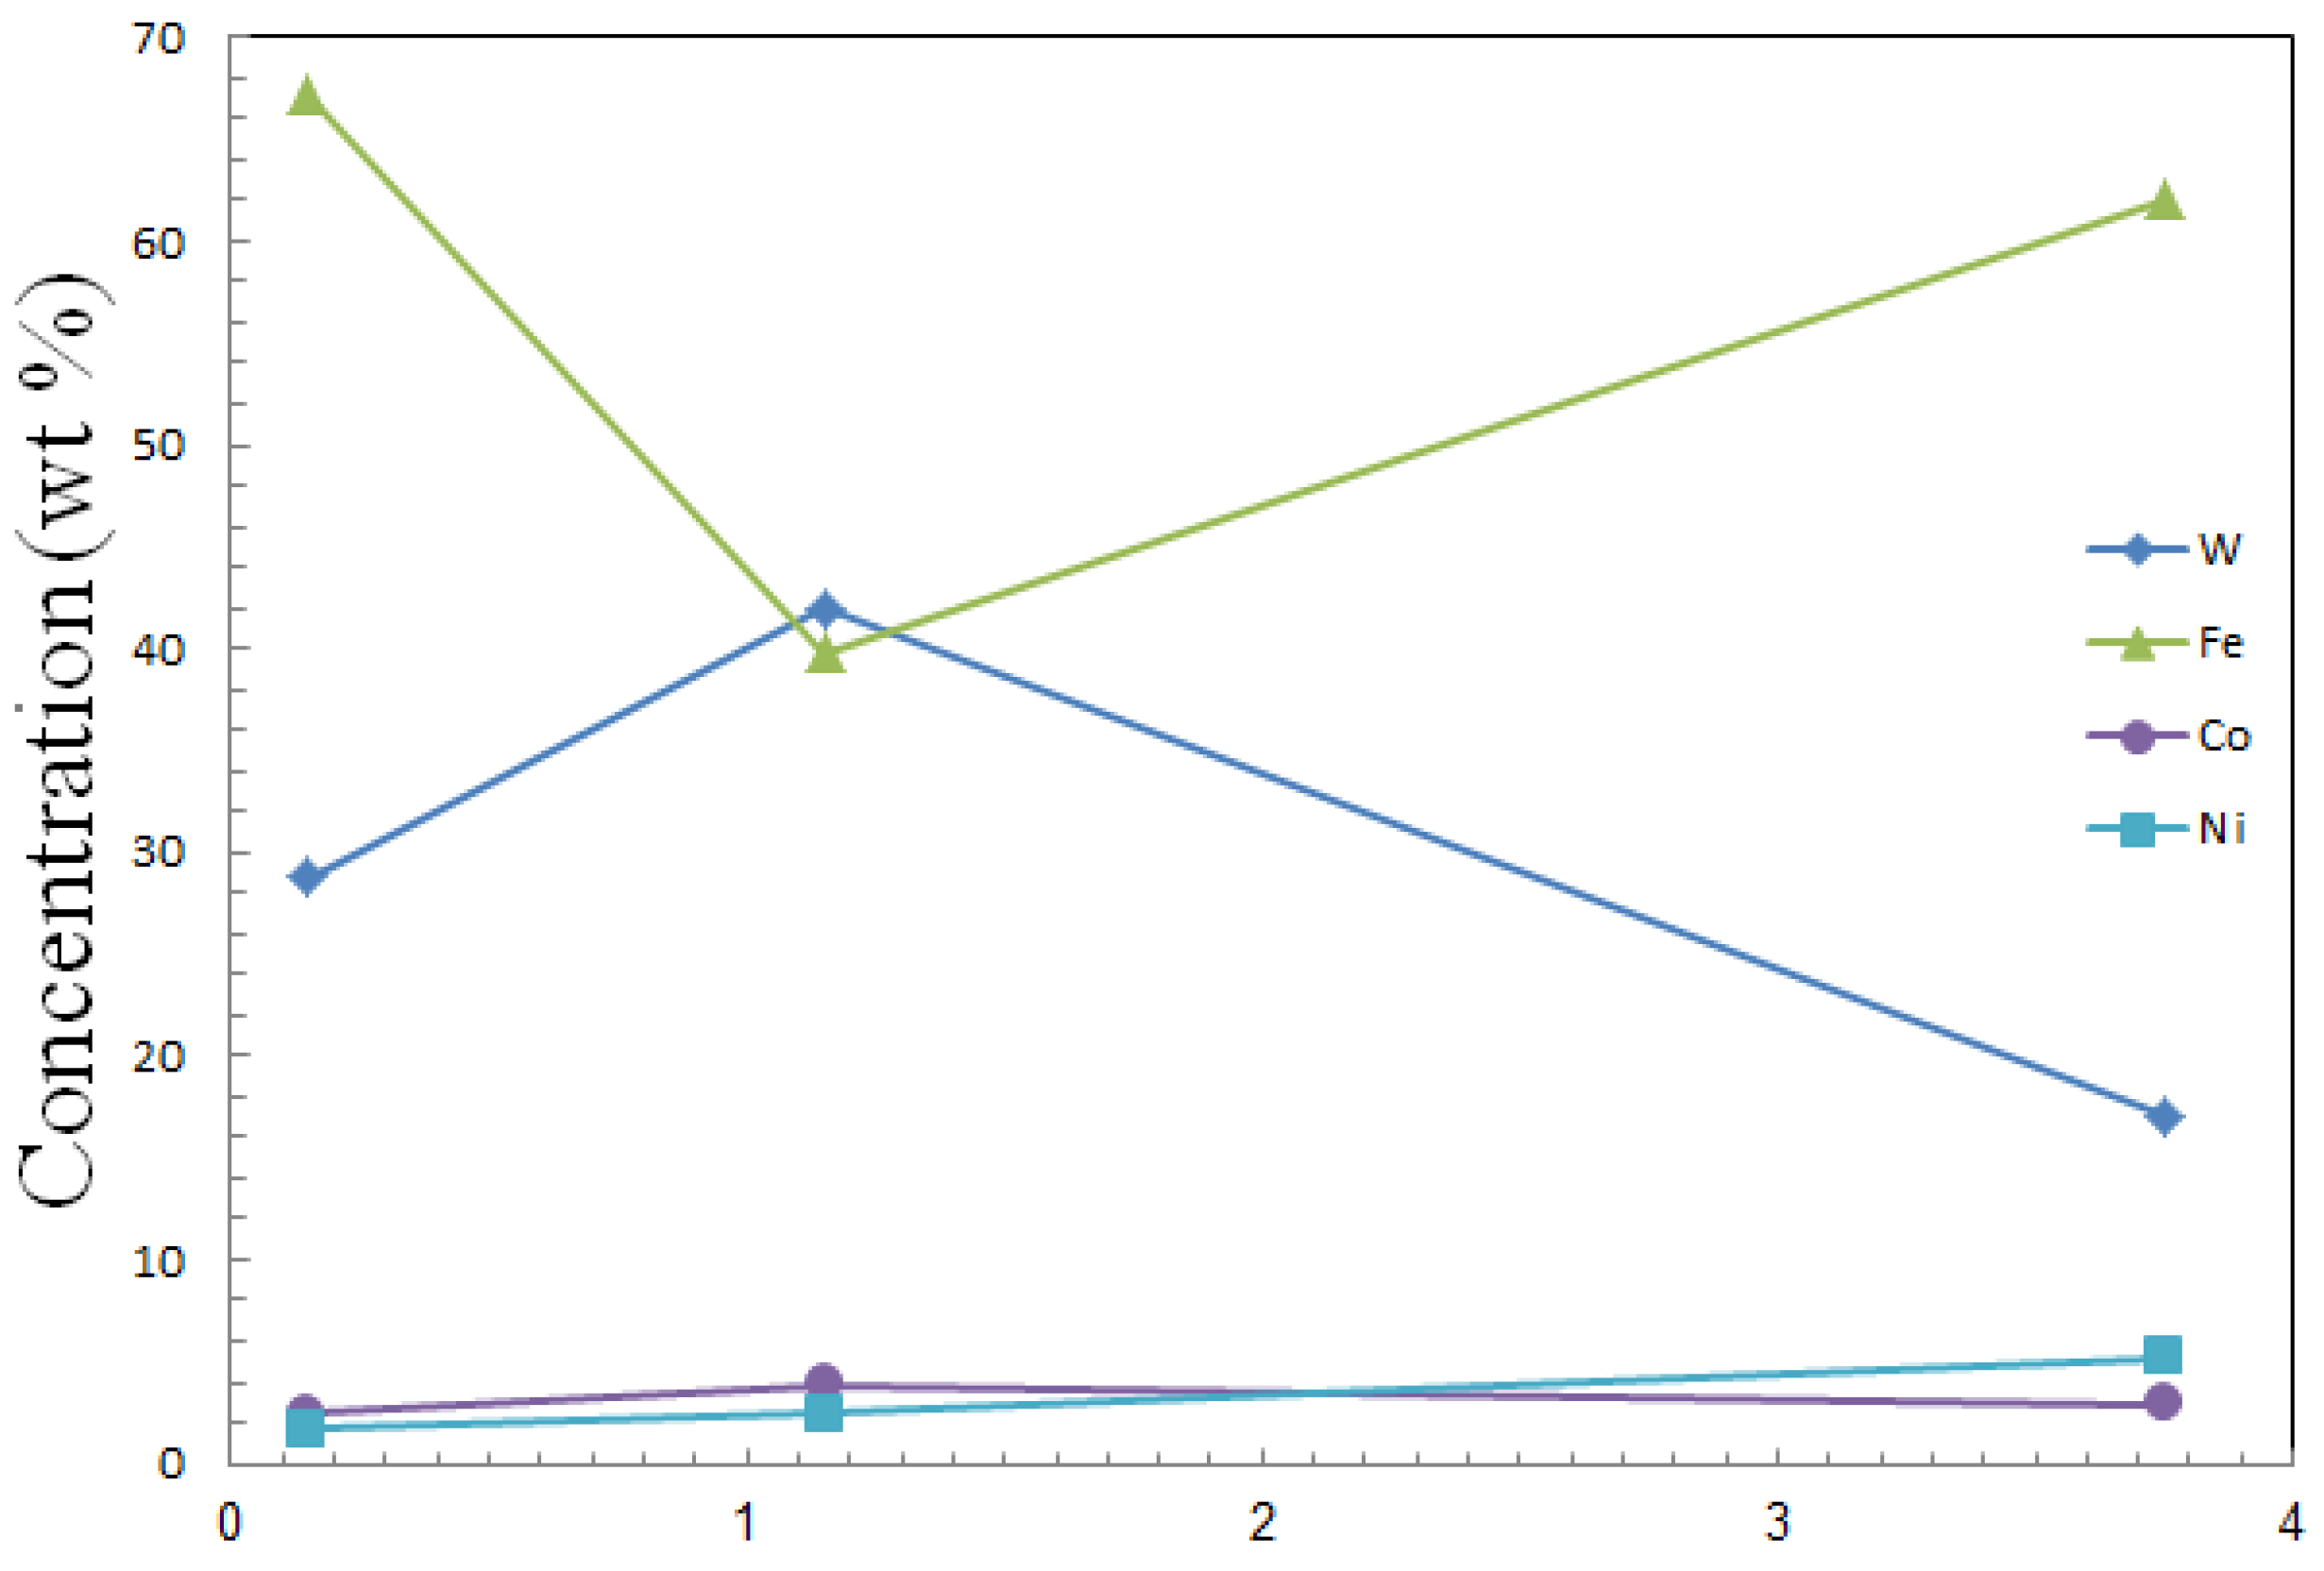
In sample AFD250550, despite the high thickness of coating on the surface there is also a lot of porosity (Figure 9e). In addition to the large amount of porosity, the formation of deep cracks in the surface is completely obvious (Figure 9f). Therefore, it can be said that in the maximum thickness of coating presence of the surface, defects have been increased. On the surface of this sample as with former samples fine particles of Tungsten Carbide can be seen. These particles are seen with white color due to their higher weight proportional to other compounds present on the surface. Aggregation of these particles in the surface can be seen in magnification 10,000. EDS analysis results for samples AFD150510, AFD351150 and AFD250550 (Table 3), indicate the existence of transported compounds from the electrode to the surface. By the use of EDS results, changes in the amount of elements in the surface of the samples are obtained (Figure 10). Figure 10 indicates that with increasing spark energy, the amount of Tungsten in the surface increases and then reduces. At first, a small amount of Tungsten (17.3 wt % on the surface of sample AFD150510) can be seen on the surface. As the spark energy increases, the amount of Tungsten in the surface increases to 41.95 wt %. At higher spark energy the amount of Tungsten in the surface is reduced. Figure 10 also shows that the elements also behave similarly to the changes in the thickness of the coating with spark energy. With increasing energy, the thickness of coating increases up to a maximum value. At higher spark energy, due to the dispersion of particles from surface, the amount of Tungsten decreases and the Tungsten of Iron increases. EDS analysis results was indicated that the amount of Tungsten in the surface couldn’t be equal to Tungsten of electrode even in maximum case (41.95% in sample AFD250550). In order to justify this, it can be said that surface composition has been changed due to mixing molten Iron with electrode material. The cross-sectional analysis (Figure 11) results indicate that up to 6 µm from the surface change in the concentration of Tungsten and carbon is low. From a distance of 6–8 µm from the surface the Iron concentration gradually increases and then its concentration remains constant.
4.3. Microhardness Profile
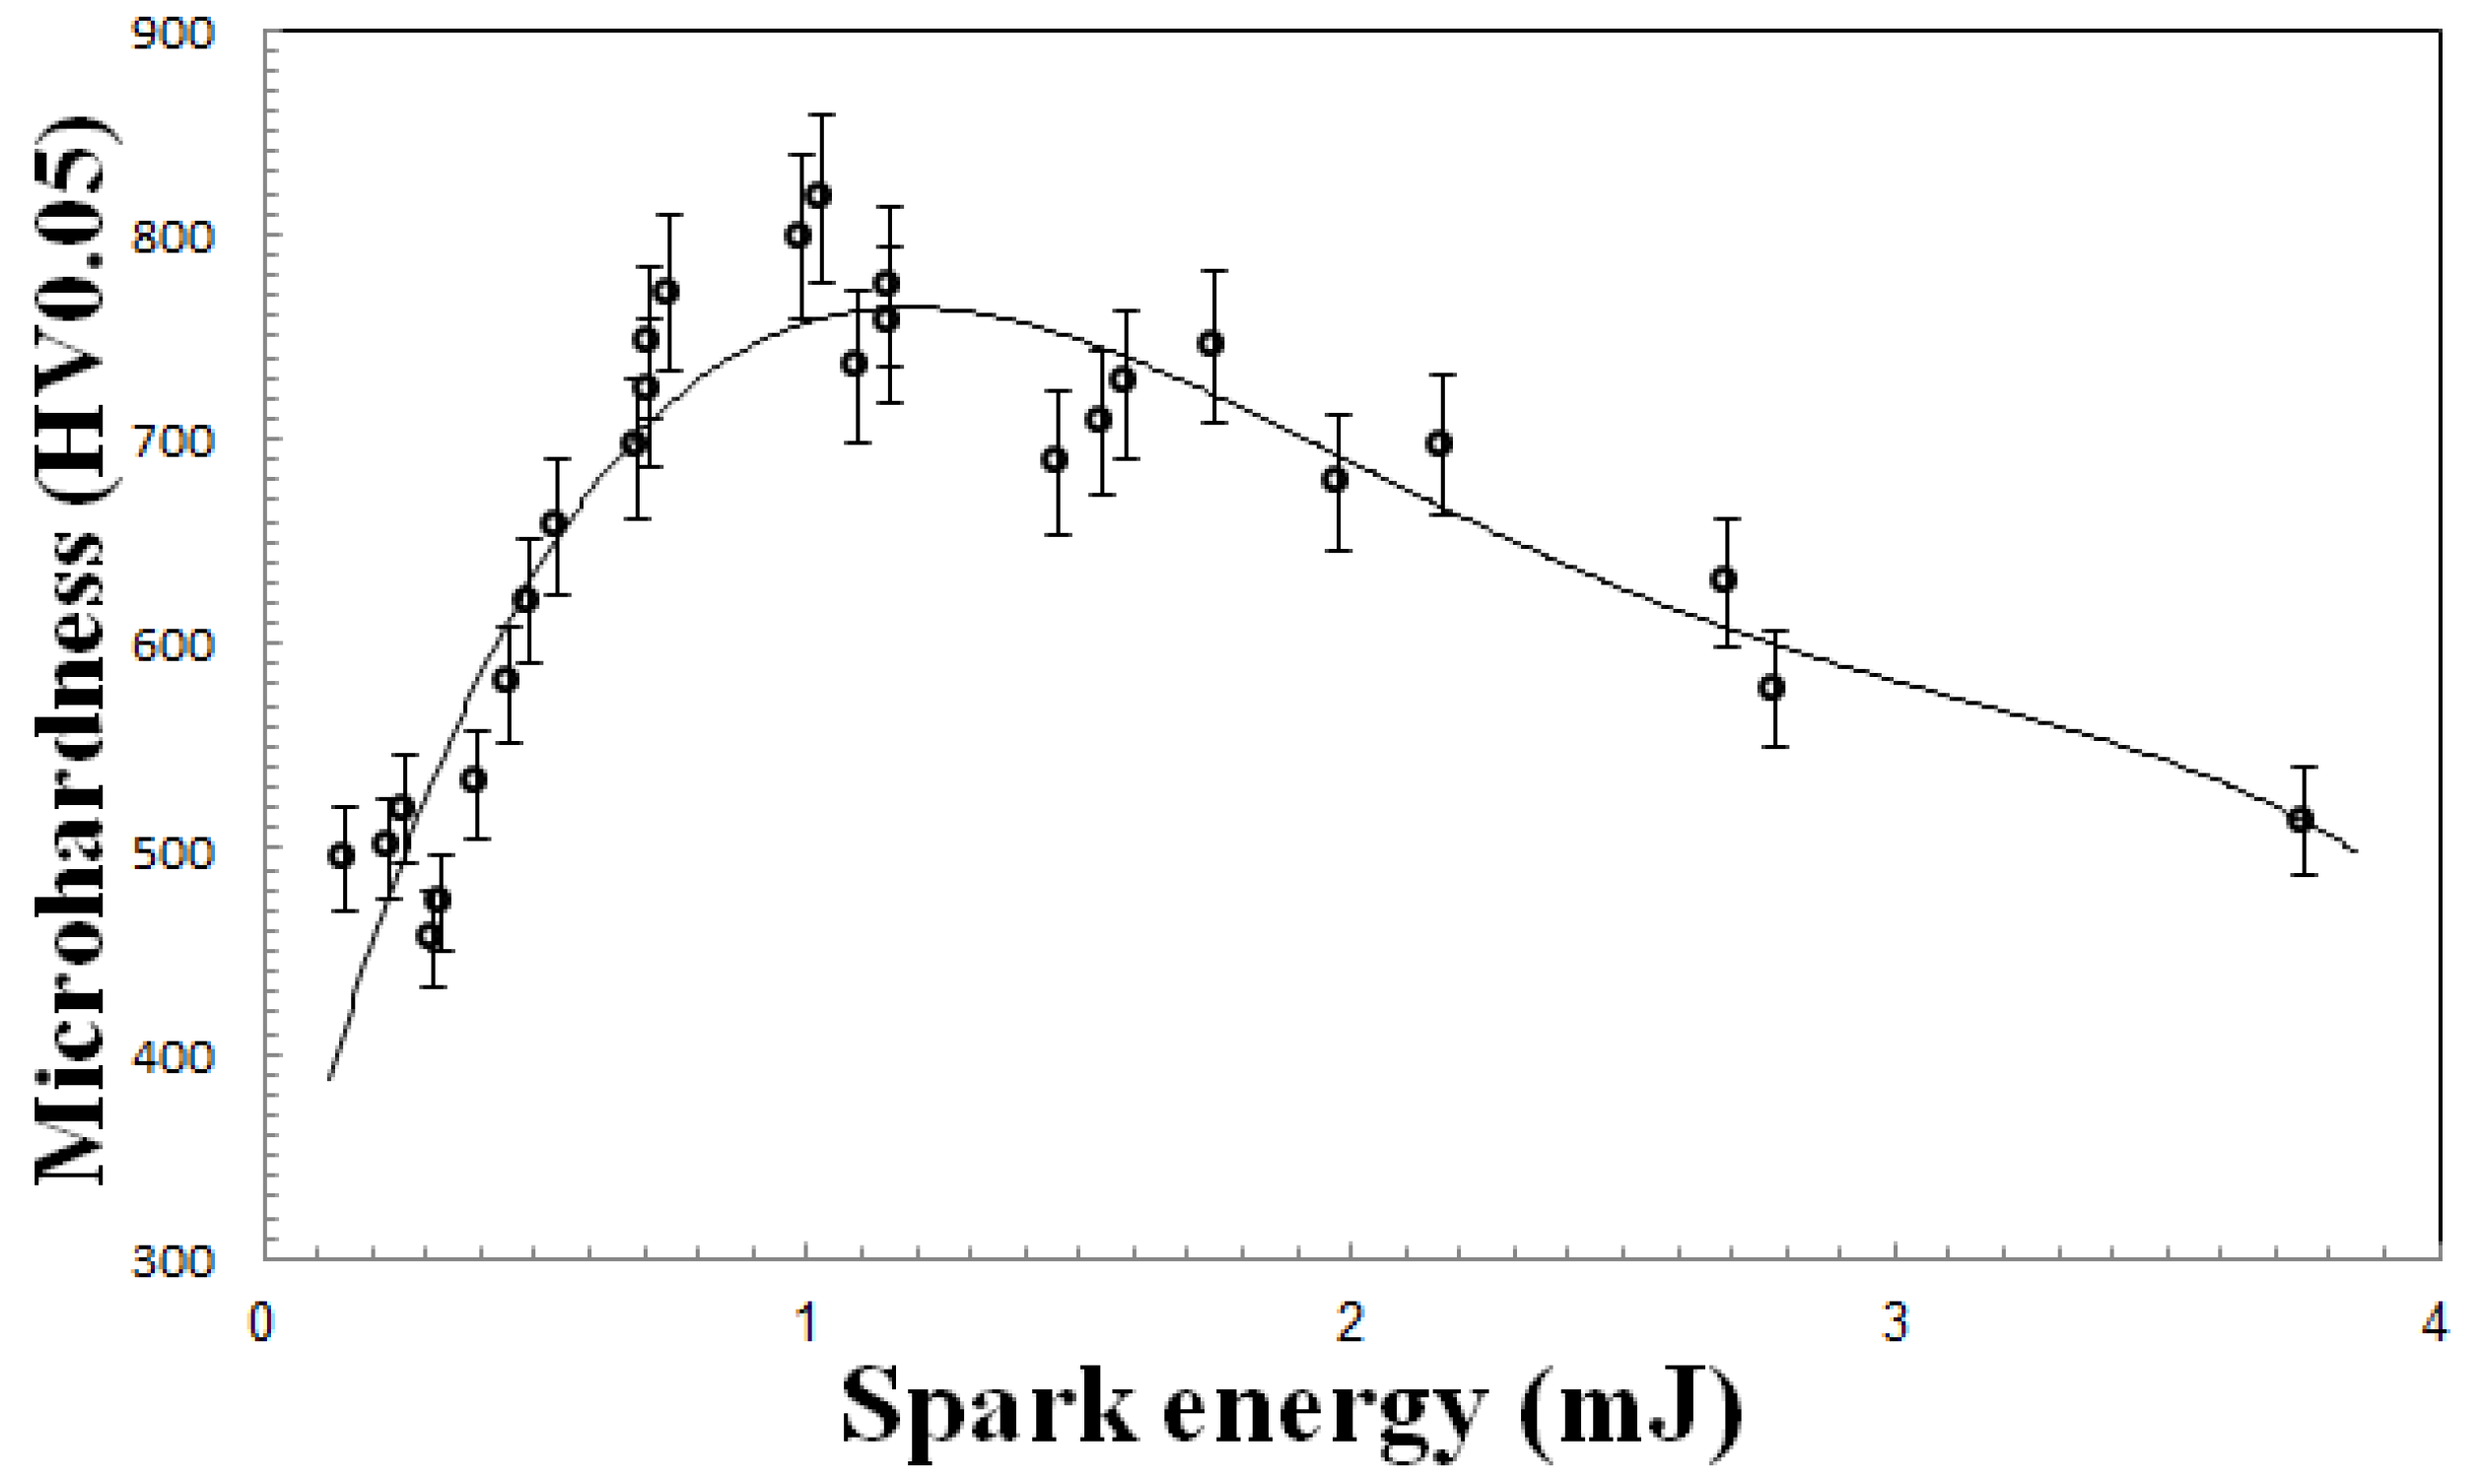
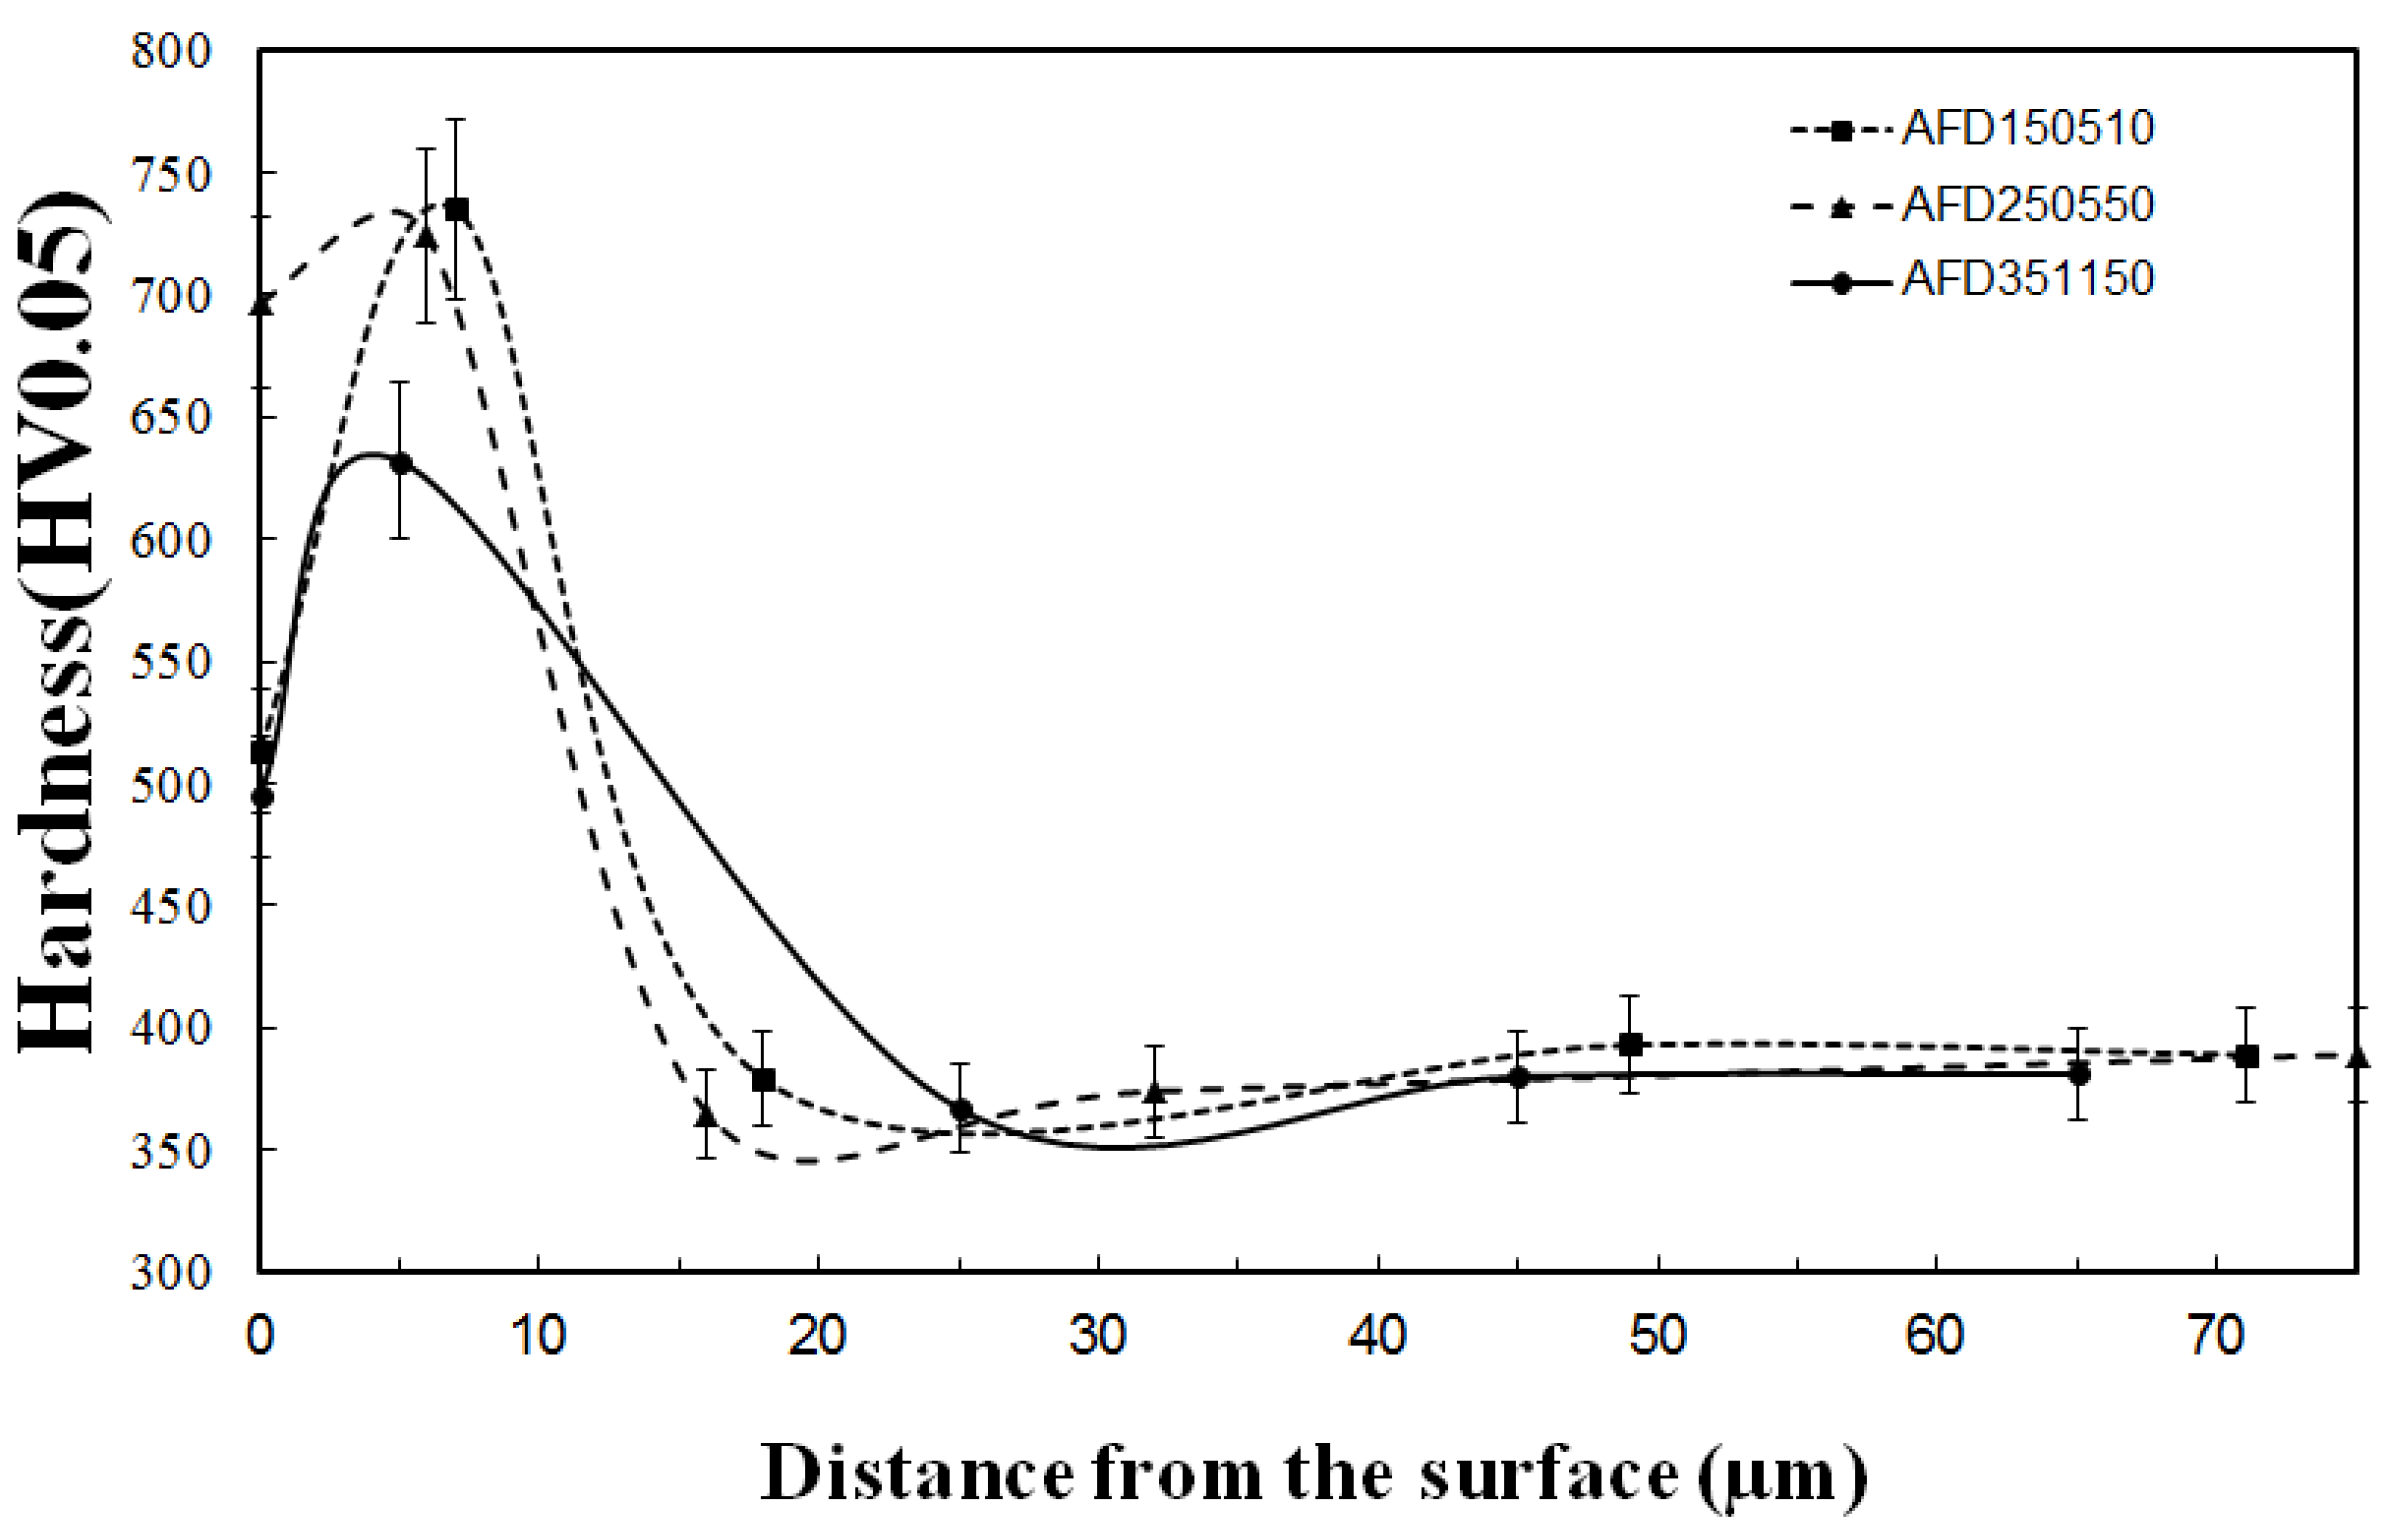
Hardness also increases like thickness coating efficiency with the increasing spark energy up to 1.03 mJ and then reduces (Figure 12). The highest measured hardness (817.33 HV0.05) is for sample AFD150830, which has the highest efficiency. As the thickness increases, the amount of hard carbide deposited on the surface phase increases (Figure 6), so it is expected that surface hardness also increases. As thickness reduces after 2 mJ energy, hardness reduction is expected. Since that Tungsten exits as carbide in surface, with the increasing Tungsten in the surface, hardness of the surface increases and with reduction of Tungsten the hardness of surface decreases. As spark energy increases the amount of Tungsten in the surface increases and then reduces (Figure 10). Figure 13 shows the hardness profile of samples AFD150510, AFD351150 and AFD250550 from surface to depth. Figure 13 indicates that the hardness of the areas near the surface is higher than the substrate (370 ± 15 VHN). With the quick solidification of melted material in surface, size of surface grains becomes finer [38]. According to the Hall-Petch equation, this causes the hardness of areas near the surface to be higher than the substrate. Also, the high amount of Tungsten in the areas near the surface (Figure 11) causes the hardness of the areas near the surface to be higher than the hardness of the substrate. Another point in Figure 13 is that the hardness increases at a distance of 5–10 µm from the surface. But at the distance of 10–20 µm from the surface, hardness reduces and in some cases (HAZ) reduces to less than substrate hardness. As noted in Section 3.2, with the increasing spark energy melt dispersion increases in the surface and the possibility of formation of surface porosities enhances. The existence of surface porosities causes the hardness of the surface to be less than the hardness of the cross section. Annealing of steel in HAZ (at distance of 10–12 µm from surface) can reduce the hardness. Especially at high spark energy, the high temperature area is large and the cooling rate is low which provides ample time for the grains to grow up, thus the grains grow obviously [39,40].
4.4. Microroughness Profile
According to Figure 14 it is clear that variation in spark energy will lead to a large dispersion value in surface roughness of samples, but the overall trend shows increase in surface roughness with increasing spark energy. The roughness variation range is from 1.82 μm for sample AFD250850 up to 4.23 μm for sample AFD350850 (sample with the highest roughness). With increasing spark energy the dispersion of particles from the surface increases, therefore the dispersion of roughness values is more in high spark energy (Figure 14) With increasing spark energy, the amount of transformed material from the electrode increases and if all of the material deposits on the surface, roughness will be increased.
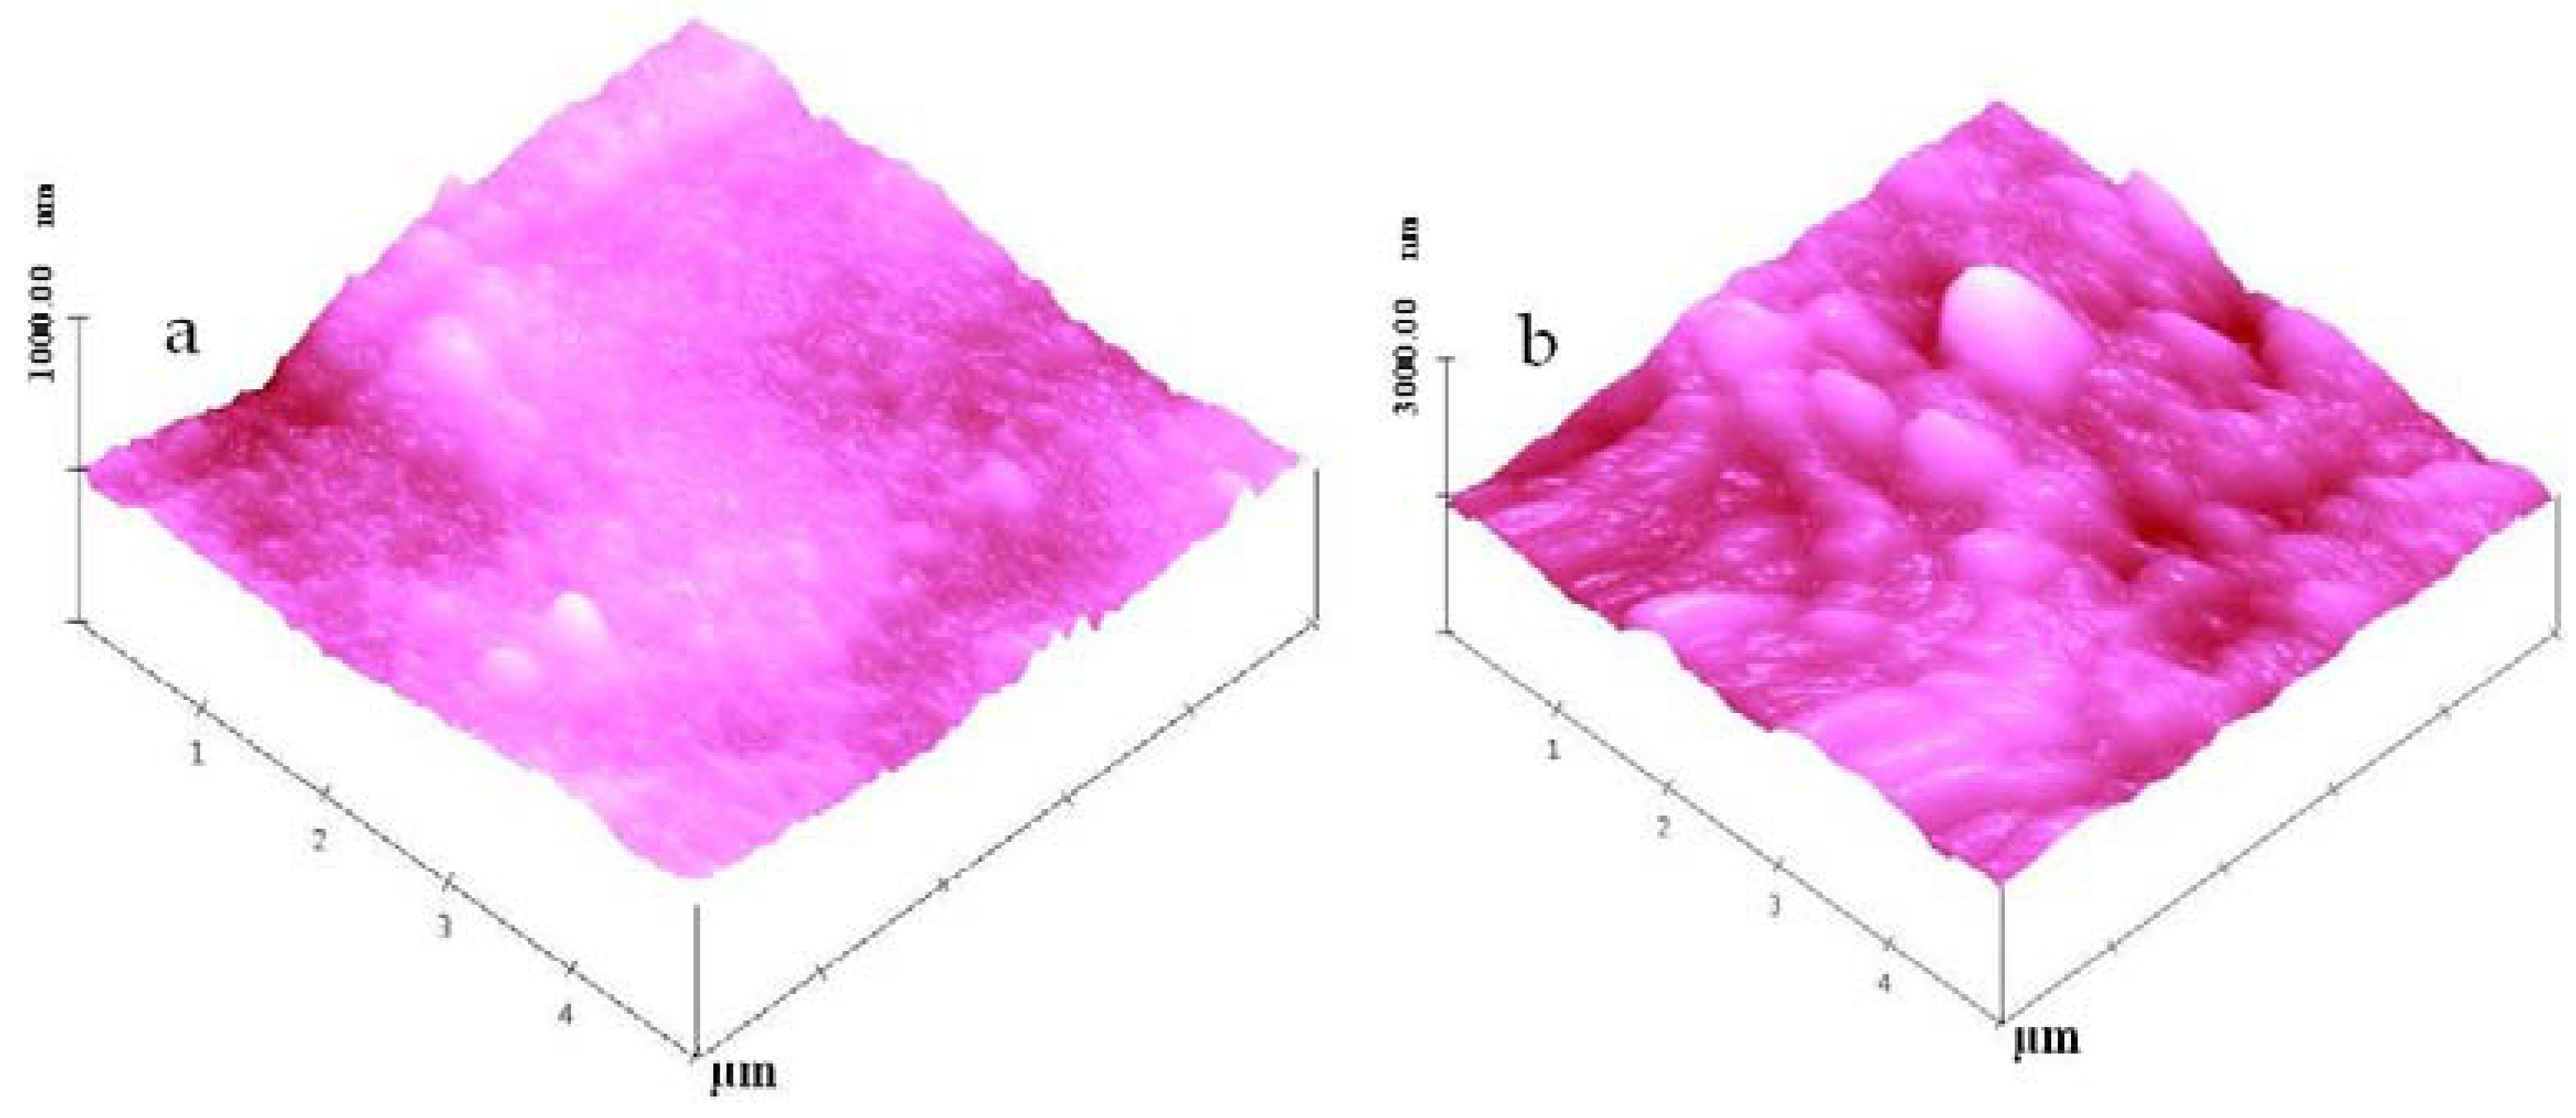
In some cases roughness decreases due to increase in the fluidity of melt in the surface, because of the increase in transformed heat to the surface and electrical arc phenomena. With increasing fluidity of melt it is expected that carbide particles merge into the melt and also surface roughness decreases. With the formation of a particle on the cathode, negative charge desire expands on the surface of the particle. Hence ions accelerate to particles. Therefore in the points with higher height probability of hitting of ions will be more due to being close to electrode. Because of this the probability of separating from upper sections of surface particles will be increased. Thus in the case of good adhesion of particles to the surface, decrease in roughness of the surface maybe occur. Figure 15 shows the AFM image for a reference sample and the sample with the highest thickness (AFD250550). It can be observed that that with coating, semispherical particles can form on the surface. The average height of particles is 1.94 ± 0.12 µm and their average diameter is 2.93 ± 0.62 µm. The particle diameter is almost twice its height and particles are up to half its height in the melt surface. This indicates that the adhesion of the particles to the substrate is appropriate. Recent results are consistent with the results of Figure 11. By the use of AFM software, roughness number for sample AFD250550 is about 2.693 µm, which is almost same with the roughness number (Ra = 2.78 µm) obtained by a roughness tester system. The roughness numbers of the roughness tester system were calculated using Figure 14.
4.5. Results of Corrosion Test
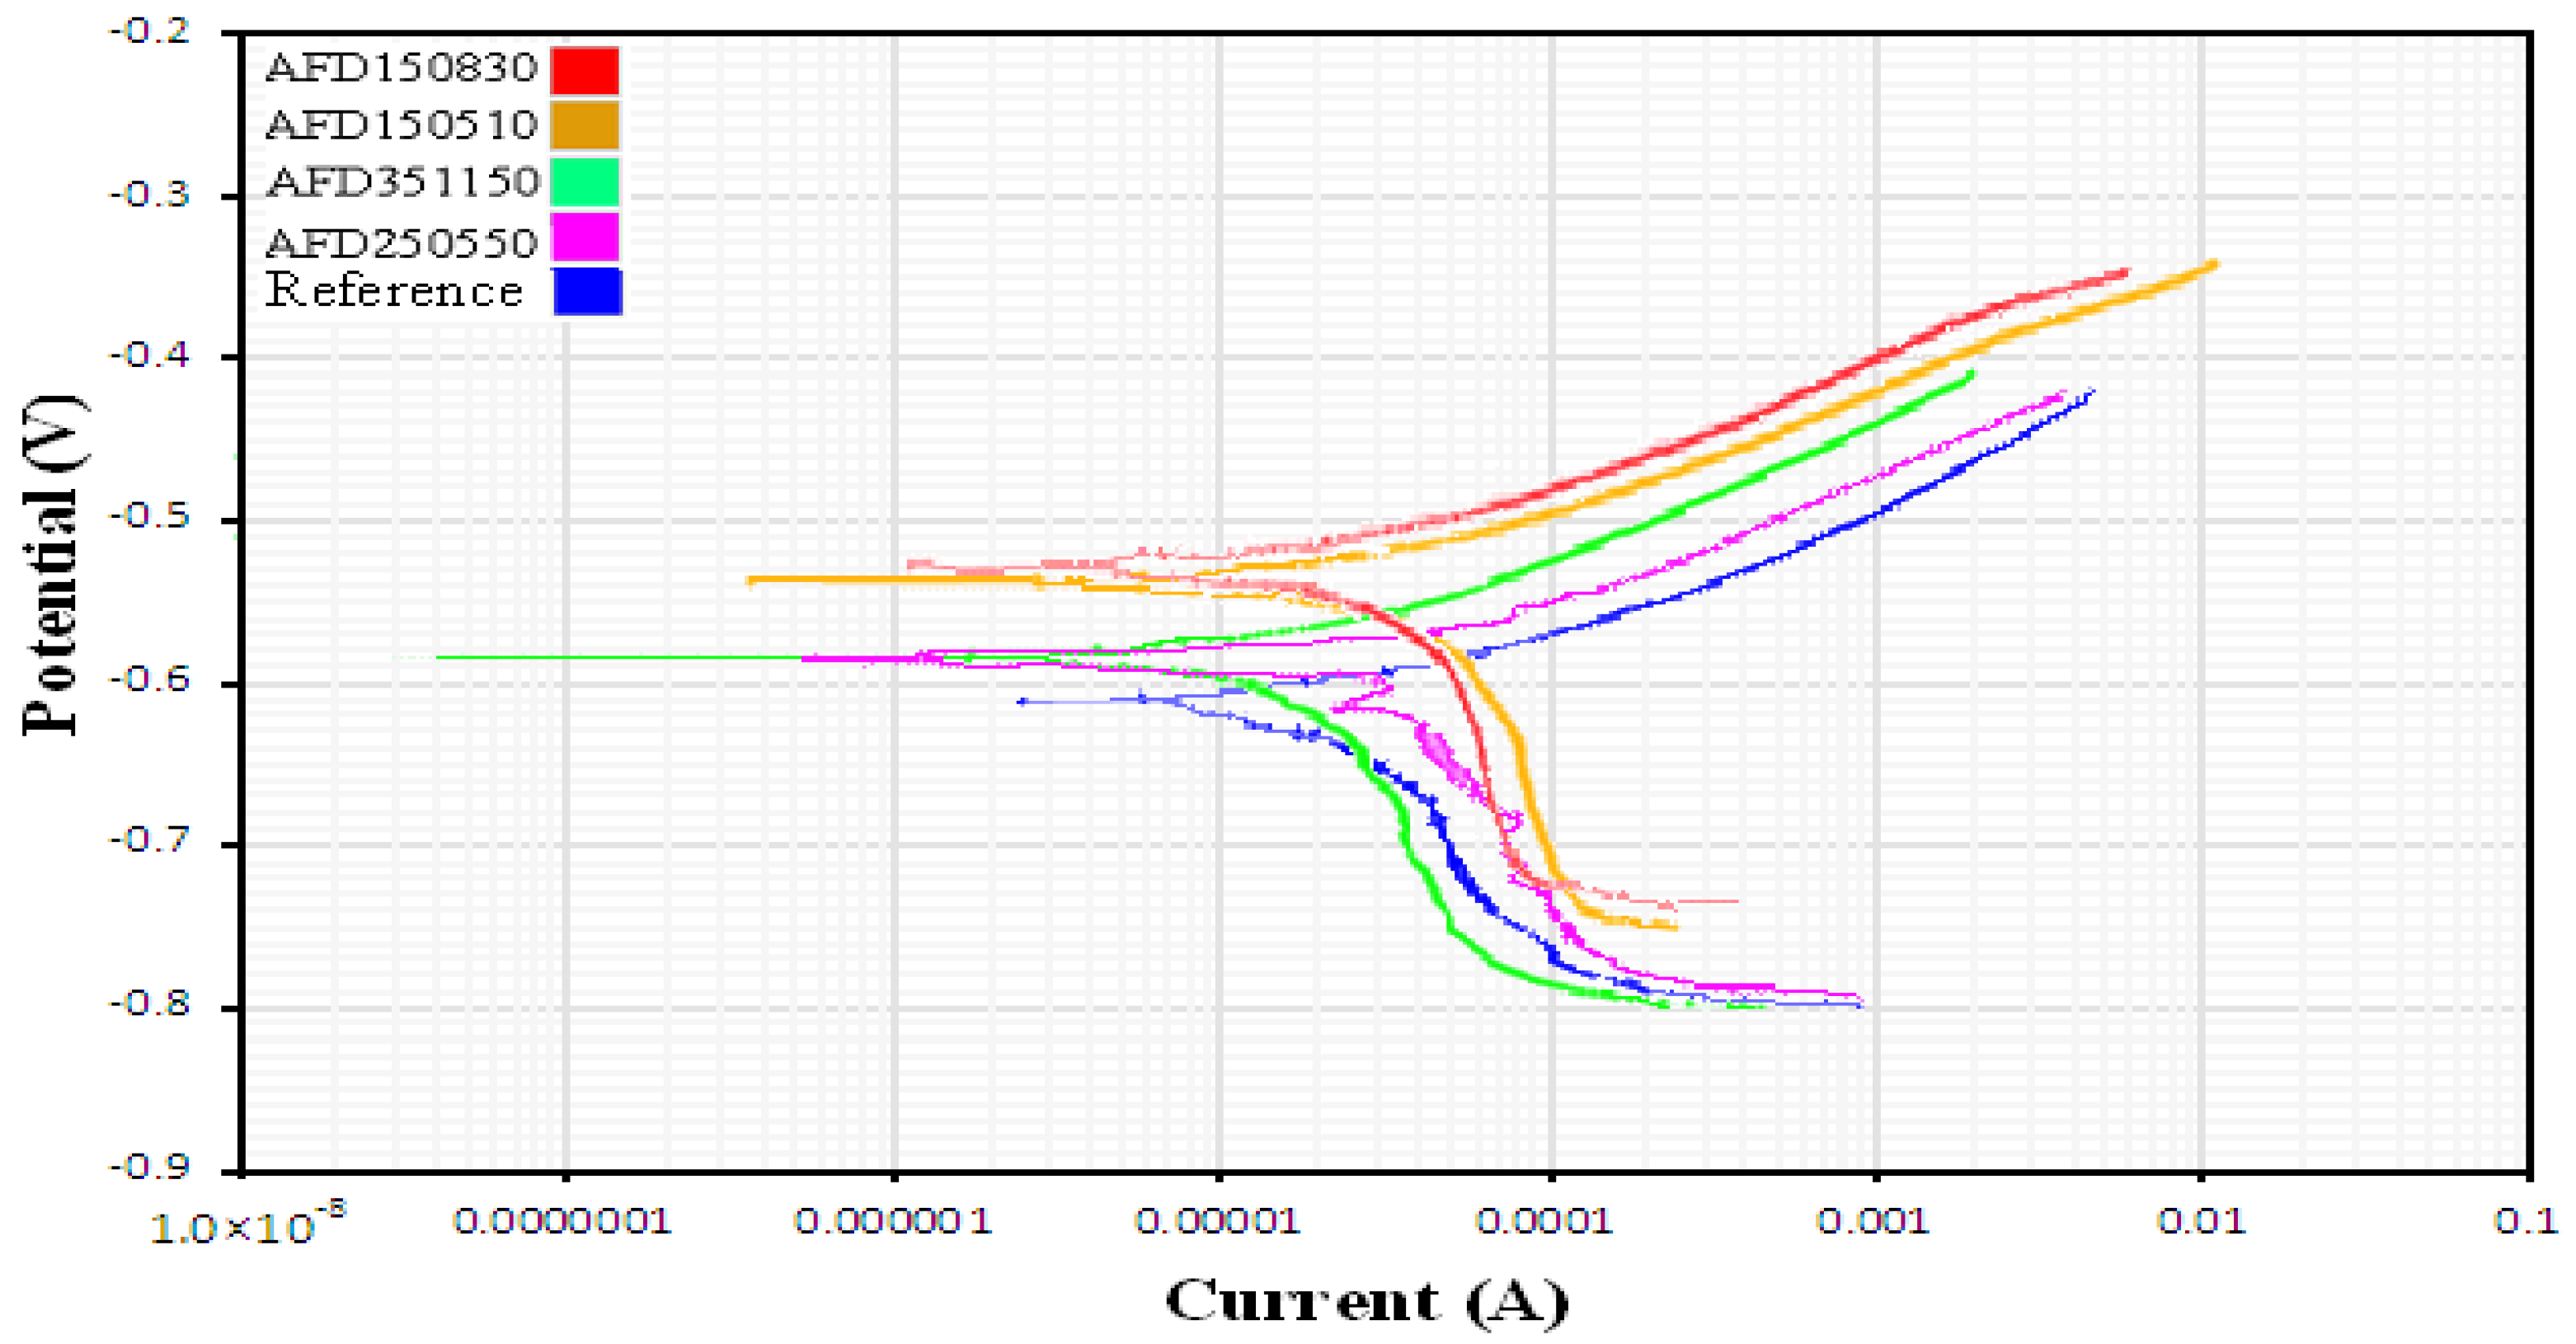
Results of a polarization test demonstrate that samples of reference, AFD150510, AFD351150, AFD250550 and AFD150830 (Figure 16), represent active behavior and there are not any passive regions. Therefore, corrosion products do not form on the surface of samples. Corrosion products play an important role in the study of corrosion behavior [41]. Among the samples, the reference sample has the highest corrosion current density (Table 4). It indicates that the reference sample has minimum value of corrosion resistance, in other words it has the maximum corrosion rate. The materials with fine grain structures are expected to be more corrosion resistant [42]. As noted in Section 4.3 the size of grains in the coating is smaller than the substrate. Since the welding current of sample AFD150510 is less, the coating and substrate incomplete joint (Figure 9a). If some chloride ion remained and eventually accumulated where the specimens were not fully joined, pitting mode corrosion could occur [43]. For the welding with high spark energy (AFD351150), the specimen exhibited over-penetration from high-power welding (Figure 9c), which resulted in extensive corrosion [43]. The lesser corrosion at the spark energy of (AFD250550) came from the complete penetration by using an appropriate power at which NaCl could not achieve deep penetration. The chloride ion residue was decreased and resulted in a lower corrosion rate [43]. In general, the corrosion resistance of the joint is affected by precipitation and grain boundary characteristics [44]. At grain boundaries, the precipitation of the chromium carbides causes susceptibility to intergranular corrosion [45]. As noted in Section 4.1, the amount of chromium carbide phase increases with increasing thickness. On the other hand, with increasing spark energy (up to 2 mJ) the thickness of coating increases. Therefore, it is expected that the corrosion resistance of sample AFD150830 (spark energy: 0.71 J) will be greater than sample AFD250550 (spark energy: 1.15 J). Also it can be concluded that sample AFD250550 probably will have a lot of surface porosity (Figure 9e). These porosities contribute to corrosion rate. According to the value of polarization resistance (RP) in Table 4 sample AFD150830 represents maximum resistance to the transmission of charge and reference sample represents minimum polarization resistance, which confirms maximum corrosion rate (C.R. = 12.1 × 10⁻⁸ mpy) for reference sample and minimum corrosion rate(C.R. = 2.6 × 10⁻⁸ mpy) for sample AFD150830. According to Table 4 the high efficiency of coating is the most important parameter that reduces the corrosion rate.
5. Conclusions
Based on results and discussion, the following conclusions were obtained:
- With increasing current limit, frequency and duty cycle of the process, spark energy increases.
- As spark energy increases, efficiency of coating increases to 80% and then decreases. If deposition efficiency is more than 50% the process will be high in efficiency, thus, in the energy range of 0.5–3.5 mJ the process will have the appropriate efficiency.
- Metallographic studies indicate that the microstructure of the substrate is composed of pearlite and bainite with a hardness of 370 ± 15 VHN.
- As spark energy increases up to 2.17 mJ, thickness of coating increases to 8.31 μm and then decreases.
- The results of the EDS analysis indicate that with increasing spark energy, the amount of Tungsten in the surface increases and then decreases. At first, a small amount of Tungsten (17.3 wt %) can be seen on the surface. As spark energy increases, the amount of Tungsten in the surface increases to 41.95 wt %. At higher spark energy, the amount of Tungsten in the surface is reduced.
- SEM observations demonstrate that concentrations of Tungsten and Iron are at a maximum limit up to an approximate distance of 6 μm from the surface, but at a distance of 6–8 μm from the surface Iron concentration has increased progressively.
- Obtained peaks of XRD analysis confirmed that in addition to metallic Iron phase with BCC structure, peaks related to phases Tungsten Carbide, Cr7C3 and Titanium Carbide also can be observed.
- Surface hardness increases to 817.33 HV0.05 with spark energy increasing up to 1.03 mJ, and then reducing.
- With increasing spark energy the surface roughness increases.
- Maximum corrosion rate (12.1 × 10⁻⁸ mpy) relates to the reference sample and minimum corrosion rate (2.6 × 10⁻⁸ mpy) relates to the sample with maximum coating efficiency (AFD150830).
Author Contributions
This paper is written from Mohamad Azhideh Master’s thesis and he conducted tests. Hossein Aghajani supervised the thesis and helped in analyzing the results. Hadi Pourbagheri has helped in performing the tests and writing the discussion of the paper.
Conflicts of Interest
The authors declare no conflict of interest.
References
- Vergne, C.; Boher, C.; Gras, R. Analysis of the friction and wear behavior of hot work tool scale: Application to the hot rolling process. Wear 2001, 250, 322–333. [Google Scholar] [CrossRef]
- Barrau, O.; Boher, C.; Gras, R.; Rezai-Aria, F. Analysis of the friction and wear behavior of hot work tool steel for forging. Wear 2003, 255, 1444–1454. [Google Scholar] [CrossRef]
- Podgornik, B.; Hogmark, S.; Sandberg, O.; Leskovsek, V. Wear resistance and anti-sticking properties of duplex treated forming tool steel. Wear 2003, 254, 1113–1121. [Google Scholar] [CrossRef]
- Alsaran, A.; Yildiz, F.; Celik, A. Effects of post-aging on wear and corrosion properties of nitrided AISI 4140 steel. Surf. Coat. Technol. 2006, 201, 3147–3154. [Google Scholar] [CrossRef]
- De Souza Brandolt, C.; Noronha, L.C.; Hidalgo, G.E.N.; Takimi, A.S.; Schroeder, R.M.; De Fraga Malfatti, C. Niobium coating applied by HVOF as protection against hydrogen embrittlement of API 5CT P110 steel. Surf. Coat. Technol. 2017, 322, 10–18. [Google Scholar] [CrossRef]
- Rao, Z.; O’Connor, B.H.; Williams, J.S.; Sood, D.K. Carbon implantation into hard Chromium coatings. Surf. Coat. Technol. 1996, 84, 512–518. [Google Scholar] [CrossRef]
- Walter, K.C.; Scheuer, J.T.; McIntyre, P.C.; Kodali, P.; Yu, N.; Nastasi, M. Increased wear resistance of electrodeposited chromium through applications of plasma source ion implantation techniques. Surf. Coat. Technol. 1996, 85, 1–6. [Google Scholar] [CrossRef]
- Kessler, O.H.; Hoffmann, F.T.; Mayr, P. Combinations of coating and heat treating processes: Establishing a system for combined processes and examples. Surf. Coat. Technol. 1998, 108–109, 211–216. [Google Scholar] [CrossRef]
- Podgornik, B.; Vizintin, J.; Wanstrand, O.; Larsson, M.; Hogmark, S. Wear and friction behaviour of duplex-treated AISI 4140 steel. Surf. Coat. Technol. 1999, 120–121, 502–508. [Google Scholar] [CrossRef]
- Podgornik, B. Coated machine elements—Fiction or reality. Surf. Coat. Technol. 2001, 146–147, 318–323. [Google Scholar] [CrossRef]
- Podgornik, B.; Vizintin, J. Rolling contact properties of ta-C coated low alloy steel. Surf. Coat. Technol. 2002, 157, 257–261. [Google Scholar] [CrossRef]
- Han, S.; Lin, J.H.; Tsai, S.H.; Chung, S.C.; Wang, D.Y.; Lu, F.H.; Shih, H.C. Corrosion and tribological studies of chromium nitride coated on steel with an interlayer of electroplated chromium. Surf. Coat. Technol. 2000, 133–134, 460–465. [Google Scholar] [CrossRef]
- Chiu, L.H.; Yang, C.F.; Hsieh, W.C.; Cheng, A.S. Effect of contact pressure on wear resistance of AISI H13 tool steels with chromium nitride and hard chromium coatings. Surf. Coat. Technol. 2002, 154, 282–288. [Google Scholar] [CrossRef]
- Chiu, L.H.; Yang, C.F.; Liu, P.M. Wear resistance of JIS SKD61 tool steels with Cr based coatings. Surf. Eng. 2000, 16, 257–261. [Google Scholar] [CrossRef]
- Hurkmans, T.; Lewis, D.D.; Brooks, J.S.; Munz, W.D. Chromium nitride coatings grown by unbalanced magnetron (UBM) and combined arc/unbalanced magnetron (ABS™) deposition techniques. Surf. Coat. Technol. 1996, 86–87, 192–199. [Google Scholar] [CrossRef]
- Johnson, R.N.; Sheldon, G.L. Advances in the electrospark deposition coating process. J. Vac. Sci. Technol. 1986, 4, 2740–2746. [Google Scholar] [CrossRef]
- Grun, R. Combination of different plasma assisted processes with pulsed D.C.: Cleaning, nitriding and hardcoatings. Surf. Coat. Technol. 1995, 74–75, 598–603. [Google Scholar] [CrossRef]
- Manjunatha, M.; Kkulkarni, R.S.; Krishna, M. Investigation of HVOF thermal sprayed Cr3C2-NiCr cermet carbide coatings on erosive performance of AISI 316 stainless steel. Procedia Mater. Sci. 2014, 5, 622–629. [Google Scholar] [CrossRef]
- Algodi, S.J.; Murray, J.W.; Fay, M.W.; Clare, A.T.; Brown, P.D. Electrical discharge coating of nanostructured TiC-Fe cermets on 304 stainless Steel. Surf. Coat. Technol. 2016, 307, 639–649. [Google Scholar] [CrossRef]
- Espallargas, N.; Berget, J.; Guilemany, J.M.; Benedetti, A.V.; Suegama, P.H. Cr3C2–NiCr and WC–Ni thermal spray coatings as alternatives to hard chromium for erosion–corrosion resistance. Surf. Coat. Technol. 2008, 202, 1405–1417. [Google Scholar] [CrossRef]
- Reynolds, J.L.; Holdren, R.L.; Brown, L.E. Electro-Spark Deposition. Adv. Mater. Process 2003, 161, 35–37. [Google Scholar]
- Johnson, R.N. ElectroSpark Deposition: Principles and Applications. In Proceedings of the 45th Annual Technical Conference of the Society of Vacuum Coaters, Richland, WA, USA, 13–18 April 2002; pp. 87–92. [Google Scholar]
- Welsh, N.C.; Watts, P.E. Spark Hardening of Cutting Tools: Austenite Formation and Edge Erosion. J. Iron Steel Inst. 1962, 5, 333. [Google Scholar]
- Schuh, C.A.; Nieh, T.G.; Yamasaki, T. Hall-Petch breakdown manifested in abrasive wear resistance of nanocrystalline nickel. Scr. Mater. 2002, 46, 735–740. [Google Scholar] [CrossRef]
- Banovic, S.W.; DuPont, J.N.; Marder, A.R. Iron Aluminide Weld Overlay Coatings for Bolier Tube Protection in Coal-Fried Low Nox Boilers. In Proceedings of the 11th Annual Conference on Fossil Energy Materials, Knoxville, TN, USA, 20–22 May 1997; p. 279. [Google Scholar]
- Polyachenko, A.U. New methods of Electrical Working of Materials. Mashgiz Moscow 1955, 46, 352. [Google Scholar]
- Gould, J.E. Welding Handbook, 9th ed.; American Welding Society: Miami, FL, USA, 2007; Volume 3, pp. 598–602. [Google Scholar]
- Wei, X.; Chen, Z.; Zhong, J.; Xiang, Y. Feasibility of preparing Mo2FeB2-based cermet coating by electrospark deposition on high speed steel. Surf. Coat. Technol. 2016, 296, 58–64. [Google Scholar] [CrossRef]
- Korkmaz, K. Investigation and characterization of electrospark deposited chromium carbide-based coating on the steel. Surf. Coat. Technol. 2015, 272, 1–7. [Google Scholar] [CrossRef]
- Radek, N.; Konstanty, J. Cermet ESD Coatings Modified by LaserTreatment. Arch. Metall. Mater. 2012, 57, 665–670. [Google Scholar] [CrossRef]
- Tang, C.-B.; Lin, D.-X.; Wang, Z.; Gao, Y. Electro-spark alloying using graphite electrode on titanium alloy surface for biomedical applications. Appl. Surf. Sci. 2011, 257, 6364–6371. [Google Scholar]
- Frangini, S.; Masci, A.; Di Bartolomeo, A. Cr7C3-based cermet coating deposited on stainless steel by electrospark process: Structural characteristics and corrosion behavior. Surf. Coat. Technol. 2002, 149, 279–286. [Google Scholar] [CrossRef]
- Chen, Z.; Zhou, Y. Surface modification of resistance welding electrode by electrospark deposited composite coatings Part II. Metallurgical behavior during welding. Surf. Coat. Technol. 2006, 201, 2419–2430. [Google Scholar] [CrossRef]
- Frangini, S.; Masci, A. A study on the effect of a dynamic contact force control for improving electrospark coating properties. Surf. Coat. Technol. 2010, 204, 2613–2623. [Google Scholar] [CrossRef]
- Steel VCMO230 (Mat. No. 1.7707, DIN 30CrMoV9, AISI 4340). Heat Treatment Manual; Data Sheet, SIJ Metal Ravne Co.: Carinthia, Slovenia, 2005. [Google Scholar]
- Soltanieh, M.; Aghajani, H.; Mahboubi, F.; Nekouee, K.A. Surface characterization of multiple coated H11 hot work steel by plasma nitriding and hard chromium electroplating processes. Vacuum 2012, 86, 1470–1476. [Google Scholar] [CrossRef]
- Gaskell, D.R. Introduction to the Thermodynamics of Materials; Taylor & Francis: New York, NY, USA, 1995. [Google Scholar]
- Mo, D.F.; Hu, Z.F.; Chen, S.J.; Wang, C.X.; He, G.Q. Microstructure and hardness of T250 Maraging steel in heat affected zone. J. Iron Steel Res. Int. 2009, 16, 87–91. [Google Scholar] [CrossRef]
- Gharibshahiyan, E.; Raouf, A.H.; Parvin, N.; Rahimian, M. The effect of microstructure on hardness and toughness of low carbon welded steel using inert gas welding. Mater. Des. 2011, 32, 2042–2048. [Google Scholar] [CrossRef]
- Li, L.C.; Chai, M.Y.; Li, Y.Q.; Bai, W.J.; Duan, Q. Effect of Welding Heat Input on Grain Size and Microstructure of 316L Stainless Steel Welded Joint. Mech. Mater. 2013, 331, 578–582. [Google Scholar] [CrossRef]
- Zhang, S.; Zhao, H.; Shu, F.; He, W.; Wang, G. Microstructure and Corrosion Behavior of Simulated Welding HAZ of Q315NS Steel in Sulfuric Acid Solution. Metals 2017, 7, 194. [Google Scholar] [CrossRef]
- Li, J.; Liu, X.; Li, G.; Han, P.; Liang, W. Characterization of the Microstructure, Mechanical Properties, and Corrosion Resistance of a Friction-Stir-Welded Joint of Hyper Duplex Stainless Steel. Metals 2017, 7, 138. [Google Scholar] [CrossRef]
- Yingsamphancharoen, T.; Srisuwan, N.; Rodchanarowan, A. The Electrochemical Investigation of the Corrosion Rates of Welded Pipe ASTM A106 Grade B. Metals 2016, 6, 207. [Google Scholar] [CrossRef]
- Geng, X.; Feng, H.; Jiang, Z.; Li, H.; Zhang, B.; Zhang, S.; Wang, Q.; Li, J. Microstructure, Mechanical and Corrosion Properties of Friction StirWelding High Nitrogen Martensitic Stainless Steel 30Cr15Mo1N. Metals 2016, 6, 301. [Google Scholar] [CrossRef]
- Mohammed, G.R.; Ishak, M.; Aqida, S.N.; Abdulhadi, H.A. Effects of Heat Input on Microstructure, Corrosion and Mechanical Characteristics of Welded Austenitic and Duplex Stainless Steels: A Review. Metals 2017, 7, 39. [Google Scholar] [CrossRef]
Figure 1.
Micro-Electro Welding (MEW) device made during this study.

Figure 2.
Energy Dispersive X-ray Spectroscopy (EDS) analysis for reference electrode (SCE).

Figure 3.
Variation of Spark energy with (a) current limits, (b) duty cycles and (c) frequencies.

Figure 4.
Variation of (a) weight of anode (b) weight of cathode (c) deposition efficiency by spark energy.
Figure 4.
Variation of (a) weight of anode (b) weight of cathode (c) deposition efficiency by spark energy.
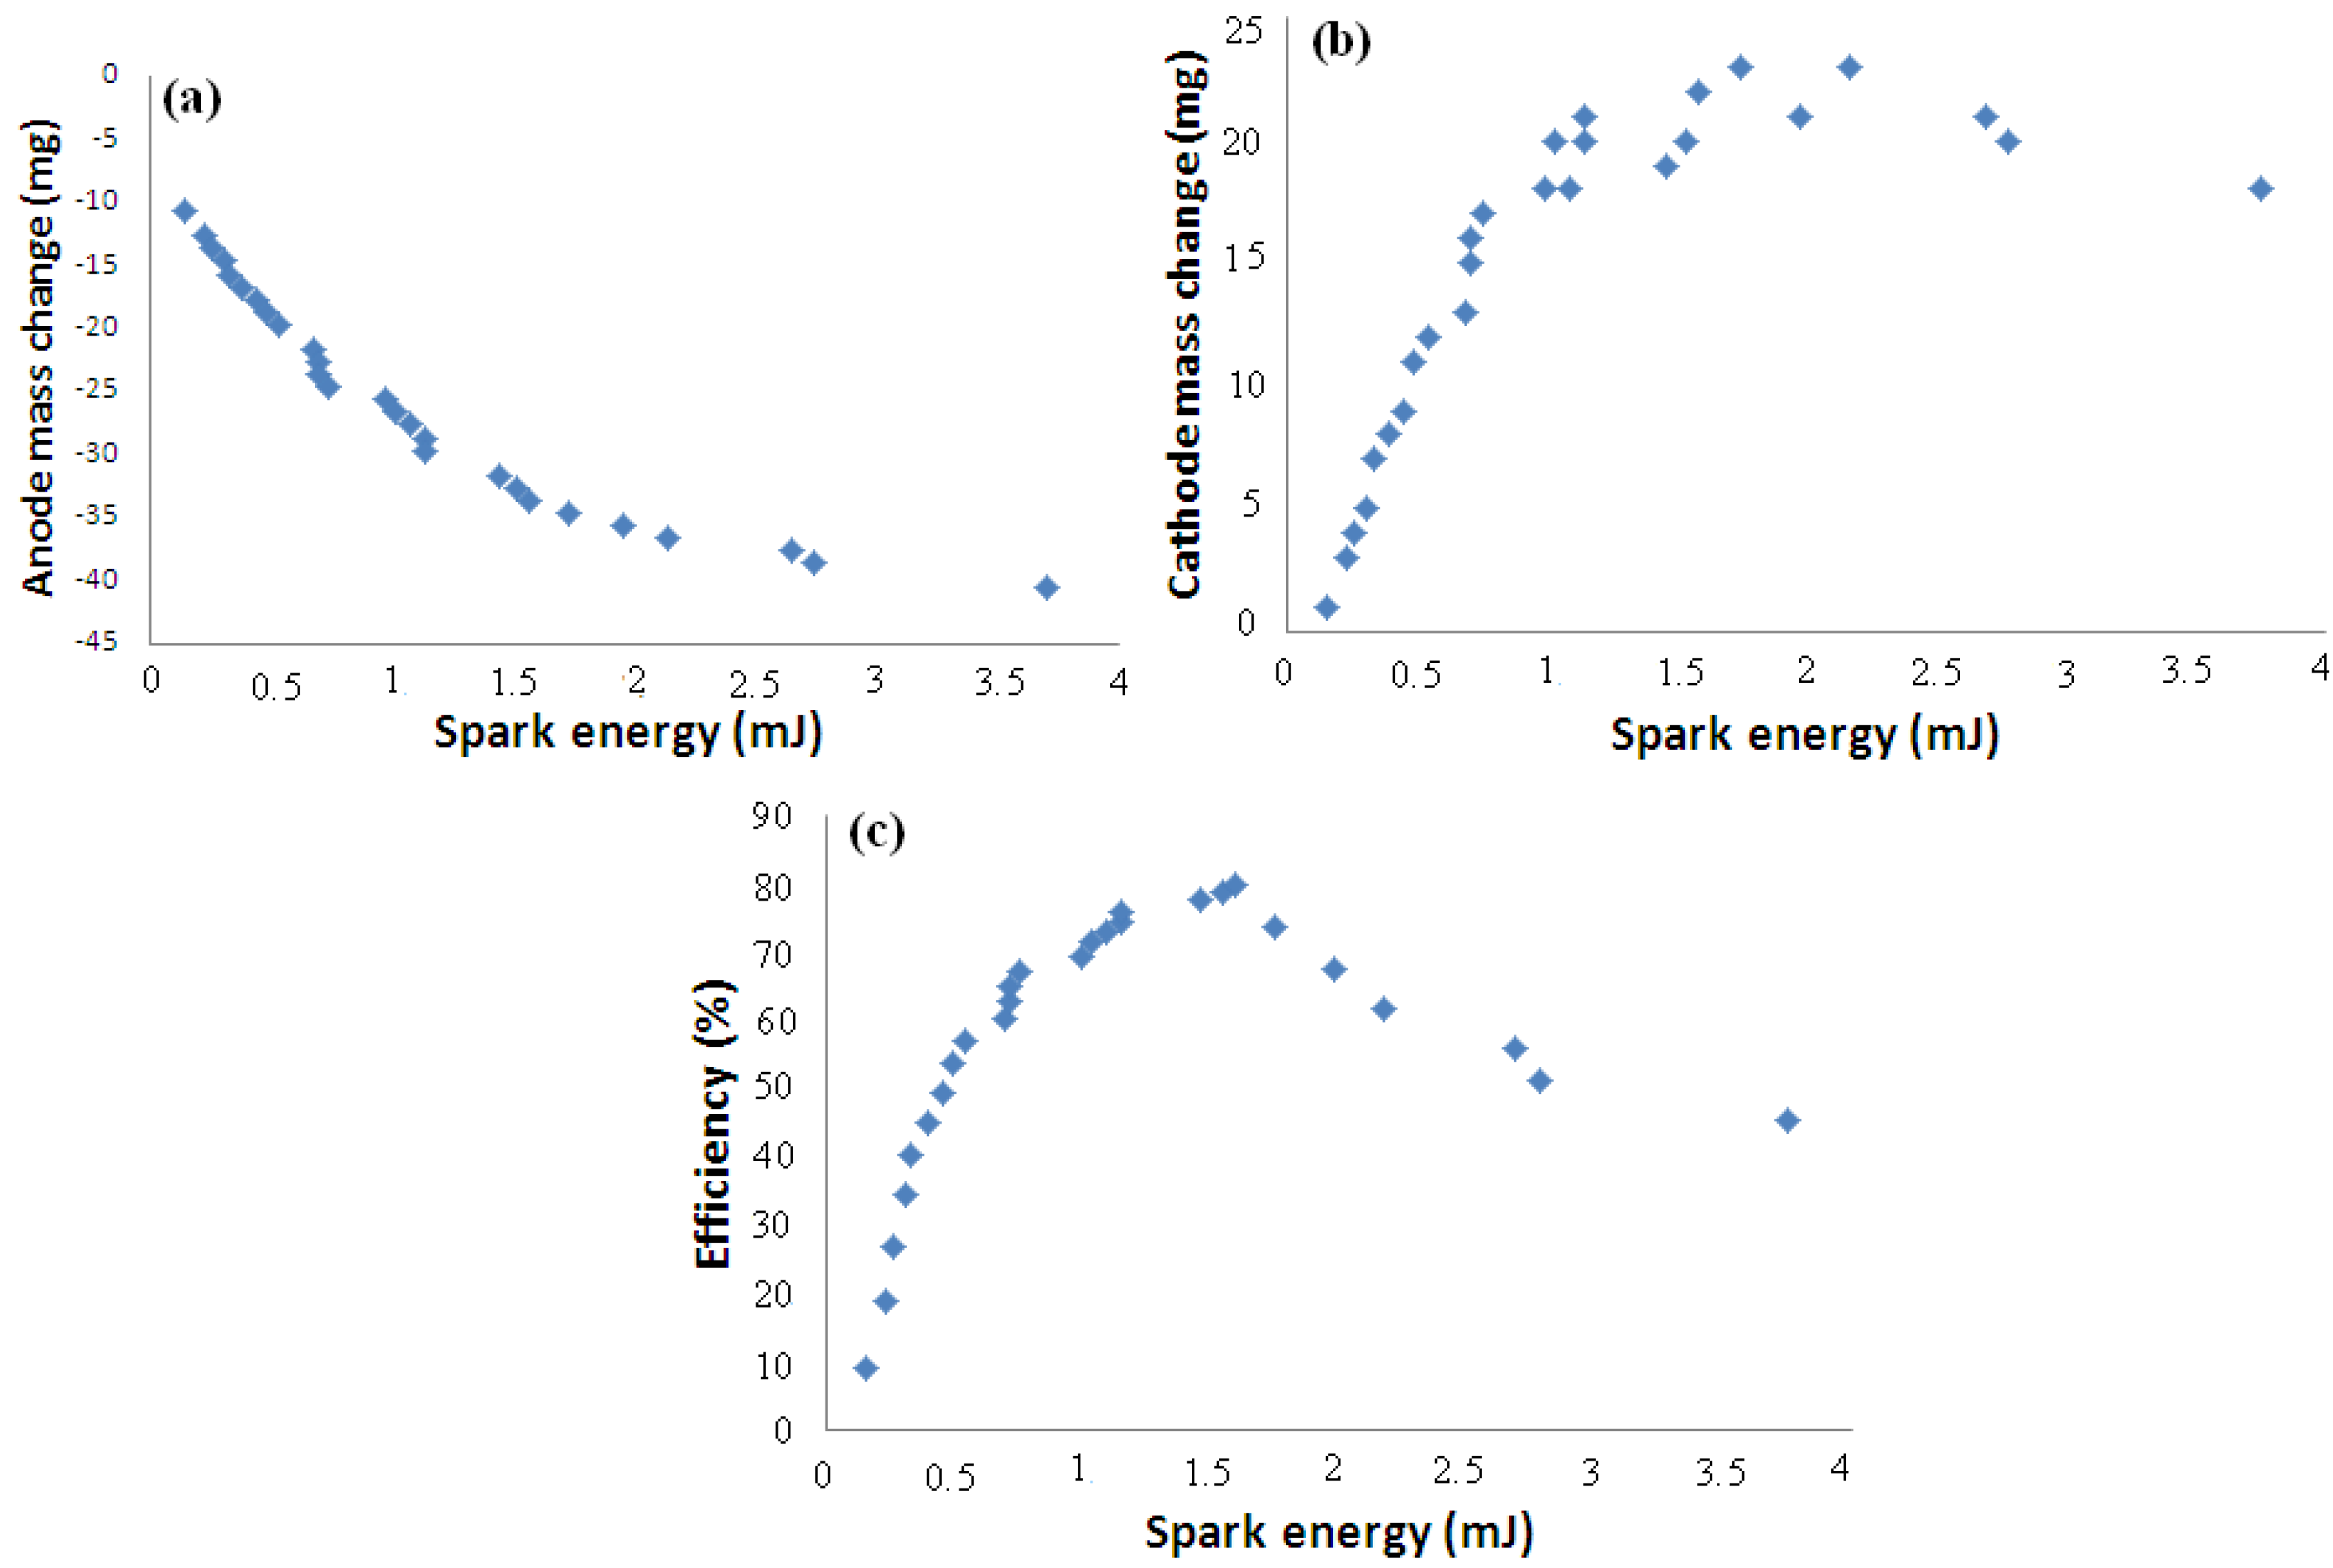
Figure 5.
Optical micrograph of coated specimens with code of AFD150530.
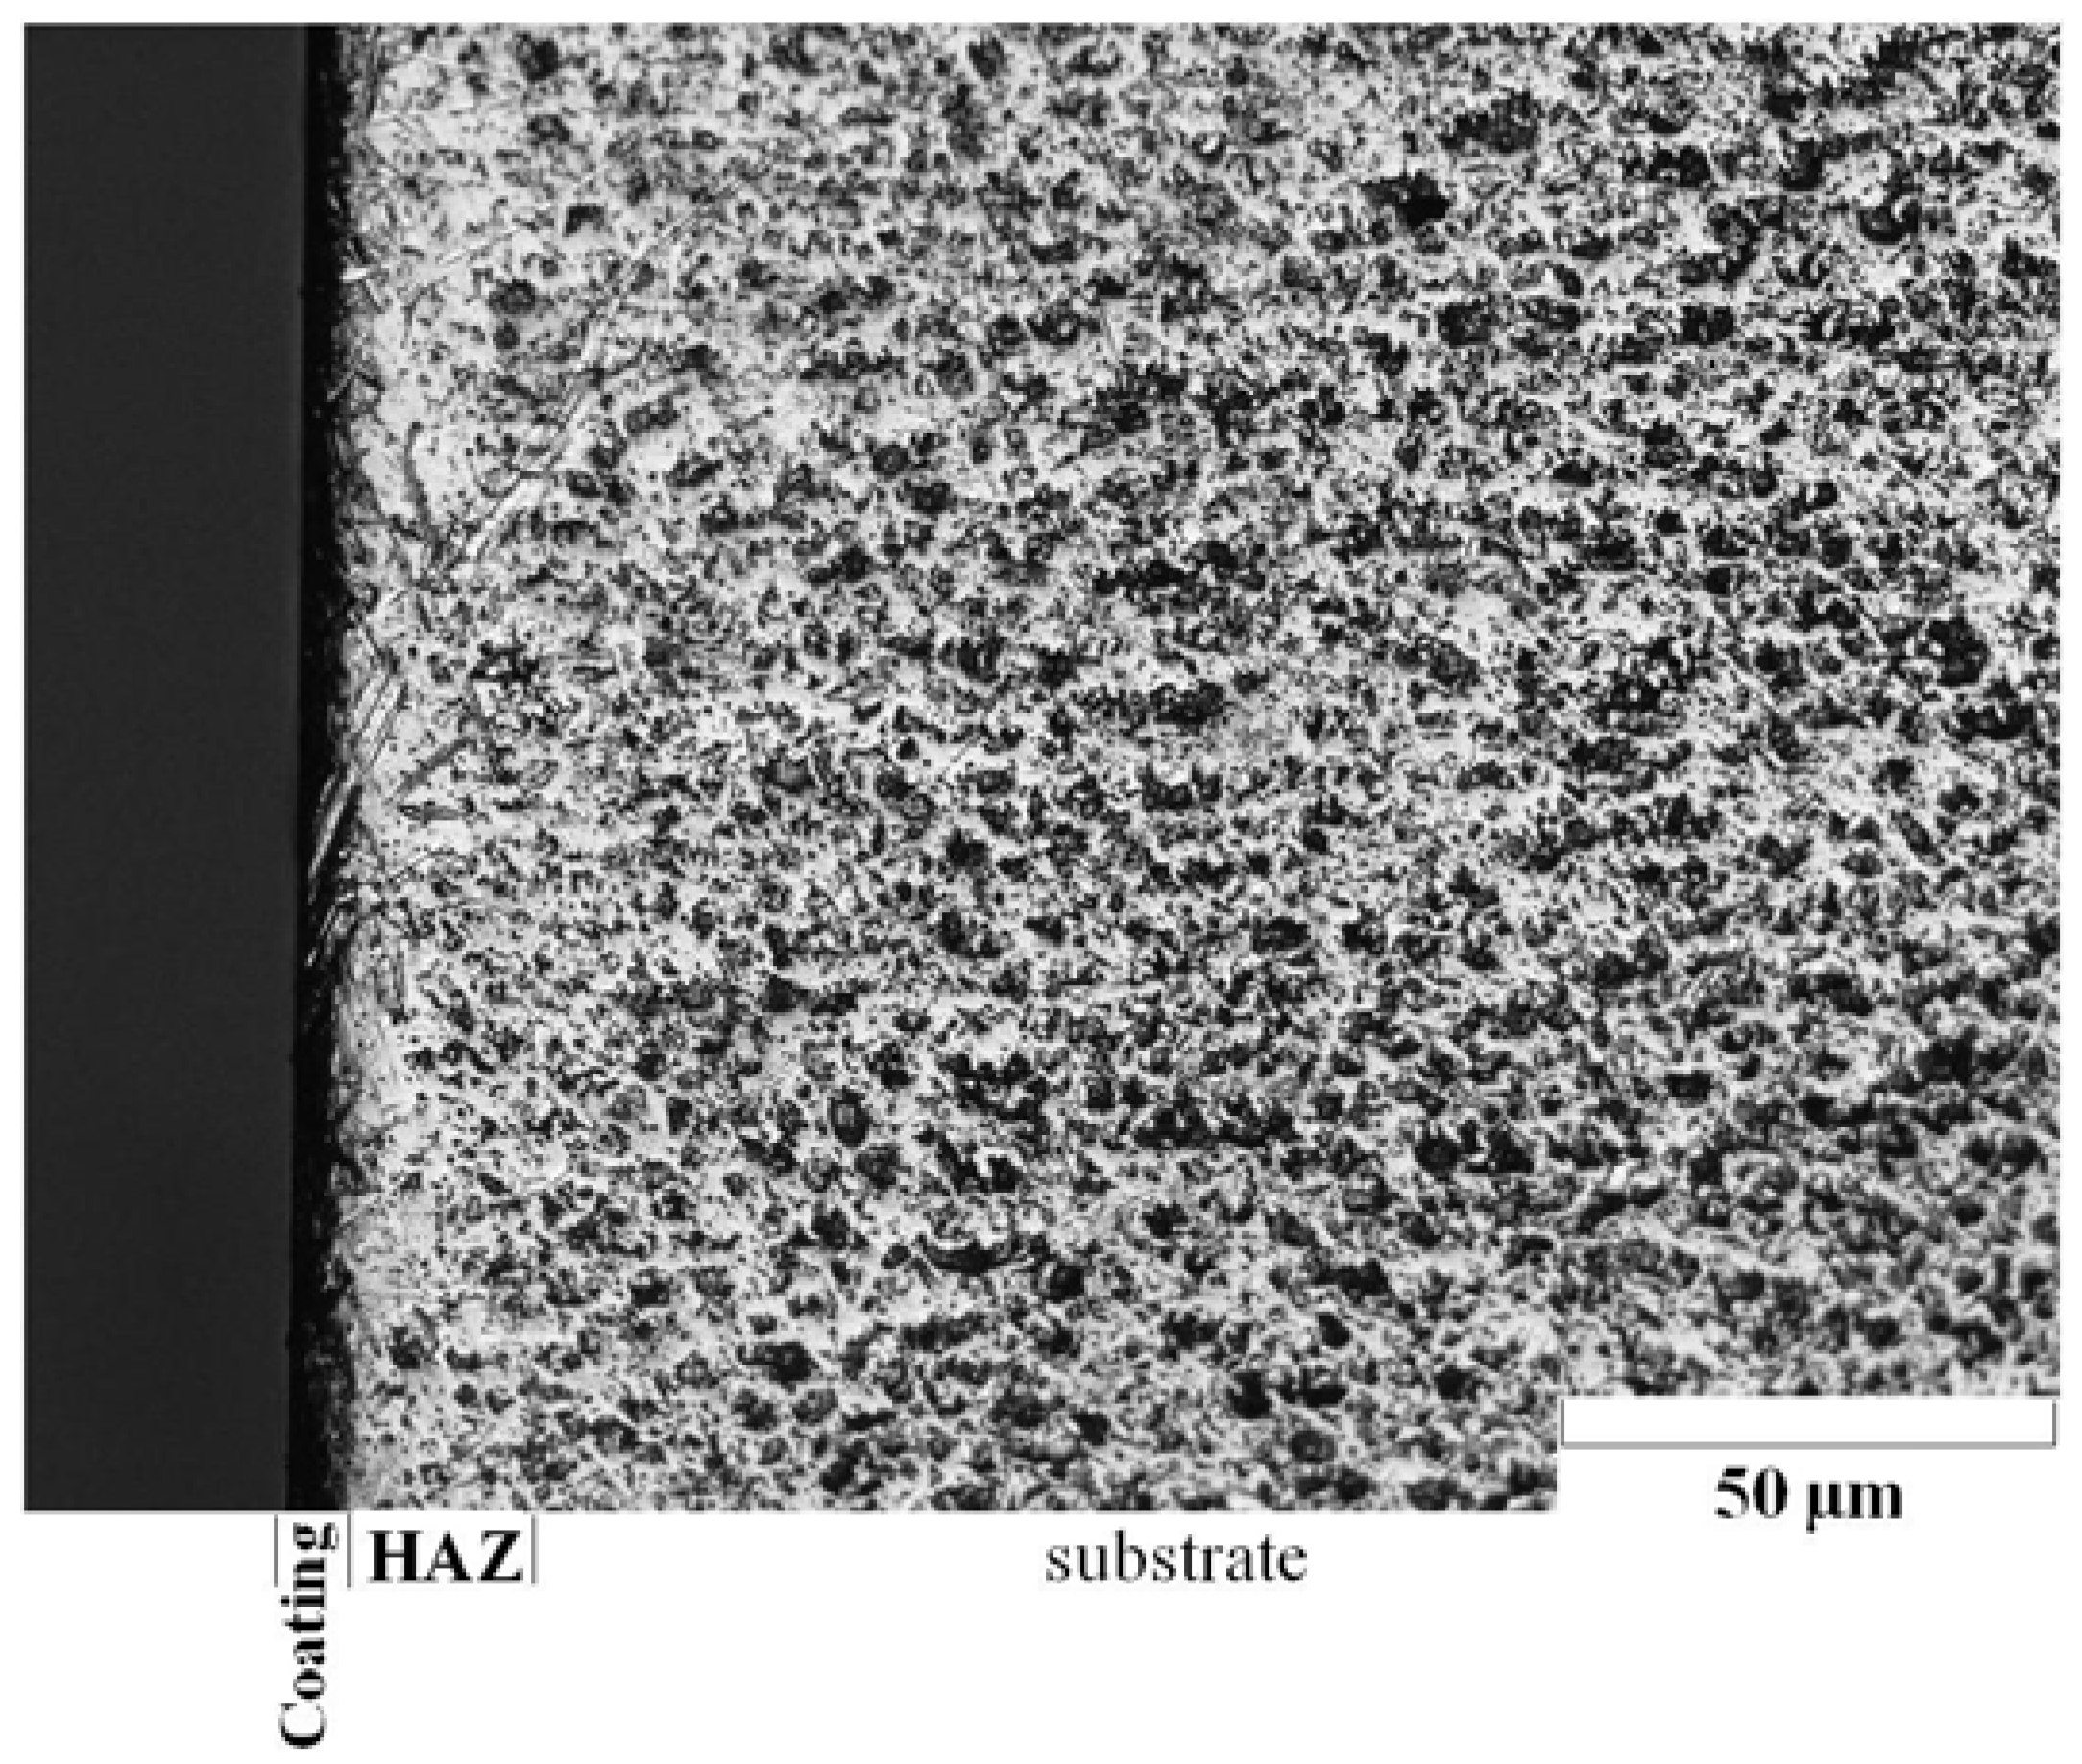
Figure 6.
X-ray diffraction (XRD) analysis of surface of coated samples (AFD150510, AFD351150, AFD250550).
Figure 6.
X-ray diffraction (XRD) analysis of surface of coated samples (AFD150510, AFD351150, AFD250550).

Figure 7.
SEM graph from cross section of specimen AFD250510.
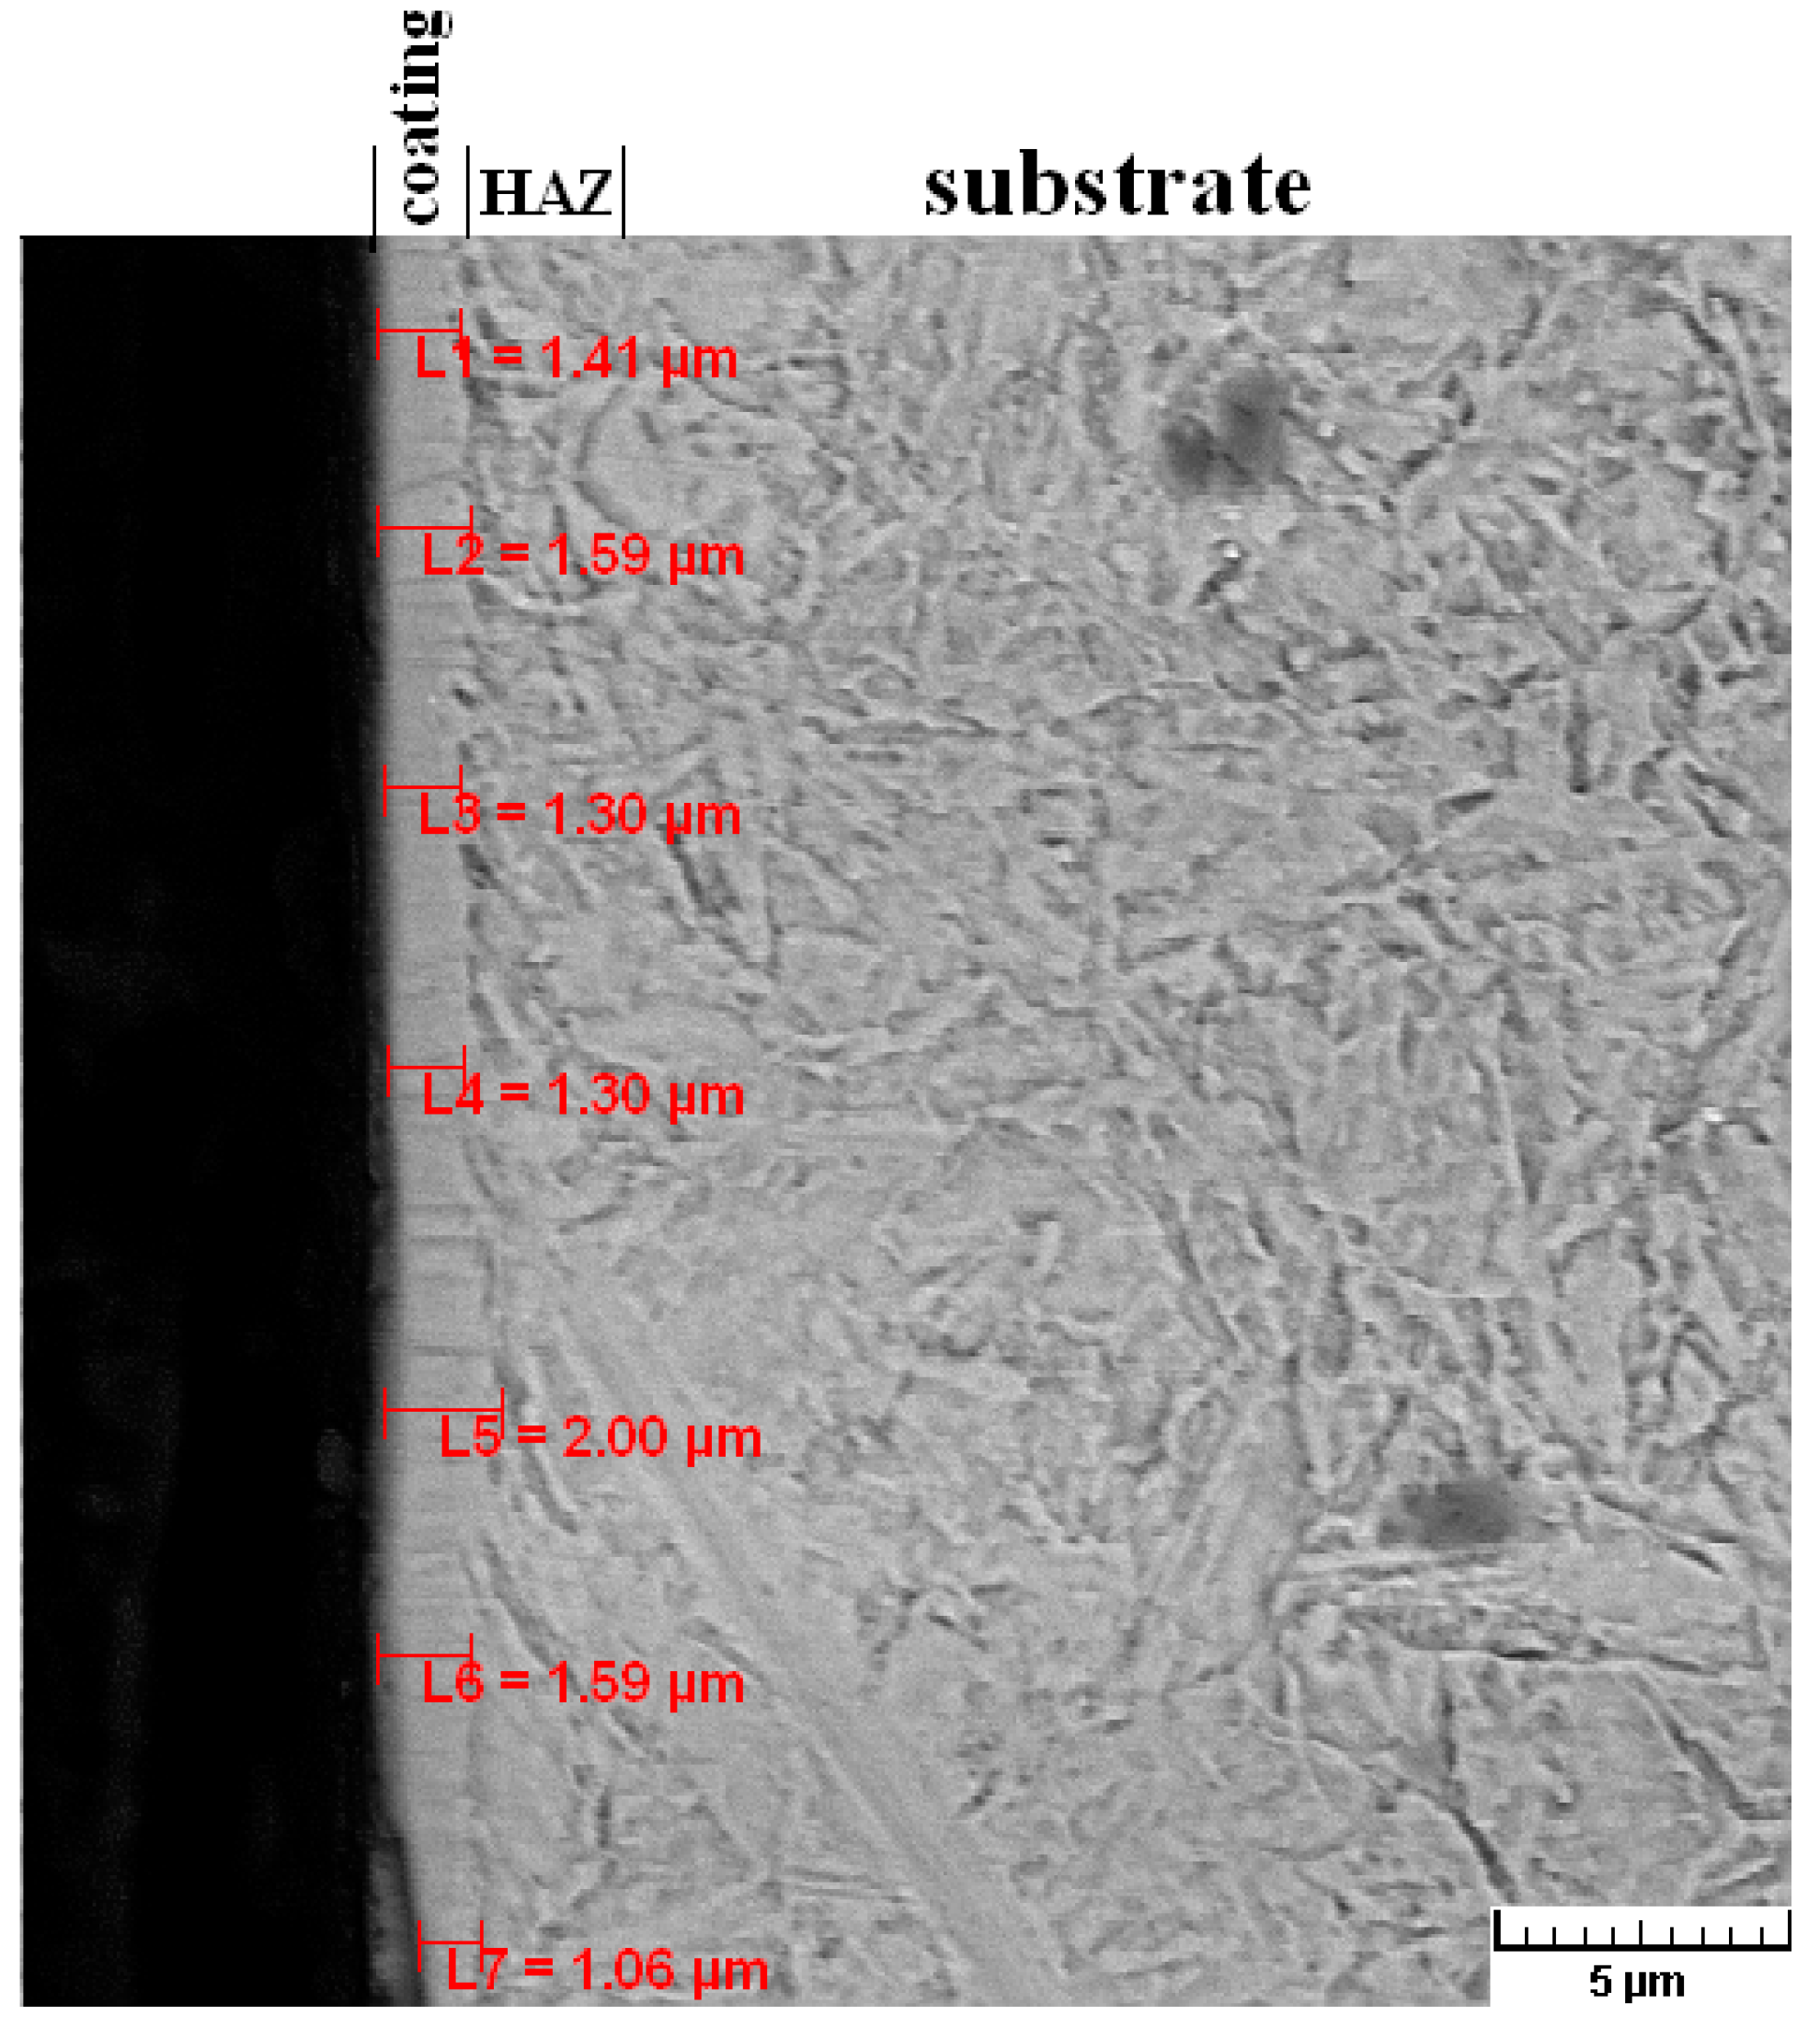
Figure 8.
Variation of thickness of coated samples with spark energy.

Figure 9.
Scanning electron microscopy (SEM) micrographs from surface of samples AFD150510, AFD351150, AFD250550 in magnification 1000 (a,c,e) and 10,000 (b,d,f) respectively.
Figure 9.
Scanning electron microscopy (SEM) micrographs from surface of samples AFD150510, AFD351150, AFD250550 in magnification 1000 (a,c,e) and 10,000 (b,d,f) respectively.

Figure 10.
Variation of value elements on surface with spark energy.

Figure 11.
Analysis of the cross section of sample AFD250550 up to 20 µm from the surface.
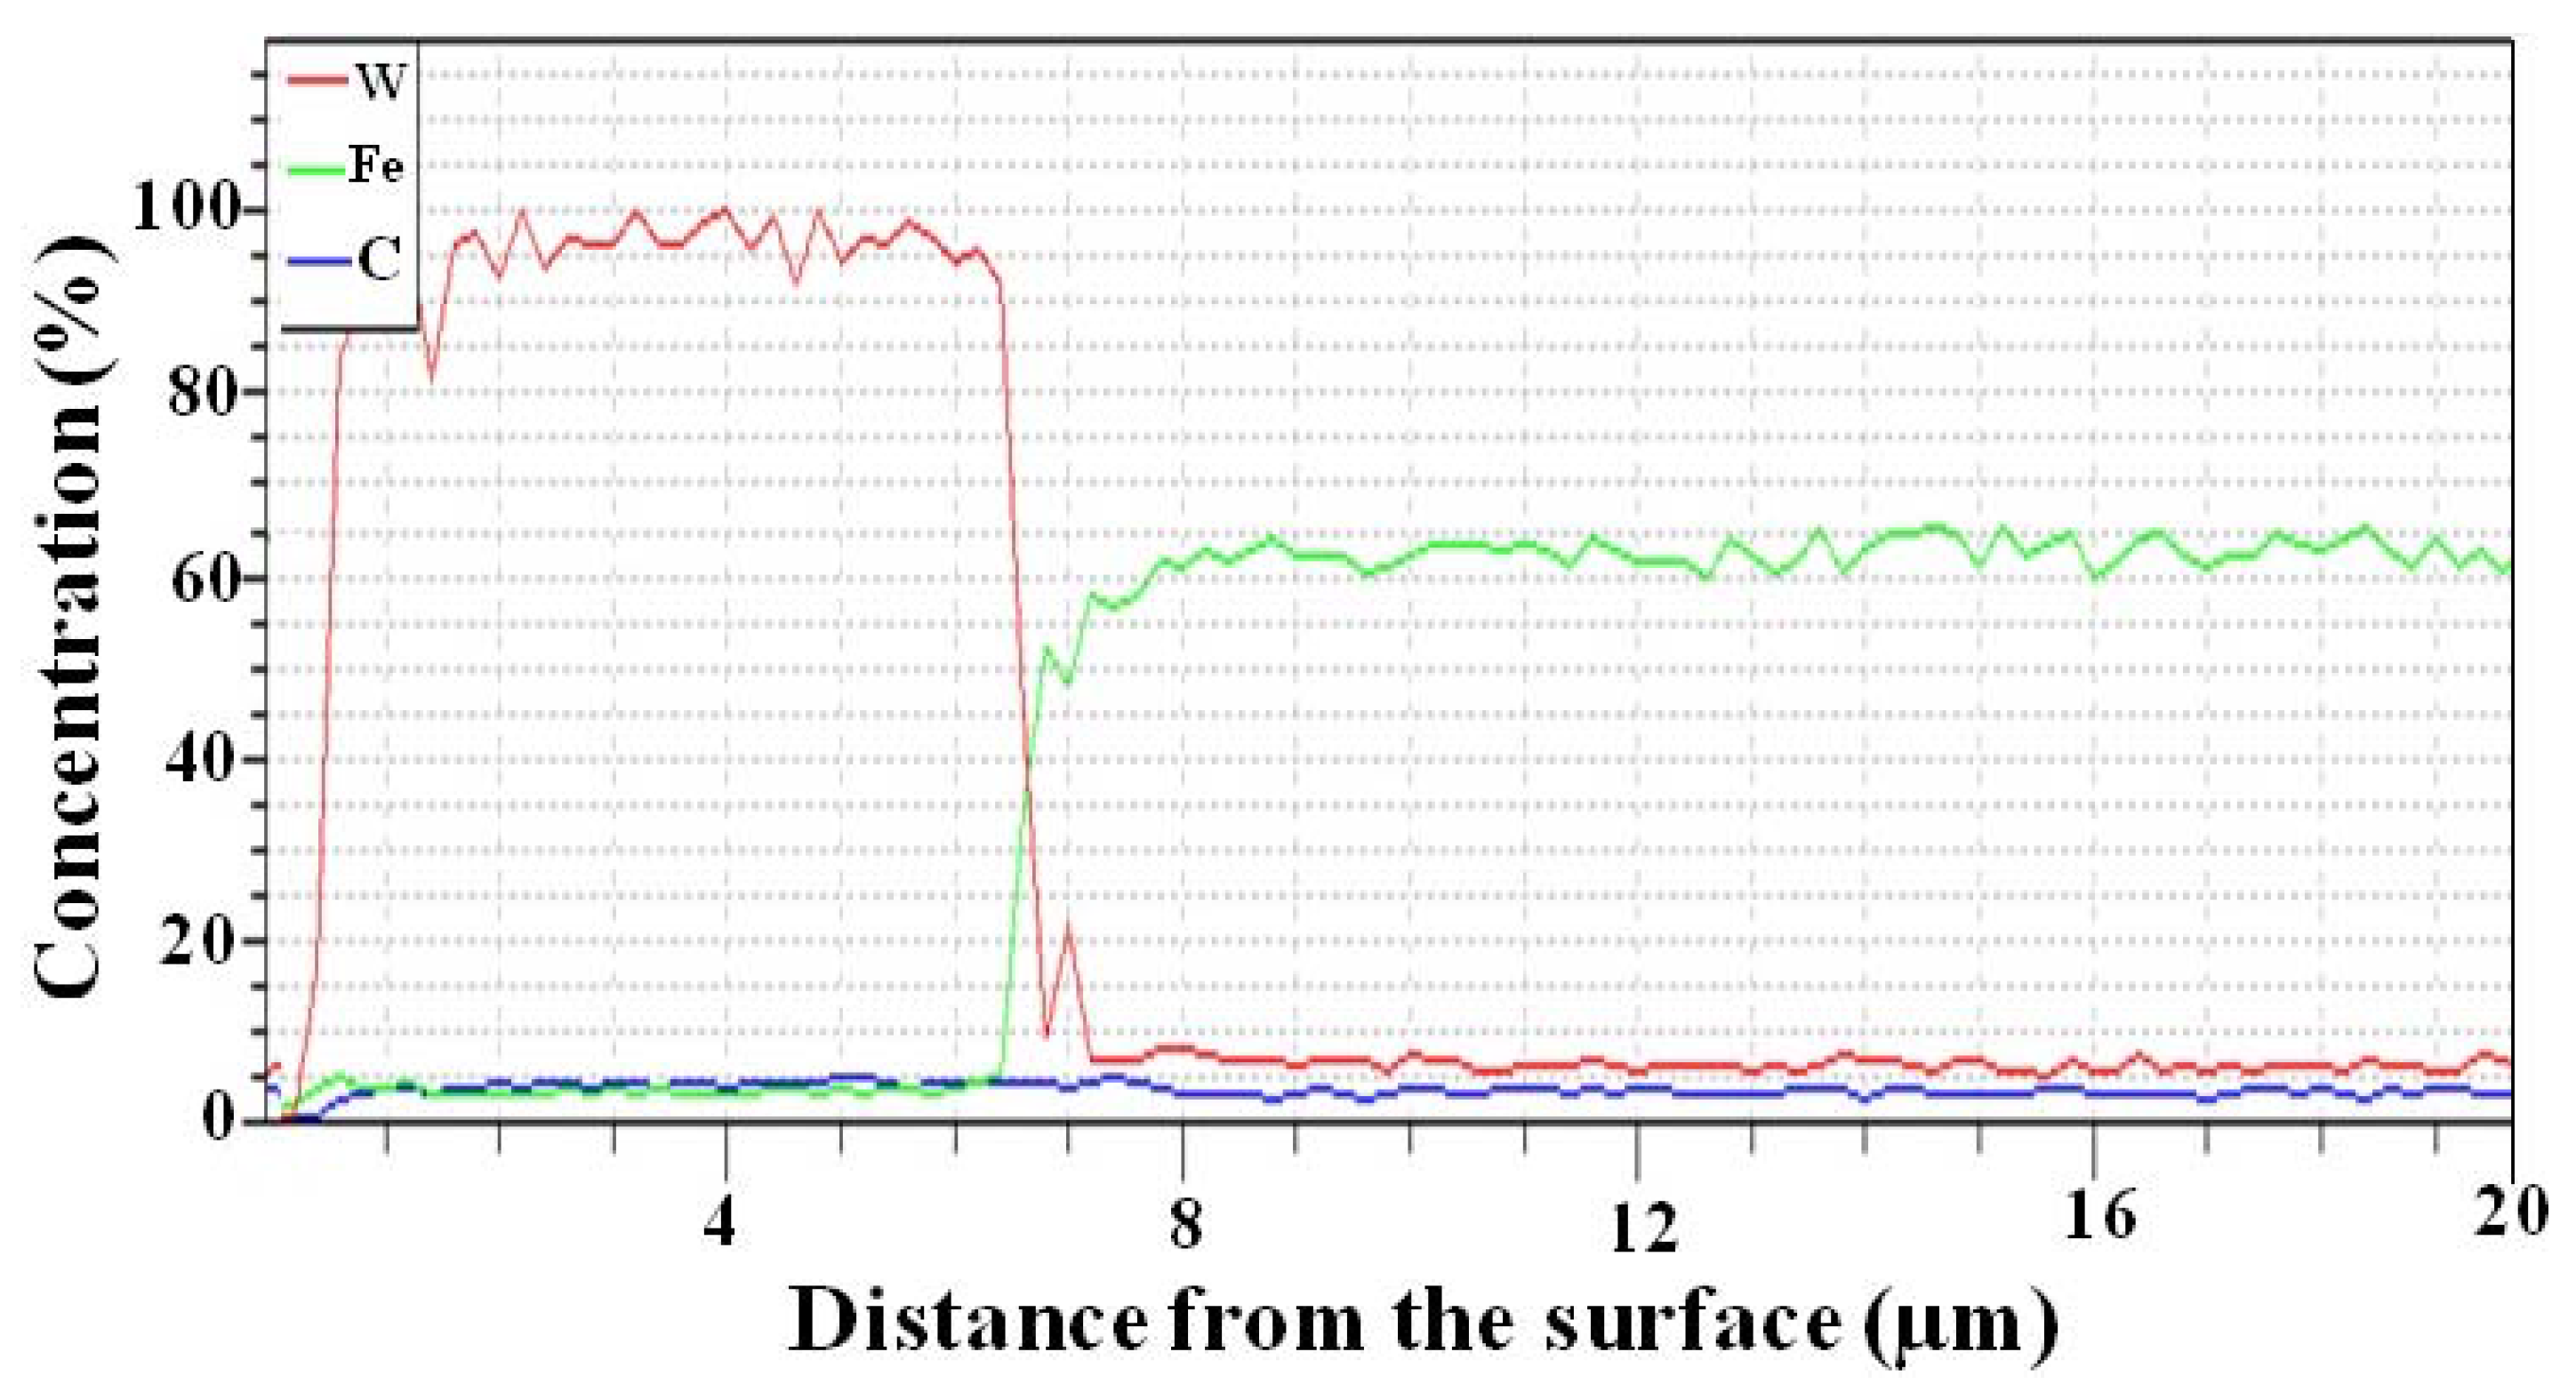
Figure 12.
Variation of hardness of coated samples with spark energy in the surface.

Figure 13.
Hardness profile from surface to depth for samples AFD150510, AFD351150 and AFD250550.

Figure 14.
Variation of roughness with spark energy.
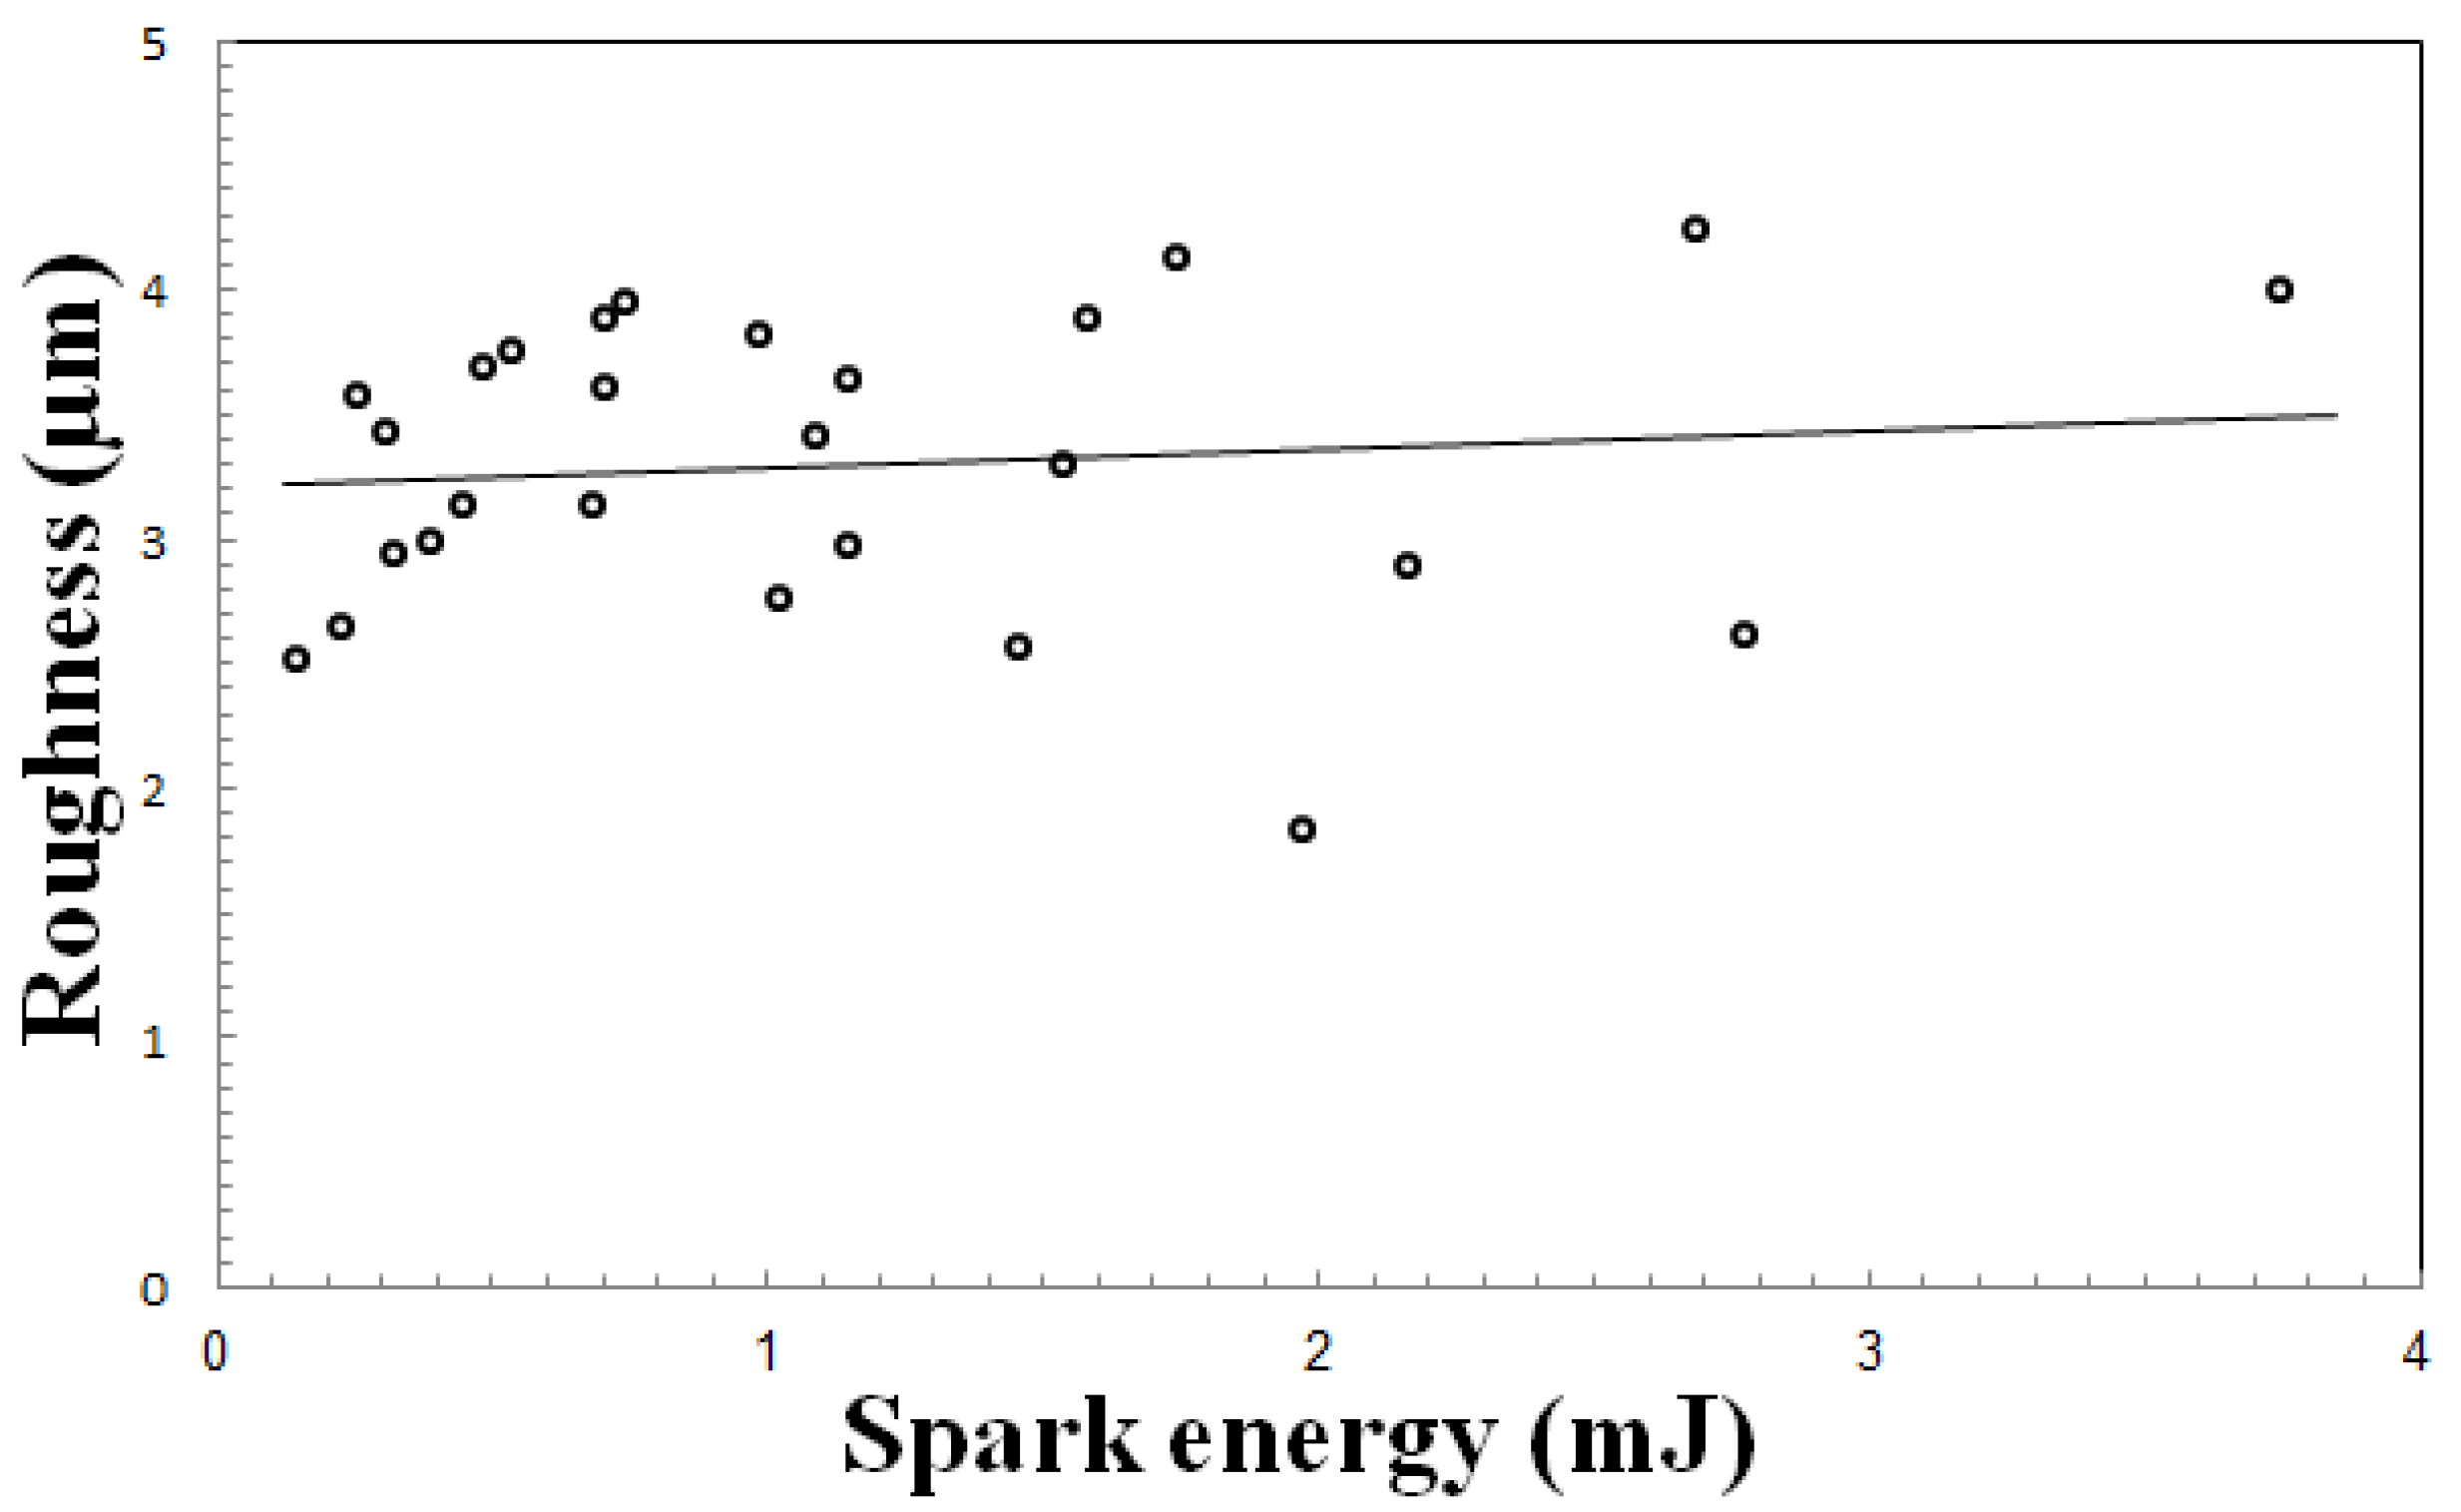
Figure 15.
Atomic force microscopy (AFM) graphs from surface of samples (a) reference, (b) AFD250550.
Figure 15.
Atomic force microscopy (AFM) graphs from surface of samples (a) reference, (b) AFD250550.

Figure 16.
Polarization curves of specimens.

Table 1.
Chemical composition of the base metal.
| Element | C | Si | Cr | Mo | V | Ni | Mn | S | P |
|---|---|---|---|---|---|---|---|---|---|
| Wt % | 0.3 | 0.25 | 2.9 | 0.22 | 0.18 | 0.1 | 0.54 | 0.004 | 0.003 |
Table 2.
Condition of specimens and their code.
| Duty Cycle (%) | Frequency (kHz) | Current (A) | Sample Code |
|---|---|---|---|
| 10 | 5 | 15 | AFD150510 |
| 25 | AFD250510 | ||
| 35 | AFD350510 | ||
| 8 | 15 | AFD150810 | |
| 25 | AFD250810 | ||
| 35 | AFD350810 | ||
| 11 | 15 | AFD151110 | |
| 25 | AFD251110 | ||
| 35 | AFD351110 | ||
| 30 | 5 | 15 | AFD150530 |
| 25 | AFD250530 | ||
| 35 | AFD350530 | ||
| 8 | 15 | AFD150830 | |
| 25 | AFD250830 | ||
| 35 | AFD350830 | ||
| 11 | 15 | AFD151130 | |
| 25 | AFD251130 | ||
| 35 | AFD351130 | ||
| 50 | 5 | 15 | AFD150550 |
| 25 | AFD250550 | ||
| 35 | AFD350550 | ||
| 8 | 15 | AFD150850 | |
| 25 | AFD250850 | ||
| 35 | AFD350850 | ||
| 11 | 15 | AFD151150 | |
| 25 | AFD251150 | ||
| 35 | AFD351150 |
Table 3.
Result of energy dispersive X-ray spectroscopy (EDS) analysis for specimens AFD150510, AFD351150 and AFD250550.
Table 3.
Result of energy dispersive X-ray spectroscopy (EDS) analysis for specimens AFD150510, AFD351150 and AFD250550.
| Element | Series | AFD150510 | AFD351150 | AFD250550 | ||||||
|---|---|---|---|---|---|---|---|---|---|---|
| Unn. c | Norm. c | Atom. c | Unn. c | Norm. c | Atom. c | Unn. c | Norm. c | Atom. c | ||
| (wt %) | (wt %) | (at %) | (wt %) | (wt %) | (at %) | (wt %) | (wt %) | (at %) | ||
| Carbon | K series | 3.12 | 3.6 | 17.68 | - | - | - | 8.29 | 10.7 | 45.34 |
| Titanium | K series | 1.08 | 1.25 | 1.54 | - | - | - | 0.96 | 1.24 | 1.31 |
| Chromium | K series | 6.27 | 7.24 | 8.21 | - | - | - | - | - | - |
| Manganese | K series | 0.72 | 0.83 | 0.89 | - | - | - | - | - | - |
| Iron | K series | 57 | 61.98 | 54.9 | 59.69 | 67.17 | 84.18 | 30.85 | 39.81 | 36.28 |
| Cobalt | K series | 2.52 | 2.91 | 2.91 | 2.15 | 2.42 | 2.87 | 3.02 | 3.9 | 3.37 |
| Nickel | K series | 4.47 | 5.16 | 5.19 | 1.49 | 1.68 | 2 | 1.86 | 2.4 | 2.08 |
| Tungsten | L series | 15.4 | 17.03 | 8.67 | 25.54 | 28.74 | 10.94 | 32.5 | 41.95 | 11.61 |
Unn. c: The unnormalised concentration in weight percent of the element.; Norm. c: The normalised concentration in weight percent of the element; Atom. c: The atomic weight percent.
Table 4.
Results of dynamic polarization test in 3.5 wt % NaCl solution at scanning rate of 0.0002 V/s consist of corrosion current, corrosion potential, polarization resistance and corrosion rate.
Table 4.
Results of dynamic polarization test in 3.5 wt % NaCl solution at scanning rate of 0.0002 V/s consist of corrosion current, corrosion potential, polarization resistance and corrosion rate.
| Sample | Corrosion Current Density (µA·cm−2) | Corrosion Potential (E vs. SCE) | βa (V/decade) | βc (V/decade) | Rp (ohm) | Corrosion Rate (mpy) × 10−8 |
|---|---|---|---|---|---|---|
| AFD150830 | 1.31 | −0.53 | 0.0143 | 0.0326 | 3397 | 2.6 |
| AFD250550 | 1.58 | −0.58 | 0.0444 | 0.2445 | 10,362 | 3.14 |
| AFD351150 | 2.13 | −0.56 | 0.0311 | 0.2350 | 5598 | 4.23 |
| AFD150510 | 2.51 | −0.54 | 0.0388 | 0.0776 | 4474 | 4.99 |
| Reference | 6.02 | −0.61 | 0.1612 | 0.0424 | 2421 | 12.10 |
© 2017 by the authors. Licensee MDPI, Basel, Switzerland. This article is an open access article distributed under the terms and conditions of the Creative Commons Attribution (CC BY) license (http://creativecommons.org/licenses/by/4.0/).
Share and Cite
MDPI and ACS Style
Azhideh, M.; Aghajani, H.; Pourbagheri, H. Surface Characterization and Corrosion Resistance of 36Cr-Ni-Mo4 Steel Coated by WC-Co Cermet Electrode Using Micro-Electro Welding. Metals 2017, 7, 308. https://doi.org/10.3390/met7080308
AMA Style
Azhideh M, Aghajani H, Pourbagheri H. Surface Characterization and Corrosion Resistance of 36Cr-Ni-Mo4 Steel Coated by WC-Co Cermet Electrode Using Micro-Electro Welding. Metals. 2017; 7(8):308. https://doi.org/10.3390/met7080308
Chicago/Turabian StyleAzhideh, Mohamad, Hossein Aghajani, and Hadi Pourbagheri. 2017. "Surface Characterization and Corrosion Resistance of 36Cr-Ni-Mo4 Steel Coated by WC-Co Cermet Electrode Using Micro-Electro Welding" Metals 7, no. 8: 308. https://doi.org/10.3390/met7080308
Note that from the first issue of 2016, this journal uses article numbers instead of page numbers. See further details here.